Tag Archives: Management Tools

Amazon Managed Grafana Is Now Generally Available with Many New Features

Post Syndicated from Danilo Poccia original https://aws.amazon.com/blogs/aws/amazon-managed-grafana-is-now-generally-available-with-many-new-features/

In December, we introduced the preview of Amazon Managed Grafana, a fully managed service developed in collaboration with Grafana Labs that makes it easy to use the open-source and the enterprise versions of Grafana to visualize and analyze your data from multiple sources. With Amazon Managed Grafana, you can analyze your metrics, logs, and traces without having to provision servers, or configure and update software.

During the preview, Amazon Managed Grafana was updated with new capabilities. Today, I am happy to announce that Amazon Managed Grafana is now generally available with additional new features:

  • Grafana has been upgraded to version 8 and offers new data sources, visualizations, and features, including library panels that you can build once and re-use on multiple dashboards, a Prometheus metrics browser to quickly find and query metrics, and new state timeline and status history visualizations.
  • To centralize the querying of additional data sources within an Amazon Managed Grafana workspace, you can now query data using the JSON data source plugin. You can now also query Redis, SAP HANA, Salesforce, ServiceNow, Atlassian Jira, and many more data sources.
  • You can use Grafana API keys to publish your own dashboards or give programmatic access to your Grafana workspace. For example, this is a Terraform recipe that you can use to add data sources and dashboards.
  • You can enable single sign-on to your Amazon Managed Grafana workspaces using Security Assertion Markup Language 2.0 (SAML 2.0). We have worked with these identity providers (IdP) to have them integrated at launch: CyberArk, Okta, OneLogin, Ping Identity, and Azure Active Directory.
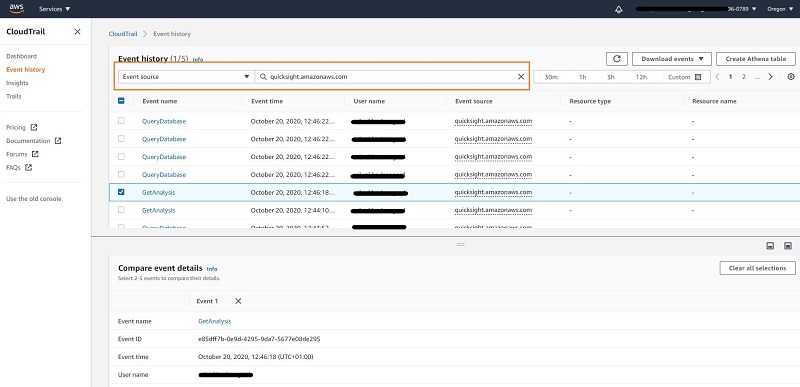
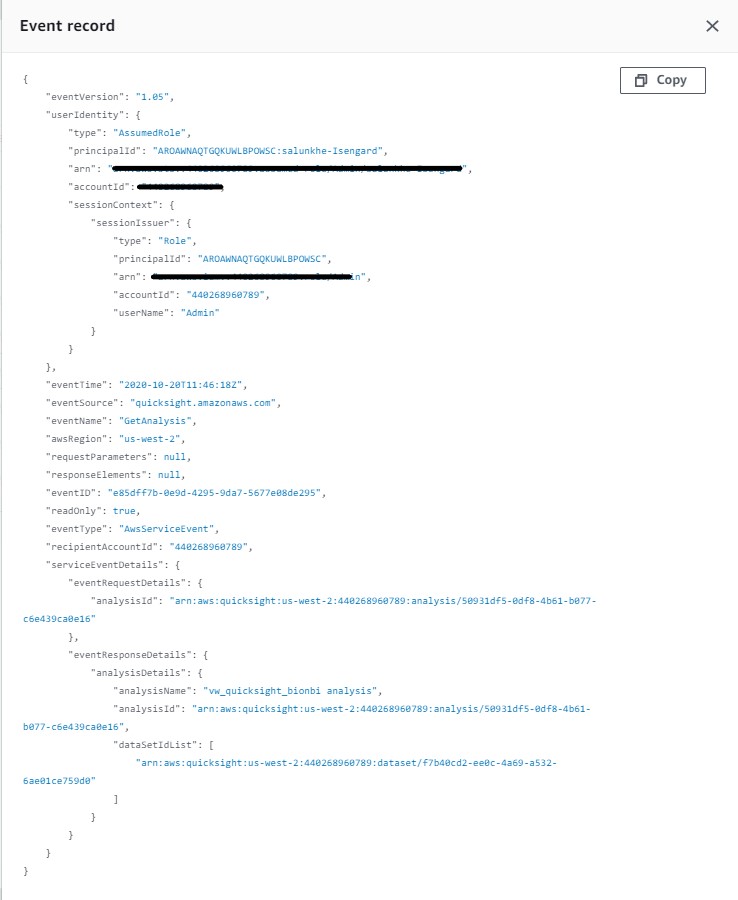
  • All calls from the Amazon Managed Grafana console and code calls to Amazon Managed Grafana API operations are captured by AWS CloudTrail. In this way, you can have a record of actions taken in Amazon Managed Grafana by a user, role, or AWS service. Additionally, you can now audit mutating changes that occur in your Amazon Managed Grafana workspace, such as when a dashboard is deleted or data source permissions are changed.
  • The service is available in ten AWS Regions (full list at the end of the post).

Let’s do a quick walkthrough to see how this works in practice.

Using Amazon Managed Grafana
In the Amazon Managed Grafana console, I choose Create workspace. A workspace is a logically isolated, highly available Grafana server. I enter a name and a description for the workspace, and then choose Next.

Console screenshot.

I can use AWS Single Sign-On (AWS SSO) or an external identity provider via SAML to authenticate the users of my workspace. For simplicity, I select AWS SSO. Later in the post, I’ll show how SAML authentication works. If this is your first time using AWS SSO, you can see the prerequisites (such as having AWS Organizations set up) in the documentation.

Console screenshot.

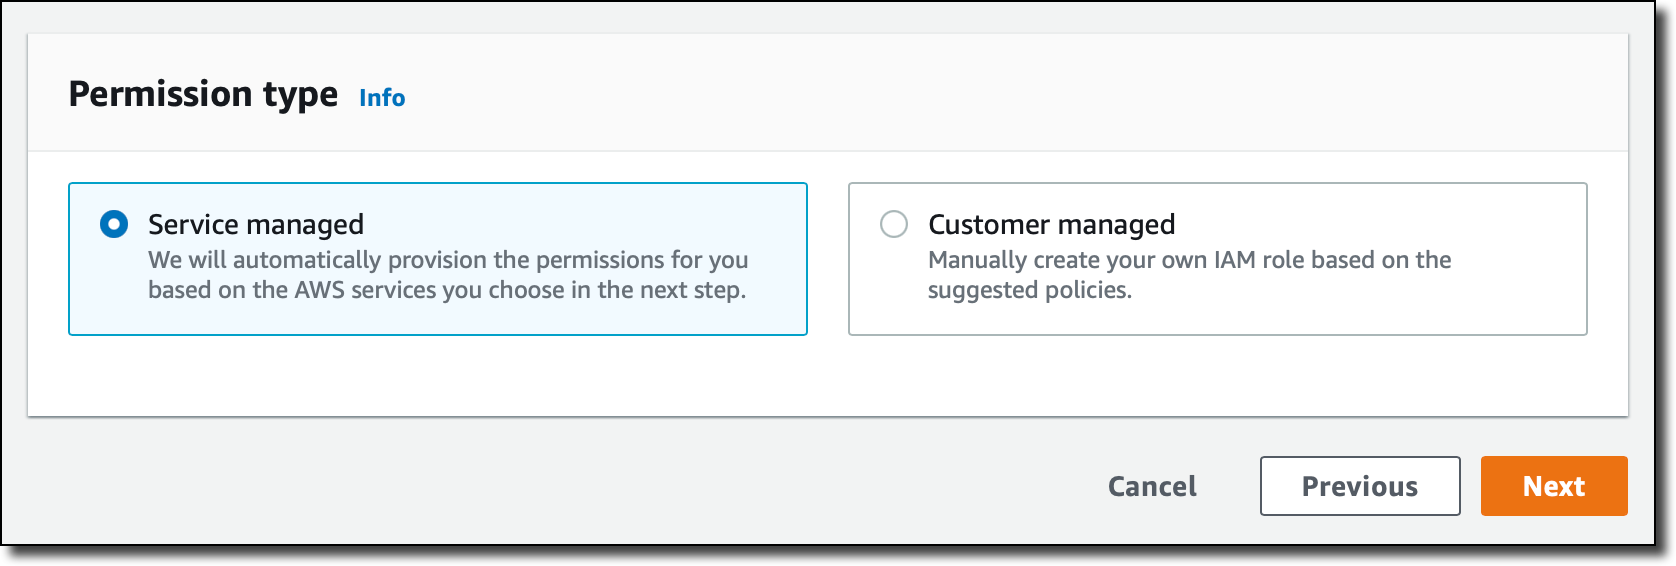
Then, I choose the Service managed permission type. In this way, Amazon Managed Grafana will automatically provision the necessary IAM permissions to access the AWS Services that I select in the next step.

Console screenshot.

In Service managed permission settings, I choose to monitor resources in my current AWS account. If you use AWS Organizations to centrally manage your AWS environment, you can use Grafana to monitor resources in your organizational units (OUs).

Console screenshot.

I can optionally select the AWS data sources that I am planning to use. This configuration creates an AWS Identity and Access Management (IAM) role that enables Amazon Managed Grafana to access those resources in my account. Later, in the Grafana console, I can set up the selected services as data sources. For now, I select Amazon CloudWatch so that I can quickly visualize CloudWatch metrics in my Grafana dashboards.

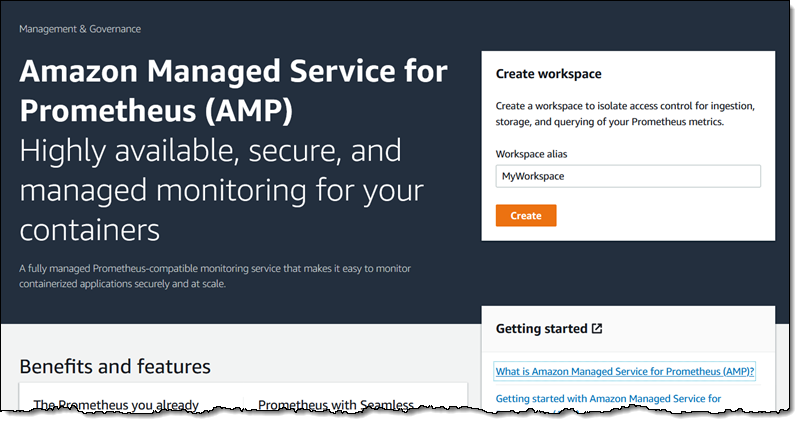
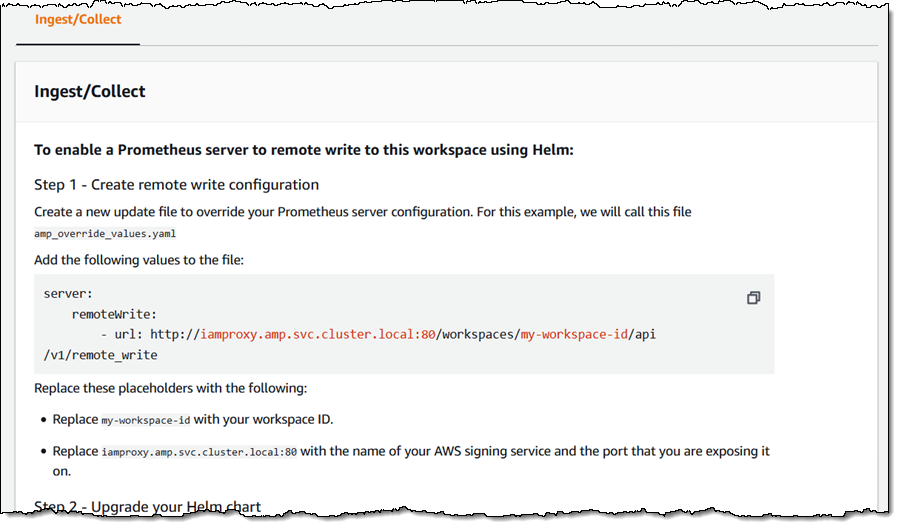
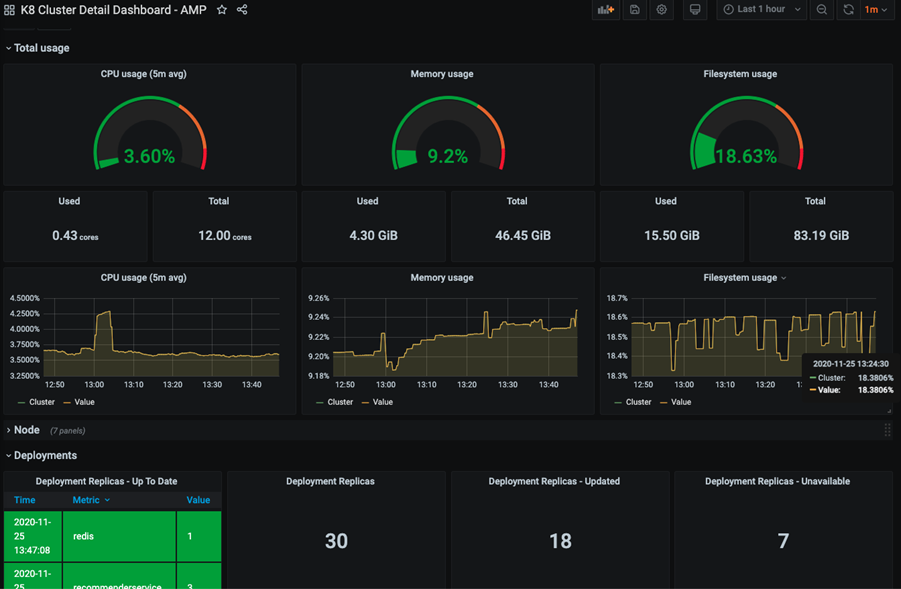
Here I also configure permissions to use Amazon Managed Service for Prometheus (AMP) as a data source and have a fully managed monitoring solution for my applications. For example, I can collect Prometheus metrics from Amazon Elastic Kubernetes Service (EKS) and Amazon Elastic Container Service (Amazon ECS) environments, using AWS Distro for OpenTelemetry or Prometheus servers as collection agents.

Console screenshot.

In this step I also select Amazon Simple Notification Service (SNS) as a notification channel. Similar to the data sources before, this option gives Amazon Managed Grafana access to SNS but does not set up the notification channel. I can do that later in the Grafana console. Specifically, this setting adds SNS publish permissions to topics that start with grafana to the IAM role created by the Amazon Managed Grafana console. If you prefer to have tighter control on permissions for SNS or any data source, you can edit the role in the IAM console or use customer-managed permissions for your workspace.

Finally, I review all the options and create the workspace.

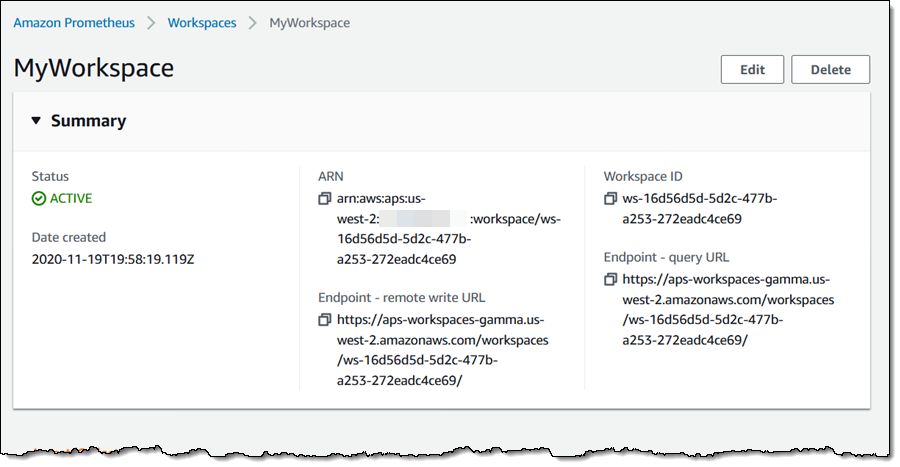
After a few minutes, the workspace is ready, and I find the workspace URL that I can use to access the Grafana console.

Console screenshot.

I need to assign at least one user or group to the Grafana workspace to be able to access the workspace URL. I choose Assign new user or group and then select one of my AWS SSO users.

Console screenshot.

By default, the user is assigned a Viewer user type and has view-only access to the workspace. To give this user permissions to create and manage dashboards and alerts, I select the user and then choose Make admin.

Console screenshot.

Back to the workspace summary, I follow the workspace URL and sign in using my AWS SSO user credentials. I am now using the open-source version of Grafana. If you are a Grafana user, everything is familiar. For my first configurations, I will focus on AWS data sources so I choose the AWS logo on the left vertical bar.

Console screenshot.

Here, I choose CloudWatch. Permissions are already set because I selected CloudWatch in the service-managed permission settings earlier. I select the default AWS Region and add the data source. I choose the CloudWatch data source and on the Dashboards tab, I find a few dashboards for AWS services such as Amazon Elastic Compute Cloud (Amazon EC2), Amazon Elastic Block Store (EBS), AWS Lambda, Amazon Relational Database Service (RDS), and CloudWatch Logs.

Console screenshot.

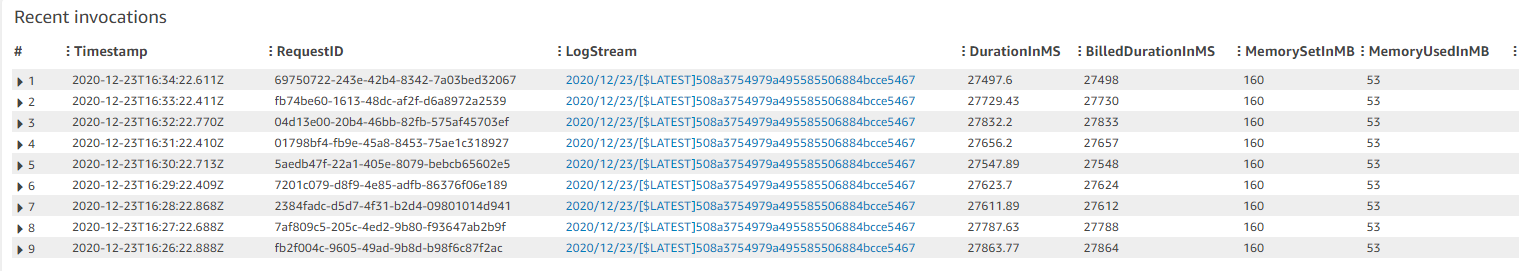
I import the AWS Lambda dashboard. I can now use Grafana to monitor invocations, errors, and throttles for Lambda functions in my account. I’ll save you the screenshot because I don’t have any interesting data in this Region.

Using SAML Authentication
If I don’t have AWS SSO enabled, I can authenticate users to the Amazon Managed Grafana workspace using an external identity provider (IdP) by selecting the SAML authentication option when I create the workspace. For existing workspaces, I can choose Setup SAML configuration in the workspace summary.

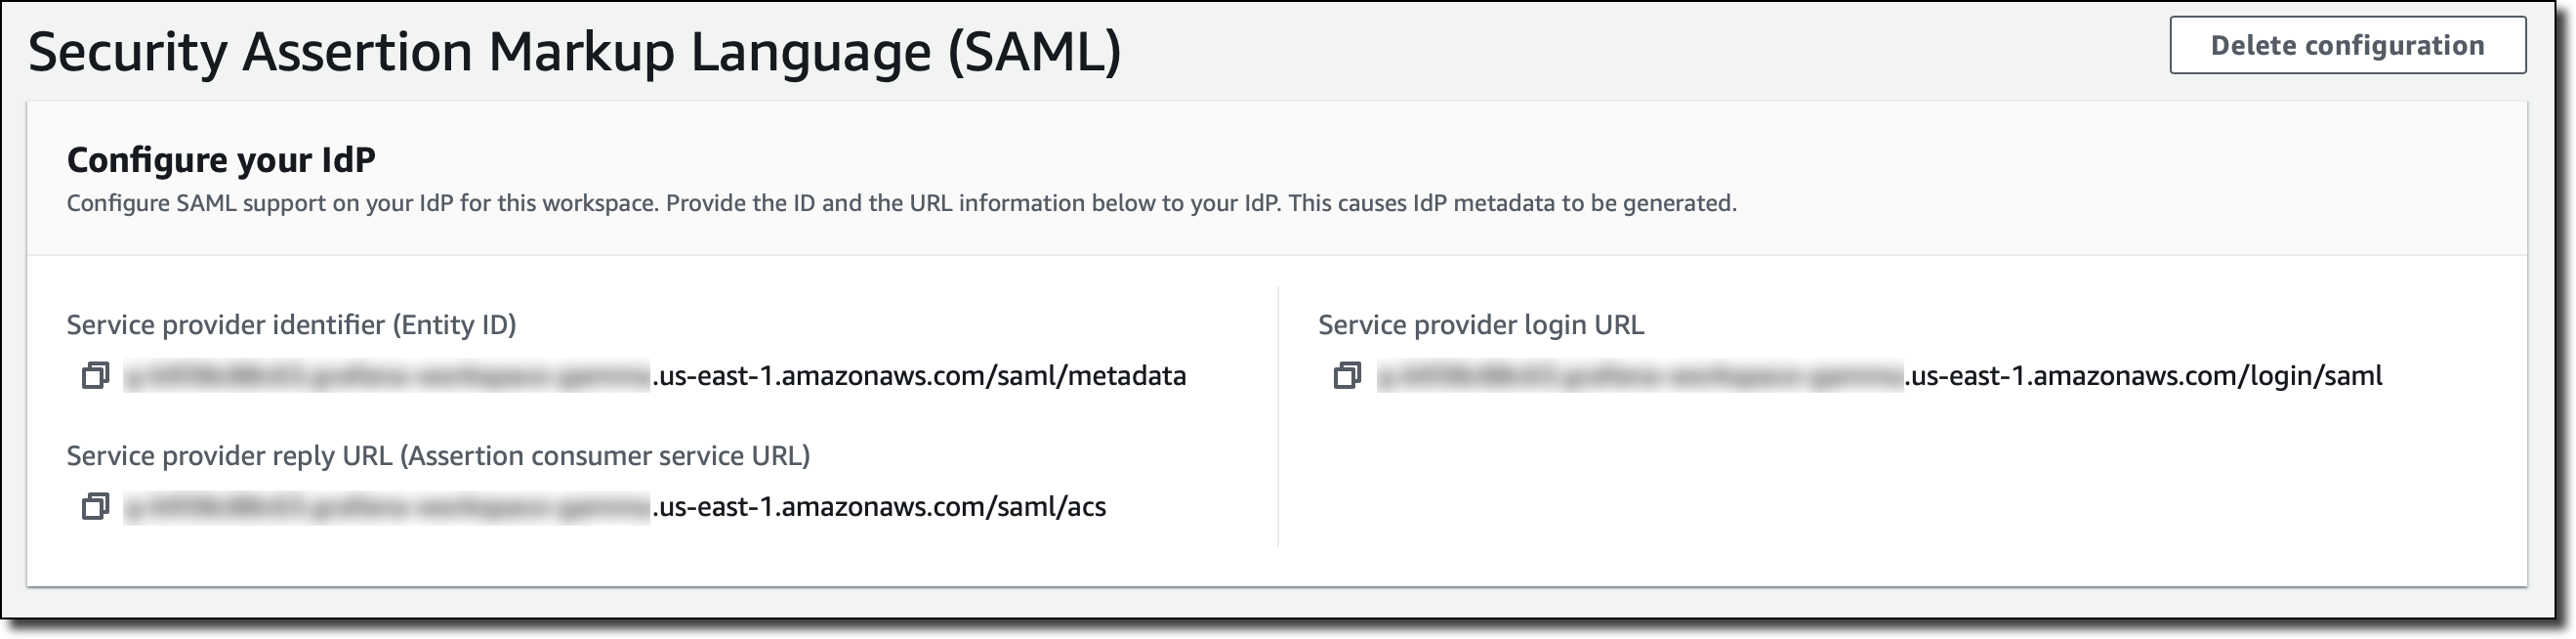
First, I have to provide the workspace ID and URL information to my IdP in order to generate IdP metadata for configuring this workspace.

Console screenshot.

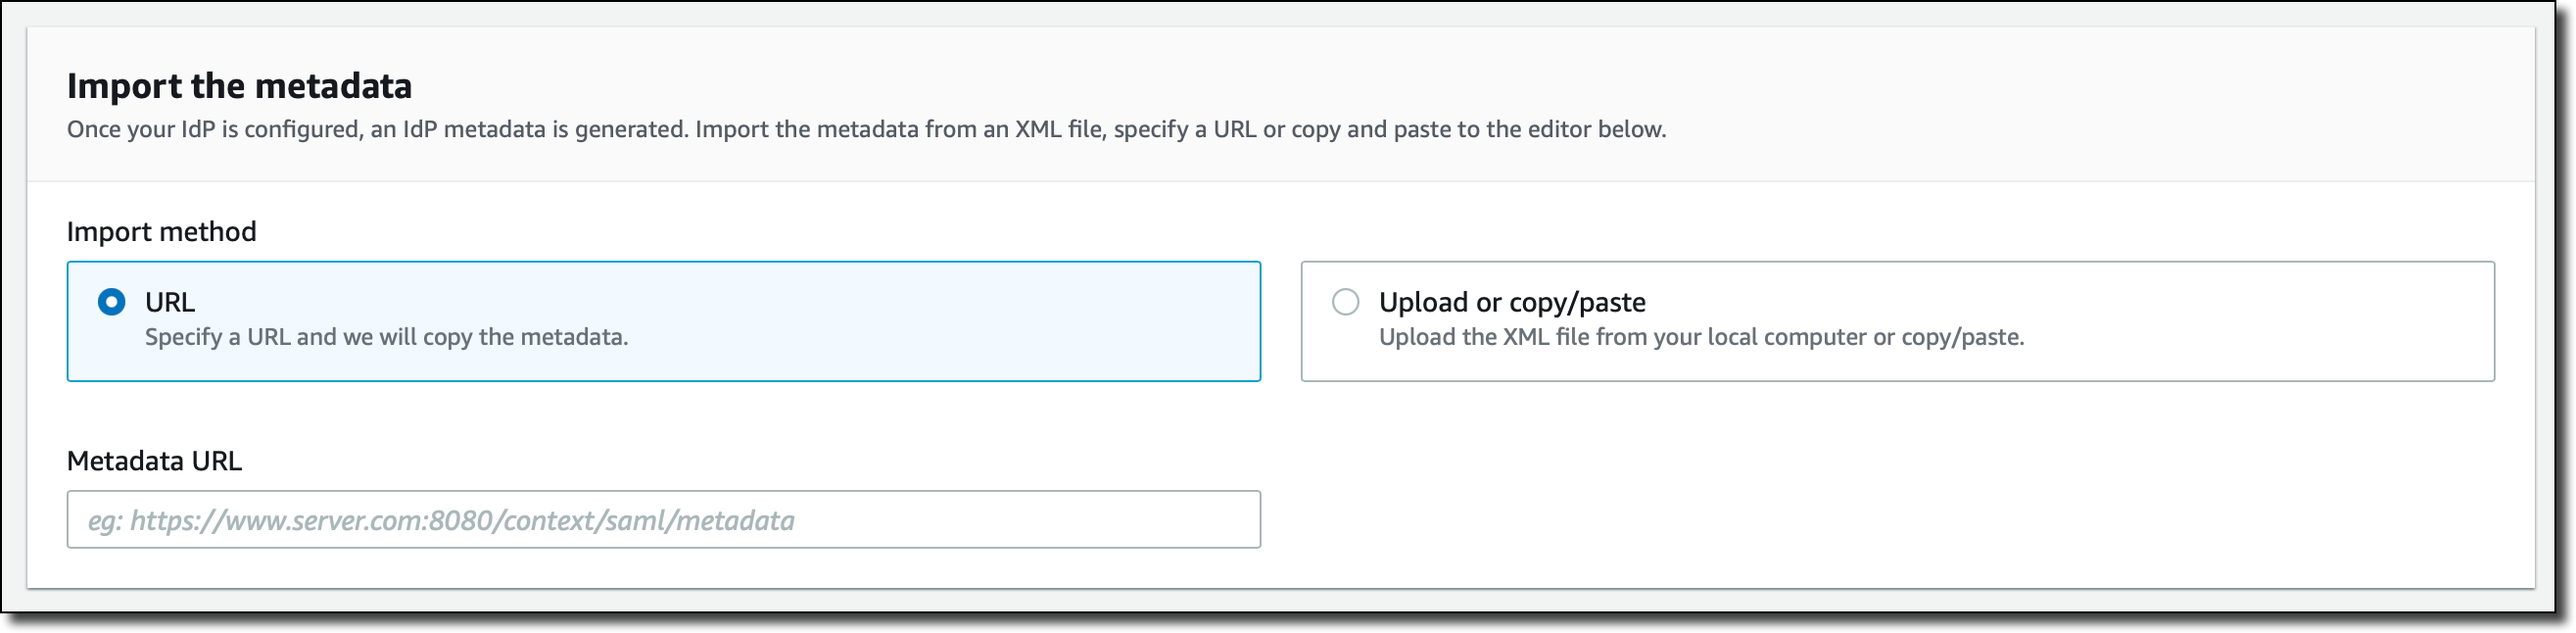
After my IdP is configured, I import the IdP metadata by specifying a URL or copying and pasting to the editor.

Console screenshot.

Finally, I can map user permissions in my IdP to Grafana user permissions, such as specifying which users will have Administrator, Editor, and Viewer permissions in my Amazon Managed Grafana workspace.

Console screenshot.

Availability and Pricing
Amazon Managed Grafana is available today in ten AWS Regions: US East (N. Virginia), US East (Ohio), US West (Oregon), Europe (Ireland), Europe (Frankfurt), Europe (London), Asia Pacific (Singapore), Asia Pacific (Tokyo), Asia Pacific (Sydney), and Asia Pacific (Seoul). For more information, see the AWS Regional Services List.

With Amazon Managed Grafana, you pay for the active users per workspace each month. Grafana API keys used to publish dashboards are billed as an API user license per workspace each month. You can upgrade to Grafana Enterprise to have access to enterprise plugins, support, and on-demand training directly from Grafana Labs. For more information, see the Amazon Managed Grafana pricing page.

To learn more, you are invited to this webinar on Thursday, September 9 at 9:00 am PDT / 12:00 pm EDT / 6:00 pm CEST.

Start using Amazon Managed Grafana today to visualize and analyze your operational data at any scale.

Danilo

New for AWS CloudFormation – Quickly Retry Stack Operations from the Point of Failure

Post Syndicated from Danilo Poccia original https://aws.amazon.com/blogs/aws/new-for-aws-cloudformation-quickly-retry-stack-operations-from-the-point-of-failure/

One of the great advantages of cloud computing is that you have access to programmable infrastructure. This allows you to manage your infrastructure as code and apply the same practices of application code development to infrastructure provisioning.

AWS CloudFormation gives you an easy way to model a collection of related AWS and third-party resources, provision them quickly and consistently, and manage them throughout their lifecycles. A CloudFormation template describes your desired resources and their dependencies so you can launch and configure them together as a stack. You can use a template to create, update, and delete an entire stack as a single unit instead of managing resources individually.

When you create or update a stack, your action might fail for different reasons. For example, there can be errors in the template, in the parameters of the template, or issues outside the template, such as AWS Identity and Access Management (IAM) permission errors. When such an error occurs, CloudFormation rolls back the stack to the previous stable condition. For a stack creation, that means deleting all resources created up to the point of the error. For a stack update, it means restoring the previous configuration.

This rollback to the previous state is great for production environments, but doesn’t make it easy to understand the reason for the error. Depending on the complexity of your template and the number of resources involved, you might spend lots of time waiting for all the resources to roll back before you can update the template with the right configuration and retry the operation.

Today, I am happy to share that now CloudFormation allows you to disable the automatic rollback, keep the resources successfully created or updated before the error occurs, and retry stack operations from the point of failure. In this way, you can quickly iterate to fix and remediate errors and greatly reduce the time required to test a CloudFormation template in a development environment. You can apply this new capability when you create a stack, when you update a stack, and when you execute a change set. Let’s see how this works in practice.

Quickly Iterate to Fix and Remediate a CloudFormation Stack
For one of my applications, I need to set up an Amazon Simple Storage Service (Amazon S3) bucket, an Amazon Simple Queue Service (SQS) queue, and an Amazon DynamoDB table that is streaming item-level changes to an Amazon Kinesis data stream. For this setup, I write down the first version of the CloudFormation template.

AWSTemplateFormatVersion: "2010-09-09"
Description: A sample template to fix & remediate
Parameters:
  ShardCountParameter:
    Type: Number
    Description: The number of shards for the Kinesis stream
Resources:
  MyBucket:
    Type: AWS::S3::Bucket
  MyQueue:
    Type: AWS::SQS::Queue
  MyStream:
    Type: AWS::Kinesis::Stream
    Properties:
      ShardCount: !Ref ShardCountParameter
  MyTable:
    Type: AWS::DynamoDB::Table
    Properties:
      BillingMode: PAY_PER_REQUEST
      AttributeDefinitions:
        - AttributeName: "ArtistId"
          AttributeType: "S"
        - AttributeName: "Concert"
          AttributeType: "S"
        - AttributeName: "TicketSales"
          AttributeType: "S"
      KeySchema:
        - AttributeName: "ArtistId"
          KeyType: "HASH"
        - AttributeName: "Concert"
          KeyType: "RANGE"
      KinesisStreamSpecification:
        StreamArn: !GetAtt MyStream.Arn
Outputs:
  BucketName:
    Value: !Ref MyBucket
    Description: The name of my S3 bucket
  QueueName:
    Value: !GetAtt MyQueue.QueueName
    Description: The name of my SQS queue
  StreamName:
    Value: !Ref MyStream
    Description: The name of my Kinesis stream
  TableName:
    Value: !Ref MyTable
    Description: The name of my DynamoDB table

Now, I want to create a stack from this template. On the CloudFormation console, I choose Create stack. Then, I upload the template file and choose Next.

Console screenshot.

I enter a name for the stack. Then, I fill the stack parameters. My template file has one parameter (ShardCountParameter) used to configure the number of shards for the Kinesis data stream. I know that the number of shards should be greater or equal to one, but by mistake, I enter zero and choose Next.

Console screenshot.

To create, modify, or delete resources in the stack, I use an IAM role. In this way, I have a clear boundary for the permissions that CloudFormation can use for stack operations. Also, I can use the same role to automate the deployment of the stack later in a standardized and reproducible environment.

In Permissions, I select the IAM role to use for the stack operations.

Console screenshot.

Now it’s time to use the new feature! In the Stack failure options, I select Preserve successfully provisioned resources to keep, in case of errors, the resources that have already been created. Failed resources are always rolled back to the last known stable state.

Console screenshot.

I leave all other options at their defaults and choose Next. Then, I review my configurations and choose Create stack.

The creation of the stack is in progress for a few seconds, and then it fails because of an error. In the Events tab, I look at the timeline of the events. The start of the creation of the stack is at the bottom. The most recent event is at the top. Properties validation for the stream resource failed because the number of shards (ShardCount) is below the minimum. For this reason, the stack is now in the CREATE_FAILED status.

Console screenshot.

Because I chose to preserve the provisioned resources, all resources created before the error are still there. In the Resources tab, the S3 bucket and the SQS queue are in the CREATE_COMPLETE status, while the Kinesis data stream is in the CREATE_FAILED status. The creation of the DynamoDB table depends on the Kinesis data stream to be available because the table uses the data stream in one of its properties (KinesisStreamSpecification). As a consequence of that, the table creation has not started yet, and the table is not in the list.

Console screenshot.

The rollback is now paused, and I have a few new options:

Retry – To retry the stack operation without any change. This option is useful if a resource failed to provision due to an issue outside the template. I can fix the issue and then retry from the point of failure.

Update – To update the template or the parameters before retrying the stack creation. The stack update starts from where the last operation was interrupted by an error.

Rollback – To roll back to the last known stable state. This is similar to default CloudFormation behavior.

Console screenshot.

Fixing Issues in the Parameters
I quickly realize the mistake I made while entering the parameter for the number of shards, so I choose Update.

I don’t need to change the template to fix this error. In Parameters, I fix the previous error and enter the correct amount for the number of shards: one shard.

Console screenshot.

I leave all other options at their current values and choose Next.

In Change set preview, I see that the update will try to modify the Kinesis stream (currently in the CREATE_FAILED status) and add the DynamoDB table. I review the other configurations and choose Update stack.

Console screenshot.

Now the update is in progress. Did I solve all the issues? Not yet. After some time, the update fails.

Fixing Issues Outside the Template
The Kinesis stream has been created, but the IAM role assumed by CloudFormation doesn’t have permissions to create the DynamoDB table.

Console screenshots.

In the IAM console, I add additional permissions to the role used by the stack operations to be able to create the DynamoDB table.

Console screenshot.

Back to the CloudFormation console, I choose the Retry option. With the new permissions, the creation of the DynamoDB table starts, but after some time, there is another error.

Fixing Issues in the Template
This time there is an error in my template where I define the DynamoDB table. In the AttributeDefinitions section, there is an attribute (TicketSales) that is not used in the schema.

Console screenshot.

With DynamoDB, attributes defined in the template should be used either for the primary key or for an index. I update the template and remove the TicketSales attribute definition.

Because I am editing the template, I take the opportunity to also add MinValue and MaxValue properties to the number of shards parameter (ShardCountParameter). In this way, CloudFormation can check that the value is in the correct range before starting the deployment, and I can avoid further mistakes.

I select the Update option. I choose to update the current template, and I upload the new template file. I confirm the current values for the parameters. Then, I leave all other options to their current values and choose Update stack.

This time, the creation of the stack is successful, and the status is UPDATE_COMPLETE. I can see all resources in the Resources tab and their description (based on the Outputs section of the template) in the Outputs tab.

Console screenshot.

Here’s the final version of the template:

AWSTemplateFormatVersion: "2010-09-09"
Description: A sample template to fix & remediate
Parameters:
  ShardCountParameter:
    Type: Number
    MinValue: 1
    MaxValue: 10
    Description: The number of shards for the Kinesis stream
Resources:
  MyBucket:
    Type: AWS::S3::Bucket
  MyQueue:
    Type: AWS::SQS::Queue
  MyStream:
    Type: AWS::Kinesis::Stream
    Properties:
      ShardCount: !Ref ShardCountParameter
  MyTable:
    Type: AWS::DynamoDB::Table
    Properties:
      BillingMode: PAY_PER_REQUEST
      AttributeDefinitions:
        - AttributeName: "ArtistId"
          AttributeType: "S"
        - AttributeName: "Concert"
          AttributeType: "S"
      KeySchema:
        - AttributeName: "ArtistId"
          KeyType: "HASH"
        - AttributeName: "Concert"
          KeyType: "RANGE"
      KinesisStreamSpecification:
        StreamArn: !GetAtt MyStream.Arn
Outputs:
  BucketName:
    Value: !Ref MyBucket
    Description: The name of my S3 bucket
  QueueName:
    Value: !GetAtt MyQueue.QueueName
    Description: The name of my SQS queue
  StreamName:
    Value: !Ref MyStream
    Description: The name of my Kinesis stream
  TableName:
    Value: !Ref MyTable
    Description: The name of my DynamoDB table

This was a simple example, but the new capability to retry stack operations from the point of failure already saved me lots of time. It allowed me to fix and remediate issues quickly, reducing the feedback loop and increasing the number of iterations that I can do in the same amount of time. In addition to using this for debugging, it is also great for incremental interactive development of templates. With more sophisticated applications, the time saved will be huge!

Fix and Remediate a CloudFormation Stack Using the AWS CLI
I can preserve successfully provisioned resources with the AWS Command Line Interface (CLI) by specifying the --disable-rollback option when I create a stack, update a stack, or execute a change set. For example:

aws cloudformation create-stack --stack-name my-stack \
    --template-body file://my-template.yaml -–disable-rollback
aws cloudformation update-stack --stack-name my-stack \
    --template-body file://my-template.yaml --disable-rollback
aws cloudformation execute-change-set --stack-name my-stack --change-set-name my-change-set \
    --template-body file://my-template.yaml --disable-rollback

For an existing stack, I can see if the DisableRollback property is enabled with the describe stack command:

aws cloudformation describe-stacks --stack-name my-stack

I can now update stacks in the CREATE_FAILED or UPDATE_FAILED status. To manually roll back a stack that is in the CREATE_FAILED or UPDATE_FAILED status, I can use the new rollback stack command:

aws cloudformation rollback-stack --stack-name my-stack

Availability and Pricing
The capability for AWS CloudFormation to retry stack operations from the point of failure is available at no additional charge in the following AWS Regions: US East (N. Virginia, Ohio), US West (Oregon, N. California), AWS GovCloud (US-East, US-West), Canada (Central), Europe (Frankfurt, Ireland, London, Milan, Paris, Stockholm), Asia Pacific (Hong Kong, Mumbai, Osaka, Seoul, Singapore, Sydney, Tokyo), Middle East (Bahrain), Africa (Cape Town), and South America (São Paulo).

Do you prefer to define your cloud application resources using familiar programming languages such as JavaScript, TypeScript, Python, Java, C#, and Go? Good news! The AWS Cloud Development Kit (AWS CDK) team is planning to add support for the new capabilities described in this post in the next couple of weeks.

Spend less time to fix and remediate your CloudFormation stacks with the new capability to retry stack operations from the point of failure.

Danilo

Run usage analytics on Amazon QuickSight using AWS CloudTrail

Post Syndicated from Sunil Salunkhe original https://aws.amazon.com/blogs/big-data/run-usage-analytics-on-amazon-quicksight-using-aws-cloudtrail/

Amazon QuickSight is a cloud-native BI service that allows end users to create and publish dashboards in minutes, without provisioning any servers or requiring complex licensing. You can view these dashboards on the QuickSight product console or embed them into applications and websites. After you deploy a dashboard, it’s important to assess how they and other assets are being adopted, accessed, and used across various departments or customers.

In this post, we use a QuickSight dashboard to present the following insights:

  • Most viewed and accessed dashboards
  • Most updated dashboards and analyses
  • Most popular datasets
  • Active users vs. idle users
  • Idle authors
  • Unused datasets (wasted SPICE capacity)

You can use these insights to reduce costs and create operational efficiencies in a deployment. The following diagram illustrates this architecture.

The following diagram illustrates this architecture.

Solution components

The following table summarizes the AWS services and resources that this solution uses.

Resource Type Name Purpose
AWS CloudTrail logs CloudTrailMultiAccount Capture all API calls for all AWS services across all AWS Regions for this account. You can use AWS Organizations to consolidate trails across multiple AWS accounts.
AWS Glue crawler

QSCloudTrailLogsCrawler

QSProcessedDataCrawler

Ensures that all CloudTrail data is crawled periodically and that partitions are updated in the AWS Glue Data Catalog.
AWS Glue ETL job QuickSightCloudTrailProcessing Reads catalogued data from the crawler, processes, transforms, and stores it in an S3 output bucket.
AWS Lambda function ExtractQSMetadata_func Extracts event data using the AWS SDK for Python, Boto3. The event data is enriched with QuickSight metadata objects like user, analysis, datasets, and dashboards.
Amazon Simple Storage Service (s3)

CloudTrailLogsBucket

QuickSight-BIonBI-processed

One bucket stores CloudTrail data. The other stores processed data.
Amazon QuickSight Quicksight_BI_On_BO_Analysis Visualizes the processed data.

 Solution walkthrough

AWS CloudTrail is a service that enables governance, compliance, operational auditing, and risk auditing of your AWS account. You can use CloudTrail to log, continuously monitor, and retain account activity related to actions across your AWS infrastructure. You can define a trail to collect API actions across all AWS Regions. Although we have enabled a trail for all Regions in our solution, the dashboard shows the data for single Region only.

After you enable CloudTrail, it starts capturing all API actions and then, at 15-minute intervals, delivers logs in JSON format to a configured Amazon Simple Storage Service (Amazon S3) bucket. Before the logs are made available to our ad hoc query engine, Amazon Athena, they must be parsed, transformed, and processed by the AWS Glue crawler and ETL job.

Before the logs are made available to our ad hoc query engine

This will be handled by AWS Glue Crawler & AWS Glue ETL Job. The AWS Glue crawler crawls through the data every day and populates new partitions in the Data Catalog. The data is later made available as a table on the Athena console for processing by the AWS Glue ETL job. Glue ETL Job QuickSightCloudtrail_GlueJob.txt filters logs and processes only those events where the event source is QuickSight. (for example, eventSource = quicksight.amazonaws.com’).

  This will be handled by AWS Glue Crawler & AWS Glue ETL Job.

The following screenshot shows the sample JSON for the QuickSight API calls.

The following screenshot shows the sample JSON for the QuickSight API calls.

The job processes those events and creates a Parquet file. The following table summarizes the file’s data points.

Quicksightlogs
Field Name Data Type
eventtime Datetime
eventname String
awsregion String
accountid String
username String
analysisname String
Date Date

The processed data is stored in an S3 folder at s3://<BucketName>/processedlogs/. For performance optimization during querying and connecting this data to QuickSight for visualization, these logs are partitioned by date field. For this reason, we recommend that you configure the AWS Glue crawler to detect the new data and partitions and update the Data Catalog for subsequent analysis. We have configured the crawler to run one time a day.

We need to enrich this log data with metadata from QuickSight, such as a list of analyses, users, and datasets. This metadata can be extracted using descibe_analysis, describe_user, describe_data_set in the AWS SDK for Python.

We provide an AWS Lambda function that is ideal for this extraction. We configured it to be triggered once a day through Amazon EventBridge. The extracted metadata is stored in the S3 folder at s3://<BucketName>/metadata/.

Now that we have processed logs and metadata for enrichment, we need to prepare the data visualization in QuickSight. Athena allows us to build views that can be imported into QuickSight as datasets.

We build the following views based on the tables populated by the Lambda function and the ETL job:

CREATE VIEW vw_quicksight_bionbi 
AS 
  SELECT Date_parse(eventtime, '%Y-%m-%dT%H:%i:%SZ') AS "Event Time", 
         eventname  AS "Event Name", 
         awsregion  AS "AWS Region", 
         accountid  AS "Account ID", 
         username   AS "User Name", 
         analysisname AS "Analysis Name", 
         dashboardname AS "Dashboard Name", 
         Date_parse(date, '%Y%m%d') AS "Event Date" 
  FROM   "quicksightbionbi"."quicksightoutput_aggregatedoutput" 

CREATE VIEW vw_users 
AS 
  SELECT usr.username "User Name", 
         usr.role     AS "Role", 
         usr.active   AS "Active" 
  FROM   (quicksightbionbi.users 
          CROSS JOIN Unnest("users") t (usr)) 

CREATE VIEW vw_analysis 
AS 
  SELECT aly.analysisname "Analysis Name", 
         aly.analysisid   AS "Analysis ID" 
  FROM   (quicksightbionbi.analysis 
          CROSS JOIN Unnest("analysis") t (aly)) 

CREATE VIEW vw_analysisdatasets 
AS 
  SELECT alyds.analysesname "Analysis Name", 
         alyds.analysisid   AS "Analysis ID", 
         alyds.datasetid    AS "Dataset ID", 
         alyds.datasetname  AS "Dataset Name" 
  FROM   (quicksightbionbi.analysisdatasets 
          CROSS JOIN Unnest("analysisdatasets") t (alyds)) 

CREATE VIEW vw_datasets 
AS 
  SELECT ds.datasetname AS "Dataset Name", 
         ds.importmode  AS "Import Mode" 
  FROM   (quicksightbionbi.datasets 
          CROSS JOIN Unnest("datasets") t (ds))

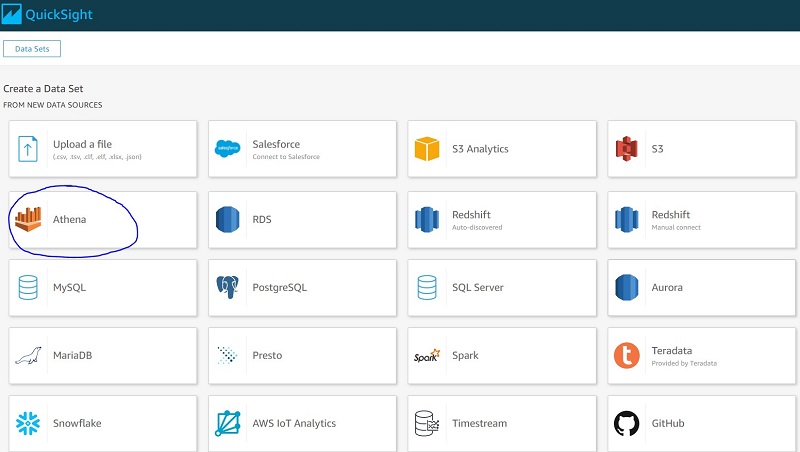
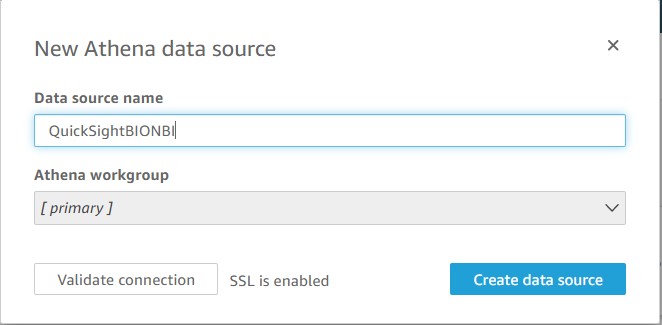
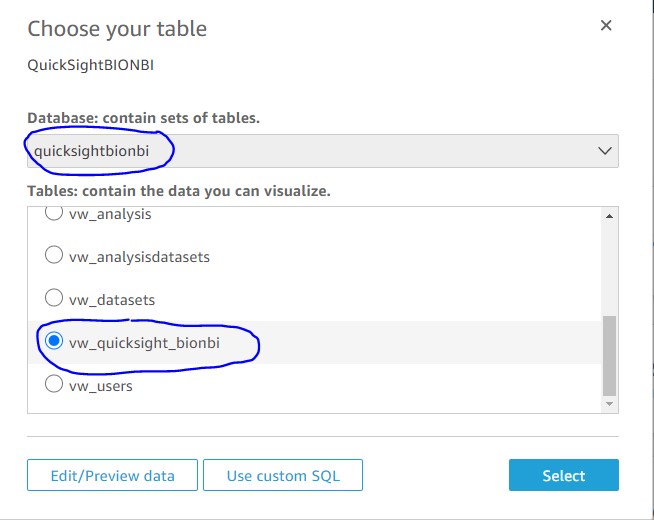
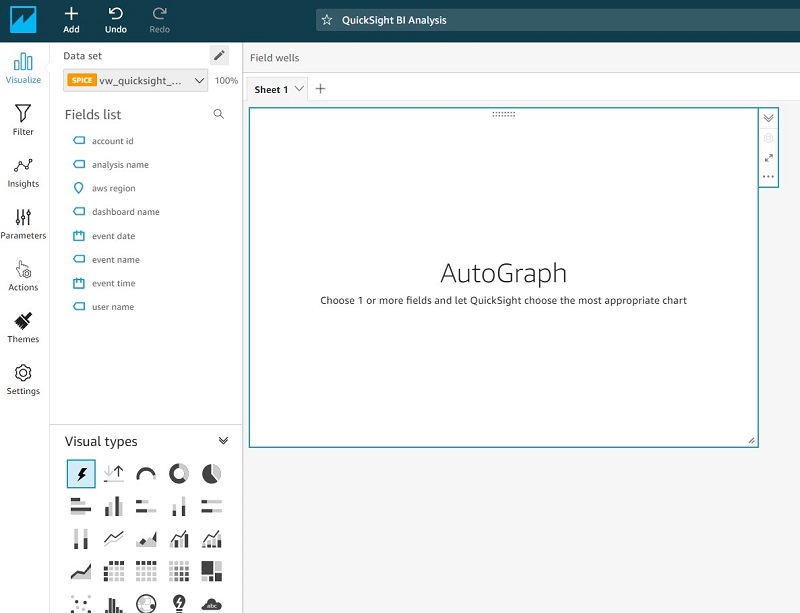
QuickSight visualization

Follow these steps to connect the prepared data with QuickSight and start building the BI visualization.

  1. Sign in to the AWS Management Console and open the QuickSight console.

You can set up QuickSight access for end users through SSO providers such as AWS Single Sign-On (AWS SSO), Okta, Ping, and Azure AD so they don’t need to open the console.

You can set up QuickSight access for end users through SSO providers

  1. On the QuickSight console, choose Datasets.
  2. Choose New dataset to create a dataset for our analysis.

Choose New dataset to create a dataset for our analysis.

  1. For Create a Data Set, choose Athena.

In the previous steps, we prepared all our data in the form of Athena views.

  1. Configure permission for QuickSight to access AWS services, including Athena and its S3 buckets. For information, see Accessing Data Sources.

Configure permission for QuickSight to access AWS services,

  1. For Data source name, enter QuickSightBIbBI.
  2. Choose Create data source.

Choose Create data source.

  1. On Choose your table, for Database, choose quicksightbionbi.
  2. For Tables, select vw_quicksight_bionbi.
  3. Choose Select.

Choose Select.

  1. For Finish data set creation, there are two options to choose from:
    1. Import to SPICE for quicker analytics – Built from the ground up for the cloud, SPICE uses a combination of columnar storage, in-memory technologies enabled through the latest hardware innovations, and machine code generation to run interactive queries on large datasets and get rapid responses. We use this option for this post.
    2. Directly query your data – You can connect to the data source in real time, but if the data query is expected to bring bulky results, this option might slow down the dashboard refresh.
  2. Choose Visualize to complete the data source creation process.

Choose Visualize to complete the data source creation process.

Now you can build your visualizations sheets. QuickSight refreshes the data source first. You can also schedule a periodic refresh of your data source.

Now you can build your visualizations sheets.

The following screenshot shows some examples of visualizations we built from the data source.

The following screenshot shows some examples of visualizations we built from the data source.


This dashboard presents us with two main areas for cost optimization:

  • Usage analysis – We can see how analyses and dashboards are being consumed by users. This area highlights the opportunity for cost saving by looking at datasets that have not been used for the last 90 days in any of the analysis but are still holding a major chunk of SPICE capacity.
  • Account governance – Because author subscriptions are charged on a fixed fee basis, it’s important to monitor if they are actively used. The dashboard helps us identify idle authors for the last 60 days.

Based on the information in the dashboard, we could do the following to save costs:

Conclusion

In this post, we showed how you can use CloudTrail logs to review the use of QuickSight objects, including analysis, dashboards, datasets, and users. You can use the information available in dashboards to save money on storage, subscriptions, understand maturity of QuickSight Tool adoption and more.


About the Author

Sunil SalunkheSunil Salunkhe is a Senior Solution Architect working with Strategic Accounts on their vision to leverage the cloud to drive aggressive growth strategies. He practices customer obsession by solving their complex challenges in all the aspects of the cloud journey including scale, security and reliability. While not working, he enjoys playing cricket and go cycling with his wife and a son.

Developing enterprise application patterns with the AWS CDK

Post Syndicated from Krishnakumar Rengarajan original https://aws.amazon.com/blogs/devops/developing-application-patterns-cdk/

Enterprises often need to standardize their infrastructure as code (IaC) for governance, compliance, and quality control reasons. You also need to manage and centrally publish updates to your IaC libraries. In this post, we demonstrate how to use the AWS Cloud Development Kit (AWS CDK) to define patterns for IaC and publish them for consumption in controlled releases using AWS CodeArtifact.

AWS CDK is an open-source software development framework to model and provision cloud application resources in programming languages such as TypeScript, JavaScript, Python, Java, and C#/.Net. The basic building blocks of AWS CDK are called constructs, which map to one or more AWS resources, and can be composed of other constructs. Constructs allow high-level abstractions to be defined as patterns. You can synthesize constructs into AWS CloudFormation templates and deploy them into an AWS account.

AWS CodeArtifact is a fully managed service for managing the lifecycle of software artifacts. You can use CodeArtifact to securely store, publish, and share software artifacts. Software artifacts are stored in repositories, which are aggregated into a domain. A CodeArtifact domain allows organizational policies to be applied across multiple repositories. You can use CodeArtifact with common build tools and package managers such as NuGet, Maven, Gradle, npm, yarn, pip, and twine.

Solution overview

In this solution, we complete the following steps:

  1. Create two AWS CDK pattern constructs in Typescript: one for traditional three-tier web applications and a second for serverless web applications.
  2. Publish the pattern constructs to CodeArtifact as npm packages. npm is the package manager for Node.js.
  3. Consume the pattern construct npm packages from CodeArtifact and use them to provision the AWS infrastructure.

We provide more information about the pattern constructs in the following sections. The source code mentioned in this blog is available in GitHub.

Note: The code provided in this blog post is for demonstration purposes only. You must ensure that it meets your security and production readiness requirements.

Traditional three-tier web application construct

The first pattern construct is for a traditional three-tier web application running on Amazon Elastic Compute Cloud (Amazon EC2), with AWS resources consisting of Application Load Balancer, an Autoscaling group and EC2 launch configuration, an Amazon Relational Database Service (Amazon RDS) or Amazon Aurora database, and AWS Secrets Manager. The following diagram illustrates this architecture.


Traditional stack architecture

Serverless web application construct

The second pattern construct is for a serverless application with AWS resources in AWS Lambda, Amazon API Gateway, and Amazon DynamoDB.

Serverless application architecture

Publishing and consuming pattern constructs

Both constructs are written in Typescript and published to CodeArtifact as npm packages. A semantic versioning scheme is used to version the construct packages. After a package gets published to CodeArtifact, teams can consume them for deploying AWS resources. The following diagram illustrates this architecture.

Pattern constructs

Prerequisites

Before getting started, complete the following steps:

  1. Clone the code from the GitHub repository for the traditional and serverless web application constructs:
    git clone https://github.com/aws-samples/aws-cdk-developing-application-patterns-blog.git
    cd aws-cdk-developing-application-patterns-blog
  2. Configure AWS Identity and Access Management (IAM) permissions by attaching IAM policies to the user, group, or role implementing this solution. The following policy files are in the iam folder in the root of the cloned repo:
    • BlogPublishArtifacts.json – The IAM policy to configure CodeArtifact and publish packages to it.
    • BlogConsumeTraditional.json – The IAM policy to consume the traditional three-tier web application construct from CodeArtifact and deploy it to an AWS account.
    • PublishArtifacts.json – The IAM policy to consume the serverless construct from CodeArtifact and deploy it to an AWS account.

Configuring CodeArtifact

In this step, we configure CodeArtifact for publishing the pattern constructs as npm packages. The following AWS resources are created:

  • A CodeArtifact domain named blog-domain
  • Two CodeArtifact repositories:
    • blog-npm-store – For configuring the upstream NPM repository.
    • blog-repository – For publishing custom packages.

Deploy the CodeArtifact resources with the following code:

cd prerequisites/
rm -rf package-lock.json node_modules
npm install
cdk deploy --require-approval never
cd ..

Log in to the blog-repository. This step is needed for publishing and consuming the npm packages. See the following code:

aws codeartifact login \
     --tool npm \
     --domain blog-domain \
     --domain-owner $(aws sts get-caller-identity --output text --query 'Account') \
     --repository blog-repository

Publishing the pattern constructs

  1. Change the directory to the serverless construct:
    cd serverless
  2. Install the required npm packages:
    rm package-lock.json && rm -rf node_modules
    npm install
    
  3. Build the npm project:
    npm run build
  4. Publish the construct npm package to the CodeArtifact repository:
    npm publish

    Follow the previously mentioned steps for building and publishing a traditional (classic Load Balancer plus Amazon EC2) web app by running these commands in the traditional directory.

    If the publishing is successful, you see messages like the following screenshots. The following screenshot shows the traditional infrastructure.

    Successful publishing of Traditional construct package to CodeArtifact

    The following screenshot shows the message for the serverless infrastructure.

    Successful publishing of Serverless construct package to CodeArtifact

    We just published version 1.0.1 of both the traditional and serverless web app constructs. To release a new version, we can simply update the version attribute in the package.json file in the traditional or serverless folder and repeat the last two steps.

    The following code snippet is for the traditional construct:

    {
        "name": "traditional-infrastructure",
        "main": "lib/index.js",
        "files": [
            "lib/*.js",
            "src"
        ],
        "types": "lib/index.d.ts",
        "version": "1.0.1",
    ...
    }

    The following code snippet is for the serverless construct:

    {
        "name": "serverless-infrastructure",
        "main": "lib/index.js",
        "files": [
            "lib/*.js",
            "src"
        ],
        "types": "lib/index.d.ts",
        "version": "1.0.1",
    ...
    }

Consuming the pattern constructs from CodeArtifact

In this step, we demonstrate how the pattern constructs published in the previous steps can be consumed and used to provision AWS infrastructure.

  1. From the root of the GitHub package, change the directory to the examples directory containing code for consuming traditional or serverless constructs.To consume the traditional construct, use the following code:
    cd examples/traditional

    To consume the serverless construct, use the following code:

    cd examples/serverless
  2. Open the package.json file in either directory and note that the packages and versions we consume are listed in the dependencies section, along with their version.
    The following code shows the traditional web app construct dependencies:

    "dependencies": {
        "@aws-cdk/core": "1.30.0",
        "traditional-infrastructure": "1.0.1",
        "aws-cdk": "1.47.0"
    }

    The following code shows the serverless web app construct dependencies:

    "dependencies": {
        "@aws-cdk/core": "1.30.0",
        "serverless-infrastructure": "1.0.1",
        "aws-cdk": "1.47.0"
    }
  3. Install the pattern artifact npm package along with the dependencies:
    rm package-lock.json && rm -rf node_modules
    npm install
    
  4. As an optional step, if you need to override the default Lambda function code, build the npm project. The following commands build the Lambda function source code:
    cd ../override-serverless
    npm run build
    cd -
  5. Bootstrap the project with the following code:
    cdk bootstrap

    This step is applicable for serverless applications only. It creates the Amazon Simple Storage Service (Amazon S3) staging bucket where the Lambda function code and artifacts are stored.

  6. Deploy the construct:
    cdk deploy --require-approval never

    If the deployment is successful, you see messages similar to the following screenshots. The following screenshot shows the traditional stack output, with the URL of the Load Balancer endpoint.

    Traditional CloudFormation stack outputs

    The following screenshot shows the serverless stack output, with the URL of the API Gateway endpoint.

    Serverless CloudFormation stack outputs

    You can test the endpoint for both constructs using a web browser or the following curl command:

    curl <endpoint output>

    The traditional web app endpoint returns a response similar to the following:

    [{"app": "traditional", "id": 1605186496, "purpose": "blog"}]

    The serverless stack returns two outputs. Use the output named ServerlessStack-v1.Api. See the following code:

    [{"purpose":"blog","app":"serverless","itemId":"1605190688947"}]

  7. Optionally, upgrade to a new version of pattern construct.
    Let’s assume that a new version of the serverless construct, version 1.0.2, has been published, and we want to upgrade our AWS infrastructure to this version. To do this, edit the package.json file and change the traditional-infrastructure or serverless-infrastructure package version in the dependencies section to 1.0.2. See the following code example:

    "dependencies": {
        "@aws-cdk/core": "1.30.0",
        "serverless-infrastructure": "1.0.2",
        "aws-cdk": "1.47.0"
    }

    To update the serverless-infrastructure package to 1.0.2, run the following command:

    npm update

    Then redeploy the CloudFormation stack:

    cdk deploy --require-approval never

Cleaning up

To avoid incurring future charges, clean up the resources you created.

  1. Delete all AWS resources that were created using the pattern constructs. We can use the AWS CDK toolkit to clean up all the resources:
    cdk destroy --force

    For more information about the AWS CDK toolkit, see Toolkit reference. Alternatively, delete the stack on the AWS CloudFormation console.

  2. Delete the CodeArtifact resources by deleting the CloudFormation stack that was deployed via AWS CDK:
    cd prerequisites
    cdk destroy –force
    

Conclusion

In this post, we demonstrated how to publish AWS CDK pattern constructs to CodeArtifact as npm packages. We also showed how teams can consume the published pattern constructs and use them to provision their AWS infrastructure.

This mechanism allows your infrastructure for AWS services to be provisioned from the configuration that has been vetted for quality control and security and governance checks. It also provides control over when new versions of the pattern constructs are released, and when the teams consuming the constructs can upgrade to the newly released versions.

About the Authors

Usman Umar


Usman Umar is a Sr. Applications Architect at AWS Professional Services. He is passionate about developing innovative ways to solve hard technical problems for the customers. In his free time, he likes going on biking trails, doing car modifications, and spending time with his family.


Krishnakumar Rengarajan


Krishnakumar Rengarajan is a DevOps Consultant with AWS Professional Services. He enjoys working with customers and focuses on building and delivering automated solutions that enables customers on their AWS cloud journeys.

Optimizing AWS Lambda cost and performance using AWS Compute Optimizer

Post Syndicated from Chad Schmutzer original https://aws.amazon.com/blogs/compute/optimizing-aws-lambda-cost-and-performance-using-aws-compute-optimizer/

This post is authored by Brooke Chen, Senior Product Manager for AWS Compute Optimizer, Letian Feng, Principal Product Manager for AWS Compute Optimizer, and Chad Schmutzer, Principal Developer Advocate for Amazon EC2

Optimizing compute resources is a critical component of any application architecture. Over-provisioning compute can lead to unnecessary infrastructure costs, while under-provisioning compute can lead to poor application performance.

Launched in December 2019, AWS Compute Optimizer is a recommendation service for optimizing the cost and performance of AWS compute resources. It generates actionable optimization recommendations tailored to your specific workloads. Over the last year, thousands of AWS customers reduced compute costs up to 25% by using Compute Optimizer to help choose the optimal Amazon EC2 instance types for their workloads.

One of the most frequent requests from customers is for AWS Lambda recommendations in Compute Optimizer. Today, we announce that Compute Optimizer now supports memory size recommendations for Lambda functions. This allows you to reduce costs and increase performance for your Lambda-based serverless workloads. To get started, opt in for Compute Optimizer to start finding recommendations.

Overview

With Lambda, there are no servers to manage, it scales automatically, and you only pay for what you use. However, choosing the right memory size settings for a Lambda function is still an important task. Computer Optimizer uses machine-learning based memory recommendations to help with this task.

These recommendations are available through the Compute Optimizer console, AWS CLI, AWS SDK, and the Lambda console. Compute Optimizer continuously monitors Lambda functions, using historical performance metrics to improve recommendations over time. In this blog post, we walk through an example to show how to use this feature.

Using Compute Optimizer for Lambda

This tutorial uses the AWS CLI v2 and the AWS Management Console.

In this tutorial, we setup two compute jobs that run every minute in AWS Region US East (N. Virginia). One job is more CPU intensive than the other. Initial tests show that the invocation times for both jobs typically last for less than 60 seconds. The goal is to either reduce cost without much increase in duration, or reduce the duration in a cost-efficient manner.

Based on these requirements, a serverless solution can help with this task. Amazon EventBridge can schedule the Lambda functions using rules. To ensure that the functions are optimized for cost and performance, you can use the memory recommendation support in Compute Optimizer.

In your AWS account, opt in to Compute Optimizer to start analyzing AWS resources. Ensure you have the appropriate IAM permissions configured – follow these steps for guidance. If you prefer to use the console to opt in, follow these steps. To opt in, enter the following command in a terminal window:

$ aws compute-optimizer update-enrollment-status --status Active

Once you enable Compute Optimizer, it starts to scan for functions that have been invoked for at least 50 times over the trailing 14 days. The next section shows two example scheduled Lambda functions for analysis.

Example Lambda functions

The code for the non-CPU intensive job is below. A Lambda function named lambda-recommendation-test-sleep is created with memory size configured as 1024 MB. An EventBridge rule is created to trigger the function on a recurring 1-minute schedule:

import json
import time

def lambda_handler(event, context):
  time.sleep(30)
  x=[0]*100000000
  return {
    'statusCode': 200,
    'body': json.dumps('Hello World!')
  }

The code for the CPU intensive job is below. A Lambda function named lambda-recommendation-test-busy is created with memory size configured as 128 MB. An EventBridge rule is created to trigger the function on a recurring 1-minute schedule:

import json
import random

def lambda_handler(event, context):
  random.seed(1)
  x=0
  for i in range(0, 20000000):
    x+=random.random()

  return {
    'statusCode': 200,
    'body': json.dumps('Sum:' + str(x))
  }

Understanding the Compute Optimizer recommendations

Compute Optimizer needs a history of at least 50 invocations of a Lambda function over the trailing 14 days to deliver recommendations. Recommendations are created by analyzing function metadata such as memory size, timeout, and runtime, in addition to CloudWatch metrics such as number of invocations, duration, error count, and success rate.

Compute Optimizer will gather the necessary information to provide memory recommendations for Lambda functions, and make them available within 48 hours. Afterwards, these recommendations will be refreshed daily.

These are recent invocations for the non-CPU intensive function:

Recent invocations for the non-CPU intensive function

Function duration is approximately 31.3 seconds with a memory setting of 1024 MB, resulting in a duration cost of about $0.00052 per invocation. Here are the recommendations for this function in the Compute Optimizer console:

Recommendations for this function in the Compute Optimizer console

The function is Not optimized with a reason of Memory over-provisioned. You can also fetch the same recommendation information via the CLI:

$ aws compute-optimizer \
  get-lambda-function-recommendations \
  --function-arns arn:aws:lambda:us-east-1:123456789012:function:lambda-recommendation-test-sleep
{
    "lambdaFunctionRecommendations": [
        {
            "utilizationMetrics": [
                {
                    "name": "Duration",
                    "value": 31333.63587049883,
                    "statistic": "Average"
                },
                {
                    "name": "Duration",
                    "value": 32522.04,
                    "statistic": "Maximum"
                },
                {
                    "name": "Memory",
                    "value": 817.67049838188,
                    "statistic": "Average"
                },
                {
                    "name": "Memory",
                    "value": 819.0,
                    "statistic": "Maximum"
                }
            ],
            "currentMemorySize": 1024,
            "lastRefreshTimestamp": 1608735952.385,
            "numberOfInvocations": 3090,
            "functionArn": "arn:aws:lambda:us-east-1:123456789012:function:lambda-recommendation-test-sleep:$LATEST",
            "memorySizeRecommendationOptions": [
                {
                    "projectedUtilizationMetrics": [
                        {
                            "name": "Duration",
                            "value": 30015.113193697029,
                            "statistic": "LowerBound"
                        },
                        {
                            "name": "Duration",
                            "value": 31515.86878891883,
                            "statistic": "Expected"
                        },
                        {
                            "name": "Duration",
                            "value": 33091.662123300975,
                            "statistic": "UpperBound"
                        }
                    ],
                    "memorySize": 900,
                    "rank": 1
                }
            ],
            "functionVersion": "$LATEST",
            "finding": "NotOptimized",
            "findingReasonCodes": [
                "MemoryOverprovisioned"
            ],
            "lookbackPeriodInDays": 14.0,
            "accountId": "123456789012"
        }
    ]
}

The Compute Optimizer recommendation contains useful information about the function. Most importantly, it has determined that the function is over-provisioned for memory. The attribute findingReasonCodes shows the value MemoryOverprovisioned. In memorySizeRecommendationOptions, Compute Optimizer has found that using a memory size of 900 MB results in an expected invocation duration of approximately 31.5 seconds.

For non-CPU intensive jobs, reducing the memory setting of the function often doesn’t have a negative impact on function duration. The recommendation confirms that you can reduce the memory size from 1024 MB to 900 MB, saving cost without significantly impacting duration. The new duration cost per invocation saves approximately 12%.

The Compute Optimizer console validates these calculations:

Compute Optimizer console validates these calculations

These are recent invocations for the second function which is CPU-intensive:

Recent invocations for the second function which is CPU-intensive

The function duration is about 37.5 seconds with a memory setting of 128 MB, resulting in a duration cost of about $0.000078 per invocation. The recommendations for this function appear in the Compute Optimizer console:

recommendations for this function appear in the Compute Optimizer console

The function is also Not optimized with a reason of Memory under-provisioned. The same recommendation information is available via the CLI:

$ aws compute-optimizer \
  get-lambda-function-recommendations \
  --function-arns arn:aws:lambda:us-east-1:123456789012:function:lambda-recommendation-test-busy
{
    "lambdaFunctionRecommendations": [
        {
            "utilizationMetrics": [
                {
                    "name": "Duration",
                    "value": 36006.85851551957,
                    "statistic": "Average"
                },
                {
                    "name": "Duration",
                    "value": 38540.43,
                    "statistic": "Maximum"
                },
                {
                    "name": "Memory",
                    "value": 53.75978407557355,
                    "statistic": "Average"
                },
                {
                    "name": "Memory",
                    "value": 55.0,
                    "statistic": "Maximum"
                }
            ],
            "currentMemorySize": 128,
            "lastRefreshTimestamp": 1608725151.752,
            "numberOfInvocations": 741,
            "functionArn": "arn:aws:lambda:us-east-1:123456789012:function:lambda-recommendation-test-busy:$LATEST",
            "memorySizeRecommendationOptions": [
                {
                    "projectedUtilizationMetrics": [
                        {
                            "name": "Duration",
                            "value": 27340.37604781184,
                            "statistic": "LowerBound"
                        },
                        {
                            "name": "Duration",
                            "value": 28707.394850202432,
                            "statistic": "Expected"
                        },
                        {
                            "name": "Duration",
                            "value": 30142.764592712556,
                            "statistic": "UpperBound"
                        }
                    ],
                    "memorySize": 160,
                    "rank": 1
                }
            ],
            "functionVersion": "$LATEST",
            "finding": "NotOptimized",
            "findingReasonCodes": [
                "MemoryUnderprovisioned"
            ],
            "lookbackPeriodInDays": 14.0,
            "accountId": "123456789012"
        }
    ]
}

For this function, Compute Optimizer has determined that the function’s memory is under-provisioned. The value of findingReasonCodes is MemoryUnderprovisioned. The recommendation is to increase the memory from 128 MB to 160 MB.

This recommendation may seem counter-intuitive, since the function only uses 55 MB of memory per invocation. However, Lambda allocates CPU and other resources linearly in proportion to the amount of memory configured. This means that increasing the memory allocation to 160 MB also reduces the expected duration to around 28.7 seconds. This is because a CPU-intensive task also benefits from the increased CPU performance that comes with the additional memory.

After applying this recommendation, the new expected duration cost per invocation is approximately $0.000075. This means that for almost no change in duration cost, the job latency is reduced from 37.5 seconds to 28.7 seconds.

The Compute Optimizer console validates these calculations:

Compute Optimizer console validates these calculations

Applying the Compute Optimizer recommendations

To optimize the Lambda functions using Compute Optimizer recommendations, use the following CLI command:

$ aws lambda update-function-configuration \
  --function-name lambda-recommendation-test-sleep \
  --memory-size 900

After invoking the function multiple times, we can see metrics of these invocations in the console. This shows that the function duration has not changed significantly after reducing the memory size from 1024 MB to 900 MB. The Lambda function has been successfully cost-optimized without increasing job duration:

Console shows the metrics from recent invocations

To apply the recommendation to the CPU-intensive function, use the following CLI command:

$ aws lambda update-function-configuration \
  --function-name lambda-recommendation-test-busy \
  --memory-size 160

After invoking the function multiple times, the console shows that the invocation duration is reduced to about 28 seconds. This matches the recommendation’s expected duration. This shows that the function is now performance-optimized without a significant cost increase:

Console shows that the invocation duration is reduced to about 28 seconds

Final notes

A couple of final notes:

  • Not every function will receive a recommendation. Compute optimizer only delivers recommendations when it has high confidence that these recommendations may help reduce cost or reduce execution duration.
  • As with any changes you make to an environment, we strongly advise that you test recommended memory size configurations before applying them into production.

Conclusion

You can now use Compute Optimizer for serverless workloads using Lambda functions. This can help identify the optimal Lambda function configuration options for your workloads. Compute Optimizer supports memory size recommendations for Lambda functions in all AWS Regions where Compute Optimizer is available. These recommendations are available to you at no additional cost. You can get started with Compute Optimizer from the console.

To learn more visit Getting started with AWS Compute Optimizer.


Announcing Amazon Managed Service for Grafana (in Preview)

Post Syndicated from Marcia Villalba original https://aws.amazon.com/blogs/aws/announcing-amazon-managed-grafana-service-in-preview/

Today, in partnership with Grafana Labs, we are excited to announce in preview, Amazon Managed Service for Grafana (AMG), a fully managed service that makes it easy to create on-demand, scalable, and secure Grafana workspaces to visualize and analyze your data from multiple sources.

Grafana is one of the most popular open source technologies used to create observability dashboards for your applications. It has a pluggable data source model and support for different kinds of time series databases and cloud monitoring vendors. Grafana centralizes your application data from multiple open-source, cloud, and third-party data sources.

Many of our customers love Grafana, but don’t want the burden of self-hosting and managing it. AMG manages the provisioning, setup, scaling, version upgrades and security patching of Grafana, eliminating the need for customers to do it themselves. AMG automatically scales to support thousands of users with high availability.

With AMG, you will get a fully managed and secure data visualization service where you can query, correlate, and visualize operational metrics, logs and traces across multiple data sources including cloud services such as AWS, Google, and Microsoft. AMG is integrated with AWS data sources, such as Amazon CloudWatch, Amazon Elasticsearch Service, AWS X-Ray, AWS IoT SiteWise, Amazon Timestream, and others to collect operational data in a simple way. Additionally, AMG also provides plug-ins to connect to popular third-party data sources, such as Datadog, Splunk, ServiceNow, and New Relic by upgrading to Grafana Enterprise directly from the AWS Console.

Screenshot for creating and configuring a managed Grafana workspace

AMG integrates directly into your AWS Organizations. You can define a AMG workspace in one AWS account that allows you to discover and access datasources in all your accounts and regions across your AWS organization. Creating dashboards in Grafana is easy as all these different datasources are discoverable in one place.

Customers really like Grafana for the ease of creating dashboards, it comes with many built-in dashboards to use when you add a new data source, or you can take advantage of its broad community of pre-built dashboards. For example, you can see in the following image a really nice dashboard that AMG created for me from one of my AWS Lambda function.

Screenshot of an automatic dashboard for Lambda function

One of my favorite things from AMG is the built-in security features. You can easily enable single sign-on using AWS Single Sign-On, restrict access to data sources and dashboards to the right users, and access audit logs via AWS CloudTrail for your hosted Grafana workspace. With AWS Single Sign-On you can leverage your existing corporate directories to enforce authentication and authorization permissions.

Another powerful feature that AMG has is support for Alerts. AMG integrates with Amazon Simple Notification Service (SNS) so customers can send Grafana alerts to SNS as a notification destination. It also has support for four other alert destinations including PagerDuty, Slack, VictorOps and OpsGenie.

There are no up-front investments required to use AMG, and you only pay a monthly active user license fee. This means that you can provision many users to access to your Grafana workspace, but will only be billed for active users that log in and use the workspace that month. Users granted access but that do not log in, will not be billed that month. You can also upgrade to Grafana Enterprise using AWS Marketplace, to get access to enterprise plugins, support, and training content directly from Grafana Labs.

Availability

This service is available in US East (N. Virginia) and Europe (Ireland) regions. To learn more visit the AMG service page, and be sure to join our re:Invent session tomorrow 12/16 from 8:00am – 8:30am PST for a demo!

AMG is now available in preview; to get access to this service fill out the registration form here.

Marcia

Join the Preview – Amazon Managed Service for Prometheus (AMP)

Post Syndicated from Jeff Barr original https://aws.amazon.com/blogs/aws/join-the-preview-amazon-managed-service-for-prometheus-amp/

Observability is an essential aspect of running cloud infrastructure at scale. You need to know that your resources are healthy and performing as expected, and that your system is delivering the desired level of performance to your customers.

A lot of challenges arise when monitoring container-based applications. First, because container resources are transient and there are lots of metrics to watch, the monitoring data has strikingly high cardinality. In plain language this means that there are lots of unique values, which can make it harder to define a space-efficient storage model and to create queries that return meaningful results. Second, because a well-architected container-based system is composed using a large number of moving parts, ingesting, processing, and storing the monitoring data can become an infrastructure challenge of its own.

Prometheus is a leading open-source monitoring solution with an active developer and user community. It has a multi-dimensional data model that is a great fit for time series data collected from containers.

Introducing Amazon Managed Service for Prometheus (AMP)
Today we are launching a preview of Amazon Managed Service for Prometheus (AMP). This fully-managed service is 100% compatible with Prometheus. It supports the same metrics, the same PromQL queries, and can also make use of the 150+ Prometheus exporters. AMP runs across multiple Availability Zones for high availability, and is powered by CNCF Cortex for horizontal scalability. AMP will easily scale to ingest, store, and query millions of time series metrics.

The preview includes support for Amazon Elastic Kubernetes Service (EKS) and Amazon Elastic Container Service (ECS). It can also be used to monitor your self-managed Kubernetes clusters that are running in the cloud or on-premises.

Getting Started with Amazon Managed Service for Prometheus (AMP)
After joining the preview, I open the AMP Console, enter a name for my AMP workspace, and click Create to get started (API and CLI support is also available):

My workspace is active within a minute or so. The console provides me with the endpoints that I can use to write data to my workspace, and to issue queries:

It also provides guidance on how to configure an existing Prometheus server to send metrics to the AMP workspace:

I can also use AWS Distro for OpenTelemetry to scrape Prometheus metrics and send them to my AMP workspace.

Once I have stored some metrics in my workspace, I can run PromQL queries and I can use Grafana to create dashboards and other visualizations. Here’s a sample Grafana dashboard:

Join the Preview
As noted earlier, we’re launching Amazon Managed Service for Prometheus (AMP) in preview form and you are welcome to try it out today.

We’ll have more info (and a more detailed blog post) at launch time.

Jeff;

Rapid and flexible Infrastructure as Code using the AWS CDK with AWS Solutions Constructs

Post Syndicated from Biff Gaut original https://aws.amazon.com/blogs/devops/rapid-flexible-infrastructure-with-solutions-constructs-cdk/

Introduction

As workloads move to the cloud and all infrastructure becomes virtual, infrastructure as code (IaC) becomes essential to leverage the agility of this new world. JSON and YAML are the powerful, declarative modeling languages of AWS CloudFormation, allowing you to define complex architectures using IaC. Just as higher level languages like BASIC and C abstracted away the details of assembly language and made developers more productive, the AWS Cloud Development Kit (AWS CDK) provides a programming model above the native template languages, a model that makes developers more productive when creating IaC. When you instantiate CDK objects in your Typescript (or Python, Java, etc.) application, those objects “compile” into a YAML template that the CDK deploys as an AWS CloudFormation stack.

AWS Solutions Constructs take this simplification a step further by providing a library of common service patterns built on top of the CDK. These multi-service patterns allow you to deploy multiple resources with a single object, resources that follow best practices by default – both independently and throughout their interaction.

Comparison of an Application stack with Assembly Language, 4th generation language and Object libraries such as Hibernate with an IaC stack of CloudFormation, AWS CDK and AWS Solutions Constructs

Application Development Stack vs. IaC Development Stack

Solution overview

To demonstrate how using Solutions Constructs can accelerate the development of IaC, in this post you will create an architecture that ingests and stores sensor readings using Amazon Kinesis Data Streams, AWS Lambda, and Amazon DynamoDB.

An architecture diagram showing sensor readings being sent to a Kinesis data stream. A Lambda function will receive the Kinesis records and store them in a DynamoDB table.

Prerequisite – Setting up the CDK environment

Tip – If you want to try this example but are concerned about the impact of changing the tools or versions on your workstation, try running it on AWS Cloud9. An AWS Cloud9 environment is launched with an AWS Identity and Access Management (AWS IAM) role and doesn’t require configuring with an access key. It uses the current region as the default for all CDK infrastructure.

To prepare your workstation for CDK development, confirm the following:

  • Node.js 10.3.0 or later is installed on your workstation (regardless of the language used to write CDK apps).
  • You have configured credentials for your environment. If you’re running locally you can do this by configuring the AWS Command Line Interface (AWS CLI).
  • TypeScript 2.7 or later is installed globally (npm -g install typescript)

Before creating your CDK project, install the CDK toolkit using the following command:

npm install -g aws-cdk

Create the CDK project

  1. First create a project folder called stream-ingestion with these two commands:

mkdir stream-ingestion
cd stream-ingestion

  1. Now create your CDK application using this command:

npx [email protected] init app --language=typescript

Tip – This example will be written in TypeScript – you can also specify other languages for your projects.

At this time, you must use the same version of the CDK and Solutions Constructs. We’re using version 1.68.0 of both based upon what’s available at publication time, but you can update this with a later version for your projects in the future.

Let’s explore the files in the application this command created:

  • bin/stream-ingestion.ts – This is the module that launches the application. The key line of code is:

new StreamIngestionStack(app, 'StreamIngestionStack');

This creates the actual stack, and it’s in StreamIngestionStack that you will write the CDK code that defines the resources in your architecture.

  • lib/stream-ingestion-stack.ts – This is the important class. In the constructor of StreamIngestionStack you will add the constructs that will create your architecture.

During the deployment process, the CDK uploads your Lambda function to an Amazon S3 bucket so it can be incorporated into your stack.

  1. To create that S3 bucket and any other infrastructure the CDK requires, run this command:

cdk bootstrap

The CDK uses the same supporting infrastructure for all projects within a region, so you only need to run the bootstrap command once in any region in which you create CDK stacks.

  1. To install the required Solutions Constructs packages for our architecture, run the these two commands from the command line:

npm install @aws-solutions-constructs/[email protected]

Write the code

First you will write the Lambda function that processes the Kinesis data stream messages.

  1. Create a folder named lambda under stream-ingestion
  2. Within the lambda folder save a file called lambdaFunction.js with the following contents:
var AWS = require("aws-sdk");

// Create the DynamoDB service object
var ddb = new AWS.DynamoDB({ apiVersion: "2012-08-10" });

AWS.config.update({ region: process.env.AWS_REGION });

// We will configure our construct to 
// look for the .handler function
exports.handler = async function (event) {
  try {
    // Kinesis will deliver records 
    // in batches, so we need to iterate through
    // each record in the batch
    for (let record of event.Records) {
      const reading = parsePayload(record.kinesis.data);
      await writeRecord(record.kinesis.partitionKey, reading);
    };
  } catch (err) {
    console.log(`Write failed, err:\n${JSON.stringify(err, null, 2)}`);
    throw err;
  }
  return;
};

// Write the provided sensor reading data to the DynamoDB table
async function writeRecord(partitionKey, reading) {

  var params = {
    // Notice that Constructs automatically sets up 
    // an environment variable with the table name.
    TableName: process.env.DDB_TABLE_NAME,
    Item: {
      partitionKey: { S: partitionKey },  // sensor Id
      timestamp: { S: reading.timestamp },
      value: { N: reading.value}
    },
  };

  // Call DynamoDB to add the item to the table
  await ddb.putItem(params).promise();
}

// Decode the payload and extract the sensor data from it
function parsePayload(payload) {

  const decodedPayload = Buffer.from(payload, "base64").toString(
    "ascii"
  );

  // Our CLI command will send the records to Kinesis
  // with the values delimited by '|'
  const payloadValues = decodedPayload.split("|", 2)
  return {
    value: payloadValues[0],
    timestamp: payloadValues[1]
  }
}

We won’t spend a lot of time explaining this function – it’s pretty straightforward and heavily commented. It receives an event with one or more sensor readings, and for each reading it extracts the pertinent data and saves it to the DynamoDB table.

You will use two Solutions Constructs to create your infrastructure:

The aws-kinesisstreams-lambda construct deploys an Amazon Kinesis data stream and a Lambda function.

  • aws-kinesisstreams-lambda creates the Kinesis data stream and Lambda function that subscribes to that stream. To support this, it also creates other resources, such as IAM roles and encryption keys.

The aws-lambda-dynamodb construct deploys a Lambda function and a DynamoDB table.

  • aws-lambda-dynamodb creates an Amazon DynamoDB table and a Lambda function with permission to access the table.
  1. To deploy the first of these two constructs, replace the code in lib/stream-ingestion-stack.ts with the following code:
import * as cdk from "@aws-cdk/core";
import * as lambda from "@aws-cdk/aws-lambda";
import { KinesisStreamsToLambda } from "@aws-solutions-constructs/aws-kinesisstreams-lambda";

import * as ddb from "@aws-cdk/aws-dynamodb";
import { LambdaToDynamoDB } from "@aws-solutions-constructs/aws-lambda-dynamodb";

export class StreamIngestionStack extends cdk.Stack {
  constructor(scope: cdk.Construct, id: string, props?: cdk.StackProps) {
    super(scope, id, props);

    const kinesisLambda = new KinesisStreamsToLambda(
      this,
      "KinesisLambdaConstruct",
      {
        lambdaFunctionProps: {
          // Where the CDK can find the lambda function code
          runtime: lambda.Runtime.NODEJS_10_X,
          handler: "lambdaFunction.handler",
          code: lambda.Code.fromAsset("lambda"),
        },
      }
    );

    // Next Solutions Construct goes here
  }
}

Let’s explore this code:

  • It instantiates a new KinesisStreamsToLambda object. This Solutions Construct will launch a new Kinesis data stream and a new Lambda function, setting up the Lambda function to receive all the messages in the Kinesis data stream. It will also deploy all the additional resources and policies required for the architecture to follow best practices.
  • The third argument to the constructor is the properties object, where you specify overrides of default values or any other information the construct needs. In this case you provide properties for the encapsulated Lambda function that informs the CDK where to find the code for the Lambda function that you stored as lambda/lambdaFunction.js earlier.
  1. Now you’ll add the second construct that connects the Lambda function to a new DynamoDB table. In the same lib/stream-ingestion-stack.ts file, replace the line // Next Solutions Construct goes here with the following code:
    // Define the primary key for the new DynamoDB table
    const primaryKeyAttribute: ddb.Attribute = {
      name: "partitionKey",
      type: ddb.AttributeType.STRING,
    };

    // Define the sort key for the new DynamoDB table
    const sortKeyAttribute: ddb.Attribute = {
      name: "timestamp",
      type: ddb.AttributeType.STRING,
    };

    const lambdaDynamoDB = new LambdaToDynamoDB(
      this,
      "LambdaDynamodbConstruct",
      {
        // Tell construct to use the Lambda function in
        // the first construct rather than deploy a new one
        existingLambdaObj: kinesisLambda.lambdaFunction,
        tablePermissions: "Write",
        dynamoTableProps: {
          partitionKey: primaryKeyAttribute,
          sortKey: sortKeyAttribute,
          billingMode: ddb.BillingMode.PROVISIONED,
          removalPolicy: cdk.RemovalPolicy.DESTROY
        },
      }
    );

    // Add autoscaling
    const readScaling = lambdaDynamoDB.dynamoTable.autoScaleReadCapacity({
      minCapacity: 1,
      maxCapacity: 50,
    });

    readScaling.scaleOnUtilization({
      targetUtilizationPercent: 50,
    });

Let’s explore this code:

  • The first two const objects define the names and types for the partition key and sort key of the DynamoDB table.
  • The LambdaToDynamoDB construct instantiated creates a new DynamoDB table and grants access to your Lambda function. The key to this call is the properties object you pass in the third argument.
    • The first property sent to LambdaToDynamoDB is existingLambdaObj – by setting this value to the Lambda function created by KinesisStreamsToLambda, you’re telling the construct to not create a new Lambda function, but to grant the Lambda function in the other Solutions Construct access to the DynamoDB table. This illustrates how you can chain many Solutions Constructs together to create complex architectures.
    • The second property sent to LambdaToDynamoDB tells the construct to limit the Lambda function’s access to the table to write only.
    • The third property sent to LambdaToDynamoDB is actually a full properties object defining the DynamoDB table. It provides the two attribute definitions you created earlier as well as the billing mode. It also sets the RemovalPolicy to DESTROY. This policy setting ensures that the table is deleted when you delete this stack – in most cases you should accept the default setting to protect your data.
  • The last two lines of code show how you can use statements to modify a construct outside the constructor. In this case we set up auto scaling on the new DynamoDB table, which we can access with the dynamoTable property on the construct we just instantiated.

That’s all it takes to create the all resources to deploy your architecture.

  1. Save all the files, then compile the Typescript into a CDK program using this command:

npm run build

  1. Finally, launch the stack using this command:

cdk deploy

(Enter “y” in response to Do you wish to deploy all these changes (y/n)?)

You will see some warnings where you override CDK default values. Because you are doing this intentionally you may disregard these, but it’s always a good idea to review these warnings when they occur.

Tip – Many mysterious CDK project errors stem from mismatched versions. If you get stuck on an inexplicable error, check package.json and confirm that all CDK and Solutions Constructs libraries have the same version number (with no leading caret ^). If necessary, correct the version numbers, delete the package-lock.json file and node_modules tree and run npm install. Think of this as the “turn it off and on again” first response to CDK errors.

You have now deployed the entire architecture for the demo – open the CloudFormation stack in the AWS Management Console and take a few minutes to explore all 12 resources that the program deployed (and the 380 line template generated to created them).

Feed the Stream

Now use the CLI to send some data through the stack.

Go to the Kinesis Data Streams console and copy the name of the data stream. Replace the stream name in the following command and run it from the command line.

aws kinesis put-records \
--stream-name StreamIngestionStack-KinesisLambdaConstructKinesisStreamXXXXXXXX-XXXXXXXXXXXX \
--records \
PartitionKey=1301,'Data=15.4|2020-08-22T01:16:36+00:00' \
PartitionKey=1503,'Data=39.1|2020-08-22T01:08:15+00:00'

Tip – If you are using the AWS CLI v2, the previous command will result in an “Invalid base64…” error because v2 expects the inputs to be Base64 encoded by default. Adding the argument --cli-binary-format raw-in-base64-out will fix the issue.

To confirm that the messages made it through the service, open the DynamoDB console – you should see the two records in the table.

Now that you’ve got it working, pause to think about what you just did. You deployed a system that can ingest and store sensor readings and scale to handle heavy loads. You did that by instantiating two objects – well under 60 lines of code. Experiment with changing some property values and deploying the changes by running npm run build and cdk deploy again.

Cleanup

To clean up the resources in the stack, run this command:

cdk destroy

Conclusion

Just as languages like BASIC and C allowed developers to write programs at a higher level of abstraction than assembly language, the AWS CDK and AWS Solutions Constructs allow us to create CloudFormation stacks in Typescript, Java, or Python instead JSON or YAML. Just as there will always be a place for assembly language, there will always be situations where we want to write CloudFormation templates manually – but for most situations, we can now use the AWS CDK and AWS Solutions Constructs to create complex and complete architectures in a fraction of the time with very little code.

AWS Solutions Constructs can currently be used in CDK applications written in Typescript, Javascript, Java and Python and will be available in C# applications soon.

About the Author

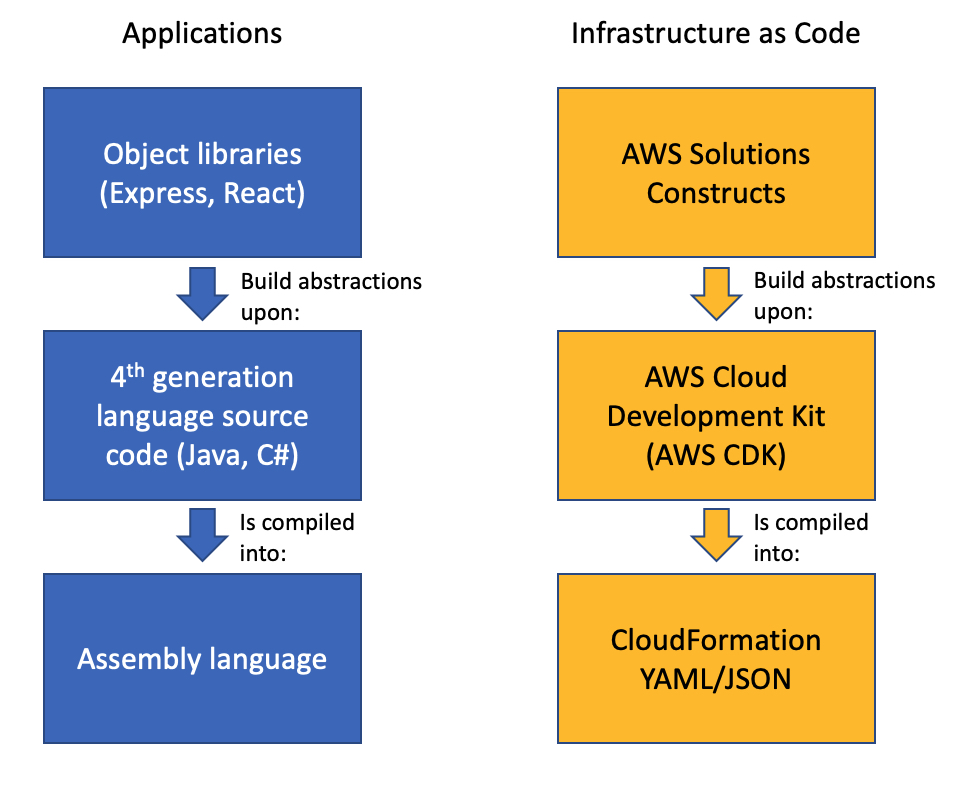
Biff Gaut has been shipping software since 1983, from small startups to large IT shops. Along the way he has contributed to 2 books, spoken at several conferences and written many blog posts. He is now a Principal Solutions Architect at AWS working on the AWS Solutions Constructs team, helping customers deploy better architectures more quickly.