Tag Archives: Management Tools

New – Multi-account search in AWS Resource Explorer

Post Syndicated from Danilo Poccia original https://aws.amazon.com/blogs/aws/new-multi-account-search-in-aws-resource-explorer/

With AWS Resource Explorer, you can search for and discover your resources, such as Amazon Elastic Compute Cloud (Amazon EC2) instances, Amazon Kinesis data streams, and Amazon DynamoDB tables, across AWS Regions. Starting today, you can also search across accounts within your organization.

It takes just a few minutes to turn on and configure Resource Explorer for an entire organization or a specific organizational unit (OU) and use simple free-form text and filtered searches to find relevant AWS resources across accounts and Regions.

Multi-account search is available in the Resource Explorer console, anywhere in the AWS Management Console through the unified search bar (the search bar at the top of every AWS console page), using the AWS Command Line Interface (AWS CLI), AWS SDKs, or AWS Chatbot. In this way, you can locate a resource quickly, navigate to the appropriate account and service, and take action.

When operating in a well-architected manner, multiple AWS accounts are used to help isolate and manage business applications and data. You can now use Resource Explorer to simplify how you explore your resources across accounts and act on them at scale. For example, Resource Explorer can help you locate impacted resources across your entire organization when investigating increased operational costs, troubleshooting a performance issue, or remediating a security alert.

Let’s see how this works in practice.

Setting up multi-account search
You can set up multi-account search for your organization in four steps:

  1. Enable trusted access for AWS Account Management.
  2. Configure Resource Explorer in every account in the organization or in the OU you want to search through. You can do that in just a few clicks using AWS Systems Manager Quick Setup. Optionally, you can use AWS CloudFormation, or other management tools you are comfortable with.
  3. It is not mandatory, but we suggest creating a delegated admin account for AWS Account Management. Then, to centralize all the required permissions for multi-account creation, we recommend using the delegated admin account to create Resource Explorer multi-account views.
  4. Finally, you can create a multi-account view to start searching across the organization.

Create a multi-account view
I already implemented the first three steps in the previous list. Using the delegated admin account, I go to the Resource Explorer console. There, I choose Views in the Explore resources section and create a view.

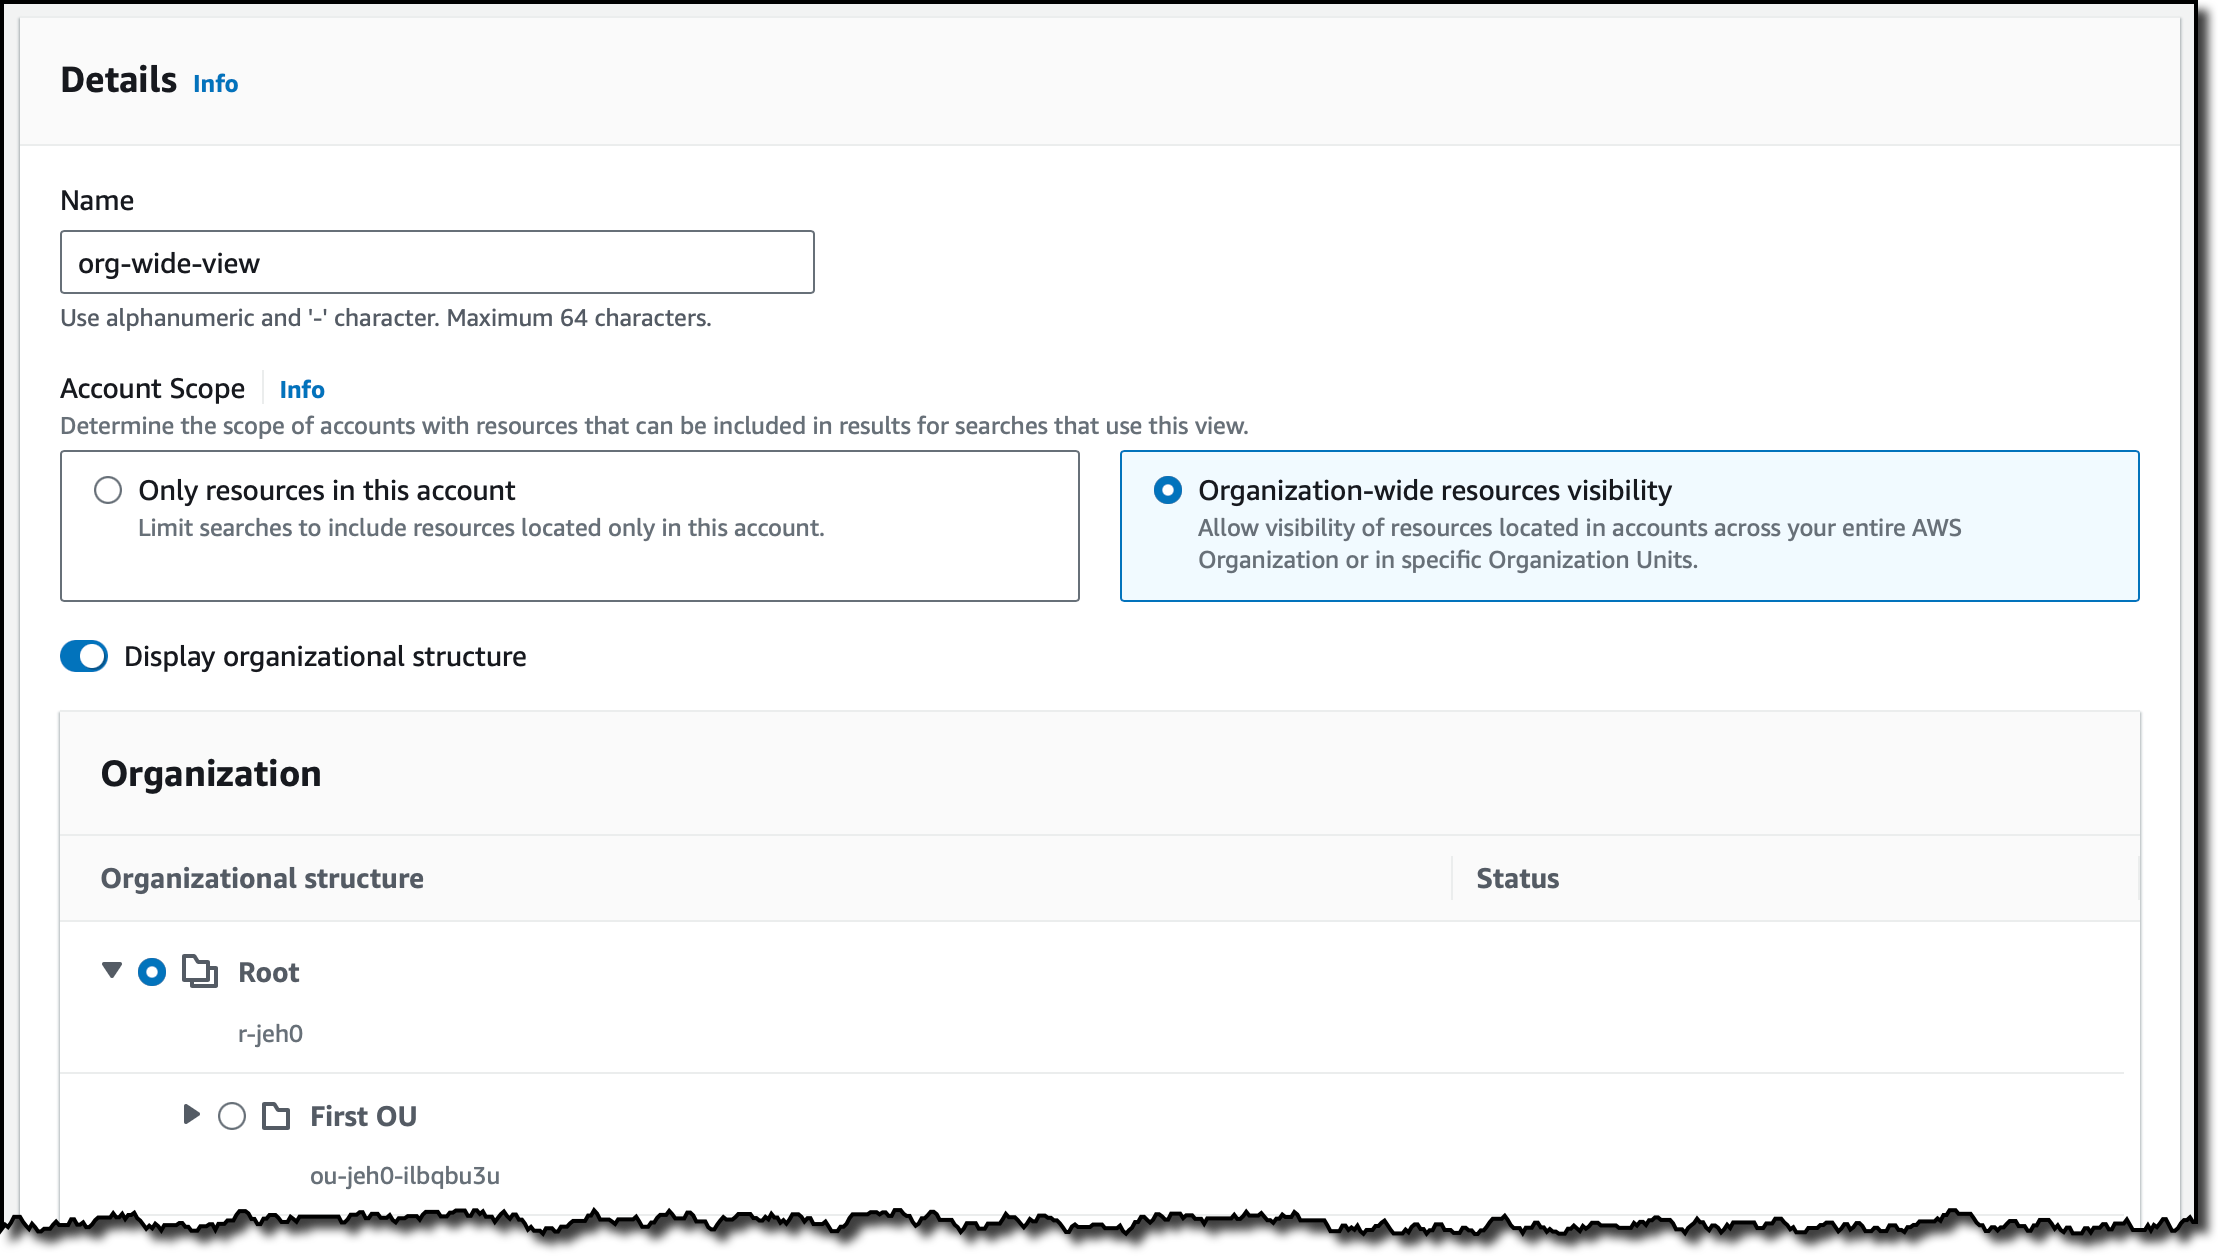
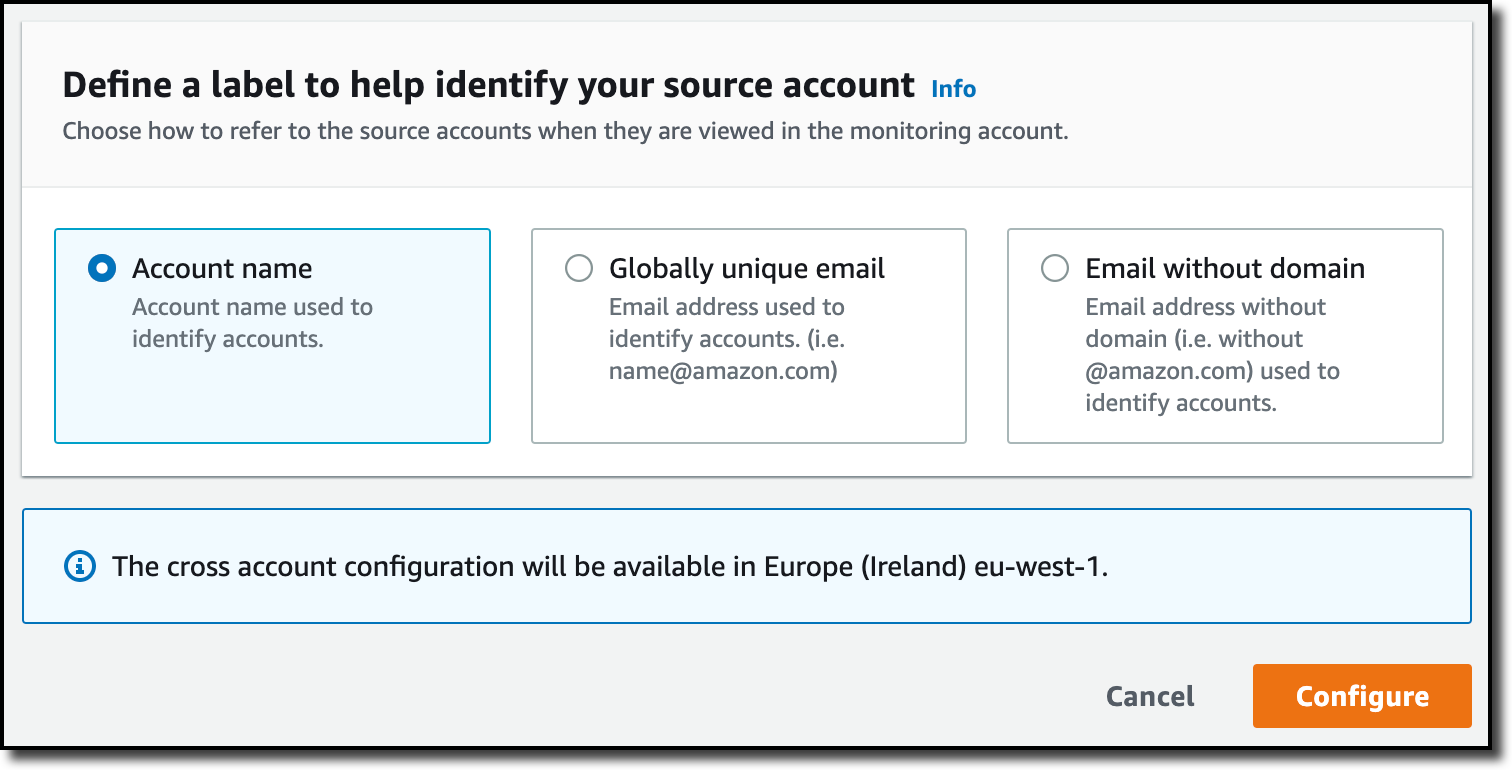
I enter a name for the view and select Organization-wide resources visibility. In this way, I can allow visibility of resources located in accounts across my entire organization or in specific OUs. For this view, I select the whole organization.

Console screenshot.

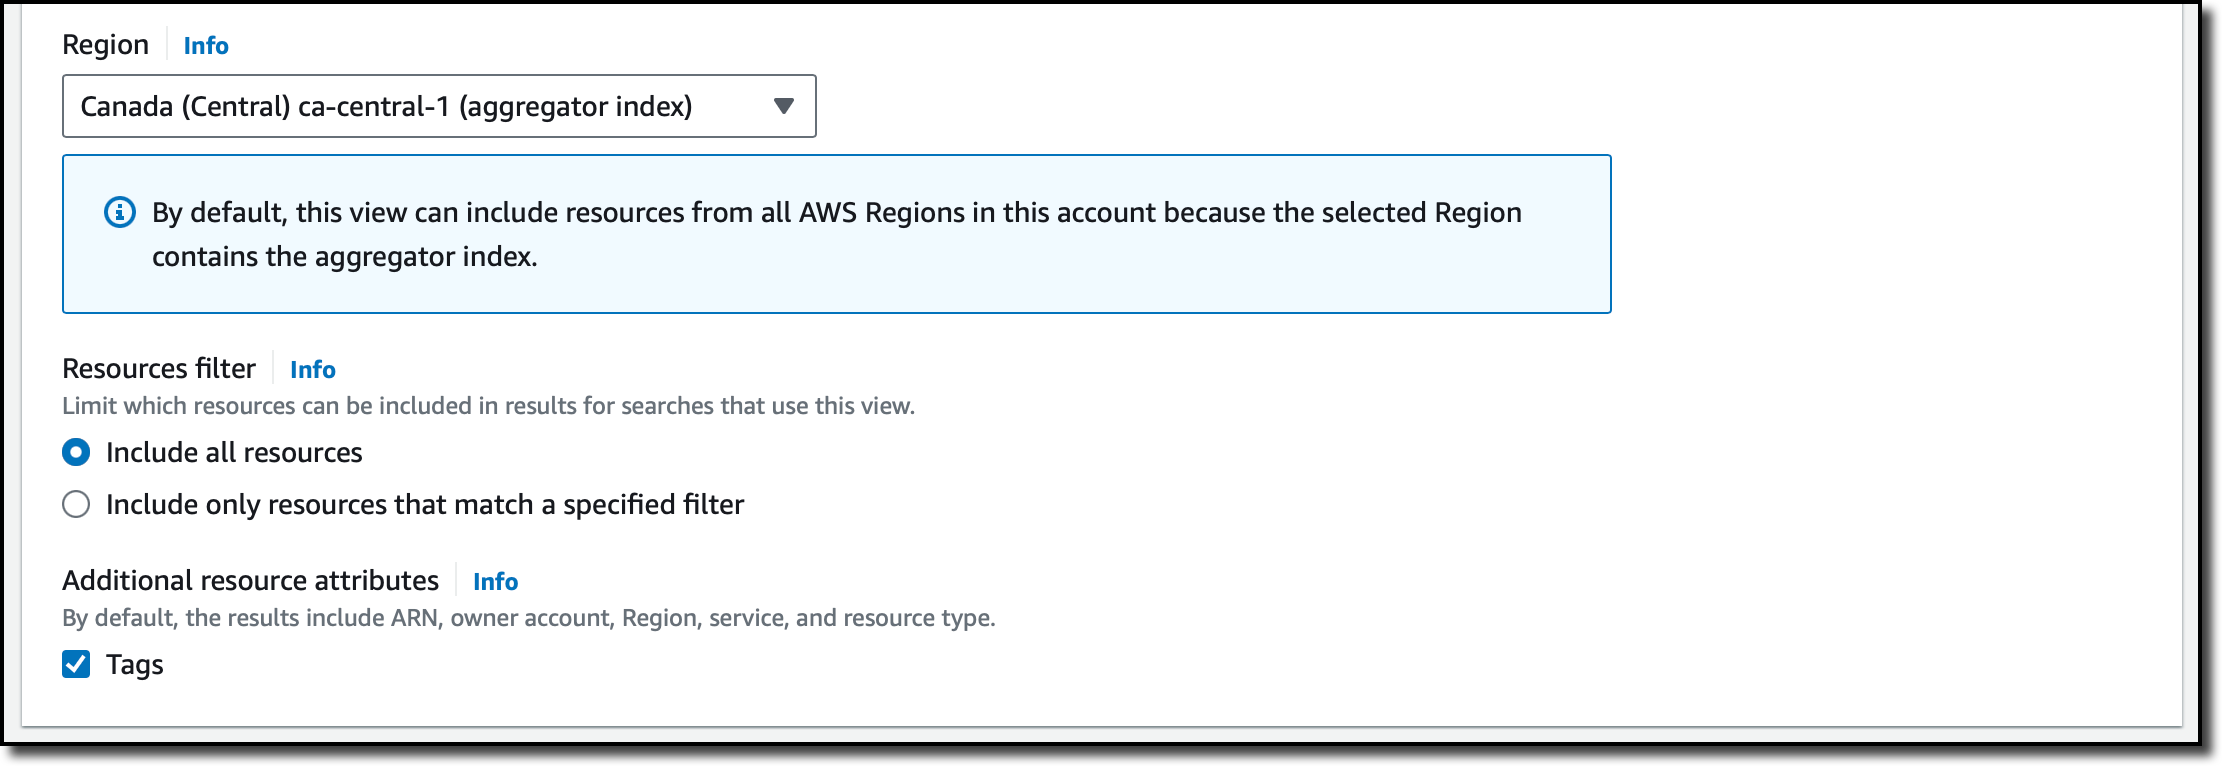
For the Region, I select the one where I have the aggregator index. The aggregator index contains a replicated copy of the local index in every other Region where Resource Explorer has been turned on. Optionally, I can use a filter to limit which resources should be included in this view. I choose to include all resources and additional resource attributes such as tags.

Console screenshot.

Then, I complete the creation of the view. Now, by granting access to the view, I can control who can access what resource information in Resource Explorer.

Using multi-account search
To try the new multi-account view, I choose Resource search from the Explore resources section of the navigation pane. In my query, I want to see if there are Amazon ElastiCache resources for an old version of Redis. I type elasticache:* redis3.2 in the Query field.

Console screenshot.

In the results, I see the different AWS accounts and Regions where these resources are based. For resources in my account, there is a link in the first column that opens that resource in the console. For resources in other accounts, I can use the console with the appropriate account and service to get more information or take action.

Things to know
Multi-account search is available in the following AWS Regions: [[ Regions ]].

There is no additional charge for using AWS Resource Explorer, including for multi-account searches.

To share views with other accounts in an organization, we suggest you use the delegated admin account to create the view with the necessary visibility in terms of resources, Regions, and accounts within the organization and then use AWS Resource Access Manager to share access to the view. For example, you can create a view for a specific OU and then share the view with an account in that OU.

Search for and discover relevant resources across accounts in your organization and across Regions with AWS Resource Explorer.

Danilo

Deploy container applications in a multicloud environment using Amazon CodeCatalyst

Post Syndicated from Pawan Shrivastava original https://aws.amazon.com/blogs/devops/deploy-container-applications-in-a-multicloud-environment-using-amazon-codecatalyst/

In the previous post of this blog series, we saw how organizations can deploy workloads to virtual machines (VMs) in a hybrid and multicloud environment. This post shows how organizations can address the requirement of deploying containers, and containerized applications to hybrid and multicloud platforms using Amazon CodeCatalyst. CodeCatalyst is an integrated DevOps service which enables development teams to collaborate on code, and build, test, and deploy applications with continuous integration and continuous delivery (CI/CD) tools.

One prominent scenario where multicloud container deployment is useful is when organizations want to leverage AWS’ broadest and deepest set of Artificial Intelligence (AI) and Machine Learning (ML) capabilities by developing and training AI/ML models in AWS using Amazon SageMaker, and deploying the model package to a Kubernetes platform on other cloud platforms, such as Azure Kubernetes Service (AKS) for inference. As shown in this workshop for operationalizing the machine learning pipeline, we can train an AI/ML model, push it to Amazon Elastic Container Registry (ECR) as an image, and later deploy the model as a container application.

Scenario description

The solution described in the post covers the following steps:

  • Setup Amazon CodeCatalyst environment.
  • Create a Dockerfile along with a manifest for the application, and a repository in Amazon ECR.
  • Create an Azure service principal which has permissions to deploy resources to Azure Kubernetes Service (AKS), and store the credentials securely in Amazon CodeCatalyst secret.
  • Create a CodeCatalyst workflow to build, test, and deploy the containerized application to AKS cluster using Github Actions.

The architecture diagram for the scenario is shown in Figure 1.

Solution architecture diagram

Figure 1 – Solution Architecture

Solution Walkthrough

This section shows how to set up the environment, and deploy a HTML application to an AKS cluster.

Setup Amazon ECR and GitHub code repository

Create a new Amazon ECR and a code repository. In this case we’re using GitHub as the repository but you can create a source repository in CodeCatalyst or you can choose to link an existing source repository hosted by another service if that service is supported by an installed extension. Then follow the application and Docker image creation steps outlined in Step 1 in the environment creation process in exposing Multiple Applications on Amazon EKS. Create a file named manifest.yaml as shown, and map the “image” parameter to the URL of the Amazon ECR repository created above.

apiVersion: apps/v1
kind: Deployment
metadata:
  name: multicloud-container-deployment-app
  labels:
    app: multicloud-container-deployment-app
spec:
  selector:
    matchLabels:
      app: multicloud-container-deployment-app
  replicas: 2
  template:
    metadata:
      labels:
        app: multicloud-container-deployment-app
    spec:
      nodeSelector:
        "beta.kubernetes.io/os": linux
      containers:
      - name: ecs-web-page-container
        image: <aws_account_id>.dkr.ecr.us-west-2.amazonaws.com/<my_repository>
        imagePullPolicy: Always
        ports:
            - containerPort: 80
        resources:
          limits:
            memory: "100Mi"
            cpu: "200m"
      imagePullSecrets:
          - name: ecrsecret
---
apiVersion: v1
kind: Service
metadata:
  name: multicloud-container-deployment-service
spec:
  type: LoadBalancer
  ports:
  - port: 80
    targetPort: 80
  selector:
    app: multicloud-container-deployment-app

Push the files to Github code repository. The multicloud-container-app github repository should look similar to Figure 2 below

Files in multicloud container app github repository 

Figure 2 – Files in Github repository

Configure Azure Kubernetes Service (AKS) cluster to pull private images from ECR repository

Pull the docker images from a private ECR repository to your AKS cluster by running the following command. This setup is required during the azure/k8s-deploy Github Actions in the CI/CD workflow. Authenticate Docker to an Amazon ECR registry with get-login-password by using aws ecr get-login-password. Run the following command in a shell where AWS CLI is configured, and is used to connect to the AKS cluster. This creates a secret called ecrsecret, which is used to pull an image from the private ECR repository.

kubectl create secret docker-registry ecrsecret\
 --docker-server=<aws_account_id>.dkr.ecr.us-west-2.amazonaws.com/<my_repository>\
 --docker-username=AWS\
 --docker-password= $(aws ecr get-login-password --region us-west-2)

Provide ECR URI in the variable “–docker-server =”.

CodeCatalyst setup

Follow these steps to set up CodeCatalyst environment:

Configure access to the AKS cluster

In this solution, we use three GitHub Actions – azure/login, azure/aks-set-context and azure/k8s-deploy – to login, set the AKS cluster, and deploy the manifest file to the AKS cluster respectively. For the Github Actions to access the Azure environment, they require credentials associated with an Azure Service Principal.

Service Principals in Azure are identified by the CLIENT_ID, CLIENT_SECRET, SUBSCRIPTION_ID, and TENANT_ID properties. Create the Service principal by running the following command in the azure cloud shell:

az ad sp create-for-rbac \
    --name "ghActionHTMLapplication" \
    --scope /subscriptions/<SUBSCRIPTION_ID>/resourceGroups/<RESOURCE_GROUP> \
    --role Contributor \
    --sdk-auth

The command generates a JSON output (shown in Figure 3), which is stored in CodeCatalyst secret called AZURE_CREDENTIALS. This credential is used by azure/login Github Actions.

JSON output stored in AZURE-CREDENTIALS secret

Figure 3 – JSON output

Configure secrets inside CodeCatalyst Project

Create three secrets CLUSTER_NAME (Name of AKS cluster), RESOURCE_GROUP(Name of Azure resource group) and AZURE_CREDENTIALS(described in the previous step) as described in the working with secret document. The secrets are shown in Figure 4.

Secrets in CodeCatalyst

Figure 4 – CodeCatalyst Secrets

CodeCatalyst CI/CD Workflow

To create a new CodeCatalyst workflow, select CI/CD from the navigation on the left and select Workflows (1). Then, select Create workflow (2), leave the default options, and select Create (3) as shown in Figure 5.

Create CodeCatalyst CI/CD workflow

Figure 5 – Create CodeCatalyst CI/CD workflow

Add “Push to Amazon ECR” Action

Add the Push to Amazon ECR action, and configure the environment where you created the ECR repository as shown in Figure 6. Refer to adding an action to learn how to add CodeCatalyst action.

Create ‘Push to ECR’ CodeCatalyst Action

Figure 6 – Create ‘Push to ECR’ Action

Select the Configuration tab and specify the configurations as shown in Figure7.

Configure ‘Push to ECR’ CodeCatalyst Action

Figure 7 – Configure ‘Push to ECR’ Action

Configure the Deploy action

1. Add a GitHub action for deploying to AKS as shown in Figure 8.

Github action to deploy to AKS

Figure 8 – Github action to deploy to AKS

2. Configure the GitHub action from the configurations tab by adding the following snippet to the GitHub Actions YAML property:

- name: Install Azure CLI
  run: pip install azure-cli
- name: Azure login
  id: login
  uses: azure/[email protected]
  with:
    creds: ${Secrets.AZURE_CREDENTIALS}
- name: Set AKS context
  id: set-context
  uses: azure/aks-set-context@v3
  with:
    resource-group: ${Secrets.RESOURCE_GROUP}
    cluster-name: ${Secrets.CLUSTER_NAME}
- name: Setup kubectl
  id: install-kubectl
  uses: azure/setup-kubectl@v3
- name: Deploy to AKS
  id: deploy-aks
  uses: Azure/k8s-deploy@v4
  with:
    namespace: default
    manifests: manifest.yaml
    pull-images: true

Github action configuration for deploying application to AKS

Figure 9 – Github action configuration

3. The workflow is now ready and can be validated by choosing ‘Validate’ and then saved to the repository by choosing ‘Commit’.
We have implemented an automated CI/CD workflow that builds the container image of the application (refer Figure 10), pushes the image to ECR, and deploys the application to AKS cluster. This CI/CD workflow is triggered as application code is pushed to the repository.

Automated CI/CD workflow

Figure 10 – Automated CI/CD workflow

Test the deployment

When the HTML application runs, Kubernetes exposes the application using a public facing load balancer. To find the external IP of the load balancer, connect to the AKS cluster and run the following command:

kubectl get service multicloud-container-deployment-service

The output of the above command should look like the image in Figure 11.

Output of kubectl get service command

Figure 11 – Output of kubectl get service

Paste the External IP into a browser to see the running HTML application as shown in Figure 12.

HTML application running successfully in AKS

Figure 12 – Application running in AKS

Cleanup

If you have been following along with the workflow described in the post, you should delete the resources you deployed so you do not continue to incur charges. First, delete the Amazon ECR repository using the AWS console. Second, delete the project from CodeCatalyst by navigating to Project settings and choosing Delete project. There’s no cost associated with the CodeCatalyst project and you can continue using it. Finally, if you deployed the application on a new AKS cluster, delete the cluster from the Azure console. In case you deployed the application to an existing AKS cluster, run the following commands to delete the application resources.

kubectl delete deployment multicloud-container-deployment-app
kubectl delete services multicloud-container-deployment-service

Conclusion

In summary, this post showed how Amazon CodeCatalyst can help organizations deploy containerized workloads in a hybrid and multicloud environment. It demonstrated in detail how to set up and configure Amazon CodeCatalyst to deploy a containerized application to Azure Kubernetes Service, leveraging a CodeCatalyst workflow, and GitHub Actions. Learn more and get started with your Amazon CodeCatalyst journey!

If you have any questions or feedback, leave them in the comments section.

About Authors

Picture of Pawan

Pawan Shrivastava

Pawan Shrivastava is a Partner Solution Architect at AWS in the WWPS team. He focusses on working with partners to provide technical guidance on AWS, collaborate with them to understand their technical requirements, and designing solutions to meet their specific needs. Pawan is passionate about DevOps, automation and CI CD pipelines. He enjoys watching MMA, playing cricket and working out in the gym.

Picture of Brent

Brent Van Wynsberge

Brent Van Wynsberge is a Solutions Architect at AWS supporting enterprise customers. He accelerates the cloud adoption journey for organizations by aligning technical objectives to business outcomes and strategic goals, and defining them where needed. Brent is an IoT enthusiast, specifically in the application of IoT in manufacturing, he is also interested in DevOps, data analytics and containers.

Picture of Amandeep

Amandeep Bajwa

Amandeep Bajwa is a Senior Solutions Architect at AWS supporting Financial Services enterprises. He helps organizations achieve their business outcomes by identifying the appropriate cloud transformation strategy based on industry trends, and organizational priorities. Some of the areas Amandeep consults on are cloud migration, cloud strategy (including hybrid & multicloud), digital transformation, data & analytics, and technology in general.

Picture of Brian

Brian Beach

Brian Beach has over 20 years of experience as a Developer and Architect. He is currently a Principal Solutions Architect at Amazon Web Services. He holds a Computer Engineering degree from NYU Poly and an MBA from Rutgers Business School. He is the author of “Pro PowerShell for Amazon Web Services” from Apress. He is a regular author and has spoken at numerous events. Brian lives in North Carolina with his wife and three kids.

Let’s Architect! Getting started with containers

Post Syndicated from Luca Mezzalira original https://aws.amazon.com/blogs/architecture/lets-architect-getting-started-with-containers/

Most of AWS customers building cloud-native applications or modernizing applications choose containers to run their microservices applications to accelerate innovation and time to market while lowering their total cost of ownership (TCO). Using containers in AWS comes with other benefits, such as increased portability, scalability, and flexibility.

The combination of containers technologies and AWS services also provides features such as load balancing, auto scaling, and service discovery, making it easier to deploy and manage applications at scale.

In this edition of Let’s Architect! we share useful resources to help you to get started with containers on AWS.

Container Build Lens

This whitepaper describes the Container Build Lens for the AWS Well-Architected Framework. It helps customers review and improve their cloud-based architectures and better understand the business impact of their design decisions. The document describes general design principles for containers, as well as specific best practices and implementation guidance using the Six Pillars of the Well-Architected Framework.

Take me to explore the Containers Build Lens!

Follow Containers Build Lens Best practices to architect your containers-based workloads

Follow Containers Build Lens Best practices to architect your containers-based workloads.

EKS Workshop

The EKS Workshop is a useful resource to familiarize yourself with Amazon Elastic Kubernetes Service (Amazon EKS) by practicing on real use-cases. It is built to help users learn about Amazon EKS features and integrations with popular open-source projects. The workshop is abstracted into high-level learning modules, including Networking, Security, DevOps Automation, and more. These are further broken down into standalone labs focusing on a particular feature, tool, or use case.

Once you’re done experimenting with EKS Workshop, start building your environments with Amazon EKS Blueprints, a collection of Infrastructure as Code (IaC) modules that helps you configure and deploy consistent, batteries-included Amazon EKS clusters across accounts and regions following AWS best practices. Amazon EKS Blueprints are available in both Terraform and CDK.

Take me to this workshop!

The workshop is abstracted into high-level learning modules, including Networking, Security, DevOps Automation, and more.

The workshop is abstracted into high-level learning modules, including Networking, Security, DevOps Automation, and more.

Architecting for resiliency on AWS App Runner

Learn how to architect an highly available and resilient application using AWS App Runner. With App Runner, you can start with just the source code of your application or a container image. The complexity of running containerized applications is abstracted away, including the cloud resources needed for running your web application or API. App Runner manages load balancers, TLS certificates, auto scaling, logs, metrics, teachability and more, so you can focus on implementing your business logic in a highly scalable and elastic environment.

Take me to this blog post!

A high-level architecture for an available and resilient application with AWS App Runner.

A high-level architecture for an available and resilient application with AWS App Runner

Securing Kubernetes: How to address Kubernetes attack vectors

As part of designing any modern system on AWS, it is necessary to think about the security implications and what can affect your security posture. This session introduces the fundamentals of the Kubernetes architecture and common attack vectors. It also includes security controls provided by Amazon EKS and suggestions on how to address them. With these strategies, you can learn how to reduce risk for your Kubernetes-based workloads.

Take me to this video!

Some common attack vectors that need addressing with Kubernetes

Some common attack vectors that need addressing with Kubernetes

See you next time!

Thanks for exploring architecture tools and resources with us!

Next time we’ll talk about serverless.

To find all the posts from this series, check out the Let’s Architect! page of the AWS Architecture Blog.

Optimizing GPU utilization for AI/ML workloads on Amazon EC2

Post Syndicated from Sheila Busser original https://aws.amazon.com/blogs/compute/optimizing-gpu-utilization-for-ai-ml-workloads-on-amazon-ec2/

­­­­This blog post is written by Ben Minahan, DevOps Consultant, and Amir Sotoodeh, Machine Learning Engineer.

Machine learning workloads can be costly, and artificial intelligence/machine learning (AI/ML) teams can have a difficult time tracking and maintaining efficient resource utilization. ML workloads often utilize GPUs extensively, so typical application performance metrics such as CPU, memory, and disk usage don’t paint the full picture when it comes to system performance. Additionally, data scientists conduct long-running experiments and model training activities on existing compute instances that fit their unique specifications. Forcing these experiments to be run on newly provisioned infrastructure with proper monitoring systems installed might not be a viable option.

In this post, we describe how to track GPU utilization across all of your AI/ML workloads and enable accurate capacity planning without needing teams to use a custom Amazon Machine Image (AMI) or to re-deploy their existing infrastructure. You can use Amazon CloudWatch to track GPU utilization, and leverage AWS Systems Manager Run Command to install and configure the agent across your existing fleet of GPU-enabled instances.

Overview

First, make sure that your existing Amazon Elastic Compute Cloud (Amazon EC2) instances have the Systems Manager Agent installed, and also have the appropriate level of AWS Identity and Access Management (IAM) permissions to run the Amazon CloudWatch Agent. Next, specify the configuration for the CloudWatch Agent in Systems Manager Parameter Store, and then deploy the CloudWatch Agent to our GPU-enabled EC2 instances. Finally, create a CloudWatch Dashboard to analyze GPU utilization.

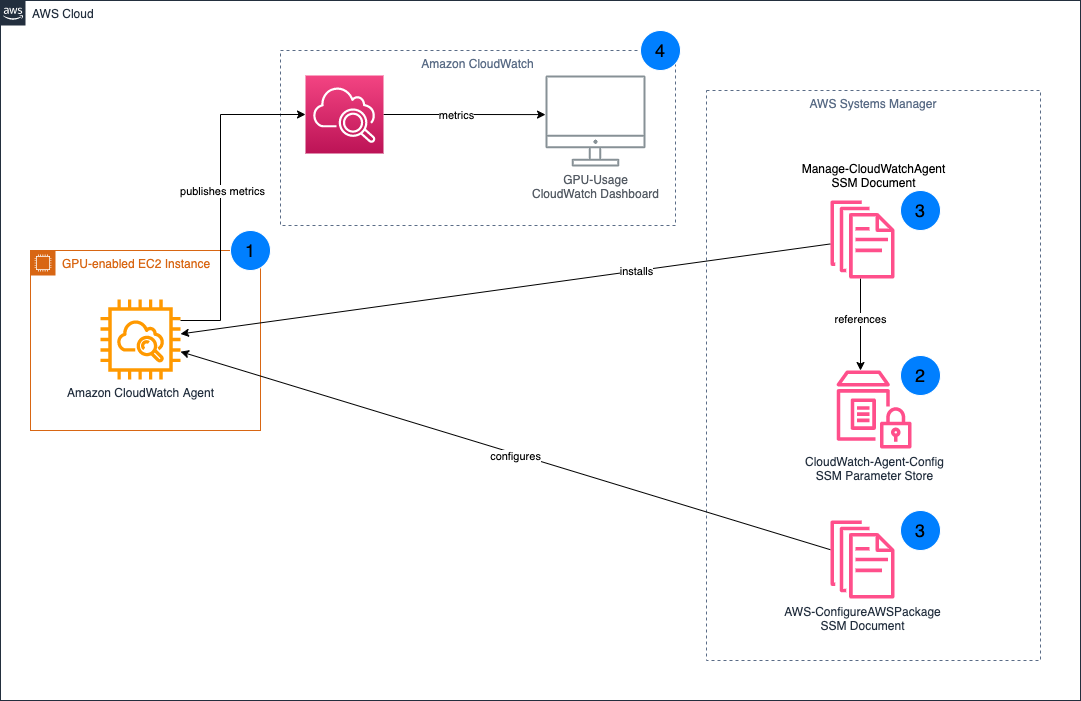
Architecture Diagram depicting the integration between AWS Systems Manager with RunCommand Arguments stored in SSM Parameter Store, your Amazon GPU enabled EC2 instance with installed Amazon CloudWatch Agen­t, and Amazon CloudWatch Dashboard that aggregates and displays the ­reported metrics.

  1. Install the CloudWatch Agent on your existing GPU-enabled EC2 instances.
  2. Your CloudWatch Agent configuration is stored in Systems Manager Parameter Store.
  3. Systems Manager Documents are used to install and configure the CloudWatch Agent on your EC2 instances.
  4. GPU metrics are published to CloudWatch, which you can then visualize through the CloudWatch Dashboard.

Prerequisites

This post assumes you already have GPU-enabled EC2 workloads running in your AWS account. If the EC2 instance doesn’t have any GPUs, then the custom configuration won’t be applied to the CloudWatch Agent. Instead, the default configuration is used. For those instances, leveraging the CloudWatch Agent’s default configuration is better suited for tracking resource utilization.

For the CloudWatch Agent to collect your instance’s GPU metrics, the proper NVIDIA drivers must be installed on your instance. Several AWS official AMIs including the Deep Learning AMI already have these drivers installed. To see a list of AMIs with the NVIDIA drivers pre-installed, and for full installation instructions for Linux-based instances, see Install NVIDIA drivers on Linux instances.

Additionally, deploying and managing the CloudWatch Agent requires the instances to be running. If your instances are currently stopped, then you must start them to follow the instructions outlined in this post.

Preparing your EC2 instances

You utilize Systems Manager to deploy the CloudWatch Agent, so make sure that your EC2 instances have the Systems Manager Agent installed. Many AWS-provided AMIs already have the Systems Manager Agent installed. For a full list of the AMIs which have the Systems Manager Agent pre-installed, see Amazon Machine Images (AMIs) with SSM Agent preinstalled. If your AMI doesn’t have the Systems Manager Agent installed, see Working with SSM Agent for instructions on installing based on your operating system (OS).

Once installed, the CloudWatch Agent needs certain permissions to accept commands from Systems Manager, read Systems Manager Parameter Store entries, and publish metrics to CloudWatch. These permissions are bundled into the managed IAM policies AmazonEC2RoleforSSM, AmazonSSMReadOnlyAccess, and CloudWatchAgentServerPolicy. To create a new IAM role and associated IAM instance profile with these policies attached, you can run the following AWS Command Line Interface (AWS CLI) commands, replacing <REGION_NAME> with your AWS region, and <INSTANCE_ID> with the EC2 Instance ID that you want to associate with the instance profile:

aws iam create-role --role-name CloudWatch-Agent-Role --assume-role-policy-document  '{"Statement":{"Effect":"Allow","Principal":{"Service":"ec2.amazonaws.com"},"Action":"sts:AssumeRole"}}'
aws iam attach-role-policy --role-name CloudWatch-Agent-Role --policy-arn arn:aws:iam::aws:policy/service-role/AmazonEC2RoleforSSM
aws iam attach-role-policy --role-name CloudWatch-Agent-Role --policy-arn arn:aws:iam::aws:policy/AmazonSSMReadOnlyAccess
aws iam attach-role-policy --role-name CloudWatch-Agent-Role --policy-arn arn:aws:iam::aws:policy/CloudWatchAgentServerPolicy
aws iam create-instance-profile --instance-profile-name CloudWatch-Agent-Instance-Profile
aws iam add-role-to-instance-profile --instance-profile-name CloudWatch-Agent-Instance-Profile --role-name CloudWatch-Agent-Role
aws ec2 associate-iam-instance-profile --region <REGION_NAME> --instance-id <INSTANCE_ID> --iam-instance-profile Name=CloudWatch-Agent-Instance-Profile

Alternatively, you can attach the IAM policies to your existing IAM role associated with an existing IAM instance profile.

aws iam attach-role-policy --role-name <ROLE_NAME> --policy-arn arn:aws:iam::aws:policy/service-role/AmazonEC2RoleforSSM
aws iam attach-role-policy --role-name <ROLE_NAME> --policy-arn arn:aws:iam::aws:policy/AmazonSSMReadOnlyAccess
aws iam attach-role-policy --role-name <ROLE_NAME> --policy-arn arn:aws:iam::aws:policy/CloudWatchAgentServerPolicy
aws ec2 associate-iam-instance-profile --region <REGION_NAME> --instance-id <INSTANCE_ID> --iam-instance-profile Name=<INSTANCE_PROFILE>

Once complete, you should see that your EC2 instance is associated with the appropriate IAM role.

An Amazon EC2 Instance with the CloudWatch-Agent-Role IAM Role attached

This role should have the AmazonEC2RoleforSSM, AmazonSSMReadOnlyAccess and CloudWatchAgentServerPolicy IAM policies attached.

The CloudWatch-Agent-Role IAM Role’s attached permission policies, Amazon EC2 Role for SSM, CloudWatch Agent Server ¬Policy, and Amazon SSM Read Only Access

Configuring and deploying the CloudWatch Agent

Before deploying the CloudWatch Agent onto our EC2 instances, make sure that those agents are properly configured to collect GPU metrics. To do this, you must create a CloudWatch Agent configuration and store it in Systems Manager Parameter Store.

Copy the following into a file cloudwatch-agent-config.json:

{
    "agent": {
        "metrics_collection_interval": 60,
        "run_as_user": "cwagent"
    },
    "metrics": {
        "aggregation_dimensions": [
            [
                "InstanceId"
            ]
        ],
        "append_dimensions": {
            "AutoScalingGroupName": "${aws:AutoScalingGroupName}",
            "ImageId": "${aws:ImageId}",
            "InstanceId": "${aws:InstanceId}",
            "InstanceType": "${aws:InstanceType}"
        },
        "metrics_collected": {
            "cpu": {
                "measurement": [
                    "cpu_usage_idle",
                    "cpu_usage_iowait",
                    "cpu_usage_user",
                    "cpu_usage_system"
                ],
                "metrics_collection_interval": 60,
                "resources": [
                    "*"
                ],
                "totalcpu": false
            },
            "disk": {
                "measurement": [
                    "used_percent",
                    "inodes_free"
                ],
                "metrics_collection_interval": 60,
                "resources": [
                    "*"
                ]
            },
            "diskio": {
                "measurement": [
                    "io_time"
                ],
                "metrics_collection_interval": 60,
                "resources": [
                    "*"
                ]
            },
            "mem": {
                "measurement": [
                    "mem_used_percent"
                ],
                "metrics_collection_interval": 60
            },
            "swap": {
                "measurement": [
                    "swap_used_percent"
                ],
                "metrics_collection_interval": 60
            },
            "nvidia_gpu": {
                "measurement": [
                    "utilization_gpu",
                    "temperature_gpu",
                    "utilization_memory",
                    "fan_speed",
                    "memory_total",
                    "memory_used",
                    "memory_free",
                    "pcie_link_gen_current",
                    "pcie_link_width_current",
                    "encoder_stats_session_count",
                    "encoder_stats_average_fps",
                    "encoder_stats_average_latency",
                    "clocks_current_graphics",
                    "clocks_current_sm",
                    "clocks_current_memory",
                    "clocks_current_video"
                ],
                "metrics_collection_interval": 60
            }
        }
    }
}

Run the following AWS CLI command to deploy a Systems Manager Parameter CloudWatch-Agent-Config, which contains a minimal agent configuration for GPU metrics collection. Replace <REGION_NAME> with your AWS Region.

aws ssm put-parameter \
--region <REGION_NAME> \
--name CloudWatch-Agent-Config \
--type String \
--value file://cloudwatch-agent-config.json

Now you can see a CloudWatch-Agent-Config parameter in Systems Manager Parameter Store, containing your CloudWatch Agent’s JSON configuration.

CloudWatch-Agent-Config stored in Systems Manager Parameter Store

Next, install the CloudWatch Agent on your EC2 instances. To do this, you can leverage Systems Manager Run Command, specifically the AWS-ConfigureAWSPackage document which automates the CloudWatch Agent installation.

  1. Run the following AWS CLI command, replacing <REGION_NAME> with the Region into which your instances are deployed, and <INSTANCE_ID> with the EC2 Instance ID on which you want to install the CloudWatch Agent.
aws ssm send-command \
--query 'Command.CommandId' \
--region <REGION_NAME> \
--instance-ids <INSTANCE_ID> \
--document-name AWS-ConfigureAWSPackage \
--parameters '{"action":["Install"],"installationType":["In-place update"],"version":["latest"],"name":["AmazonCloudWatchAgent"]}'

2. To monitor the status of your command, use the get-command-invocation AWS CLI command. Replace <COMMAND_ID> with the command ID output from the previous step, <REGION_NAME> with your AWS region, and <INSTANCE_ID> with your EC2 instance ID.

aws ssm get-command-invocation --query Status --region <REGION_NAME> --command-id <COMMAND_ID> --instance-id <INSTANCE_ID>

3.Wait for the command to show the status Success before proceeding.

$ aws ssm send-command \
	 --query 'Command.CommandId' \
    --region us-east-2 \
    --instance-ids i-0123456789abcdef \
    --document-name AWS-ConfigureAWSPackage \
    --parameters '{"action":["Install"],"installationType":["Uninstall and reinstall"],"version":["latest"],"additionalArguments":["{}"],"name":["AmazonCloudWatchAgent"]}'

"5d8419db-9c48-434c-8460-0519640046cf"

$ aws ssm get-command-invocation --query Status --region us-east-2 --command-id 5d8419db-9c48-434c-8460-0519640046cf --instance-id i-0123456789abcdef

"Success"

Repeat this process for all EC2 instances on which you want to install the CloudWatch Agent.

Next, configure the CloudWatch Agent installation. For this, once again leverage Systems Manager Run Command. However, this time the AmazonCloudWatch-ManageAgent document which applies your custom agent configuration is stored in the Systems Manager Parameter Store to your deployed agents.

  1. Run the following AWS CLI command, replacing <REGION_NAME> with the Region into which your instances are deployed, and <INSTANCE_ID> with the EC2 Instance ID on which you want to configure the CloudWatch Agent.
aws ssm send-command \
--query 'Command.CommandId' \
--region <REGION_NAME> \
--instance-ids <INSTANCE_ID> \
--document-name AmazonCloudWatch-ManageAgent \
--parameters '{"action":["configure"],"mode":["ec2"],"optionalConfigurationSource":["ssm"],"optionalConfigurationLocation":["/CloudWatch-Agent-Config"],"optionalRestart":["yes"]}'

2. To monitor the status of your command, utilize the get-command-invocation AWS CLI command. Replace <COMMAND_ID> with the command ID output from the previous step, <REGION_NAME> with your AWS region, and <INSTANCE_ID> with your EC2 instance ID.

aws ssm get-command-invocation --query Status --region <REGION_NAME> --command-id <COMMAND_ID> --instance-id <INSTANCE_ID>

3. Wait for the command to show the status Success before proceeding.

$ aws ssm send-command \
    --query 'Command.CommandId' \
    --region us-east-2 \
    --instance-ids i-0123456789abcdef \
    --document-name AmazonCloudWatch-ManageAgent \
    --parameters '{"action":["configure"],"mode":["ec2"],"optionalConfigurationSource":["ssm"],"optionalConfigurationLocation":["/CloudWatch-Agent-Config"],"optionalRestart":["yes"]}'

"9a4a5c43-0795-4fd3-afed-490873eaca63"

$ aws ssm get-command-invocation --query Status --region us-east-2 --command-id 9a4a5c43-0795-4fd3-afed-490873eaca63 --instance-id i-0123456789abcdef

"Success"

Repeat this process for all EC2 instances on which you want to install the CloudWatch Agent. Once finished, the CloudWatch Agent installation and configuration is complete, and your EC2 instances now report GPU metrics to CloudWatch.

Visualize your instance’s GPU metrics in CloudWatch

Now that your GPU-enabled EC2 Instances are publishing their utilization metrics to CloudWatch, you can visualize and analyze these metrics to better understand your resource utilization patterns.

The GPU metrics collected by the CloudWatch Agent are within the CWAgent namespace. Explore your GPU metrics using the CloudWatch Metrics Explorer, or deploy our provided sample dashboard.

  1. Copy the following into a file, cloudwatch-dashboard.json, replacing instances of <REGION_NAME> with your Region:
{
    "widgets": [
        {
            "height": 10,
            "width": 24,
            "y": 16,
            "x": 0,
            "type": "metric",
            "properties": {
                "metrics": [
                    [{"expression": "SELECT AVG(nvidia_smi_utilization_gpu) FROM SCHEMA(\"CWAgent\", InstanceId) GROUP BY InstanceId","id": "q1"}]
                ],
                "view": "timeSeries",
                "stacked": false,
                "region": "<REGION_NAME>",
                "stat": "Average",
                "period": 300,
                "title": "GPU Core Utilization",
                "yAxis": {
                    "left": {"label": "Percent","max": 100,"min": 0,"showUnits": false}
                }
            }
        },
        {
            "height": 7,
            "width": 8,
            "y": 0,
            "x": 0,
            "type": "metric",
            "properties": {
                "metrics": [
                    [{"expression": "SELECT AVG(nvidia_smi_utilization_gpu) FROM SCHEMA(\"CWAgent\", InstanceId)", "label": "Utilization","id": "q1"}]
                ],
                "view": "gauge",
                "stacked": false,
                "region": "<REGION_NAME>",
                "stat": "Average",
                "period": 300,
                "title": "Average GPU Core Utilization",
                "yAxis": {"left": {"max": 100, "min": 0}
                },
                "liveData": false
            }
        },
        {
            "height": 9,
            "width": 24,
            "y": 7,
            "x": 0,
            "type": "metric",
            "properties": {
                "metrics": [
                    [{ "expression": "SEARCH(' MetricName=\"nvidia_smi_memory_used\" {\"CWAgent\", InstanceId} ', 'Average')", "id": "m1", "visible": false }],
                    [{ "expression": "SEARCH(' MetricName=\"nvidia_smi_memory_total\" {\"CWAgent\", InstanceId} ', 'Average')", "id": "m2", "visible": false }],
                    [{ "expression": "SEARCH(' MetricName=\"mem_used_percent\" {CWAgent, InstanceId} ', 'Average')", "id": "m3", "visible": false }],
                    [{ "expression": "100*AVG(m1)/AVG(m2)", "label": "GPU", "id": "e2", "color": "#17becf" }],
                    [{ "expression": "AVG(m3)", "label": "RAM", "id": "e3" }]
                ],
                "view": "timeSeries",
                "stacked": false,
                "region": "<REGION_NAME>",
                "stat": "Average",
                "period": 300,
                "yAxis": {
                    "left": {"min": 0,"max": 100,"label": "Percent","showUnits": false}
                },
                "title": "Average Memory Utilization"
            }
        },
        {
            "height": 7,
            "width": 8,
            "y": 0,
            "x": 8,
            "type": "metric",
            "properties": {
                "metrics": [
                    [ { "expression": "SEARCH(' MetricName=\"nvidia_smi_memory_used\" {\"CWAgent\", InstanceId} ', 'Average')", "id": "m1", "visible": false } ],
                    [ { "expression": "SEARCH(' MetricName=\"nvidia_smi_memory_total\" {\"CWAgent\", InstanceId} ', 'Average')", "id": "m2", "visible": false } ],
                    [ { "expression": "100*AVG(m1)/AVG(m2)", "label": "Utilization", "id": "e2" } ]
                ],
                "sparkline": true,
                "view": "gauge",
                "region": "<REGION_NAME>",
                "stat": "Average",
                "period": 300,
                "yAxis": {
                    "left": {"min": 0,"max": 100}
                },
                "liveData": false,
                "title": "GPU Memory Utilization"
            }
        }
    ]
}

2. run the following AWS CLI command, replacing <REGION_NAME> with the name of your Region:

aws cloudwatch put-dashboard \
    --region <REGION_NAME> \
    --dashboard-name My-GPU-Usage \
    --dashboard-body file://cloudwatch-dashboard.json

View the My-GPU-Usage CloudWatch dashboard in the CloudWatch console for your AWS region..

An example CloudWatch dashboard, My-GPU-Usage, showing the GPU usage metrics over time.

Cleaning Up

To avoid incurring future costs for resources created by following along in this post, delete the following:

  1. My-GPU-Usage CloudWatch Dashboard
  2. CloudWatch-Agent-Config Systems Manager Parameter
  3. CloudWatch-Agent-Role IAM Role

Conclusion

By following along with this post, you deployed and configured the CloudWatch Agent across your GPU-enabled EC2 instances to track GPU utilization without pausing in-progress experiments and model training. Then, you visualized the GPU utilization of your workloads with a CloudWatch Dashboard to better understand your workload’s GPU usage and make more informed scaling and cost decisions. For other ways that Amazon CloudWatch can improve your organization’s operational insights, see the Amazon CloudWatch documentation.

New – Self-Service Provisioning of Terraform Open-Source Configurations with AWS Service Catalog

Post Syndicated from Danilo Poccia original https://aws.amazon.com/blogs/aws/new-self-service-provisioning-of-terraform-open-source-configurations-with-aws-service-catalog/

With AWS Service Catalog, you can create, govern, and manage a catalog of infrastructure as code (IaC) templates that are approved for use on AWS. These IaC templates can include everything from virtual machine images, servers, software, and databases to complete multi-tier application architectures. You can control which IaC templates and versions are available, what is configured by each version, and who can access each template based on individual, group, department, or cost center. End users such as engineers, database administrators, and data scientists can then quickly discover and self-service provision approved AWS resources that they need to use to perform their daily job functions.

When using Service Catalog, the first step is to create products based on your IaC templates. You can then collect products, together with configuration information, in a portfolio.

Starting today, you can define Service Catalog products and their resources using either AWS CloudFormation or Hashicorp Terraform and choose the tool that better aligns with your processes and expertise. You can now integrate your existing Terraform configurations into Service Catalog to have them part of a centrally approved portfolio of products and share it with the AWS accounts used by your end users. In this way, you can prevent inconsistencies and mitigate the risk of noncompliance.

When resources are deployed by Service Catalog, you can maintain least privilege access during provisioning and govern tagging on the deployed resources. End users of Service Catalog pick and choose what they need from the list of products and versions they have access to. Then, they can provision products in a single action regardless of the technology (CloudFormation or Terraform) used for the deployment.

The Service Catalog hub-and-spoke model that enables organizations to govern at scale can now be extended to include Terraform configurations. With the Service Catalog hub and spoke model, you can centrally manage deployments using a management/user account relationship:

  • One management account – Used to create Service Catalog products, organize them into portfolios, and share portfolios with user accounts
  • Multiple user accounts (up to thousands) – A user account is any AWS account in which the end users of Service Catalog are provisioning resources.

Let’s see how this works in practice.

Creating an AWS Service Catalog Product Using Terraform
To get started, I install the Terraform Reference Engine (provided by AWS on GitHub) that configures the code and infrastructure required for the Terraform open-source engine to work with AWS Service Catalog. I only need to do this once, in the management account for Service Catalog, and the setup takes just minutes. I use the automated installation script:

./deploy-tre.sh -r us-east-1

To keep things simple for this post, I create a product deploying a single EC2 instance using AWS Graviton processors and the Amazon Linux 2023 operating system. Here’s the content of my main.tf file:

terraform {
  required_providers {
    aws = {
      source  = "hashicorp/aws"
      version = "~> 4.16"
    }
  }

  required_version = ">= 1.2.0"
}

provider "aws" {
  region  = "us-east-1"
}

resource "aws_instance" "app_server" {
  ami           = "ami-00c39f71452c08778"
  instance_type = "t4g.large"

  tags = {
    Name = "GravitonServerWithAmazonLinux2023"
  }
}

I sign in to the AWS Management Console in the management account for Service Catalog. In the Service Catalog console, I choose Product list in the Administration section of the navigation pane. There, I choose Create product.

In Product details, I select Terraform open source as Product type. I enter a product name and description and the name of the owner.

Console screenshot.

In the Version details, I choose to Upload a template file (using a tar.gz archive). Optionally, I can specify the template using an S3 URL or an external code repository (on GitHub, GitHub Enterprise Server, or Bitbucket) using an AWS CodeStar provider.

Console screenshot.

I enter support details and custom tags. Note that tags can be used to categorize your resources and also to check permissions to create a resource. Then, I complete the creation of the product.

Adding an AWS Service Catalog Product Using Terraform to a Portfolio
Now that the Terraform product is ready, I add it to my portfolio. A portfolio can include both Terraform and CloudFormation products. I choose Portfolios from the Administrator section of the navigation pane. There, I search for my portfolio by name and open it. I choose Add product to portfolio. I search for the Terraform product by name and select it.

Console screenshot.

Terraform products require a launch constraint. The launch constraint specifies the name of an AWS Identity and Access Management (IAM) role that is used to deploy the product. I need to separately ensure that this role is created in every account with which the product is shared.

The launch role is assumed by the Terraform open-source engine in the management account when an end user launches, updates, or terminates a product. The launch role also contains permissions to describe, create, and update a resource group for the provisioned product and tag the product resources. In this way, Service Catalog keeps the resource group up-to-date and tags the resources associated with the product.

The launch role enables least privilege access for end users. With this feature, end users don’t need permission to directly provision the product’s underlying resources because your Terraform open-source engine assumes the launch role to provision those resources, such as an approved configuration of an Amazon Elastic Compute Cloud (Amazon EC2) instance.

In the Launch constraint section, I choose Enter role name to use a role I created before for this product:

  • The trust relationship of the role defines the entities that can assume the role. For this role, the trust relationship includes Service Catalog and the management account that contains the Terraform Reference Engine.
  • For permissions, the role allows to provision, update, and terminate the resources required by my product and to manage resource groups and tags on those resources.

Console screenshot.

I complete the addition of the product to my portfolio. Now the product is available to the end users who have access to this portfolio.

Launching an AWS Service Catalog Product Using Terraform
End users see the list of products and versions they have access to and can deploy them in a single action. If you already use Service Catalog, the experience is the same as with CloudFormation products.

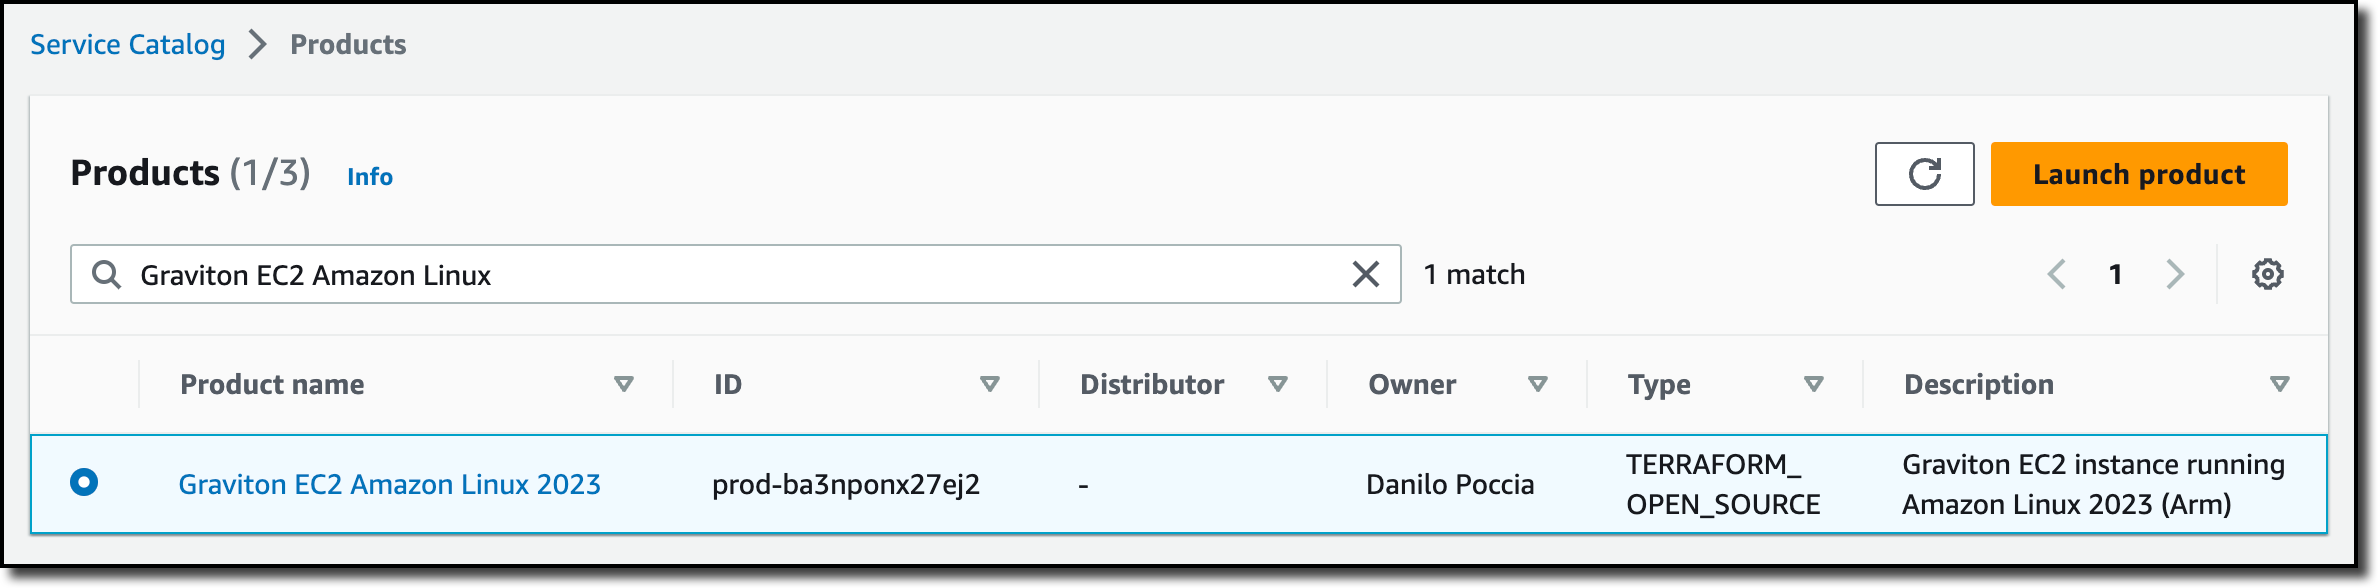
I sign in to the AWS Console in the user account for Service Catalog. The portfolio I used before has been shared by the management account with this user account. In the Service Catalog console, I choose Products from the Provisioning group in the navigation pane. I search for the product by name and choose Launch product.

Console screenshot.

I let Service Catalog generate a unique name for the provisioned product and select the product version to deploy. Then, I launch the product.

Console screenshot.

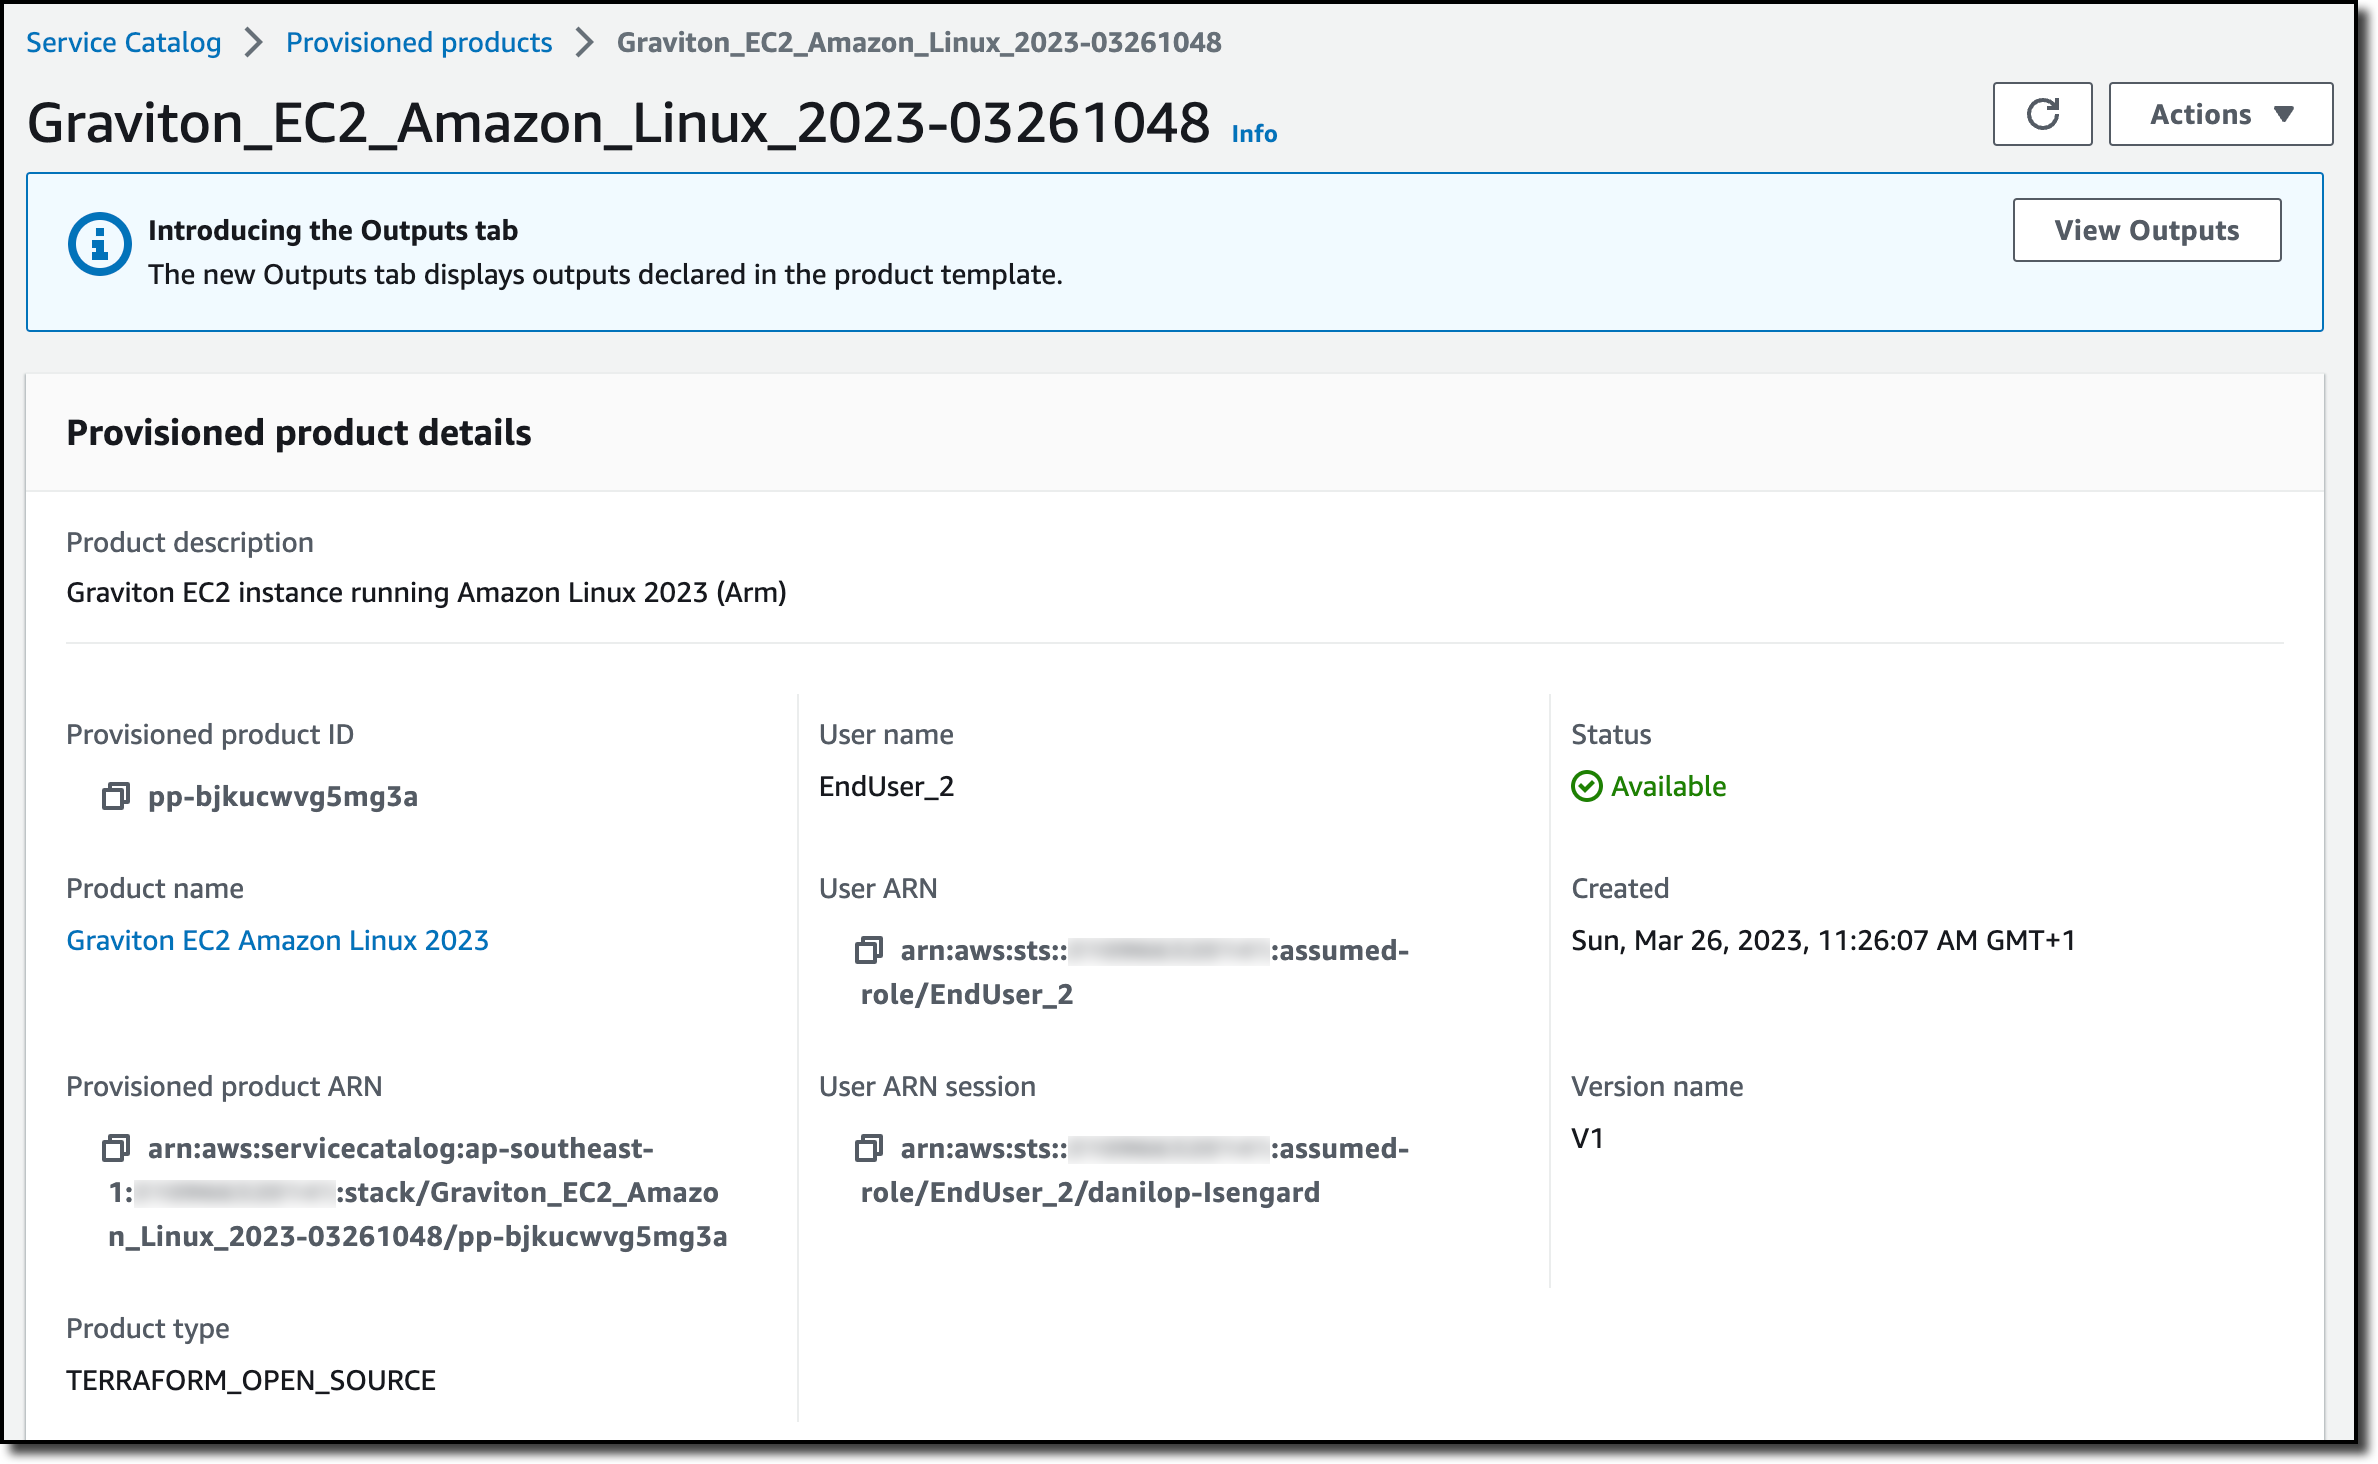
After a few minutes, the product has been deployed and is available. The deployment has been managed by the Terraform Reference Engine.

Console screenshot.

In the Associated tags tab, I see that Service Catalog automatically added information on the portfolio and the product.

Console screenshot.

In the Resources tab, I see the resources created by the provisioned product. As expected, it’s an EC2 instance, and I can follow the link to open the Amazon EC2 console and get more information.

Console screenshot.

End users such as engineers, database administrators, and data scientists can continue to use Service Catalog and launch the products they need without having to consider if they are provisioned using Terraform or CloudFormation.

Availability and Pricing
AWS Service Catalog support for Terraform open-source configurations is available today in all AWS Regions where it is offered. There is no change in pricing when using Terraform. With Service Catalog, you pay for the API calls you make to the service, and you can start for free with the free tier. You also pay for the resources used and created by the Terraform Reference Engine. For more information, see Service Catalog Pricing.

Enable self-service provisioning at scale for your Terraform open-source configurations.

Danilo

AWS Week in Review – March 20, 2023

Post Syndicated from Danilo Poccia original https://aws.amazon.com/blogs/aws/aws-week-in-review-march-20-2023/

This post is part of our Week in Review series. Check back each week for a quick roundup of interesting news and announcements from AWS!

A new week starts, and Spring is almost here! If you’re curious about AWS news from the previous seven days, I got you covered.

Last Week’s Launches
Here are the launches that got my attention last week:

Picture of an S3 bucket and AWS CEO Adam Selipsky.Amazon S3 – Last week there was AWS Pi Day 2023 celebrating 17 years of innovation since Amazon S3 was introduced on March 14, 2006. For the occasion, the team released many new capabilities:

Amazon Linux 2023 – Our new Linux-based operating system is now generally available. Sébastien’s post is full of tips and info.

Application Auto Scaling – Now can use arithmetic operations and mathematical functions to customize the metrics used with Target Tracking policies. You can use it to scale based on your own application-specific metrics. Read how it works with Amazon ECS services.

AWS Data Exchange for Amazon S3 is now generally available – You can now share and find data files directly from S3 buckets, without the need to create or manage copies of the data.

Amazon Neptune – Now offers a graph summary API to help understand important metadata about property graphs (PG) and resource description framework (RDF) graphs. Neptune added support for Slow Query Logs to help identify queries that need performance tuning.

Amazon OpenSearch Service – The team introduced security analytics that provides new threat monitoring, detection, and alerting features. The service now supports OpenSearch version 2.5 that adds several new features such as support for Point in Time Search and improvements to observability and geospatial functionality.

AWS Lake Formation and Apache Hive on Amazon EMR – Introduced fine-grained access controls that allow data administrators to define and enforce fine-grained table and column level security for customers accessing data via Apache Hive running on Amazon EMR.

Amazon EC2 M1 Mac Instances – You can now update guest environments to a specific or the latest macOS version without having to tear down and recreate the existing macOS environments.

AWS Chatbot – Now Integrates With Microsoft Teams to simplify the way you troubleshoot and operate your AWS resources.

Amazon GuardDuty RDS Protection for Amazon Aurora – Now generally available to help profile and monitor access activity to Aurora databases in your AWS account without impacting database performance

AWS Database Migration Service – Now supports validation to ensure that data is migrated accurately to S3 and can now generate an AWS Glue Data Catalog when migrating to S3.

AWS Backup – You can now back up and restore virtual machines running on VMware vSphere 8 and with multiple vNICs.

Amazon Kendra – There are new connectors to index documents and search for information across these new content: Confluence Server, Confluence Cloud, Microsoft SharePoint OnPrem, Microsoft SharePoint Cloud. This post shows how to use the Amazon Kendra connector for Microsoft Teams.

For a full list of AWS announcements, be sure to keep an eye on the What’s New at AWS page.

Other AWS News
A few more blog posts you might have missed:

Example of a geospatial query.Women founders Q&A – We’re talking to six women founders and leaders about how they’re making impacts in their communities, industries, and beyond.

What you missed at that 2023 IMAGINE: Nonprofit conference – Where hundreds of nonprofit leaders, technologists, and innovators gathered to learn and share how AWS can drive a positive impact for people and the planet.

Monitoring load balancers using Amazon CloudWatch anomaly detection alarms – The metrics emitted by load balancers provide crucial and unique insight into service health, service performance, and end-to-end network performance.

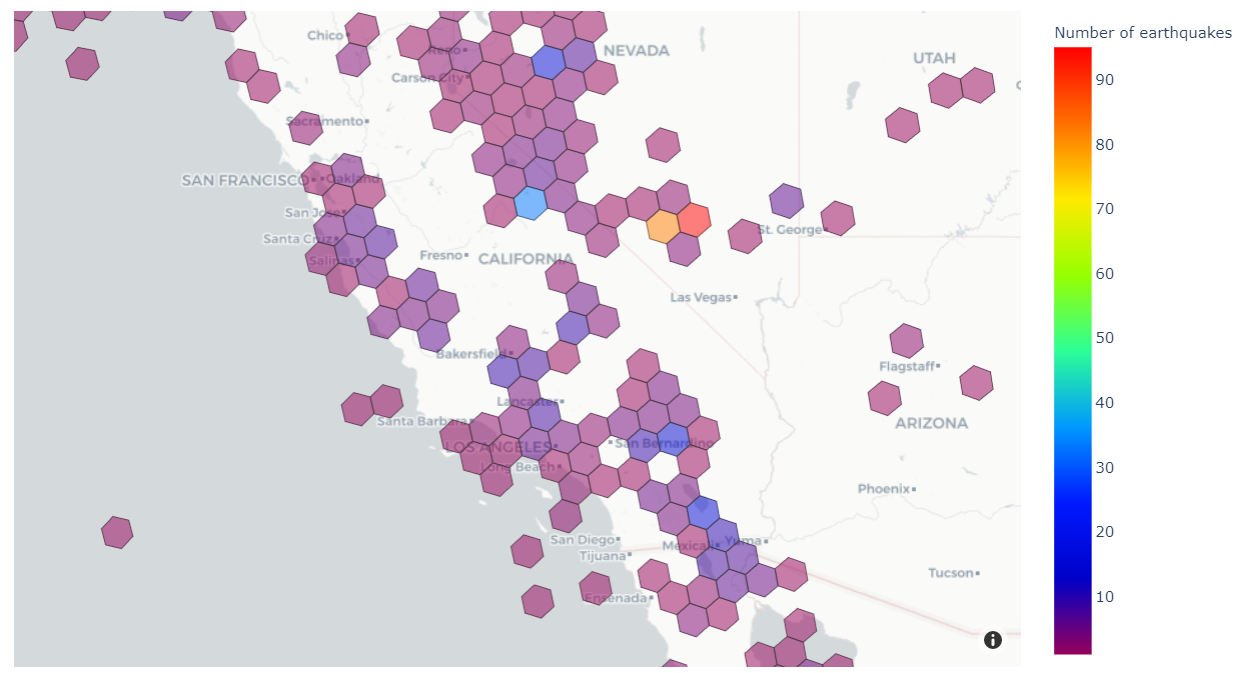
Extend geospatial queries in Amazon Athena with user-defined functions (UDFs) and AWS Lambda – Using a solution based on Uber’s Hexagonal Hierarchical Spatial Index (H3) to divide the globe into equally-sized hexagons.

How cities can use transport data to reduce pollution and increase safety – A guest post by Rikesh Shah, outgoing head of open innovation at Transport for London.

For AWS open-source news and updates, here’s the latest newsletter curated by Ricardo to bring you the most recent updates on open-source projects, posts, events, and more.

Upcoming AWS Events
Here are some opportunities to meet:

AWS Public Sector Day 2023 (March 21, London, UK) – An event dedicated to helping public sector organizations use technology to achieve more with less through the current challenging conditions.

Women in Tech at Skills Center Arlington (March 23, VA, USA) – Let’s celebrate the history and legacy of women in tech.

The AWS Summits season is warming up! You can sign up here to know when registration opens in your area.

That’s all from me for this week. Come back next Monday for another Week in Review!

Danilo

Architecting for data residency with AWS Outposts rack and landing zone guardrails

Post Syndicated from Sheila Busser original https://aws.amazon.com/blogs/compute/architecting-for-data-residency-with-aws-outposts-rack-and-landing-zone-guardrails/

This blog post was written by Abeer Naffa’, Sr. Solutions Architect, Solutions Builder AWS, David Filiatrault, Principal Security Consultant, AWS and Jared Thompson, Hybrid Edge SA Specialist, AWS.

In this post, we will explore how organizations can use AWS Control Tower landing zone and AWS Organizations custom guardrails to enable compliance with data residency requirements on AWS Outposts rack. We will discuss how custom guardrails can be leveraged to limit the ability to store, process, and access data and remain isolated in specific geographic locations, how they can be used to enforce security and compliance controls, as well as, which prerequisites organizations should consider before implementing these guardrails.

Data residency is a critical consideration for organizations that collect and store sensitive information, such as Personal Identifiable Information (PII), financial, and healthcare data. With the rise of cloud computing and the global nature of the internet, it can be challenging for organizations to make sure that their data is being stored and processed in compliance with local laws and regulations.

One potential solution for addressing data residency challenges with AWS is to use Outposts rack, which allows organizations to run AWS infrastructure on premises and in their own data centers. This lets organizations store and process data in a location of their choosing. An Outpost is seamlessly connected to an AWS Region where it has access to the full suite of AWS services managed from a single plane of glass, the AWS Management Console or the AWS Command Line Interface (AWS CLI).  Outposts rack can be configured to utilize landing zone to further adhere to data residency requirements.

The landing zones are a set of tools and best practices that help organizations establish a secure and compliant multi-account structure within a cloud provider. A landing zone can also include Organizations to set policies – guardrails – at the root level, known as Service Control Policies (SCPs) across all member accounts. This can be configured to enforce certain data residency requirements.

When leveraging Outposts rack to meet data residency requirements, it is crucial to have control over the in-scope data movement from the Outposts. This can be accomplished by implementing landing zone best practices and the suggested guardrails. The main focus of this blog post is on the custom policies that restrict data snapshots, prohibit data creation within the Region, and limit data transfer to the Region.

Prerequisites

Landing zone best practices and custom guardrails can help when data needs to remain in a specific locality where the Outposts rack is also located.  This can be completed by defining and enforcing policies for data storage and usage within the landing zone organization that you set up. The following prerequisites should be considered before implementing the suggested guardrails:

1. AWS Outposts rack

AWS has installed your Outpost and handed off to you. An Outpost may comprise of one or more racks connected together at the site. This means that you can start using AWS services on the Outpost, and you can manage the Outposts rack using the same tools and interfaces that you use in AWS Regions.

2. Landing Zone Accelerator on AWS

We recommend using Landing Zone Accelerator on AWS (LZA) to deploy a landing zone for your organization. Make sure that the accelerator is configured for the appropriate Region and industry. To do this, you must meet the following prerequisites:

    • A clear understanding of your organization’s compliance requirements, including the specific Region and industry rules in which you operate.
    • Knowledge of the different LZAs available and their capabilities, such as the compliance frameworks with which you align.
    • Have the necessary permissions to deploy the LZAs and configure it for your organization’s specific requirements.

Note that LZAs are designed to help organizations quickly set up a secure, compliant multi-account environment. However, it’s not a one-size-fits-all solution, and you must align it with your organization’s specific requirements.

3. Set up the data residency guardrails

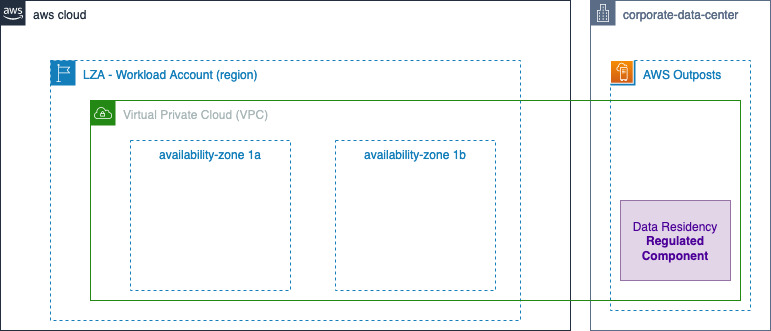
Using Organizations, you must make sure that the Outpost is ordered within a workload account in the landing zone.

Figure 1 Landing Zone Accelerator Outposts workload on AWS high level Architecture

Figure 1: Landing Zone Accelerator – Outposts workload on AWS high level Architecture

Utilizing Outposts rack for regulated components

When local regulations require regulated workloads to stay within a specific boundary, or when an AWS Region or AWS Local Zone isn’t available in your jurisdiction, you can still choose to host your regulated workloads on Outposts rack for a consistent cloud experience. When opting for Outposts rack, note that, as part of the shared responsibility model, customers are responsible for attesting to physical security, access controls, and compliance validation regarding the Outposts, as well as, environmental requirements for the facility, networking, and power. Utilizing Outposts rack requires that you procure and manage the data center within the city, state, province, or country boundary for your applications’ regulated components, as required by local regulations.

Procuring two or more racks in the diverse data centers can help with the high availability for your workloads. This is because it provides redundancy in case of a single rack or server failure. Additionally, having redundant network paths between Outposts rack and the parent Region can help make sure that your application remains connected and continue to operate even if one network path fails.

However, for regulated workloads with strict service level agreements (SLA), you may choose to spread Outposts racks across two or more isolated data centers within regulated boundaries. This helps make sure that your data remains within the designated geographical location and meets local data residency requirements.

In this post, we consider a scenario with one data center, but consider the specific requirements of your workloads and the regulations that apply to determine the most appropriate high availability configurations for your case.

Outposts rack workload data residency guardrails

Organizations provide central governance and management for multiple accounts. Central security administrators use SCPs with Organizations to establish controls to which all AWS Identity and Access Management (IAM) principals (users and roles) adhere.

Now, you can use SCPs to set permission guardrails.  A suggested preventative controls for data residency on Outposts rack that leverage the implementation of SCPs are shown as follows. SCPs enable you to set permission guardrails by defining the maximum available permissions for IAM entities in an account. If an SCP denies an action for an account, then none of the entities in the account can take that action, even if their IAM permissions let them. The guardrails set in SCPs apply to all IAM entities in the account, which include all users, roles, and the account root user.

Upon finalizing these prerequisites, you can create the guardrails for the Outposts Organization Unit (OU).

Note that while the following guidelines serve as helpful guardrails – SCPs – for data residency, you should consult internally with legal and security teams for specific organizational requirements.

 To exercise better control over workloads in the Outposts rack and prevent data transfer from Outposts to the Region or data storage outside the Outposts, consider implementing the following guardrails. Additionally, local regulations may dictate that you set up these additional guardrails.

  1. When your data residency requirements require restricting data transfer/saving to the Region, consider the following guardrails:

a. Deny copying data from Outposts to the Region for Amazon Elastic Compute Cloud (Amazon EC2), Amazon Relational Database Service (Amazon RDS), Amazon ElastiCache and data sync “DenyCopyToRegion”.

b. Deny Amazon Simple Storage Service (Amazon S3) put action to the Region “DenyPutObjectToRegionalBuckets”.

If your data residency requirements mandate restrictions on data storage in the Region,  consider implementing this guardrail to prevent  the use of S3 in the Region.

Note: You can use Amazon S3 for Outposts.

c. If your data residency requirements mandate restrictions on data storage in the Region, consider implementing “DenyDirectTransferToRegion” guardrail.

Out of Scope is metadata such as tags, or operational data such as KMS keys.

{
  "Version": "2012-10-17",
  "Statement": [
      {
      "Sid": "DenyCopyToRegion",
      "Action": [
        "ec2:ModifyImageAttribute",
        "ec2:CopyImage",  
        "ec2:CreateImage",
        "ec2:CreateInstanceExportTask",
        "ec2:ExportImage",
        "ec2:ImportImage",
        "ec2:ImportInstance",
        "ec2:ImportSnapshot",
        "ec2:ImportVolume",
        "rds:CreateDBSnapshot",
        "rds:CreateDBClusterSnapshot",
        "rds:ModifyDBSnapshotAttribute",
        "elasticache:CreateSnapshot",
        "elasticache:CopySnapshot",
        "datasync:Create*",
        "datasync:Update*"
      ],
      "Resource": "*",
      "Effect": "Deny"
    },
    {
      "Sid": "DenyDirectTransferToRegion",
      "Action": [
        "dynamodb:PutItem",
        "dynamodb:CreateTable",
        "ec2:CreateTrafficMirrorTarget",
        "ec2:CreateTrafficMirrorSession",
        "rds:CreateGlobalCluster",
        "es:Create*",
        "elasticfilesystem:C*",
        "elasticfilesystem:Put*",
        "storagegateway:Create*",
        "neptune-db:connect",
        "glue:CreateDevEndpoint",
        "glue:UpdateDevEndpoint",
        "datapipeline:CreatePipeline",
        "datapipeline:PutPipelineDefinition",
        "sagemaker:CreateAutoMLJob",
        "sagemaker:CreateData*",
        "sagemaker:CreateCode*",
        "sagemaker:CreateEndpoint",
        "sagemaker:CreateDomain",
        "sagemaker:CreateEdgePackagingJob",
        "sagemaker:CreateNotebookInstance",
        "sagemaker:CreateProcessingJob",
        "sagemaker:CreateModel*",
        "sagemaker:CreateTra*",
        "sagemaker:Update*",
        "redshift:CreateCluster*",
        "ses:Send*",
        "ses:Create*",
        "sqs:Create*",
        "sqs:Send*",
        "mq:Create*",
        "cloudfront:Create*",
        "cloudfront:Update*",
        "ecr:Put*",
        "ecr:Create*",
        "ecr:Upload*",
        "ram:AcceptResourceShareInvitation"
      ],
      "Resource": "*",
      "Effect": "Deny"
    },
    {
      "Sid": "DenyPutObjectToRegionalBuckets",
      "Action": [
        "s3:PutObject"
      ],
      "Resource": ["arn:aws:s3:::*"],
      "Effect": "Deny"
    }
  ]
}
  1. If your data residency requirements require limitations on data storage in the Region, consider implementing this guardrail “DenySnapshotsToRegion” and “DenySnapshotsNotOutposts” to restrict the use of snapshots in the Region.

a. Deny creating snapshots of your Outpost data in the Region “DenySnapshotsToRegion”

 Make sure to update the Outposts “<outpost_arn_pattern>”.

b. Deny copying or modifying Outposts Snapshots “DenySnapshotsNotOutposts”

Make sure to update the Outposts “<outpost_arn_pattern>”.

Note: “<outpost_arn_pattern>” default is arn:aws:outposts:*:*:outpost/*

{
  "Version": "2012-10-17",
  "Statement": [

    {
      "Sid": "DenySnapshotsToRegion",
      "Effect":"Deny",
      "Action":[
        "ec2:CreateSnapshot",
        "ec2:CreateSnapshots"
      ],
      "Resource":"arn:aws:ec2:*::snapshot/*",
      "Condition":{
         "ArnLike":{
            "ec2:SourceOutpostArn":"<outpost_arn_pattern>"
         },
         "Null":{
            "ec2:OutpostArn":"true"
         }
      }
    },
    {

      "Sid": "DenySnapshotsNotOutposts",          
      "Effect":"Deny",
      "Action":[
        "ec2:CopySnapshot",
        "ec2:ModifySnapshotAttribute"
      ],
      "Resource":"arn:aws:ec2:*::snapshot/*",
      "Condition":{
         "ArnLike":{
            "ec2:OutpostArn":"<outpost_arn_pattern>"
         }
      }
    }

  ]
}
  1. This guardrail helps to prevent the launch of Amazon EC2 instances or creation of network interfaces in non-Outposts subnets. It is advisable to keep data residency workloads within the Outposts rather than the Region to ensure better control over regulated workloads. This approach can help your organization achieve better control over data residency workloads and improve governance over your AWS Organization.

Make sure to update the Outposts subnets “<outpost_subnet_arns>”.

{
"Version": "2012-10-17",
  "Statement":[{
    "Sid": "DenyNotOutpostSubnet",
    "Effect":"Deny",
    "Action": [
      "ec2:RunInstances",
      "ec2:CreateNetworkInterface"
    ],
    "Resource": [
      "arn:aws:ec2:*:*:network-interface/*"
    ],
    "Condition": {
      "ForAllValues:ArnNotEquals": {
        "ec2:Subnet": ["<outpost_subnet_arns>"]
      }
    }
  }]
}

Additional considerations

When implementing data residency guardrails on Outposts rack, consider backup and disaster recovery strategies to make sure that your data is protected in the event of an outage or other unexpected events. This may include creating regular backups of your data, implementing disaster recovery plans and procedures, and using redundancy and failover systems to minimize the impact of any potential disruptions. Additionally, you should make sure that your backup and disaster recovery systems are compliant with any relevant data residency regulations and requirements. You should also test your backup and disaster recovery systems regularly to make sure that they are functioning as intended.

Additionally, the provided SCPs for Outposts rack in the above example do not block the “logs:PutLogEvents”. Therefore, even if you implemented data residency guardrails on Outpost, the application may log data to CloudWatch logs in the Region.

Highlights

By default, application-level logs on Outposts rack are not automatically sent to Amazon CloudWatch Logs in the Region. You can configure CloudWatch logs agent on Outposts rack to collect and send your application-level logs to CloudWatch logs.

logs: PutLogEvents does transmit data to the Region, but it is not blocked by the provided SCPs, as it’s expected that most use cases will still want to be able to use this logging API. However, if blocking is desired, then add the action to the first recommended guardrail. If you want specific roles to be allowed, then combine with the ArnNotLike condition example referenced in the previous highlight.

Conclusion

The combined use of Outposts rack and the suggested guardrails via AWS Organizations policies enables you to exercise better control over the movement of the data. By creating a landing zone for your organization, you can apply SCPs to your Outposts racks that will help make sure that your data remains within a specific geographic location, as required by the data residency regulations.

Note that, while custom guardrails can help you manage data residency on Outposts rack, it’s critical to thoroughly review your policies, procedures, and configurations to make sure that they are compliant with all relevant data residency regulations and requirements. Regularly testing and monitoring your systems can help make sure that your data is protected and your organization stays compliant.

References

New – AWS CloudTrail Lake Supports Ingesting Activity Events From Non-AWS Sources

Post Syndicated from Channy Yun original https://aws.amazon.com/blogs/aws/new-aws-cloudtrail-lake-supports-ingesting-activity-events-from-non-aws-sources/

In November 2013, we announced AWS CloudTrail to track user activity and API usage. AWS CloudTrail enables auditing, security monitoring, and operational troubleshooting. CloudTrail records user activity and API calls across AWS services as events. CloudTrail events help you answer the questions of “who did what, where, and when?”.

Recently we have improved the ability for you to simplify your auditing and security analysis by using AWS CloudTrail Lake. CloudTrail Lake is a managed data lake for capturing, storing, accessing, and analyzing user and API activity on AWS for audit, security, and operational purposes. You can aggregate and immutably store your activity events, and run SQL-based queries for search and analysis.

We have heard your feedback that aggregating activity information from diverse applications across hybrid environments is complex and costly, but important for a comprehensive picture of your organization’s security and compliance posture.

Today we are announcing support of ingestion for activity events from non-AWS sources using CloudTrail Lake, making it a single location of immutable user and API activity events for auditing and security investigations. Now you can consolidate, immutably store, search, and analyze activity events from AWS and non-AWS sources, such as in-house or SaaS applications, in one place.

Using the new PutAuditEvents API in CloudTrail Lake, you can centralize user activity information from disparate sources into CloudTrail Lake, enabling you to analyze, troubleshoot and diagnose issues using this data. CloudTrail Lake records all events in standardized schema, making it easier for users to consume this information to comprehensively and quickly respond to security incidents or audit requests.

CloudTrail Lake is also integrated with selected AWS Partners, such as Cloud Storage Security, Clumio, CrowdStrike, CyberArk, GitHub, Kong Inc, LaunchDarkly, MontyCloud, Netskope, Nordcloud, Okta, One Identity, Shoreline.io, Snyk, and Wiz, allowing you to easily enable audit logging through the CloudTrail console.

Getting Started to Integrate External Sources
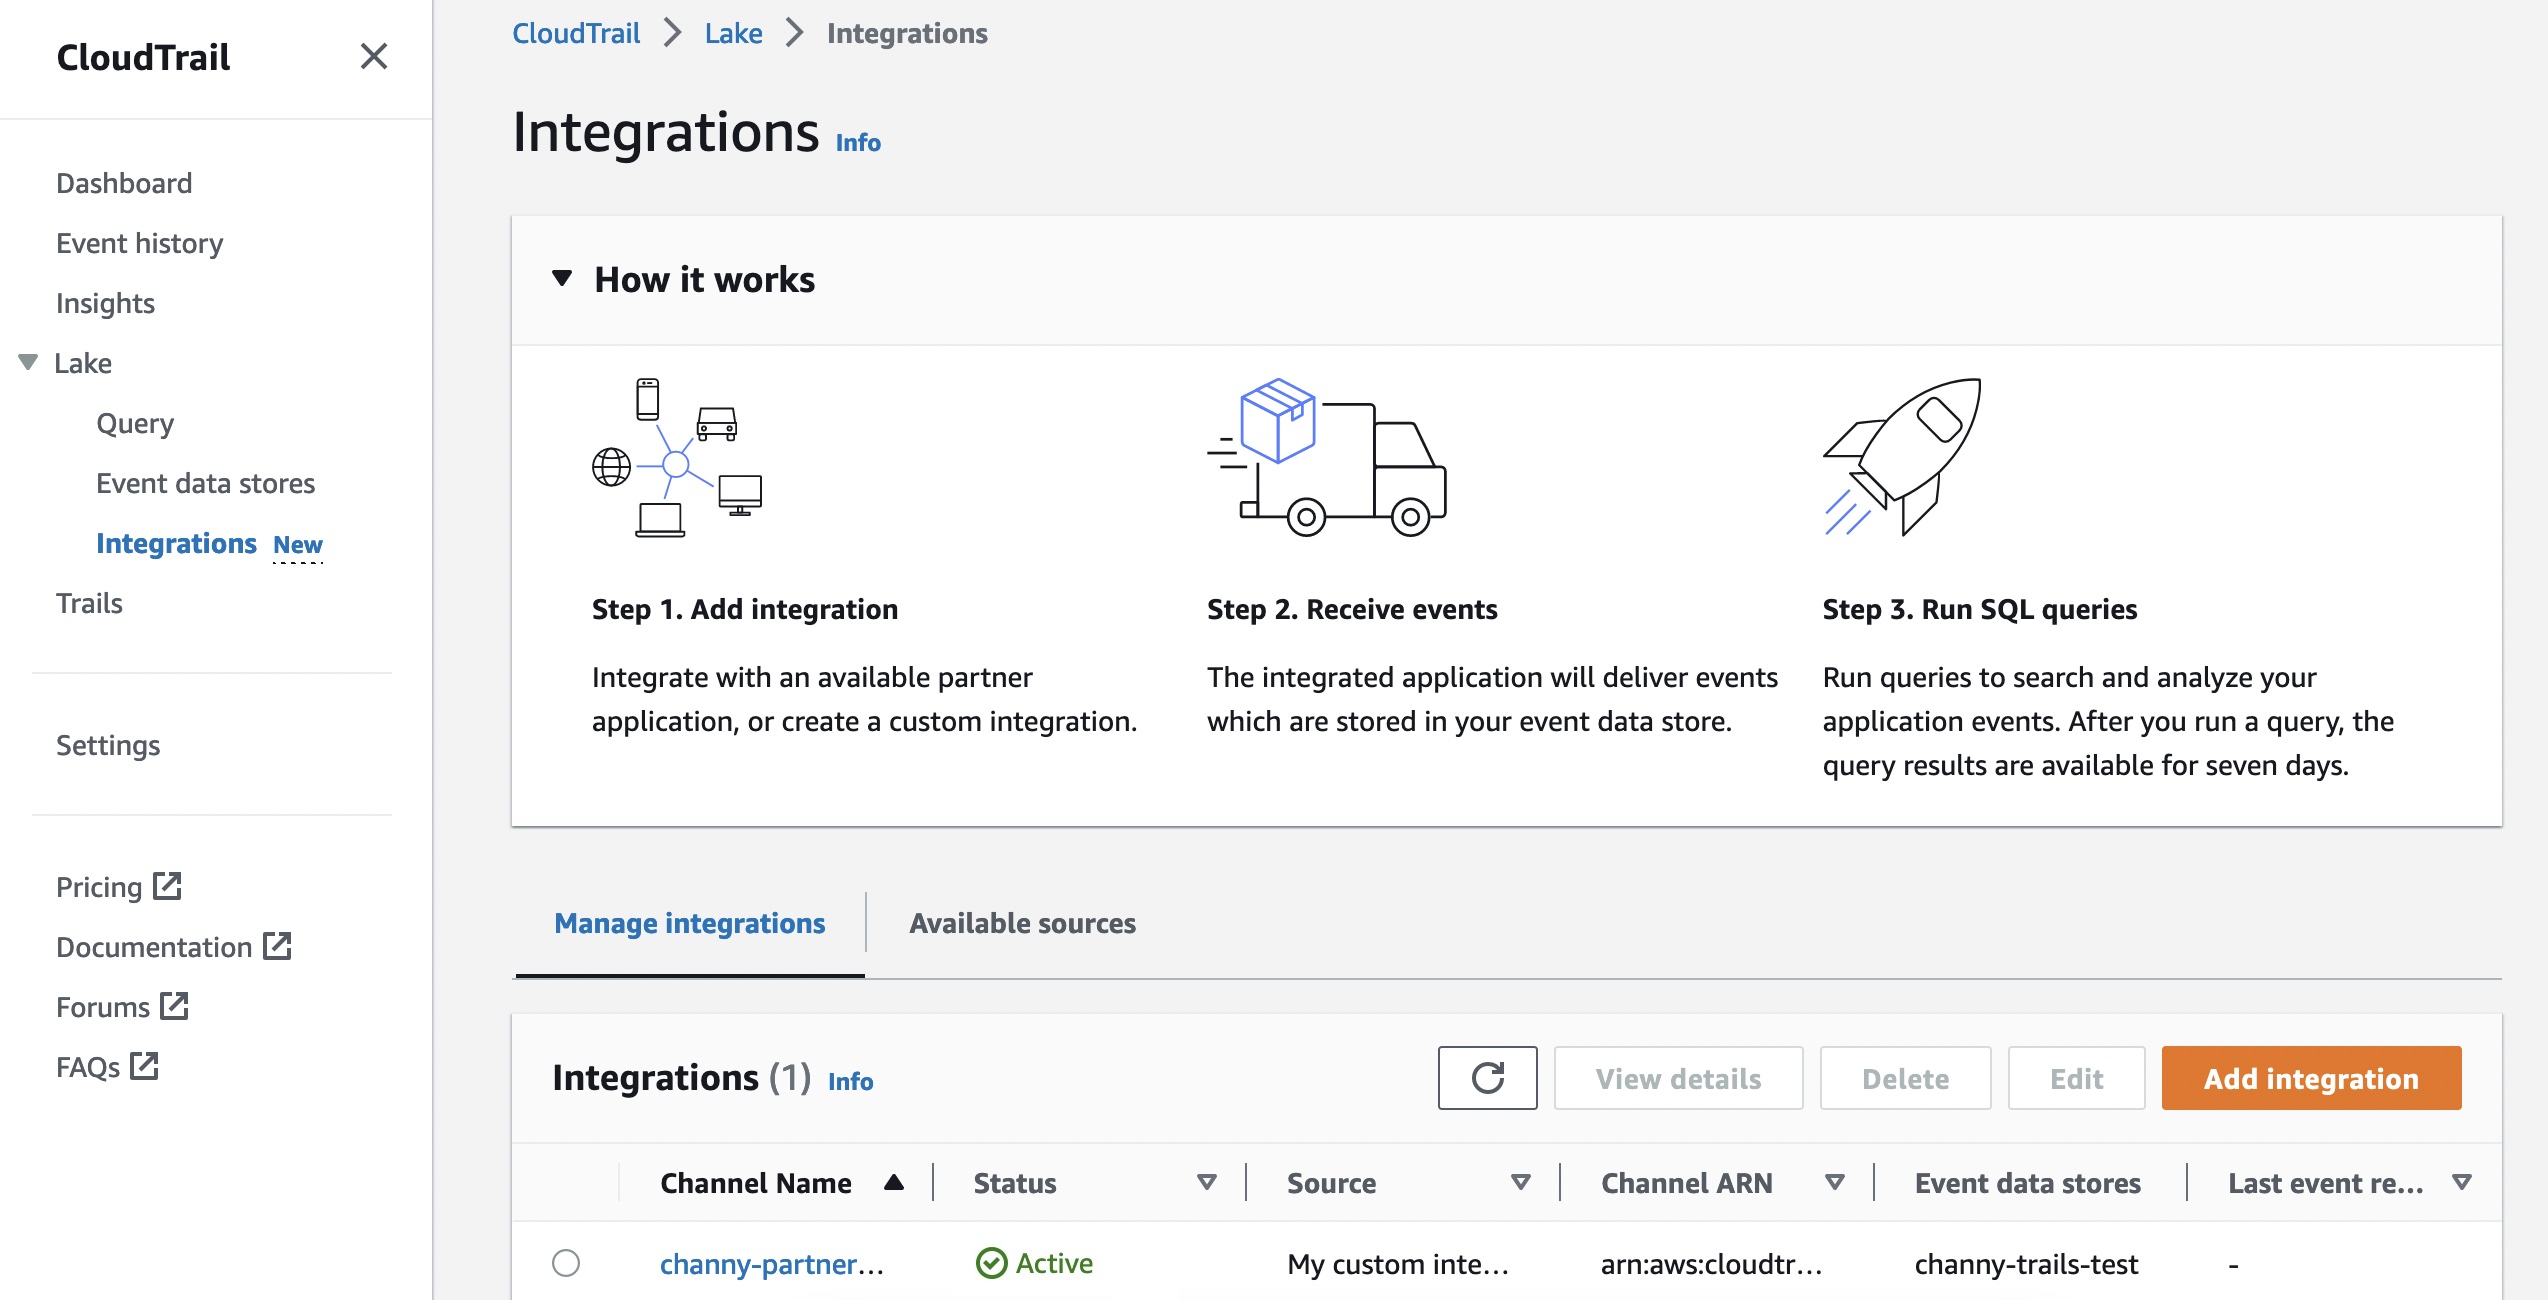
You can start to ingest activity events from your own data sources or partner applications by choosing Integrations under the Lake menu in the AWS CloudTrail console.

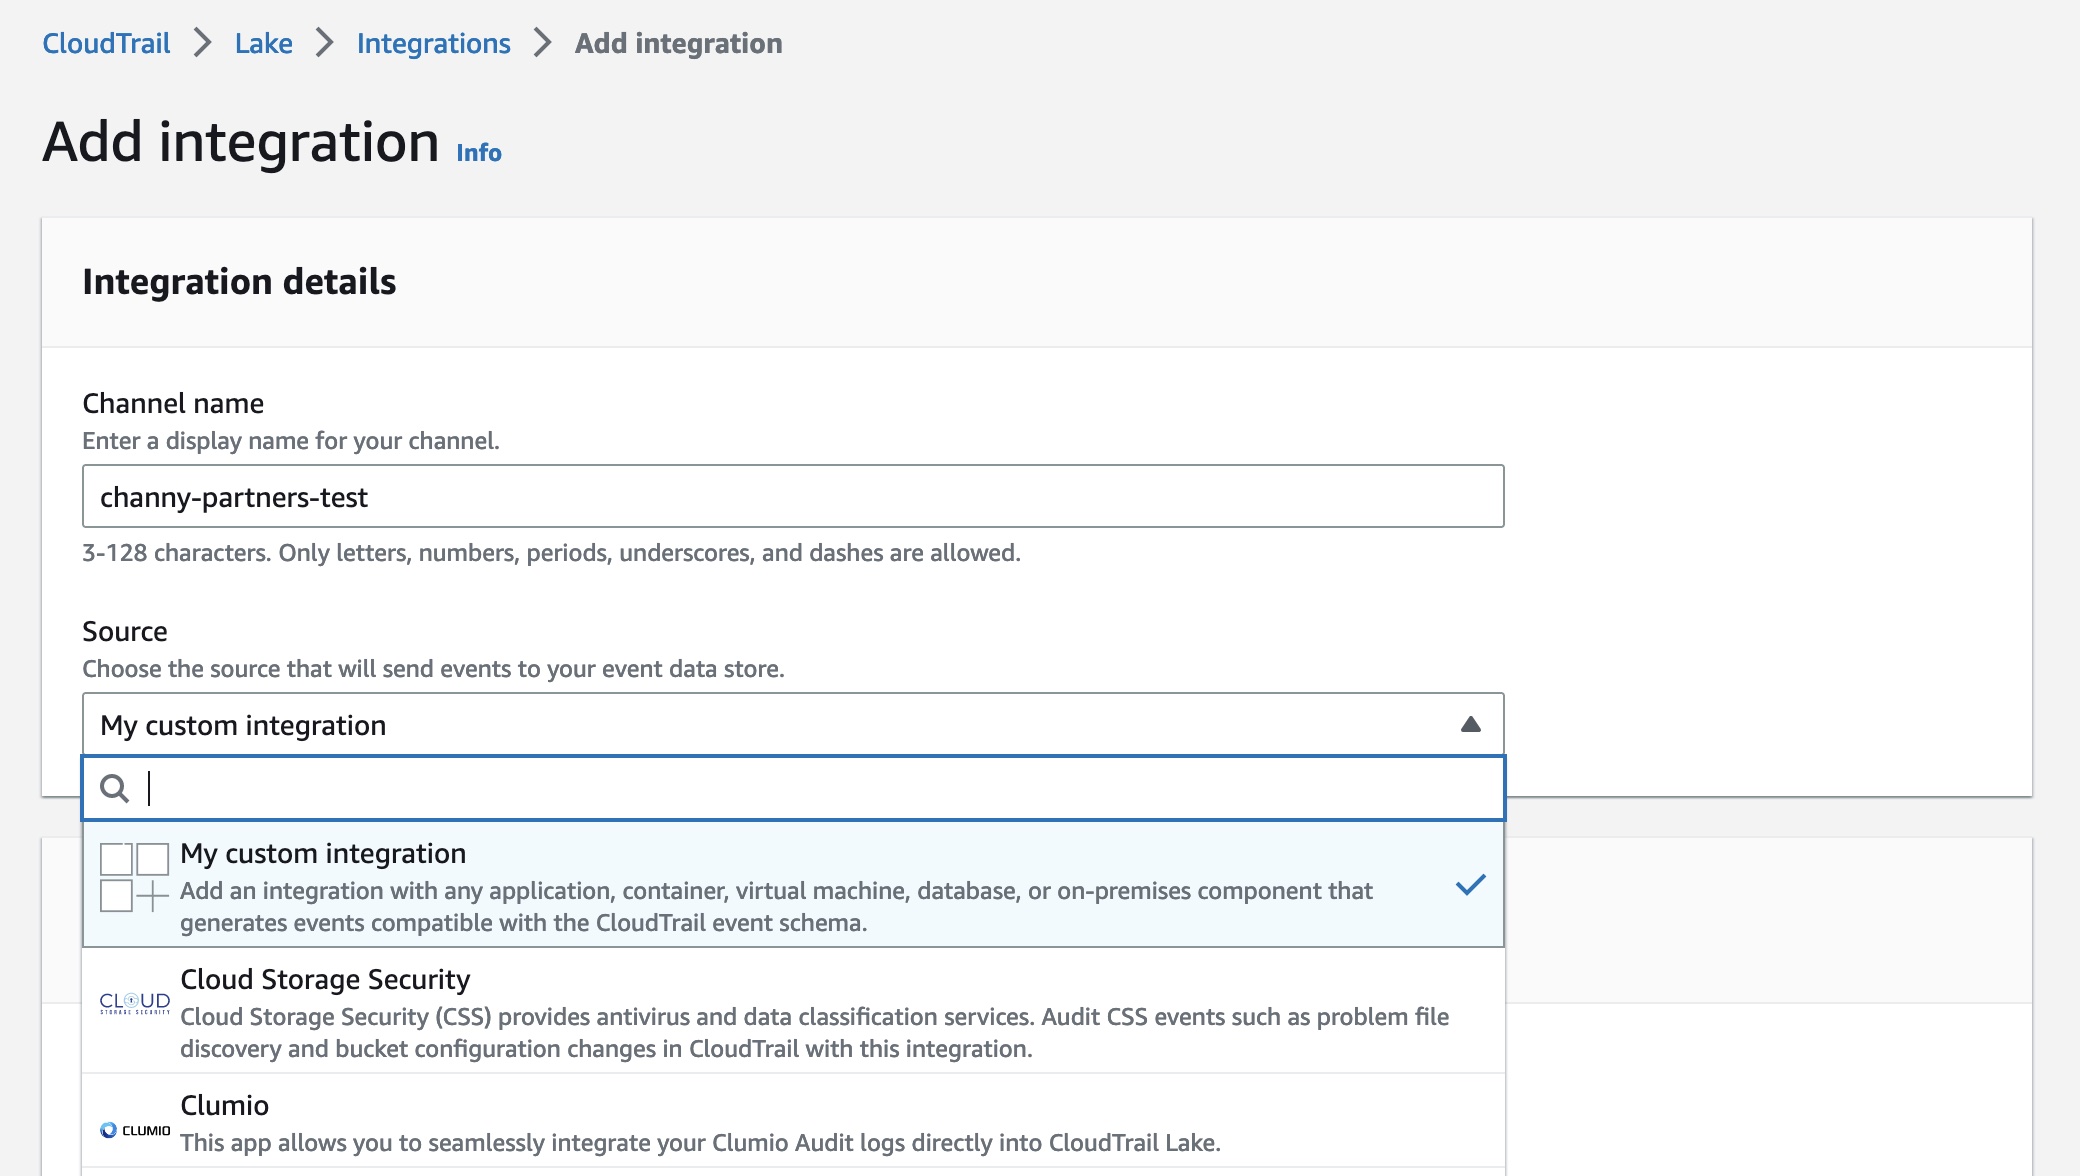
To create a new integration, choose Add integration and enter your channel name. You can choose the partner application source from which you want to get events. If you’re integrating with events from your own applications hosted on-premises or in the cloud, choose My custom integration.

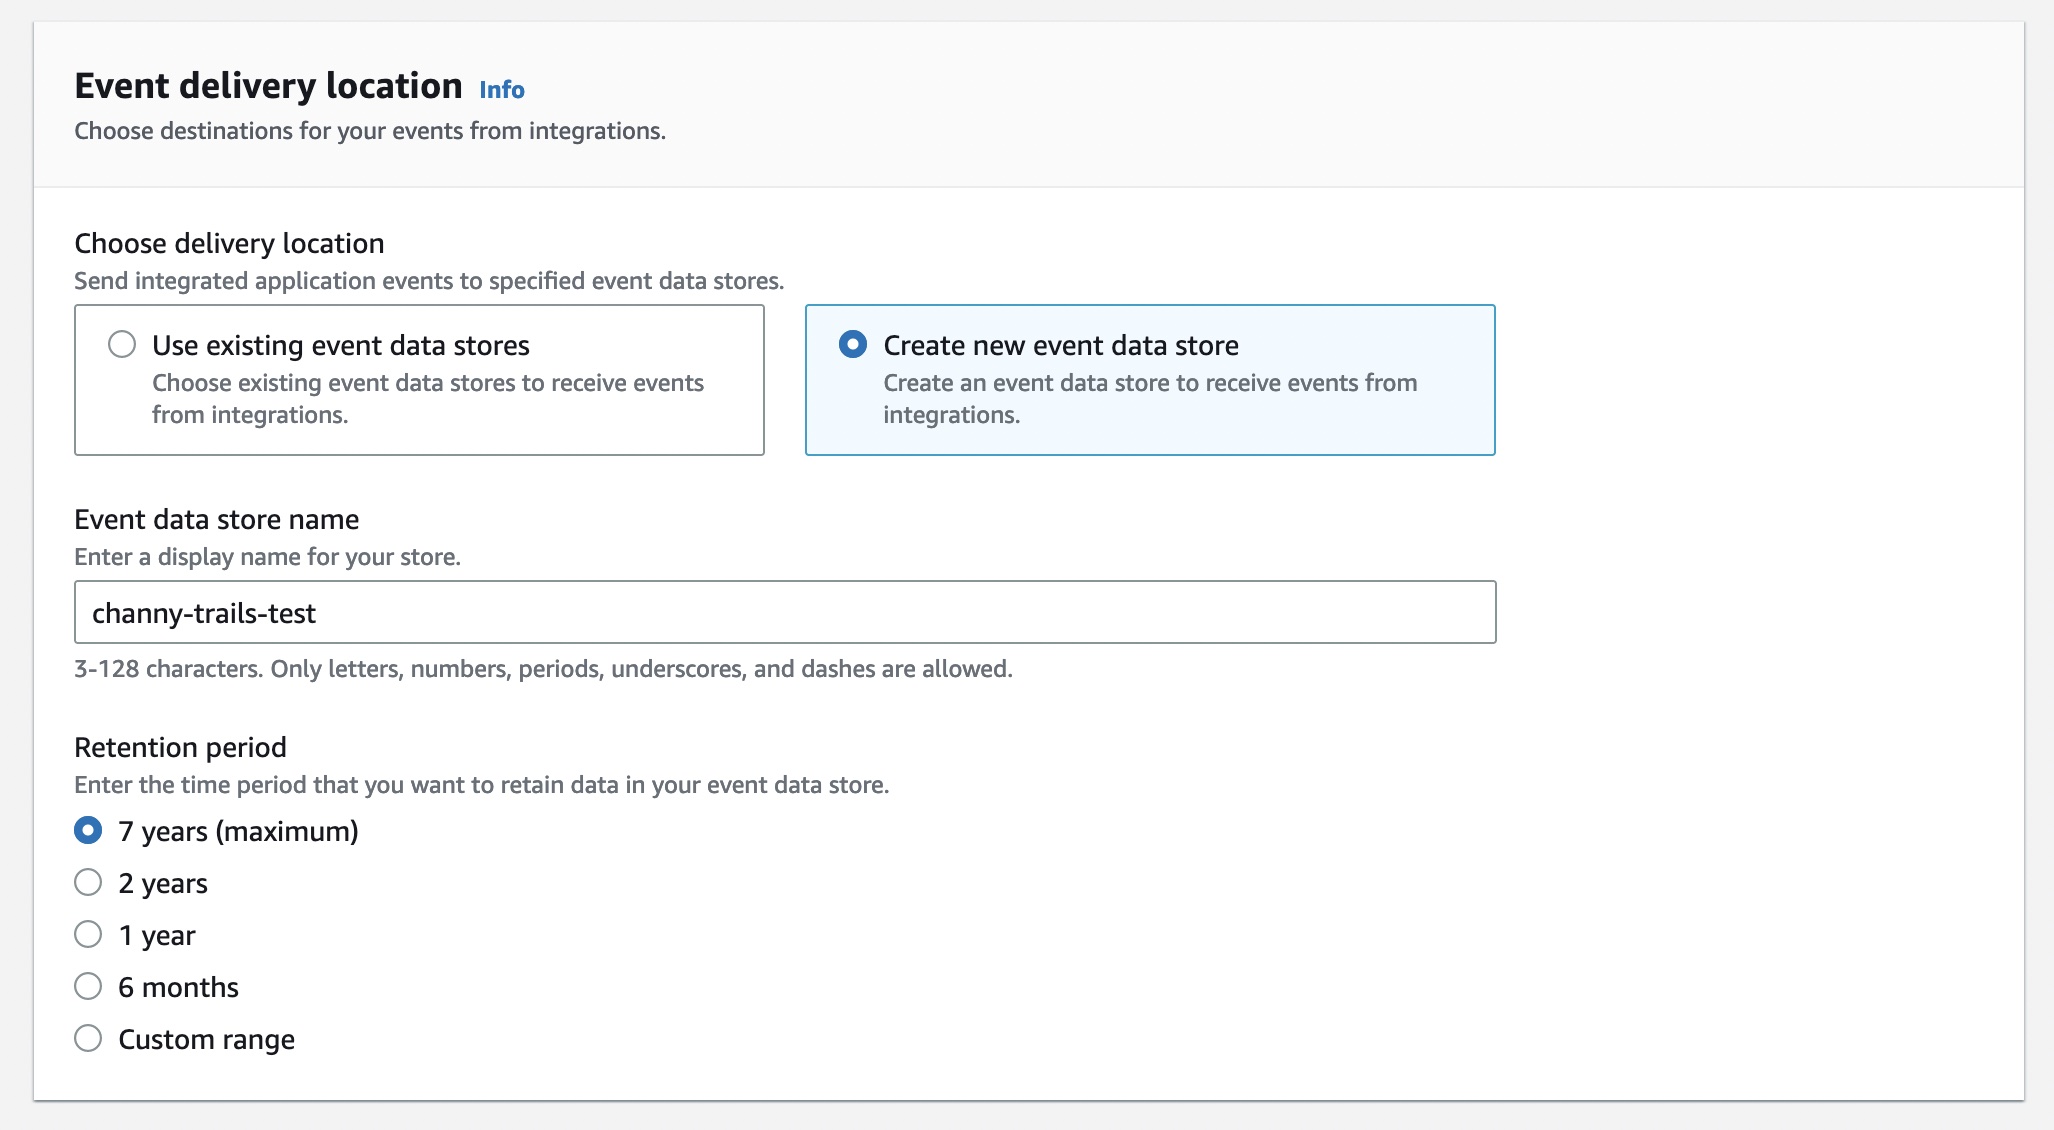
For Event delivery location, you can choose destinations for your events from this integration. This allows your application or partners to deliver events to your event data store of CloudTrail Lake. An event data store can retain your activity events for a week to up to seven years. Then you can run queries on the event data store.

Choose either Use existing event data stores or Create new event data store—to receive events from integrations. To learn more about event data store, see Create an event data store in the AWS documentation.

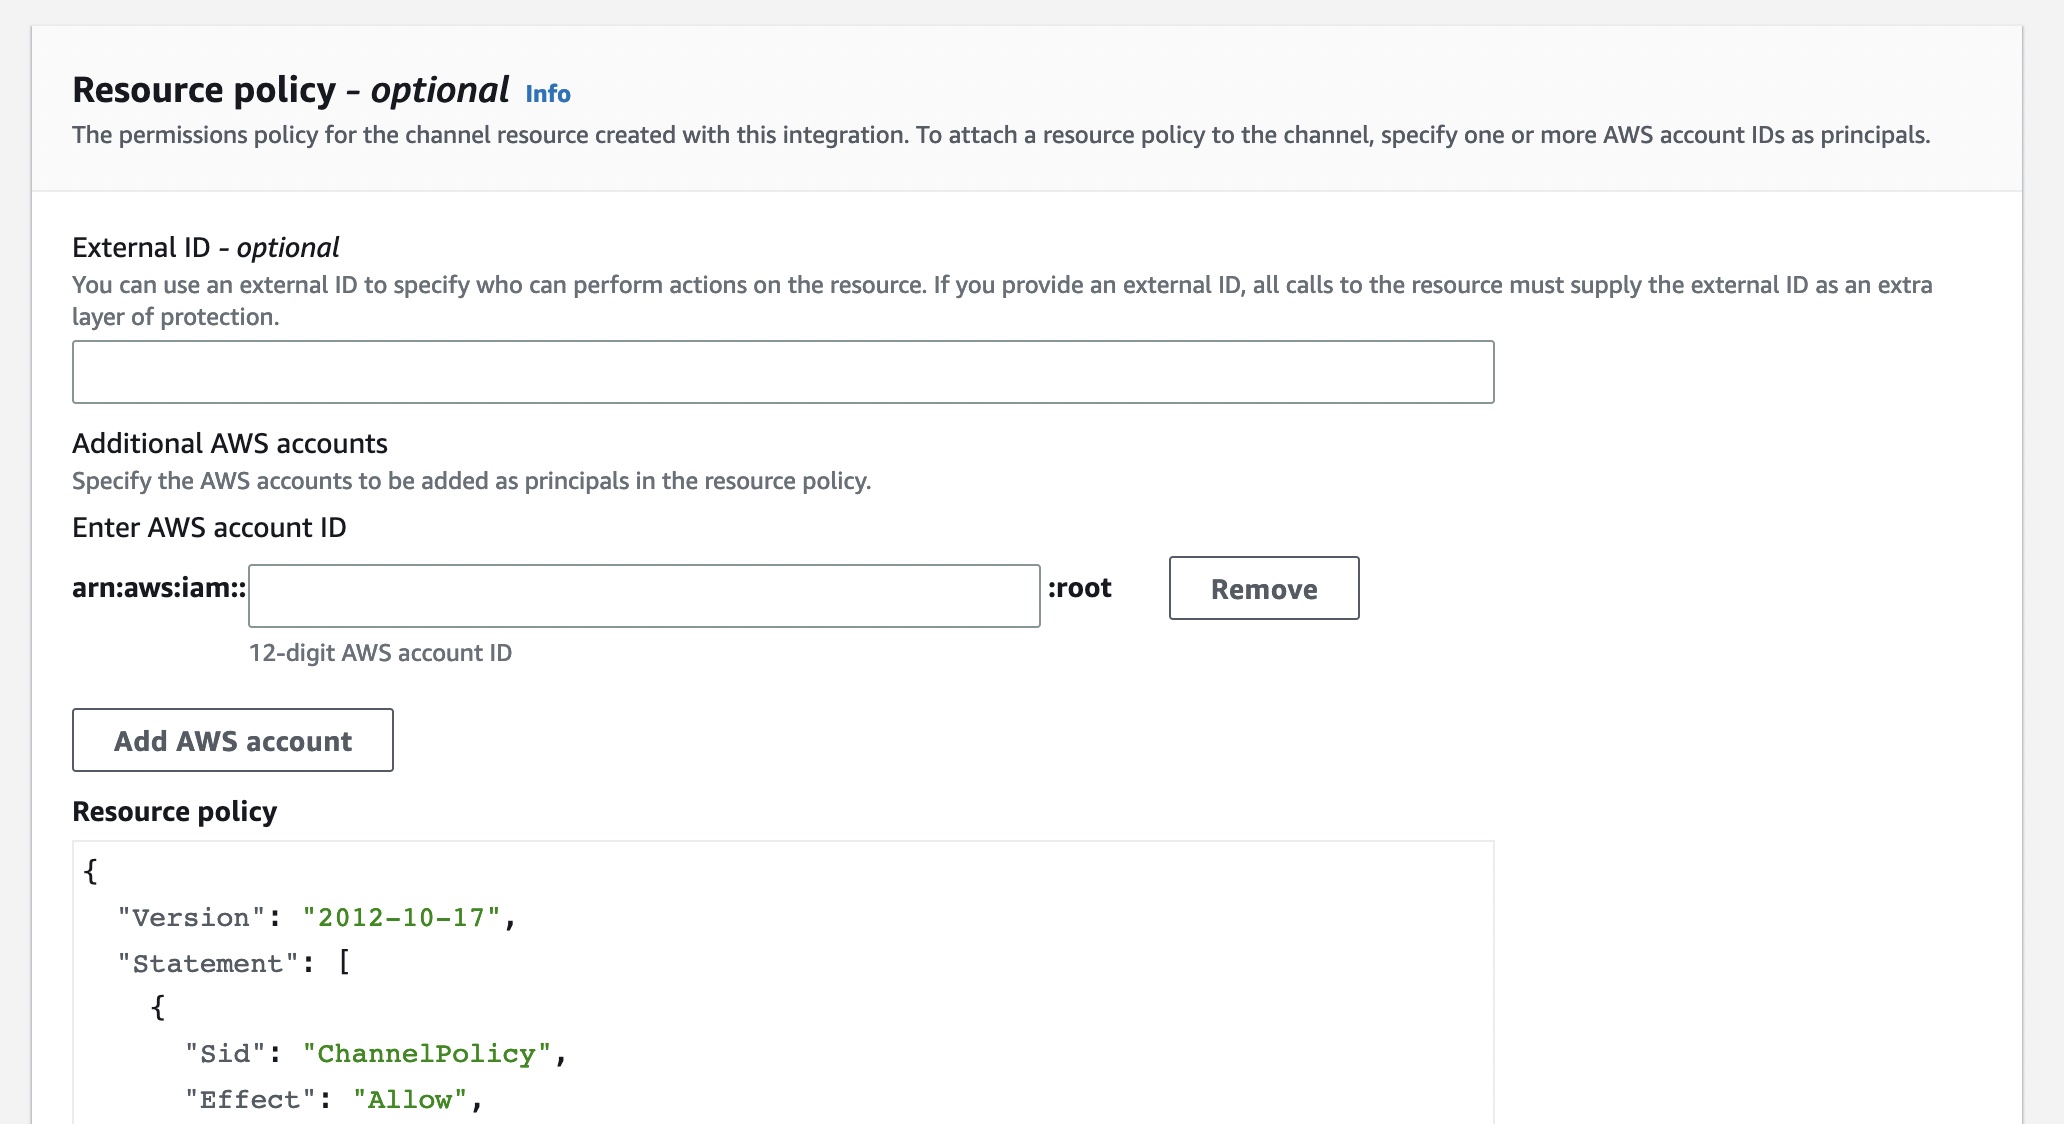
You can also set up the permissions policy for the channel resource created with this integration. The information required for the policy is dependent on the integration type of each partner applications.

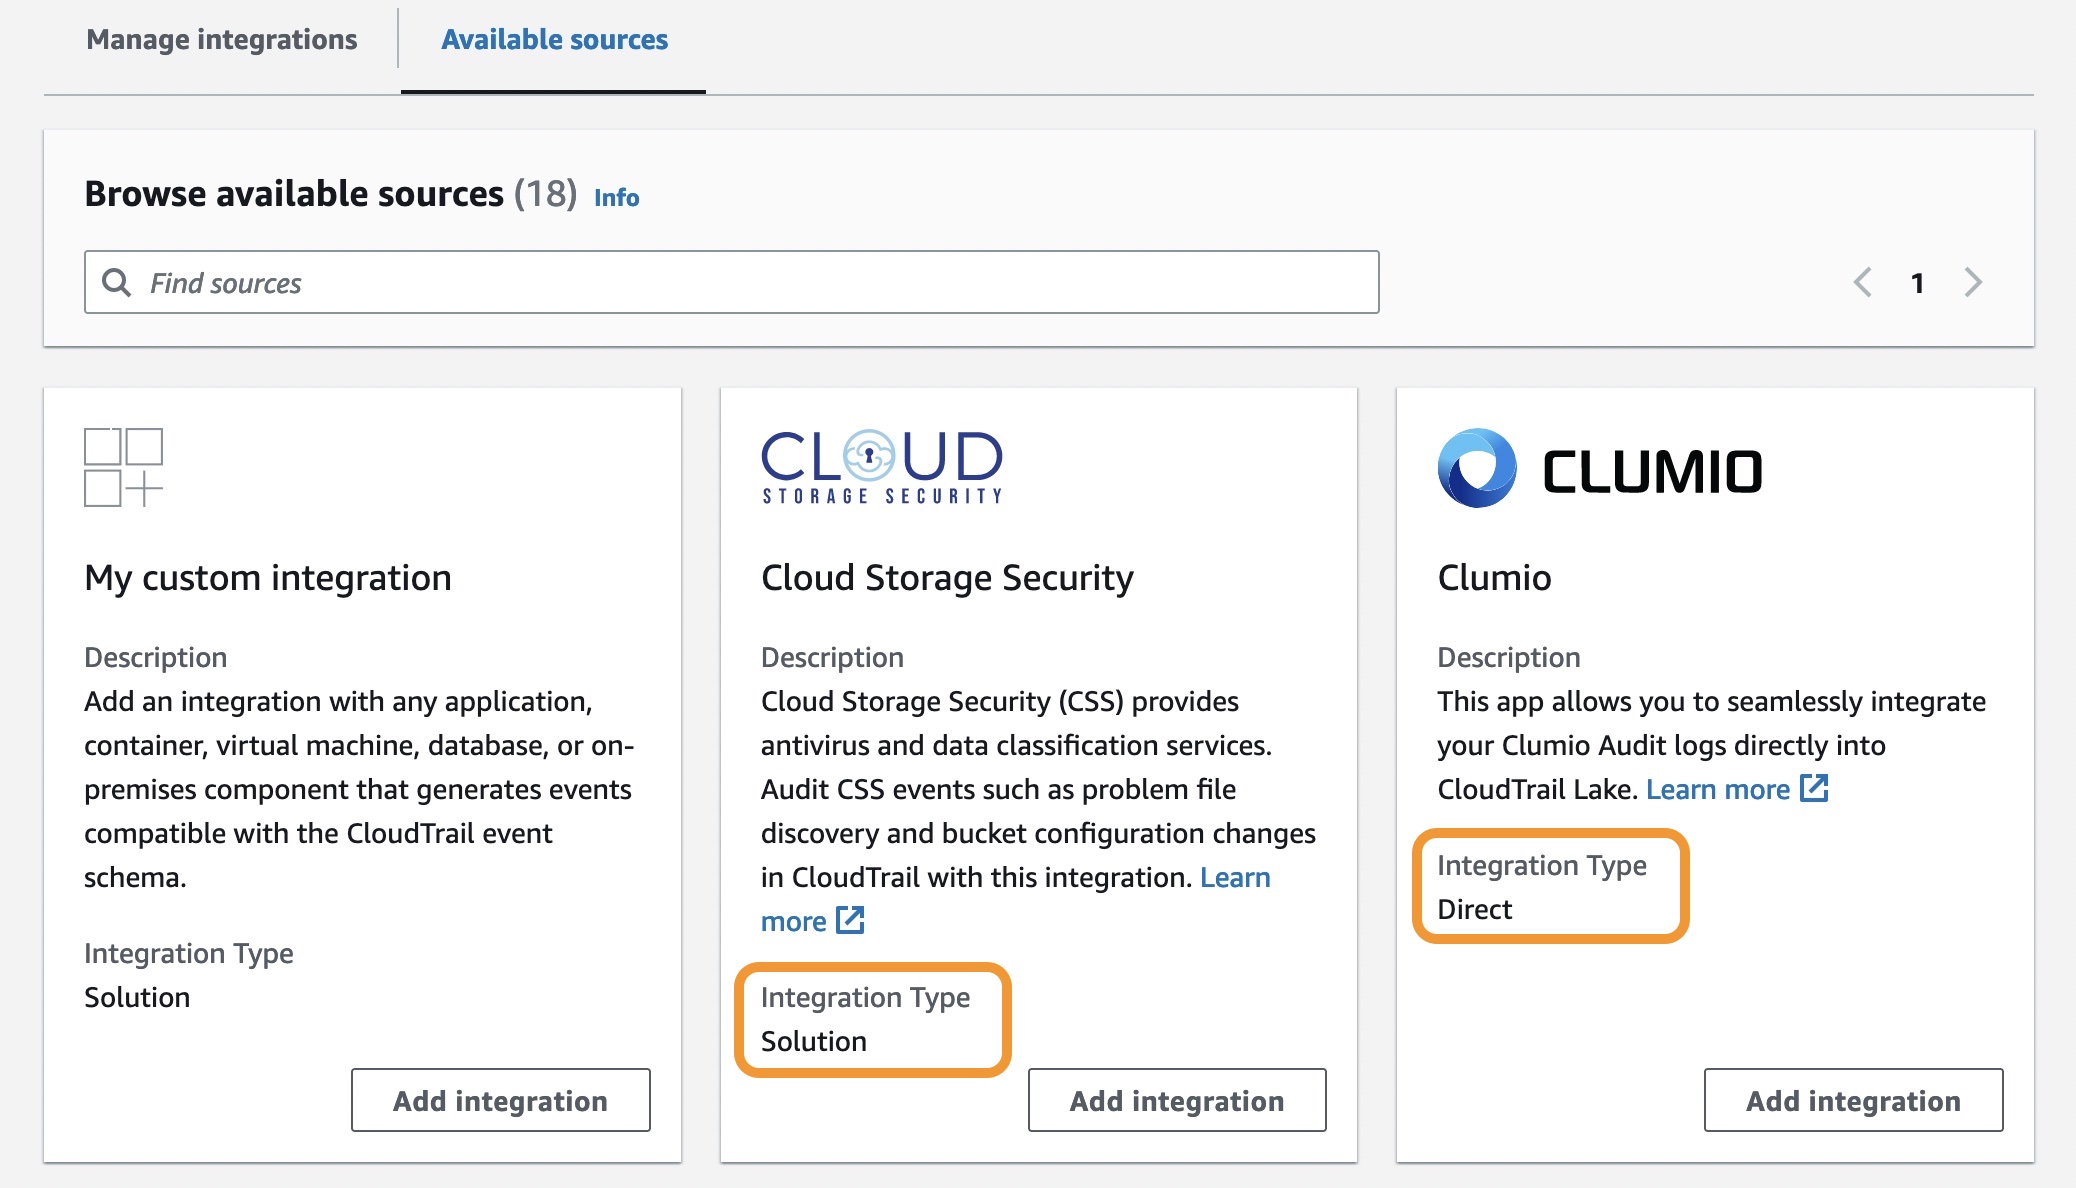
There are two types of integrations: direct and solution. With direct integrations, the partner calls the PutAuditEvents API to deliver events to the event data store for your AWS account. In this case, you need to provide External ID, the unique account identifier provided by the partner. You can see a link to partner website for the step-by-step guide. With solution integrations, the application runs in your AWS account and the application calls the PutAuditEvents API to deliver events to the event data store for your AWS account.

To find the Integration type for your partner, choose the Available sources tab from the integrations page.

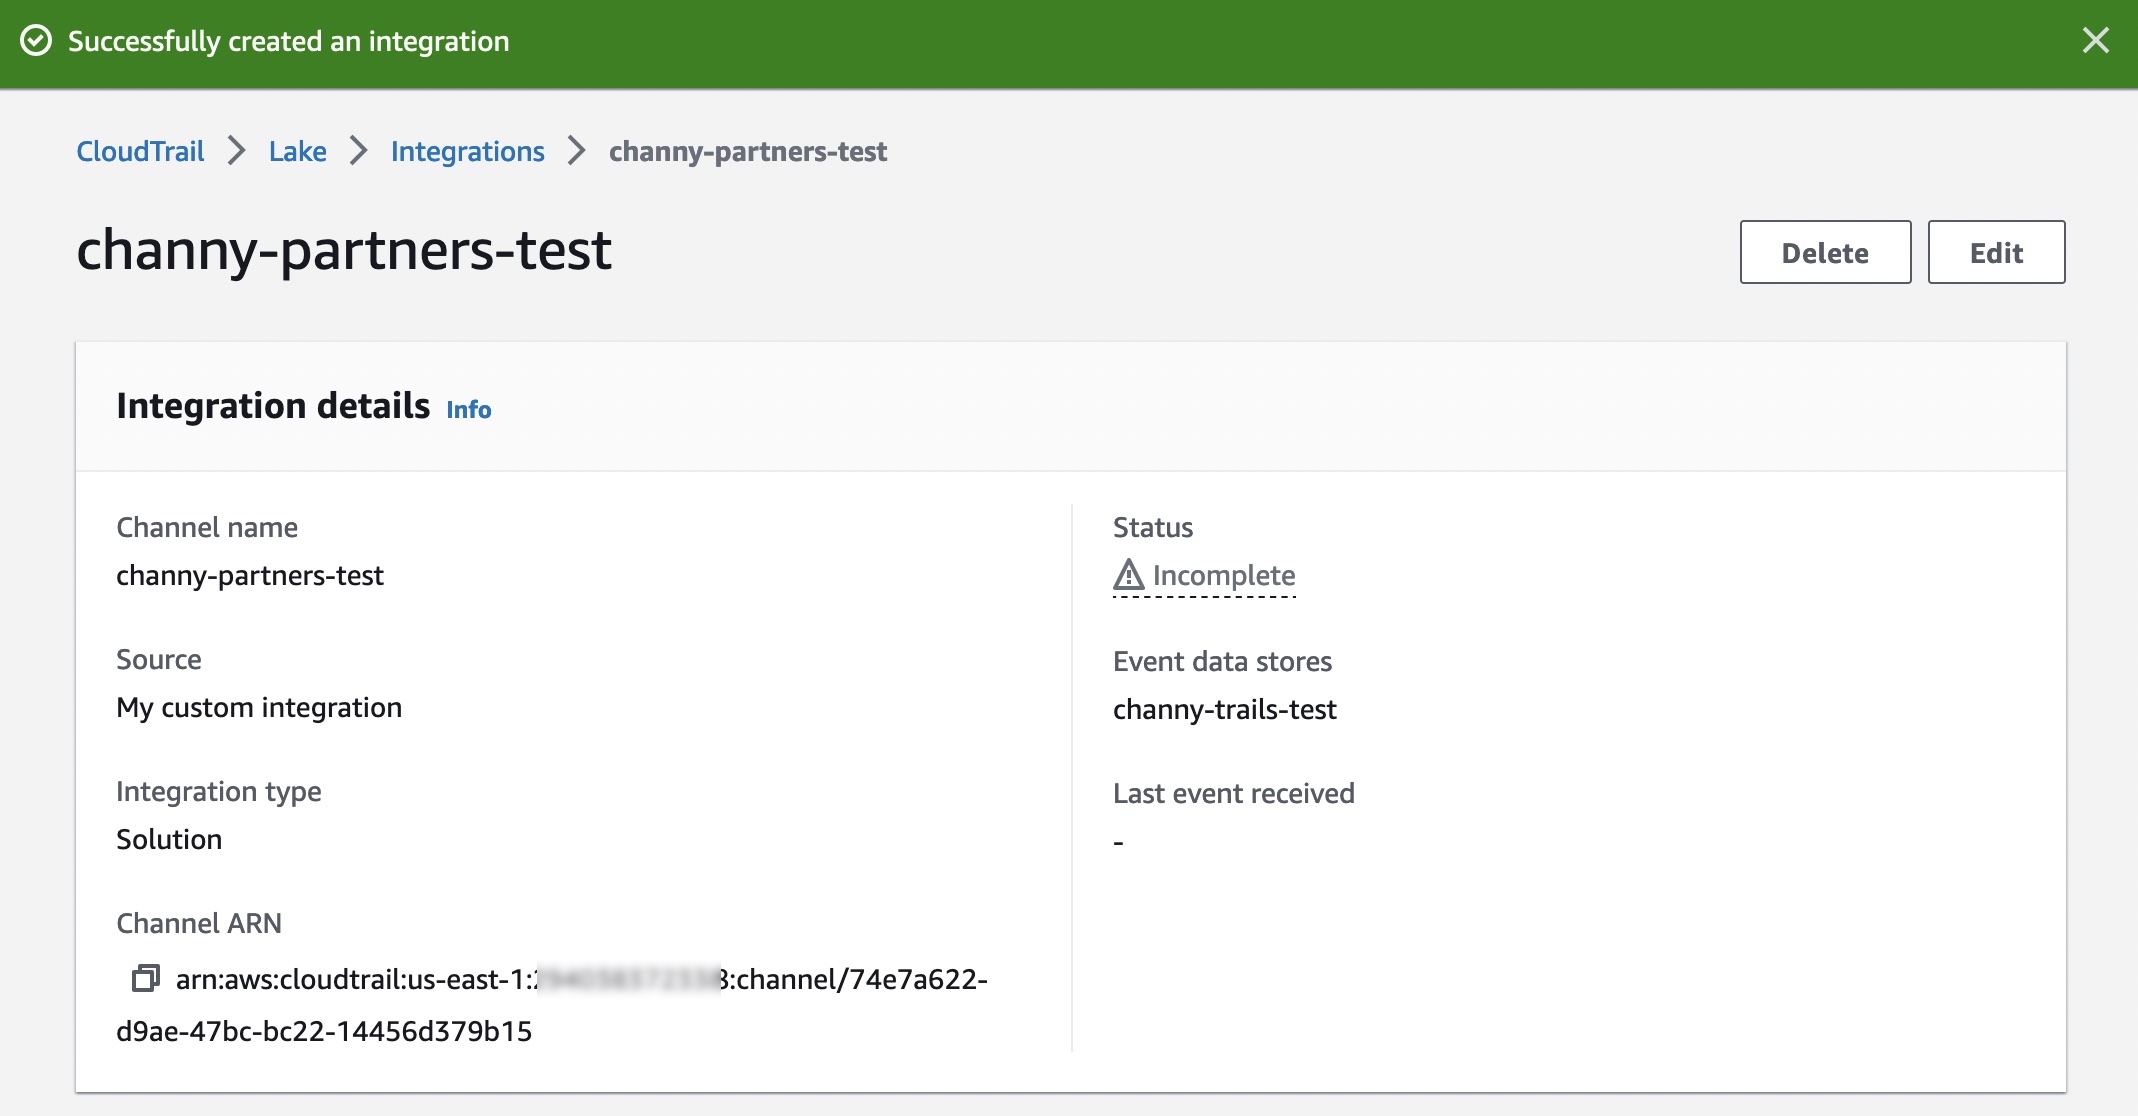
After creating an integration, you will need to provide this Channel ARN to the source or partner application. Until these steps are finished, the status will remain as incomplete. Once CloudTrail Lake starts receiving events for the integrated partner or application, the status field will be updated to reflect the current state.

To ingest your application’s activity events into your integration, call the PutAuditEvents API to add the payload of events. Be sure that there is no sensitive or personally identifying information in the event payload before ingesting it into CloudTrail Lake.

You can make a JSON array of event objects, which includes a required user-generated ID from the event, the required payload of the event as the value of EventData, and an optional checksum to help validate the integrity of the event after ingestion into CloudTrail Lake.

{
  "AuditEvents": [
     {
      "Id": "event_ID",
      "EventData": "{event_payload}", "EventDataChecksum": "optional_checksum",
     },
   ... ]
}

The following example shows how to use the put-audit-events AWS CLI command.

$ aws cloudtrail-data put-audit-events \
--channel-arn $ChannelArn \
--external-id $UniqueExternalIDFromPartner \
--audit-events \
{
  "Id": "87f22433-0f1f-4a85-9664-d50a3545baef",
  "EventData":"{\"eventVersion\":\0.01\",\"eventSource\":\"MyCustomLog2\", ...\}",
},
{
  "Id": "7e5966e7-a999-486d-b241-b33a1671aa74",
  "EventData":"{\"eventVersion\":\0.02\",\"eventSource\":\"MyCustomLog1\", ...\}",
"EventDataChecksum":"848df986e7dd61f3eadb3ae278e61272xxxx",
}

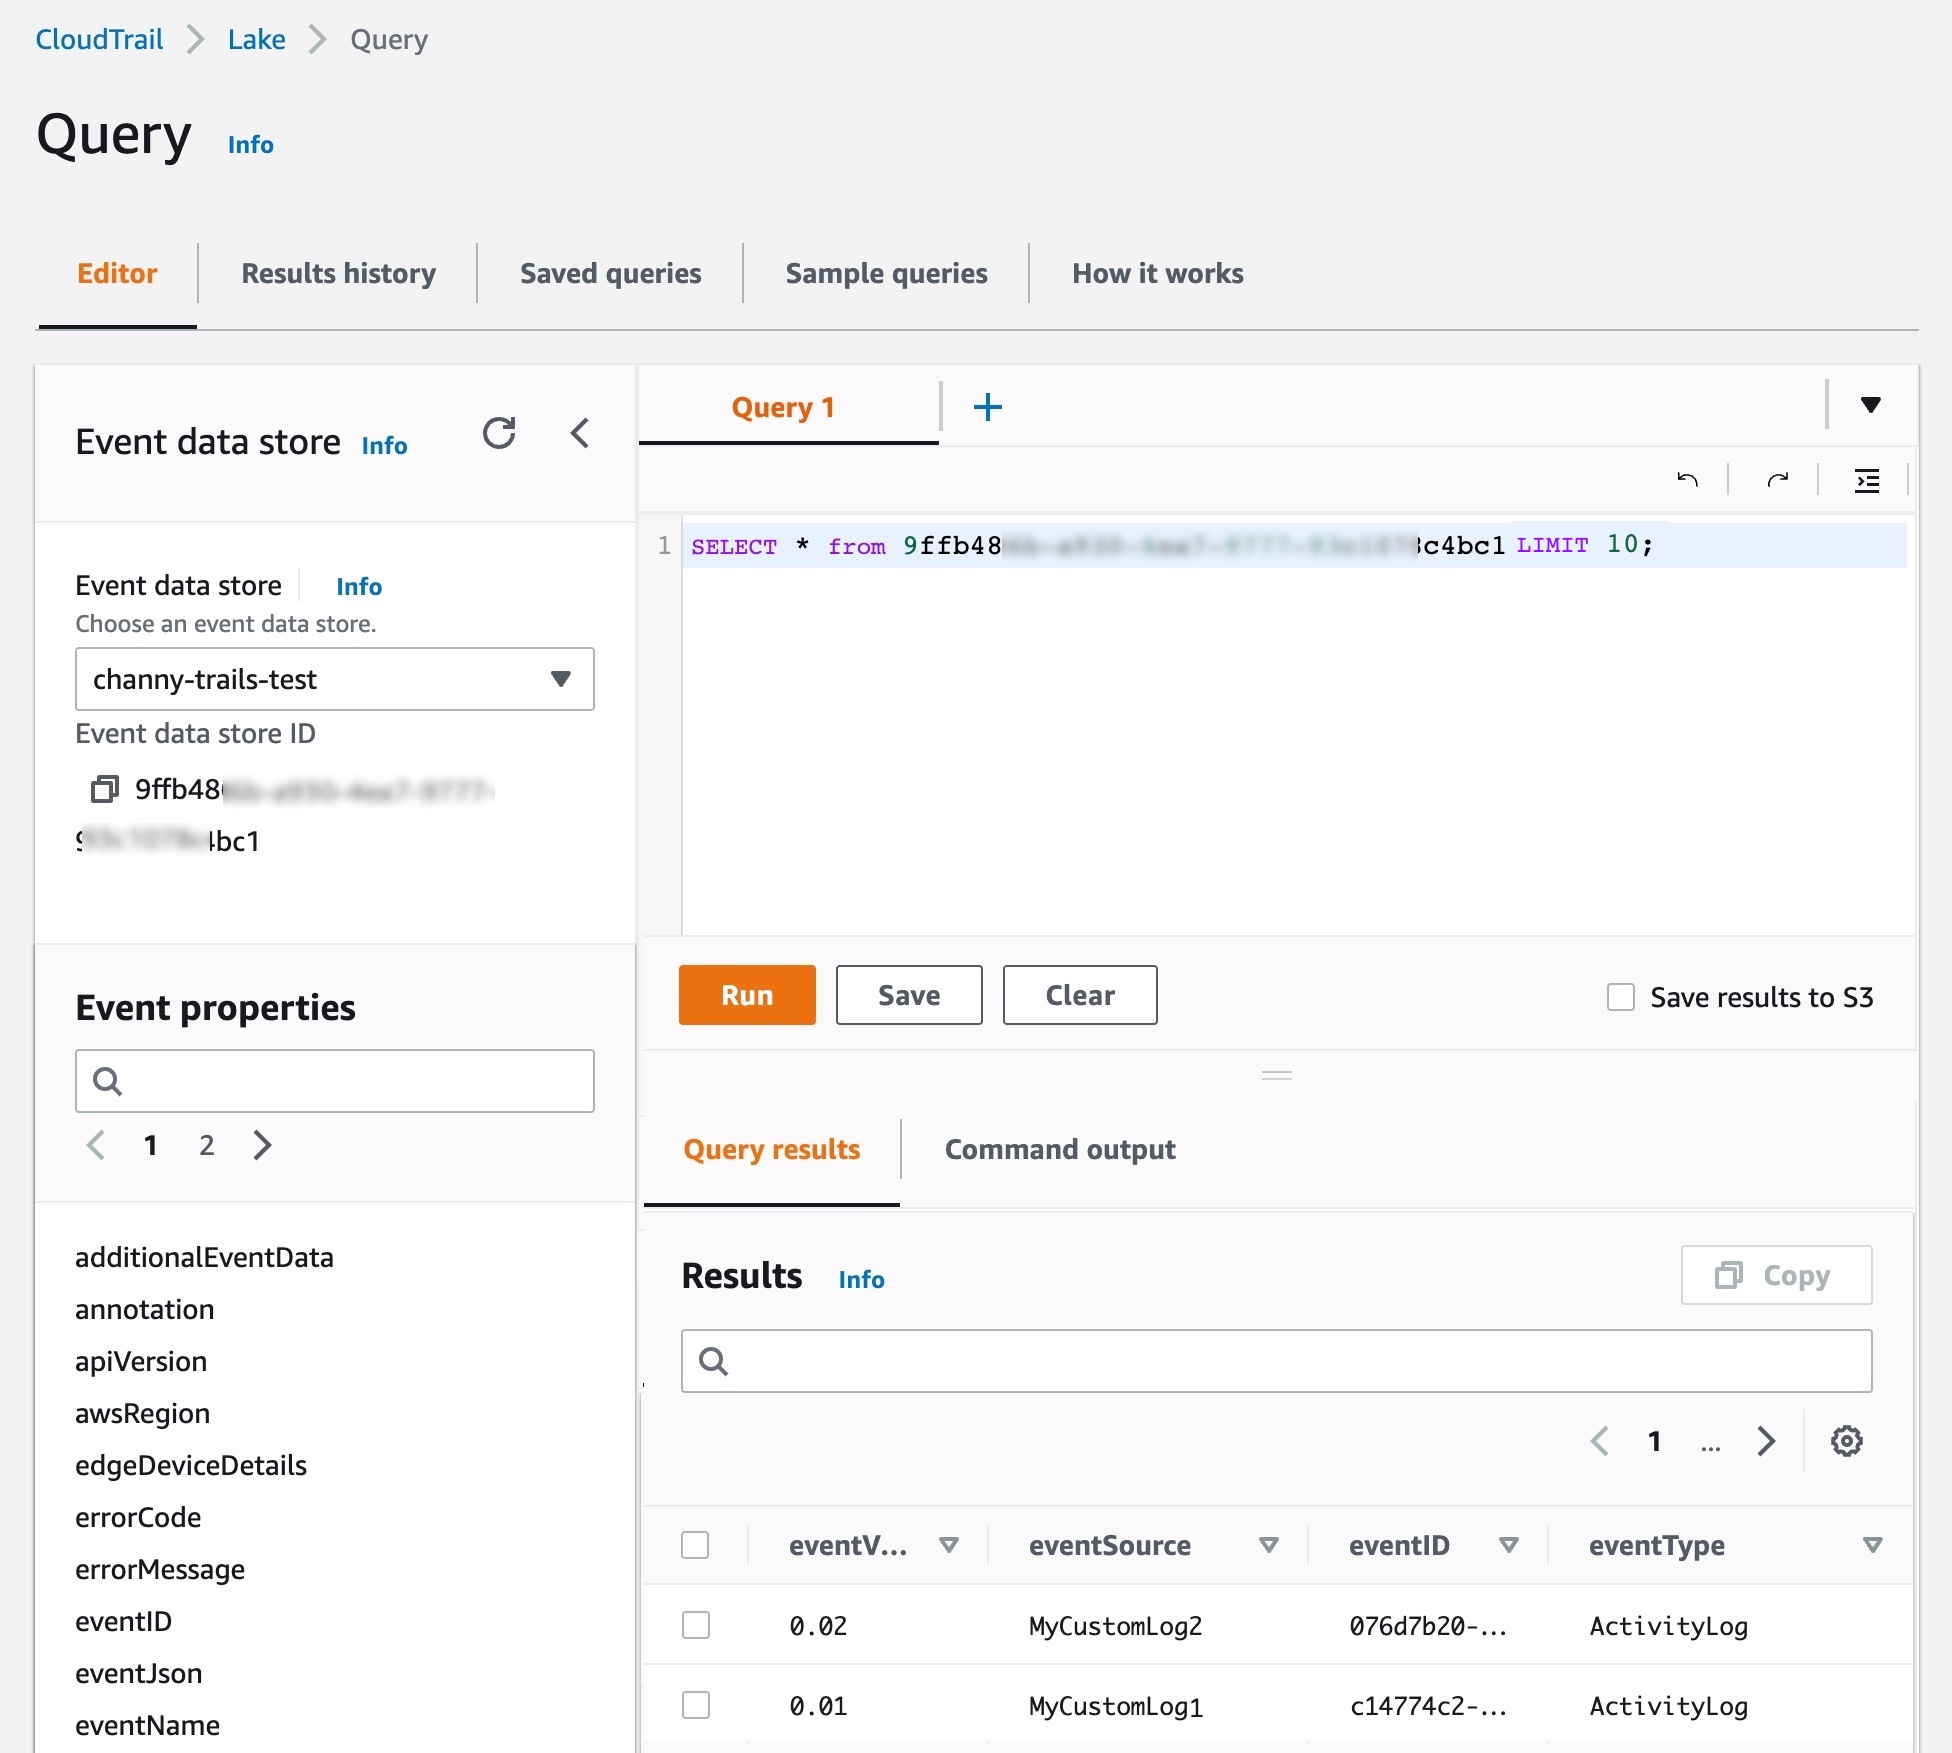
On the Editor tab in the CloudTrail Lake, write your own queries for a new integrated event data store to check delivered events.

You can make your own integration query, like getting all principals across AWS and external resources that have made API calls after a particular date:

SELECT userIdentity.principalId FROM $AWS_EVENT_DATA_STORE_ID 
WHERE eventTime > '2022-09-24 00:00:00'
UNION ALL
SELECT eventData.userIdentity.principalId FROM $PARTNER_EVENT_DATA_STORE_ID
WHRERE eventData.eventTime > '2022-09-24 00:00:00'

To learn more, see CloudTrail Lake event schema and sample queries to help you get started.

Launch Partners
You can see the list of our launch partners to support a CloudTrail Lake integration option in the Available applications tab. Here are blog posts and announcements from our partners who collaborated on this launch (some will be added in the next few days).

  • Cloud Storage Security
  • Clumio
  • CrowdStrike
  • CyberArk
  • GitHub
  • Kong Inc
  • LaunchDarkly
  • MontyCloud
  • Netskope
  • Nordcloud
  • Okta
  • One Identity
  • Shoreline.io
  • Snyk
  • Wiz

Now Available
AWS CloudTrail Lake now supports ingesting activity events from external sources in all AWS Regions where CloudTrail Lake is available today. To learn more, see the AWS documentation and each partner’s getting started guides.

If you are interested in becoming an AWS CloudTrail Partner, you can contact your usual partner contacts.

Channy

The most visited AWS DevOps blogs in 2022

Post Syndicated from original https://aws.amazon.com/blogs/devops/the-most-visited-aws-devops-blogs-in-2022/

As we kick off 2023, I wanted to take a moment to highlight the top posts from 2022. Without further ado, here are the top 10 AWS DevOps Blog posts of 2022.

#1: Integrating with GitHub Actions – CI/CD pipeline to deploy a Web App to Amazon EC2

Coming in at #1, Mahesh Biradar, Solutions Architect and Suresh Moolya, Cloud Application Architect use GitHub Actions and AWS CodeDeploy to deploy a sample application to Amazon Elastic Compute Cloud (Amazon EC2).

Architecture diagram from the original post.

#2: Deploy and Manage GitLab Runners on Amazon EC2

Sylvia Qi, Senior DevOps Architect, and Sebastian Carreras, Senior Cloud Application Architect, guide us through utilizing infrastructure as code (IaC) to automate GitLab Runner deployment on Amazon EC2.

Architecture diagram from the original post.

#3 Multi-Region Terraform Deployments with AWS CodePipeline using Terraform Built CI/CD

Lerna Ekmekcioglu, Senior Solutions Architect, and Jack Iu, Global Solutions Architect, demonstrate best practices for multi-Region deployments using HashiCorp Terraform, AWS CodeBuild, and AWS CodePipeline.

Architecture diagram from the original post.

#4 Use the AWS Toolkit for Azure DevOps to automate your deployments to AWS

Mahmoud Abid, Senior Customer Delivery Architect, leverages the AWS Toolkit for Azure DevOps to deploy AWS CloudFormation stacks.

Architecture diagram from the original post.

#5 Deploy and manage OpenAPI/Swagger RESTful APIs with the AWS Cloud Development Kit

Luke Popplewell, Solutions Architect, demonstrates using AWS Cloud Development Kit (AWS CDK) to build and deploy Amazon API Gateway resources using the OpenAPI specification.

Architecture diagram from the original post.

#6: How to unit test and deploy AWS Glue jobs using AWS CodePipeline

Praveen Kumar Jeyarajan, Senior DevOps Consultant, and Vaidyanathan Ganesa Sankaran, Sr Modernization Architect, discuss unit testing Python-based AWS Glue Jobs in AWS CodePipeline.

Architecture diagram from the original post.

#7: Jenkins high availability and disaster recovery on AWS

James Bland, APN Global Tech Lead for DevOps, and Welly Siauw, Sr. Partner solutions architect, discuss the challenges of architecting Jenkins for scale and high availability (HA).

Architecture diagram from the original post.

#8: Monitor AWS resources created by Terraform in Amazon DevOps Guru using tfdevops

Harish Vaswani, Senior Cloud Application Architect, and Rafael Ramos, Solutions Architect, explain how you can configure and use tfdevops to easily enable Amazon DevOps Guru for your existing AWS resources created by Terraform.

Architecture diagram from the original post.

#9: Manage application security and compliance with the AWS Cloud Development Kit and cdk-nag

Arun Donti, Senior Software Engineer with Twitch, demonstrates how to integrate cdk-nag into an AWS Cloud Development Kit (AWS CDK) application to provide continual feedback and help align your applications with best practices.

Featured image from the original post.

#10: Smithy Server and Client Generator for TypeScript (Developer Preview)

Adam Thomas, Senior Software Development Engineer, demonstrate how you can use Smithy to define services and SDKs and deploy them to AWS Lambda using a generated client.

Architecture diagram from the original post.

A big thank you to all our readers! Your feedback and collaboration are appreciated and help us produce better content.


About the author:

Brian Beach

Brian Beach has over 20 years of experience as a Developer and Architect. He is currently a Principal Solutions Architect at Amazon Web Services. He holds a Computer Engineering degree from NYU Poly and an MBA from Rutgers Business School. He is the author of “Pro PowerShell for Amazon Web Services” from Apress. He is a regular author and has spoken at numerous events. Brian lives in North Carolina with his wife and three kids.

New – AWS Config Rules Now Support Proactive Compliance

Post Syndicated from Danilo Poccia original https://aws.amazon.com/blogs/aws/new-aws-config-rules-now-support-proactive-compliance/

When operating a business, you have to find the right balance between speed and control for your cloud operations. On one side, you want to have the ability to quickly provision the cloud resources you need for your applications. At the same time, depending on your industry, you need to maintain compliance with regulatory, security, and operational best practices.

AWS Config provides rules, which you can run in detective mode to evaluate if the configuration settings of your AWS resources are compliant with your desired configuration settings. Today, we are extending AWS Config rules to support proactive mode so that they can be run at any time before provisioning and save time spent to implement custom pre-deployment validations.

When creating standard resource templates, platform teams can run AWS Config rules in proactive mode so that they can be tested to be compliant before being shared across your organization. When implementing a new service or a new functionality, development teams can run rules in proactive mode as part of their continuous integration and continuous delivery (CI/CD) pipeline to identify noncompliant resources.

You can also use AWS CloudFormation Guard in your deployment pipelines to check for compliance proactively and ensure that a consistent set of policies are applied both before and after resources are provisioned.

Let’s see how this works in practice.

Using Proactive Compliance with AWS Config
In the AWS Config console, I choose Rules in the navigation pane. In the rules table, I see the new Enabled evaluation mode column that specifies whether the rule is proactive or detective. Let’s set up my first rule.

Console screenshot.

I choose Add rule, and then I enter rds-storage in the AWS Managed Rules search box to find the rds-storage-encrypted rule. This rule checks whether storage encryption is enabled for your Amazon Relational Database Service (RDS) DB instances and can be added in proactive or detective evaluation mode. I choose Next.

Console screenshot.

In the Evaluation mode section, I turn on proactive evaluation. Now both the proactive and detective evaluation switches are enabled.

Console screenshot.

I leave all the other settings to their default values and choose Next. In the next step, I review the configuration and add the rule.

Console screenshot.

Now, I can use proactive compliance via the AWS Config API (including the AWS Command Line Interface (CLI) and AWS SDKs) or with CloudFormation Guard. In my CI/CD pipeline, I can use the AWS Config API to check the compliance of a resource before creating it. When deploying using AWS CloudFormation, I can set up a CloudFormation hook to proactively check my configuration before the actual deployment happens.

Let’s do an example using the AWS CLI. First, I call the StartProactiveEvaluationResponse API with in input the resource ID (for reference only), the resource type, and its configuration using the CloudFormation schema. For simplicity, in the database configuration, I only use the StorageEncrypted option and set it to true to pass the evaluation. I use an evaluation timeout of 60 seconds, which is more than enough for this rule.

aws configservice start-resource-evaluation --evaluation-mode PROACTIVE \
    --resource-details '{"ResourceId":"myDB",
                         "ResourceType":"AWS::RDS::DBInstance",
                         "ResourceConfiguration":"{\"StorageEncrypted\":true}",
                         "ResourceConfigurationSchemaType":"CFN_RESOURCE_SCHEMA"}' \
    --evaluation-timeout 60
{
    "ResourceEvaluationId": "be2a915a-540d-4595-ac7b-e105e39b7980-1847cb6320d"
}

I get back in output the ResourceEvaluationId that I use to check the evaluation status using the GetResourceEvaluationSummary API. In the beginning, the evaluation is IN_PROGRESS. It usually takes a few seconds to get a COMPLIANT or NON_COMPLIANT result.

aws configservice get-resource-evaluation-summary \
    --resource-evaluation-id be2a915a-540d-4595-ac7b-e105e39b7980-1847cb6320d
{
    "ResourceEvaluationId": "be2a915a-540d-4595-ac7b-e105e39b7980-1847cb6320d",
    "EvaluationMode": "PROACTIVE",
    "EvaluationStatus": {
        "Status": "SUCCEEDED"
    },
    "EvaluationStartTimestamp": "2022-11-15T19:13:46.029000+00:00",
    "Compliance": "COMPLIANT",
    "ResourceDetails": {
        "ResourceId": "myDB",
        "ResourceType": "AWS::RDS::DBInstance",
        "ResourceConfiguration": "{\"StorageEncrypted\":true}"
    }
}

As expected, the Amazon RDS configuration is compliant to the rds-storage-encrypted rule. If I repeat the previous steps with StorageEncrypted set to false, I get a noncompliant result.

If more than one rule is enabled for a resource type, all applicable rules are run in proactive mode for the resource evaluation. To find out individual rule-level compliance for the resource, I can call the GetComplianceDetailsByResource API:

aws configservice get-compliance-details-by-resource \
    --resource-evaluation-id be2a915a-540d-4595-ac7b-e105e39b7980-1847cb6320d
{
    "EvaluationResults": [
        {
            "EvaluationResultIdentifier": {
                "EvaluationResultQualifier": {
                    "ConfigRuleName": "rds-storage-encrypted",
                    "ResourceType": "AWS::RDS::DBInstance",
                    "ResourceId": "myDB",
                    "EvaluationMode": "PROACTIVE"
                },
                "OrderingTimestamp": "2022-11-15T19:14:42.588000+00:00",
                "ResourceEvaluationId": "be2a915a-540d-4595-ac7b-e105e39b7980-1847cb6320d"
            },
            "ComplianceType": "COMPLIANT",
            "ResultRecordedTime": "2022-11-15T19:14:55.588000+00:00",
            "ConfigRuleInvokedTime": "2022-11-15T19:14:42.588000+00:00"
        }
    ]
}

If, when looking at these details, your desired rule is not invoked, be sure to check that proactive mode is turned on.

Availability and Pricing
Proactive compliance will be available in all commercial AWS Regions where AWS Config is offered but it might take a few days to deploy this new capability across all these Regions. I’ll update this post when this deployment is complete. To see which AWS Config rules can be turned into proactive mode, see the Developer Guide.

You are charged based on the number of AWS Config rule evaluations recorded. A rule evaluation is recorded every time a resource is evaluated for compliance against an AWS Config rule. Rule evaluations can be run in detective mode and/or in proactive mode, if available. If you are running a rule in both detective mode and proactive mode, you will be charged for only the evaluations in detective mode. For more information, see AWS Config pricing.

With this new feature, you can use AWS Config to check your rules before provisioning and avoid implementing your own custom validations.

Danilo

New for AWS Control Tower – Comprehensive Controls Management (Preview)

Post Syndicated from Danilo Poccia original https://aws.amazon.com/blogs/aws/new-for-aws-control-tower-comprehensive-controls-management-preview/

Today, customers in regulated industries face the challenge of defining and enforcing controls needed to meet compliance and security requirements while empowering engineers to make their design choices. In addition to addressing risk, reliability, performance, and resiliency requirements, organizations may also need to comply with frameworks and standards such as PCI DSS and NIST 800-53.

Building controls that account for service relationships and their dependencies is time-consuming and expensive. Sometimes customers restrict engineering access to AWS services and features until their cloud architects identify risks and implement their own controls.

To make that easier, today we are launching comprehensive controls management in AWS Control Tower. You can use it to apply managed preventative, detective, and proactive controls to accounts and organizational units (OUs) by service, control objective, or compliance framework. AWS Control Tower does the mapping between them on your behalf, saving time and effort.

With this new capability, you can now also use AWS Control Tower to turn on AWS Security Hub detective controls across all accounts in an OU. In this way, Security Hub controls are enabled in every AWS Region that AWS Control Tower governs.

Let’s see how this works in practice.

Using AWS Control Tower Comprehensive Controls Management
In the AWS Control Tower console, there is a new Controls library section. There, I choose All controls. There are now more than three hundred controls available. For each control, I see which AWS service it is related to, the control objective this control is part of, the implementation (such as AWS Config rule or AWS CloudFormation Guard rule), the behavior (preventive, detective, or proactive), and the frameworks it maps to (such as NIST 800-53 or PCI DSS).

Console screenshot.

In the Find controls search box, I look for a preventive control called CT.CLOUDFORMATION.PR.1. This control uses a service control policy (SCP) to protect controls that use CloudFormation hooks and is required by the control that I want to turn on next. Then, I choose Enable control.

Console screenshot.

Then, I select the OU for which I want to enable this control.

Console screenshot.

Now that I have set up this control, let’s see how controls are presented in the console in categories. I choose Categories in the navigation pane. There, I can browse controls grouped as Frameworks, Services, and Control objectives. By default, the Frameworks tab is selected.

Console screenshot.

I select a framework (for example, PCI DSS version 3.2.1) to see all the related controls and control objectives. To implement a control, I can select the control from the list and choose Enable control.

Console screenshot.

I can also manage controls by AWS service. When I select the Services tab, I see a list of AWS services and the related control objectives and controls.

Console screenshot.

I choose Amazon DynamoDB to see the controls that I can turn on for this service.

Console screenshot.

I select the Control objectives tab. When I need to assess a control objective, this is where I have access to the list of related controls to turn on.

Console screenshot.

I choose Encrypt data at rest to see and search through the available controls for that control objective. I can also check which services are covered in this specific case. I type RDS in the search bar to find the controls related to Amazon Relational Database Service (RDS) for this control objective.

I choose CT.RDS.PR.16 – Require an Amazon RDS database cluster to have encryption at rest configured and then Enable control.

Console screenshot.

I select the OU for which I want to enable the control for, and I proceed. All the AWS accounts in this organization’s OU will have this control enabled in all the Regions that AWS Control Tower governs.

Console screenshot.

After a few minutes, the AWS Control Tower setup is updated. Now, the accounts in this OU have proactive control CT.RDS.PR.16 turned on. When an account in this OU deploys a CloudFormation stack, any Amazon RDS database cluster has to have encryption at rest configured. Because this control is proactive, it’ll be checked by a CloudFormation hook before the deployment starts. This saves a lot of time compared to a detective control that would find the issue only when the CloudFormation deployment is in progress or has terminated. This also improves my security posture by preventing something that’s not allowed as opposed to reacting to it after the fact.

Availability and Pricing
Comprehensive controls management is available in preview today in all AWS Regions where AWS Control Tower is offered. These enhanced control capabilities reduce the time it takes you to vet AWS services from months or weeks to minutes. They help you use AWS by undertaking the heavy burden of defining, mapping, and managing the controls required to meet the most common control objectives and regulations.

There is no additional charge to use these new capabilities during the preview. However, when you set up AWS Control Tower, you will begin to incur costs for AWS services configured to set up your landing zone and mandatory controls. For more information, see AWS Control Tower pricing.

Simplify how you implement compliance and security requirements with AWS Control Tower.

Danilo

Protect Sensitive Data with Amazon CloudWatch Logs

Post Syndicated from Marcia Villalba original https://aws.amazon.com/blogs/aws/protect-sensitive-data-with-amazon-cloudwatch-logs/

Today we are announcing Amazon CloudWatch Logs data protection, a new set of capabilities for Amazon CloudWatch Logs that leverage pattern matching and machine learning (ML) to detect and protect sensitive log data in transit.

While developers try to prevent logging sensitive information such as Social Security numbers, credit card details, email addresses, and passwords, sometimes it gets logged. Until today, customers relied on manual investigation or third-party solutions to detect and mitigate sensitive information from being logged. If sensitive data is not redacted during ingestion, it will be visible in plain text in the logs and in any downstream system that consumed those logs.

Enforcing prevention across the organization is challenging, which is why quick detection and prevention of access to sensitive data in the logs is important from a security and compliance perspective. Starting today, you can enable Amazon CloudWatch Logs data protection to detect and mask sensitive log data as it is ingested into CloudWatch Logs or as it is in transit.

Customers from all industries that want to take advantage of native data protection capabilities can benefit from this feature. But in particular, it is useful for industries under strict regulations that need to make sure that no personal information gets exposed. Also, customers building payment or authentication services where personal and sensitive information may be captured can use this new feature to detect and mask sensitive information as it’s logged.

Getting Started
You can enable a data protection policy for new or existing log groups from the AWS Management Console, AWS Command Line Interface (CLI), or AWS CloudFormation. From the console, select any log group and create a data protection policy in the Data protection tab.

Enable data protection policy

When you create the policy, you can specify the data you want to protect. Choose from over 100 managed data identifiers, which are a repository of common sensitive data patterns spanning financial, health, and personal information. This feature provides you with complete flexibility in choosing from a wide variety of data identifiers that are specific to your use cases or geographical region.

Configure data protection policy

You can also enable audit reports and send them to another log group, an Amazon Simple Storage Service (Amazon S3) bucket, or Amazon Kinesis Firehose. These reports contain a detailed log of data protection findings.

If you want to monitor and get notified when sensitive data is detected, you can create an alarm around the metric LogEventsWithFindings. This metric shows how many findings there are in a particular log group. This allows you to quickly understand which application is logging sensitive data.

When sensitive information is logged, CloudWatch Logs data protection will automatically mask it per your configured policy. This is designed so that none of the downstream services that consume these logs can see the unmasked data. From the AWS Management Console, AWS CLI, or any third party, the sensitive information in the logs will appear masked.

Example of log file with masked data

Only users with elevated privileges in their IAM policy (add logs:Unmask action in the user policy) can view unmasked data in CloudWatch Logs Insights, logs stream search, or via FilterLogEvents and GetLogEvents APIs.

You can use the following query in CloudWatch Logs Insights to unmask data for a particular log group:

fields @timestamp, @message, unmask(@message)
| sort @timestamp desc
| limit 20

Available Now
Data protection is available in US East (Ohio), US East (N. Virginia), US West (N. California), US West (Oregon), Africa (Cape Town), Asia Pacific (Hong Kong), Asia Pacific (Jakarta), Asia Pacific (Mumbai), Asia Pacific (Osaka), Asia Pacific (Seoul), Asia Pacific (Singapore), Asia Pacific (Sydney), Asia Pacific (Tokyo), Canada (Central), Europe (Frankfurt), Europe (Ireland), Europe (London), Europe (Milan), Europe (Paris), Europe (Stockholm), Middle East (Bahrain), and South America (São Paulo) AWS Regions.

Amazon CloudWatch Logs data protection pricing is based on the amount of data that is scanned for masking. You can check the CloudWatch Logs pricing page to learn more about the pricing of this feature in your Region.

Learn more about data protection on the CloudWatch Logs User Guide.

Marcia

New – Amazon CloudWatch Cross-Account Observability

Post Syndicated from Danilo Poccia original https://aws.amazon.com/blogs/aws/new-amazon-cloudwatch-cross-account-observability/

Deploying applications using multiple AWS accounts is a good practice to establish security and billing boundaries between teams and reduce the impact of operational events. When you adopt a multi-account strategy, you have to analyze telemetry data that is scattered across several accounts. To give you the flexibility to monitor all the components of your applications from a centralized view, we are introducing today Amazon CloudWatch cross-account observability, a new capability to search, analyze, and correlate cross-account telemetry data stored in CloudWatch such as metrics, logs, and traces.

You can now set up a central monitoring AWS account and connect your other accounts as sources. Then, you can search, audit, and analyze logs across your applications to drill down into operational issues in a matter of seconds. You can discover and visualize metrics from many accounts in a single place and create alarms that evaluate metrics belonging to other accounts. You can start with an aggregated cross-account view of your application to visually identify the resources exhibiting errors and dive deep into correlated traces, metrics, and logs to find the root cause. This seamless cross-account data access and navigation helps reduce the time and effort required to troubleshoot issues.

Let’s see how this works in practice.

Configuring CloudWatch Cross-Account Observability
To enable cross-account observability, CloudWatch has introduced the concept of monitoring and source accounts:

  • A monitoring account is a central AWS account that can view and interact with observability data shared by other accounts.
  • A source account is an individual AWS account that shares observability data and resources with one or more monitoring accounts.

You can configure multiple monitoring accounts with the level of visibility you need. CloudWatch cross-account observability is also integrated with AWS Organizations. For example, I can have a monitoring account with wide access to all accounts in my organization for central security and operational teams and then configure other monitoring accounts with more restricted visibility across a business unit for individual service owners.

First, I configure the monitoring account. In the CloudWatch console, I choose Settings in the navigation pane. In the Monitoring account configuration section, I choose Configure.

Console screenshot.

Now I can choose which telemetry data can be shared with the monitoring account: Logs, Metrics, and Traces. I leave all three enabled.

Console screenshot.

To list the source accounts that will share data with this monitoring account, I can use account IDs, organization IDs, or organization paths. I can use an organization ID to include all the accounts in the organization or an organization path to include all the accounts in a department or business unit. In my case, I have only one source account to link, so I enter the account ID.

Console screenshot.

When using the CloudWatch console in the monitoring account to search and display telemetry data, I see the account ID that shared that data. Because account IDs are not easy to remember, I can display a more descriptive “account label.” When configuring the label via the console, I can choose between the account name or the email address used to identify the account. When using an email address, I can also choose whether to include the domain. For example, if all the emails used to identify my accounts are using the same domain, I can use as labels the email addresses without that domain.

There is a quick reminder that cross-account observability only works in the selected Region. If I have resources in multiple Regions, I can configure cross-account observability in each Region. To complete the configuration of the monitoring account, I choose Configure.

Console screenshot.

The monitoring account is now enabled, and I choose Resources to link accounts to determine how to link my source accounts.

Console screenshot.

To link source accounts in an AWS organization, I can download an AWS CloudFormation template to be deployed in a CloudFormation delegated administration account.

To link individual accounts, I can either download a CloudFormation template to be deployed in each account or copy a URL that helps me use the console to set up the accounts. I copy the URL and paste it into another browser where I am signed in as the source account. Then, I can configure which telemetry data to share (logs, metrics, or traces). The Amazon Resource Name (ARN) of the monitoring account configuration is pre-filled because I copy-pasted the URL in the previous step. If I don’t use the URL, I can copy the ARN from the monitoring account and paste it here. I confirm the label used to identify my source account and choose Link.

In the Confirm monitoring account permission dialog, I type Confirm to complete the configuration of the source account.

Using CloudWatch Cross-Account Observability
To see how things work with cross-account observability, I deploy a simple cross-account application using two AWS Lambda functions, one in the source account (multi-account-function-a) and one in the monitoring account (multi-account-function-b). When triggered, the function in the source account publishes an event to an Amazon EventBridge event bus in the monitoring account. There, an EventBridge rule triggers the execution of the function in the monitoring account. This is a simplified setup using only two accounts. You’d probably have your workloads running in multiple source accounts.Architectural diagram.

In the Lambda console, the two Lambda functions have Active tracing and Enhanced monitoring enabled. To collect telemetry data, I use the AWS Distro for OpenTelemetry (ADOT) Lambda layer. The Enhanced monitoring option turns on Amazon CloudWatch Lambda Insights to collect and aggregate Lambda function runtime performance metrics.

Console screenshot.

I prepare a test event in the Lambda console of the source account. Then, I choose Test and run the function a few times.

Console screenshot.

Now, I want to understand what the components of my application, running in different accounts, are doing. I start with logs and then move to metrics and traces.

In the CloudWatch console of the monitoring account, I choose Log groups in the Logs section of the navigation pane. There, I search for and find the log groups created by the two Lambda functions running in different AWS accounts. As expected, each log group shows the account ID and label originating the data. I select both log groups and choose View in Logs Insights.

Console screenshot.

I can now search and analyze logs from different AWS accounts using the CloudWatch Logs Insights query syntax. For example, I run a simple query to see the last twenty messages in the two log groups. I include the @log field to see the account ID that the log belongs to.

Console screenshot.

I can now also create Contributor Insights rules on cross-account log groups. This enables me, for example, to have a holistic view of what security events are happening across accounts or identify the most expensive Lambda requests in a serverless application running in multiple accounts.

Then, I choose All metrics in the Metrics section of the navigation pane. To see the Lambda function runtime performance metrics collected by CloudWatch Lambda Insights, I choose LambdaInsights and then function_name. There, I search for multi-account and memory to see the memory metrics. Again, I see the account IDs and labels that tell me that these metrics are coming from two different accounts. From here, I can just select the metrics I am interested in and create cross-account dashboards and alarms. With the metrics selected, I choose Add to dashboard in the Actions dropdown.

Console screenshot.

I create a new dashboard and choose the Stacked area widget type. Then, I choose Add to dashboard.

Console screenshot.

I do the same for the CPU and memory metrics (but using different widget types) to quickly create a cross-account dashboard where I can keep under control my multi-account setup. Well, there isn’t a lot of traffic yet but I am hopeful.

Console screenshot.

Finally, I choose Service map from the X-Ray traces section of the navigation pane to see the flow of my multi-account application. In the service map, the client triggers the Lambda function in the source account. Then, an event is sent to the other account to run the other Lambda function.

Console screenshot.

In the service map, I select the gear icon for the function running in the source account (multi-account-function-a) and then View traces to look at the individual traces. The traces contain data from multiple AWS accounts. I can search for traces coming from a specific account using a syntax such as:

service(id(account.id: "123412341234"))

Console screenshot.

The service map now stitches together telemetry from multiple accounts in a single place, delivering a consolidated view to monitor their cross-account applications. This helps me to pinpoint issues quickly and reduces resolution time.

Availability and Pricing
Amazon CloudWatch cross-account observability is available today in all commercial AWS Regions using the AWS Management Console, AWS Command Line Interface (CLI), and AWS SDKs. AWS CloudFormation support is coming in the next few days. Cross-account observability in CloudWatch comes with no extra cost for logs and metrics, and the first trace copy is free. See the Amazon CloudWatch pricing page for details.

Having a central point of view to monitor all the AWS accounts that you use gives you a better understanding of your overall activities and helps solve issues for applications that span multiple accounts.

Start using CloudWatch cross-account observability to monitor all your resources.

Danilo

New for AWS Backup – Protect and Restore Your CloudFormation Stacks

Post Syndicated from Danilo Poccia original https://aws.amazon.com/blogs/aws/new-for-aws-backup-protect-and-restore-your-cloudformation-stacks/

To define the data protection policy of an application, you have to look at its components and find which ones store data that needs to be protected. Those are the stateful components of your application, such as databases and file systems. Other components don’t store data but need to be restored as well in case of issues. These are stateless components, such as containers and their network configurations.

When you manage your application using infrastructure as code (IaC), you have a single repository where all these components are described. Can we use this information to help protect your applications? Yes! AWS Backup now supports attaching an AWS CloudFormation stack to your data protection policies.

When you use CloudFormation as a resource, all stateful components supported by AWS Backup are backed up around the same time. The backup also includes the stateless resources in the stack, such as AWS Identity and Access Management (IAM) roles and Amazon Virtual Private Cloud (Amazon VPC) security groups. This gives you a single recovery point that you can use to recover the application stack or the individual resources you need. In case of recovery, you don’t need to mix automated tools with custom scripts and manual activities to recover and put the whole application stack back together. As you modernize and update an application managed with CloudFormation, AWS Backup automatically keeps track of changes and updates the data protection policies for you.

CloudFormation support for AWS Backup also helps you prove compliance of your data protection policies. You can monitor your application resources in AWS Backup Audit Manager, a feature of AWS Backup that enables you to audit and report on the compliance of data protection policies. You can also use AWS Backup Vault Lock to manage the immutability of your backups as required by your compliance obligations.

Let’s see how this works in practice.

Using AWS Backup Support for CloudFormation Stacks
First, I need to turn on the CloudFormation resource type for AWS Backup. In the AWS Backup console, I choose Settings in the navigation pane and then, in the Service opt-in section, Configure resources. There, I toggle the CloudFormation resource type on and choose Confirm.

Console screenshot.

Now that CloudFormation support is enabled, I choose Dashboard in the navigation pane and then Create backup plan. I select the Start with a template option and then the Daily-35day-Retention template. As the name suggests, this template creates daily backups that are kept for 35 days before being automatically deleted. I enter a name for the backup plan and choose Create plan.

Console screenshot.

Now I can assign resources to my backup plan. I enter a resource assignment name and use the default IAM role that is automatically created with the correct permissions.

Console screenshot.

In the Resource selection, I can select Include all resource types to automatically protect all resource types that are enabled in my account. Because I’d like to show how CloudFormation support works, I select Include specific resource types and then CloudFormation in the Select resource types dropdown menu. In the Choose resources menu, I can use the All supported CloudFormation stacks option to have all my stacks protected. For simplicity, I choose to protect only one stack, the my-app stack.

Console screenshot.

I leave the other options at their default values and choose Assign resources. That’s all! Now the CloudFormation stack that I selected will be backed up daily with 35 days of retention. What does that mean? Let’s have a look at what happens when I create an on-demand backup of a CloudFormation stack.

Creating On-Demand Backups for CloudFormation Stacks
I choose Protected resources in the navigation pane and then Create on-demand backup. The next steps are similar to what I did before when assigning resources to a backup plan. I select the CloudFormation resource type and the my-app stack. I use the Create backup now option to start the backup within one hour. I choose 7 days of retention and the Default backup vault. Backup vaults are logical containers that store and organize your backups. I select the default IAM role and choose Create on-demand backup.

Console screenshot.

Within a few minutes, the backup job is running. I expand the Backup job ID in the Backup jobs list to see the resources being backed up. The stateful resources (such as Amazon DynamoDB tables and Amazon Relational Database Service (RDS) databases) are listed with the current state of the backup job. The stateless resources in my stack (such as IAM roles, AWS Lambda functions, and VPC configurations) are backed up by the job with the CloudFormation resource type.

Console screenshot.

When the backup job has completed, I go back to the Protected resources page to see the list of resources that I can now restore. In the list, I see the IDs of the stateful resources (in this case, two DynamoDB tables and an Aurora database) and of the CloudFormation stack. If I choose each of the stateful resources, I see the available recovery points corresponding to the different points in time when that resource has been backed up.

Console screenshot.

If I choose the CloudFormation stack, I get a list of composite recovery points. Each composite recovery point includes all stateless and stateful resources in the stack. More specifically, the stateless resources are included in the CloudFormation template recovery point (the last one in the following screenshot).

Console screenshot.

Restoring a CloudFormation Backup
Inside the composite recovery point, I select the recovery point of the CloudFormation stack and choose Restore. Restoring a CloudFormation stack backup creates a new stack with a change set that represents the backup. I enter the new stack and change set names and choose Restore backup. After a few minutes, the restore job is completed.

In the CloudFormation console, the new stack is under review. I need to apply the change set.

Console screenshot.

I choose the new stack and select the change set created by the restore job to apply the change set.

Console screenshot.

After some time, the resources in my original stack have been recreated in the new stack. The stateful resources have been recreated empty. To recover the stateful resources, I can go back to the list of recovery points, select the recovery point I need, and initiate a restore.

Availability and Pricing
AWS Backup support for CloudFormation stacks is available today using the console, AWS Command Line Interface (CLI), and AWS SDKs in all AWS Regions where AWS Backup is offered. There is no additional cost for the stateless resources backed up and restored by AWS Backup. You only pay for the stateful resources such as databases, storage volumes, or file systems. For more information, see AWS Backup pricing.

You now have an automated solution to create and restore your applications with a simplified experience, eliminating the need to manage custom scripts.

Danilo

Introducing AWS Resource Explorer – Quickly Find Resources in Your AWS Account

Post Syndicated from Danilo Poccia original https://aws.amazon.com/blogs/aws/introducing-aws-resource-explorer-quickly-find-resources-in-your-aws-account/

Looking for a specific Amazon Elastic Compute Cloud (Amazon EC2) instance, Amazon Elastic Container Service (Amazon ECS) task, or Amazon CloudWatch log group can take some time, especially if you have many resources and use multiple AWS Regions.

Today, we’re making that easier. Using the new AWS Resource Explorer, you can search through the AWS resources in your account across Regions using metadata such as names, tags, and IDs. When you find a resource in the AWS Management Console, you can quickly go from the search results to the corresponding service console and Region to start working on that resource. In a similar way, you can use the AWS Command Line Interface (CLI) or any of the AWS SDKs to find resources in your automation tools.

Let’s see how this works in practice.

Using AWS Resource Explorer
To start using Resource Explorer, I need to turn it on so that it creates and maintains the indexes that will provide fast responses to my search queries. Usually, the administrator of the account is the one taking these steps so that authorized users in that account can start searching.

To run a query, I need a view that gives access to an index. If the view is using an aggregator index, then the query can search across all indexed Regions.

Aggregator index diagram.

If the view is using a local index, then the query has access only to the resources in that Region.

Local index diagram.

I can control the visibility of resources in my account by creating views that define what resource information is available for search and discovery. These controls are not based only on resources but also on the information that resources bring. For example, I can give access to the Amazon Resource Names (ARNs) of all resources but not to their tags which might contain information that I want to keep confidential.

In the Resource Explorer console, I choose Enable Resource Explorer. Then, I select the Quick setup option to have visibility for all supported resources within my account. This option creates local indexes in all Regions and an aggregator index in the selected Region. A default view with a filter that includes all supported resources in the account is also created in the same Region as the aggregator index.

Console screenshot.

With the Advanced setup option, I have access to more granular controls that are useful when there are specific governance requirements. For example, I can select in which Regions to create indexes. I can choose not to replicate resource information to any other Region so that resources from each AWS Region are searchable only from within the same Region. I can also control what information is available in the default view or avoid the creation of the default view.

With the Quick setup option selected, I choose Go to Resource Explorer. A quick overview shows the progress of enabling Resource Explorer across Regions. After the indexes have been created, it can take up to 36 hours to index all supported resources, and search results might be incomplete until then. When resources are created or deleted, your indexes are automatically updated. These updates are asynchronous, so it can take some time (usually a few minutes) to see the changes.

Searching With AWS Resource Explorer
After resources have been indexed, I choose Proceed to resource search. In the Search criteria, I choose which View to use. Currently, I have the default view selected. Then, I start typing in the Query field to search through the resources in my AWS account across all Regions. For example, I have an application where I used the convention to start resource names with my-app. For the resources I created manually, I also added the Project tag with value MyApp.

To find the resource of this application, I start by searching for my-app.

Console screenshot.

The results include resources from multiple services and Regions and global resources from AWS Identity and Access Management (IAM). I have a service, tasks, and a task definition from Amazon ECS, roles and policies from AWS IAM, log groups from CloudWatch. Optionally, I can filter results by Region or resource type. If I choose any of the listed resources, the link will bring me to the corresponding service console and Region with the resource selected.

Console screenshot.

To look for something in a specific Region, such as Europe (Ireland), I can restrict the results by adding region:eu-west-1 to the query.

Console screenshot.

I can further restrict results to Amazon ECS resources by adding service:ecs to the query. Now I only see the ECS cluster, service, tasks, and task definition in Europe (Ireland). That’s the task definition I was looking for!

Console screenshot.

I can also search using tags. For example, I can see the resources where I added the MyApp tag by including tag.value:MyApp in a query. To specify the actual key-value pair of the tag, I can use tag:Project=MyApp.

Console screenshot.

Creating a Custom View
Sometimes you need to control the visibility of the resources in your account. For example, all the EC2 instances used for development in my account are in US West (Oregon). I create a view for the development team by choosing a specific Region (us-west-2) and filtering the results with service:ec2 in the query. Optionally, I could further filter results based on resource names or tags. For example, I could add tag:Environment=Dev to only see resources that have been tagged to be in a development environment.

Console screenshot.

Now I allow access to this view to users and roles used by the development team. To do so, I can attach an identity-based policy to the users and roles of the development team. In this way, they can only explore and search resources using this view.

Console screenshot.

Unified Search in the AWS Management Console
After I turn Resource Explorer on, I can also search through my AWS resources in the search bar at the top of the Management Console. We call this capability unified search as it gives results that include AWS services, features, blogs, documentation, tutorial, events, and more.

To focus my search on AWS resources, I add /Resources at the beginning of my search.

Console screenshot.

Note that unified search automatically inserts a wildcard character (*) at the end of the first keyword in the string. This means that unified search results include resources that match any string that starts with the specified keyword.

Console screenshot.

The search performed by the Query text box on the Resource search page in the Resource Explorer console does not automatically append a wildcard character but I can do it manually after any term in the search string to have similar results.

Unified search works when I have the default view in the same Region that contains the aggregator index. To check if unified search works for me, I look at the top of the Settings page.

Console screenshot.

Availability and Pricing
You can start using AWS Resource Explorer today with a global console and via the AWS Command Line Interface (CLI) and the AWS SDKs. AWS Resource Explorer is available at no additional charge. Using Resource Explorer makes it much faster to find the resources you need and use them in your automation processes and in their service console.

Discover and access your AWS resources across all the Regions you use with AWS Resource Explorer.

Danilo

Using CloudFormation events to build custom workflows for post provisioning management

Post Syndicated from Vivek Kumar original https://aws.amazon.com/blogs/devops/using-cloudformation-events-to-build-custom-workflows-for-post-provisioning-management/

Over one million active customers manage application resources with AWS CloudFormation every week. CloudFormation is a service that helps you model, provision, and manage your cloud resources by treating Infrastructure as Code (IaC). It can simplify infrastructure management, quickly replicate your environment to multiple AWS regions with a single turn-key solution, and let you easily control and track changes in your infrastructure.

You can create various AWS resources using CloudFormation to setup an environment for your workloads. You continue to interact with and manage those resources throughout the workload lifecycle to make sure the resource configuration is aligned with business objectives such as adhering to security compliance standards, meeting required reliability targets, and aligning with budget requirements. The inability to perform a hand-off between resource provisioning actions in CloudFormation and resource management actions in other relevant AWS and non-AWS services poses a challenge. For example, after provisioning of resources, customers might need to perform additional tasks to manage these resources such as adding cost allocation tags, populating resource inventory database or trigger downstream processes.

While they are able to obtain the logical resource grouping that is tied to a workload or a workload component with a CloudFormation stack, that context does not extend beyond CloudFormation for the most part when they use various AWS and non-AWS services to conduct post-provisioning resource management. These AWS and non-AWS services typically offer a resource level view, or in some cases offer basic aggregated views such as supporting a tag group, or an account level abstraction to see all resources in a given account. For a CloudFormation customer, the inability to not have the context of a stack beyond resource provisioning provides a disjointed experience given there is no hand-off between resource provisioning actions in CloudFormation and resource management actions in other relevant AWS and non-AWS services. The various management actions customers take with their workload resources through out their lifecycle are

CloudFormation events provide a robust way to track the status of individual resources during the lifecycle of a stack. You can send CloudFormation events to Amazon EventBridge whenever a create, update,  or drift detection action is performed on your stack. Then you can set up additional workflows based on those events from EventBridge. For example, by tagging the resources automatically, you can reference that tag group when using AWS Trusted Advisor, and continue your resource management experience post-provisioning. CloudFormation sends these events to EventBridge automatically so that you don’t need to do anything. One real-world use case is to use these events to create actionable tasks for your teams to troubleshoot issues. CloudFormation events published to EventBridge can be used to create OpsItems within AWS Systems Manager OpsCenter. OpsItems are the work items created in OpsCenter for engineers to view, investigate and remediate tasks/issues. This enables teams to respond and resolve any issues more efficiently.

Walkthrough

To set up the EventBridge rule, go to the AWS console and navigate to EventBridge. Select on Create Rule to get started. Enter Name, description and select Next:

Create Rule

On the next screen, select AWS events in the Event source section.

This sample event is for the CREATE_COMPLETE event. It contains the source, AWS account number, AWS region, event type, resources and details about the event.

On the same page in the Event pattern section:

Select Custom patterns (JSON editor) and enter the following event pattern. This will match any events when a resource fails to create, update, or delete. Learn more about EventBridge event patterns.

{
    "source": [
        "aws.cloudformation"
    ],
    "detail-type": [
        "CloudFormation Resource Status Change"
    ],
    "detail": {
        "status-details": {
            "status": [
                "CREATE_FAILED",
                "UPDATE_FAILED",
                "DELETE_FAILED"
            ]
        }
    }
}

Custom patterns - JSON editor

Select Next. On the Target screen, select AWS service, then select System Manager OpsItem as the target for this rule.

Target 1

Add a second target – an Amazon Simple Notification Service (SNS) Topic – to notify the Ops team whenever a failure occurs and an OpsItem has been created.

Target 2

Select Next and optionally add tags.

Select next to review the selections, and select Create rule.

Now your rule is created and whenever a stack failure occurs, an OpsItem gets created and a notification is sent out for the operators to troubleshoot and fix the issue. The OpsItem contains operational data, such as the resource that failed, the reason for failure, as well as the stack to which it belongs, which is useful for troubleshooting the issue. Operators can take manual actions or use runbooks codified as Systems Manager Documents to take corrective actions. From the AWS Console you can go to OpsCenter to see the events:

operational data

Once the issues have been addressed, operators can mark the OpsItem as resolved, and retry the stack operation that failed, resulting in a swift resolution of the issue, and preventing duplication of efforts.

This walkthrough is for the Console but you can use AWS Command Line Interface (AWS CLI), AWS SDK or even CloudFormation to accomplish all of this. Refer to AWS CLI documentation for more information on creating EventBridge rules through CLI. Furthermore, refer to AWS SDK documentation for creating EventBridge rules through AWS SDK. You can use following CloudFormation template to deploy the EventBridge rules example used as part of the walkthrough in this blog post:

{
	"Parameters": {
		"SNSTopicARN": {
			"Type": "String",
			"Description": "Enter the ARN of the SNS Topic where you want stack failure notifications to be sent."
		}
	},
	"Resources": {
		"CFNEventsRule": {
			"Type": "AWS::Events::Rule",
			"Properties": {
				"Description": "Event rule to capture CloudFormation failure events",
				"EventPattern": {
					"source": [
						"aws.cloudformation"
					],
					"detail-type": [
						"CloudFormation Resource Status Change"
					],
					"detail": {
						"status-details": {
							"status": [
								"CREATE_FAILED",
								"UPDATE_FAILED",
								"DELETE_FAILED"
							]
						}
					}
				},
				"Name": "cfn-stack-failure-test",
				"State": "ENABLED",
				"Targets": [
					{
						"Arn": {
							"Fn::Sub": "arn:aws:ssm:${AWS::Region}:${AWS::AccountId}:opsitem"
						},
						"Id": "opsitems",
						"RoleArn": {
							"Fn::GetAtt": [
								"TargetInvocationRole",
								"Arn"
							]
						}
					},
					{
						"Arn": {
							"Ref": "SNSTopicARN"
						},
						"Id": "sns"
					}
				]
			}
		},
		"TargetInvocationRole": {
			"Type": "AWS::IAM::Role",
			"Properties": {
				"AssumeRolePolicyDocument": {
					"Version": "2012-10-17",
					"Statement": [
						{
							"Effect": "Allow",
							"Principal": {
								"Service": [
									"events.amazonaws.com"
								]
							},
							"Action": [
								"sts:AssumeRole"
							]
						}
					]
				},
				"Path": "/",
				"Policies": [
					{
						"PolicyName": "createopsitem",
						"PolicyDocument": {
							"Version": "2012-10-17",
							"Statement": [
								{
									"Effect": "Allow",
									"Action": [
										"ssm:CreateOpsItem"
									],
									"Resource": "*"
								}
							]
						}
					}
				]
			}
		},
		"AllowSNSPublish": {
			"Type": "AWS::SNS::TopicPolicy",
			"Properties": {
				"PolicyDocument": {
					"Statement": [
						{
							"Sid": "grant-eventbridge-publish",
							"Effect": "Allow",
							"Principal": {
								"Service": "events.amazonaws.com"
							},
							"Action": [
								"sns:Publish"
							],
							"Resource": {
								"Ref": "SNSTopicARN"
							}
						}
					]
				},
				"Topics": [
					{
						"Ref": "SNSTopicARN"
					}
				]
			}
		}
	}
}

Summary

Responding to CloudFormation stack events becomes easy with the integration between CloudFormation and EventBridge. CloudFormation events can be used to perform post-provisioning actions on workload resources. With the variety of targets available to EventBridge rules, various actions such as adding tags and, troubleshooting issues can be performed. This example above uses Systems Manager and Amazon SNS but you can have numerous targets including, Amazon API gateway, AWS Lambda, Amazon Elastic Container Service (Amazon ECS) task, Amazon Kinesis services, Amazon Redshift, Amazon SageMaker pipeline, and many more. These events are available for free in EventBridge.

Learn more about Managing events with CloudFormation and EventBridge.

About the Author

Vivek is a Solutions Architect at AWS based out of New York. He works with customers providing technical assistance and architectural guidance on various AWS services. He brings more than 25 years of experience in software engineering and architecture roles for various large-scale enterprises.


Mahanth is a Solutions Architect at Amazon Web Services (AWS). As part of the AWS Well-Architected team, he works with customers and AWS Partner Network partners of all sizes to help them build secure, high-performing, resilient, and efficient infrastructure for their applications. He spends his free time playing with his pup Cosmo, learning more about astronomy, and is an avid gamer.


Sukhchander is a Solutions Architect at Amazon Web Services. He is passionate about helping startups and enterprises adopt the cloud in the most scalable, secure, and cost-effective way by providing technical guidance, best practices, and well architected solutions.

Deploy and manage OpenAPI/Swagger RESTful APIs with the AWS Cloud Development Kit

Post Syndicated from Luke Popplewell original https://aws.amazon.com/blogs/devops/deploy-and-manage-openapi-swagger-restful-apis-with-the-aws-cloud-development-kit/

This post demonstrates how AWS Cloud Development Kit (AWS CDK) Infrastructure as Code (IaC) constructs and AWS serverless technology can be used to build and deploy a RESTful Application Programming Interface (API) defined in the OpenAPI specification. This post uses an example API that describes  Widget resources and demonstrates how to use an AWS CDK Pipeline to:

  • Deploy a RESTful API stage to Amazon API Gateway from an OpenAPI specification.
  • Build and deploy an AWS Lambda function that contains the API functionality.
  • Auto-generate API documentation and publish it to an Amazon Simple Storage Service (Amazon S3)-hosted website served by the Amazon CloudFront content delivery network (CDN) service. This provides technical and non-technical stakeholders with versioned, current, and accessible API documentation.
  • Auto-generate client libraries for invoking the API and deploy them to AWS CodeArtifact, which is a fully-managed artifact repository service. This allows API client development teams to integrate with different versions of the API in different environments.

The diagram shown in the following figure depicts the architecture of the AWS services and resources described in this post.

 The architecture described in this post consists of an AWS CodePipeline pipeline, provisioned using the AWS CDK, that deploys the Widget API to AWS Lambda and API Gateway. The pipeline then auto-generates the API’s documentation as a website served by CloudFront and deployed to S3. Finally, the pipeline auto-generates a client library for the API and deploys this to CodeArtifact.

Figure 1 – Architecture

The code that accompanies this post, written in Java, is available here.

Background

APIs must be understood by all stakeholders and parties within an enterprise including business areas, management, enterprise architecture, and other teams wishing to consume the API. Unfortunately, API definitions are often hidden in code and lack up-to-date documentation. Therefore, they remain inaccessible for the majority of the API’s stakeholders. Furthermore, it’s often challenging to determine what version of an API is present in different environments at any one time.

This post describes some solutions to these issues by demonstrating how to continuously deliver up-to-date and accessible API documentation, API client libraries, and API deployments.

AWS CDK

The AWS CDK is a software development framework for defining cloud IaC and is available in multiple languages including TypeScript, JavaScript, Python, Java, C#/.Net, and Go. The AWS CDK Developer Guide provides best practices for using the CDK.

This post uses the CDK to define IaC in Java which is synthesized to a cloud assembly. The cloud assembly includes one to many templates and assets that are deployed via an AWS CodePipeline pipeline. A unit of deployment in the CDK is called a Stack.

OpenAPI specification (formerly Swagger specification)

OpenAPI specifications describe the capabilities of an API and are both human and machine-readable. They consist of definitions of API components which include resources, endpoints, operation parameters, authentication methods, and contact information.

Project composition

The API project that accompanies this post consists of three directories:

  • app
  • api
  • cdk

app directory

This directory contains the code for the Lambda function which is invoked when the Widget API is invoked via API Gateway. The code has been developed in Java as an Apache Maven project.

The Quarkus framework has been used to define a WidgetResource class (see src/main/java/aws/sample/blog/cdkopenapi/app/WidgetResources.java ) that contains the methods that align with HTTP Methods of the Widget API.
api directory

The api directory contains the OpenAPI specification file ( openapi.yaml ). This file is used as the source for:

  • Defining the REST API using API Gateway’s support for OpenApi.
  • Auto-generating the API documentation.
  • Auto-generating the API client artifact.

The api directory also contains the following files:

  • openapi-generator-config.yaml : This file contains configuration settings for the OpenAPI Generator framework, which is described in the section CI/CD Pipeline.
  • maven-settings.xml: This file is used support the deployment of the generated SDKs or libraries (Apache Maven artifacts) for the API and is described in the CI/CD Pipeline section of this post.

This directory contains a sub directory called docker . The docker directory contains a Dockerfile which defines the commands for building a Docker image:

FROM ruby:2.6.5-alpine
 
RUN apk update \
 && apk upgrade --no-cache \
 && apk add --no-cache --repository http://dl-cdn.alpinelinux.org/alpine/v3.14/main/ nodejs=14.20.0-r0 npm \
 && apk add git \
 && apk add --no-cache build-base
 
# Install Widdershins node packages and ruby gem bundler 
RUN npm install -g widdershins \
 && gem install bundler 
 
# working directory
WORKDIR /openapi
 
# Clone and install the Slate framework
RUN git clone https://github.com/slatedocs/slate
RUN cd slate \
 && bundle install

The Docker image incorporates two open source projects, the NodeJS Widdershins library and the Ruby Slate-framework. These are used together to auto-generate the documentation for the API from the OpenAPI specification.  This Dockerfile is referenced and built by the  ApiStack class, which is described in the CDK Stacks section of this post.

cdk directory

This directory contains an Apache Maven Project developed in Java for provisioning the CDK stacks for the  Widget API.

Under the  src/main/java  folder, the package  aws.sample.blog.cdkopenapi.cdk  contains the files and classes that define the application’s CDK stacks and also the entry point (main method) for invoking the stacks from the CDK Toolkit CLI:

  • CdkApp.java: This file contains the  CdkApp class which provides the main method that is invoked from the AWS CDK Toolkit to build and deploy the  application stacks.
  • ApiStack.java: This file contains the   ApiStack class which defines the  OpenApiBlogAPI   stack and is described in the CDK Stacks section of this post.
  • PipelineStack.java: This file contains the   PipelineStack class which defines the OpenAPIBlogPipeline  stack and is described in the CDK Stacks section of this post.
  • ApiStackStage.java: This file contains the  ApiStackStage class which defines a CDK stage. As detailed in the CI/CD Pipeline section of this post, a DEV stage, containing the  OpenApiBlogAPI stack resources for a DEV environment, is deployed from the  OpenApiBlogPipeline pipeline.

CDK stacks

ApiStack

Note that the CDK bundling functionality is used at multiple points in the  ApiStack  class to produce CDK Assets. The post, Building, bundling, and deploying applications with the AWS CDK, provides more details regarding using CDK bundling mechanisms.

The  ApiStack  class defines multiple resources including:

  • Widget API Lambda function: This is bundled by the CDK in a Docker container using the Java 11 runtime image.
  • Widget  REST API on API Gateway: The REST API is created from an Inline API Definition which is passed as an S3 CDK Asset. This asset includes a reference to the  Widget API OpenAPI specification located under the  api folder (see  api/openapi.yaml ) and builds upon the SpecRestApi construct and API Gateway’s support for OpenApi.
  • API documentation Docker Image Asset: This is the Docker image that contains the open source frameworks (Widdershins and Slate) that are leveraged to generate the API documentation.
  • CDK Asset bundling functionality that leverages the API documentation Docker image to auto-generate documentation for the API.
  • An S3 Bucket for holding the API documentation website.
  • An origin access identity (OAI) which allows CloudFront to securely serve the S3 Bucket API documentation content.
  • A CloudFront distribution which provides CDN functionality for the S3 Bucket website.

Note that the  ApiStack class features the following code which is executed on the  Widget API Lambda construct:

CfnFunction apiCfnFunction = (CfnFunction)apiLambda.getNode().getDefaultChild();
apiCfnFunction.overrideLogicalId("APILambda");

The CDK, by default, auto-assigns an ID for each defined resource but in this case the generated ID is being overridden with “APILambda”. The reason for this is that inside of the  Widget API OpenAPI specification (see  api/openapi.yaml ), there is a reference to the Lambda function by name (“APILambda”) so that the function can be integrated as a proxy for each listed API path and method combination. The OpenAPI specification includes this name as a variable to derive the Amazon Resource Name (ARN) for the Lambda function:
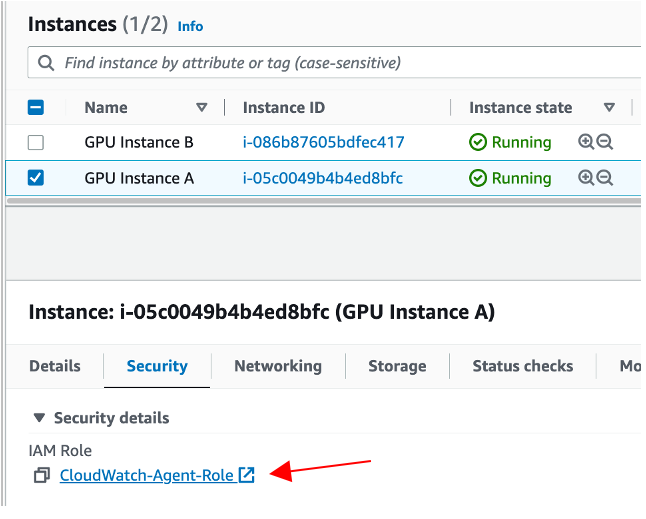
uri:
	Fn::Sub: "arn:aws:apigateway:${AWS::Region}:lambda:path/2015-03-31/functions/${APILambda.Arn}/invocations"

PipelineStack

The  PipelineStack class defines a CDK CodePipline construct which is a higher level construct and pattern. Therefore, the construct doesn’t just map directly to a single CloudFormation resource, but provisions multiple resources to fulfil the requirements of the pattern. The post, CDK Pipelines: Continuous delivery for AWS CDK applications, provides more detail on creating pipelines with the CDK.

final CodePipeline pipeline = CodePipeline.Builder.create(this, "OpenAPIBlogPipeline")
.pipelineName("OpenAPIBlogPipeline")
.selfMutation(true)
      .dockerEnabledForSynth(true)
      .synth(synthStep)
      .build();

CI/CD pipeline

The diagram in the following figure shows the multiple CodePipeline stages and actions created by the CDK CodePipeline construct that is defined in the PipelineStack class.

The CI/CD pipeline’s stages include the Source stage, the Synth stage, the Update pipeline, the Assets stage, and the DEV stage.

Figure 2 – CI/CD Pipeline

The stages defined include the following:

  • Source stage: The pipeline is passed the source code contents from this stage.
  • Synth stage: This stage consists of a Synth Action that synthesizes the CloudFormation templates for the application’s CDK stacks and compiles and builds the project Lambda API function.
  • Update Pipeline stage: This stage checks the OpenAPIBlogPipeline stack and reinitiates the pipeline when changes to its definition have been deployed.
  • Assets stage: The application’s CDK stacks produce multiple file assets (for example, zipped Lambda code) which are published to Amazon S3. Docker image assets are published to a managed CDK framework Amazon Elastic Container Registry (Amazon ECR) repository.
  • DEV stage: The API’s CDK stack ( OpenApiBlogAPI ) is deployed to a hypothetical development environment in this stage. A post stage deployment action is also defined in this stage. Through the use of a CDK ShellStep construct, a Bash script is executed that deploys a generated client Java Archive (JAR) for the Widget API to CodeArtifact. The script employs the OpenAPI Generator project for this purpose:
CodeBuildStep codeArtifactStep = CodeBuildStep.Builder.create("CodeArtifactDeploy")
    .input(pipelineSource)
    .commands(Arrays.asList(
           	"echo $REPOSITORY_DOMAIN",
           	"echo $REPOSITORY_NAME",
           	"export CODEARTIFACT_TOKEN=`aws codeartifact get-authorization-token --domain $REPOSITORY_DOMAIN --query authorizationToken --output text`",
           	"export REPOSITORY_ENDPOINT=$(aws codeartifact get-repository-endpoint --domain $REPOSITORY_DOMAIN --repository $REPOSITORY_NAME --format maven | jq .repositoryEndpoint | sed 's/\\\"//g')",
           	"echo $REPOSITORY_ENDPOINT",
           	"cd api",
           	"wget -q https://repo1.maven.org/maven2/org/openapitools/openapi-generator-cli/5.4.0/openapi-generator-cli-5.4.0.jar -O openapi-generator-cli.jar",
     	          "cp ./maven-settings.xml /root/.m2/settings.xml",
        	          "java -jar openapi-generator-cli.jar batch openapi-generator-config.yaml",
                    "cd client",
                    "mvn --no-transfer-progress deploy -DaltDeploymentRepository=openapi--prod::default::$REPOSITORY_ENDPOINT"
))
      .rolePolicyStatements(Arrays.asList(codeArtifactStatement, codeArtifactStsStatement))
.env(new HashMap<String, String>() {{
      		put("REPOSITORY_DOMAIN", codeArtifactDomainName);
            	put("REPOSITORY_NAME", codeArtifactRepositoryName);
       }})
      .build();

Running the project

To run this project, you must install the AWS CLI v2, the AWS CDK Toolkit CLI, a Java/JDK 11 runtime, Apache Maven, Docker, and a Git client. Furthermore, the AWS CLI must be configured for a user who has administrator access to an AWS Account. This is required to bootstrap the CDK in your AWS account (if not already completed) and provision the required AWS resources.

To build and run the project, perform the following steps:

  1. Fork the OpenAPI blog project in GitHub.
  2. Open the AWS Console and create a connection to GitHub. Note the connection’s ARN.
  3. In the Console, navigate to AWS CodeArtifact and create a domain and repository.  Note the names used.
  4. From the command line, clone your forked project and change into the project’s directory:
git clone https://github.com/<your-repository-path>
cd <your-repository-path>
  1. Edit the CDK JSON file at  cdk/cdk.json  and enter the details:
"RepositoryString": "<your-github-repository-path>",
"RepositoryBranch": "<your-github-repository-branch-name>",
"CodestarConnectionArn": "<connection-arn>",
"CodeArtifactDomain": "<code-artifact-domain-name>",
"CodeArtifactRepository": "<code-artifact-repository-name>"

Please note that for setting configuration values in CDK applications, it is recommend to use environment variables or AWS Systems Manager parameters.

  1. Commit and push your changes back to your GitHub repository:
git push origin main
  1. Change into the  cdk directory and bootstrap the CDK in your AWS account if you haven’t already done so (enter “Y” when prompted):
cd cdk
cdk bootstrap
  1. Deploy the CDK pipeline stack (enter “Y” when prompted):
cdk deploy OpenAPIBlogPipeline

Once the stack deployment completes successfully, the pipeline  OpenAPIBlogPipeline will start running. This will build and deploy the API and its associated resources. If you open the Console and navigate to AWS CodePipeline, then you’ll see a pipeline in progress for the API.

Once the pipeline has completed executing, navigate to AWS CloudFormation to get the output values for the  DEV-OpenAPIBlog  stack deployment:

  1. Select the  DEV-OpenAPIBlog  stack entry and then select the Outputs column. Record the REST_URL value for the key that begins with   OpenAPIBlogRestAPIEndpoint .
  2. Record the CLOUDFRONT_URL value for the key  OpenAPIBlogCloudFrontURL .

The API ping method at https://<REST_URL>/ping can now be invoked using your browser or an API development tool like Postman. Other API other methods, as defined by the OpenApi specification, are also available for invocation (For example, GET https://<REST_URL>/widgets).

To view the generated API documentation, open a browser at https://< CLOUDFRONT_URL>.

The following figure shows the API documentation website that has been auto-generated from the API’s OpenAPI specification. The documentation includes code snippets for using the API from multiple programming languages.

The API’s auto-generated documentation website provides descriptions of the API’s methods and resources as well as code snippets in multiple languages including JavaScript, Python, and Java.

Figure 3 – Auto-generated API documentation

To view the generated API client code artifact, open the Console and navigate to AWS CodeArtifact. The following figure shows the generated API client artifact that has been published to CodeArtifact.

The CodeArtifact service user interface in the Console shows the different versions of the API’s auto-generated client libraries.

Figure 4 – API client artifact in CodeArtifact

Cleaning up

  1. From the command change to the  cdk directory and remove the API stack in the DEV stage (enter “Y” when prompted):
cd cdk
cdk destroy OpenAPIBlogPipeline/DEV/OpenAPIBlogAPI
  1. Once this has completed, delete the pipeline stack:
cdk destroy OpenAPIBlogPipeline
  1. Delete the S3 bucket created to support pipeline operations. Open the Console and navigate to Amazon S3. Delete buckets with the prefix  openapiblogpipeline .

Conclusion

This post demonstrates the use of the AWS CDK to deploy a RESTful API defined by the OpenAPI/Swagger specification. Furthermore, this post describes how to use the AWS CDK to auto-generate API documentation, publish this documentation to a web site hosted on Amazon S3, auto-generate API client libraries or SDKs, and publish these artifacts to an Apache Maven repository hosted on CodeArtifact.

The solution described in this post can be improved by:

  • Building and pushing the API documentation Docker image to Amazon ECR, and then using this image in CodePipeline API pipelines.
  • Creating stages for different environments such as TEST, PREPROD, and PROD.
  • Adding integration testing actions to make sure that the API Deployment is working correctly.
  • Adding Manual approval actions for that are executed before deploying the API to PROD.
  • Using CodeBuild caching of artifacts including Docker images and libraries.

About the author:

Luke Popplewell

Luke Popplewell works primarily with federal entities in the Australian Government. In his role as an architect, Luke uses his knowledge and experience to help organisations reach their goals on the AWS cloud. Luke has a keen interest in serverless technology, modernization, DevOps and event-driven architectures.

Identification of replication bottlenecks when using AWS Application Migration Service

Post Syndicated from Tobias Reekers original https://aws.amazon.com/blogs/architecture/identification-of-replication-bottlenecks-when-using-aws-application-migration-service/

Enterprises frequently begin their journey by re-hosting (lift-and-shift) their on-premises workloads into AWS and running Amazon Elastic Compute Cloud (Amazon EC2) instances. A simpler way to re-host is by using AWS Application Migration Service (Application Migration Service), a cloud-native migration service.

To streamline and expedite migrations, automate reusable migration patterns that work for a wide range of applications. Application Migration Service is the recommended migration service to lift-and-shift your applications to AWS.

In this blog post, we explore key variables that contribute to server replication speed when using Application Migration Service. We will also look at tests you can run to identify these bottlenecks and, where appropriate, include remediation steps.

Overview of migration using Application Migration Service

Figure 1 depicts the end-to-end data replication flow from source servers to a target machine hosted on AWS. The diagram is designed to help visualize potential bottlenecks within the data flow, which are denoted by a black diamond.

Data flow when using AWS Application Migration Service (black diamonds denote potential points of contention)

Figure 1. Data flow when using AWS Application Migration Service (black diamonds denote potential points of contention)

Baseline testing

To determine a baseline replication speed, we recommend performing a control test between your target AWS Region and the nearest Region to your source workloads. For example, if your source workloads are in a data center in Rome and your target Region is Paris, run a test between eu-south-1 (Milan) and eu-west-3 (Paris). This will give a theoretical upper bandwidth limit, as replication will occur over the AWS backbone. If the target Region is already the closest Region to your source workloads, run the test from within the same Region.

Network connectivity

There are several ways to establish connectivity between your on-premises location and AWS Region:

  1. Public internet
  2. VPN
  3. AWS Direct Connect

This section pertains to options 1 and 2. If facing replication speed issues, the first place to look is at network bandwidth. From a source machine within your internal network, run a speed test to calculate your bandwidth out to the internet; common test providers include Cloudflare, Ookla, and Google. This is your bandwidth to the internet, not to AWS.

Next, to confirm the data flow from within your data center, run a traceroute (Windows) or tracert (Linux). Identify any network hops that are unusual or potentially throttling bandwidth (due to hardware limitations or configuration).

To measure the maximum bandwidth between your data center and the AWS subnet that is being used for data replication, while accounting for Security Sockets Layer (SSL) encapsulation, use the CloudEndure SSL bandwidth tool (refer to Figure 1).

Source storage I/O

The next area to look for replication bottlenecks is source storage. The underlying storage for servers can be a point of contention. If the storage is maxing-out its read speeds, this will impact the data-replication rate. If your storage I/O is heavily utilized, it can impact block replication by Application Migration Service. In order to measure storage speeds, you can use the following tools:

  • Windows: WinSat (or other third-party tooling, like AS SSD Benchmark)
  • Linux: hdparm

We suggest reducing read/write operations on your source storage when starting your migration using Application Migration Service.

Application Migration Service EC2 replication instance size

The size of the EC2 replication server instance can also have an impact on the replication speed. Although it is recommended to keep the default instance size (t3.small), it can be increased if there are business requirements, like to speed up the initial data sync. Note: using a larger instance can lead to increased compute costs.

-508 (1)

Common replication instance changes include:

  • Servers with <26 disks: change the instance type to m5.large. Increase the instance type to m5.xlarge or higher, as needed.
  • Servers with <26 disks (or servers in AWS Regions that do not support m5 instance types): change the instance type to m4.large. Increase to m4.xlarge or higher, as needed.

Note: Changing the replication server instance type will not affect data replication. Data replication will automatically pick up where it left off, using the new instance type you selected.
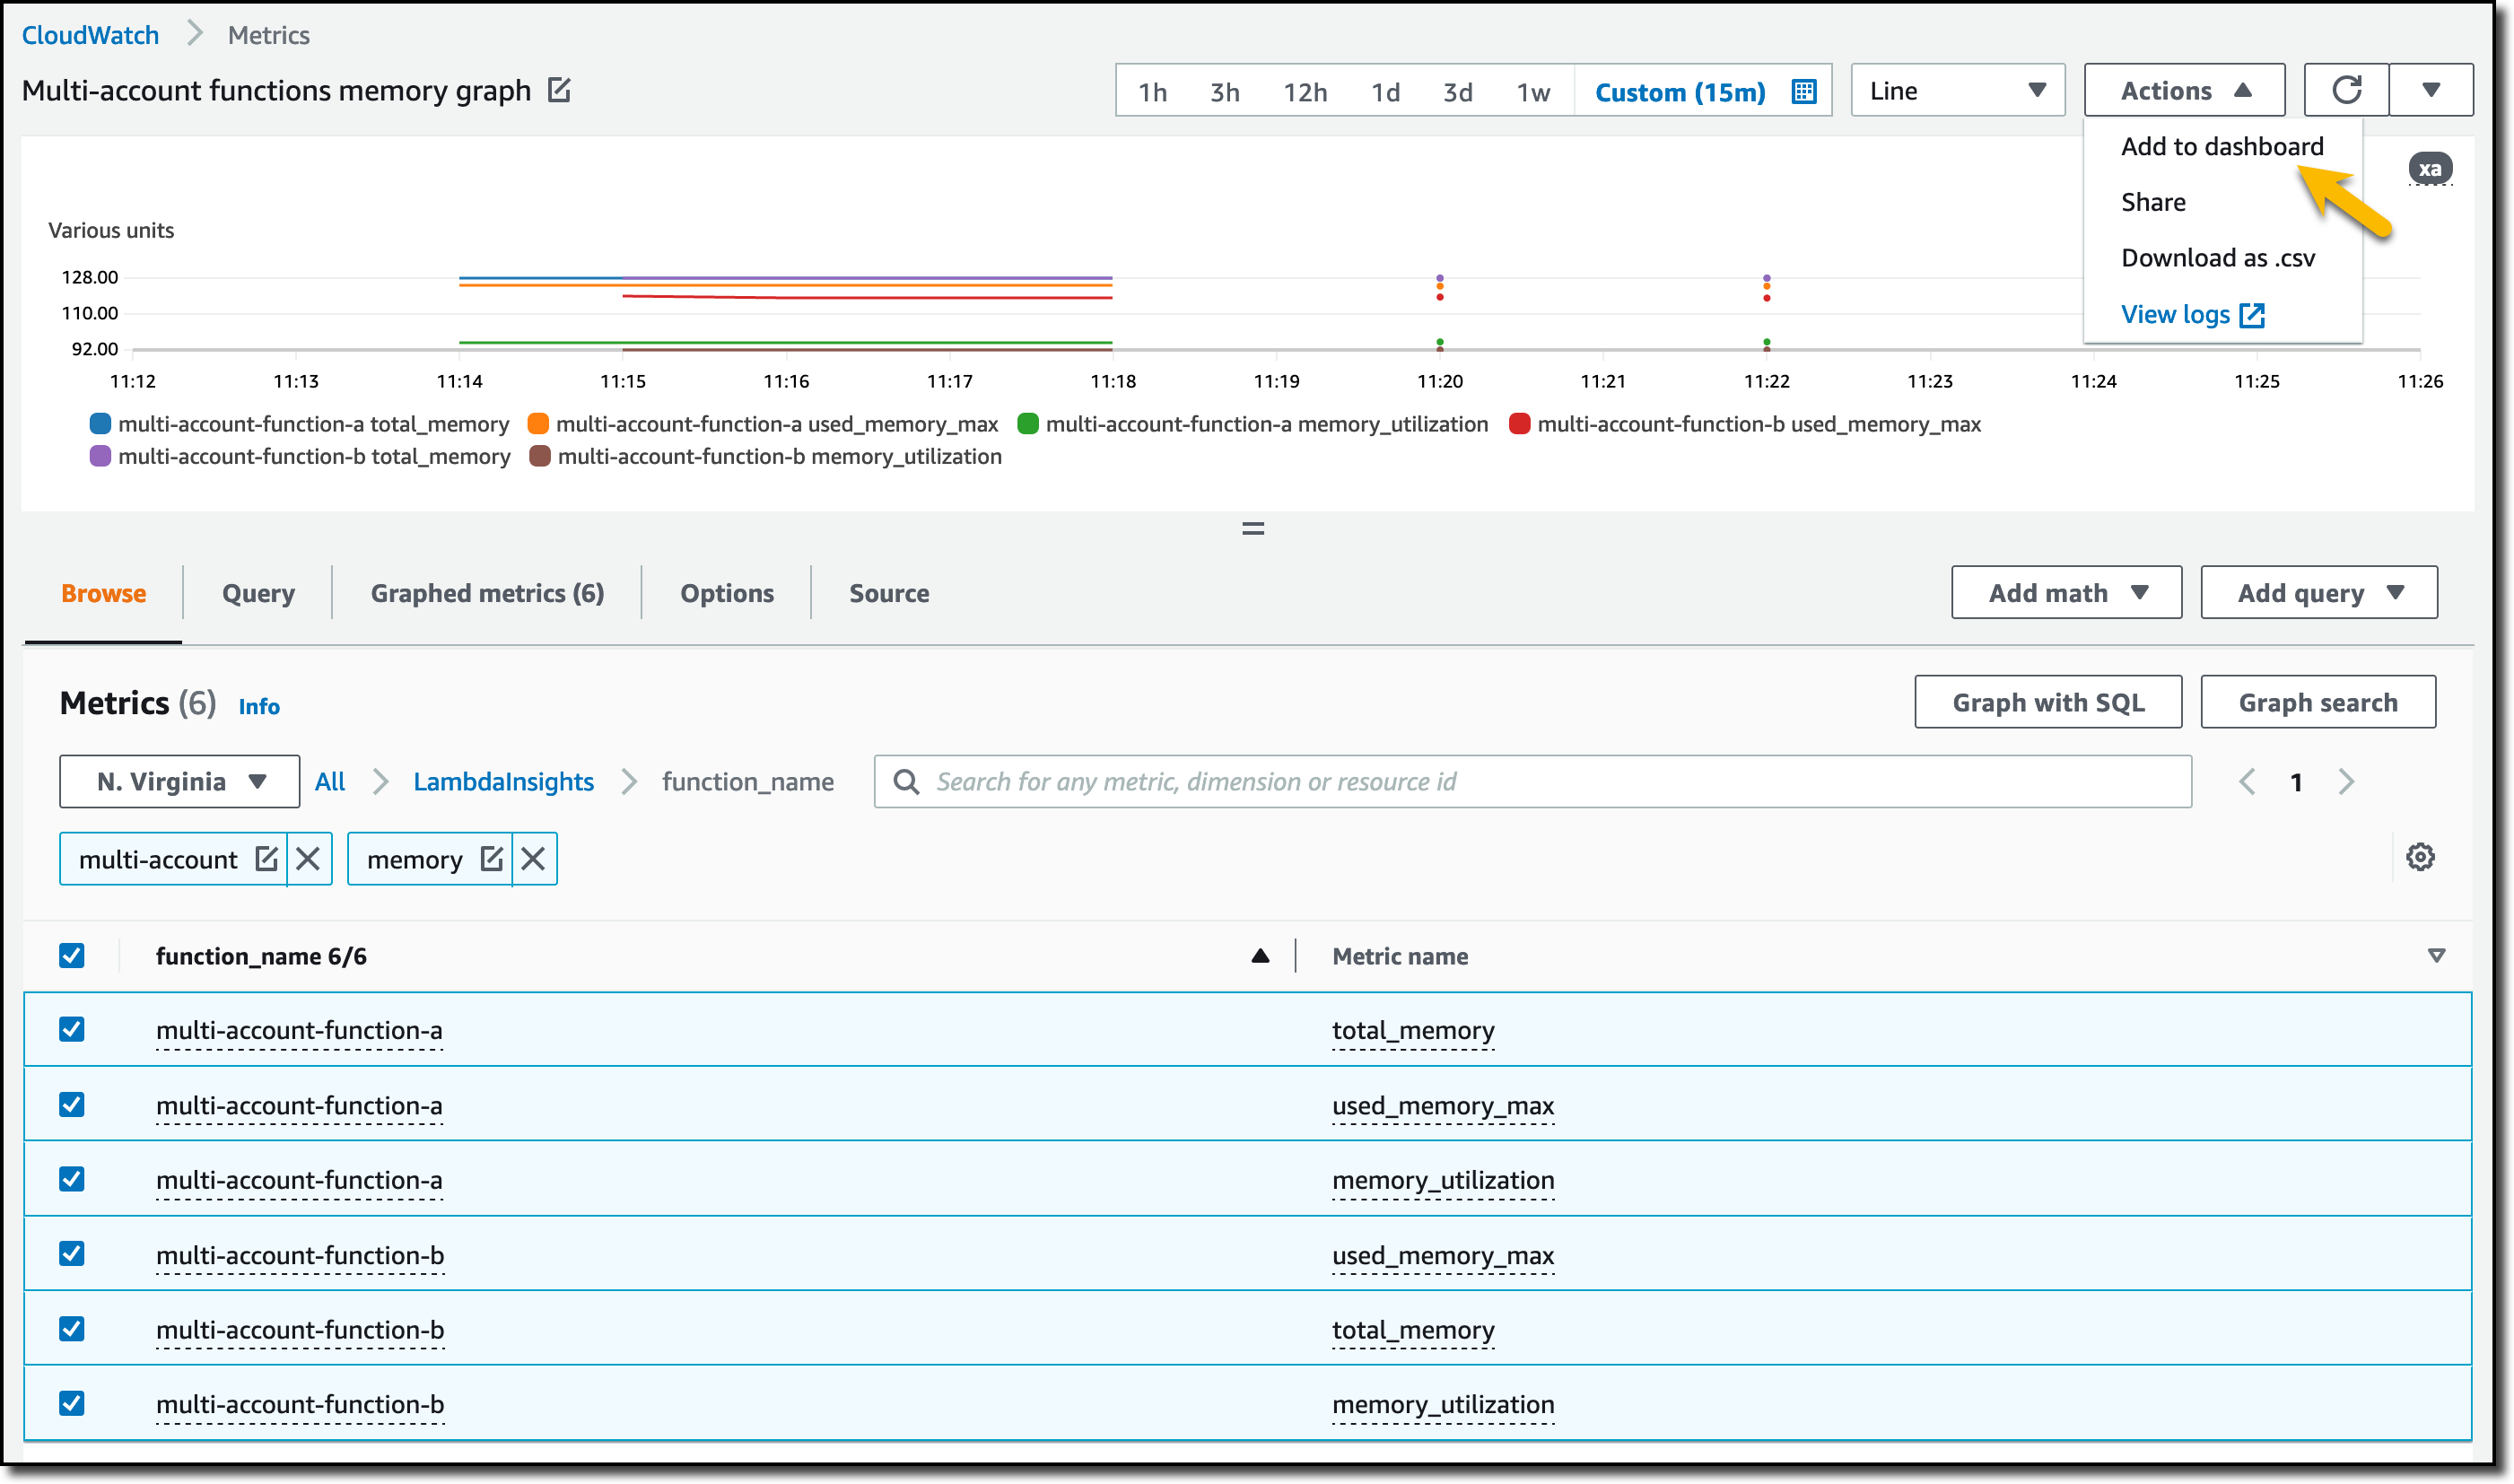
Application Migration Service Elastic Block Store replication volume

You can customize the Amazon Elastic Block Store (Amazon EBS) volume type used by each disk within each source server in that source server’s settings (change staging disk type).

By default, disks <500GiB use Magnetic HDD volumes. AWS best practice suggests not change the default Amazon EBS volume type, unless there is a business need for doing so. However, as we aim to speed up the replication, we actively change the default EBS volume type.

There are two options to choose from:

  1. The lower cost, Throughput Optimized HDD (st1) option utilizes slower, less expensive disks.

-508 (2)

    • Consider this option if you(r):
      • Want to keep costs low
      • Large disks do not change frequently
      • Are not concerned with how long the initial sync process will take
  1. The faster, General Purpose SSD (gp2) option utilizes faster, but more expensive disks.

-508 (3)

    • Consider this option if you(r):
      • Source server has disks with a high write rate, or if you need faster performance in general
      • Want to speed up the initial sync process
      • Are willing to pay more for speed

Source server CPU

The Application Migration Service agent that is installed on the source machine for data replication uses a single core in most cases (agent threads can be scheduled to multiple cores). If core utilization reaches a maximum, this can be a limitation for replication speed. In order to check the core utilization:

  • Windows: Launch the Task Manger application within Windows, and click on the “CPU” tab. Right click on the CPU graph (this is currently showing an average of cores) > select “Change graph to” > “Logical processors”. This will show individual cores and their current utilization (Figure 2).
Logical processor CPU utilization

Figure 2. Logical processor CPU utilization

Linux: Install htop and run from the terminal. The htop command will display the Application Migration Service/CE process and indicate the CPU and memory utilization percentage (this is of the entire machine). You can check the CPU bars to determine if a CPU is being maxed-out (Figure 3).

AWS Application Migration Service/CE process to assess CPU utilization

Figure 3. AWS Application Migration Service/CE process to assess CPU utilization

Conclusion

In this post, we explored several key variables that contribute to server replication speed when using Application Migration Service. We encourage you to explore these key areas during your migration to determine if your replication speed can be optimized.

Related information

Extend your pre-commit hooks with AWS CloudFormation Guard

Post Syndicated from Joaquin Manuel Rinaudo original https://aws.amazon.com/blogs/security/extend-your-pre-commit-hooks-with-aws-cloudformation-guard/

Git hooks are scripts that extend Git functionality when certain events and actions occur during code development. Developer teams often use Git hooks to perform quality checks before they commit their code changes. For example, see the blog post Use Git pre-commit hooks to avoid AWS CloudFormation errors for a description of how the AWS Integration and Automation team uses various pre-commit hooks to help reduce effort and errors when they build AWS Quick Starts.

This blog post shows you how to extend your Git hooks to validate your AWS CloudFormation templates against policy-as-code rules by using AWS CloudFormation Guard. This can help you verify that your code follows organizational best practices for security, compliance, and more by preventing you from commit changes that fail validation rules.

We will also provide patterns you can use to centrally maintain a list of rules that security teams can use to roll out new security best practices across an organization. You will learn how to configure a pre-commit framework by using an example repository while you store Guard rules in both a central Amazon Simple Storage Service (Amazon S3) bucket or in versioned code repositories (such as AWS CodeCommit, GitHub, Bitbucket, or GitLab).
Prerequisites

To complete the steps in this blog post, first perform the following installations.

  1. Install AWS Command Line Interface (AWS CLI).
  2. Install the Git CLI.
  3. Install the pre-commit framework by running the following command.
    pip install pre-commit
  4. Install the Rust programming language by following these instructions.
  5. (Windows only) Install the version of Microsoft Visual C++ Build Tools 2019 that provides just the Visual C++ build tools. 

Solution walkthrough

In this section, we walk you through an exercise to extend a Java service on an Amazon EKS example repository with Git hooks by using AWS CloudFormation Guard. You can choose to upload your Guard rules in either a separate GitHub repository or your own S3 bucket.

First, download the sample repository that you will add the pre-commit framework to.

To clone the test repository

  • Clone the repo to a local directory by running the following command in your local terminal.

    git clone https://github.com/aws-samples/amazon-eks-example-for-stateful-java-service.git

Next, create Guard rules that reflect the organization’s policy-as-code best practices and store them in an S3 bucket.

To set up an S3 bucket with your Guard rules

  1. Create an S3 bucket by running the following command in the AWS CLI.

    aws s3 mb s3://<account-id>-cfn-guard-rules --region <aws-region>

    where <account-id> is the ID of the AWS account you’re using and <aws-region> is the AWS Region you want to use.

  2. (Optional) Alternatively, you can follow the Getting started with Amazon S3 tutorial to create the bucket and upload the object (as described in step 4 that follows) by using the AWS Management Console.

    When you store your Guard rules in an S3 bucket, you can make the rules accessible to other member accounts in your organization by using the aws:PrincipalOrgID condition and setting the value to your organization ID in the bucket policy.

  3. Create a file that contains a Guard rule named rules.guard, with the following content.
    let eks_cluster = Resources.* [ Type == 'AWS::EKS::Cluster' ]
    rule eks_public_disallowed when %eks_cluster !empty {
          %eks_cluster.Properties.ResourcesVpcConfig.EndpointPublicAccess == false
    }

    This rule will verify that public endpoints are disabled by checking that resources that are created by using the AWS::EKS::Cluster resource type have the EndpointPublicAccess property set to false. For more information about authoring your own rules using Guard domain-specific language (DSL), see Introducing AWS CloudFormation Guard 2.0.

  4. Upload the rule set to your S3 bucket by running the following command in the AWS CLI.

    aws s3 cp rules.guard s3://<account-id>-cfn-guard-rules/rules/rules.guard

In the next step, you will set up the pre-commit framework in the repository to run CloudFormation Guard against code changes.

To configure your pre-commit hook to use Guard

  1. Run the following command to create a new branch where you will test your changes.
    git checkout -b feature/guard-hook
  2. Navigate to the root directory of the project that you cloned earlier and create a .pre-commit-config.yaml file with the following configuration.
    repos:
      - repo: local
        hooks:
          -   id: cfn-guard-rules
              name: Rules for AWS
              description: Download Organization rules
              entry: aws s3 cp --recursive s3://<account-id>-cfn-guard-rules/rules  guard-rules/org-rules/
              language: system
              pass_filenames: false
          -   id: cfn-guard
              name: AWS CloudFormation Guard
              description: Validate code against your Guard rules
              entry: bash -c 'for template in "$@"; do cfn-guard validate -r guard-rules -d "$template" || SCAN_RESULT="FAILED"; done; if [[ "$SCAN_RESULT" = "FAILED" ]]; then exit 1; fi'
              language: rust
              files: \.(json|yaml|yml|template\.json|template)$
              additional_dependencies:
                - cli:cfn-guard

    You will need to replace the <account-id> placeholder value with the AWS account ID you entered in the To set up an S3 bucket with your Guard rules procedure.

    This hook configuration uses local pre-commit hooks to download the latest version of Guard rules from the bucket you created previously. This allows you to set up a centralized set of Guard rules across your organization.

    Alternatively, you can create and use a code repository such as GitHub, AWS CodeCommit, or Bitbucket to keep your rules in version control. To do so, replace the command in the Download Organization rules step of the .pre-commit-config.yaml file with:

    bash -c ‘if [ -d guard-rules/org-rules ]; then cd guard-rules/org-rules && git pull; else git clone <guard-rules-repository-target> guard-rules/org-rules; fi’

    Where <guard-rules-repository-target> is the HTTPS or SSH URL of your repository. This command will clone or pull the latest rules from your Git repo by using your Git credentials.

    The hook will also install Guard as an additional dependency by using a Rust hook. Using Guard, it will run the code changes in the repository directory against the downloaded rule set. When misconfigurations are detected, the hook stops the commit.

    You can further extend your organization rules with your own Guard rules by adding them to the cfn-guard-rules folder. You should commit these rules in your repository and add cfn-guard-rules/org-rules/* to your .gitignore file.

  3. Run a pre-commit install command to install the hooks you just created.

Finally, test that the pre-commit’s Guard hook fails commits of code changes that do not follow organizational best practices.

To test pre-commit hooks

  1. Add EndpointPublicAccess: true in cloudformation/eks.template.yaml, as shown following. This describes the test-only intent (meaning that you want to detect and flag errors in your rule) of adding public access to the Amazon Elastic Kubernetes Service (Amazon EKS) cluster.
      EKSCluster:
        Type: AWS::EKS::Cluster
        Properties:
          Name: java-app-demo-cluster
          ResourcesVpcConfig:
            EndpointPublicAccess: true
            SecurityGroupIds:
              - !Ref EKSControlPlaneSecurityGroup

  2. Add your changes with the git add command.

    git add .pre-commit-config.yaml

    git add cloudformation/eks.template.yaml

  3. Commit changes with the following command.

    git commit -m bad config

    You should see the following error that disallows the commit to the local repository and shows which one of your Guard rules failed.

    amazon-eks-controlplane.template.yaml Status = FAIL
    		
    FAILED rules
    		
    rules.guard/eks_public_disallowed    FAIL
    		
    ---
    		
    Evaluation of rules rules.guard against data amazon-eks-controlplane.template.yaml
    		
    ---
    		
    Property
    [/Resources/EKS/Properties/ResourcesVpcConfig/EndpointPublicAccess] in data
    [eks.template.yaml] is not compliant with [rules.guard/eks_public_disallowed] 
    because provided value [true] did not match expected value [false]. 
    Error Message []

  4. (Optional) You can also test hooks before committing by using the pre-commit run command to see similar output.

Cleanup

To avoid incurring ongoing charges, follow these cleanup steps to delete the resources and files you created as you followed along with this blog post.

To clean up resources and files

  1. Remove your local repository.
    rm -rf /path/to/repository
  2. Delete the S3 bucket you created by running the following command.
    aws s3 rb s3://<account-id>-cfn-guard-rules --force
  3. (Optional) Remove the pre-commit hooks framework by running this command.
    pip uninstall pre-commit

Conclusion

In this post, you learned how to use AWS CloudFormation Guard with the pre-commit framework locally to validate your infrastructure-as-code solutions before you push remote changes to your repositories.

You also learned how to extend the solution to use a centralized list of security rules that is stored in versioned code repositories (GitHub, Bitbucket, or GitLab) or an S3 bucket. And you learned how to further extend the solution with your own rules. You can find examples of rules to use in Guard’s Github repository or refer to write preventative compliance rules for AWS CloudFormation templates the cfn-guard way. You can then further configure other repositories to prevent misconfigurations by using the same Guard rules.

 
If you have feedback about this post, submit comments in the Comments section below. If you have questions about this post, start a new thread on the KMS re:Post or contact AWS Support.

Want more AWS Security news? Follow us on Twitter.

Author

Joaquin Manuel Rinaudo

Joaquin is a Senior Security Architect with AWS Professional Services. He is passionate about building solutions that help developers improve their software quality. Prior to AWS, he worked across multiple domains in the security industry, from mobile security to cloud and compliance related topics. In his free time, Joaquin enjoys spending time with family and reading science-fiction novels.

New for AWS Control Tower – Region Deny and Guardrails to Help You Meet Data Residency Requirements

Post Syndicated from Danilo Poccia original https://aws.amazon.com/blogs/aws/new-for-aws-control-tower-region-deny-and-guardrails-to-help-you-meet-data-residency-requirements/

Many customers, such as those in highly regulated industries and the public sector, want to have control over where their data is stored and processed. AWS already offers many tools and features to comply with local laws and regulations, but we want to provide a simplified way to translate data residency requirements into controls that can be applied to single- and multi-account environments.

Starting today, you can use AWS Control Tower to deploy data residency preventive and detective controls, referred to as guardrails. These guardrails will prevent provisioning resources in unwanted AWS Regions by restricting access to AWS APIs through service control policies (SCPs) built and managed by AWS Control Tower. In this way, content cannot be created or transferred outside of your selected Regions at the infrastructure level. In this context, content can be software (including machine images), data, text, audio, video, or images hosted on AWS for processing or storage. For example, AWS customers in Germany can deny access to AWS services in Regions outside of Frankfurt with the exception of global services such as AWS Identity and Access Management (IAM) and AWS Organizations.

AWS Control Tower also offers guardrails to further control data residency in underlying AWS service options, for example, blocking Amazon Simple Storage Service (Amazon S3) cross-region replication or blocking the creation of internet gateways.

The AWS account used for managing AWS Control Tower is not restricted by the new Region deny settings. That account can be used for remediation if you have data in an unwanted Region before enabling Region deny.

Detective guardrails are implemented via AWS Config rules and can further detect unexpected configuration changes that should not be allowed.

You still retain a shared responsibility model for data residency at the application level, but these controls can help you restrict what infrastructure and application teams can do on AWS.

Using Data Residency Guardrails in AWS Control Tower
To use the new data residency guardrails, you need to have created a landing zone using AWS Control Tower. See Plan your AWS Control Tower landing zone for more information.

To see all the new controls that are available, I select Guardrails on the left pane of the AWS Control Tower console and then find those in the Data Residency category. I sort results by Behavior. Guardrails that have a Prevention behavior are implemented as SCPs. Those that have a Detection behavior are implemented as AWS Config rules.

Console screenshot.

The most interesting guardrail is probably the one denying access to AWS based on the requested AWS Region. I choose it from the list and find that it is different from the other guardrails because it affects all Organizational Units (OUs) and cannot be activated here but must be activated in the landing zone settings.

Console screenshot.

Below the Overview, in the Guardrail components, there is a link to the full SCP for this guardrail, and I can see the list of the AWS APIs that, when this setting is enabled, are still going to be allowed towards non-governed Regions. Depending on your requirements, some of those services, such as Amazon CloudFront or AWS Global Accelerator, can be further limited by a custom SCP.

In the Landing zone settings, the Region deny guardrail is currently not enabled. I choose Modify settings and then enable the Region deny settings.

Console screenshot.

Below the Region deny settings, there is the list of AWS Regions governed by the landing zone. Those will be the regions allowed when I enable Region deny.

Console screenshot.

In my case, I have four governed Regions, two in the US and two in Europe:

  • US East (N. Virginia), which is also the home Region for the landing zone
  • US West (Oregon)
  • Europe (Ireland)
  • Europe (Frankfurt)

I choose Update landing zone at the bottom. The update of the landing zone takes a few minutes to complete. Now, the vast majority of the AWS APIs are blocked if they are not directed to one of those governed Regions. Let’s do a few tests.

Testing Region Deny in a Sandbox Account
Using AWS Single Sign-On, I copy the AWS credentials to use the sandbox account with AWSAdministratorAccess permissions. In a terminal, I paste the commands setting the environment variables to use those credentials.

Console screenshot.

Now, I try to start a new Amazon Elastic Compute Cloud (Amazon EC2) instance in US East (Ohio), one of the non-governed Regions. In a landing zone, the default VPC is replaced by a VPC managed by AWS Control Tower. To start the instance, I need to specify a VPC subnet. Let’s find a subnet ID that I can use.

aws ec2 describe-subnets --query 'Subnets[0].SubnetId' --region us-east-2

An error occurred (UnauthorizedOperation) when calling the DescribeSubnets operation:
You are not authorized to perform this operation.

As expected, I am not authorized to perform this operation in US East (Ohio). Let’s try to start an EC2 instance without passing the subnet ID.

aws ec2 run-instances --image-id ami-0dd0ccab7e2801812 --region us-east-2 \
    --instance-type t3.small                                     

An error occurred (UnauthorizedOperation) when calling the RunInstances operation:
You are not authorized to perform this operation.
Encoded authorization failure message: <ENCODED MESSAGE>

Again, I am not authorized. More information is included in the encoded authorization failure message that I can decode as described in this article:

aws sts decode-authorization-message --encoded-message <ENCODED MESSAGE>

The decoded message (that I have omitted for brevity) tells me that there was an explicit deny to my request and includes the full SCP that caused the deny. This information is really useful for debugging these kind of errors.

Now, let’s try in US East (N. Virginia), one of the four governed regions.

aws ec2 describe-subnets --query 'Subnets[0].SubnetId' --region us-east-1
"subnet-0f3580c0c5e56c210"

This time, the command returns the subnet ID of the first subnet returned by the request. Let’s start an instance in US East (N. Virginia) using this subnet.

aws ec2 run-instances --image-id  ami-04ad2567c9e3d7893 --region us-east-1 \
    --instance-type t3.small --subnet-id subnet-0f3580c0c5e56c210

As expected, it works, and I can see the EC2 instance running in the console.

Console screenshot.

Similarly, APIs for other AWS services are limited by the Region deny settings. For example, I can’t create an S3 bucket in a non-governed Region.

Console screenshot.

When I try to create the bucket, I get an access denied error.

Console screenshot.

As expected, the creation of an S3 bucket works in a governed Region.

Even if someone gives this account access to a bucket in a non-governed Region, I would not be able to copy any data into that bucket.

Other preventive guardrails can enforce data residency, for example:

  • Disallow cross-region networking for Amazon EC2, Amazon CloudFront, and AWS Global Accelerator
  • Disallow internet access for an Amazon VPC instance managed by a customer
  • Disallow Amazon Virtual Private Network (VPN) connections

Now, let’s see how detective guardrails work.

Testing Detective Guardrails in a Sandbox Account
I enable the following guardrails for all accounts in the sandbox OU:

  • Detect whether Amazon EBS snapshots are restorable by all AWS accounts
  • Detect whether public routes exist in the route table for an internet gateway

Now, I want to see what happens if I go against these guardrails. In the EC2 console, I create an EBS snapshot for the volume of the EC2 instance I started before. Then, I modify permissions to share it with all AWS accounts.

Console screenshot.

Then, in the VPC console, I create an internet gateway, attach it to the AWS Control Tower managed VPC, and update the route table of one of the private subnets to use the internet gateway.

Console screenshot.

After a few minutes, the noncompliant resources in the sandbox account are found by the detective guardrails.

Console screenshot.

I look at the information provided by the guardrails and update my configuration to fix the issues. In a multi-account setup I’d contact the account owner and ask for remediation.

Availability and Pricing
You can use data-residency guardrails to control resources in any AWS Region. To create a landing zone, you should start from one of the Regions where AWS Control Tower is offered. For more information, see the AWS Regional Services List. There is no additional cost for this feature. You pay the costs of other services used, such as AWS Config.

This feature provides you with a framework of controls and guidance for setting up a multi-account environment that addresses data residency requirements. Depending on your use case, you may use any subset of the new data residency guardrails.

Set up guardrails based on your data residency requirements with AWS Control Tower.

Danilo