Post Syndicated from Arturs Lontons original https://blog.zabbix.com/user-roles-for-the-enterprise/12887/
In this post, we’ll talk about granular user roles introduced in Zabbix 5.2 and some scenarios where user roles should be used and where they give a great benefit to these specific environments.
Contents
I. Permissions granularity (0:40)
II. User Roles in 5.2 (5:16)
III. Example use cases (16:16)
IV. Questions & Answers (h2)
Permissions granularity
Permissions granularity
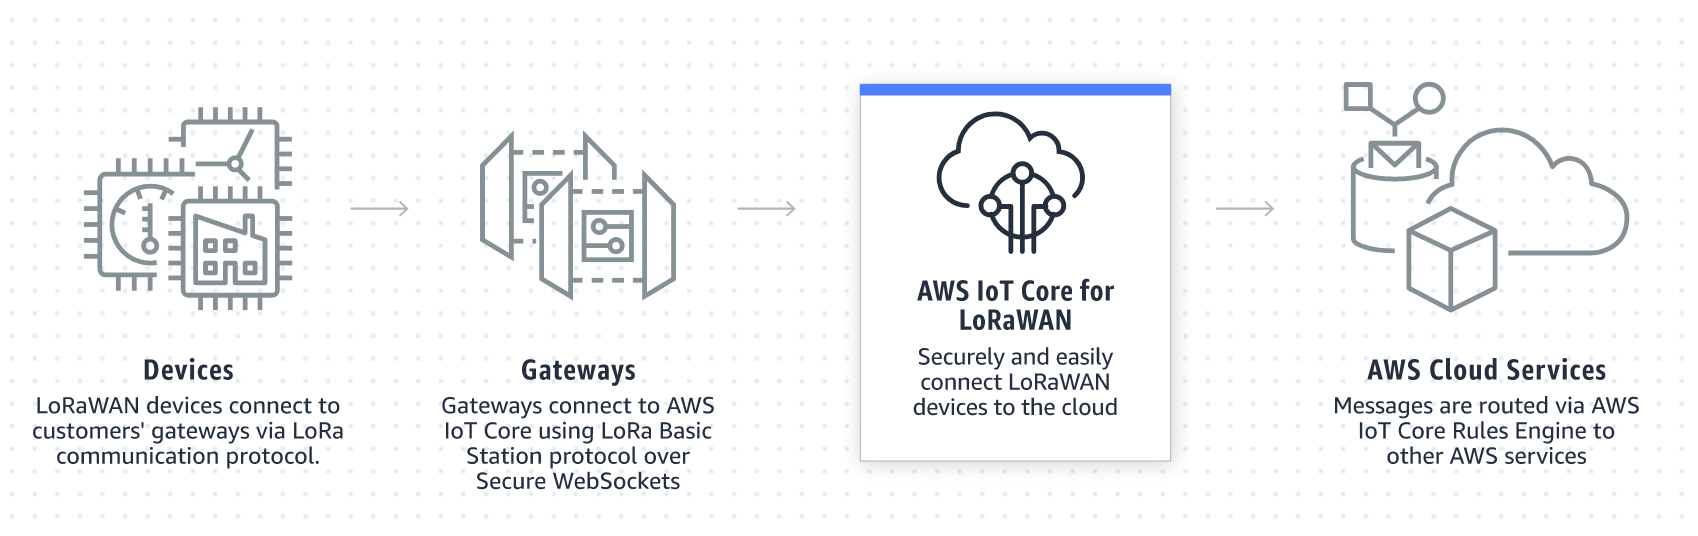
Let’s consider two roles: the NOC Team role and the Network Administrator role. These are quite different roles requiring different permission levels. Let’s not also forget that the people working in these roles usually have different skill sets, therefore the user experience is quite important for both of these roles: NOC Team probably wants to see only the most important, the most vital data, while the Network Administrators usually require permissions to view data in more detail and have access to more detailed and granular information overviews of what’s going on in your environment.
For our example, let’s first define the requirements for these roles.
NOC Team role:
- They will definitely require access to dashboards and maps.
- We will want to restrict unnecessary UI elements for them just to improve the UX. In this case – less is more. Removing the unused UI elements will make the day-to-day workflow easier for the NOC team members who aren’t as proficient with Zabbix as our Monitoring team members.
- For security reasons we need to restrict API access because NOC team members will either use API very rarely or not at all. With roles we can restrict the API access either partially or completely.
- The ability to modify the existing configuration will be restricted, as the NOC team will not be responsible for changing the Zabbix configuration.
- The ability to close problems manually will be restricted, since the network admin team will be responsible for that.
Network Administrator role:
- Similar to the NOC team, the Network Administrators also require access to dashboards and maps. what’s going on in your environment, the health of the environment.
- They need to have access to configuration, since members of this team are responsible for making configuration changes.
- Most likely, instead of disabling the API access for our network administrator role, we would want to restrict API access in some way. They might still need access to get or create methods, while access to everything else should be restricted.
- For each of our roles we will be implementing a UI cleanup by restricting UI elements – we will hide the functionality that we have opted out of using.
Roles and multi-tenancy
Granular permissions are one of the key factors in multi-tenant environments. We could use permissions to segregate our environment per tenant, but in 5.2 that’s not the end of it:
- Imagine multiple tenants where each has different monitoring requirements. Some want to use the services function for SLA calculation, others want to use inventory, or need the maps and the dashboards.
- Restricting access to elements and actions per tenant is important. So, for example, some tenants wish to be able to close problems manually, others need to have restrictions on map or dashboard creations for a specific user group..
- Permissions are still used to enable isolation between tenants on host group level
User Roles in 5.2
With Zabbix 5.2 these use cases, which require additional permission granularity, are now fully supported.
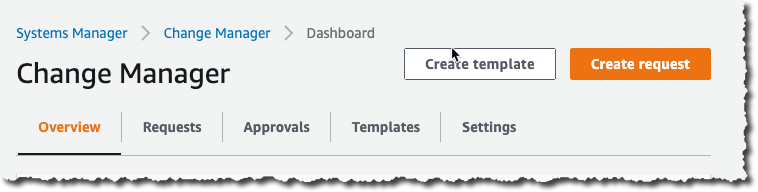
So, let’s take a look at how the User Role feature looks in a real environment.
User role
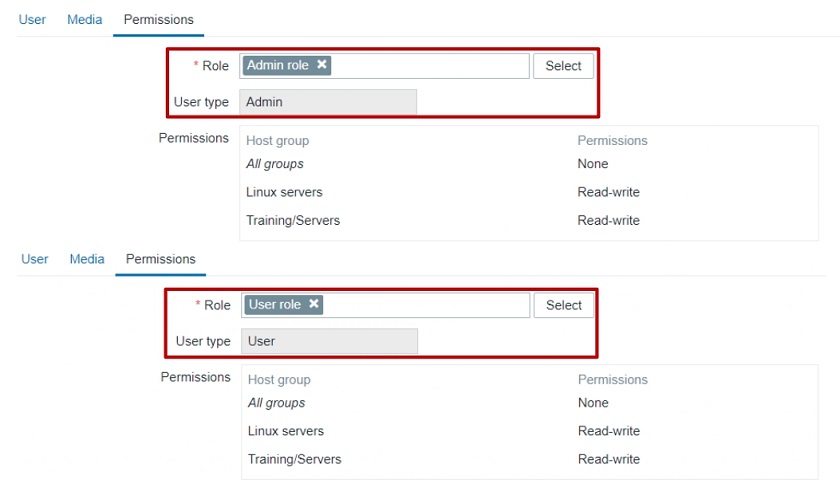
User roles in Zabbix 5.2 are something completely new. Each user will have a role assigned to them on top of their User Type:
User permissions
We end up having our User types being linked to User roles, and User roles linked to Users. This means that User types are linked to Users indirectly through the User roles.
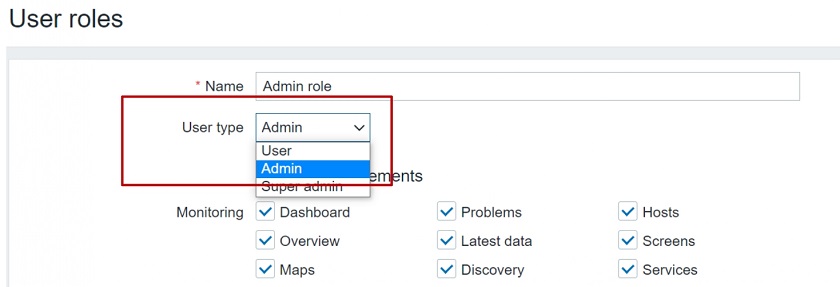
User types
The User, Admin, and Super admin types are still in use. The role will be linked to one of these 3 user types.
User roles
Note that User type restrictions still apply.
- Super admin has access to every section: Administration, Configuration, Reports, Inventory, and Monitoring.
- Admin has access to Configuration, Reports, Inventory, and Monitoring.
- User has access to Reports, Inventory, and Monitoring.
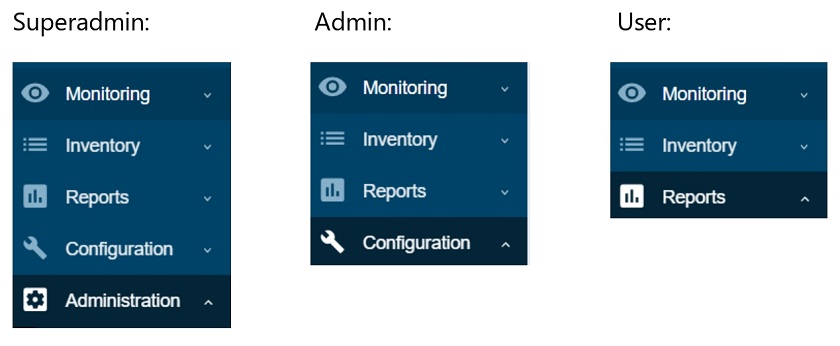
Frontend sections restricted by User type
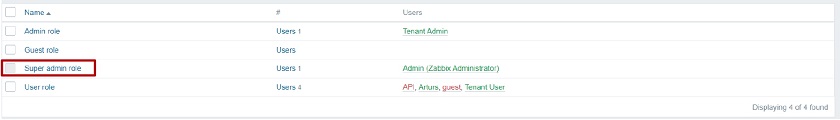
Default User roles
Once we upgrade to 5.2 or install a fresh 5.2 instance, we will have a set of default user roles. The 4 pre-configured user roles are available under Administration > User roles:
- Super admin,
- Admin,
- User, and
- Guest.
Super admin role
- The default Super admin role is static. It is set up by default once you upgrade or install a fresh instance. Users cannot modify this role.
All of the other default roles can be modified. In the Zabbix environment, we must have at least a single user with this Super admin role that has access to all of Zabbix functionality. This is similar to the root user in the Linux OS.
Newly created roles of either Super admin, Admin, or User types can be modified. For example, we can create another Super admin role, change the permissions. For instance, we can have a Super admin that doesn’t have access to Administration > General, but has access to everything else.
User role section
Once we open the User roles section, we will see a list of features and functions that we can restrict per user role.
When we create a new role or open a pre-created role they will have the maximum allowed permissions depending on the User type that is used for the role.
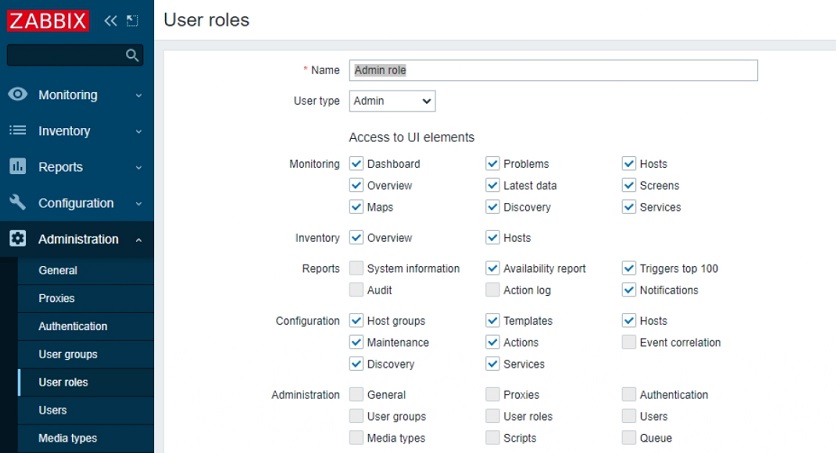
Each of the default roles contains the maximum allowed permissions per user type
UI element restriction
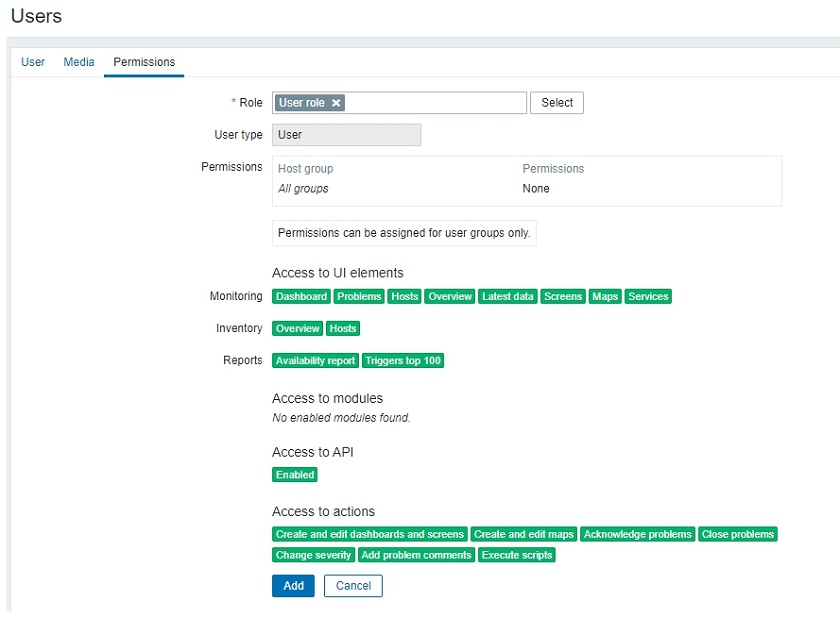
We can restrict access to UI elements for each role. If we wish to create a NOC role we can restrict them to have access only to Dashboards and maps. When we open the User up and go to Permissions we will see the available sections highlighted in green.
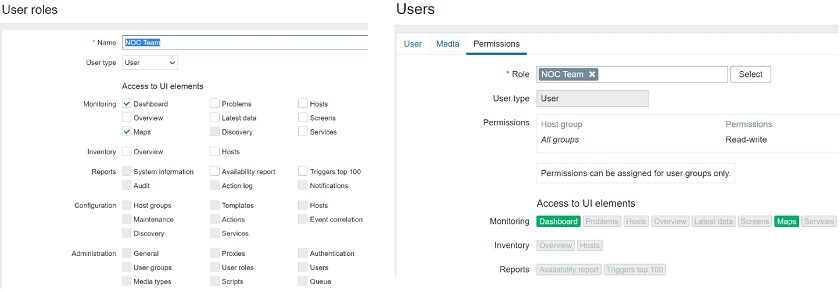
NOC user role that has access only to Dashboards and maps
Once we open up the Dashboards or the Monitoring section, we will see only the UI sections in our navigation menu that have been permitted for this specific user.
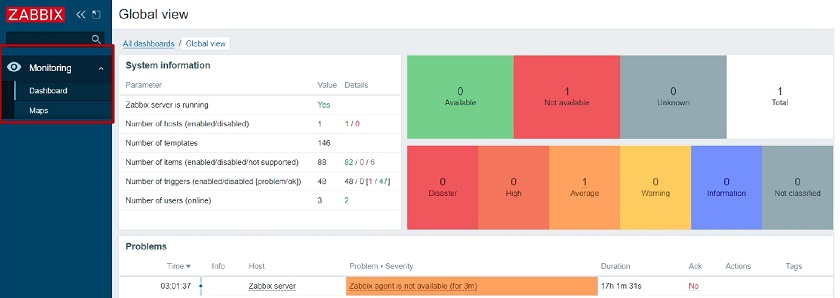
Global view: NOC user role that has access only to Dashboards and maps
Host group permissions
Note, that User Group access to Host Groups still has to be properly assigned. For instance, when we open the Dashboard, we still have to check if this user belongs to a user group, which has access to a specific host group. Then we will either display or hide the corresponding data.
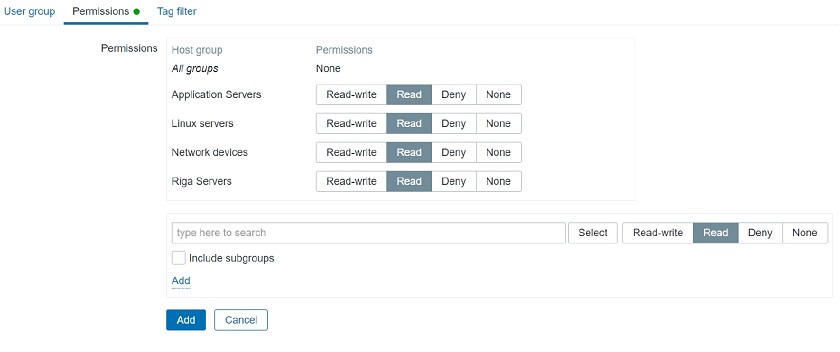
User Group access to Host Group
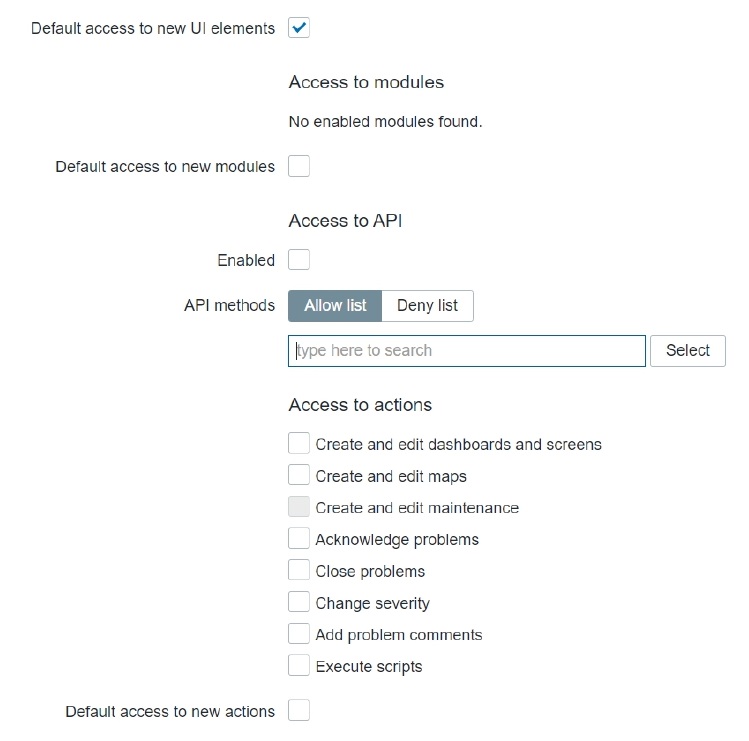
Access to API
API access can also be restricted for each role. Depending on the Access to API “Enabled” checkbox the corresponding user of this specific role will be permitted or denied to access the API.
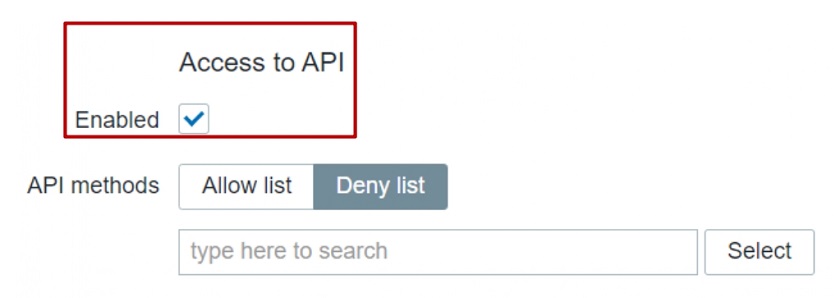
Used when creating API specific user roles
In addition to that, we can allow or restrict the execution of specific API methods. For this we can use an Allow or Deny list. For instance, we could create a user that has access only to get methods: they can read the data, but they cannot modify the data.
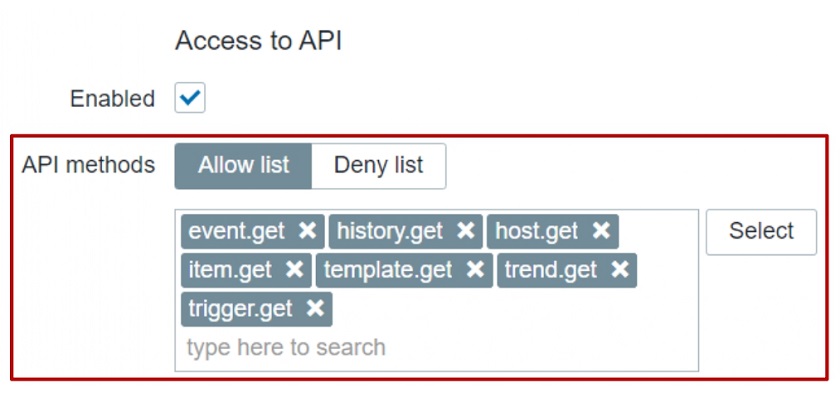
Restricting API method
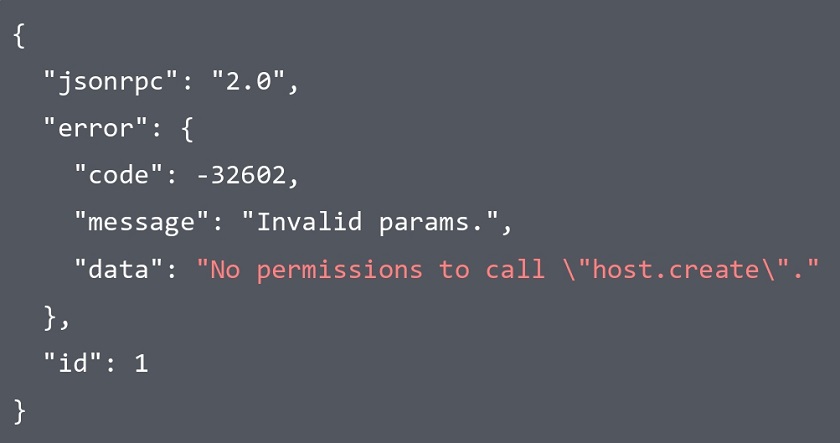
Let’s use host.create method as an example. If I don’t have permission to do so, I will see an error message ‘no permissions to call’ and then the name of the call — host.create in this case.
Access to actions
Each role can have a specific list of actions that it can perform with respect to the role User type.
In this context, ‘Actions’ mean what this user can do within the UI: Do we wish for the user to be able to close problems, acknowledge them, create or edit maps.
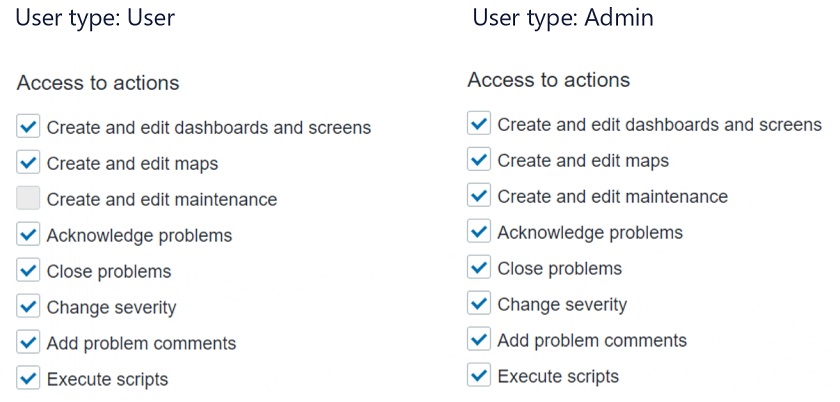
Defining access to actions
NOTE. For the role of type ‘User’, the ‘Create and edit maintenance’ will be grayed out because the User type by default doesn’t have access to the Maintenance section. You cannot enable it for the role of User type, but you can enable or disable it for the Admin type role.
Restricting Actions example
Let’s restrict the role for acknowledging and closing problems. Once we define the restriction the acknowledgment and closing of problems will be grayed out in the frontend.
If we enable it (the checkboxes are editable), we can acknowledge and close problems.
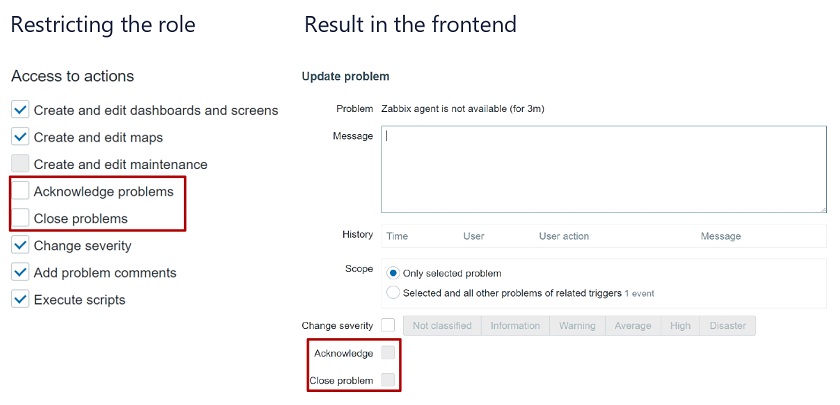
Restricted role
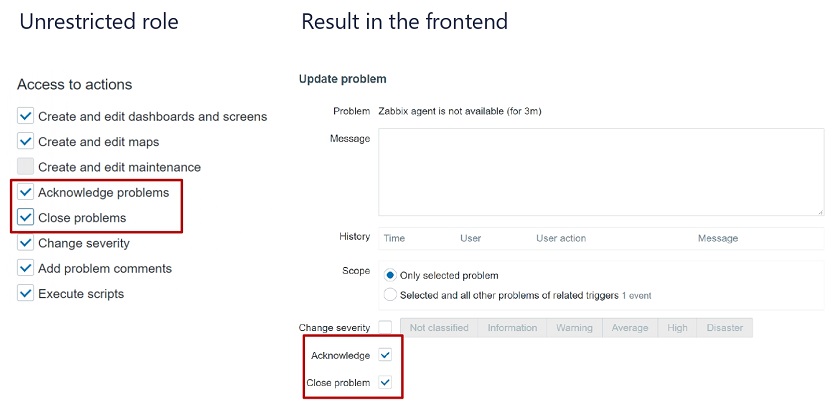
Unrestricted role
Default access
We can also modify the Default access section. We can define that a role has default access to new actions, modules, and UI elements. For instance, if we are importing a new frontend module or upgrading our version 5.2 to version 6.0 in the future – if any new UI elements, modules or action types appear, do we want for this specific role to have access to it by default once it is created or should this role by default have restricted access to all of these new elements that we are creating?
This allows to give access to any new UI elements for our Super Admin users while disabling the for any other User roles.
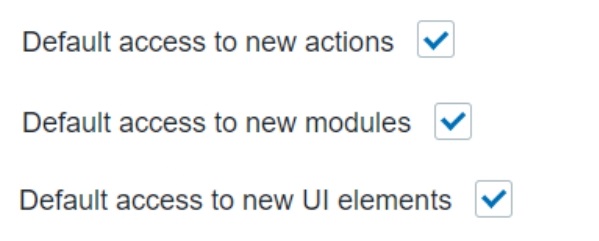
Default access for new elements of different types can be enabled or disabled for user roles
If Default access is enabled, whenever a new element is added, the user belonging to this role will automatically have access to it.
Role assignment post-upgrade
How are these roles going to be assigned after migration to 5.2? I have my users of a specific User type, but what’s going to happen with roles? Will I have to assign them manually?
When you upgrade to 5.2 from, for example, 5.0, the users will have the pre-created default roles for Admin, User, and Super admin assigned for them based on their types.
Pre-created roles after migration
This allows us to keep things as they were before 5.2 or go ahead with creating new User roles.
Example use cases
The following example use cases will give you an idea of how you can implement this in your environment.
Read-only role
ANOC Team User role, with no ability to create or modify any elements:
- read-only access to dashboards,
- no access to problems,
- no access to API, and
- no permissions to execute frontend scripts.
When we are defining this new role, we will mark the corresponding checkboxes in the Monitoring section. The User type for this role is going to be ‘User’ because they don’t need to have access to Administration or Configuration.
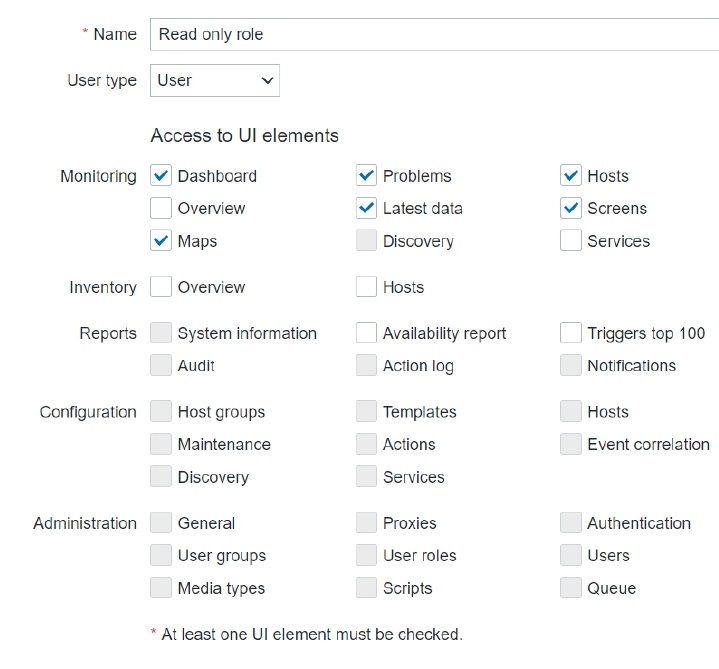
User type and sections the role has access to
We will also restrict access to actions, the API, and decide on the new UI element and module permission logic. Default access to new actions and modules will be restricted. Read up on Zabbix release notes to see if any new UI elements have been added in future releases!
Read-only role
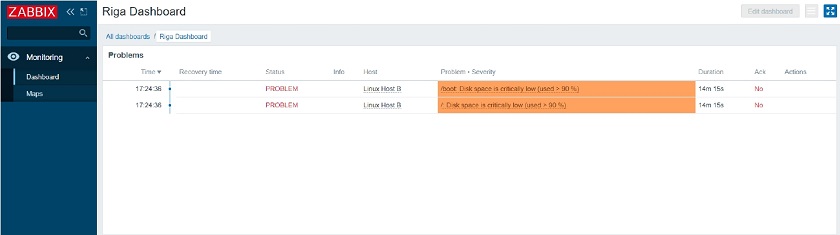
When we log in with this user and go to Dashboards, we will see that this user has no option to create or edit a dashboard because we have restricted such an action. The access is still granted based on the Dashboard permissions — depending on whether it is a public or a private dashboard. When they open it up, the data that they will see will depend on the User group to Host group relationship.
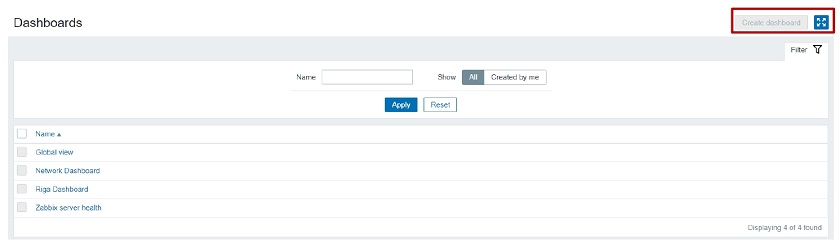
When this user opens up the frontend, he will see that access to the unnecessary UI elements is restricted (the restricted UI elements are hidden). Even though he has access to the Problem widget on the dashboard, they are unable to acknowledge or close the problem as we have restricted those actions.
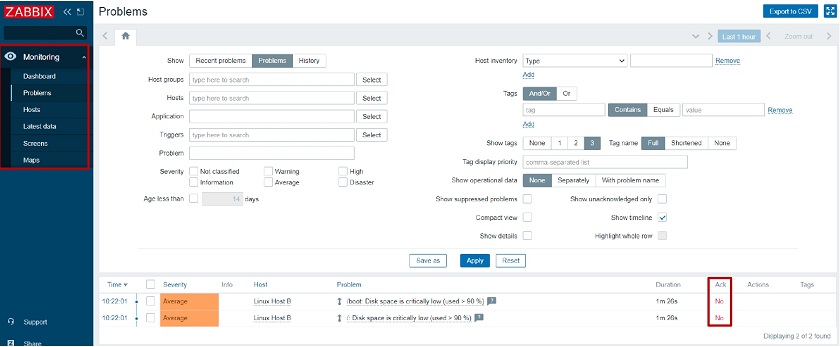
Restricted UI elements hidden and ‘Acknowledge’ button unclickable for this Role
Restrict access to Administration section
Another very interesting use case — restricting access to Administration sections. Administration sections are available only for our Super admins, but, in this case, we want to have a separate role of type Super admin that has some restrictions.
Our Super admin type role that has no access to User сonfiguration and General Zabbix settings will need to be able to:
- create and manage proxies,
- define media types and frontend scripts, and
- access the queue to check the health of our Zabbix instance.
But they won’t be able to create new User groups, Users, and so on.
So, we are opening our Administration > User roles section, creating a new role of type Super admin, and restricting all of the user-related sections, and also restricting access to Administration > General.
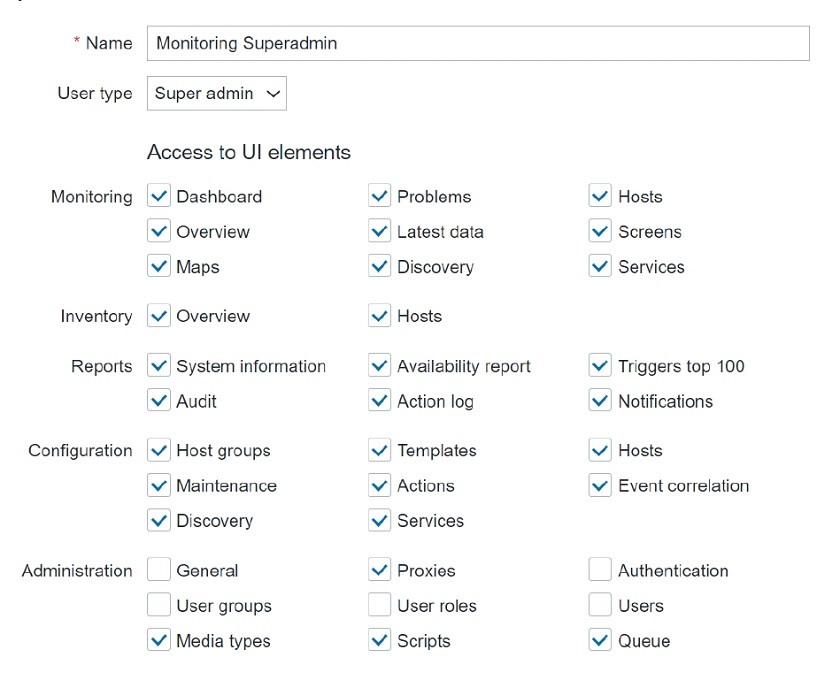
User type – Super admin. General and User sections are restricted for this role
When we log in, we can see that there is no access to Administration > General section because we have restricted the ability to change housekeeper settings, trigger severities, and other settings that are available in Administration > General.
But the Monitoring Super admin user still has the ability to create new Proxies, Media Types, Scripts and has access to the Queue section. This is a nice way to create different types of Super admins which was not possible before 5.2.
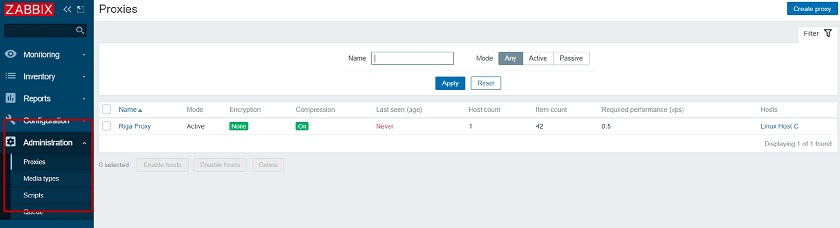
Access to Administration section elements
Roles for multi-tenant environment
Zabbix Dashboards and maps are used by multiple tenants to provide monitoring data.
In our example, we will imagine a customer portal that different tenants can access. They log in to Zabbix and based on their roles and permissions can access different elements. One of our Tenant requires a NOC role :
- read-only access to dashboards,
- read-only access to maps,
- no access to API,
- no access to configuration,
- isolation per tenant so we won’t be able to see the host status of other tenants.
We will create a new role in Administration > User roles — new role of type User. We will restrict access only to the UI elements that need to be visible for the users belonging to this role.

User type role with very limited access to UI
Since we need to have isolation, we will also be using tag-based permissions to isolate our Hosts per tenant. We’ll go to Permissions section, add read-only or write permissions on a User group to a specific Host group. Then we will also define the tag-based permissions so that these users have access only to problems that are tagged with a specific tag.
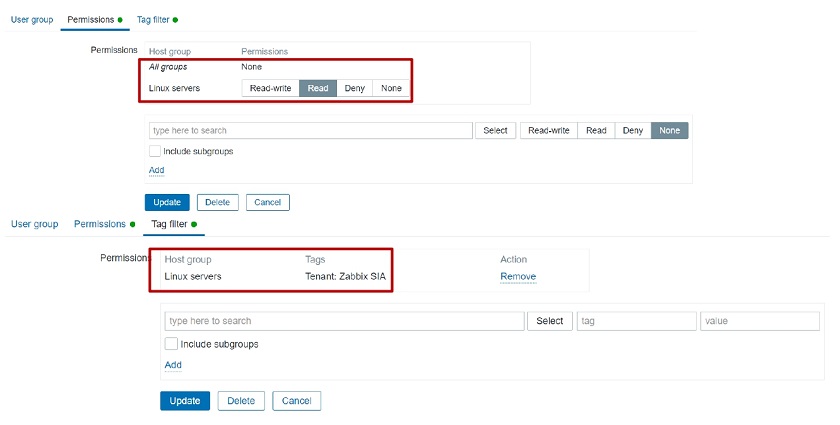
Tag-based permissions to isolate our Hosts per tenant
Don’t forget to actually tag those problems and define these tags either on the trigger level or on the host level.
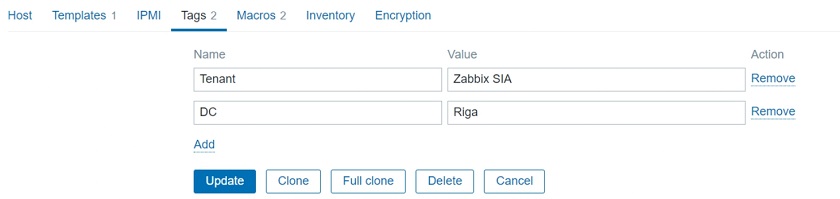
Tagging on the host level
Once we have implemented this, if we open up the UI, we go to Monitoring > Dashboards. We can see that:
- The UI is restricted only to the required monitoring sections.
- Tag-based permission ensure that we are seeing problems related to our specific tenant.
Isolation and role restriction have been implemented, and we can successfully have our multi-tenant environment.
Roles for multi-tenant environments
What’s next?
How would you proceed with upgrading to Zabbix 5.2 and implementing this? At the design stage, you need to understand that User roles can help you with a couple of things and you need to estimate and assign value to these things if you want to implement them in your environment.
- User roles can improve auditing. Since you have restricted roles per each user it’s easier to audit who did what in your environment.
- Restricting API access. We can not only enable or disable API access, but we can also restrict our users to specific methods. From the security and auditing perspective, this adds a lot of flexibility.
- Restricting configuration. We can restrict users to specific actions or limit their access to specific Configuration sections as in the example with the custom Super admin role. This allows us to have multiple tiers of admins in our environment
- Removing unwanted UI elements. By restricting access to only the necessary UI elements we can give Zabbix a much cleaner look and improve the UX of your users.
Thank you! I hope I gave you some insight into how roles can be used and how they will be implemented in Zabbix 5.2. I hope you aren’t too afraid to play around with this new set of features and implement them in your environment.
Questions & Answers
Question. Can we have a limited read-only user that will have access to all the hosts that are already in Zabbix and will be added in the future?
Answer. Yes, we can have access to all of the existing Host groups. But when you add a new Host Group, you will have to go to your Permissions section and assign User Group to Host Group permissions for the newly added group.
Question. So that means that now we can have a fully customizable multi-tenant environment?
Answer. Definitely. Fully customizable based both on our User group to Host group permissions and roles to make the actions and different UI sections available as per the requirements of our tenants.
Question. I want to create a user with only API access. Is that possible in 5.0 or 5.2?
Answer. It’s been possible for a while now. You can just disable the frontend access and leave the user with the respective permissions on specific Host groups. But with 5.2 you can make the API limitations more granular. So, you can say that this API-only user has access only to specific API methods
Question. Can we make a user who can see but cannot edit the configuration?
Answer. Partially. For read-only users, read-only access still works for the Monitoring section. But if we go to Configuration, if we want to see anything in the Configuration section, we need write access.You can use Monitoring > Hosts section, where you can see partial configuration. Configuration section unfortunately still is not available for read-only access.


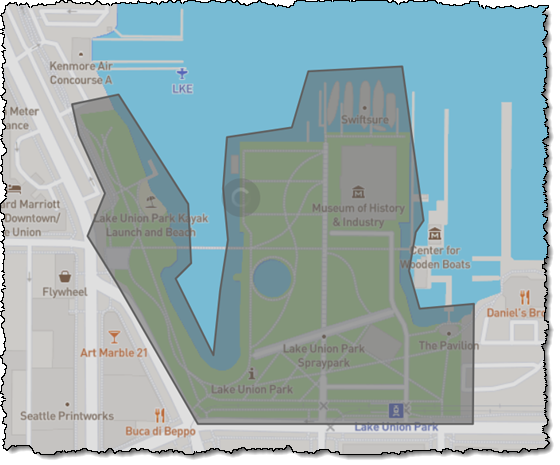
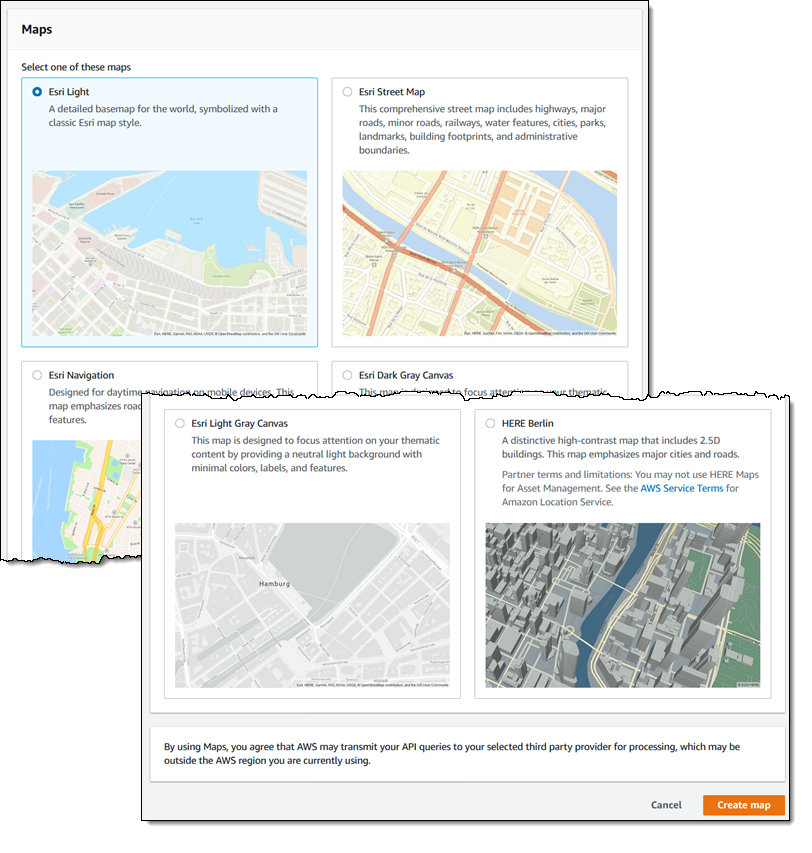
 We want to make it easier and more cost-effective for you to add maps, location awareness, and other location-based features to your web and mobile applications. Until now, doing this has been somewhat complex and expensive, and also tied you to the business and programming models of a single provider.