Tag Archives: Uncategorized

Existential Risk and the Fermi Paradox

Post Syndicated from Bruce Schneier original https://www.schneier.com/blog/archives/2022/12/existential-risk-and-the-fermi-paradox.html

We know that complexity is the worst enemy of security, because it makes attack easier and defense harder. This becomes catastrophic as the effects of that attack become greater.

In A Hacker’s Mind (coming in February 2023), I write:

Our societal systems, in general, may have grown fairer and more just over the centuries, but progress isn’t linear or equitable. The trajectory may appear to be upwards when viewed in hindsight, but from a more granular point of view there are a lot of ups and downs. It’s a “noisy” process.

Technology changes the amplitude of the noise. Those near-term ups and downs are getting more severe. And while that might not affect the long-term trajectories, they drastically affect all of us living in the short term. This is how the twentieth century could—statistically—both be the most peaceful in human history and also contain the most deadly wars.

Ignoring this noise was only possible when the damage wasn’t potentially fatal on a global scale; that is, if a world war didn’t have the potential to kill everybody or destroy society, or occur in places and to people that the West wasn’t especially worried about. We can’t be sure of that anymore. The risks we face today are existential in a way they never have been before. The magnifying effects of technology enable short-term damage to cause long-term planet-wide systemic damage. We’ve lived for half a century under the potential specter of nuclear war and the life-ending catastrophe that could have been. Fast global travel allowed local outbreaks to quickly become the COVID-19 pandemic, costing millions of lives and billions of dollars while increasing political and social instability. Our rapid, technologically enabled changes to the atmosphere, compounded through feedback loops and tipping points, may make Earth much less hospitable for the coming centuries. Today, individual hacking decisions can have planet-wide effects. Sociobiologist Edward O. Wilson once described the fundamental problem with humanity is that “we have Paleolithic emotions, medieval institutions, and godlike technology.”

Technology could easily get to the point where the effects of a successful attack could be existential. Think biotech, nanotech, global climate change, maybe someday cyberattack—everything that people like Nick Bostrom study. In these areas, like everywhere else in past and present society, the technologies of attack develop faster the technologies of defending against attack. But suddenly, our inability to be proactive becomes fatal. As the noise due to technological power increases, we reach a threshold where a small group of people can irrecoverably destroy the species. The six-sigma guy can ruin it for everyone. And if they can, sooner or later they will. It’s possible that I have just explained the Fermi paradox.

AWS Local Zones and AWS Outposts, choosing the right technology for your edge workload

Post Syndicated from Sheila Busser original https://aws.amazon.com/blogs/compute/aws-local-zones-and-aws-outposts-choosing-the-right-technology-for-your-edge-workload/

This blog post is written by Joe Sacco, Senior Technical Account Manager.

The AWS Global Cloud Infrastructure includes 30 Launched Regions, 96 Availability Zones (AZs), 410+ Points of Presence with 400+ Edge Locations, and 13 Regional Edge Caches.  With over 200 AWS services, most customer workloads can run in the AWS Regions. However, for some location-sensitive workloads with low-latency or data residency requirements, and when an AWS Region isn’t close enough, AWS offers two additional infrastructure options: AWS Local Zones and AWS Outposts. Although Local Zones and Outposts solve for similar problems, we’ll review use cases as well as the services and features available that can help you decide which offering best suits your needs.

Let’s start with an overview of Local Zones and Outposts.

What are Local Zones?

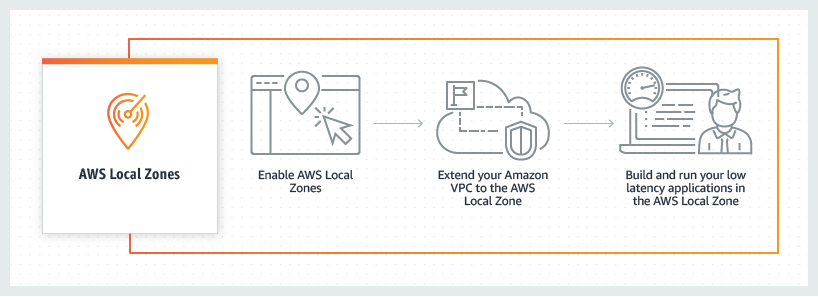
Local Zones are a new type of infrastructure deployment that places AWS compute, storage, database, and other select AWS services in large metropolitan areas closer to end users. This gives you access to single-digit millisecond latency with the use of AWS Direct Connect and the ability to meet data residency requirements. Local Zones are also connected to their parent Region via AWS’s redundant and high bandwidth private network. This gives applications running in Local Zones fast, secure, and seamless access to a complete list of services in the parent Region.

Unlike Outposts, which you deploy within your datacenter or a co-location of your choice, Local Zones are owned, managed, and operated by AWS. Local Zones eliminate the need for you to manage power, connectivity, and capacity. Furthermore, you can provision workloads on a Local Zone from your AWS Management Console just as you would for AZs and Regions today.

AWS Local Zones how it worksWhat is Outposts?

Outposts is a family of fully managed solutions delivering AWS infrastructure and services to virtually any on-premises or edge location for a truly consistent hybrid experience. Outposts lets you run some AWS services locally and connect to a broad range of services available in the local AWS Region. Outposts comes in two types of offerings: Outposts rack and Outposts servers, with which you can run applications and workloads on-premises using the same AWS infrastructure, services, tools, and APIs as in AWS Regions.

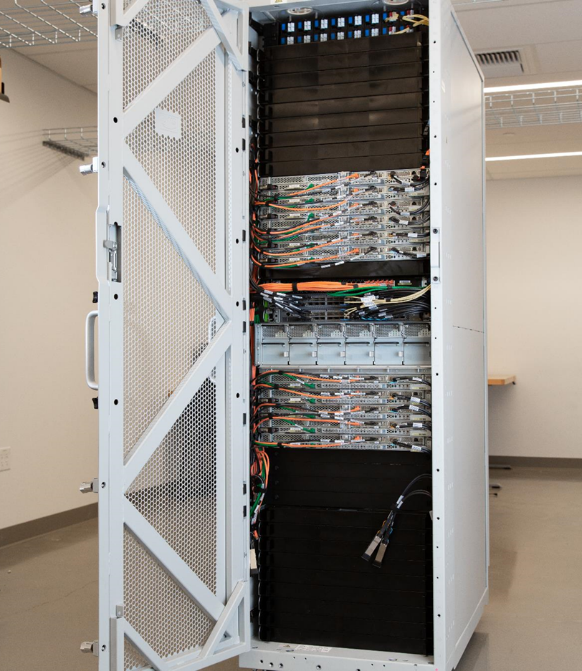
The Outposts rack is available as an industry standard 42U form factor. It provides the same AWS infrastructure, services, tools, and APIs to your data center or co-location space  that you would find in an AWS Region.

Outposts Rack

The Outposts servers come in a 1U or 2U form factor and are designed for locations that have limited space or smaller capacity requirements. Both support different compute instances, as detailed in the Outposts servers feature page.

Outposts ServersCustomer use cases

Now that we have an overview of both Local Zones and Outposts service offerings, let’s dive into use cases, the differences between them, and how your business can leverage each to accomplish your workloads requirements.

Low latency

Customers today require low latency computing for workloads, such as medical imaging, transaction processing for Enterprise Resource Planning (ERP) applications, enterprise migration with hybrid architecture, real-time multiplayer gaming, telco network function virtualization, and regulated gaming workloads.

Outposts can meet ultra-low latency requirements. This is accomplished by bringing AWS services on premises and to the edge at Outpost Sites. An Outpost site is the physical location where your Outpost operates, and it can be local within one of your data centers or at a co-location facility of your choice.

When accessing from within the same metro, Local Zones will provide you with a low, single millisecond latency experience when communicating with your applications. Latency between Local Zones and AWS Regions or Local Zones and on-premises environments varies, and these will depend on how close the nearest Local Zone is as well as the type of modality used for the connection (Public Internet, VPN, and AWS Direct Connect). You should always choose the closest Local Zone location to achieve the lowest possible latency. For use cases such as mobile gaming, you can utilize Local Zones by deploying your applications to a Local Zone location nearest to your end users. Local Zones are generally available in 17 metros across the US, 4 outside the US, and we are continuing to launch Local Zones in 30 cities across 25 countries. Check out updates for more general availability of Local Zones.

Data residency

On occasion, data must remain in a specific geographic region for regulatory or information security reasons. Healthcare and other regulated industries, such as financial services or Oil & Gas, have specific data residency requirements.

Outposts helps meet a customer’s data residency requirements because it’s installed on premises and essentially brings AWS to where the data currently resides. This allows you to pick and control where your workloads run, and where your data will stay. Check out the full list of countries and territories where Outposts is available on the FAQs page of Outposts rack and the FAQs page of Outposts servers.

Local Zones bring AWS closer or within a customer’s geographic boundary in a fully AWS owned and operated mode. Although Local Zones can help meet data residency use cases in some scenarios, data residency requirements vary depending on the jurisdictions. Therefore, you should work closely with your compliance and information security teams when choosing the Local Zone location in which to deploy your regulated workloads.

Migration and modernization

When trying to migrate to the cloud and modernize your stack, some workloads can be challenging. Often there are on-premises applications which are difficult to move into Regions due to latency-sensitive system intermittencies between their various components. As dependencies arise, you may choose to segment these migrations into smaller pieces. Then this will require latency-sensitive connectivity between the various parts of the application.

Outposts and Local Zones both allow for a gradual migration and modernization of your stack. You can choose to migrate parts of their workloads while still maintaining latency-sensitive connectivity between components until the entirety is ready to move.

Factors in selecting Local Zones or Outposts

Choosing between Local Zones and Outposts will depend on the following factors, and you should examine all of them together when selecting a service for your use case.

  1. Latency requirements

Local Zones can achieve low single millisecond latency when accessing within the same metro. On the other hand, Outposts can achieve ultra-low latency requirements when deployed within your datacenter or at a co-location facility of your choice. When selecting one over the other, you must work backward from your goal and workload requirements.

If you’re conducting a migration and modernization strategy which requires ultra-low latency between a workloads application and database tiers that are difficult to migrate to the AWS Regions, then Outposts would be the right solution for you.

Alternatively, if your workload involves streaming live broadcasts to end users which requires low single millisecond latency, but your end users are located where an AWS Region isn’t available, then Local Zones distributed across various metros would work best to serve your content.

  1. Availability of services needed to support your workload

Local Zones and Outposts differ with their list of supported AWS services, and you must review your workload’s service requirements when determining the best fit for you. For example, if a customer has a computer vision workload that requires storing and retrieving large volumes of images locally using Amazon Simple Storage Service (Amazon S3), then Outposts and certain Local Zones meet this requirement while other Local Zones don’t. Learn how you can use Amazon S3 on Outposts for computer vision workloads.

Outposts rack and servers support different sets of AWS services locally. You can view comparisons between them, or visit the Outposts servers and Outposts rack feature sites for more details.

Local Zones’ features vary depending on the location in which you choose to deploy. You can view more details and a full list of supported features and services per location on our Local Zones features page.

  1. Investment and management of infrastructure on-premises

Management of the infrastructure and prerequisites are another factor when considering which AWS service best suits your needs.

Outposts is ordered through AWS, and it requires installation in a customer’s on-premises datacenter or co-location provider of their choice. Outposts rack installation is handled by AWS, while Outposts servers installation is done by the customer or a third-party of their choosing. There are power and redundant networking requirements for the Outpost Site, as well as a required subscription to AWS Enterprise Support or On-Ramp Support.

Local Zones infrastructure is fully-managed by AWS, including the power, networking, and capacity. This reduces operational management as well as the overhead cost for customers. An Enterprise support agreement isn’t required to utilize Local Zones.

You should always choose Regions or Local Zones if your use case allows, and use Outposts when a Region or Local Zone isn’t a good fit. If both Outposts and Local Zones fit a customer’s use case and requirements, then Local Zones will be the preferred choice.

  1. Regulations, compliance, and information security

If a Local Zone is either unavailable or unable to meet your residency requirements within your geographic boundary consider Outposts, which can be deployed to a data center or co-location facility of your choice. Data residency requirements can be a factor based on your industry and the regulations to which your workload must adhere. Furthermore, you should work closely with your compliance and information security teams when choosing between Local Zones or Outposts.

Conclusion

Whether you’re dealing with latency-sensitive applications, data residency requirements, or a migration and modernization strategy, AWS provides options and flexibility for you to leverage the same AWS infrastructure, services, APIs, and tools to metro areas and on-premises locations with Local Zones and Outposts.

The decision of which technology to use will depend on several factors that we discussed above. You must work across teams within your organization to make sure that the latency requirements (low single millisecond latency within a metro for Local Zones vs the ultra low latency of Outposts when deployed close to or within your datacenter), data reseidency needs, installation prerequisites, and availability of services to support your workload are met.

Once these factors are taken into account, and you have made a choice, visit our product pages for Outposts and Local Zones with information on how you can get started.
Sirius XM Software Vulnerability

Post Syndicated from Bruce Schneier original https://www.schneier.com/blog/archives/2022/12/sirius-xm-software-vulnerability.html

This is new:

Newly revealed research shows that a number of major car brands, including Honda, Nissan, Infiniti, and Acura, were affected by a previously undisclosed security bug that would have allowed a savvy hacker to hijack vehicles and steal user data. According to researchers, the bug was in the car’s Sirius XM telematics infrastructure and would have allowed a hacker to remotely locate a vehicle, unlock and start it, flash the lights, honk the horn, pop the trunk, and access sensitive customer info like the owner’s name, phone number, address, and vehicle details.

Cars are just computers with four wheels and an engine. It’s no surprise that the software is vulnerable, and that everything is connected.

Facebook Fined $276M under GDPR

Post Syndicated from Bruce Schneier original https://www.schneier.com/blog/archives/2022/11/facebook-fined-276m-under-gdpr.html

Facebook—Meta—was just fined $276 million (USD) for a data leak that included full names, birth dates, phone numbers, and location.

Meta’s total fine by the Data Protection Commission is over $700 million. Total GDPR fines are over €2 billion (EUR) since 2018.

Reducing Java cold starts on AWS Lambda functions with SnapStart

Post Syndicated from Eric Johnson original https://aws.amazon.com/blogs/compute/reducing-java-cold-starts-on-aws-lambda-functions-with-snapstart/

Written by Mark Sailes, Senior Serverless Solutions Architect, AWS.

At AWS re:Invent 2022, AWS announced SnapStart for AWS Lambda functions running on Java Corretto 11. This feature enables customers to achieve up to 10x faster function startup performance for Java functions, at no additional cost, and typically with minimal or no code changes.

Overview

Today, for Lambda’s function invocations, the largest contributor to startup latency is the time spent initializing a function. This includes loading the function’s code and initializing dependencies. For interactive workloads that are sensitive to start-up latencies, this can cause suboptimal end user experience.

To address this challenge, customers either provision resources ahead of time, or spend effort building relatively complex performance optimizations, such as compiling with GraalVM native-image. Although these workarounds help reduce the startup latency, users must spend time on some heavy lifting instead of focusing on delivering business value. SnapStart addresses this concern directly for Java-based Lambda functions.

How SnapStart works

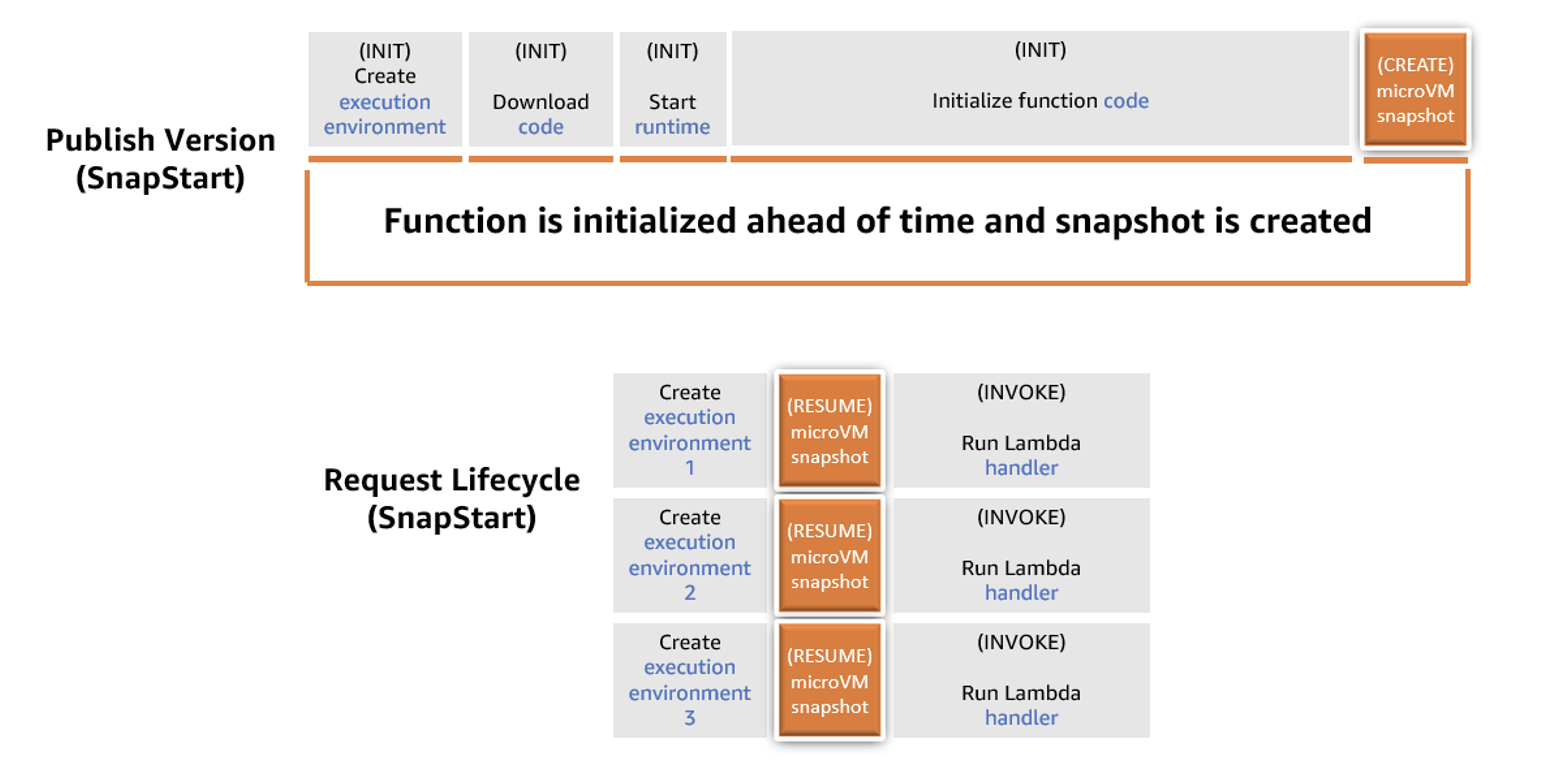
With SnapStart, when a customer publishes a function version, the Lambda service initializes the function’s code. It takes an encrypted snapshot of the initialized execution environment, and persists the snapshot in a tiered cache for low latency access.

When the function is first invoked and then scaled, Lambda resumes the execution environment from the persisted snapshot instead of initializing from scratch. This results in a lower startup latency.

Lambda function lifecycle

Lambda function lifecycle

A function version activated with SnapStart transitions to an inactive state if it remains idle for 14 days, after which Lambda deletes the snapshot. When you try to invoke a function version that is inactive, the invocation fails. Lambda sends a SnapStartNotReadyException and begins initializing a new snapshot in the background, during which the function version remains in Pending state. Wait until the function reaches the Active state, and then invoke it again. To learn more about this process and the function states, read the documentation.

Using SnapStart

Application frameworks such as Spring give developers an enormous productivity gain by reducing the amount of boilerplate code they write to accomplish common tasks. When first created, frameworks didn’t have to consider startup time because they run on application servers, which run for long periods of time. The startup time is minimal compared to the running duration. You often only restart them when there is an application version change.

If the functionality that these frameworks bring is implemented at runtime, then they often contribute to latency in startup time. SnapStart allows you to use frameworks like Spring and not compromise tail latency.

To demonstrate SnapStart, I use a sample application that saves records into Amazon DynamoDB. This Spring Boot application (TODO Link) uses a REST controller to handle CRUD requests. This sample includes infrastructure as code to deploy the application using the AWS Serverless Application Model (AWS SAM). You must install the AWS SAM CLI to deploy this example.

To deploy:

  1. Clone the git repository and change to project directory:
    git clone https://github.com/aws-samples/serverless-patterns.git
    cd serverless-patterns/apigw-lambda-snapstart
  2. Use the AWS SAM CLI to build the application:
    sam build
  3. Use the AWS SAM CLI to deploy the resources to your AWS account:
    sam deploy -g

This project deploys with SnapStart already enabled. To enable or disable this functionality in the AWS Management Console:

  1. Navigate to your Lambda function.
  2. Select the Configuration tab.
  3. Choose Edit and change the SnapStart attribute to PublishedVersions.
  4. Choose Save.

    Lambda Console confoguration

    Lambda Console confoguration

  5. Select the Versions tab and choose Publish new.
  6. Choose Publish.

Once you’ve enabled SnapStart, Lambda publishes all subsequent versions with snapshots. The time to run your publish version depends on your init code. You can run init up to 15 minutes with this feature.

Considerations

Stale credentials

Using SnapStart and restoring from a snapshot often changes how you create functions. With on-demand functions, you might access one time data in the init phase, and then reuse it during future invokes. If this data is ephemeral, a database password for example, then there might be a time between fetching the secret and using it, that the password has changed leading to an error. You must write code to handle this error case.

With SnapStart, if you follow the same approach, your database password is persisted in an encrypted snapshot. All future execution environments have the same state. This can be days, weeks, or longer after the snapshot is taken. This makes it more likely that your function has the incorrect password stored. To improve this, you could move the functionality to fetch the password to the post-snapshot hook. With each approach, it is important to understand your application’s needs and handle errors when they occur.

Demo application architecture

Demo application architecture

A second challenge in sharing the initial state is with randomness and uniqueness. If random seeds are stored in the snapshot during the initialization phase, then it may cause random numbers to be predictable.

Cryptography

AWS has changed the managed runtime to help customers handle the effects of uniqueness and randomness when restoring functions.

Lambda has already incorporated updates to Amazon Linux 2 and one of the commonly used cryptographic libraries, OpenSSL (1.0.2), to make them resilient to snapshot operations. AWS has also validated that Java runtime’s built-in RNG java.security.SecureRandom maintains uniqueness when resuming from a snapshot.

Software that always gets random numbers from the operating system (for example, from /dev/random or /dev/urandom) is already resilient to snapshot operations. It does not need updates to restore uniqueness. However, customers who prefer to implement uniqueness using custom code for their Lambda functions must verify that their code restores uniqueness when using SnapStart.

For more details, read Starting up faster with AWS Lambda SnapStart and refer to Lambda documentation on SnapStart uniqueness.

Runtime hooks

These pre- and post-hooks give developers a way to react to the snapshotting process.

For example, a function that must always preload large amounts of data from Amazon S3 should do this before Lambda takes the snapshot. This embeds the data in the snapshot so that it does not need fetching repeatedly. However, in some cases, you may not want to keep ephemeral data. A password to a database may be rotated frequently and cause unnecessary errors. I discuss this in greater detail in a later section.

The Java managed runtime uses the open-source Coordinated Restore at Checkpoint (CRaC) project to provide hook support. The managed Java runtime contains a customized CRaC context implementation that calls your Lambda function’s runtime hooks before completing snapshot creation and after restoring the execution environment from a snapshot.

The following function example shows how you can create a function handler with runtime hooks. The handler implements the CRaC Resource and the Lambda RequestHandler interface.

...
import org.crac.Resource;
import org.crac.Core;
...

public class HelloHandler implements RequestHandler<String, String>, Resource {

    public HelloHandler() {
        Core.getGlobalContext().register(this);
    }

    public String handleRequest(String name, Context context) throws IOException {
        System.out.println("Handler execution");
        return "Hello " + name;
    }

    @Override
    public void beforeCheckpoint(org.crac.Context<? extends Resource> context) throws Exception {
        System.out.println("Before Checkpoint");
    }

    @Override
    public void afterRestore(org.crac.Context<? extends Resource> context) throws Exception {
        System.out.println("After Restore");
    }
}

For the classes required to write runtime hooks, add the following dependency to your project:

Maven

<dependency>
  <groupId>io.github.crac</groupId>
  <artifactId>org-crac</artifactId>
  <version>0.1.3</version>
</dependency>

Gradle

implementation 'io.github.crac:org-crac:0.1.3'

Priming

SnapStart and runtime hooks give you new ways to build your Lambda functions for low startup latency. You can use the pre-snapshot hook to make your Java application as ready as possible for the first invoke. Do as much as possible within your function before the snapshot is taken. This is called priming.

When you upload your zip file of Java code to Lambda, the zip contains .class files of bytecode. This can be run on any machine with a JVM. When the JVM executes your bytecode, it is initially interpreted, then compiled into native machine code. This compilation stage is relatively CPU intensive and happens just in time (JIT Compiler).

You can use the before snapshot hook to run code paths before the snapshot is taken. The JVM compiles these code paths and the optimization is kept for future restores. For example, if you have a function that integrates with DynamoDB, you can make a read operation in your before snapshot hook.

This means that your function code, the AWS SDK for Java, and any other libraries used in that action are compiled and kept within the snapshot. The JVM then won’t need to compile this code when your function is invoked, meaning your latency is less the first time an execution environment is invoked.

Priming requires that you understand your application code and the consequences of executing it. The sample application includes a before snapshot hook, which primes the application by making a read operation from DynamoDB. (TODO Link)

Metrics

The following chart reflects invoking the sample application Lambda function 100 times per second for 10 minutes. This test is based on this function, both with and without SnapStart.


p50 p99.9
On-demand 7.87ms 5,114ms
SnapStart 7.87ms 488ms

Conclusion

This blog shows how SnapStart reduces startup (cold-start) latencies times for Java-based Lambda functions. You can configure SnapStart using AWS SDK, AWS CloudFormation, AWS SAM, and CDK.

To learn more, see Configuring function options in the AWS documentation. This functionality may require some minimal code changes. In most cases, the existing code is already compatible with SnapStart. You can now bring your latency-sensitive Java-based workloads to Lambda and run with improved tail latencies.

This feature allows developers to use the on-demand model in Lambda with low-latency response times, without incurring extra cost. To read more about how to use SnapStart with partner frameworks, find out more from Quarkus and Micronaut. To read more about this and other features, visit Serverless Land.

Starting up faster with AWS Lambda SnapStart

Post Syndicated from Eric Johnson original https://aws.amazon.com/blogs/compute/starting-up-faster-with-aws-lambda-snapstart/

This blog written by Tarun Rai Madan, Sr. Product Manager, AWS Lambda, and Mike Danilov, Sr. Principal Engineer, AWS Lambda.

AWS Lambda SnapStart is a new performance optimization developed by AWS that can significantly improve the startup time for applications. Announced at AWS re:Invent 2022, the first capability to feature SnapStart is Lambda SnapStart for Java. This feature delivers up to 10x faster function startup times for latency-sensitive Java applications at no extra cost, and with minimal or no code changes.

Overview

When applications start up, whether it’s an app on your phone, or a serverless Lambda function, they go through initialization. The initialization process can vary based on the application and the programming language, but even the smallest applications written in the most efficient programming languages require some kind of initialization before they can do anything useful. For a Lambda function, the initialization phase involves downloading the function’s code, starting the runtime and any external dependencies, and running the function’s initialization code. Ordinarily, for a Lambda function, this initialization happens every time your application scales up to create a new execution environment.

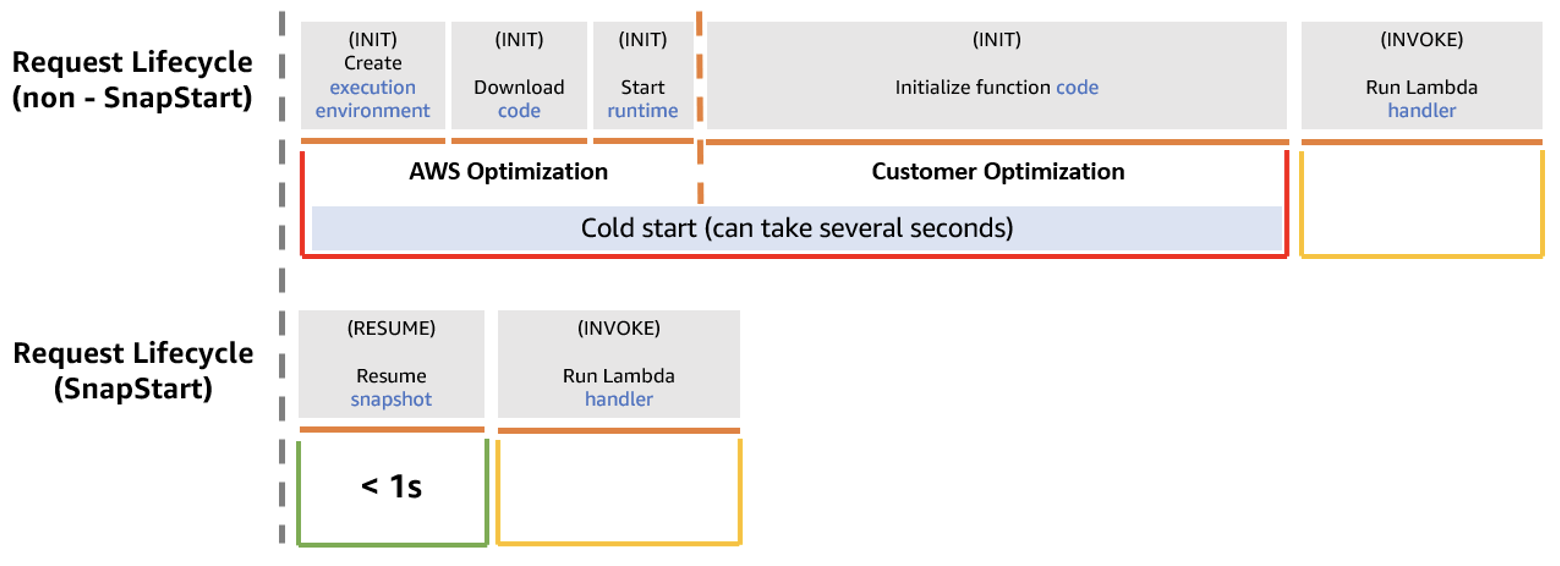
With SnapStart, the function’s initialization is done ahead of time when you publish a function version. Lambda takes a Firecracker microVM snapshot of the memory and disk state of the initialized execution environment, encrypts the snapshot, and caches it for low-latency access. When your application starts up and scales to handle traffic, Lambda resumes new execution environments from the cached snapshot instead of initializing them from scratch, improving startup performance.

The following diagram compares a cold start request lifecycle for a non-SnapStart function and a SnapStart function. The time it takes to initialize the function, which is the predominant contributor to high startup latency, is replaced by a faster resume phase with SnapStart.

Diagram of a non-SnapStart function versus a SnapStart function

Diagram of a non-SnapStart function versus a SnapStart function

Request lifecycle for a non-SnapStart function versus a SnapStart function

Front loading the initialization phase can significantly improve the startup performance for latency-sensitive Lambda functions, such as synchronous microservices that are sensitive to initialization time. Because Java is a dynamic language with its own runtime and garbage collector, Lambda functions written in Java can be amongst the slowest to initialize. For applications that require frequent scaling, the delay introduced by initialization, commonly referred to as a cold start, can lead to a suboptimal experience for end users. Such applications can now start up faster with SnapStart.

AWS’ work in Firecracker makes it simple to use SnapStart. Because SnapStart uses micro Virtual Machine (microVM) snapshots to checkpoint and restore full applications, the approach is adaptable and general purpose. It can be used to speed up many kinds of application starts. While microVMs have long been used for strong secure isolation between applications and environments, the ability to front-load initialization with SnapStart means that microVMs can also augment performance savings at scale.

SnapStart and uniqueness

Lambda SnapStart speeds up applications by re-using a single initialized snapshot to resume multiple execution environments. As a result, unique content included in the snapshot during initialization is reused across execution environments, and so may no longer remain unique. A class of applications where uniqueness of state is a key consideration is cryptographic software, which assumes that the random numbers are truly random (both random and unpredictable). If content such as a random seed is saved in the snapshot during initialization, it is re-used when multiple execution environments resume and may produce predictable random sequences.

To maintain uniqueness, you must verify before using SnapStart that any unique content previously generated during the initialization now gets generated after that initialization. This includes unique IDs, unique secrets, and entropy used to generate pseudo-randomness.

Multiple execution environments resumed from a shared snapshot

SnapStart life cycle

SnapStart life cycle

However, we have implemented a few things to make it easier for customers to maintain uniqueness.

First, it is not common or a best practice for applications to generate these unique items directly. Still, it’s worth confirming that your application handles uniqueness correctly. That’s usually a matter of checking for any unique IDs, keys, timestamps, or “homemade” entropy in the initializer methods for your function.

Lambda offers a SnapStart scanning tool that checks for certain categories of code that assume uniqueness, so customers can make changes as required. The SnapStart scanning tool is an open-source SpotBugs plugin that runs static analysis against a set of rules and reports “potential SnapStart bugs”. We are committed to engaging with the community to expand these set of rules against which the scanning tool checks the code.

As an example, the following Lambda function creates a unique log stream for each execution environment during initialization. This unique value is re-used across execution environments when they re-use a snapshot.

public class LambdaUsingUUID {

    private AWSLogsClient logs;
    private final UUID sandboxId;

    public LambdaUsingUUID() {
       sandboxId = UUID.randomUUID(); // <-- unique content created
       logs = new AWSLogsClient();
    }
    @Override
    public String handleRequest(Map<String,String> event, Context context) {
       CreateLogStreamRequest request = new CreateLogStreamRequest(
         "myLogGroup", sandboxId + ".log9.txt");
         logs.createLogStream(request);     
         return "Hello world!";
    }
} 

When you run the scanning tool on the previous code, the following message helps identify a potential implementation that assumes uniqueness. One way to address such cases is to move the generation of the unique ID inside your function’s handler method.

H C SNAP_START: Detected a potential SnapStart bug in Lambda function initialization code. At LambdaUsingUUID.java: [line 7]

A best practice used by many applications is to rely on the system libraries and kernel for uniqueness. These have long-handled other cases where keys and IDs may be inadvertently duplicated, such as when forking or cloning processes. AWS has worked with upstream kernel maintainers and open source developers so that the existing protection mechanisms use the open standard VM Generation ID (vmgenid) that SnapStart supports. vmgenid is an emulated device, which exposes a 128-bit, cryptographically random integer value identifier to the kernel, and is statistically unique across all resumed microVMs.

Lambda’s included versions of Amazon Linux 2, OpenSSL (1.0.2), and java.security.SecureRandom all automatically re-initialize their randomness and secrets after a SnapStart. Software that always gets random numbers from the operating system (for example, from /dev/random or /dev/urandom) does not need any updates to maintain randomness. Because Lambda always reseeds /dev/random and /dev/urandom when restoring a snapshot, random numbers are not repeated even when multiple execution environments resume from the same snapshot.

Lambda’s request IDs are already unique for each invocation and are available using the getAwsRequestId() method of the Lambda request object. Most Lambda functions should require no modification to run with SnapStart enabled. It’s generally recommended that for SnapStart, you do not include unique state in the function’s initialization code, and use cryptographically secure random number generators (CSPRNGs) when needed.

Second, if you do want to create unique data directly in a Lambda function initialization phase, Lambda supports two new runtime hooks. Runtime hooks are available as part of the open-source Coordinated Restore at Checkpoint (CRaC) project. You can use the beforeCheckpoint hook to run code immediately before a snapshot is taken, and use the afterRestore hook to run code immediately after restoring a snapshot. This helps you delete any unique content before the snapshot is created, and restore any unique content after the snapshot is restored. For an example of how to use CRaC with a reference application, see the CRaC GitHub repository.

Conclusion

This blog describes how SnapStart optimizes startup performance under the hood, and outlines considerations around uniqueness. We also introduce the new interfaces that AWS Lambda provides (via scanning tool and runtime hooks) to customers to maintain uniqueness for their SnapStart functions.

SnapStart is made possible by several pieces of open-source work, including Firecracker, Linux, CraC, OpenSSL and more. AWS is grateful to the maintainers and developers who have made this possible. With this work, we’re excited to launch Lambda SnapStart for Java as what we hope is the first amongst many other capabilities to benefit from the performance savings and enhanced security that SnapStart microVMs provide.

For more serverless learning resources, visit Serverless Land.

Monitoring shared AWS Outposts rack capacity

Post Syndicated from Sheila Busser original https://aws.amazon.com/blogs/compute/monitoring-shared-aws-outposts-rack-capacity/

This post is written by Adam Imeson, Sr. Hybrid Edge Specialist Solutions Architect.

AWS Outposts rack is a fully-managed service that offers the same AWS infrastructure, APIs, tools, and a subset of AWS services to any data center, colocation space, or on-premises facility for a consistent hybrid experience. Outposts rack is ideal for workloads that require low latency, access to on-premises systems, local data processing, data residency, and migration of applications with local system interdependencies.

An Outpost is a pool of AWS compute and storage capacity deployed at a customer site. In an Outposts rack deployment, an Outpost may comprise of one or more racks connected together at the site. It’s common for customers to order their Outpost in a dedicated account and then integrate with their multi-account organizational architecture by sharing the Outpost via AWS Resource Access Manager (AWS RAM). This post will explain how to set up cross-account Amazon CloudWatch metrics so that disparate stakeholders within your organization can effectively monitor your Outpost’s capacity to meet their specific needs.

Overview

The AWS account that you use to order an Outpost owns that Outpost. This includes all metrics and health events pertaining to that Outpost. Many customers must integrate Outposts into their multi-account environments, as discussed in the “Best practices: AWS Outposts in a multi-account AWS environment” posts (part 1 and part 2). This post will go into more detail on how to monitor Outposts in these environments.

The nuance here stems from the different ways to share access to AWS resources. AWS RAM allows infrastructure resources to be shared across multiple accounts. Then, the consumer accounts can launch resources on the infrastructure as though they owned it. AWS Identity and Access Management (IAM) allows customers to modify a given account’s permissions such that users in other accounts can make AWS API calls that affect the given account.

An Outpost provides infrastructure resources, so customers can share Outposts via AWS RAM. CloudWatch metrics about Outposts are data which customers retrieve using AWS API calls, so customers can share access to those metrics using IAM.

In a typical customer’s AWS Organization, there are two cases to consider. First, when the customer is sharing an Outpost to multiple development accounts, each account needs to view metrics relevant to the Outpost so that the development accounts can deploy and operate their applications.Diagram depicting an Outpost that a customer has shared to three different accounts using RAM. The three different accounts each have a different application deployed in them.

Second, when the customer has several accounts that each own different Outposts, the customer’s centralized monitoring account needs to track metrics relevant to each of the Outposts.

Diagram depicting three accounts that each own a separate Outpost, with all three accounts sharing Outpost metrics to CloudWatch in the customer’s central monitoring account.

This post will explain strategies for both cases.

Customers must monitor the health of the Outpost’s connection to its regional control plane (the Outpost’s service link), as an Outpost is an extension of an AWS Availability Zone (AZ) and is designed to be connected to an AZ at all times. The health of the Outpost’s service link is a crucial variable when application owners are diagnosing disruptions to their application, and also when infrastructure owners are diagnosing disruptions to a site. Customers can monitor their service link’s status with the ConnectedStatus metric.

Customers also must monitor their Outposts’ current capacity. Outposts necessarily have a limited capacity footprint when compared to an AWS Region. Application owners must make informed decisions about capacity as they scale their apps over time or respond to occasional hardware failures. Infrastructure owners also must maintain a holistic view of capacity across all of the Outposts for which they are responsible so that they can plan for capacity expansion over time. Customers can monitor their Outposts’ capacity using the various capacity metrics that Outposts provide.

For an overview of how to set up a capacity dashboard and capacity-based CloudWatch alarms within a single account, see “Monitoring AWS Outposts capacity.” This post will expand on the single-account strategy by introducing cross-account capabilities. See also “Cross-Account Cross-Region Dashboards with Amazon CloudWatch.” These two posts provide practical walkthroughs for setting up the metric flows explained below.

Setting up Outposts metric permissions for your organization

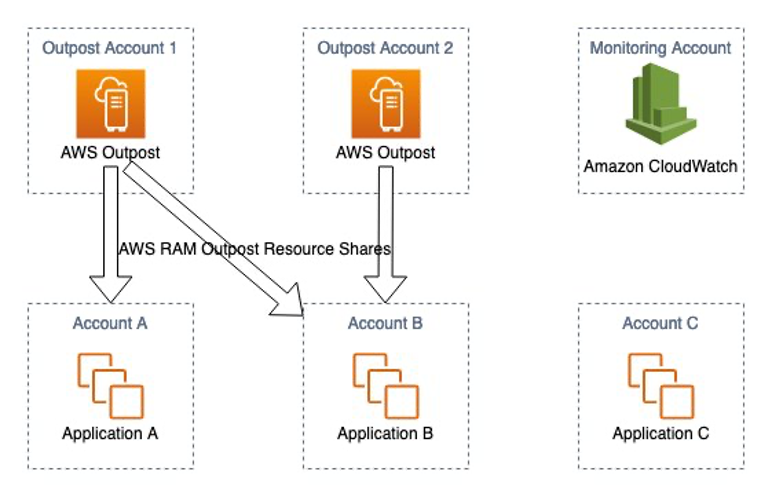
This post assumes that you have multiple Outposts in different accounts that are all part of the same Organization. You’re sharing these Outposts into accounts that development teams use to deploy and operate their applications. You also have a centralized monitoring account where your infrastructure team tracks various metrics across all accounts. Your Organization might look something like this:

A base diagram depicting six AWS accounts with different names. Outpost Account 1 contains an Outpost. Outpost Account 2 contains a different Outpost. Monitoring Account contains Amazon CloudWatch. Accounts A through C contain Applications A through C respectively.

The first Outpost is shared to Accounts A and B, and the second Outpost is only shared to Account B. This is just an example of how a customer might set up their environment so that Application A can deploy on Outpost 1, and Application B can deploy on both Outpost 1 and 2.

The same base diagram of the six AWS accounts as before, with arrows added to depict AWS RAM resource shares. Outpost Account 1 shares its Outpost to Accounts A and B. Outpost Account 2 shares its Outpost to Account B.

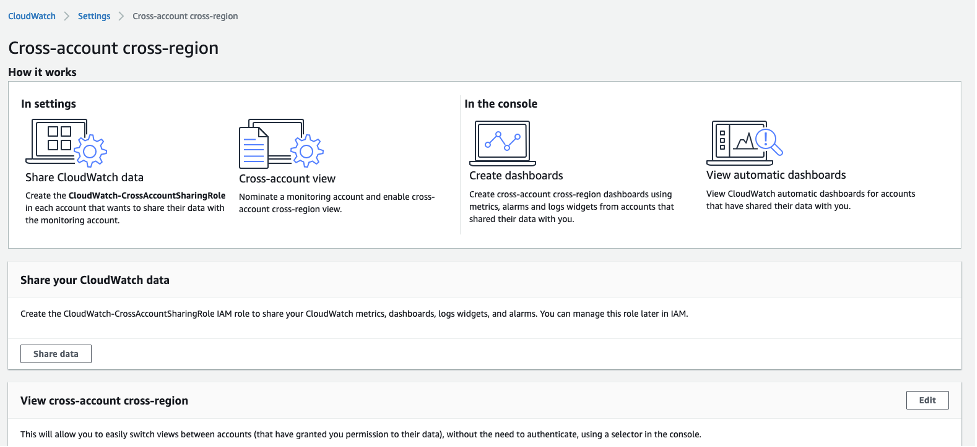
To enable centralized monitoring, each account shares CloudWatch metrics with the central monitoring account as described in “Cross-Account Cross-Region Dashboards with Amazon CloudWatch.”

The same base diagram of the six AWS accounts, with arrows added to depict CloudWatch metrics being shared from all five of the other accounts to the Monitoring Account.

Now there are application accounts which can launch on the desired Outposts, and all of the accounts are sharing metrics with the central monitoring account. The team responsible for procuring and managing the Outposts can now set up dashboards in the central monitoring account in accordance with “Monitoring AWS Outposts capacity” to get a holistic view of capacity. This is valuable for capacity planning as applications naturally grow over time.

However, this may not be sufficient for operations. Consider that each application team needs to understand how much capacity is available on the Outpost that they’re using. This is crucial for teams operating highly available applications to maintain awareness of whether they still have N+1 capacity available on the Outpost to use in the event of a hardware failure. This is also important for planning expansions to the application ahead of time, as application teams have the best understanding of the future needs of their applications. Finally, application teams can use the metrics to track the operational health of the Outpost, which is crucial for root-causing any application disruptions.

You can implement this by sharing CloudWatch metrics from the Outpost accounts to the application accounts which are consuming the Outposts’ capacity, as shown in the following diagram.

The same base diagram of the six AWS accounts, with arrows depicting CloudWatch metrics being shared. Outpost Account 1 is sharing CloudWatch metrics to Accounts A and B. Outpost Account 2 is sharing CloudWatch metrics to Account B.

Walkthrough

Log in to your application account and navigate to the CloudWatch console. Open the Settings menu and choose Configure.

Screenshot of the CloudWatch Console’s Settings menu.

Scroll to the bottom. In the View cross-account cross-region section, choose Edit.

Screenshot of the Cross-account cross-region sub-menu in the CloudWatch console.

Choose your preferred account selection method from the three options and choose Save changes. I recommend the Custom account selector option, as it strikes a good balance between a simple setup and ease of use. If you choose this option, then input the Outpost owner account’s account ID and a human-readable name for the account. This name will appear in the drop-down when you’re using the CloudWatch console to view metrics from other accounts later.

Screenshot of the Cross-account cross-region sub-menu in the CloudWatch console, with the “Custom account selector” option selected and “123456789012 Outpost owner account” in the input field.

Your application account is now prepared to view metrics from the Outpost owner account. Now log in to the account that owns the Outpost and navigate to the CloudWatch console. You still need to share the Outpost’s metrics to the application account. Open the Settings page again, and choose Configure in the Cross-account cross-region section as before. This time, choose Share data in the Share your CloudWatch data section:

Screenshot of the Cross-account cross-region sub-menu in the CloudWatch console, with the “Share data” button circled in red in the “Share your CloudWatch data” section.

Choose Add account and input the application account’s account ID. Then scroll to the bottom of the page and choose Launch CloudFormation template.

Screenshot of the “Share your CloudWatch data sub-menu in the CloudWatch console. The “Specific accounts” option in the “Sharing” section is highlighted, and the sample account ID “234567890123” is typed into the input field.

The AWS CloudFormation template will create the CloudWatch-CrossAccountSharingRole. This role gives CloudWatch read access to the AWS account that you specified, the application account. You can view and modify this role using the IAM console if you want to. For example, you might adjust the role to allow read access to an entire Organizational Unit (OU).

Now, log back in to the application account and navigate to the CloudWatch console. Choose All metrics in the left-side menu. In the Metrics section, select the Outpost owner account from the drop-down.

Screenshot of the CloudWatch console’s “All metrics” sub-page. The account selection drop-down is circled in red in the “Metrics” subsection.

You can now view the metrics from the Outpost owner account and incorporate them into the dashboards in the application account. Now the application teams can track the Outposts’ ConnectedStatus metrics to be alerted on any disconnections from the region, and they can track the Outposts’ capacity metrics as well. It’s a best practice to alarm on Outpost capacity metrics once a consumption threshold defined by business needs has been breached.

Conclusion

Outposts rack allows customers to deploy AWS infrastructure into virtually any data center, colocation space, or on-premises facility. Outposts are tied to the AWS account that ordered them, and customers can share Outposts among AWS accounts within the same Organization. When multiple teams within a customer’s Organization are interacting with the same Outpost, that introduces additional monitoring surface area for capacity and service health. This post explains how customers can accommodate their teams’ different needs by sharing Outposts metrics around their Organization along with their Outposts. As best practices, customers should share their Outposts capacity and ConnectedStatus metrics to teams who are running applications on Outposts. Customers’ operations teams should also work with their stakeholders to define a maximum capacity utilization threshold for a given Outpost and alarm on that threshold.

Charles V of Spain Secret Code Cracked

Post Syndicated from Bruce Schneier original https://www.schneier.com/blog/archives/2022/11/charles-v-of-spain-secret-code-cracked.html

Diplomatic code cracked after 500 years:

In painstaking work backed by computers, Pierrot found “distinct families” of about 120 symbols used by Charles V. “Whole words are encrypted with a single symbol” and the emperor replaced vowels coming after consonants with marks, she said, an inspiration probably coming from Arabic.

In another obstacle, he used meaningless symbols to mislead any adversary trying to decipher the message.

The breakthrough came in June when Pierrot managed to make out a phrase in the letter, and the team then cracked the code with the help of Camille Desenclos, a historian. “It was painstaking and long work but there was really a breakthrough that happened in one day, where all of a sudden we had the right hypothesis,” she said.

BloomIP Automatically Identifies production issues with Amazon DevOps Guru

Post Syndicated from David Ernst original https://aws.amazon.com/blogs/devops/bloomip-automatically-identifies-production-issues-with-amazon-devops-guru/

Operational excellence is critical for BloomIP’s customers. In this post, you will see how we built a solution to automate the detection of trends and issues in production workloads by implementing Amazon DevOps Guru for our clients.

BloomIP ensures your business is ready for what’s ahead, with security, scalability, performance, and cost control. We are cloud solutions partner that gets to know both the people and processes in your business.

The Challenge

Identifying operational issues within applications and services is time-consuming. This requires developers and cloud engineers to spend valuable time manually debugging using multiple tools. We needed to quickly identify any operational issues related to our clients applications, including any load balancer errors or user delays in accessing their application. Ensuring the application is up and running during certain times of the day is crucial to the success of our client’s business. We needed to identify any downtime or performance patterns and quickly address any related issues.

Analyzing an AWS environment after any incident requires a combination of tools such as Amazon CloudWatch, AWS Config, AWS CloudTrail, AWS CloudFormation, and AWS X-Ray. We spend hours pouring over the information in each tool to try to identify patterns and troubleshooting steps. Still, identifying issues that correlate between those tools is a manual process.

Automating Identification of Operational Issues

To address the challenges of tedious and manual processes of analyzing different tools to identify patterns, we implemented Amazon DevOps Guru  for many of our clients. Amazon DevOps Guru helps us automatically ingests all related data from the services mentioned above and applies Machine Learning techniques to analyze and recommend fixes for abnormal behaviors. Amazon DevOps Guru organizes its findings into reactive and proactive insights.

We capture Amazon DevOps Guru Insights as events using Amazon EventBridg, and send them to an  Amazon SNS Topic, which then notifies us via email and Slack.

Architecture diagram showing a typical 3 tier web app using AWS services and integrating the application with Amazon DevOps Guru, Amazon Eventbridge and Amazon SNS Topic to send send notifications via Email and Slack

Figure 1. Architecture diagram

Results

BloomIP is leveraging DevOps Guru to scale its operations across multiple customers. Amazon DevOps Guru was easy to enable; it provides us with a single console experience to search and visualize operational data. In addition to detecting anomalies, we can see graphs and timelines related to the numerous anomalous metrics and more contextual information such as relevant events and log snippets. This helps us quickly understand the anomaly scope. Because it integrates data across multiple sources such as Amazon CloudWatch, AWS Config, AWS CloudTrail, AWS CloudFormation, and AWS X-Ray, Amazon DevOps Guru reduces the need for us to use numerous tools.

“We were looking at a way to effortlessly scale our observability needs across multiple clients while ensuring we had the proper coverage. DevOps Guru gives us additional insight and assurance by quickly pointing out anomalies in our client’s environments. With ML-powered recommendations, DevOps Guru has allowed us to remediate repeated production issues automatically. ” – Joshua Haynes, Director of Engineering, BloomIP

Conclusion

Amazon DevOps Guru provides BloomIP with a streamlined approach to visualize operational data by integrating data across multiple sources supporting Amazon CloudWatch, AWS Config, AWS CloudTrail, AWS CloudFormation, and AWS X-Ray and reduces the need to use multiple tools. DevOps Guru gives you a single-console dashboard to look for and visualize anomalies in your operational data.

Start monitoring your AWS applications with AWS DevOps Guru today using this link

About the authors:

David Ernst

David is a Sr. Specialist Solution Architect – DevOps, with 20+ years of experience in designing and implementing software solutions for various industries. David is an automation enthusiast and works with AWS customers to design, deploy, and manage their AWS workloads/architectures.

Abdullahi Olaoye

Abdullahi is a Senior Cloud Architect at AWS Professional Services where he works with customers of different scales to design and build IT solutions that solve business challenges. When he’s not working, he enjoys spending time with his family, traveling and learning history of different varieties through documentaries and podcasts.

Computer Repair Technicians Are Stealing Your Data

Post Syndicated from Bruce Schneier original https://www.schneier.com/blog/archives/2022/11/computer-repair-technicians-are-stealing-your-data.html

Laptop technicians routinely violate the privacy of the people whose computers they repair:

Researchers at University of Guelph in Ontario, Canada, recovered logs from laptops after receiving overnight repairs from 12 commercial shops. The logs showed that technicians from six of the locations had accessed personal data and that two of those shops also copied data onto a personal device. Devices belonging to females were more likely to be snooped on, and that snooping tended to seek more sensitive data, including both sexually revealing and non-sexual pictures, documents, and financial information.

[…]

In three cases, Windows Quick Access or Recently Accessed Files had been deleted in what the researchers suspect was an attempt by the snooping technician to cover their tracks. As noted earlier, two of the visits resulted in the logs the researchers relied on being unrecoverable. In one, the researcher explained they had installed antivirus software and performed a disk cleanup to “remove multiple viruses on the device.” The researchers received no explanation in the other case.

[…]

The laptops were freshly imaged Windows 10 laptops. All were free of malware and other defects and in perfect working condition with one exception: the audio driver was disabled. The researchers chose that glitch because it required only a simple and inexpensive repair, was easy to create, and didn’t require access to users’ personal files.

Half of the laptops were configured to appear as if they belonged to a male and the other half to a female. All of the laptops were set up with email and gaming accounts and populated with browser history across several weeks. The researchers added documents, both sexually revealing and non-sexual pictures, and a cryptocurrency wallet with credentials.

A few notes. One: this is a very small study—only twelve laptop repairs. Two, some of the results were inconclusive, which indicated—but did not prove—log tampering by the technicians. Three, this study was done in Canada. There would probably be more snooping by American repair technicians.

The moral isn’t a good one: if you bring your laptop in to be repaired, you should expect the technician to snoop through your hard drive, taking what they want.

Research paper.

The US Has a Shortage of Bomb-Sniffing Dogs

Post Syndicated from Bruce Schneier original https://www.schneier.com/blog/archives/2022/11/the-us-has-a-shortage-of-bomb-sniffing-dogs.html

Nothing beats a dog’s nose for detecting explosives. Unfortunately, there aren’t enough dogs:

Last month, the US Government Accountability Office (GAO) released a nearly 100-page report about working dogs and the need for federal agencies to better safeguard their health and wellness. The GOA says that as of February the US federal government had approximately 5,100 working dogs, including detection dogs, across three federal agencies. Another 420 dogs “served the federal government in 24 contractor-managed programs within eight departments and two independent agencies,” the GAO report says.

The report also underscores the demands placed on detection dogs and the potential for overwork if there aren’t enough dogs available. “Working dogs might need the strength to suddenly run fast, or to leap over a tall barrier, as well as the physical stamina to stand or walk all day,” the report says. “They might need to search over rubble or in difficult environmental conditions, such as extreme heat or cold, often wearing heavy body armor. They also might spend the day detecting specific scents among thousands of others, requiring intense mental concentration. Each function requires dogs to undergo specialized training.”

A decade and a half ago I was optimistic about bomb-sniffing bees and wasps, but nothing seems to have come of that.

Our guide to AWS Compute at re:Invent 2022

Post Syndicated from Sheila Busser original https://aws.amazon.com/blogs/compute/our-guide-to-aws-compute-at-reinvent-2022/

This blog post is written by Shruti Koparkar, Senior Product Marketing Manager, Amazon EC2.

AWS re:Invent is the most transformative event in cloud computing and it is starting on November 28, 2022. AWS Compute team has many exciting sessions planned for you covering everything from foundational content, to technology deep dives, customer stories, and even hands on workshops. To help you build out your calendar for this year’s re:Invent, let’s look at some highlights from the AWS Compute track in this blog. Please visit the session catalog for a full list of AWS Compute sessions.

Learn what powers AWS Compute

AWS offers the broadest and deepest functionality for compute. Amazon Elastic Cloud Compute (Amazon EC2) offers granular control for managing your infrastructure with the choice of processors, storage, and networking.

The AWS Nitro System is the underlying platform for our all our modern EC2 instances. It enables AWS to innovate faster, further reduce cost for our customers, and deliver added benefits like increased security and new instance types.

Discover the benefits of AWS Silicon

AWS has invested years designing custom silicon optimized for the cloud. This investment helps us deliver high performance at lower costs for a wide range of applications and workloads using AWS services.

  • Explore the AWS journey into silicon innovation with our “CMP201: Silicon Innovation at AWS” session. We will cover some of the thought processes, learnings, and results from our experience building silicon for AWS Graviton, AWS Nitro System, and AWS Inferentia.
  • To learn about customer-proven strategies to help you make the move to AWS Graviton quickly and confidently while minimizing uncertainty and risk, attend “CMP410: Framework for adopting AWS Graviton-based instances”.

 Explore different use cases

Amazon EC2 provides secure and resizable compute capacity for several different use-cases including general purpose computing for cloud native and enterprise applications, and accelerated computing for machine learning and high performance computing (HPC) applications.

High performance computing

  • HPC on AWS can help you design your products faster with simulations, predict the weather, detect seismic activity with greater precision, and more. To learn how to solve world’s toughest problems with extreme-scale compute come join us for “CMP205: HPC on AWS: Solve complex problems with pay-as-you-go infrastructure”.
  • Single on-premises general-purpose supercomputers can fall short when solving increasingly complex problems. Attend “CMP222: Redefining supercomputing on AWS” to learn how AWS is reimagining supercomputing to provide scientists and engineers with more access to world-class facilities and technology.
  • AWS offers many solutions to design, simulate, and verify the advanced semiconductor devices that are the foundation of modern technology. Attend “CMP320: Accelerating semiconductor design, simulation, and verification” to hear from ARM and Marvel about how they are using AWS to accelerate EDA workloads.

Machine Learning

Cost Optimization

Hear from our customers

We have several sessions this year where AWS customers are taking the stage to share their stories and details of exciting innovations made possible by AWS.

Get started with hands-on sessions

Nothing like a hands-on session where you can learn by doing and get started easily with AWS compute. Our speakers and workshop assistants will help you every step of the way. Just bring your laptop to get started!

You’ll get to meet the global cloud community at AWS re:Invent and get an opportunity to learn, get inspired, and rethink what’s possible. So build your schedule in the re:Invent portal and get ready to hit the ground running. We invite you to stop by the AWS Compute booth and chat with our experts. We look forward to seeing you in Las Vegas!

Apple’s Device Analytics Can Identify iCloud Users

Post Syndicated from Bruce Schneier original https://www.schneier.com/blog/archives/2022/11/apples-device-analytics-can-identify-icloud-users.html

Researchers claim that supposedly anonymous device analytics information can identify users:

On Twitter, security researchers Tommy Mysk and Talal Haj Bakry have found that Apple’s device analytics data includes an iCloud account and can be linked directly to a specific user, including their name, date of birth, email, and associated information stored on iCloud.

Apple has long claimed otherwise:

On Apple’s device analytics and privacy legal page, the company says no information collected from a device for analytics purposes is traceable back to a specific user. “iPhone Analytics may include details about hardware and operating system specifications, performance statistics, and data about how you use your devices and applications. None of the collected information identifies you personally,” the company claims.

Apple was just sued for tracking iOS users without their consent, even when they explicitly opt out of tracking.

Govern and manage permissions of Amazon QuickSight assets with the new centralized asset management console

Post Syndicated from Srikanth Baheti original https://aws.amazon.com/blogs/big-data/govern-and-manage-permissions-of-amazon-quicksight-assets-with-the-new-centralized-asset-management-console/

Amazon QuickSight is a fully-managed, cloud-native business intelligence (BI) service that makes it easy to connect to your data, create interactive dashboards, and share these with tens of thousands of users, either within the QuickSight interface or embedded in software as a service (SaaS) applications or web portals. With QuickSight providing insights to power daily decisions across the organization, it becomes more important than ever for administrators to ensure they can easily govern and manage permissions of all the assets in their account.

We recently announced the launch of a new admin asset management console in QuickSight, which enables administrators at enterprises and independent software vendors (ISVs) to govern their QuickSight account at scale and have self-service support capabilities by providing easy visibility and access to all the assets across the entire account, including in a multi-tenant setup. In addition, admins can perform actions that were previously possible only via API, such as bulk transfer of assets from one user or group to another, share multiple assets with someone at once, or revoke a user’s access to an asset.

This launch also supports APIs for searching assets which allows administrators to automate and govern at scale. Administrators and developers can programmatically search for assets a user or group has access to and search for assets by name. Additionally, they can describe and manage assets permissions.

In this post, we show how to access this console and some of the administration and governance use cases that you can achieve.

Feature overview

The QuickSight admin asset management console is available for admins with AWS Identity and Access Management (IAM) permissions who have access to QuickSight admin console pages. The following IAM policy allows an IAM user get access to all the features in the asset management console:

{
    "Version": "2012-10-17",
    "Statement": [
        {
            "Effect": "Allow",
            "Action": [          
                "quicksight:SearchGroups",
                "quicksight:SearchUsers",            
                "quicksight:ListNamespaces",            
                "quicksight:DescribeAnalysisPermissions",
                "quicksight:DescribeDashboardPermissions",
                "quicksight:DescribeDataSetPermissions",
                "quicksight:DescribeDataSourcePermissions",
                "quicksight:DescribeFolderPermissions",
                "quicksight:ListAnalyses",
                "quicksight:ListDashboards",
                "quicksight:ListDataSets",
                "quicksight:ListDataSources",
                "quicksight:ListFolders",
                "quicksight:SearchAnalyses",
                "quicksight:SearchDashboards",
                "quicksight:SearchFolders",
                "quicksight:SearchDataSets",
                "quicksight:SearchDataSources",
                "quicksight:UpdateAnalysisPermissions",
                "quicksight:UpdateDashboardPermissions",
                "quicksight:UpdateDataSetPermissions",
                "quicksight:UpdateDataSourcePermissions",
                "quicksight:UpdateFolderPermissions"
            ],
            "Resource": "*"
        }
    ]
}

APIs

Assets can be searched by using the following public APIs:

Permissions of the assets can be described and managed by using the following public APIs:

Access the QuickSight asset management console

To access the new QuickSight asset management console, complete the following steps:

  1. On the QuickSight console, navigate to the user menu and choose Manage QuickSight.
  2. In the navigation pane, choose Manage assets.

The landing page presents three ways to list assets:

  • Search for assets owned by a user or a group in a namespace
  • Search for assets by name
  • Browse all assets or filter by asset type in the account

If you have only one namespace, you won’t see namespace drop-down, as shown in the following screenshot.

Use case overview

Let’s consider a fictional company, AnyCompany, which is an ISV that provides services to thousands of customers across the globe. QuickSight is one of the services used by AnyCompany for providing multi-tenant BI and analytics solutions. They have already implemented multi-tenancy in QuickSight using namespaces to isolate users and groups. Within each tenant, assets are organized using folders.

Previously, there was no single pane of glass view in the QuickSight user interface that could show them all the assets by tenant users or groups and associated permissions. To get a holistic view, they were dependent on IT administrators to run tenant-specific API calls and export that information on a regular basis to validate the asset permissions.

With this feature, AnyCompany is no longer dependent on IT administrators for the asset information, and doesn’t have to go through the tedious task of reconciliation and access validation. This not only removes a dependency on IT administrators’ availability, but also provides a centralized solution for asset governance.

AnyCompany has the following key administration and governance needs that they deem critical:

  • Transfer assets – They want to be able to quickly transfer assets from one user or group to another in case the original owner is leaving the company or is on an extended leave
  • Onboard new employees – They want to be able to speed up onboarding of new employees by giving them access to assets their teammates have
  • Support authors – They want their in-house BI engineers to be able to easily and quickly support authors in other tenants by getting access to their dashboards
  • Revoke access – They want the capability to quickly audit and revoke permissions when changes occur

In the following sections, we discuss how AnyCompany meets their asset management needs in more detail.

Transfer assets

One of the business analysts, who was responsible for authoring some the key dashboards for use within the management team in headquarters and common dashboards that were being shared with all the tenants, recently switched organizations within AnyCompany. The central administrator wants to transfer all the assets to another team member and to maintain continuity.

To transfer assets, complete the following steps:

  1. Log in to QuickSight and navigate to Manage assets.
  2. Choose the namespace of the business analyst who left.
  3. Enter at least the first three characters of the username or the email of the analyst who left and choose the user from the search results.

A list of all the assets that the analyst is owner or viewer of is displayed.

  1. Use the filters to list assets of which the analyst is the sole owner.
  2. You can also choose to list only a single type of asset, such as dashboards.
  3. Select all the assets on the first page.
  4. On the Actions menu, choose Transfer.
  5. Choose the namespace the new user belongs to.
  6. Search for the analyst to whom all the assets will be transferred to by entering at least the first three characters of the username or the email.
  7. Choose the appropriate user from the search results.
  8. For Permissions, you can choose to replicate permissions that the analyst had to the new user, or make the new user owner or viewer of all assets being transferred.
  9. Choose Transfer.
  10. When the transfer is complete, choose Done.
  11. Repeat these steps if there is more than one page of assets listed.

Onboard new employees

A new analyst has joined AnyCompany, and the manager wants this analyst to have access to all QuickSight assets as one of the existing analyst.

To share assets, the administrator takes the following steps:

  1. Log in to QuickSight and navigate to Manage assets.
  2. Choose the namespace the existing business analyst belongs to.
  3. Search for the existing analyst by entering at least the first three characters of the username or the email and choose the user from the search results.

A list of all the assets that the analyst is owner or viewer of is displayed.

  1. Select all the assets on the first page.
  2. On the Actions menu, choose Share.
  3. Choose the namespace the new user belongs to.
  4. Search for the analyst who just joined the team by entering at least the first three characters of the username or the email and choose the appropriate user from the search results.
  5. You can choose to replicate permissions that the analyst had to the new user, or make the new user the owner or viewer of all assets being shared.
  6. Choose Share.
  7. When the share is complete, choose Done.

Support authors

AnyCompany often receives support requests from their tenant authors who are creating and sharing dashboards within the boundary of their tenant, which is achieved by namespaces in QuickSight. AnyCompany’s support team wants to get easy access to other tenant authors’ assets and provide the necessary support quickly.

To get access to an author’s assets, complete the following steps:

  1. Log in to QuickSight and navigate to Manage assets.
  2. For Search by asset name, enter the name of the asset that the support team wants to get access to.

A list of assets that contain the search text is displayed.

  1. Select the assets you want to give the support team access to.
  2. Choose Share.
  3. Choose the namespace the support team belongs to.
  4. Choose the group the support team belongs to.
  5. Choose the Owner permission in order for the support team to have complete access to the asset.
  6. Choose Share.
  7. When the share is complete, choose Done.

Revoke access

In case of policy changes or if the central administrator discovers that a QuickSight user shouldn’t have access to certain assets, you can revoke asset access.

To revoke a user’s access to an asset, complete the following steps:

  1. Log in to QuickSight and navigate to Manage assets.
  2. Choose the namespace the existing business analyst belongs to.
  3. Search for the user you want to remove access to by entering at least the first three characters of the username or the email and choose the appropriate user from the search results.

A list of all the assets that the analyst is owner or viewer of is displayed.

  1. Choose the menu icon (three vertical dots) in the Actions column of the assets you want to revoke access to and choose Revoke access.
  2. Choose Revoke.
  3. After access has been revoked, choose Done.

Conclusion

With the asset management console, admins now have easy visibility to all the assets in an account and can govern and manage permissions of all the assets in an account. Try out the asset management console for your centralized governance in QuickSight and share your feedback and questions in the comments. For more information, refer to Asset Management Console user guide.

Stay tuned for more new admin capabilities, and follow What’s New with Analytics for the latest on QuickSight.


About the Authors

Srikanth Baheti is a Specialized World Wide Sr. Solution Architect for Amazon QuickSight. He started his career as a consultant and worked for multiple private and government organizations. Later he worked for PerkinElmer Health and Sciences & eResearch Technology Inc, where he was responsible for designing and developing high traffic web applications, highly scalable and maintainable data pipelines for reporting platforms using AWS services and Serverless computing.

Raji Sivasubramaniam is a Sr. Solutions Architect at AWS, focusing on Analytics. Raji is specialized in architecting end-to-end Enterprise Data Management, Business Intelligence and Analytics solutions for Fortune 500 and Fortune 100 companies across the globe. She has in-depth experience in integrated healthcare data and analytics with wide variety of healthcare datasets including managed market, physician targeting and patient analytics.

Mayank Agarwal is a product manager for Amazon QuickSight, AWS’ cloud-native, fully managed BI service. He focuses on account administration, governance and developer experience. He started his career as an embedded software engineer developing handheld devices. Prior to QuickSight he was leading engineering teams at Credence ID, developing custom mobile embedded device and web solutions using AWS services that make biometric enrollment and identification fast, intuitive, and cost-effective for Government sector, healthcare and transaction security applications.

Breaking the Zeppelin Ransomware Encryption Scheme

Post Syndicated from Bruce Schneier original https://www.schneier.com/blog/archives/2022/11/breaking-the-zeppelin-ransomware-encryption-scheme.html

Brian Krebs writes about how the Zeppelin ransomware encryption scheme was broken:

The researchers said their break came when they understood that while Zeppelin used three different types of encryption keys to encrypt files, they could undo the whole scheme by factoring or computing just one of them: An ephemeral RSA-512 public key that is randomly generated on each machine it infects.

“If we can recover the RSA-512 Public Key from the registry, we can crack it and get the 256-bit AES Key that encrypts the files!” they wrote. “The challenge was that they delete the [public key] once the files are fully encrypted. Memory analysis gave us about a 5-minute window after files were encrypted to retrieve this public key.”

Unit 221B ultimately built a “Live CD” version of Linux that victims could run on infected systems to extract that RSA-512 key. From there, they would load the keys into a cluster of 800 CPUs donated by hosting giant Digital Ocean that would then start cracking them. The company also used that same donated infrastructure to help victims decrypt their data using the recovered keys.

A company offered recovery services based on this break, but was reluctant to advertise because it didn’t want Zeppelin’s creators to fix their encryption flaw.

Technical details.

Friday Squid Blogging: Squid Brains

Post Syndicated from Bruce Schneier original https://www.schneier.com/blog/archives/2022/11/friday-squid-blogging-squid-brains.html

Researchers have new evidence of how squid brains develop:

Researchers from the FAS Center for Systems Biology describe how they used a new live-imaging technique to watch neurons being created in the embryo in almost real-time. They were then able to track those cells through the development of the nervous system in the retina. What they saw surprised them.

The neural stem cells they tracked behaved eerily similar to the way these cells behave in vertebrates during the development of their nervous system.

It suggests that vertebrates and cephalopods, despite diverging from each other 500 million years ago, not only are using similar mechanisms to make their big brains but that this process and the way the cells act, divide, and are shaped may essentially layout the blueprint required develop this kind of nervous system.

As usual, you can also use this squid post to talk about the security stories in the news that I haven’t covered.

Read my blog posting guidelines here.

First Review of A Hacker’s Mind

Post Syndicated from Bruce Schneier original https://www.schneier.com/blog/archives/2022/11/first-review-of-a-hackers-mind.html

Kirkus reviews A Hacker’s Mind:

A cybersecurity expert examines how the powerful game whatever system is put before them, leaving it to others to cover the cost.

Schneier, a professor at Harvard Kennedy School and author of such books as Data and Goliath and Click Here To Kill Everybody, regularly challenges his students to write down the first 100 digits of pi, a nearly impossible task­—but not if they cheat, concerning which he admonishes, “Don’t get caught.” Not getting caught is the aim of the hackers who exploit the vulnerabilities of systems of all kinds. Consider right-wing venture capitalist Peter Thiel, who located a hack in the tax code: “Because he was one of the founders of PayPal, he was able to use a $2,000 investment to buy 1.7 million shares of the company at $0.001 per share, turning it into $5 billion—all forever tax free.” It was perfectly legal—and even if it weren’t, the wealthy usually go unpunished. The author, a fluid writer and tech communicator, reveals how the tax code lends itself to hacking, as when tech companies like Apple and Google avoid paying billions of dollars by transferring profits out of the U.S. to corporate-friendly nations such as Ireland, then offshoring the “disappeared” dollars to Bermuda, the Caymans, and other havens. Every system contains trap doors that can be breached to advantage. For example, Schneier cites “the Pudding Guy,” who hacked an airline miles program by buying low-cost pudding cups in a promotion that, for $3,150, netted him 1.2 million miles and “lifetime Gold frequent flier status.” Since it was all within the letter if not the spirit of the offer, “the company paid up.” The companies often do, because they’re gaming systems themselves. “Any rule can be hacked,” notes the author, be it a religious dietary restriction or a legislative procedure. With technology, “we can hack more, faster, better,” requiring diligent monitoring and a demand that everyone play by rules that have been hardened against tampering.

An eye-opening, maddening book that offers hope for leveling a badly tilted playing field.

I got a starred review. Libraries make decisions on what to buy based on starred reviews. Publications make decisions about what to review based on starred reviews. This is a big deal.

Book’s webpage.

Successful Hack of Time-Triggered Ethernet

Post Syndicated from Bruce Schneier original https://www.schneier.com/blog/archives/2022/11/successful-hack-of-time-triggered-ethernet.html

Time-triggered Ethernet (TTE) is used in spacecraft, basically to use the same hardware to process traffic with different timing and criticality. Researchers have defeated it:

On Tuesday, researchers published findings that, for the first time, break TTE’s isolation guarantees. The result is PCspooF, an attack that allows a single non-critical device connected to a single plane to disrupt synchronization and communication between TTE devices on all planes. The attack works by exploiting a vulnerability in the TTE protocol. The work was completed by researchers at the University of Michigan, the University of Pennsylvania, and NASA’s Johnson Space Center.

“Our evaluation shows that successful attacks are possible in seconds and that each successful attack can cause TTE devices to lose synchronization for up to a second and drop tens of TT messages—both of which can result in the failure of critical systems like aircraft or automobiles,” the researchers wrote. “We also show that, in a simulated spaceflight mission, PCspooF causes uncontrolled maneuvers that threaten safety and mission success.”

Much more detail in the article—and the research paper.

Failures in Twitter’s Two-Factor Authentication System

Post Syndicated from Bruce Schneier original https://www.schneier.com/blog/archives/2022/11/failures-in-twitters-two-factor-authentication-system.html

Twitter is having intermittent problems with its two-factor authentication system:

Not all users are having problems receiving SMS authentication codes, and those who rely on an authenticator app or physical authentication token to secure their Twitter account may not have reason to test the mechanism. But users have been self-reporting issues on Twitter since the weekend, and WIRED confirmed that on at least some accounts, authentication texts are hours delayed or not coming at all. The meltdown comes less than two weeks after Twitter laid off about half of its workers, roughly 3,700 people. Since then, engineers, operations specialists, IT staff, and security teams have been stretched thin attempting to adapt Twitter’s offerings and build new features per new owner Elon Musk’s agenda.

On top of that, it seems that the system has a new vulnerability:

A researcher contacted Information Security Media Group on condition of anonymity to reveal that texting “STOP” to the Twitter verification service results in the service turning off SMS two-factor authentication.

“Your phone has been removed and SMS 2FA has been disabled from all accounts,” is the automated response.

The vulnerability, which ISMG verified, allows a hacker to spoof the registered phone number to disable two-factor authentication. That potentially exposes accounts to a password reset attack or account takeover through password stuffing.

This is not a good sign.