During Birthday Week 2023, we launched Workers AI. Since then, we have been listening to your feedback, and one thing we’ve heard consistently is that our customers want Workers AI to be faster. In particular, we hear that large language model (LLM) generation needs to be faster. Users want their interactive chat and agents to go faster, developers want faster help, and users do not want to wait for applications and generated website content to load. Today, we’re announcing three upgrades we’ve made to Workers AI to bring faster and more efficient inference to our customers: upgraded hardware, KV cache compression, and speculative decoding.
Thanks to Cloudflare’s 12th generation compute servers, our network now supports a newer generation of GPUs capable of supporting larger models and faster inference. Customers can now use Meta Llama 3.2 11B, Meta’s newly released multi-modal model with vision support, as well as Meta Llama 3.1 70B on Workers AI. Depending on load and time of day, customers can expect to see two to three times the throughput for Llama 3.1 and 3.2 compared to our previous generation Workers AI hardware. More performance information for these models can be found in today’s post: Cloudflare’s Bigger, Better, Faster AI platform.
New KV cache compression methods, now open source
In our effort to deliver low-cost low-latency inference to the world, Workers AI has been developing novel methods to boost efficiency of LLM inference. Today, we’re excited to announce a technique for KV cache compression that can help increase throughput of an inference platform. And we’ve made it open source too, so that everyone can benefit from our research.
It’s all about memory
One of the main bottlenecks when running LLM inference is the amount of vRAM (memory) available. Every word that an LLM processes generates a set of vectors that encode the meaning of that word in the context of any earlier words in the input that are used to generate new tokens in the future. These vectors are stored in the KV cache, causing the memory required for inference to scale linearly with the total number of tokens of all sequences being processed. This makes memory a bottleneck for a lot of transformer-based models. Because of this, the amount of memory an instance has available limits the number of sequences it can generate concurrently, as well as the maximum token length of sequences it can generate.
So what is the KV cache anyway?
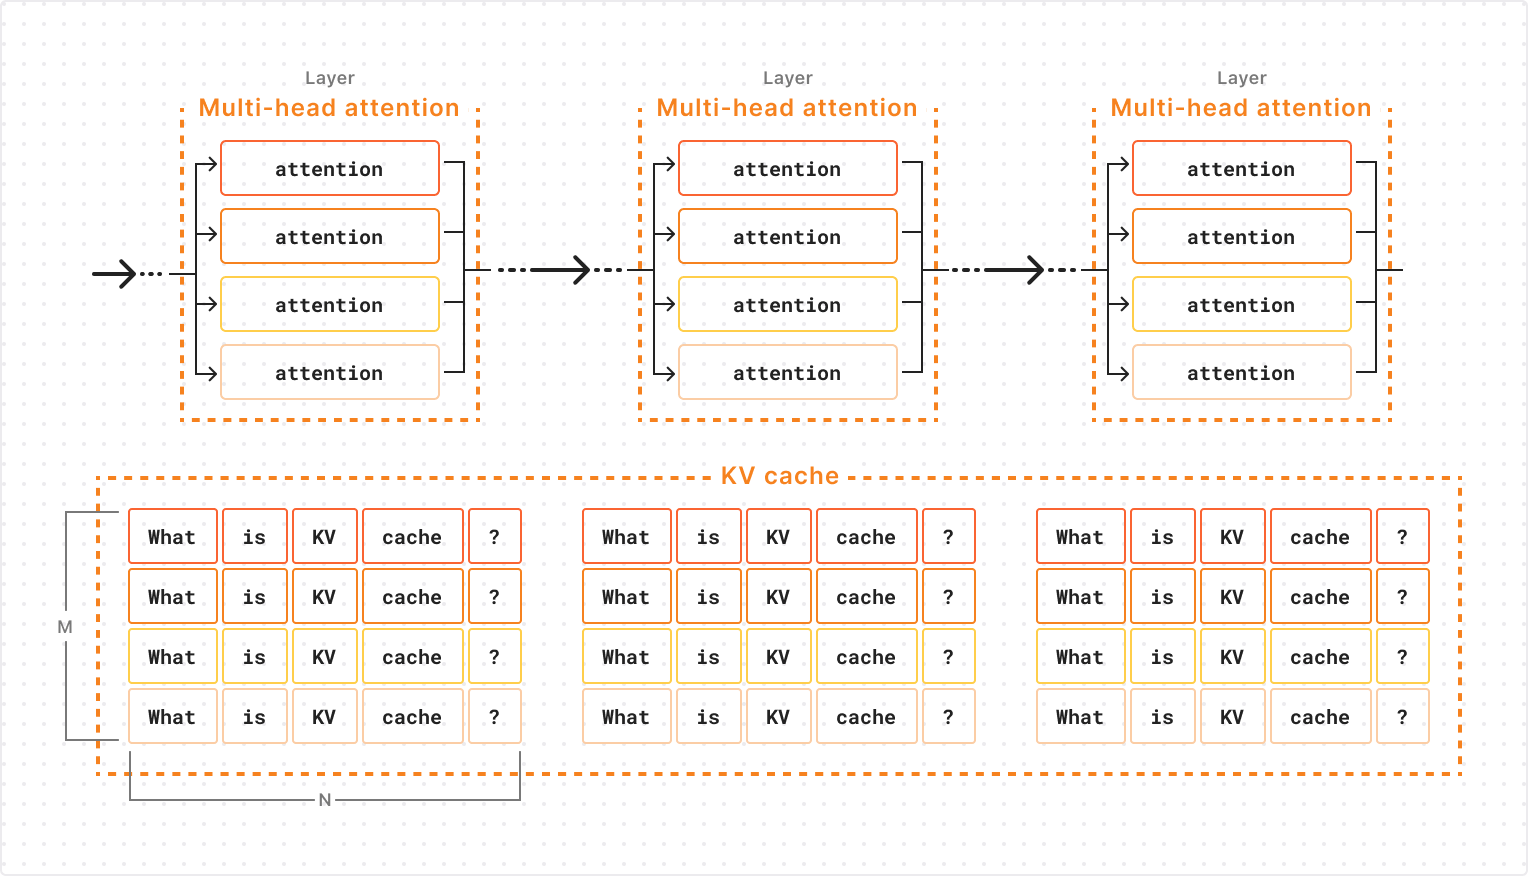
LLMs are made up of layers, with an attention operation occurring in each layer. Within each layer’s attention operation, information is collected from the representations of all previous tokens that are stored in cache. This means that vectors in the KV cache are organized into layers, so that the active layer’s attention operation can only query vectors from the corresponding layer of KV cache. Furthermore, since attention within each layer is parallelized across multiple attention “heads”, the KV cache vectors of a specific layer are further subdivided into groups corresponding to each attention head of that layer.
The diagram below shows the structure of an LLM’s KV cache for a single sequence being generated. Each cell represents a KV and the model’s representation for a token consists of all KV vectors for that token across all attention heads and layers. As you can see, the KV cache for a single layer is allocated as an M x N matrix of KV vectors where M is the number of attention heads and N is the sequence length. This will be important later!
Now that we know what the KV cache looks like, let’s dive into how we can shrink it!
The most common approach to compressing the KV cache involves identifying vectors within it that are unlikely to be queried by future attention operations and can therefore be removed without impacting the model’s outputs. This is commonly done by looking at the past attention weights for each pair of key and value vectors (a measure of the degree with which that KV’s representation has been queried during past attention operations) and selecting the KVs that have received the lowest total attention for eviction. This approach is conceptually similar to a LFU (least frequently used) cache management policy: the less a particular vector is queried, the more likely it is to be evicted in the future.
Different attention heads need different compression rates
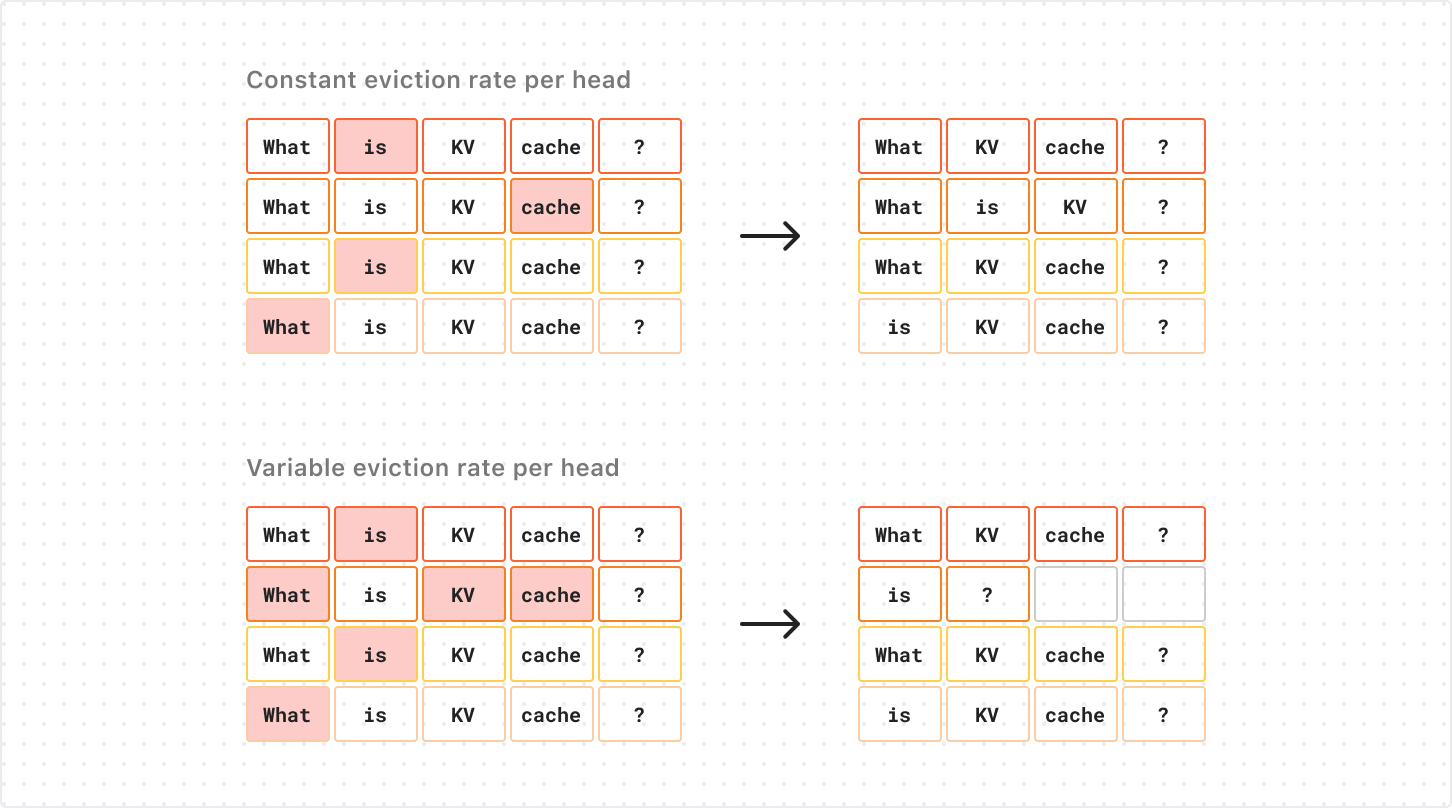
As we saw earlier, the KV cache for each sequence in a particular layer is allocated on the GPU as a # attention heads X sequence length tensor. This means that the total memory allocation scales with the maximum sequence length for all attention heads of the KV cache. Usually this is not a problem, since each sequence generates the same number of KVs per attention head.
When we consider the problem of eviction-based KV cache compression, however, this forces us to remove an equal number of KVs from each attention head when doing the compression. If we remove more KVs from one attention head alone, those removed KVs won’t actually contribute to lowering the memory footprint of the KV cache on GPU, but will just add more empty “padding” to the corresponding rows of the tensor. You can see this in the diagram below (note the empty cells in the second row below):
The extra compression along the second head frees slots for two KVs, but the cache’s shape (and memory footprint) remains the same.
This forces us to use a fixed compression rate for all attention heads of KV cache, which is very limiting on the compression rates we can achieve before compromising performance.
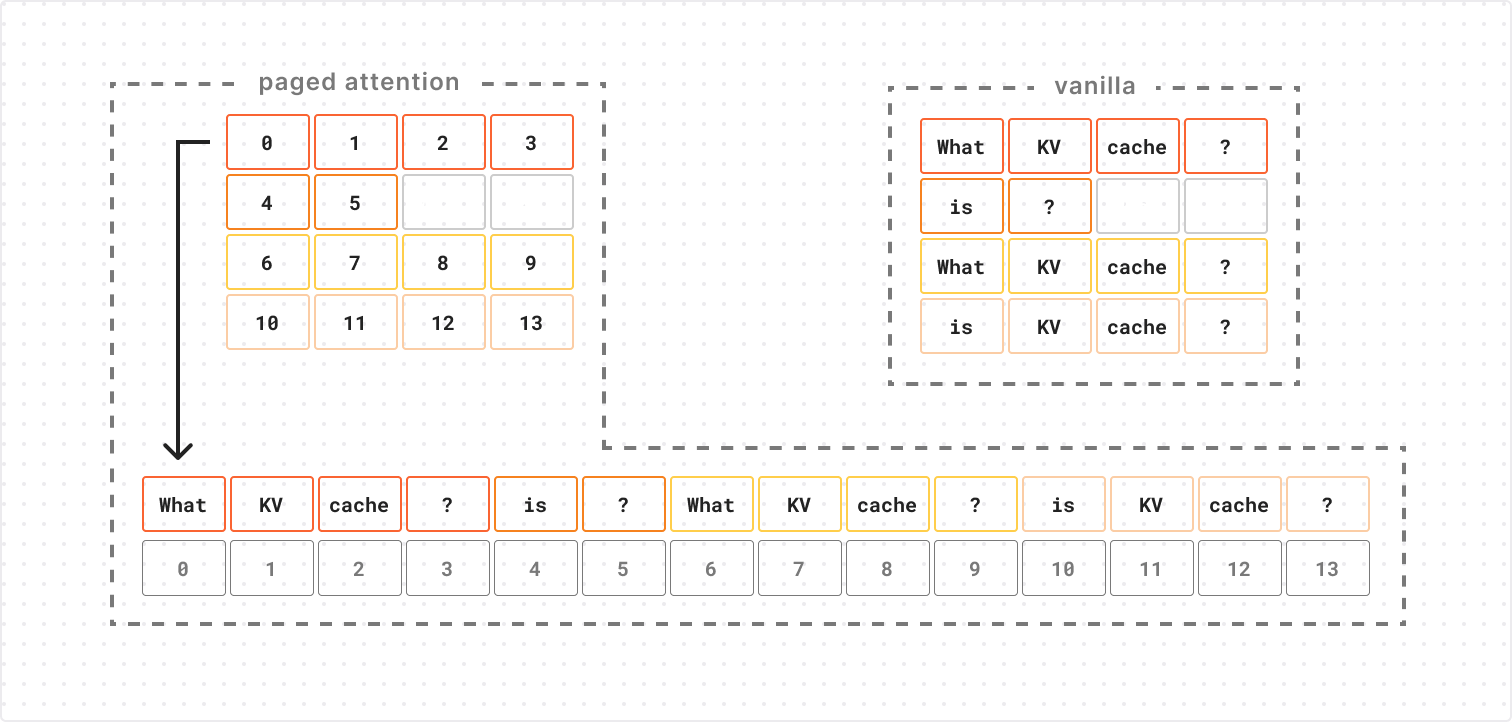
Enter PagedAttention
The solution to this problem is to change how our KV cache is represented in physical memory. PagedAttention can represent N x M tensors with padding efficiently by using an N x M block table to index into a series of “blocks”.
This lets us retrieve the ith element of a row by taking the ith block number from that row in the block table and using the block number to lookup the corresponding block, so we avoid allocating space to padding elements in our physical memory representation. In our case, the elements in physical memory are the KV cache vectors, and the M and N that define the shape of our block table are the number of attention heads and sequence length, respectively. Since the block table is only storing integer indices (rather than high-dimensional KV vectors), its memory footprint is negligible in most cases.
Results
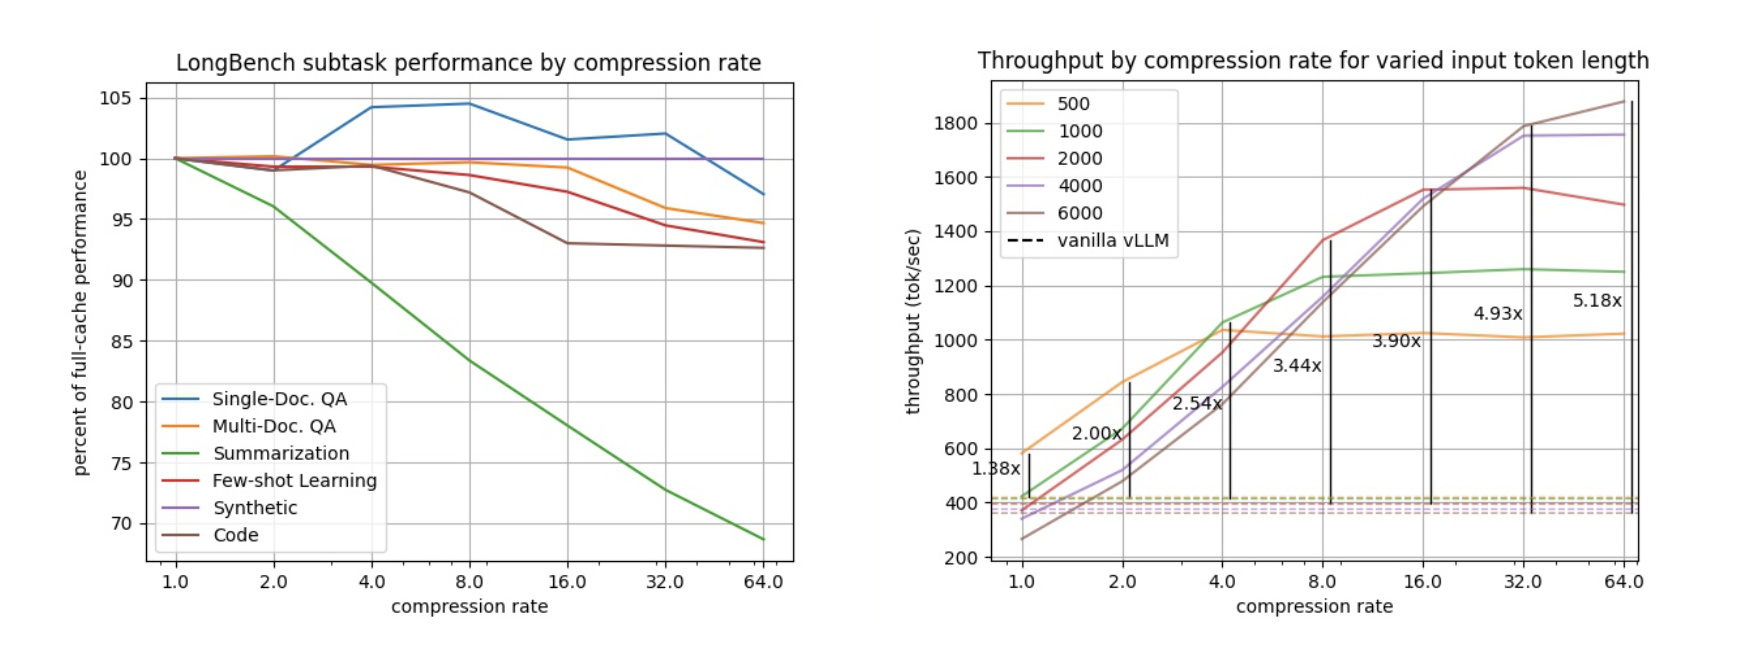
Using paged attention lets us apply different rates of compression to different heads in our KV cache, giving our compression strategy more flexibility than other methods. We tested our compression algorithm on LongBench (a collection of long-context LLM benchmarks) with Llama-3.1-8B and found that for most tasks we can retain over 95% task performance while reducing cache size by up to 8x (left figure below). Over 90% task performance can be retained while further compressing up to 64x. That means you have room in memory for 64 times as many tokens!
This lets us increase the number of requests we can process in parallel, increasing the total throughput (total tokens generated per second) by 3.44x and 5.18x for compression rates of 8x and 64x, respectively (right figure above).
Try it yourself!
If you’re interested in taking a deeper dive check out our vLLM fork and get compressing!!
Speculative decoding for faster throughput
A new inference strategy that we implemented is speculative decoding, which is a very popular way to get faster throughput (measured in tokens per second). LLMs work by predicting the next expected token (a token can be a word, word fragment or single character) in the sequence with each call to the model, based on everything that the model has seen before. For the first token generated, this means just the initial prompt, but after that each subsequent token is generated based on the prompt plus all other tokens that have been generated. Typically, this happens one token at a time, generating a single word, or even a single letter, depending on what comes next.
But what about this prompt:
Knock, knock!
If you are familiar with knock-knock jokes, you could very accurately predict more than one token ahead. For an English language speaker, what comes next is a very specific sequence that is four to five tokens long: “Who’s there?” or “Who is there?” Human language is full of these types of phrases where the next word has only one, or a few, high probability choices. Idioms, common expressions, and even basic grammar are all examples of this. So for each prediction the model makes, we can take it a step further with speculative decoding to predict the next n tokens. This allows us to speed up inference, as we’re not limited to predicting one token at a time.
There are several different implementations of speculative decoding, but each in some way uses a smaller, faster-to-run model to generate more than one token at a time. For Workers AI, we have applied prompt-lookup decoding to some of the LLMs we offer. This simple method matches the last n tokens of generated text against text in the prompt/output and predicts candidate tokens that continue these identified patterns as candidates for continuing the output. In the case of knock-knock jokes, it can predict all the tokens for “Who’s there” at once after seeing “Knock, knock!”, as long as this setup occurs somewhere in the prompt or previous dialogue already. Once these candidate tokens have been predicted, the model can verify them all with a single forward-pass and choose to either accept or reject them. This increases the generation speed of llama-3.1-8b-instruct by up to 40% and the 70B model by up to 70%.
Speculative decoding has tradeoffs, however. Typically, the results of a model using speculative decoding have a lower quality, both when measured using benchmarks like MMLU as well as when compared by humans. More aggressive speculation can speed up sequence generation, but generally comes with a greater impact to the quality of the result. Prompt lookup decoding offers one of the smallest overall quality impacts while still providing performance improvements, and we will be adding it to some language models on Workers AI including @cf/meta/llama-3.1-8b-instruct.
And, by the way, here is one of our favorite knock-knock jokes, can you guess the punchline?
Knock, knock!
Who’s there?
Figs!
Figs who?
Figs the doorbell, it’s broken!
Keep accelerating
As the AI industry continues to evolve, there will be new hardware and software that allows customers to get faster inference responses. Workers AI is committed to researching, implementing, and making upgrades to our services to help you get fast inference. As an Inference-as-a-Service platform, you’ll be able to benefit from all the optimizations we apply, without having to hire your own team of ML researchers and SREs to manage inference software and hardware deployments.
We’re excited for you to try out some of these new releases we have and let us know what you think! Check out our full-suite of AI announcements here and check out the developer docs to get started.
Traditional cloud storage is inherently slow, because it is normally accessed over a network and must carefully synchronize across many clients that could be accessing the same data. But what if we could instead put your application code deep into the storage layer, such that your code runs directly on the machine where the data is stored, and the database itself executes as a local library embedded inside your application?
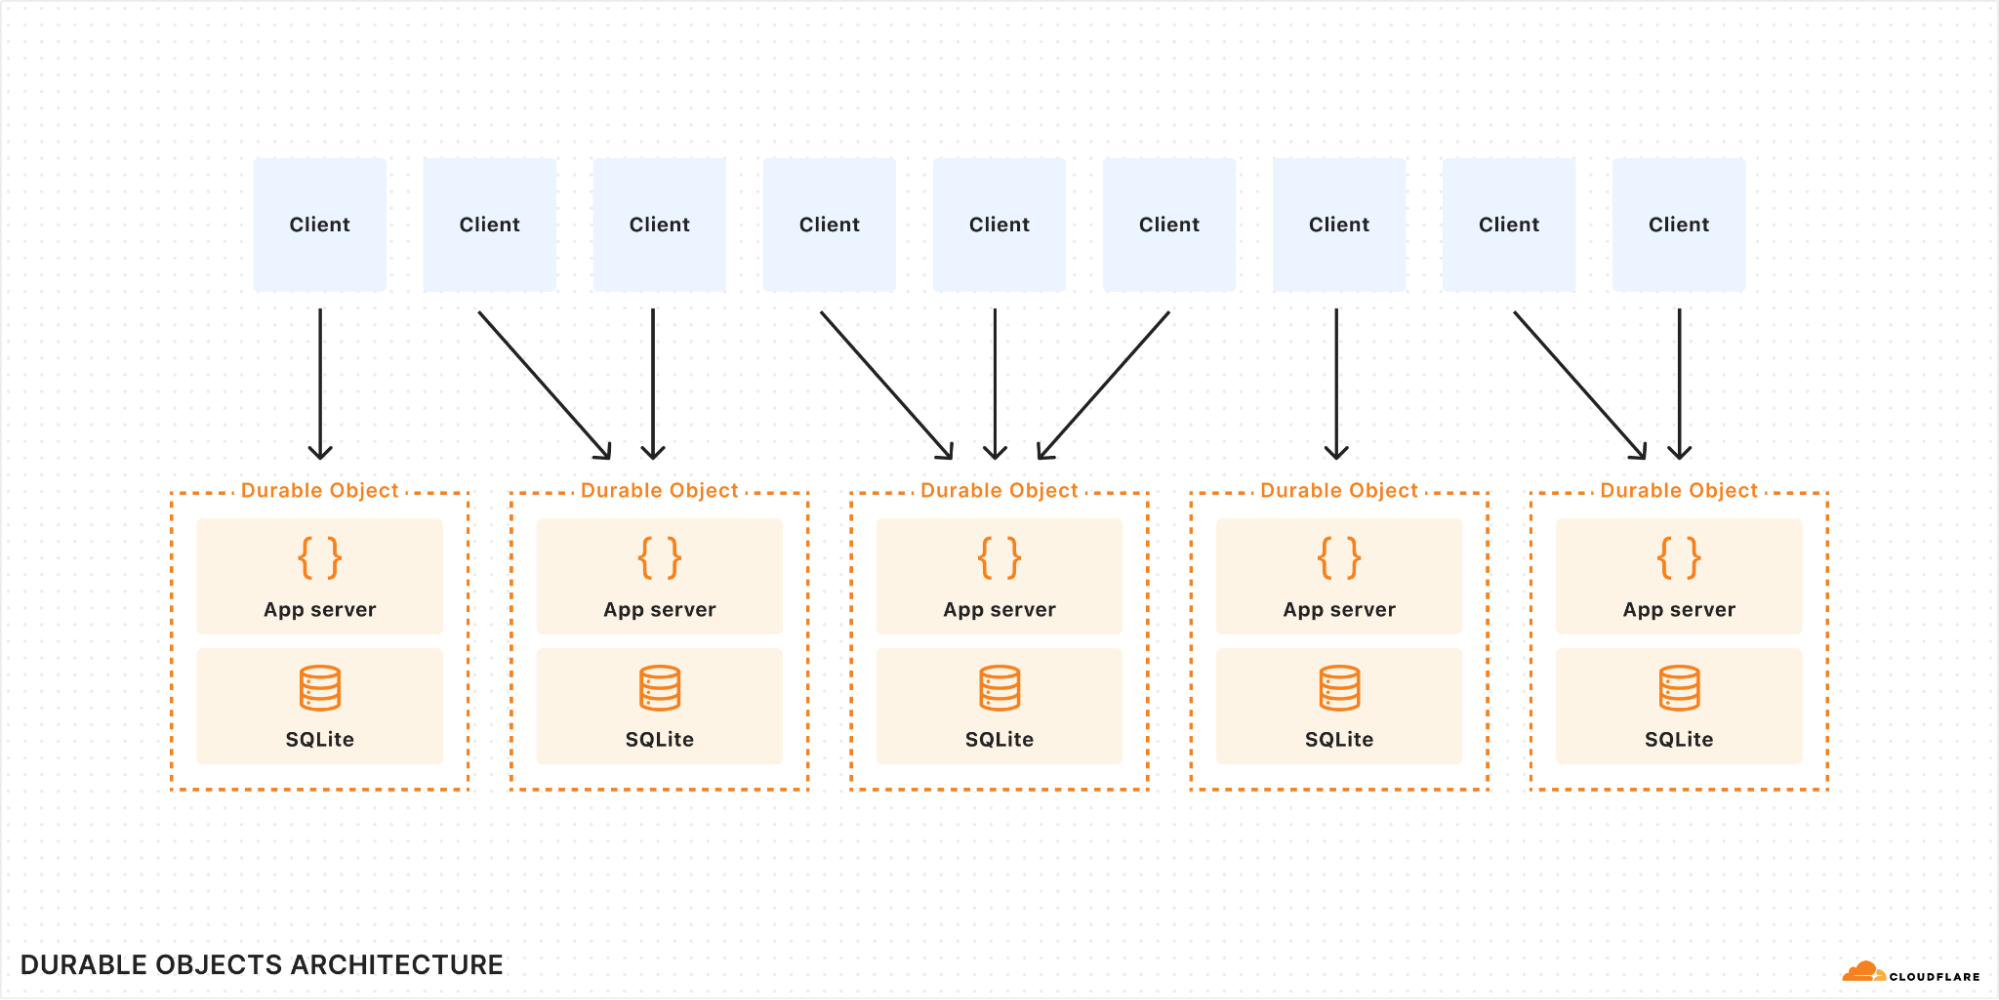
Durable Objects (DO) are a novel approach to cloud computing which accomplishes just that: Your application code runs exactly where the data is stored. Not just on the same machine: your storage lives in the same thread as the application, requiring not even a context switch to access. With proper use of caching, storage latency is essentially zero, while nevertheless being durable and consistent.
Until today, DOs only offered key/value oriented storage. But now, they support a full SQL query interface with tables and indexes, through the power of SQLite.
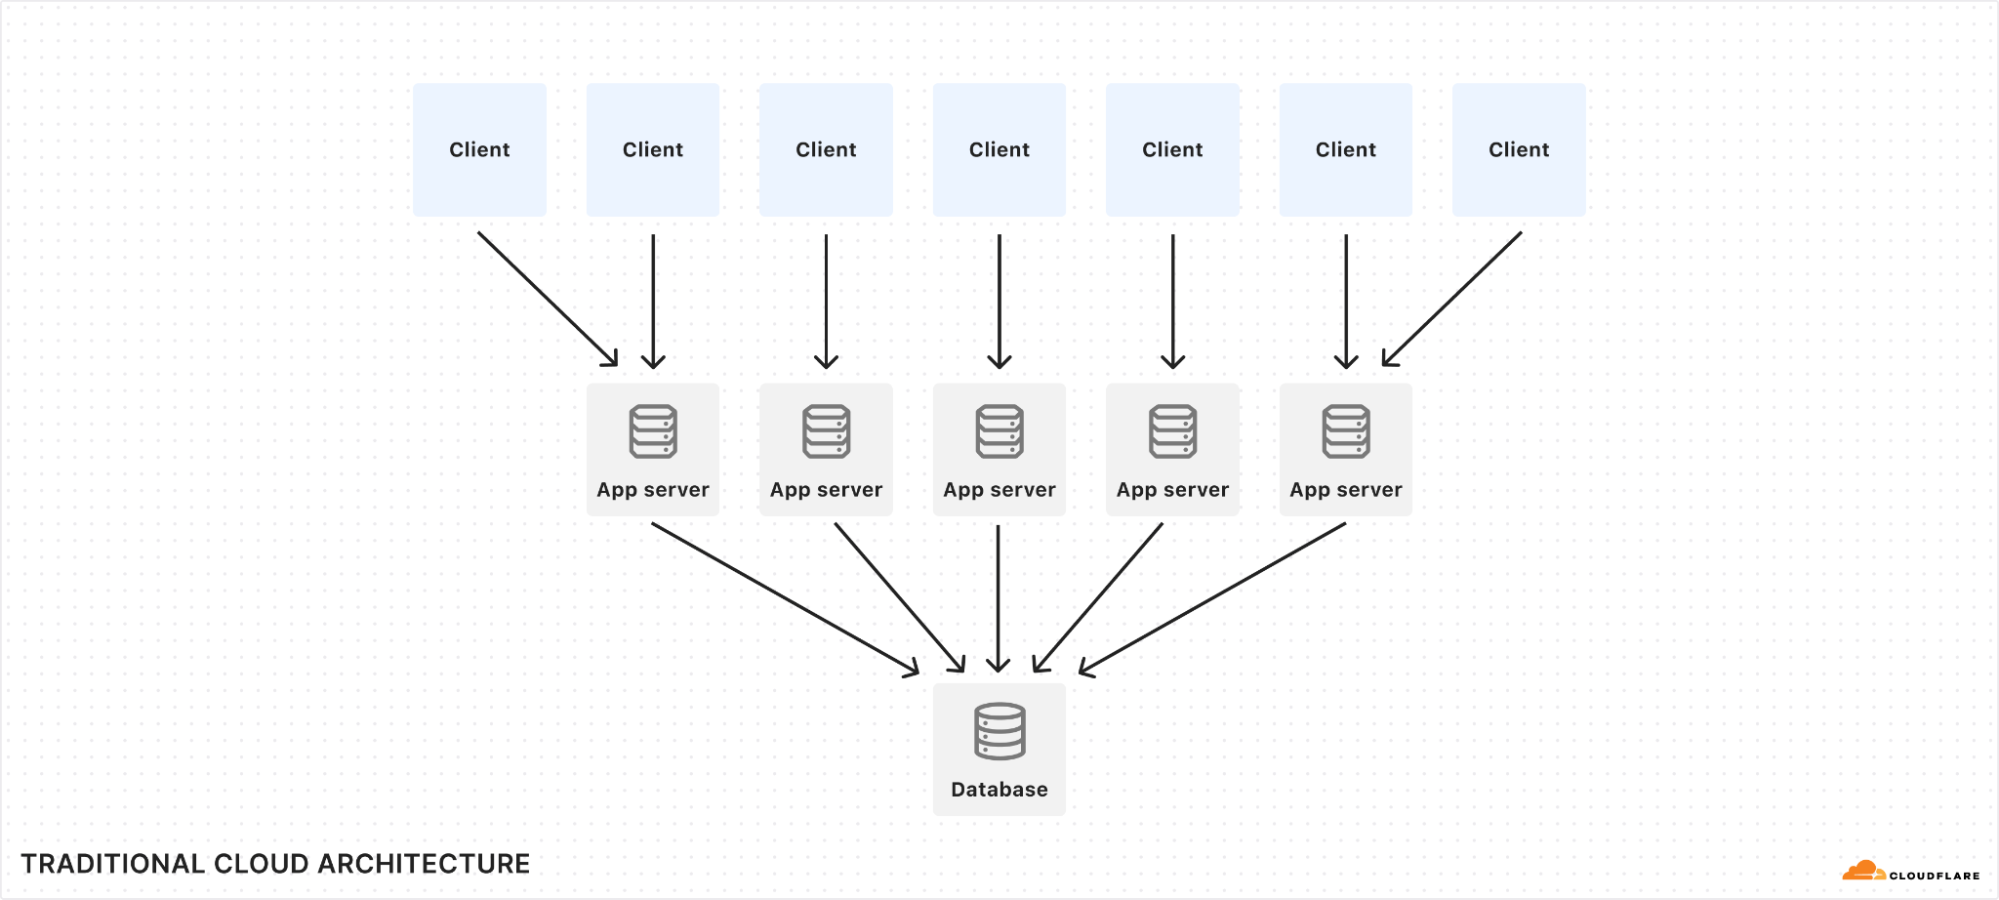
SQLite is the most-used SQL database implementation in the world, with billions of installations. It’s on practically every phone and desktop computer, and many embedded devices use it as well. It’s known to be blazingly fast and rock solid. But it’s been less common on the server. This is because traditional cloud architecture favors large distributed databases that live separately from application servers, while SQLite is designed to run as an embedded library. In this post, we’ll show you how Durable Objects turn this architecture on its head and unlock the full power of SQLite in the cloud.
Refresher: what are Durable Objects?
Durable Objects (DOs) are a part of the Cloudflare Workers serverless platform. A DO is essentially a small server that can be addressed by a unique name and can keep state both in-memory and on-disk. Workers running anywhere on Cloudflare’s network can send messages to a DO by its name, and all messages addressed to the same name — from anywhere in the world — will find their way to the same DO instance.
DOs are intended to be small and numerous. A single application can create billions of DOs distributed across our global network. Cloudflare automatically decides where a DO should live based on where it is accessed, automatically starts it up as needed when requests arrive, and shuts it down when idle. A DO has in-memory state while running and can also optionally store long-lived durable state. Since there is exactly one DO for each name, a DO can be used to coordinate between operations on the same logical object.
For example, imagine a real-time collaborative document editor application. Many users may be editing the same document at the same time. Each user’s changes must be broadcast to other users in real time, and conflicts must be resolved. An application built on DOs would typically create one DO for each document. The DO would receive edits from users, resolve conflicts, broadcast the changes back out to other users, and keep the document content updated in its local storage.
DOs are especially good at real-time collaboration, but are by no means limited to this use case. They are general-purpose servers that can implement any logic you desire to serve requests. Even more generally, DOs are a basic building block for distributed systems.
When using Durable Objects, it’s important to remember that they are intended to scale out, not up. A single object is inherently limited in throughput since it runs on a single thread of a single machine. To handle more traffic, you create more objects. This is easiest when different objects can handle different logical units of state (like different documents, different users, or different “shards” of a database), where each unit of state has low enough traffic to be handled by a single object. But sometimes, a lot of traffic needs to modify the same state: consider a vote counter with a million users all trying to cast votes at once. To handle such cases with Durable Objects, you would need to create a set of objects that each handle a subset of traffic and then replicate state to each other. Perhaps they use CRDTs in a gossip network, or perhaps they implement a fan-in/fan-out approach to a single primary object. Whatever approach you take, Durable Objects make it fast and easy to create more stateful nodes as needed.
Why is SQLite-in-DO so fast?
In traditional cloud architecture, stateless application servers run business logic and communicate over the network to a database. Even if the network is local, database requests still incur latency, typically measured in milliseconds.
When a Durable Object uses SQLite, SQLite is invoked as a library. This means the database code runs not just on the same machine as the DO, not just in the same process, but in the very same thread. Latency is effectively zero, because there is no communication barrier between the application and SQLite. A query can complete in microseconds.
Reads and writes are synchronous
The SQL query API in DOs does not require you to await results — they are returned synchronously:
// No awaits!
let cursor = sql.exec("SELECT name, email FROM users");
for (let user of cursor) {
  console.log(user.name, user.email);
}
This may come as a surprise to some. Querying a database is I/O, right? I/O should always be asynchronous, right? Isn’t this a violation of the natural order of JavaScript?
It’s OK! The database content is probably cached in memory already, and SQLite is being called as a library in the same thread as the application, so the query often actually won’t spend any time at all waiting for I/O. Even if it does have to go to disk, it’s a local SSD. You might as well consider the local disk as just another layer in the memory cache hierarchy: L5 cache, if you will. In any case, it will respond quickly.
Meanwhile, synchronous queries provide some big benefits. First, the logistics of asynchronous event loops have a cost, so in the common case where the data is already in memory, a synchronous query will actually complete faster than an async one.
More importantly, though, synchronous queries help you avoid subtle bugs. Any time your application awaits a promise, it’s possible that some other code executes while you wait. The state of the world may have changed by the time your await completes. Maybe even other SQL queries were executed. This can lead to subtle bugs that are hard to reproduce because they require events to happen at just the wrong time. With a synchronous API, though, none of that can happen. Your code always executes in the order you wrote it, uninterrupted.
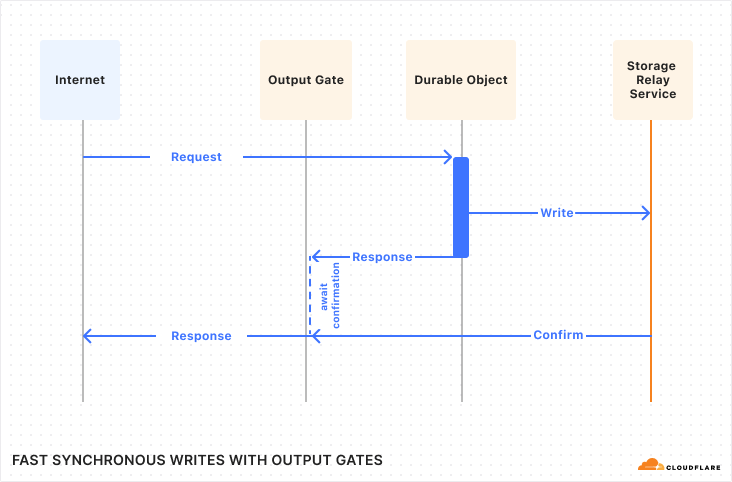
Fast writes with Output Gates
Database experts might have a deeper objection to synchronous queries: Yes, caching may mean we can perform reads and writes very fast. However, in the case of a write, just writing to cache isn’t good enough. Before we return success to our client, we must confirm that the write is actually durable, that is, it has actually made it onto disk or network storage such that it cannot be lost if the power suddenly goes out.
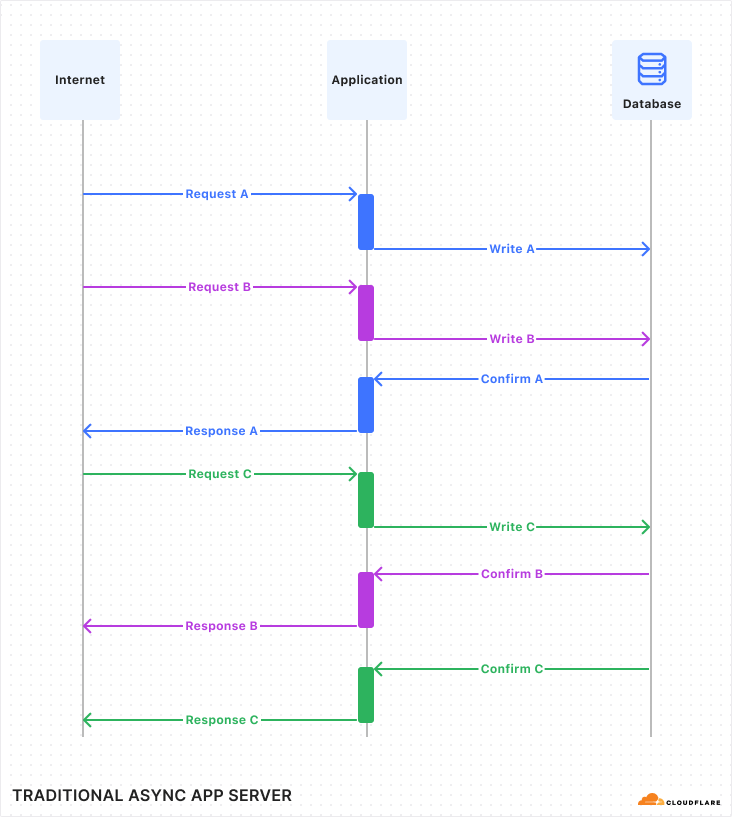
Normally, a database would confirm all writes before returning to the application. So if the query is successful, it is confirmed. But confirming writes can be slow, because it requires waiting for the underlying storage medium to respond. Normally, this is OK because the write is performed asynchronously, so the program can go on and work on other things while it waits for the write to finish. It looks kind of like this:
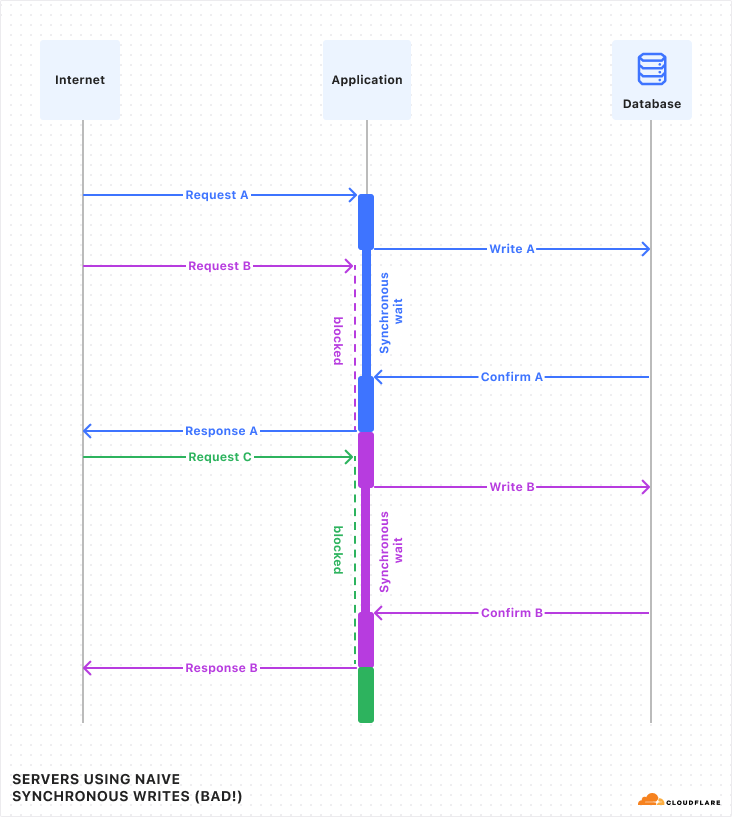
But I just told you that in Durable Objects, writes are synchronous. While a synchronous call is running, no other code in the program can run (because JavaScript does not have threads). This is convenient, as mentioned above, because it means you don’t need to worry that the state of the world may have changed while you were waiting. However, if write queries have to wait a while, and the whole program must pause and wait for them, then throughput will suffer.
Luckily, in Durable Objects, writes do not have to wait, due to a little trick we call “Output Gates”.
In DOs, when the application issues a write, it continues executing without waiting for confirmation. However, when the DO then responds to the client, the response is blocked by the “Output Gate”. This system holds the response until all storage writes relevant to the response have been confirmed, then sends the response on its way. In the rare case that the write fails, the response will be replaced with an error and the Durable Object itself will restart. So, even though the application constructed a “success” response, nobody can ever see that this happened, and thus nobody can be misled into believing that the data was stored.
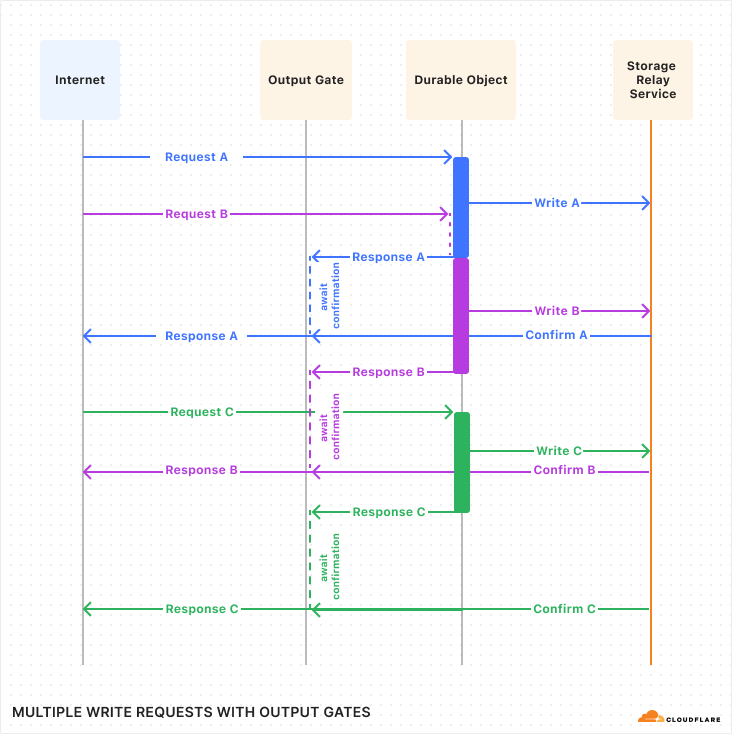
Let’s see what this looks like with multiple requests:
If you compare this against the first diagram above, you should notice a few things:
The timing of requests and confirmations are the same.
But, all responses were sent to the client sooner than in the first diagram. Latency was reduced! This is because the application is able to work on constructing the response in parallel with the storage layer confirming the write.
Request handling is no longer interleaved between the three requests. Instead, each request runs to completion before the next begins. The application does not need to worry, during the handling of one request, that its state might change unexpectedly due to a concurrent request.
With Output Gates, we get the ease-of-use of synchronous writes, while also getting lower latency and no loss of throughput.
N+1 selects? No problem.
Zero-latency queries aren’t just faster, they allow you to structure your code differently, often making it simpler. A classic example is the “N+1 selects” or “N+1 queries” problem. Let’s illustrate this problem with an example:
// N+1 SELECTs example

// Get the 100 most-recently-modified docs.
let docs = sql.exec(`
  SELECT title, authorId FROM documents
  ORDER BY lastModified DESC
  LIMIT 100
`).toArray();

// For each returned document, get the author name from the users table.
for (let doc of docs) {
  doc.authorName = sql.exec(
      "SELECT name FROM users WHERE id = ?", doc.authorId).one().name;
}
If you are an experienced SQL user, you are probably cringing at this code, and for good reason: this code does 101 queries! If the application is talking to the database across a network with 5ms latency, this will take 505ms to run, which is slow enough for humans to notice.
// Do it all in one query with a join?
let docs = sql.exec(`
  SELECT documents.title, users.name
  FROM documents JOIN users ON documents.authorId = users.id
  ORDER BY documents.lastModified DESC
  LIMIT 100
`).toArray();
Here we’ve used SQL features to turn our 101 queries into one query. Great! Except, what does it mean? We used an inner join, which is not to be confused with a left, right, or cross join. What’s the difference? Honestly, I have no idea! I had to look up joins just to write this example and I’m already confused.
Well, good news: You don’t need to figure it out. Because when using SQLite as a library, the first example above works just fine. It’ll perform about the same as the second fancy version.
More generally, when using SQLite as a library, you don’t have to learn how to do fancy things in SQL syntax. Your logic can be in regular old application code in your programming language of choice, orchestrating the most basic SQL queries that are easy to learn. It’s fine. The creators of SQLite have made this point themselves.
Point-in-Time Recovery
While not necessarily related to speed, SQLite-backed Durable Objects offer another feature: any object can be reverted to the state it had at any point in time in the last 30 days. So if you accidentally execute a buggy query that corrupts all your data, don’t worry: you can recover. There’s no need to opt into this feature in advance; it’s on by default for all SQLite-backed DOs. See the docs for details.
How do I use it?
Let’s say we’re an airline, and we are implementing a way for users to choose their seats on a flight. We will create a new Durable Object for each flight. Within that DO, we will use a SQL table to track the assignments of seats to passengers. The code might look something like this:
import {DurableObject} from "cloudflare:workers";

// Manages seat assignment for a flight.
//
// This is an RPC interface. The methods can be called remotely by other Workers
// running anywhere in the world. All Workers that specify same object ID
// (probably based on the flight number and date) will reach the same instance of
// FlightSeating.
export class FlightSeating extends DurableObject {
  sql = this.ctx.storage.sql;

  // Application calls this when the flight is first created to set up the seat map.
  initializeFlight(seatList) {
    this.sql.exec(`
      CREATE TABLE seats (
        seatId TEXT PRIMARY KEY,  -- e.g. "3B"
        occupant TEXT             -- null if available
      )
    `);

    for (let seat of seatList) {
      this.sql.exec(`INSERT INTO seats VALUES (?, null)`, seat);
    }
  }

  // Get a list of available seats.
  getAvailable() {
    let results = [];

    // Query returns a cursor.
    let cursor = this.sql.exec(`SELECT seatId FROM seats WHERE occupant IS NULL`);

    // Cursors are iterable.
    for (let row of cursor) {
      // Each row is an object with a property for each column.
      results.push(row.seatId);
    }

    return results;
  }

  // Assign passenger to a seat.
  assignSeat(seatId, occupant) {
    // Check that seat isn't occupied.
    let cursor = this.sql.exec(`SELECT occupant FROM seats WHERE seatId = ?`, seatId);
    let result = [...cursor][0];  // Get the first result from the cursor.
    if (!result) {
      throw new Error("No such seat: " + seatId);
    }
    if (result.occupant !== null) {
      throw new Error("Seat is occupied: " + seatId);
    }

    // If the occupant is already in a different seat, remove them.
    this.sql.exec(`UPDATE seats SET occupant = null WHERE occupant = ?`, occupant);

    // Assign the seat. Note: We don't have to worry that a concurrent request may
    // have grabbed the seat between the two queries, because the code is synchronous
    // (no `await`s) and the database is private to this Durable Object. Nothing else
    // could have changed since we checked that the seat was available earlier!
    this.sql.exec(`UPDATE seats SET occupant = ? WHERE seatId = ?`, occupant, seatId);
  }
}
(With just a little more code, we could extend this example to allow clients to subscribe to seat changes with WebSockets, so that if multiple people are choosing their seats at the same time, they can see in real time as seats become unavailable. But, that’s outside the scope of this blog post, which is just about SQL storage.)
Then in wrangler.toml, define a migration setting up your DO class like usual, but instead of using new_classes, use new_sqlite_classes:
[[migrations]]
tag = "v1"
new_sqlite_classes = ["FlightSeating"]
SQLite-backed objects also support the existing key/value-based storage API: KV data is stored into a hidden table in the SQLite database. So, existing applications built on DOs will work when deployed using SQLite-backed objects.
However, because SQLite-backed objects are based on an all-new storage backend, it is currently not possible to switch an existing deployed DO class to use SQLite. You must ask for SQLite when initially deploying the new DO class; you cannot change it later. We plan to begin migrating existing DOs to the new storage backend in 2025.
Pricing
We’ve kept pricing for SQLite-in-DO similar to D1, Cloudflare’s serverless SQL database, by billing for SQL queries (based on rows) and SQL storage. SQL storage per object is limited to 1 GB during the beta period, and will be increased to 10 GB on general availability. DO requests and duration billing are unchanged and apply to all DOs regardless of storage backend.
During the initial beta, billing is not enabled for SQL queries (rows read and rows written) and SQL storage. SQLite-backed objects will incur charges for requests and duration. We plan to enable SQL billing in the first half of 2025 with advance notice.
Workers Paid
Rows read
First 25 billion / month included + $0.001 / million rows
Rows written
First 50 million / month included + $1.00 / million rows
SQL storage
5 GB-month + $0.20/ GB-month
For more on how to use SQLite-in-Durable Objects, check out the documentation.
What about D1?
Cloudflare Workers already offers another SQLite-backed database product: D1. In fact, D1 is itself built on SQLite-in-DO. So, what’s the difference? Why use one or the other?
In short, you should think of D1 as a more “managed” database product, while SQLite-in-DO is more of a lower-level “compute with storage” building block.
D1 fits into a more traditional cloud architecture, where stateless application servers talk to a separate database over the network. Those application servers are typically Workers, but could also be clients running outside of Cloudflare. D1 also comes with a pre-built HTTP API and managed observability features like query insights. With D1, where your application code and SQL database queries are not colocated like in SQLite-in-DO, Workers has Smart Placement to dynamically run your Worker in the best location to reduce total request latency, considering everything your Worker talks to, including D1. By the end of 2024, D1 will support automatic read replication for scalability and low-latency access around the world. If this managed model appeals to you, use D1.
Durable Objects require a bit more effort, but in return, give you more power. With DO, you have two pieces of code that run in different places: a front-end Worker which routes incoming requests from the Internet to the correct DO, and the DO itself, which runs on the same machine as the SQLite database. You may need to think carefully about which code to run where, and you may need to build some of your own tooling that exists out-of-the-box with D1. But because you are in full control, you can tailor the solution to your application’s needs and potentially achieve more.
Under the hood: Storage Relay Service
When Durable Objects first launched in 2020, it offered only a simple key/value-based interface for durable storage. Under the hood, these keys and values were stored in a well-known off-the-shelf database, with regional instances of this database deployed to locations in our data centers around the world. Durable Objects in each region would store their data to the regional database.
For SQLite-backed Durable Objects, we have completely replaced the persistence layer with a new system built from scratch, called Storage Relay Service, or SRS. SRS has already been powering D1 for over a year, and can now be used more directly by applications through Durable Objects.
SRS is based on a simple idea:
Local disk is fast and randomly-accessible, but expensive and prone to disk failures. Object storage (like R2) is cheap and durable, but much slower than local disk and not designed for database-like access patterns. Can we get the best of both worlds by using a local disk as a cache on top of object storage?
So, how does it work?
The mismatch in functionality between local disk and object storage
A SQLite database on disk tends to undergo many small changes in rapid succession. Any row of the database might be updated by any particular query, but the database is designed to avoid rewriting parts that didn’t change. Read queries may randomly access any part of the database. Assuming the right indexes exist to support the query, they should not require reading parts of the database that aren’t relevant to the results, and should complete in microseconds.
Object storage, on the other hand, is designed for an entirely different usage model: you upload an entire “object” (blob of bytes) at a time, and download an entire blob at a time. Each blob has a different name. For maximum efficiency, blobs should be fairly large, from hundreds of kilobytes to gigabytes in size. Latency is relatively high, measured in tens or hundreds of milliseconds.
So how do we back up our SQLite database to object storage? An obviously naive strategy would be to simply make a copy of the database files from time to time and upload it as a new “object”. But, uploading the database on every change — and making the application wait for the upload to complete — would obviously be way too slow. We could choose to upload the database only occasionally — say, every 10 minutes — but this means in the case of a disk failure, we could lose up to 10 minutes of changes. Data loss is, uh, bad! And even then, for most databases, it’s likely that most of the data doesn’t change every 10 minutes, so we’d be uploading the same data over and over again.
Trick one: Upload a log of changes
Instead of uploading the entire database, SRS records a log of changes, and uploads those.
Conveniently, SQLite itself already has a concept of a change log: the Write-Ahead Log, or WAL. SRS always configures SQLite to use WAL mode. In this mode, any changes made to the database are first written to a separate log file. From time to time, the database is “checkpointed”, merging the changes back into the main database file. The WAL format is well-documented and easy to understand: it’s just a sequence of “frames”, where each frame is an instruction to write some bytes to a particular offset in the database file.
SRS monitors changes to the WAL file (by hooking SQLite’s VFS to intercept file writes) to discover the changes being made to the database, and uploads those to object storage.
Unfortunately, SRS cannot simply upload every single change as a separate “object”, as this would result in too many objects, each of which would be inefficiently small. Instead, SRS batches changes over a period of up to 10 seconds, or up to 16 MB worth, whichever happens first, then uploads the whole batch as a single object.
When reconstructing a database from object storage, we must download the series of change batches and replay them in order. Of course, if the database has undergone many changes over a long period of time, this can get expensive. In order to limit how far back it needs to look, SRS also occasionally uploads a snapshot of the entire content of the database. SRS will decide to upload a snapshot any time that the total size of logs since the last snapshot exceeds the size of the database itself. This heuristic implies that the total amount of data that SRS must download to reconstruct a database is limited to no more than twice the size of the database. Since we can delete data from object storage that is older than the latest snapshot, this also means that our total stored data is capped to 2x the database size.
Credit where credit is due: This idea — uploading WAL batches and snapshots to object storage — was inspired by Litestream, although our implementation is different.
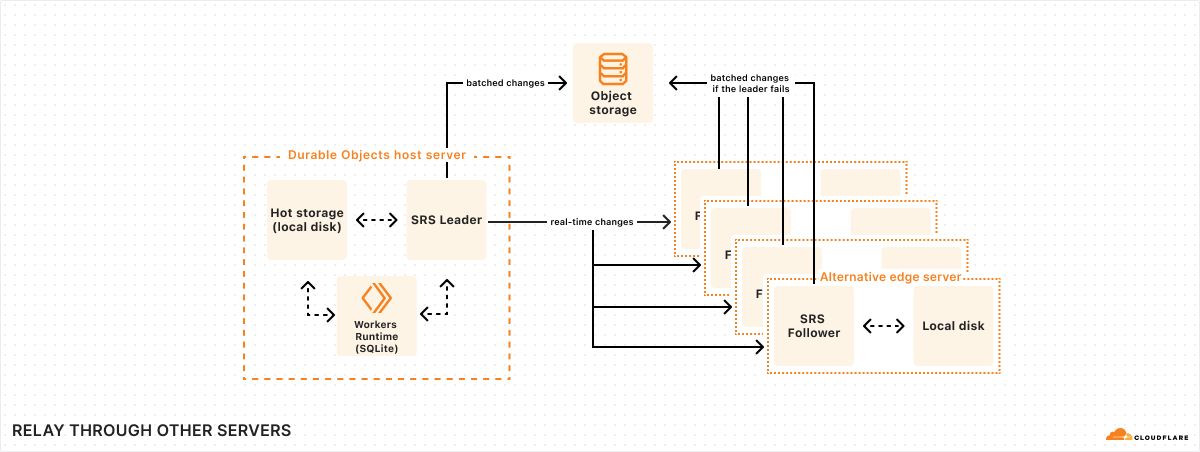
Trick two: Relay through other servers in our global network
Batches are only uploaded to object storage every 10 seconds. But obviously, we cannot make the application wait for 10 whole seconds just to confirm a write. So what happens if the application writes some data, returns a success message to the user, and then the machine fails 9 seconds later, losing the data?
To solve this problem, we take advantage of our global network. Every time SQLite commits a transaction, SRS will immediately forward the change log to five “follower” machines across our network. Once at least three of these followers respond that they have received the change, SRS informs the application that the write is confirmed. (As discussed earlier, the write confirmation opens the Durable Object’s “output gate”, unblocking network communications to the rest of the world.)
When a follower receives a change, it temporarily stores it in a buffer on local disk, and then awaits further instructions. Later on, once SRS has successfully uploaded the change to object storage as part of a batch, it informs each follower that the change has been persisted. At that point, the follower can simply delete the change from its buffer.
However, if the follower never receives the persisted notification, then, after some timeout, the follower itself will upload the change to object storage. Thus, if the machine running the database suddenly fails, as long as at least one follower is still running, it will ensure that all confirmed writes are safely persisted.
Each of a database’s five followers is located in a different physical data center. Cloudflare’s network consists of hundreds of data centers around the world, which means it is always easy for us to find four other data centers nearby any Durable Object (in addition to the one it is running in). In order for a confirmed write to be lost, then, at least four different machines in at least three different physical buildings would have to fail simultaneously (three of the five followers, plus the Durable Object’s host machine). Of course, anything can happen, but this is exceedingly unlikely.
Followers also come in handy when a Durable Object’s host machine is unresponsive. We may not know for sure if the machine has died completely, or if it is still running and responding to some clients but not others. We cannot start up a new instance of the DO until we know for sure that the previous instance is dead – or, at least, that it can no longer confirm writes, since the old and new instances could then confirm contradictory writes. To deal with this situation, if we can’t reach the DO’s host, we can instead try to contact its followers. If we can contact at least three of the five followers, and tell them to stop confirming writes for the unreachable DO instance, then we know that instance is unable to confirm any more writes going forward. We can then safely start up a new instance to replace the unreachable one.
Bonus feature: Point-in-Time Recovery
I mentioned earlier that SQLite-backed Durable Objects can be asked to revert their state to any time in the last 30 days. How does this work?
This was actually an accidental feature that fell out of SRS’s design. Since SRS stores a complete log of changes made to the database, we can restore to any point in time by replaying the change log from the last snapshot. The only thing we have to do is make sure we don’t delete those logs too soon.
Normally, whenever a snapshot is uploaded, all previous logs and snapshots can then be deleted. But instead of deleting them immediately, SRS merely marks them for deletion 30 days later. In the meantime, if a point-in-time recovery is requested, the data is still there to work from.
For a database with a high volume of writes, this may mean we store a lot of data for a lot longer than needed. As it turns out, though, once data has been written at all, keeping it around for an extra month is pretty cheap — typically cheaper, even, than writing it in the first place. It’s a small price to pay for always-on disaster recovery.
Get started with SQLite-in-DO
SQLite-backed DOs are available in beta starting today. You can start building with SQLite-in-DO by visiting developer documentation and provide beta feedback via the #durable-objects channel on our Developer Discord.
Do distributed systems like SRS excite you? Would you like to be part of building them at Cloudflare? We’re hiring!
Speed is a critical factor that dictates Internet behavior. Every additional millisecond a user spends waiting for your web page to load results in them abandoning your website. The old adage remains as true as ever: faster websites result in higher conversion rates. And with such outcomes tied to Internet speed, we believe a faster Internet is a better Internet.
Customers often use Workers KV to provide Workers with key-value data for configuration, routing, personalization, experimentation, or serving assets. Many of Cloudflare’s own products rely on KV for just this purpose: Pages stores static assets, Access stores authentication credentials, AI Gateway stores routing configuration, and Images stores configuration and assets, among others. So KV’s speed affects the latency of every request to an application, throughout the entire lifecycle of a user session.
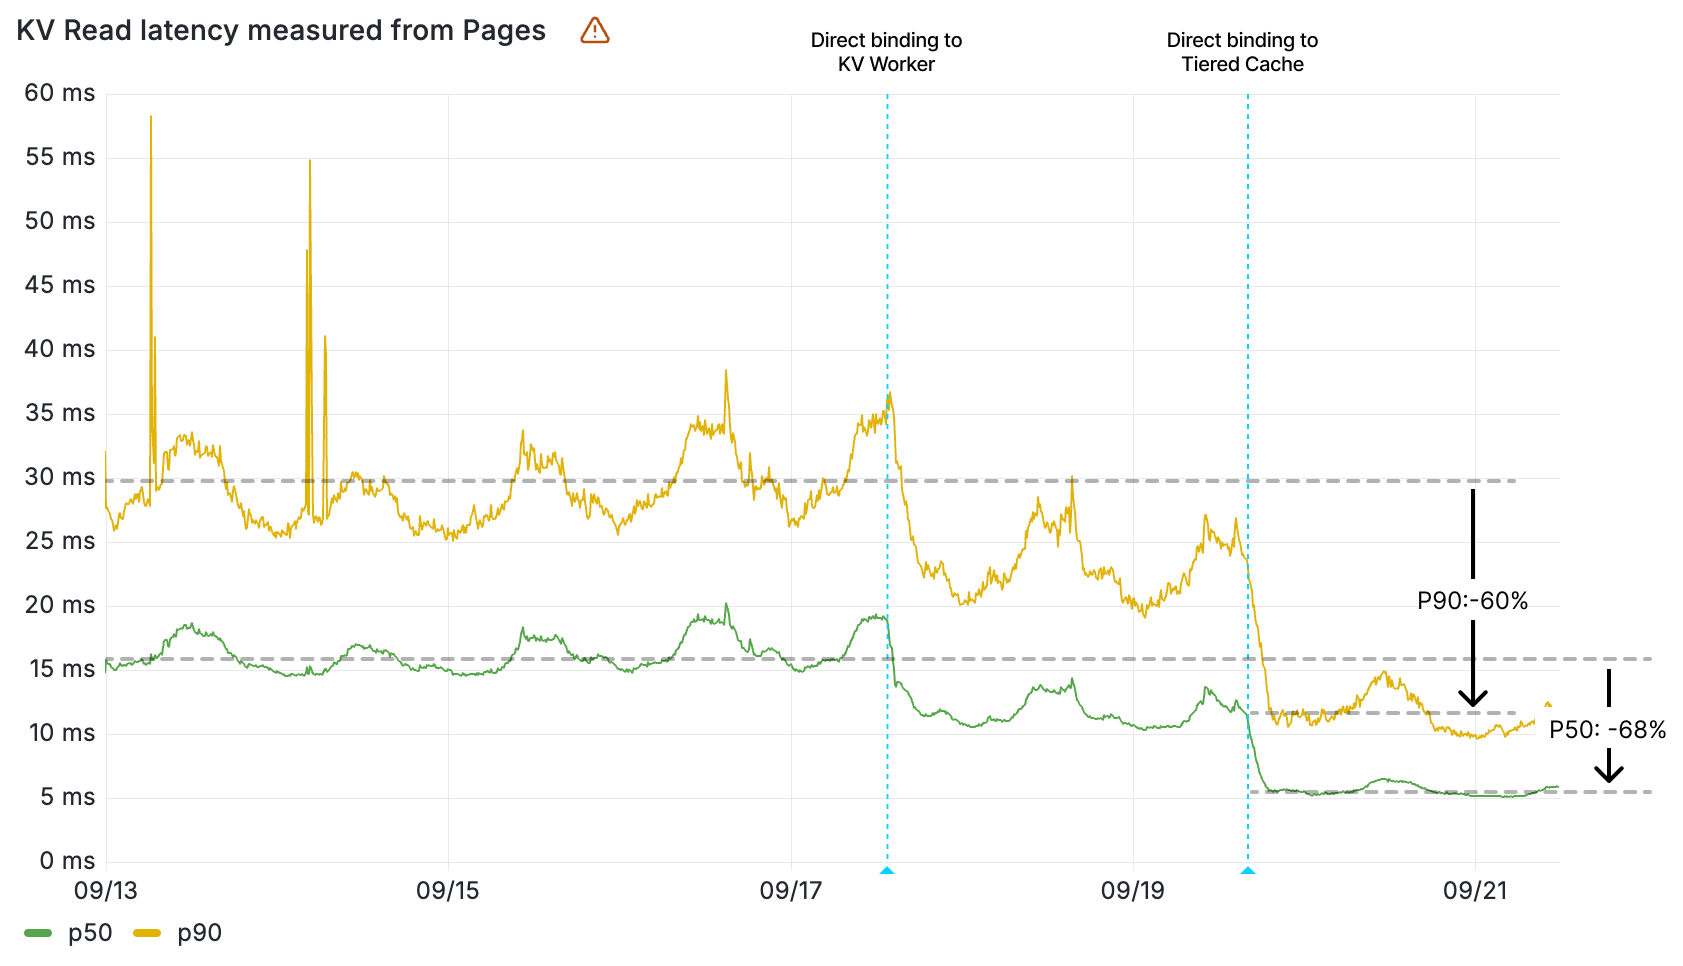
Today, we’re announcing up to 3x faster KV hot reads, with all KV operations faster by up to 20ms. And we want to pull back the curtain and show you how we did it.
Workers KV read latency (ms) by percentile measured from Pages
Optimizing Workers KV’s architecture to minimize latency
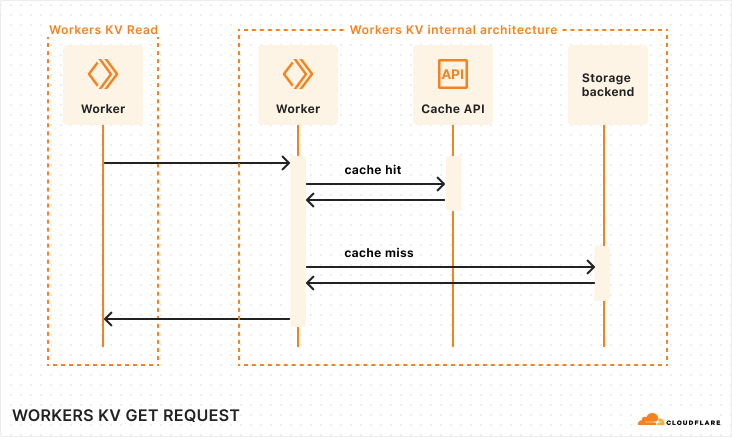
At a high level, Workers KV is itself a Worker that makes requests to central storage backends, with many layers in between to properly cache and route requests across Cloudflare’s network. You can rely on Workers KV to support operations made by your Workers at any scale, and KV’s architecture will seamlessly handle your required throughput.
Sequence diagram of a Workers KV operation
When your Worker makes a read operation to Workers KV, your Worker establishes a network connection within its Cloudflare region to KV’s Worker. The KV Worker then accesses the Cache API, and in the event of a cache miss, retrieves the value from the storage backends.
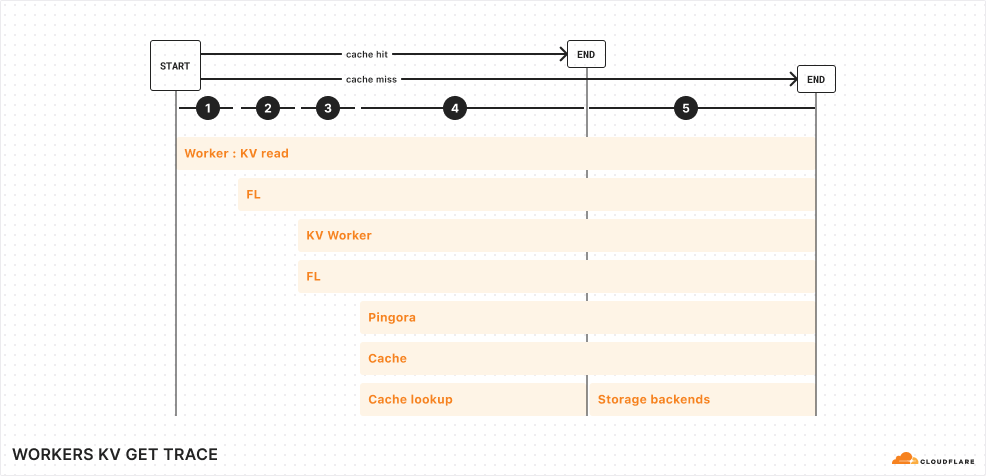
Let’s look one level deeper at a simplified trace:
Simplified trace of a Workers KV operation
From the top, here are the operations completed for a KV read operation from your Worker:
Your Worker makes a connection to Cloudflare’s network in the same data center. This incurs ~5 ms of network latency.
Upon entering Cloudflare’s network, a service called Front Line (FL) is used to process the request. This incurs ~10 ms of operational latency.
FL proxies the request to the KV Worker. The KV Worker does a cache lookup for the key being accessed. This, once again, passes through the Front Line layer, incurring an additional ~10 ms of operational latency.
Cache is stored in various backends within each region of Cloudflare’s network. A service built upon Pingora, our open-sourced Rust framework for proxying HTTP requests, routes the cache lookup to the proper cache backend.
Finally, if the cache lookup is successful, the KV read operation is resolved. Otherwise, the request reaches our storage backends, where it gets its value.
Looking at these flame graphs, it became apparent that a major opportunity presented itself to us: reducing the FL overhead (or eliminating it altogether) and reducing the cache misses across the Cloudflare network would reduce the latency for KV operations.
Bypassing FL layers between Workers and services to save ~20ms
A request from your Worker to KV doesn’t need to go through FL. Much of FL’s responsibility is to process and route requests from outside of Cloudflare — that’s more than is needed to handle a request from the KV binding to the KV Worker. So we skipped the Front Line altogether in both layers.
Reducing latency in a Workers KV operation by removing FL layers
To bypass the FL layer from the KV binding in your Worker, we modified the KV binding to connect directly to the KV Worker within the same Cloudflare location. Within the Workers host, we configured a C++ subpipeline to allow code from bindings to establish a direct connection with the proper routing configuration and authorization loaded.
The KV Worker also passes through the FL layer on its way to our internal Pingora service. In this case, we were able to use an internal Worker binding that allows Workers for Cloudflare services to bind directly to non-Worker services within Cloudflare’s network. With this fix, the KV Worker sets the proper cache control headers and establishes its connection to Pingora without leaving the network.
Together, both of these changes reduced latency by ~20 ms for every KV operation.
Implementing tiered cache to minimize requests to storage backends
We also optimized KV’s architecture to reduce the amount of requests that need to reach our centralized storage backends. These storage backends are further away and incur network latency, so improving the cache hit rate in regions close to your Workers significantly improves read latency.
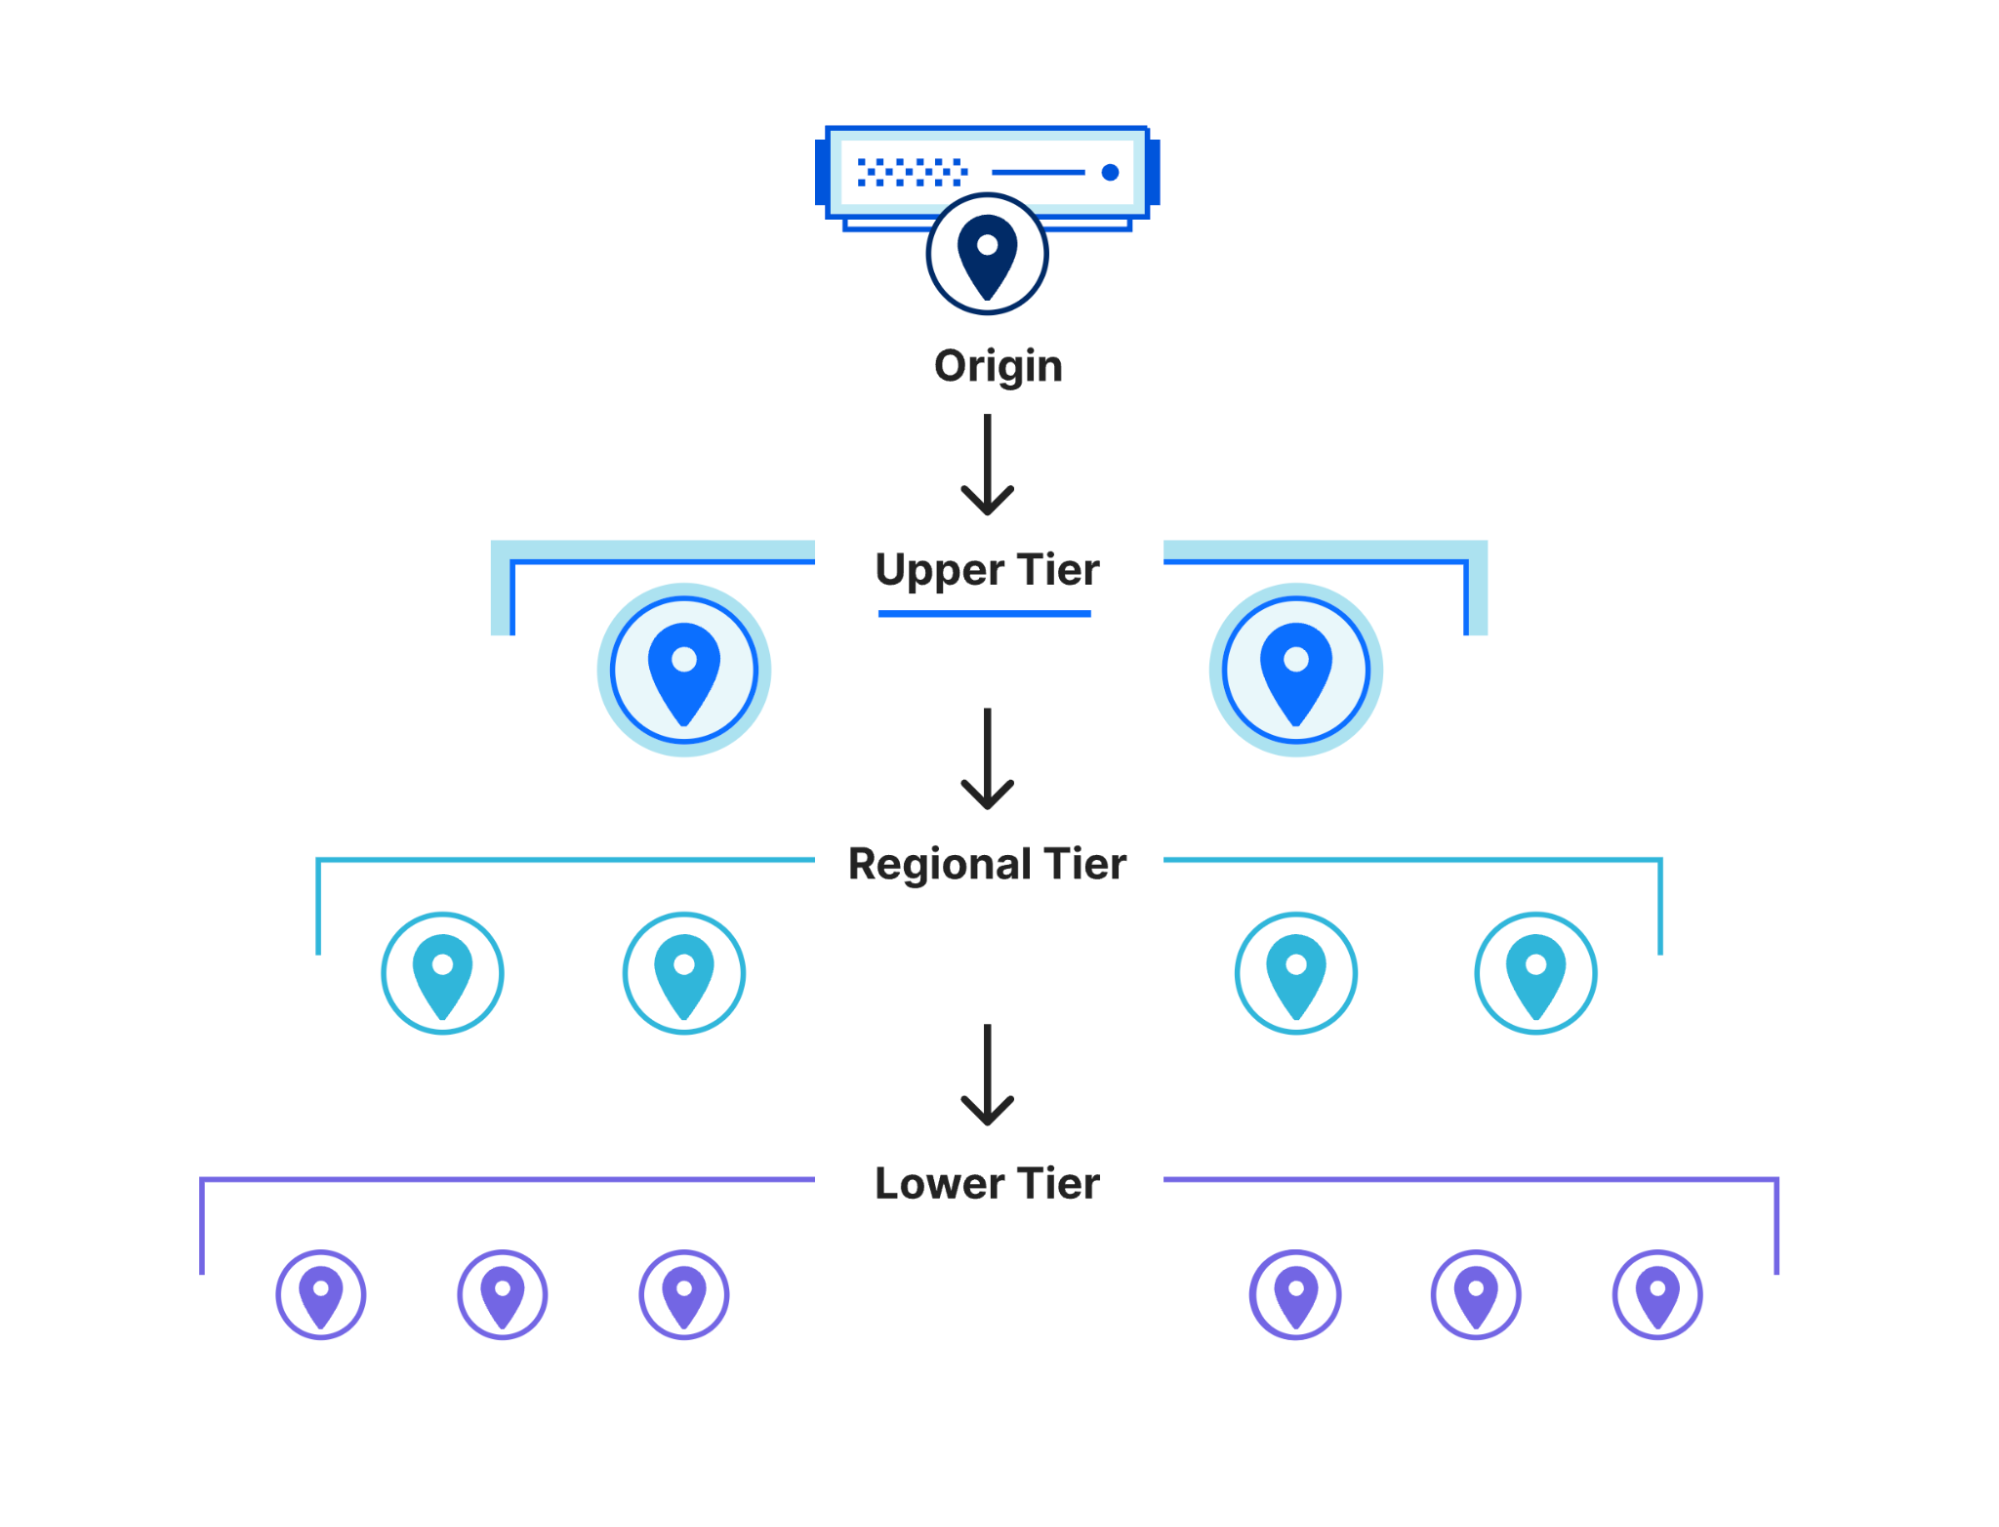
Workers KV uses Tiered Cache to resolve operations closer to your users
To accomplish this, we used Tiered Cache, and implemented a cache topology that is fine-tuned to the usage patterns of KV. With a tiered cache, requests to KV’s storage backends are cached in regional tiers in addition to local (lower) tiers. With this architecture, KV operations that may be cache misses locally may be resolved regionally, which is especially significant if you have traffic across an entire region spanning multiple Cloudflare data centers.
This significantly reduced the amount of requests that needed to hit the storage backends, with ~30% of requests resolved in tiered cache instead of storage backends.
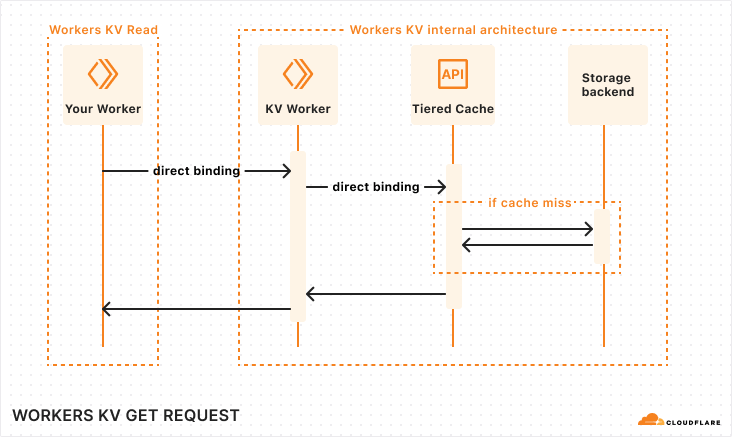
KV’s new architecture
As a result of these optimizations, KV operations are now simplified:
When you read from KV in your Worker, the KV binding binds directly to KV’s Worker, saving 10 ms.
The KV Worker binds directly to the Tiered Cache service, saving another 10 ms.
Tiered Cache is used in front of storage backends, to resolve local cache misses regionally, closer to your users.
Sequence diagram of KV operations with new architecture
In aggregate, these changes significantly reduced KV’s latency.
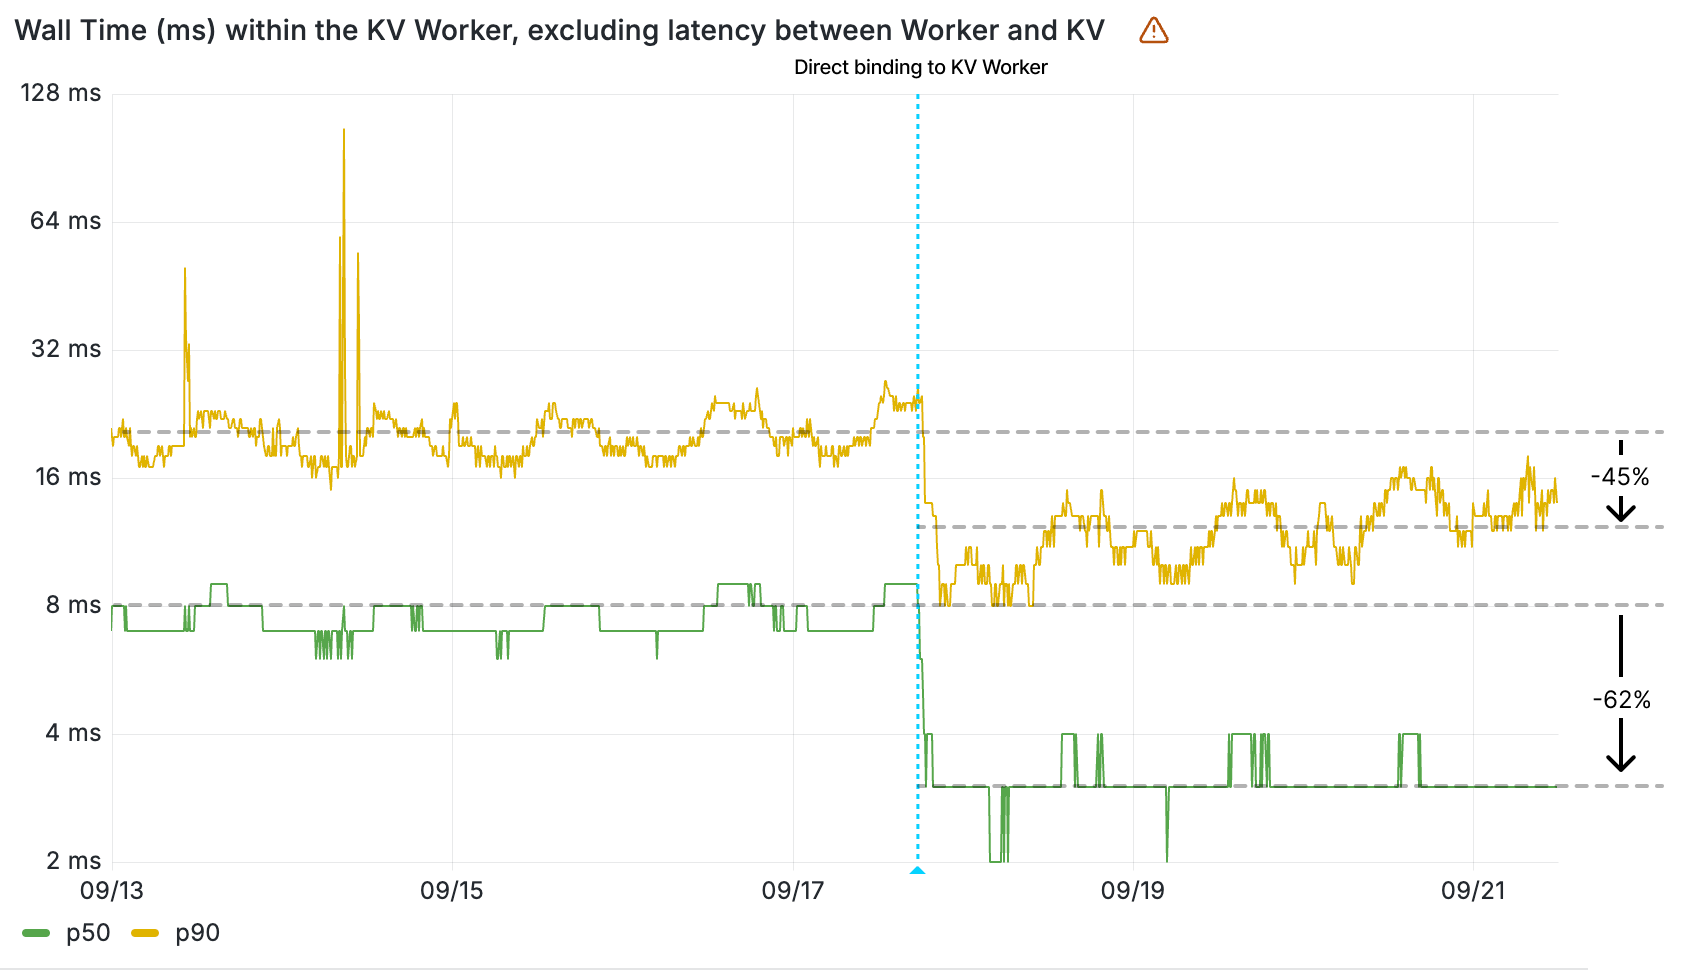
The impact of the direct binding to cache is clearly seen in the wall time of the KV Worker, given this value measures the duration of a retrieval of a key-value pair from cache. The 90th percentile of all KV Worker invocations now resolve in less than 12 ms — before the direct binding to cache, that was 22 ms. That’s a 10 ms decrease in latency.
Wall time (ms) within the KV Worker by percentile
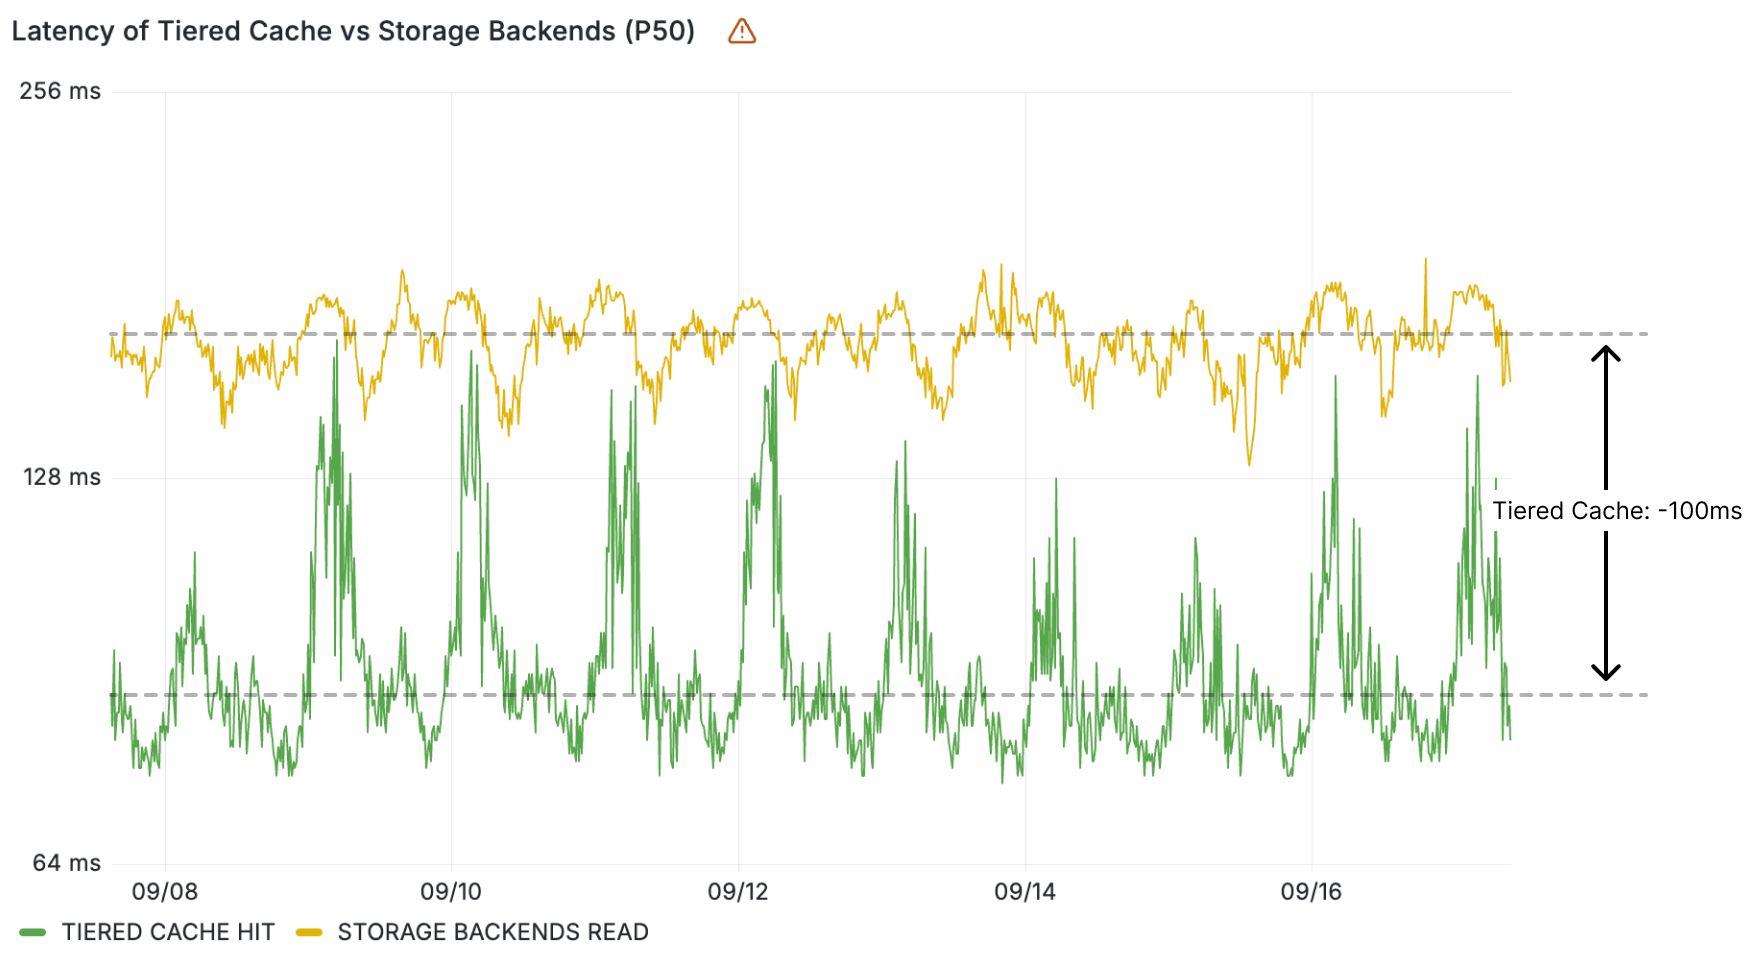
These KV read operations resolve quickly because the data is cached locally in the same Cloudflare location. But what about reads that aren’t resolved locally? ~30% of these resolve regionally within the tiered cache. Reads from tiered cache are up to 100 ms faster than when resolved at central storage backends, once again contributing to making KV reads faster in aggregate.
Wall time (ms) within the KV Worker for tiered cache vs. storage backends reads
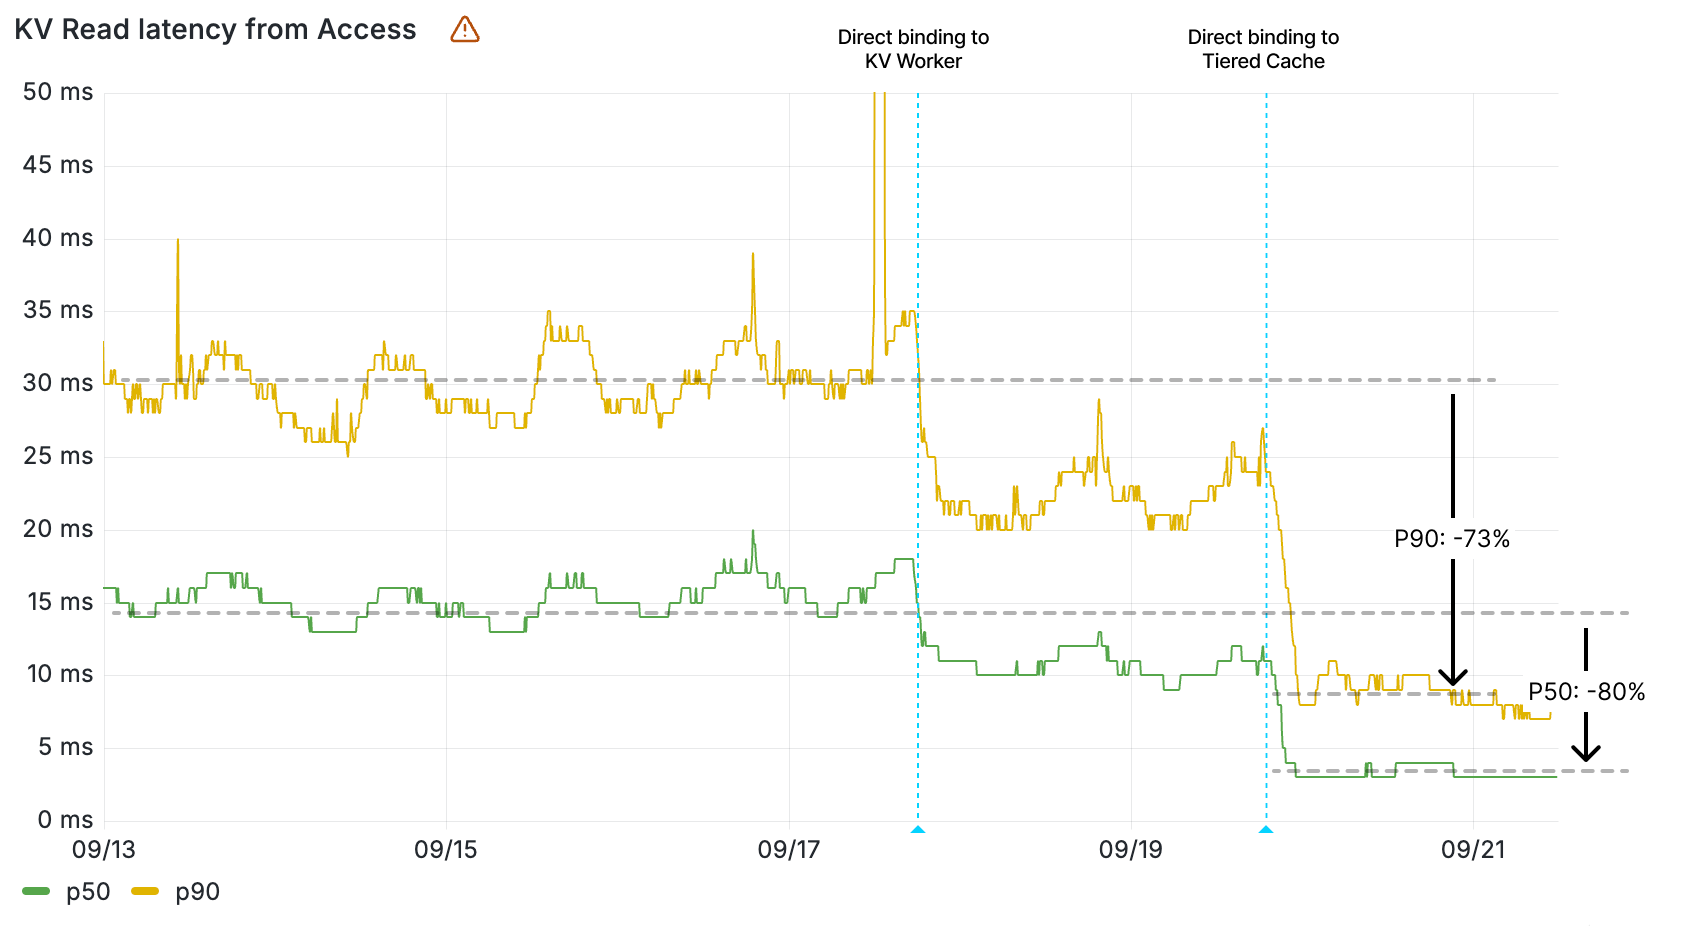
These graphs demonstrate the impact of direct binding from the KV binding to cache, and tiered cache. To see the impact of the direct binding from a Worker to the KV Worker, we need to look at the latencies reported by Cloudflare products that use KV.
Cloudflare Pages, which serves static assets like HTML, CSS, and scripts from KV, saw load times for fetching assets improve by up to 68%. Workers asset hosting, which we also announced as part of today’s Builder Day announcements, gets this improved performance from day 1.
Workers KV read operation latency measured within Cloudflare Pages by percentile
Queues and Access also saw their latencies for KV operations drop, with their KV read operations now 2-5x faster. These services rely on Workers KV data for configuration and routing data, so KV’s performance improvement directly contributes to making them faster on each request.
Workers KV read operation latency measured within Cloudflare Queues by percentile
Workers KV read operation latency measured within Cloudflare Access by percentile
These are just some of the direct effects that a faster KV has had on other services. Across the board, requests are resolving faster thanks to KV’s faster response times.
And we have one more thing to make KV lightning fast.
Optimizing KV’s hottest keys with an in-memory cache
Less than 0.03% of keys account for nearly half of requests to the Workers KV service across all namespaces. These keys are read thousands of times per second, so making these faster has a disproportionate impact. Could these keys be resolved within the KV Worker without needing additional network hops?
Almost all of these keys are under 100 KB. At this size, it becomes possible to use the in-memory cache of the KV Worker — a limited amount of memory within the main runtime process of a Worker sandbox. And that’s exactly what we did. For the highest throughput keys across Workers KV, reads resolve without even needing to leave the Worker runtime process.
Sequence diagram of KV operations with the hottest keys resolved within an in-memory cache
As a result of these changes, KV reads for these keys, which represent over 40% of Workers KV requests globally, resolve in under a millisecond. We’re actively testing these changes internally and expect to roll this out during October to speed up the hottest key-value pairs on Workers KV.
A faster KV for all
Most of these speed gains are already enabled with no additional action needed from customers. Your websites that are using KV are already responding to requests faster for your users, as are the other Cloudflare services using KV under the hood and the countless websites that depend upon them.
And we’re not done: we’ll continue to chase performance throughout our stack to make your websites faster. That’s how we’re going to move the needle towards a faster Internet.
To see Workers KV’s recent speed gains for your own KV namespaces, head over to your dashboard and check out the new KV analytics, with latency and cache status detailed per namespace.
Това Народно събрание (50-о по ред) имаше кратък живот, но все пак успяхме да свършим някои полезни неща. Ето моят кратък отчет:
Внесени законопроекти, по които съм работил: 22
Внесени предложения между 1-во и 2-ро четене по законопроекти: 5
Въпроси до министри: 41
Искания за информация до институции: 17
Ето законопроектите и предложенията, които бяха приети:
В Закона за здравето приехме разширяване на електронното здравеопазване и ограничаване на хартията, изисквания за пълнота на здравното досие, оценка на медицинския софтуер за удобство и коректност на подаваните данни към централната система (НЗИС), телемедицина (диагностични и други дейности от разстояние), служебна проверка на здравното състояние на донорите при кръводаряване, забрана на онлайн рекламата на райски газ
В Закона за ДДС приехме разширяване на електронните касови бележки, в т.ч. при използване на автоматизирани колонки за горива
В Закона за гражданската регистрация направихме съществена реформа, с която се предвижда регистрация на служебен адрес в случай, че липсва валиден постоянен адрес, както и правото на собствениците да дерегистрират лица от свой имот (освен ако не са роднини)
Сред въпросите, на които получих отговор, по-интересни са:
Два въпроса (първи, втори) до МВР (зададени към Калин Стоянов, като отговорът е получен при Атанас Илков) за свалянето на сатиричния сайт novonachalo.com от МВР. Според отговора в МВР били постъпили сигнали и те за всеки случай свалили сайта, което е сериозен проблем изисква въвеждане на механизми за контрол на тази дейност на МВР
Въпрос за напредъка по отпадането на „контактните бележки“, което инициирахме преди една година – на практика от следващата учебна година вече няма да има нужда от тях (в момента МЗ са готови и се чака интеграция с МОН)
Въпрос за обслужването от Агенцията по геодезия, картография и кадастър, както и за внедряването на новата кадастрална информационна система, която се чака отдавна и която ще реши много проблеми с работоспособността на настоящата. От отговора стана ясно, че МРРБ вместо да внесе измененията в закона, променя системата, за да пасне на стария закон. В резултат на това ние внесохме нужните промени, но не се стигна до тяхното приемане.
Въпрос относно напредъка по дигитализацията на регистри от Министерство на електронното управление, като според отговора изграждането на централизираната платформа за управление на регистри е „на пауза“.
Въпрос за прилагането на забраната за онлайн реклама в Закона за хазарта, като отговорът потвърждава изказаните от мен притеснения при приемането на закона, че предложените текстове няма да работят заради нормативната и техническа сложност при онлайн рекламата
Въпрос относно нефункциониращ портал на Агенцията по горите, който доведе до това порталът да бъде оправен преди да получа отговора (в който пише, че всичко е наред). Това поставя въпроса за нуждата от централизиран мониторинг за работоспособността на системите на администрацията
В кратки парламенти не могат да бъдат приети кой знае какви сериозни реформи, но дори внасянето и обсъждането на такива е важно, за да могат да те да минат в максималено изчистен вид в следващото Народно събрание. Ще продължавам да работя за намаляване на бюрокрацията, за повече удобство и за повече прозрачност.
Across continents and cultural contexts, our free Computing Curriculum serves as a common thread that connects educators. Read the stories of 3 educators who share their thoughts on the curriculum’s application, adaptability, and the impact it’s had on their educational settings.
I’m Freda, and I co-founded a non-profit organisation called Waloyo in South Africa.
Coming from a background of technology consulting, I know the value of computing education. I have a real drive to teach young kids coding so they can get ahead and find jobs in our digital economy.
Our role at Waloyo is to work with non-profit organisations that work with young people and want to expand their services to include computing skills training. Waloyo trains non-profit facilitators, who in turn teach computing skills to youth between the ages of 6 and 18. A unique challenge is that the majority of facilitators we train don’t have any previous computing experience. The resources we use need to be clear and easy to follow.
What I really love about The Computing Curriculum resources is the facilitator guides.
Our initial plan was to run the training programmes after school and outside the school curriculum, but we were getting requests from schools to support them too. South Africa doesn’t have a national computing curriculum, so there aren’t many subject specialist teachers. So we looked for curriculum resources from other countries to support our work and that’s how we found The Computing Curriculum.
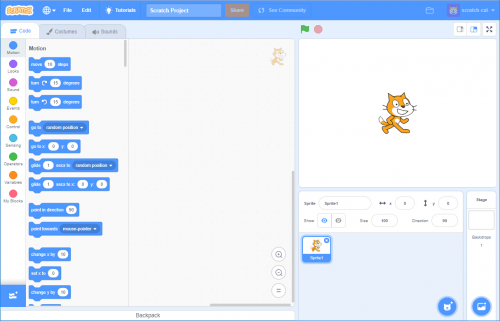
In rural Africa where we work, students have low levels of exposure to computers and computing. So whether they are 6 or 18 years old, we usually start with Scratch. The younger kids then continue with Scratch and the older kids move quickly on to Python as they build confidence.
What I really love about The Computing Curriculum resources is the facilitator guides. They fit in well with our process of training NGO facilitators to work directly with the kids. I love the comprehensiveness and flexibility of what your curriculum provides to enable this method of delivery.
So far we’ve launched 3 programmes in communities in South Africa, impacting around 150 young people, and it’s worked beautifully. It’s phenomenal to see how excited the kids get when the computer does what they want it to do!
I’m Al, and I’ve been a secondary science teacher since 1991.
For the past 13 years, I’ve taught in international schools. Two years ago, I decided to retrain in teaching computing. My wife and I are currently teaching in Kazakhstan. I now teach at primary level but still handle some secondary classes. For primary, there’s significant time pressure, especially with extra lessons for the local language, making it challenging to fit computing into the schedule.
The private schools where I work are starting to implement the UK computer science curriculum. At one of the schools, they have a robotics course which has given rise to a misconception that everything in computing is about robotics! My role, therefore, involves expanding the concept of robotics to include a broader range of computing activities and finding efficient ways to integrate these new materials into the curriculum with minimal effort from the staff. I focus on selecting appropriate units to fit into what the schools are already doing rather than implementing a comprehensive new program.
The Raspberry Pi Foundation’s curriculum resources are valuable because they provide comprehensive lists of programs and ideas that I can adapt for my colleagues. I adapt resources to make them more accessible for primary teachers, simplifying and customising them for ease of use.
The Raspberry Pi Foundation’s curriculum resources are valuable because they provide comprehensive lists of programs and ideas that I can adapt for my colleagues.
Once students understand that computing is a tool for developing skills rather than just passive consumption, they take ownership of their learning which boosts their confidence. Culturally relevant materials are particularly effective, especially in diverse international classrooms. Adapting resources to be culturally relevant and incorporating students’ examples enhances their usefulness and impact. The resources are excellent, but by tailoring them, they can be even more effective, particularly in an international context with diverse nationalities and learning concepts.
Head of ICT at an international school in Egypt
As Head of Department, I am responsible for what all the different age groups learn, from year 1 to year 12. We use the Cambridge International (CIE) curriculum, so I was looking for supplementary resources that build from the basics, have a clear progression map, and complement the resources we already had.
With The Computing Curriculum, it is easy to pick out individual lesson resources to use. I love that it doesn’t need a licence and that the students don’t face any problems when they download it to practise at home. I’m covering curriculums for both computing and digital literacy, so I use resources that are relevant to my curriculum maps.
With The Computing Curriculum, it is easy to pick out individual lesson resources to use.
In some schools, their idea of an ICT lesson is getting students to play games, use Word documents, make PowerPoint presentations, and that’s it. But this generation of students love coding and making their own games. So instead of playing the game, we teach them how to develop a game and how to add the characters themselves.
From year 1 to year 2, students take part in a wide range of computing activities and develop a lot of new skills. They find these skills amazing. It makes them feel engaged, excited, and that they are doing something valuable.
Using The Computing Curriculum
These educators’ stories show how easy it is to adapt our Computing Curriculum to your unique context, enhancing students’ technical skills and inspiring creativity, critical thinking, and a passion for problem-solving. We look forward to continuing this journey with these and other educators as they transform computing education for their learners.
Discover how our partners at ATS Group designed and implemented a custom Zabbix solution that allowed a large managed service provider (MSP) to monitor and manage a vast array of client devices across multiple data centers.
Table of Contents
The Challenge: Addressing Infrastructure Monitoring Complexities
When a federal government contractor specializing in IT managed services secured a contract to manage the infrastructure for a large federal agency, they faced a daunting challenge: how to effectively monitor and manage the vast array of devices under their purview using a single, comprehensive solution.
Real-time monitoring and immediate alerts for any issues were non-negotiable requirements. The sheer scale and complexity of the infrastructure demanded a robust monitoring system capable of providing insights across multiple data centers and diverse technologies.
The MSP, aware of the need for a trusted and experienced partner, turned to ATS Group to tackle the complexities of its observability and management challenge.
The Solution: Architecting a Custom Zabbix Solution
ATS Group, North America’s exclusive Zabbix Premium Partner, brings over two decades of experience in monitoring and optimizing enterprise IT environments. ATS Group architected and implemented a custom solution that leveraged Zabbix’s flexibility and scalability, demonstrating their deep knowledge of the technology and ability to handle complex challenges.
The ATS team deployed an on-premise Zabbix Server, accompanied by Zabbix Proxy Servers placed in each data center. This distributed architecture was a key factor in ensuring seamless monitoring across geographically dispersed environments while minimizing latency, a critical factor in managing such a vast infrastructure.
Custom Zabbix Solutions delivered by the ATS Group
From there, ATS implemented various Zabbix customizations that were integral to meeting the agency’s unique and diverse infrastructure needs, including developing templates and integrations.
Templates. ATS developed numerous templates covering a broad spectrum of technologies (including OpenShift, VMware, Dell, HP, Cisco UCS, Hitachi, NetApp, Pure, Brocade, Commvault, Linux, and Windows) to provide comprehensive monitoring capabilities tailored to the specifics of each component, ensuring a detailed view of the entire infrastructure stack.
Integrations. ATS built customized integrations for several third-party products. An integration with OpenShift allowed for alerts configured within OpenShift to be directly ingested and processed by Zabbix. The integration with VMware allowed Zabbix to detect when an administrator put a host in maintenance in VMware, automatically creating a maintenance period for that host within Zabbix to eliminate unwanted alerts while the host was being serviced.
Finally, integrations with ServiceNow and Operations Bridge Manager (OBM) enabled streamlined incident management workflows, ensuring that issues were promptly detected, triaged, and addressed with minimal manual intervention – and the proper stakeholders were notified within the customer and service provider organizations.
Trigger Actions. ATS implemented custom trigger actions to automate responses to predefined events. Whether restarting a service upon failure or executing remediation scripts, these trigger actions helped maintain system stability, minimize downtime, and reduce the workload (and callouts in the middle of the night!) for system administrators.
Dashboards. ATS designed custom dashboards to provide stakeholders with intuitive, real-time insights into the infrastructure’s health and performance. These dashboards served as a centralized hub, offering a comprehensive view of the entire environment with actionable insights to drive informed decision-making.
The Results
A custom Zabbix solution delivers visibility, streamlined monitoring, proactive management, and enhanced client satisfaction. The impact of the custom Zabbix solution was immediate and profound. By leveraging the power of Zabbix and the expert skill of the ATS team, the MSP gained unprecedented visibility and control over their client’s sprawling infrastructure. The benefits included:
Greater Operational Efficiency. With a unified view of the entire infrastructure and real-time alerts for any issues, our client experienced a significant improvement in operational efficiency. Proactive management and automated responses minimized downtime, allowing resources to be allocated more strategically.
Faster Incident Response. Issues were detected instantaneously, and relevant stakeholders were promptly alerted, enabling swift resolution and minimizing the impact on operations. This streamlined incident response mechanism reduced mean time to resolution (MTTR) and enhanced overall system reliability.
Increased Revenue. Delighted by the efficiency and effectiveness of our client’s management and monitoring capabilities, the end-user federal agency recognized the value of their partnership and expanded the scope of the contract.
This testament to our client’s success underscores the transformative impact of our solution, paving the way for further collaboration and growth opportunities. As a result, ATS Group and the managed services provider continue to expand their partnership and are solving complex infrastructure problems for numerous additional clients.
Here’s a
post on the Google Security Blog on how switching to a memory-safe
language can quickly reduce vulnerabilities in a project, even if a large
body of older code persists.
This leads to two important takeaways:
The problem is overwhelmingly with new code, necessitating a
fundamental change in how we develop code.
Code matures and gets safer with time, exponentially, making the
returns on investments like rewrites diminish over time as code gets
older.
For example, based on the average vulnerability lifetimes, 5-year-old code
has a 3.4x (using lifetimes from the study) to 7.4x (using lifetimes
observed in Android and Chromium) lower vulnerability density than new
code.
C8g instances are AWS Graviton4 based and are ideal for compute-intensive workloads such as high performance computing (HPC), batch processing, gaming, video encoding, scientific modeling, distributed analytics, CPU-based machine learning (ML) inference, and ad serving.
Also Graviton4 based, M8g instances provide the best price performance for general purpose workloads. M8g instances are ideal for applications such as application servers, microservices, gaming servers, mid-size data stores, and caching fleets.
Now looking at some of the improvements that we have made available in both these instances. C8g and M8g instances offer larger instance sizes with up to three times more vCPUs (up to 48xl), three times the memory (up to 384GB for C8g and up to 768GB for M8g), 75 percent more memory bandwidth, and two times more L2 cache over equivalent 7g instances. This helps you to process larger amounts of data, scale up your workloads, improve time to results, and lower your total cost of ownership (TCO). These instances also offer up to 50 Gbps network bandwidth and up to 40 Gbps Amazon Elastic Block Storage (Amazon EBS) bandwidth compared to up to 30 Gbps network bandwidth and up to 20 Gbps Amazon EBS bandwidth on Graviton3-based instances. Similar to R8g instances, C8g and M8g instances offer two bare metal sizes (metal-24xl and metal-48xl). You can right size your instances and deploy workloads that benefit from direct access to physical resources.
The specs for the C8g instances are as follows.
Instance size
vCPUs
Memory (GiB)
Network bandwidth (Gbps)
EBS bandwidth (Gbps)
c8g.medium
1
2
Up to 12.5
Up to 10
c8g.large
2
4
Up to 12.5
Up to 10
c8g.xlarge
4
8
Up to 12.5
Up to 10
c8g.2xlarge
8
16
Up to 15
Up to 10
c8g.4xlarge
16
32
Up to 15
Up to 10
c8g.8xlarge
32
64
15
10
c8g.12xlarge
48
96
22.5
15
c8g.16xlarge
64
128
30
20
c8g.24xlarge
96
192
40
30
c8g.48xlarge
192
384
50
40
c8g.metal-24xl
96
192
40
30
c8g.metal-48xl
192
384
50
40
The specs for the M8g instances are as follows.
Instance size
vCPUs
Memory (GiB)
Network bandwidth (Gbps)
EBS bandwidth (Gbps)
m8g.medium
1
4
Up to 12.5
Up to 10
m8g.large
2
8
Up to 12.5
Up to 10
m8g.xlarge
4
16
Up to 12.5
Up to 10
m8g.2xlarge
8
32
Up to 15
Up to 10
m8g.4xlarge
16
64
Up to 15
Up to 10
m8g.8xlarge
32
128
15
10
m8g.12xlarge
48
192
22.5
15
m8g.16xlarge
64
256
30
20
m8g.24xlarge
96
384
40
30
m8g.48xlarge
192
768
50
40
m8g.metal-24xl
96
384
40
30
m8g.metal-48xl
192
768
50
40
Good to know
AWS Graviton4 processors offer enhanced security with always-on memory encryption, dedicated caches for every vCPU, and support for pointer authentication.
These instances are built on the AWS Nitro System which is a rich collection of building blocks that offloads many of the traditional virtualization functions to dedicated hardware and software. It delivers high performance, high availability, and high security, thus reducing virtualization overhead.
The C8g and M8g instances are ideal for Linux-based workloads including containerized and microservices-based applications such as those running on Amazon Elastic Kubernetes Service (Amazon EKS) and Amazon Elastic Container Service (Amazon ECS), as well as applications written in popular programming languages such as C/C++, Rust, Go, Java, Python, .NET Core, Node.js, Ruby, and PHP.
Available now C8g and M8g instances are available today in the US East (N. Virginia), US East (Ohio), US West (Oregon), and Europe (Frankfurt) AWS Regions. As usual with Amazon EC2, you pay only for what you use. For more information, see Amazon EC2 Pricing. Check out the collection of AWS Graviton resources to help you start migrating your applications to Graviton instance types. You can also visit the AWS Graviton Fast Start program to begin your Graviton adoption journey.
To provide the best experiences, we use technologies like cookies to store and/or access device information. Consenting to these technologies will allow us to process data such as browsing behavior or unique IDs on this site. Not consenting or withdrawing consent, may adversely affect certain features and functions.
Functional
Always active
The technical storage or access is strictly necessary for the legitimate purpose of enabling the use of a specific service explicitly requested by the subscriber or user, or for the sole purpose of carrying out the transmission of a communication over an electronic communications network.
Preferences
The technical storage or access is necessary for the legitimate purpose of storing preferences that are not requested by the subscriber or user.
Statistics
The technical storage or access that is used exclusively for statistical purposes.The technical storage or access that is used exclusively for anonymous statistical purposes. Without a subpoena, voluntary compliance on the part of your Internet Service Provider, or additional records from a third party, information stored or retrieved for this purpose alone cannot usually be used to identify you.
Marketing
The technical storage or access is required to create user profiles to send advertising, or to track the user on a website or across several websites for similar marketing purposes.