Post Syndicated from Arturs Lontons original https://blog.zabbix.com/deploying-and-configuring-zabbix-5-4-in-a-multi-tenant-environment/15109/
In this post and the video, we will discuss deploying and configuring Zabbix 5.4 in a multi-tenant environment and how Zabbix is finally ready for real multi-tenant use cases thanks to multiple features.
Contents
I. Monitoring requirements of multi-tenant environments (0:30)
II. Supported monitoring approaches (2:32)
III. Zabbix and multi-tenant environment (5:56)
IV. To-do list (21:36)
V. Questions & Answers (23:32)
Monitoring requirements of multi-tenant environments
Before talking Zabbix, let us first analyze the core requirements behind multi-tenant environments. Such environments can be quite complex with a particular set of prerequisites that we have to be sure we can satisfy before continuing further.
- The core idea behind multi-tenancy is support for multiple customers. Therefore we need to support granular role/permission schema. The ability to define different roles for different customers and limit what they can access is key to success for such deployments.
- Multiple customers means a lot of data. No matter if we’re talking about a single Zabbix instance or scaling by deploying multiple Zabbix instances (say, for different regions) we need to have the ability to process large amounts of data.
- On top of that, we must be able to scale upwards, ideally – both horizontally and vertically. More customers, different requirements, varying amounts of data to process – all of this needs to be accounted for in advance.
- Redundancy is another key factor for us. As service providers, we absolutely cannot afford any downtime or data loss. While this may be acceptable in our own home labs or classrooms, this is not the case here. Unscheduled downtime could potentially result in a loss of a customer.
Supported monitoring approaches
Now that we have covered the architectural requirements, let’s focus on data collection. No matter the monitoring solution, the easiest approach in most cases would simply be to tell our customer to deploy an agent and be done with it. Unfortunately, this often doesn’t sit will with the end user and their security team. Let us also not forget that it is simply not possible to deploy an agent on some devices or environments – what then? Having a vast selection of monitoring methods is key for successful deployment of a multi-tenant monitoring service.
Let us take a look at this in the context of Zabbix.
Agent
- With Zabbix agents we can obtain data in two ways – in passive (polling) and active modes (trapping). This is extremely useful while working with multiple customers, since each of them will have different internal network security policies. I have personally seen cases where only one of these approaches is supported, while the other is restricted by the security policies.
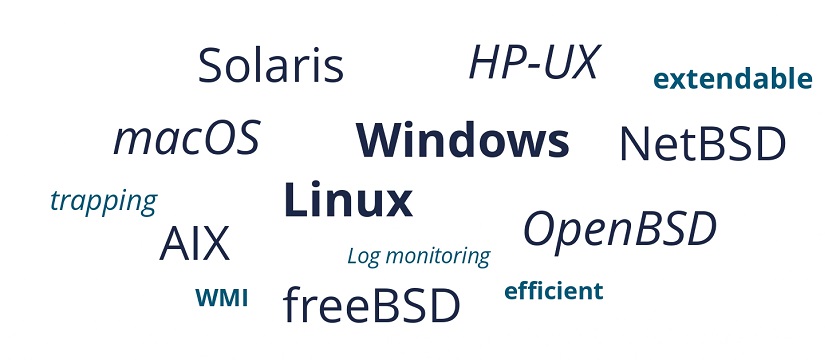
- Agents also support deployment on different platforms (Windows, Unix, etc.), as well as execution of external third-party scripts either by way of User parameters or system.run item key.
- Active agents are also capable of reading log files and event logs on Windows environments. This can be extremely useful, since many applications, even in-house ones, can provide a lot of monitoring data by logging it.
 Agent-supported deployment on various platforms
Since we need to stay flexible, there are many other monitoring approaches supported by Zabbix that we can utilize:
- SNMP, HTTP, IPMI and SSH agentless monitoring.
- Simple checks (ICMP pings, port statuses).
- Database and Java application monitoring.
- External scripts (executed by the Zabbix server, Zabbix proxy or Zabbix agent).
- Aggregations and calculations of existing data.
- VMware monitoring and integration.
- Web monitoring by creating web scenarios.
- Synthetic monitoring for simulating real life user transactions.
Latest improvements
Why are we putting emphasis on multi tenancy just now? The reason is a couple of great features added in the last few releases. These features can finally allow us to utilize Zabbix in a truly multitenant environment:
Added in Zabbix 5.2:
- Ability to create customizable user roles based on user types;
- Secrets can now be stored in an, highly secure external vault;
- Improvements in configuring frontend were also added. For example, each user can now select their time zone for frontend data display. This will be relevant for users in different geographical locations.
Added in Zabbix 5.4:
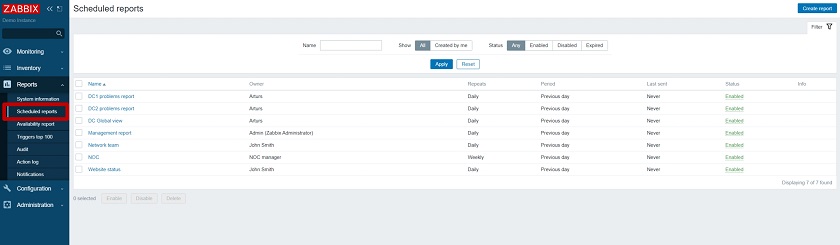
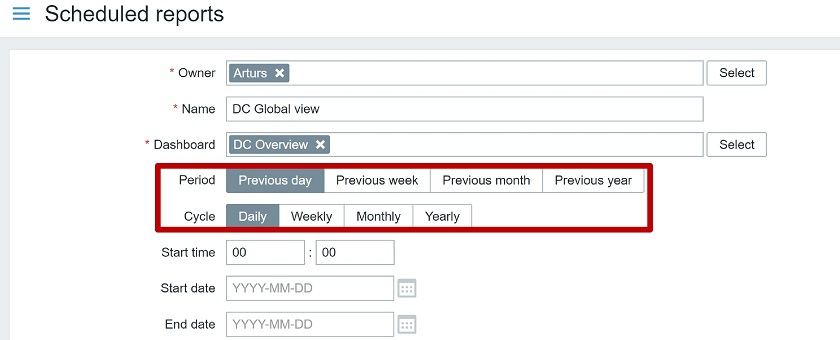
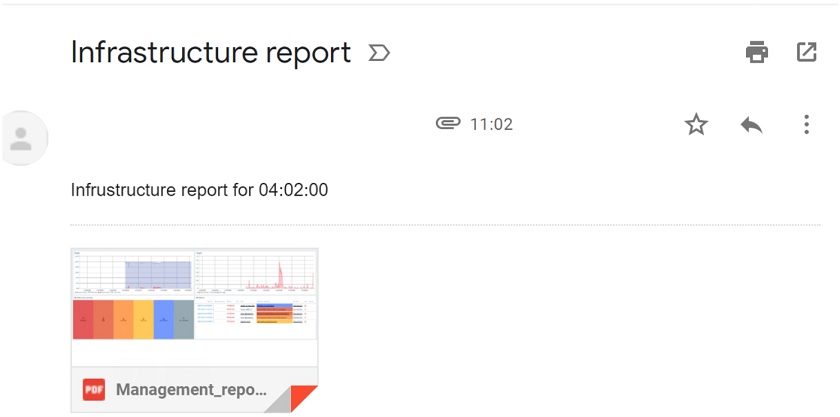
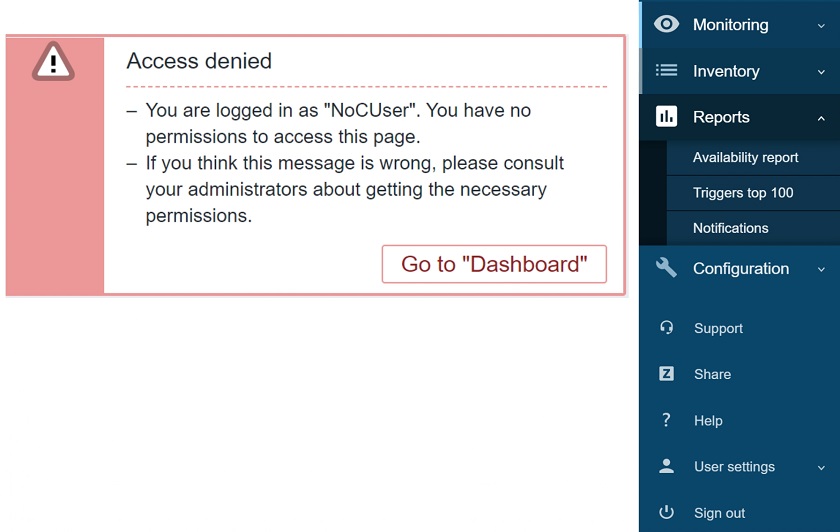
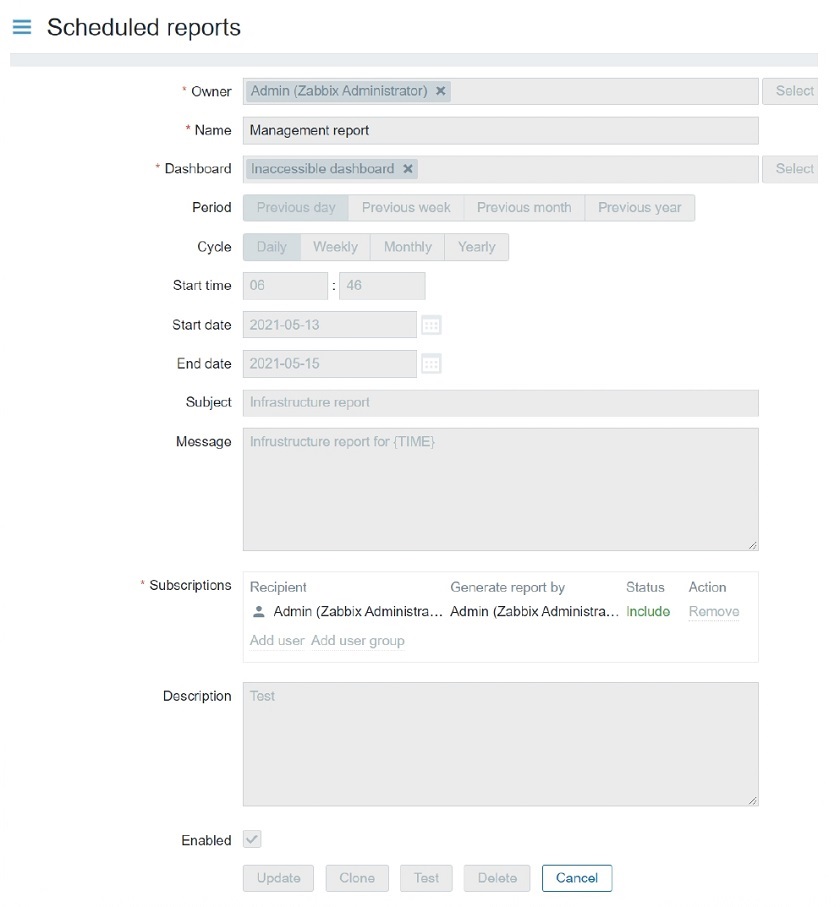
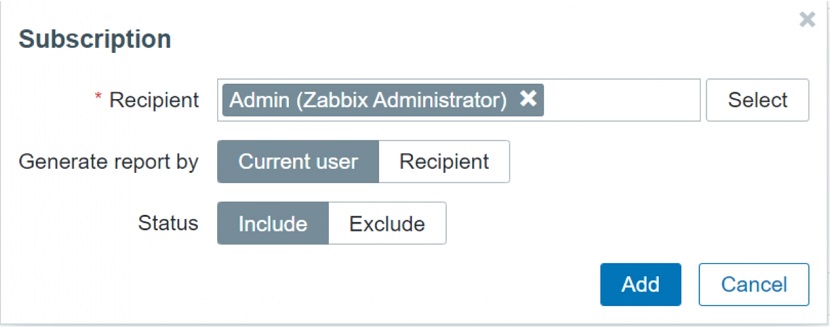
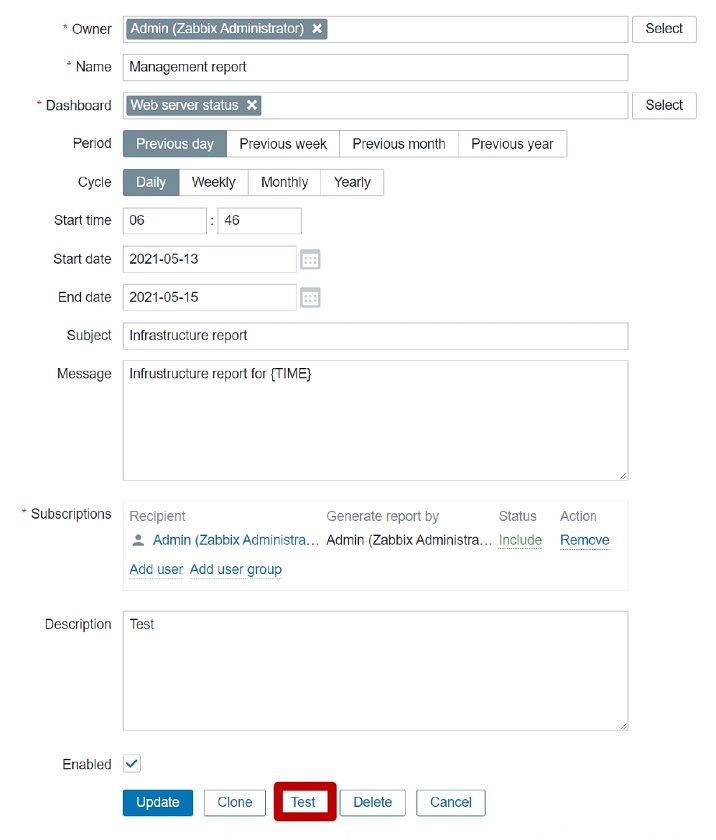
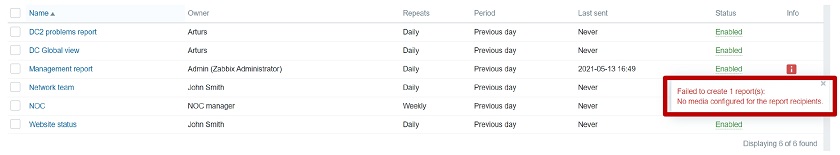
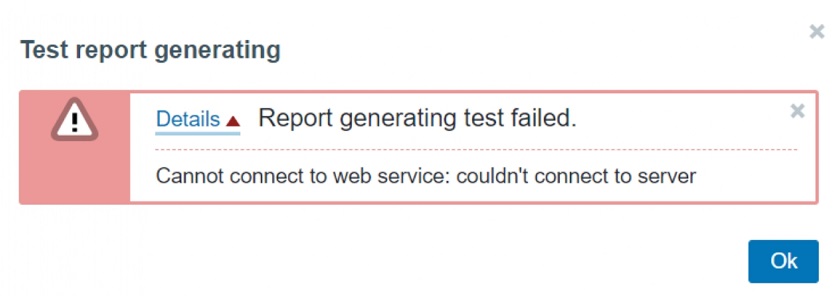
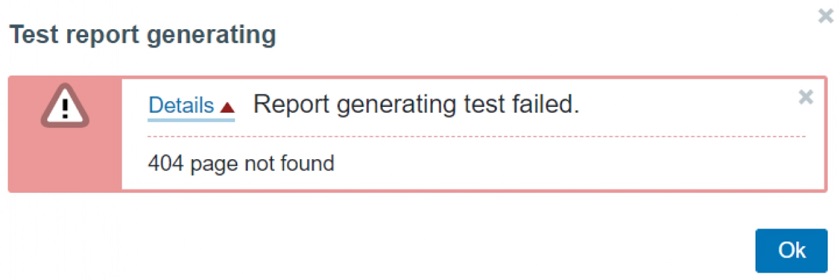
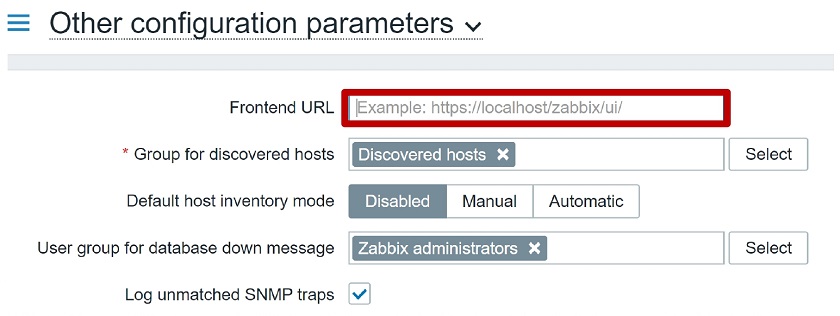
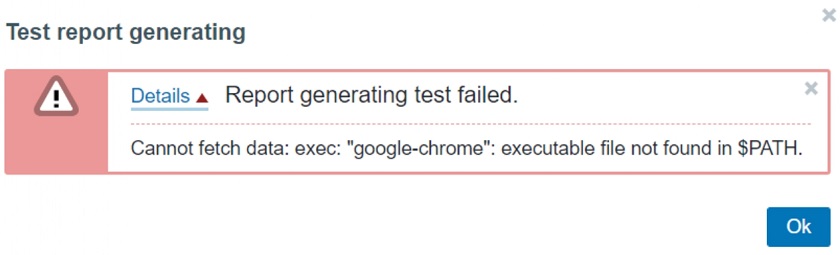
- Users now have the ability to send scheduled reports. This is extremely useful for customers who may wish to receive scheduled reports about their environments. Now, instead of utilizing third-party scripts to export data and generate reports, you can use the native Zabbix functionality.
- Major performance improvements have also been added, especially for really large instances with tens of thousands of new incoming values per second.
Zabbix and multi-tenant environment
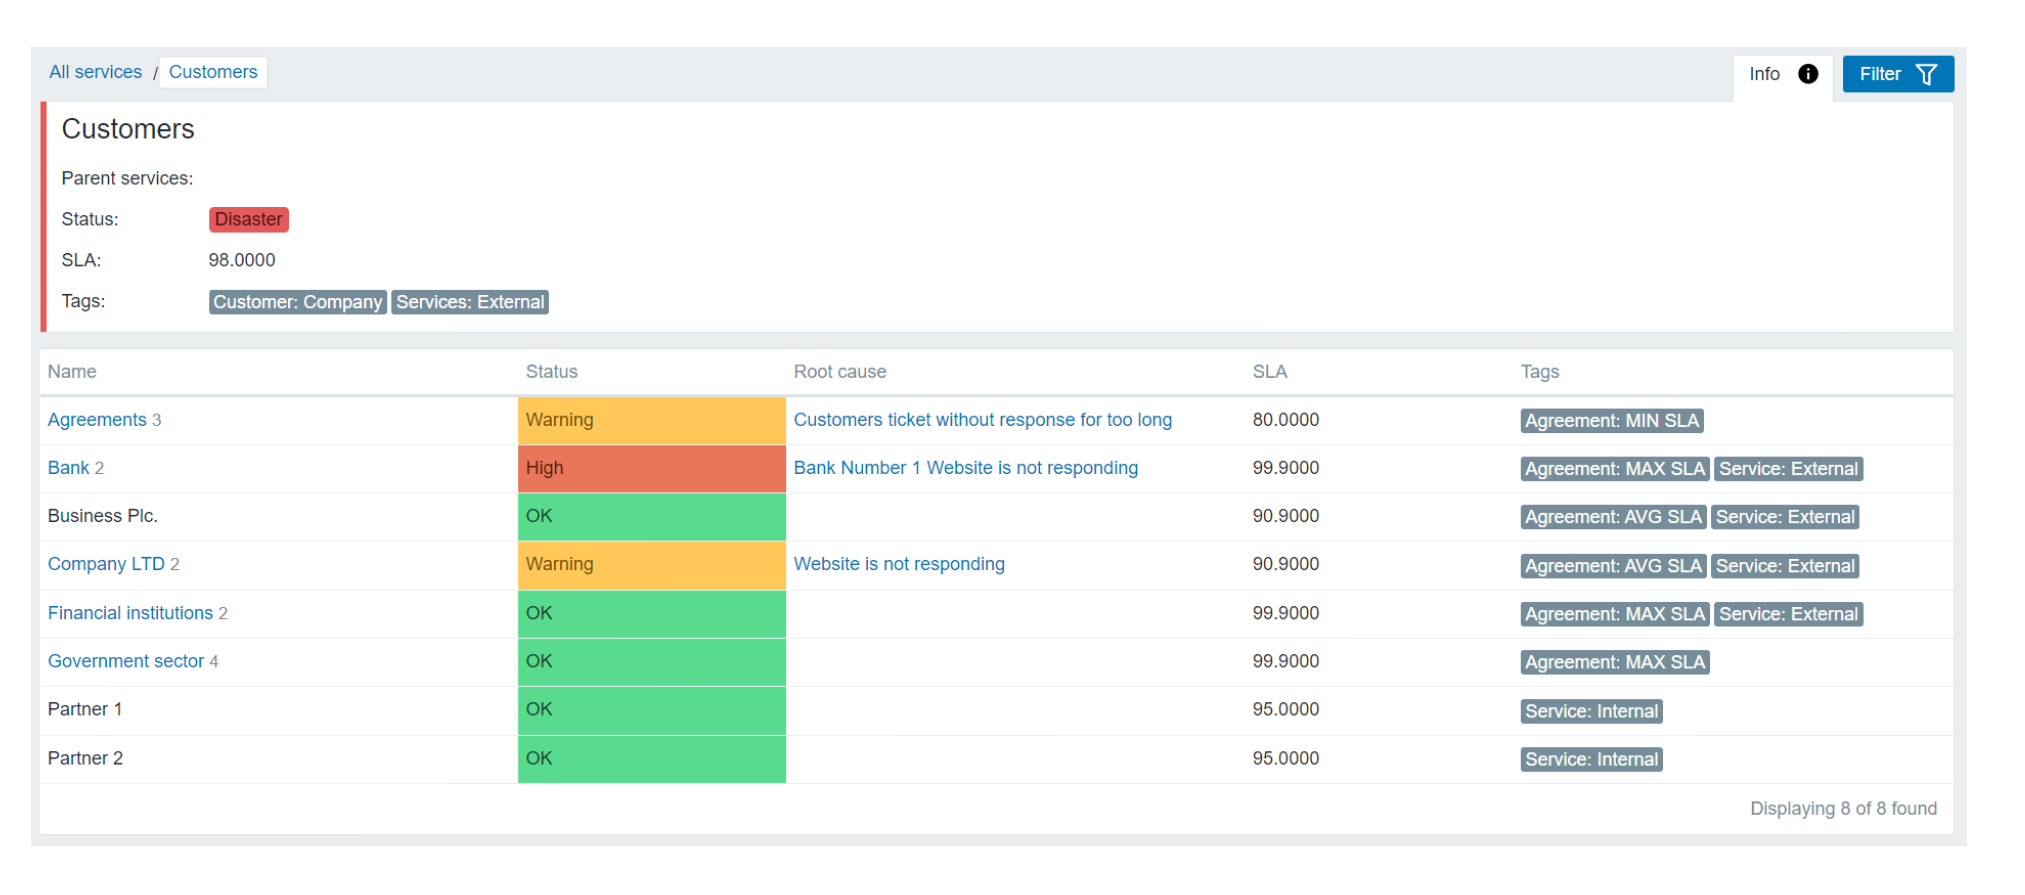
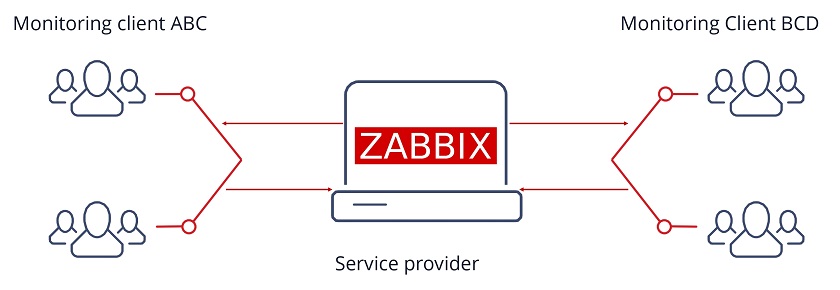
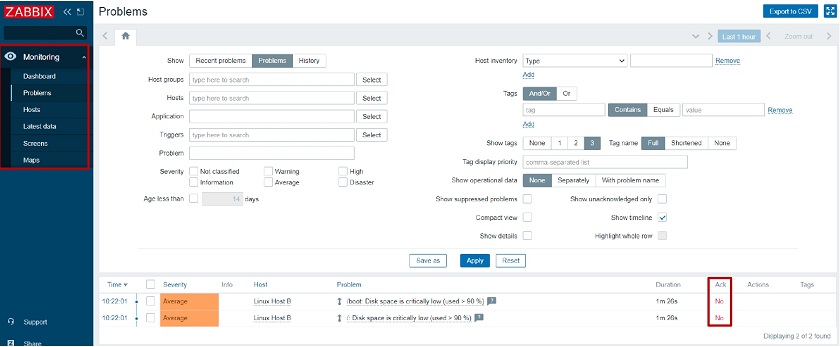
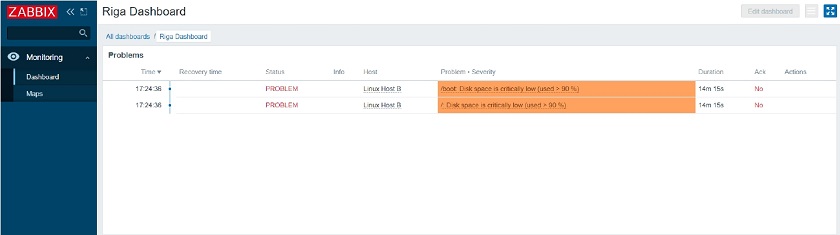
How do we use Zabbix in a multi-tenant environment? Essentially, we provide Zabbix as a service. We use the Zabbix monitoring tool to monitor our clients (ABC and BCD in the image). We monitor their network traffic, their operating system statistics, application statistics, log files, etc. For each tenant, these monitoring requirements are going to be different.
 Multi-tenant environment
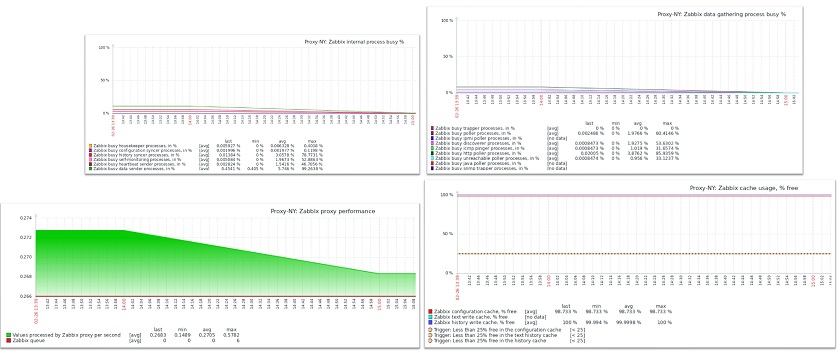
Zabbix proxy
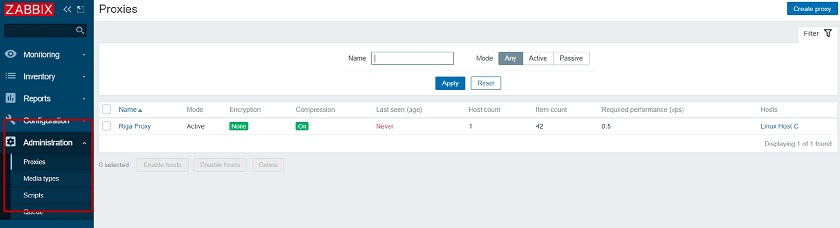
Multi-tenancy would not be possible without Zabbix proxies. With Zabbix proxies we can deploy them in customer offices, data centers, organization branches and collect data locally. Since proxies also perform preprocessing, we can even utilize them to transform and normalize metrics or even discard some of the collected metrics before forwarding them to the central Zabbix backend server.
- Proxies are capable of performing preprocessing ever since Zabbix version 5.0. This allows us to normalize and transform data, for example – change our textual data to numeric data, use throttling and other pre-processing approaches. Even custom JavaScript is supported nowadays to format or normalize the data before we send it to our central Zabbix backend server. So, instead of the server being responsible for all of the preprocessing and having quite a large preprocessing overhead, now the proxy can do it and then forward the data to the server.
- In addition, on the proxy, the data gets compressed before forwarding to the server thus saving some network traffic overhead.
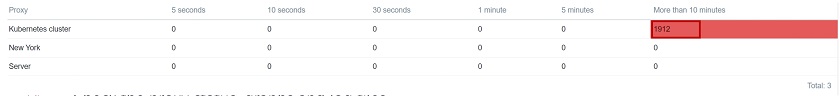
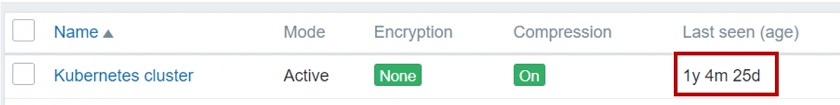
- The proxy still continues collecting data and storing it in its own database even in case of a network outage on the customer’s site.
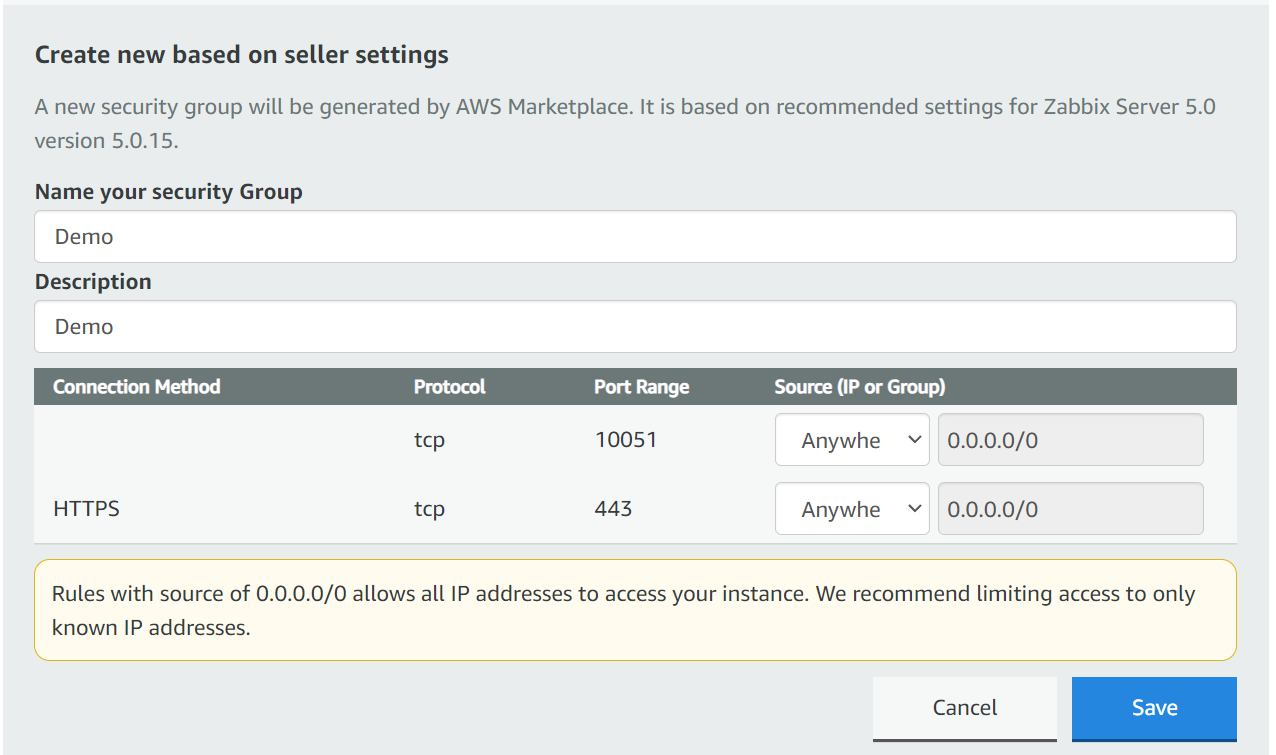
- Once we collect the data by the proxy, it gets sent to the server via a single connection, which is a lot more feasible from the network security perspective. In this case we need to create only a single firewall rule as opposed to a wide array of rules if we were to monitor the customer’s site directly from the central Zabbix backend server.
- We can execute remote scripts on the proxy.
- We can also deploy multiple proxies to improve scalability. If a single proxy cannot handle the amount of data that we are gathering or preprocessing, we can always deploy an extra proxy. They are easy to deploy, and can even use out-of-the-box SQLite databases.
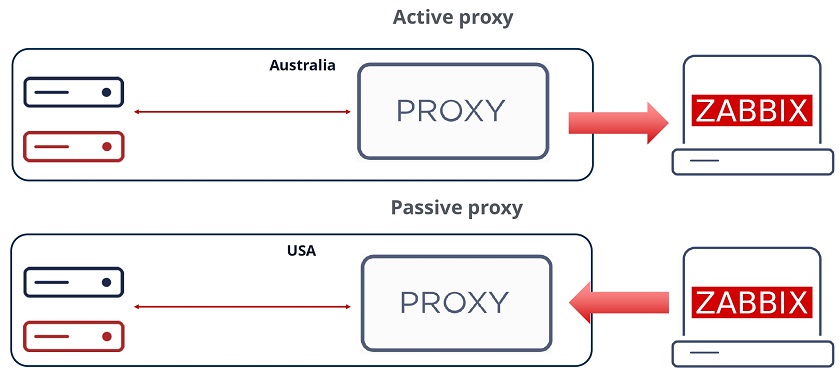
Passive and active proxies
With proxies can also select the direction of the connection. We can deploy passive proxies, which get polled by the Zabbix backend server. In that case, the Zabbix server pulls the data from the proxy. In this scenario the Zabbix server is the one responsible for establishing the connection to the proxy. This adds a minor performance overhead to the Zabbix backend server. On the other hand, we can also deploy active proxies, where we remove that overhead from the server and proxy sends the data autonomously to the server.
At the end of the day, similar to how it goes with agent requirements, the proxy mode will depend on the security policies of the customer. Don’t forget that we aren’t restricted to a single type of proxy – we can have both of these proxy types running at the same time.
 Selecting the connection direction
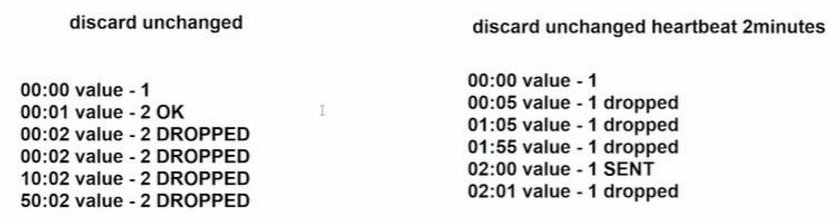
Data preprocessing — throttling
Preprocessing can help us not only normalize our data, but we can also utilize it to save up on storage and performance overhead, which is vital in large environments.
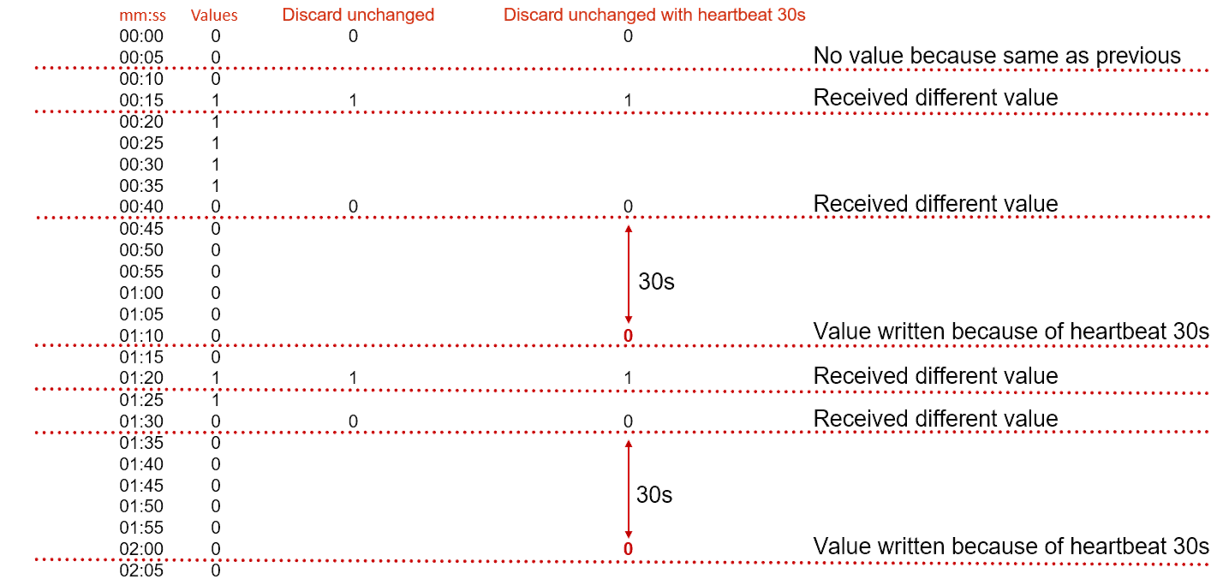
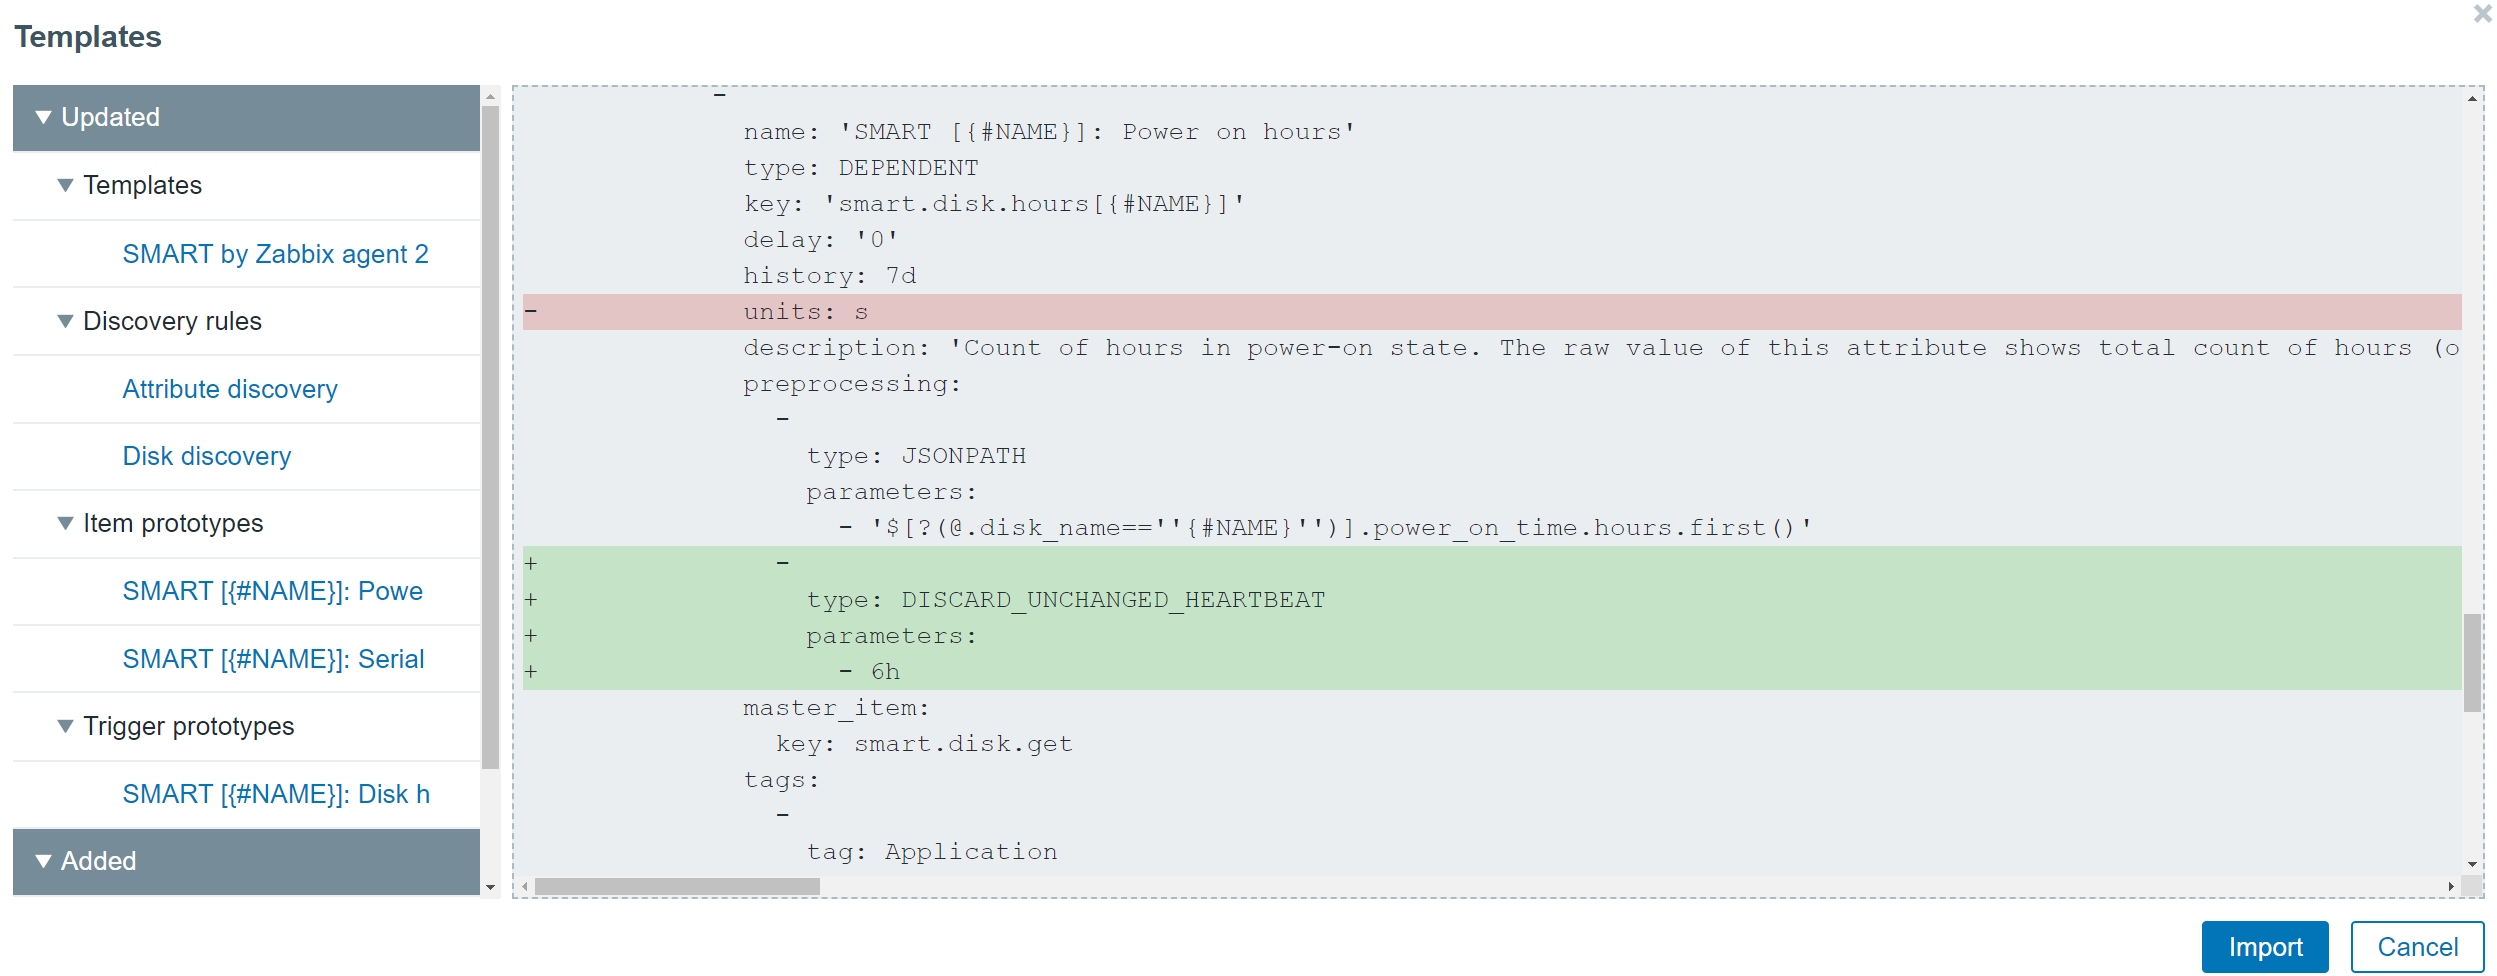
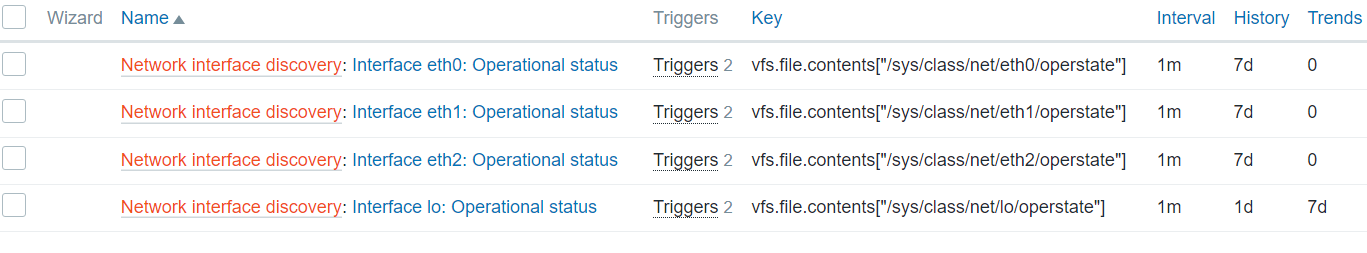
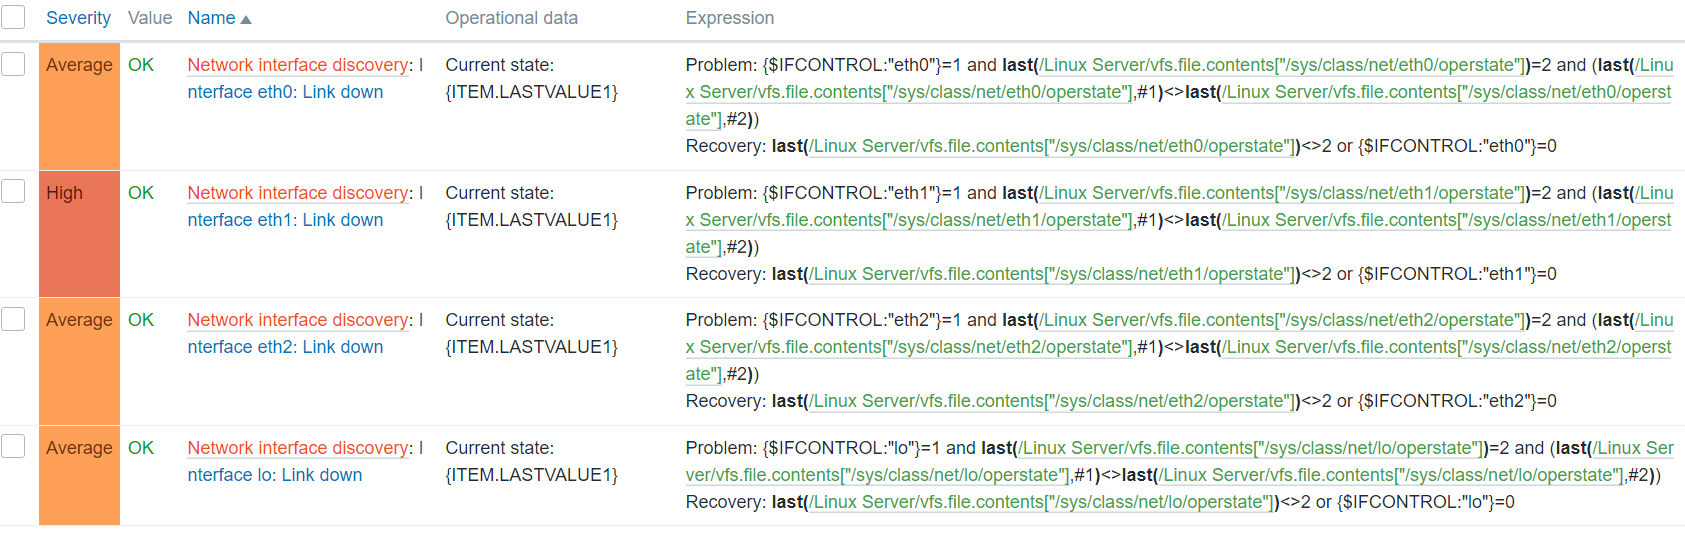
When monitoring a service or an application state, we are going to be obtaining discrete values such as 1, 2, or 3, or any number. These numbers have a tendency to repeat – if our server stays up, we are going to continue receiving a number which represents “Up”. By using the preprocessing method called throttling, we can decrease the amount of these numbers stored by discarding repeating values. Only status changes are stored, therefore we can potentially save some database space and remove unneeded data processing overhead.
 Discarding unchanged values
At this point in time, this feature sees more and more usage in many Zabbix environments, though it was severely underutilized initially when Zabbix 5.0 came out. So, if you aren’t using throttling yet and you’re running on 5.0 or newer, I definitely suggest trying to implement it to some extent. It is available in Preprocessing section of the item configuration.
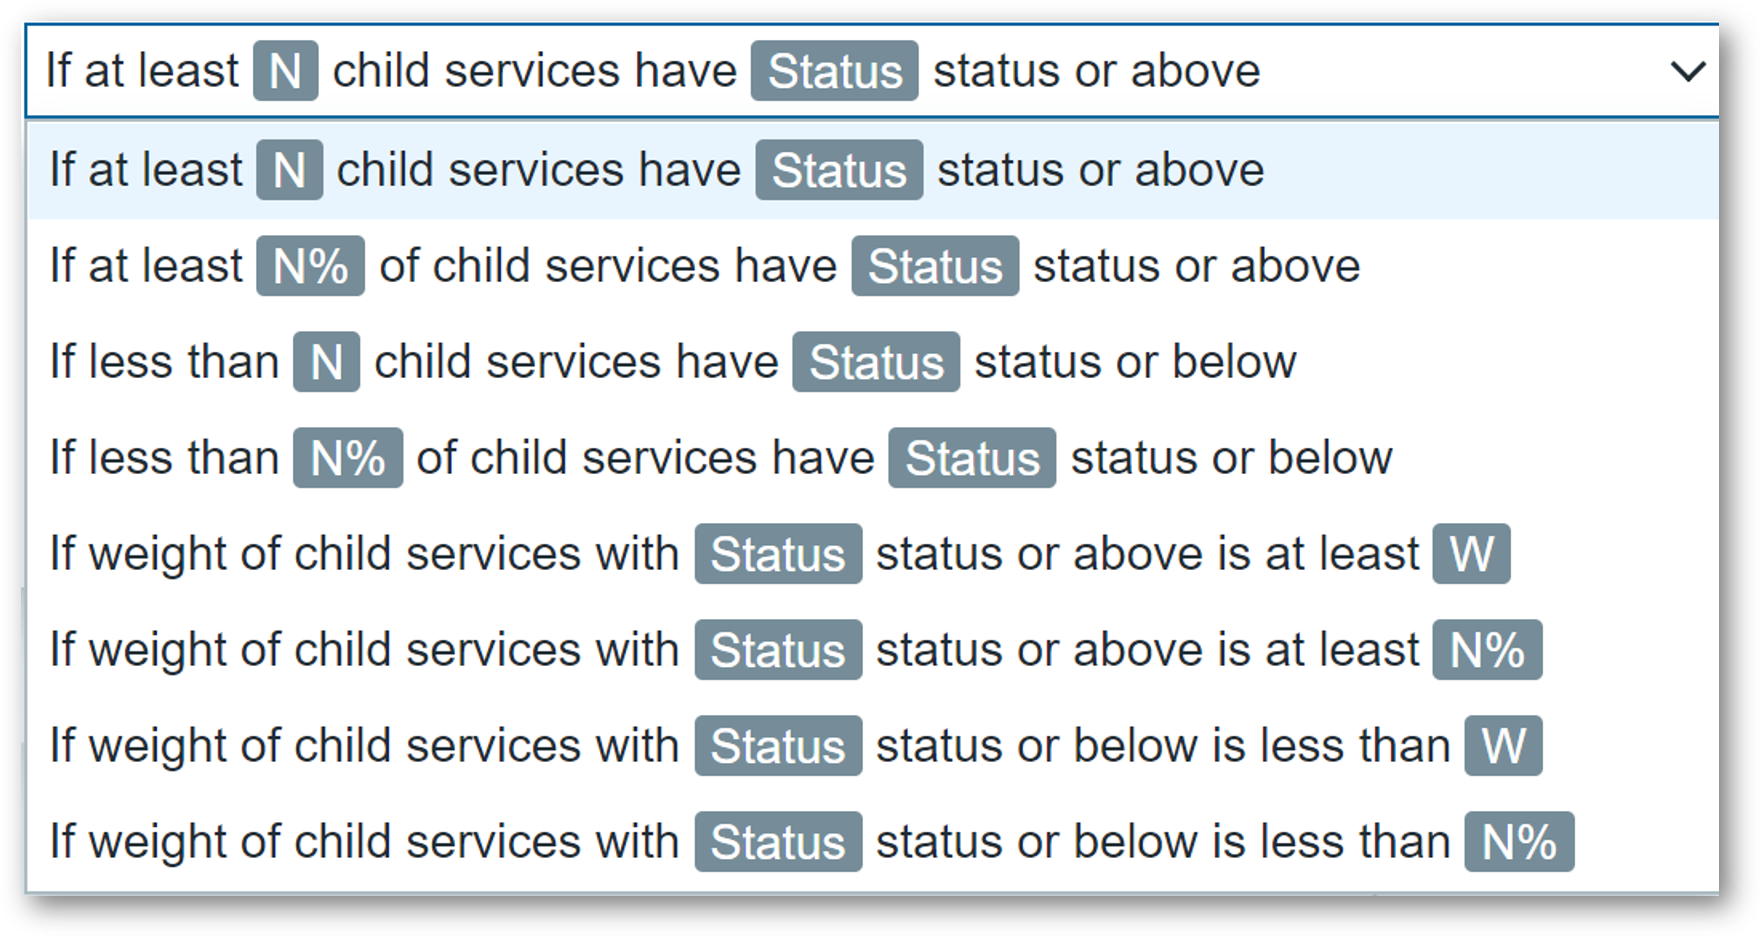
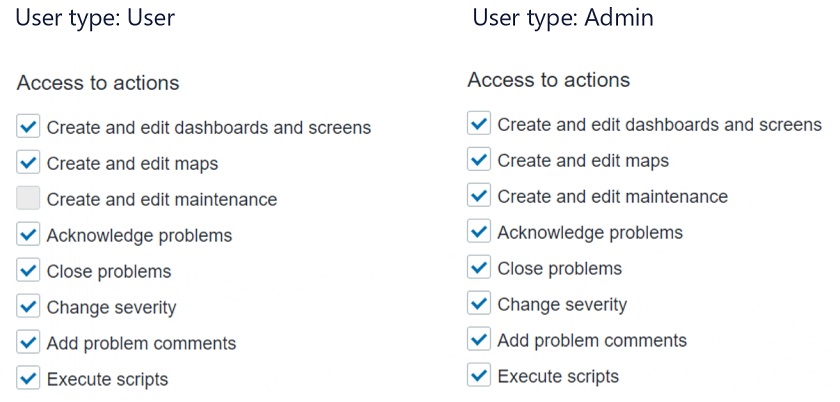
Permissions
Robust permission design is essential to a multi-tenant environment. Even though permission logic has seen an addition of roles, the user group to host group relations haven’t been abandoned and still play vital role in overall permission schema.
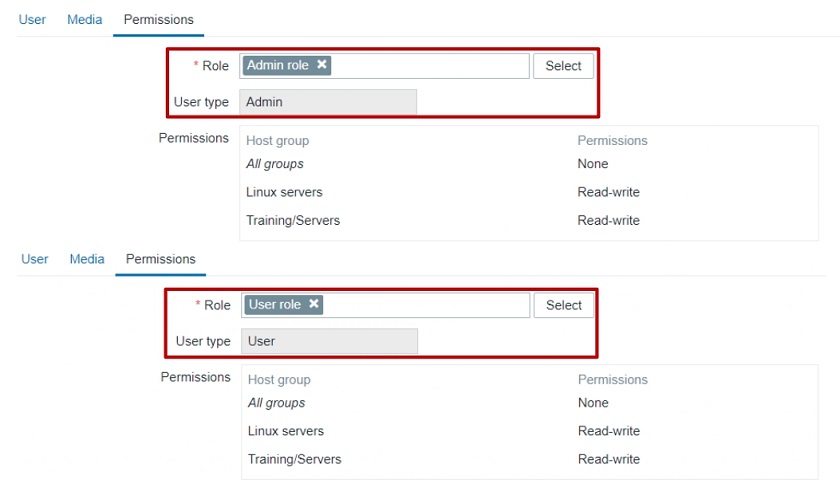
With roles we still have to utilize the three user types – Users, Admin, and Super admins.
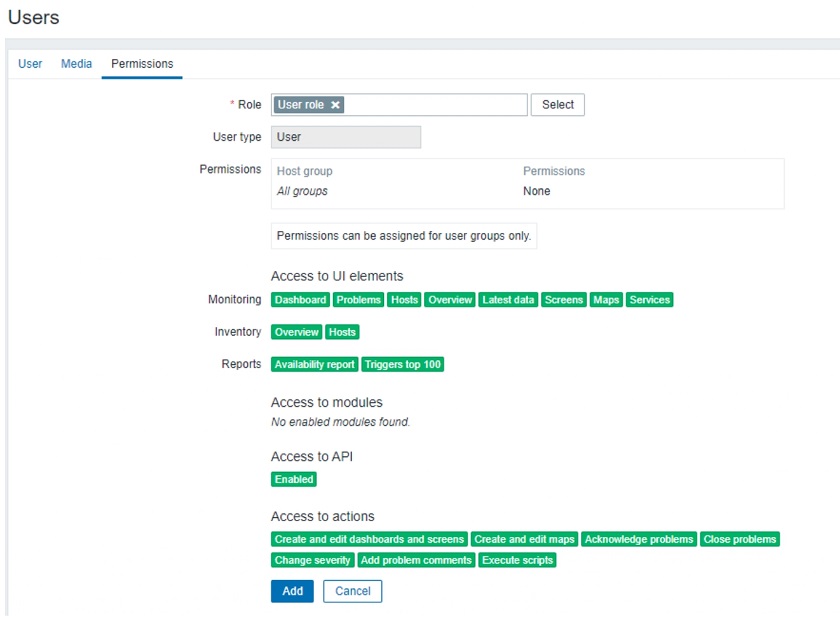
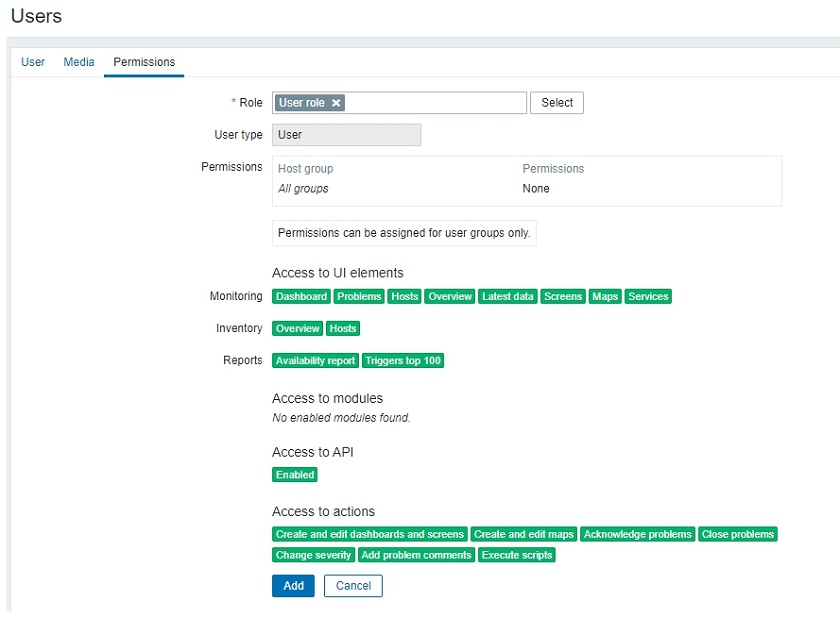
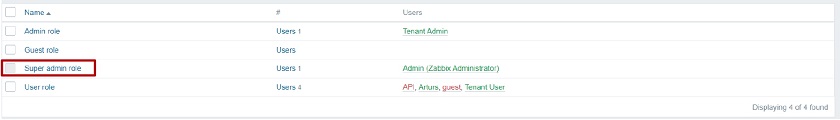
 User role overview
Here you can see the user role and the UI elements the user has access to together with API restrictions and the actions the user can perform.
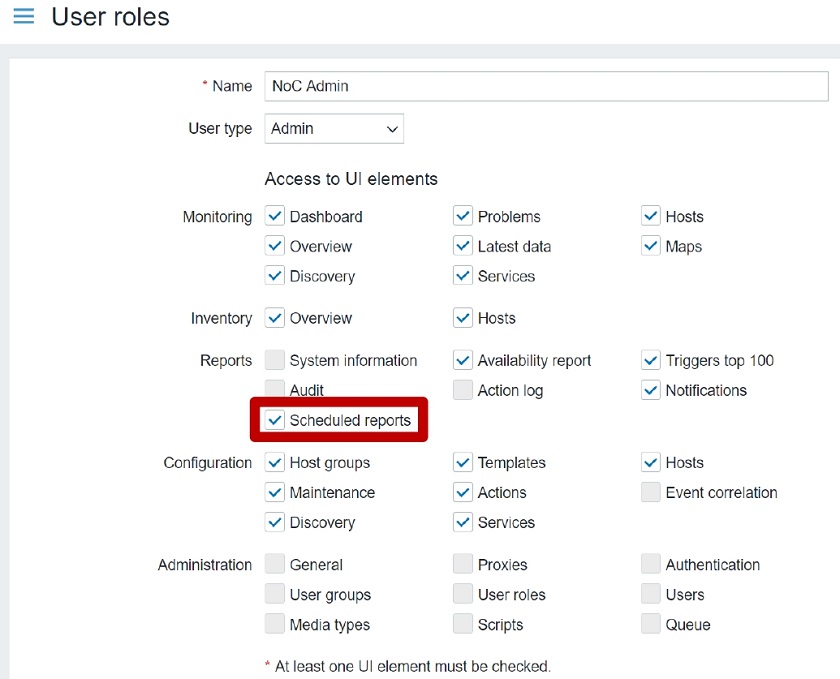
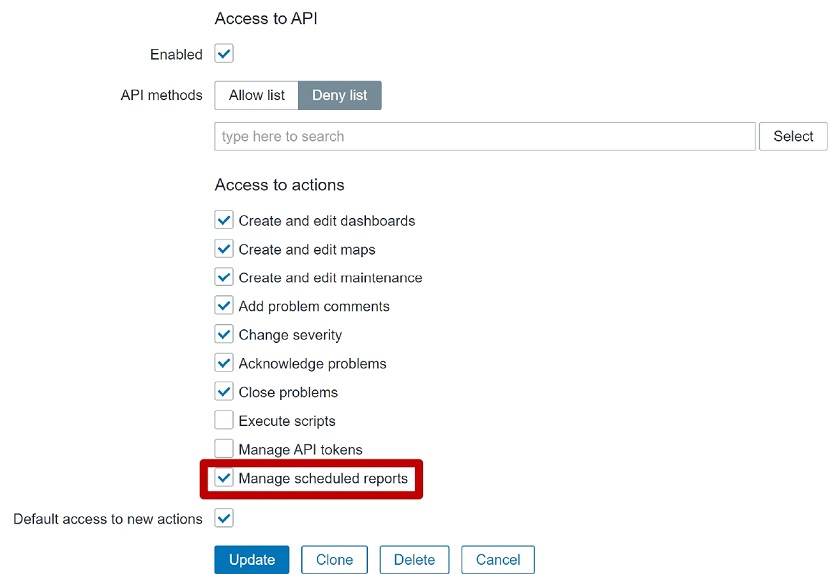
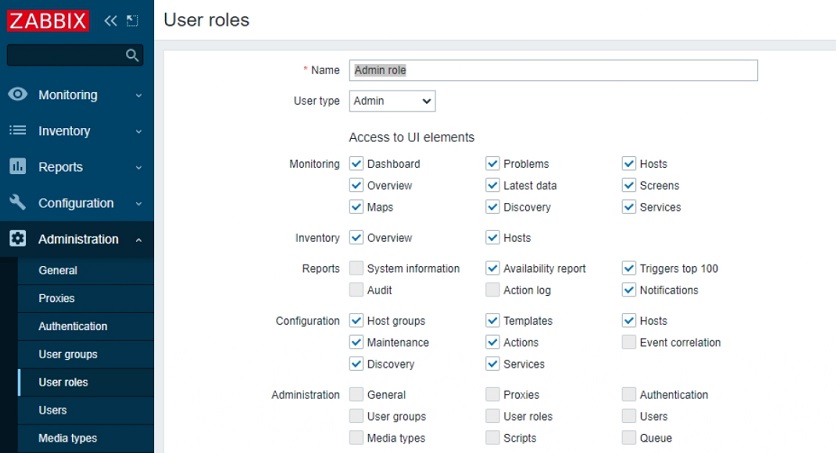
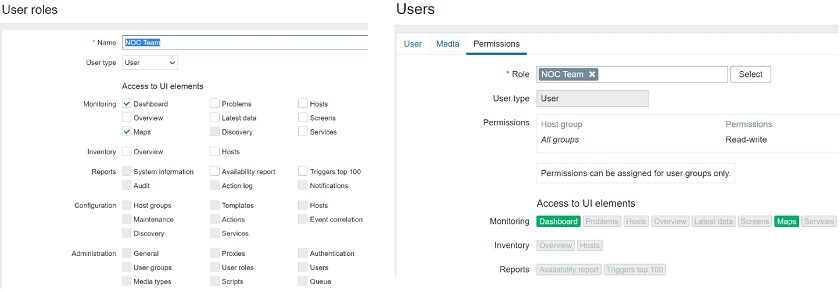
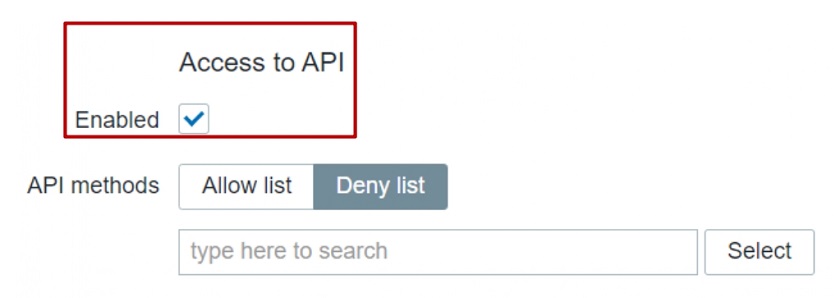
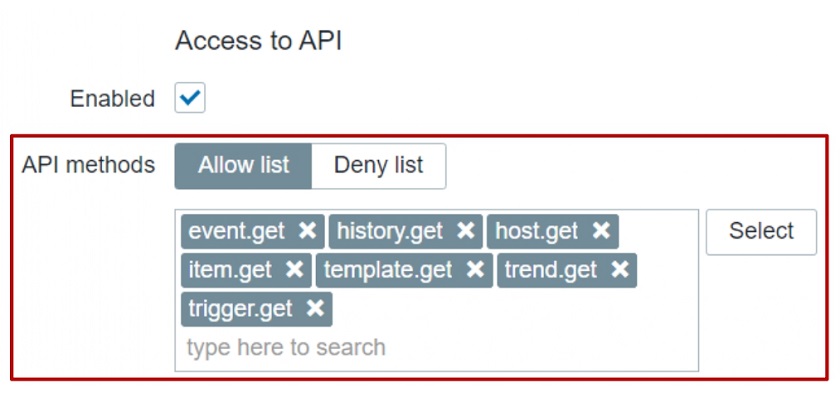
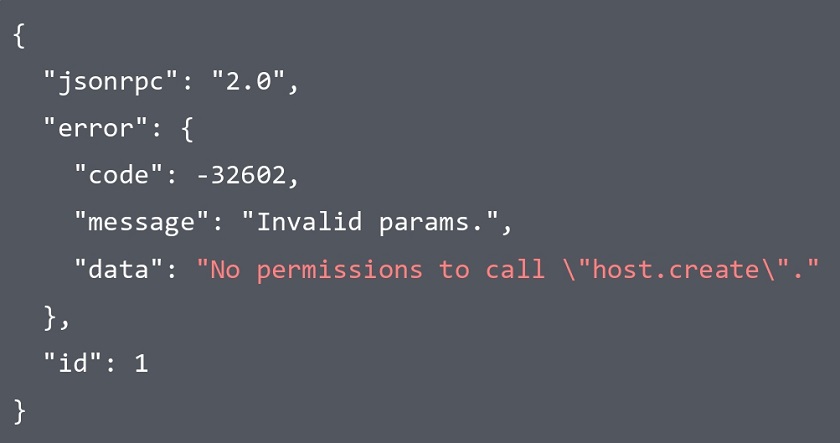
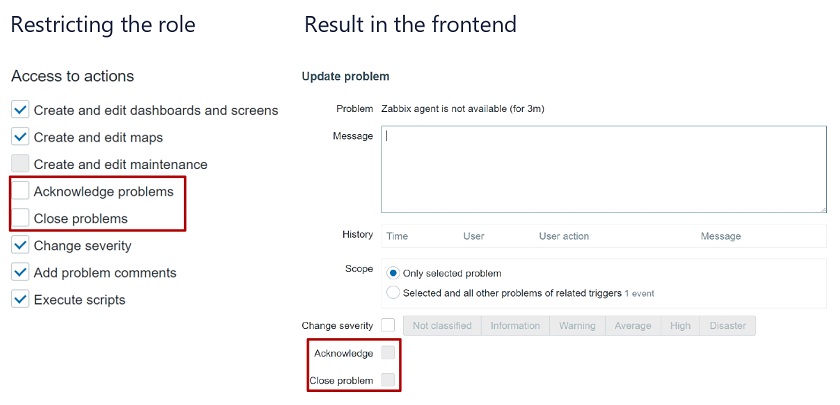
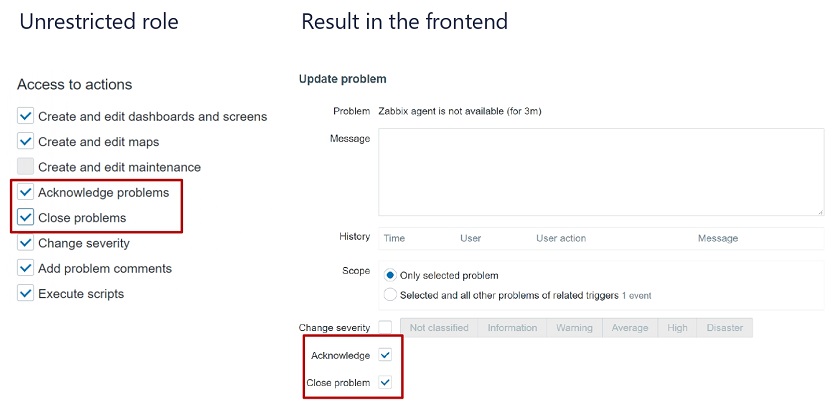
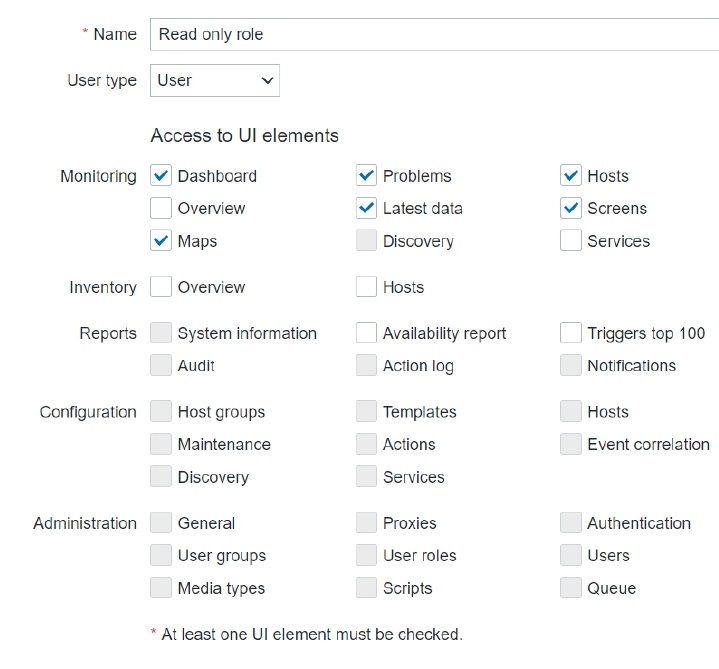
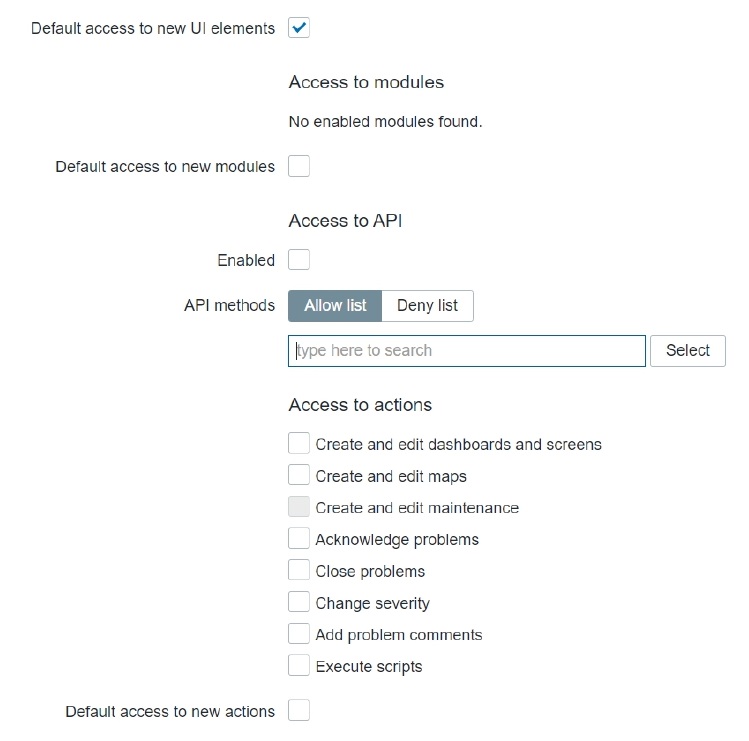
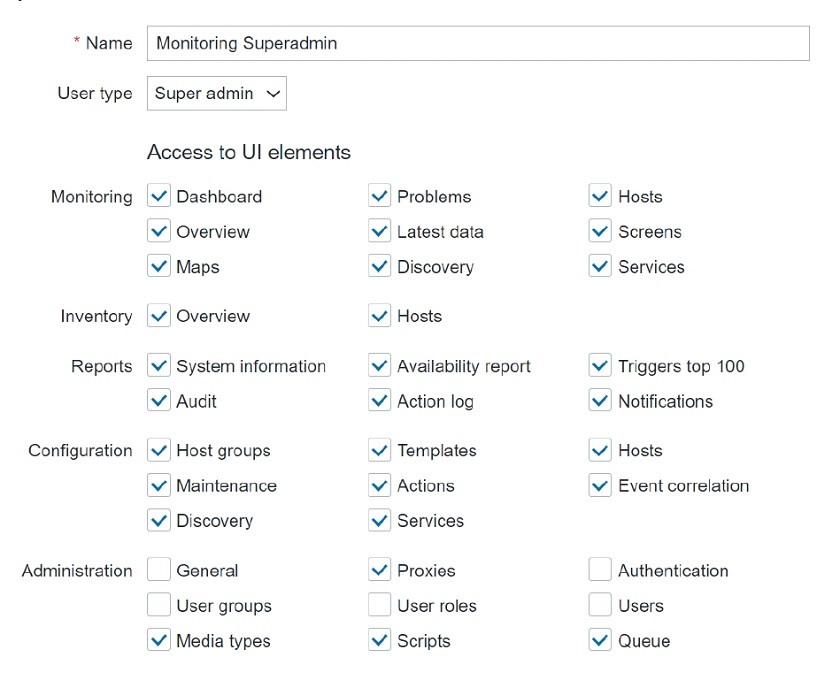
Roles grant the ability to configure access to specific UI elements, actions and restrict API calls in a granular fashion. So, when you’re configuring a role, you will see a screen similar to the one below:
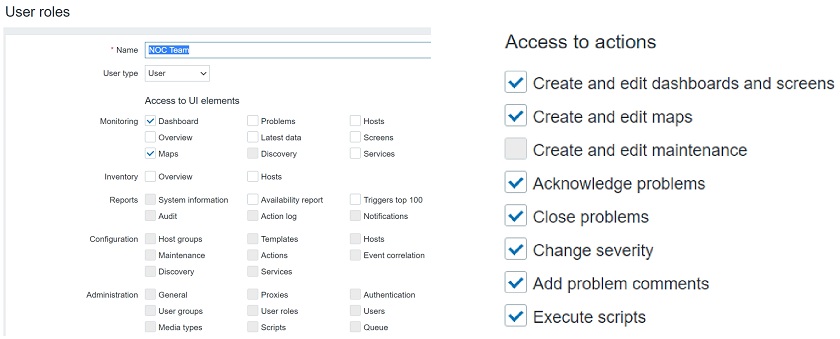
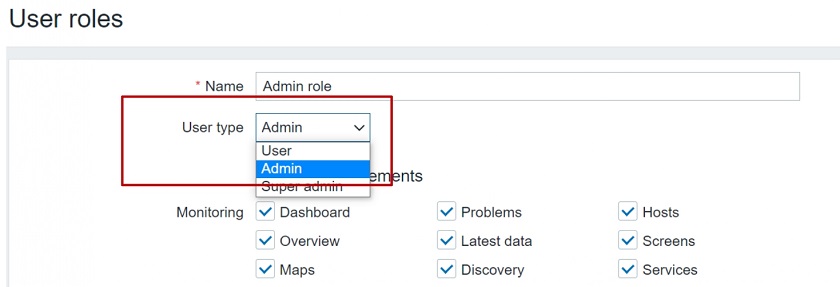
 Configuring user roles
User roles
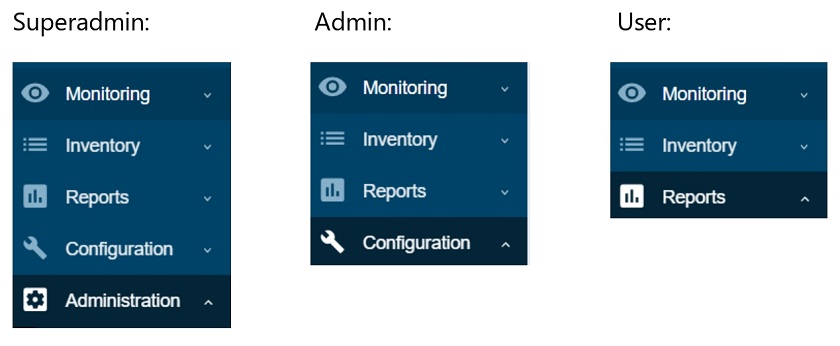
Here you can select User type. The user type restrictions still apply. Users can get access only to Monitoring and Inventory, Admins can get access to except the Administration section, and Super admins can get access to every section, including Administration.
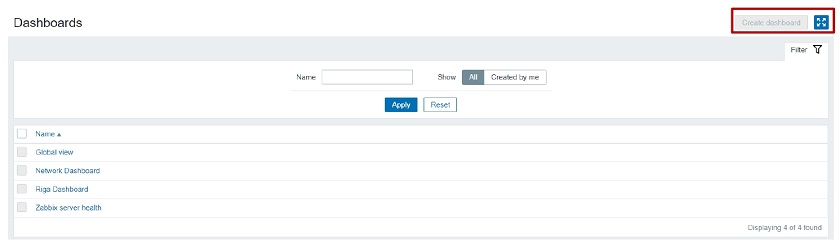
With roles we can further restrict these user types. You can have Super admins with some limitations, so that they could only do specific actions and access specific UI sections.
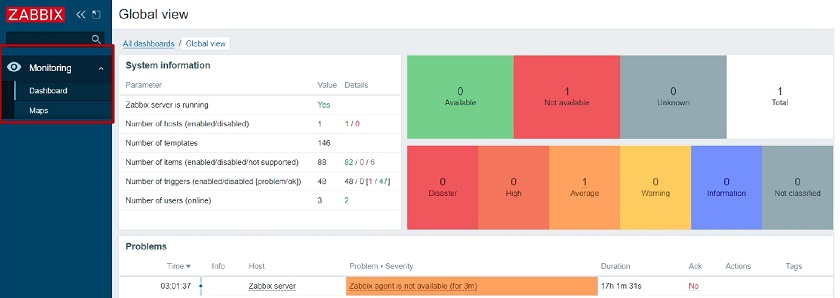
This option has two core benefits. The first one is security as we can limit what our customers can do and what they can access. The other benefit is in the UX, as we can simplify the UI for our users, especially people not experienced with Zabbix. We can restrict the visibility of the sections that the end users don’t have access to, so they will not be concerned with navigating through multiple sections and subsections that they are not familiar with.
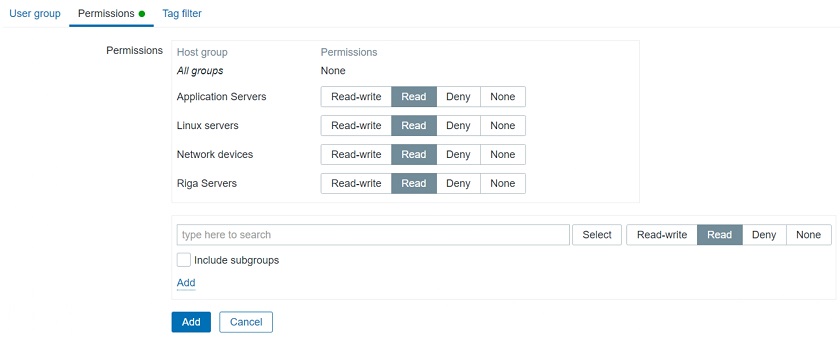
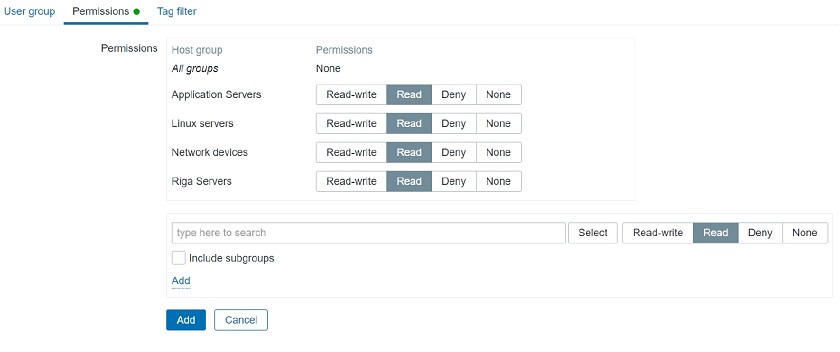
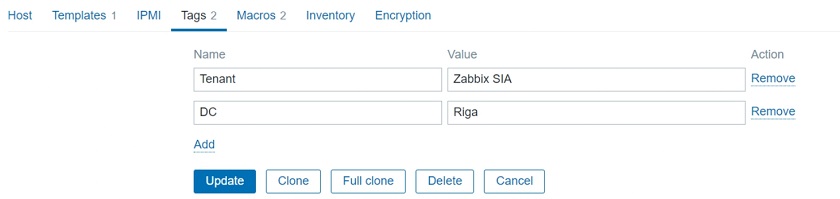
User groups
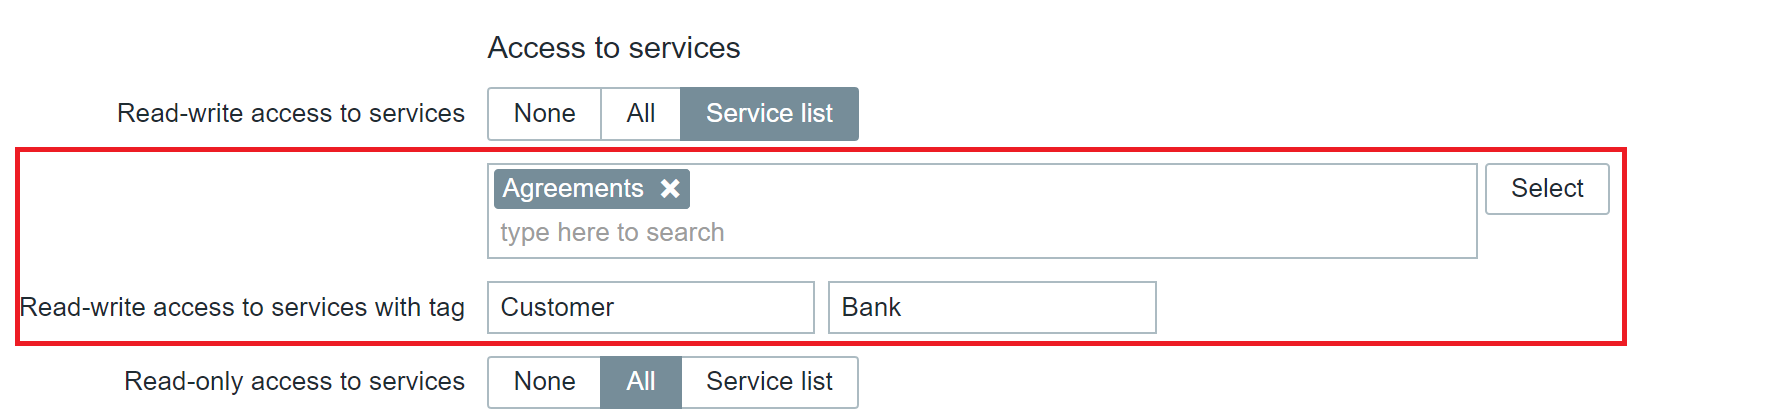
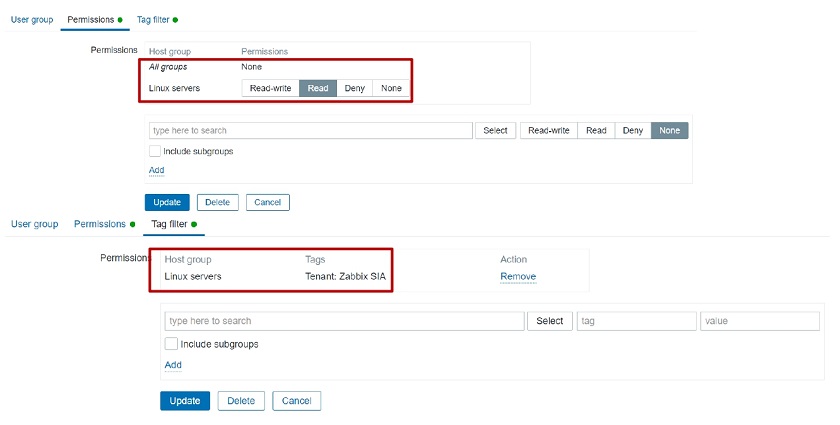
We still have user groups and user groups to host groups relations, which we have to take into consideration. Access to hosts is defined on User groups. So, we have to define our user groups and assign Full/Read only/Deny permissions on particular host groups. This is how we limit what specific customers can access.
 User groups
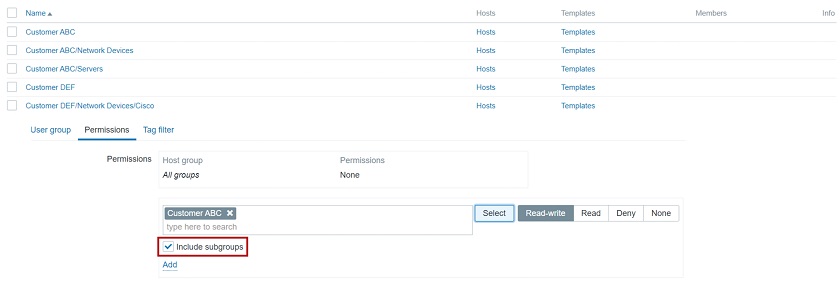
In addition, we can have host groups defined in a hierarchical manner. For instance, if you have two customers each of then having a “Network Devices” subgroup, we can select to include the root group and all of its subgroups when assigning user group to host group permissions. This is a really elegant and quick way to give a User or an Admin on the customer’s side access to all of their hosts or limit a specific organizational unit to only access what they need, e.g.: only permit access to network devices for network administrators.
 Using group hierarchy
High availability
The next important decision is the HA implementation. Going without some sort of HA solution is simply too risky and therefore is not an option with such environments.
- HA can be used to minimize downtime and add redundancy.
- Zabbix supporst Linux HA tools – PCS, Corosync, Pacemaker, which are used to enable HA. You are also welcome to try and use other third-party tools for HA.
- Out-of-the-box HA is planned for Zabbix 6.0.
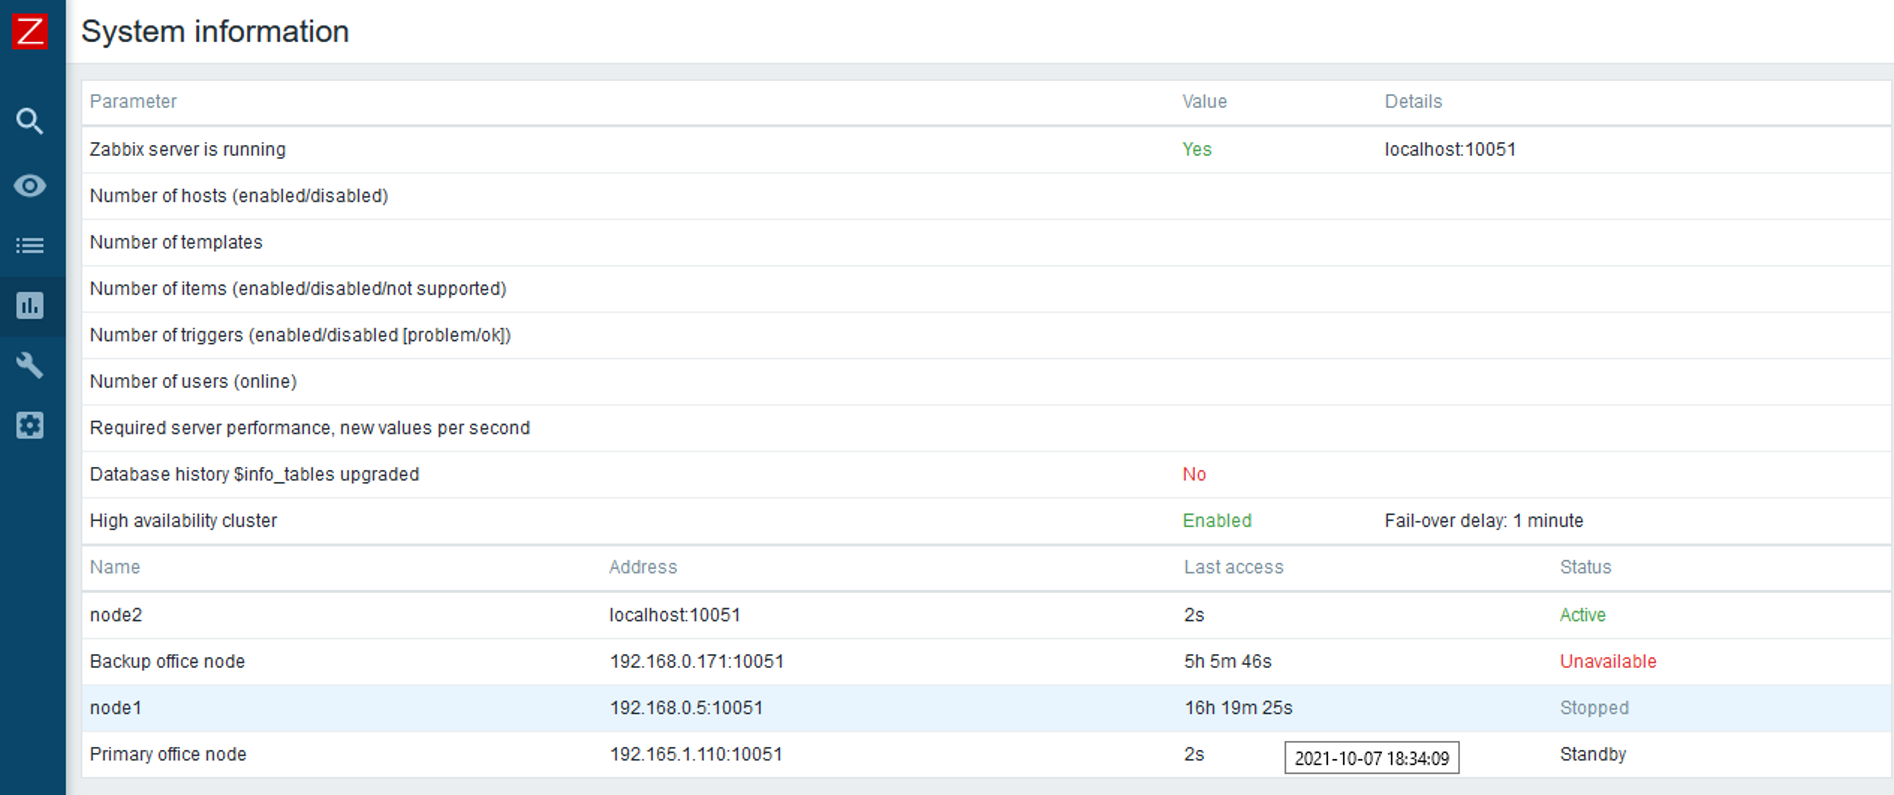
 HA setup
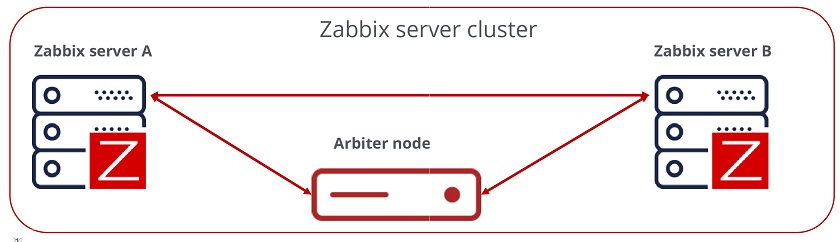
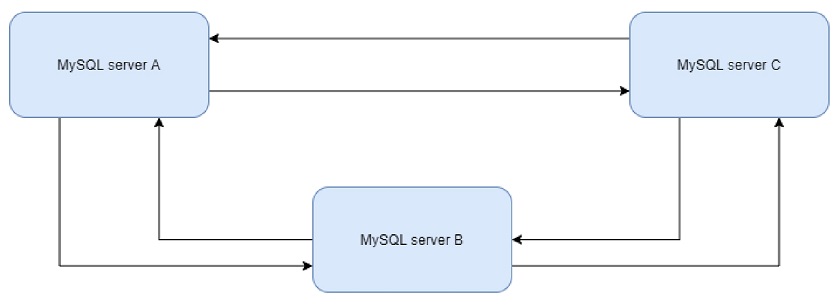
To achieve a quorum in our HA environment, we will require an odd number of nodes. For Zabbix backend HA it is very much recommended to have at least three nodes. Does that mean that you have to deploy 3 Zabbix servers? Not really – our third node is going to be a really small arbitration node, which is simply going to be checking connections to the two other Zabbix nodes and giving a vote to achieve quorum in case of issues with one of the nodes.
In the end we will have three nodes: Zabbix server A, Zabbix server B, and the Arbiter node
- An odd number of nodes is recommended to achieve quorum.
- Only Active/Passive cluster architecture is supported.
- We cannot have two Zabbix nodes active running at the same time and talking to the same database. It is important to use some ‘shoot the other node in the head’ mechanism — STONITH to avoid such split-brain scenarios.
Failure to abide by these requirements can result in issues with database consistency, issues with underlying queries and cleaning up or inserting data. This can cause unexpected Zabbix backend server crashes down the line.
In addition, it is very common to have a requirement for proxies to be deployed with HA. Before implementing HA for proxies, we need to decide if we really do need it. HA adds a significant configuration management overhead. We can have hundreds if not thousands of proxies, and managing HA for each of those can add a significant overhead. Of course, the more comfortable you feel with the HA tools, the easier the deployment and the management of the environment.
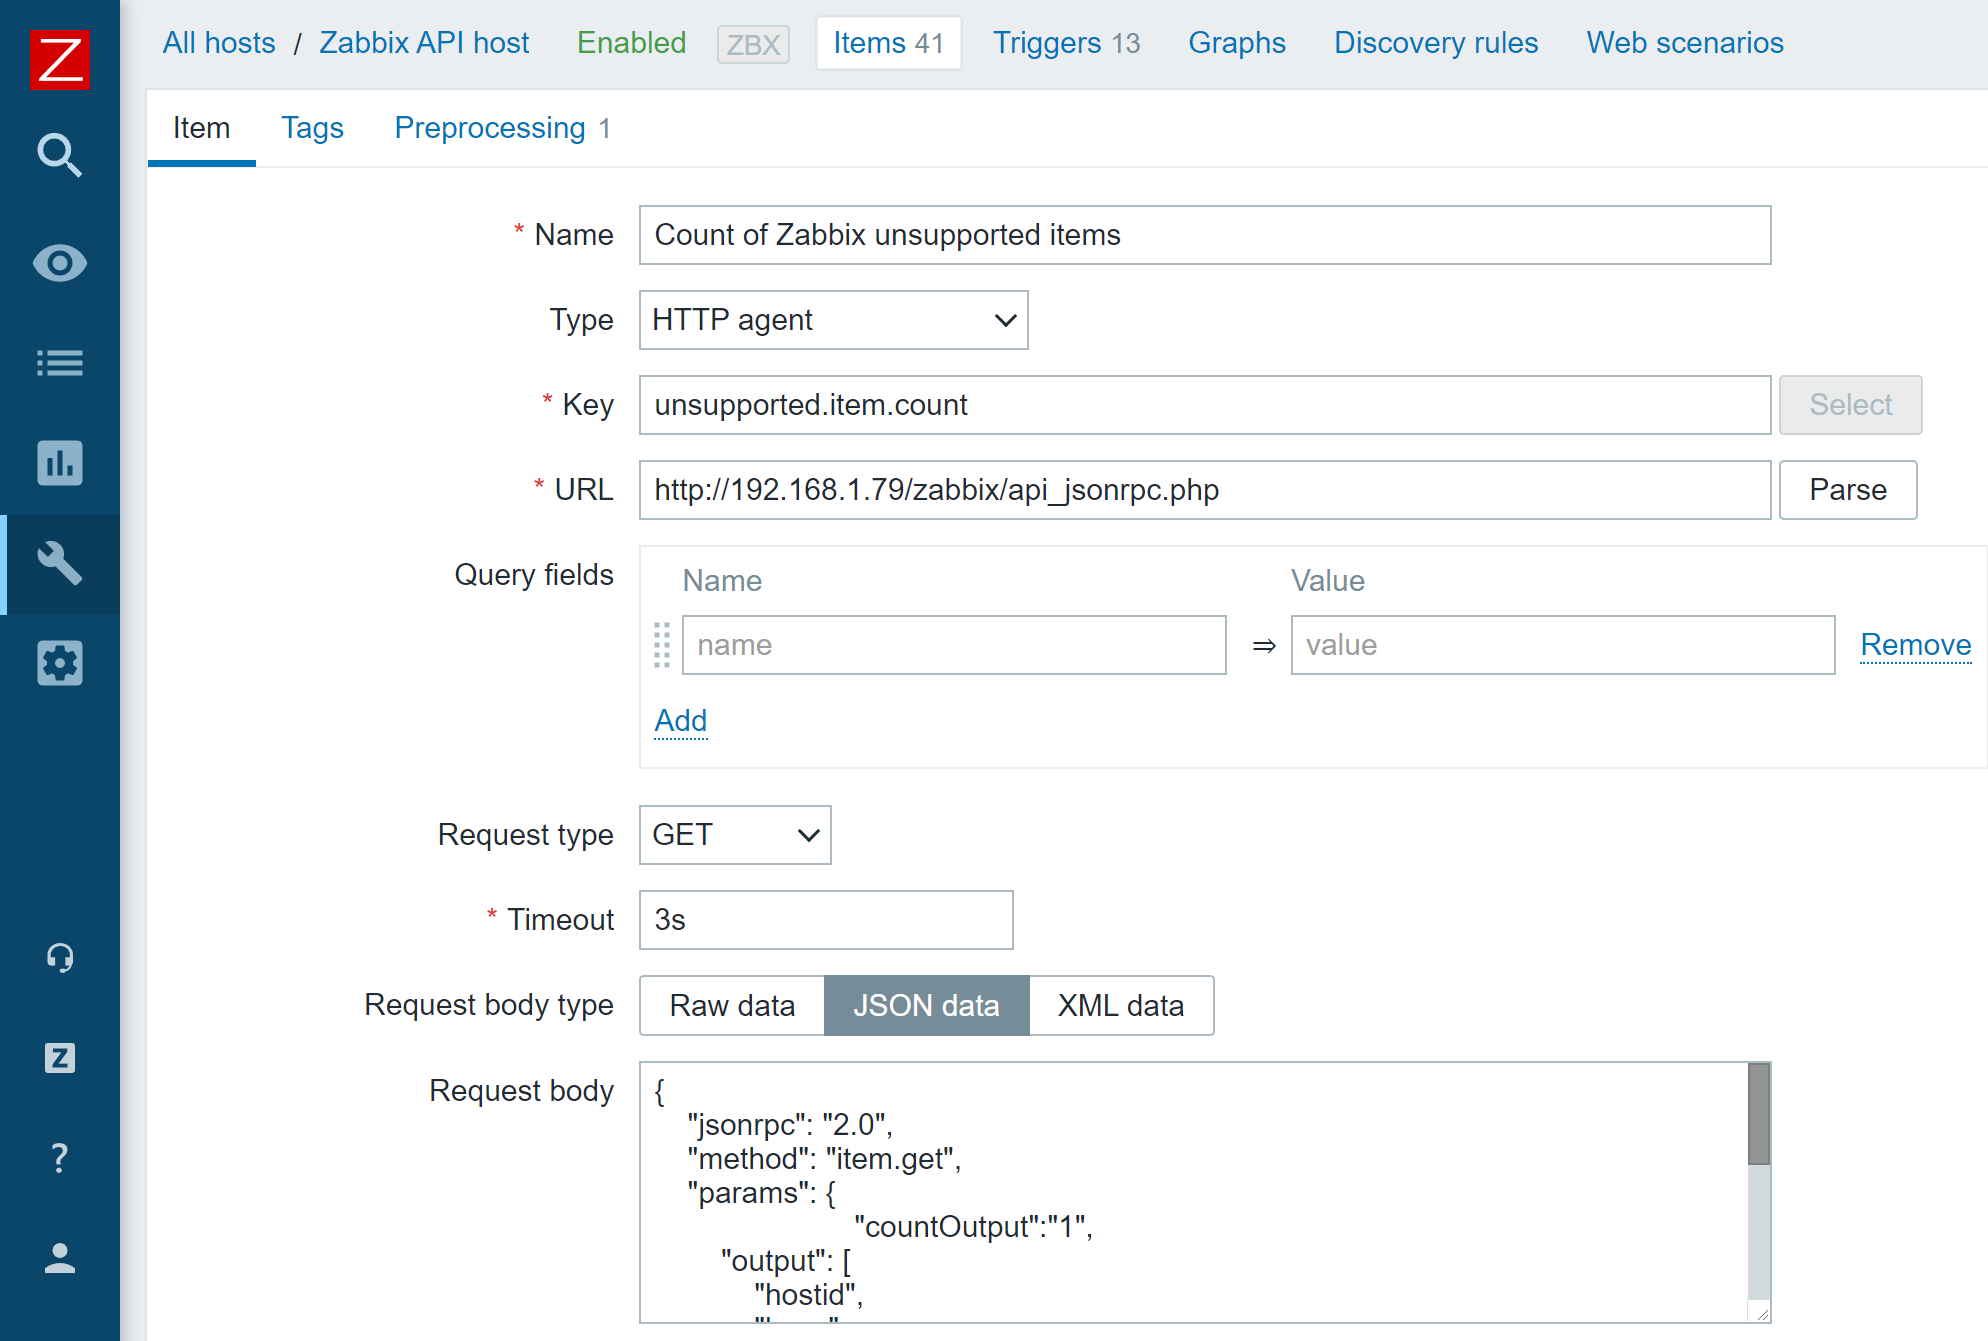
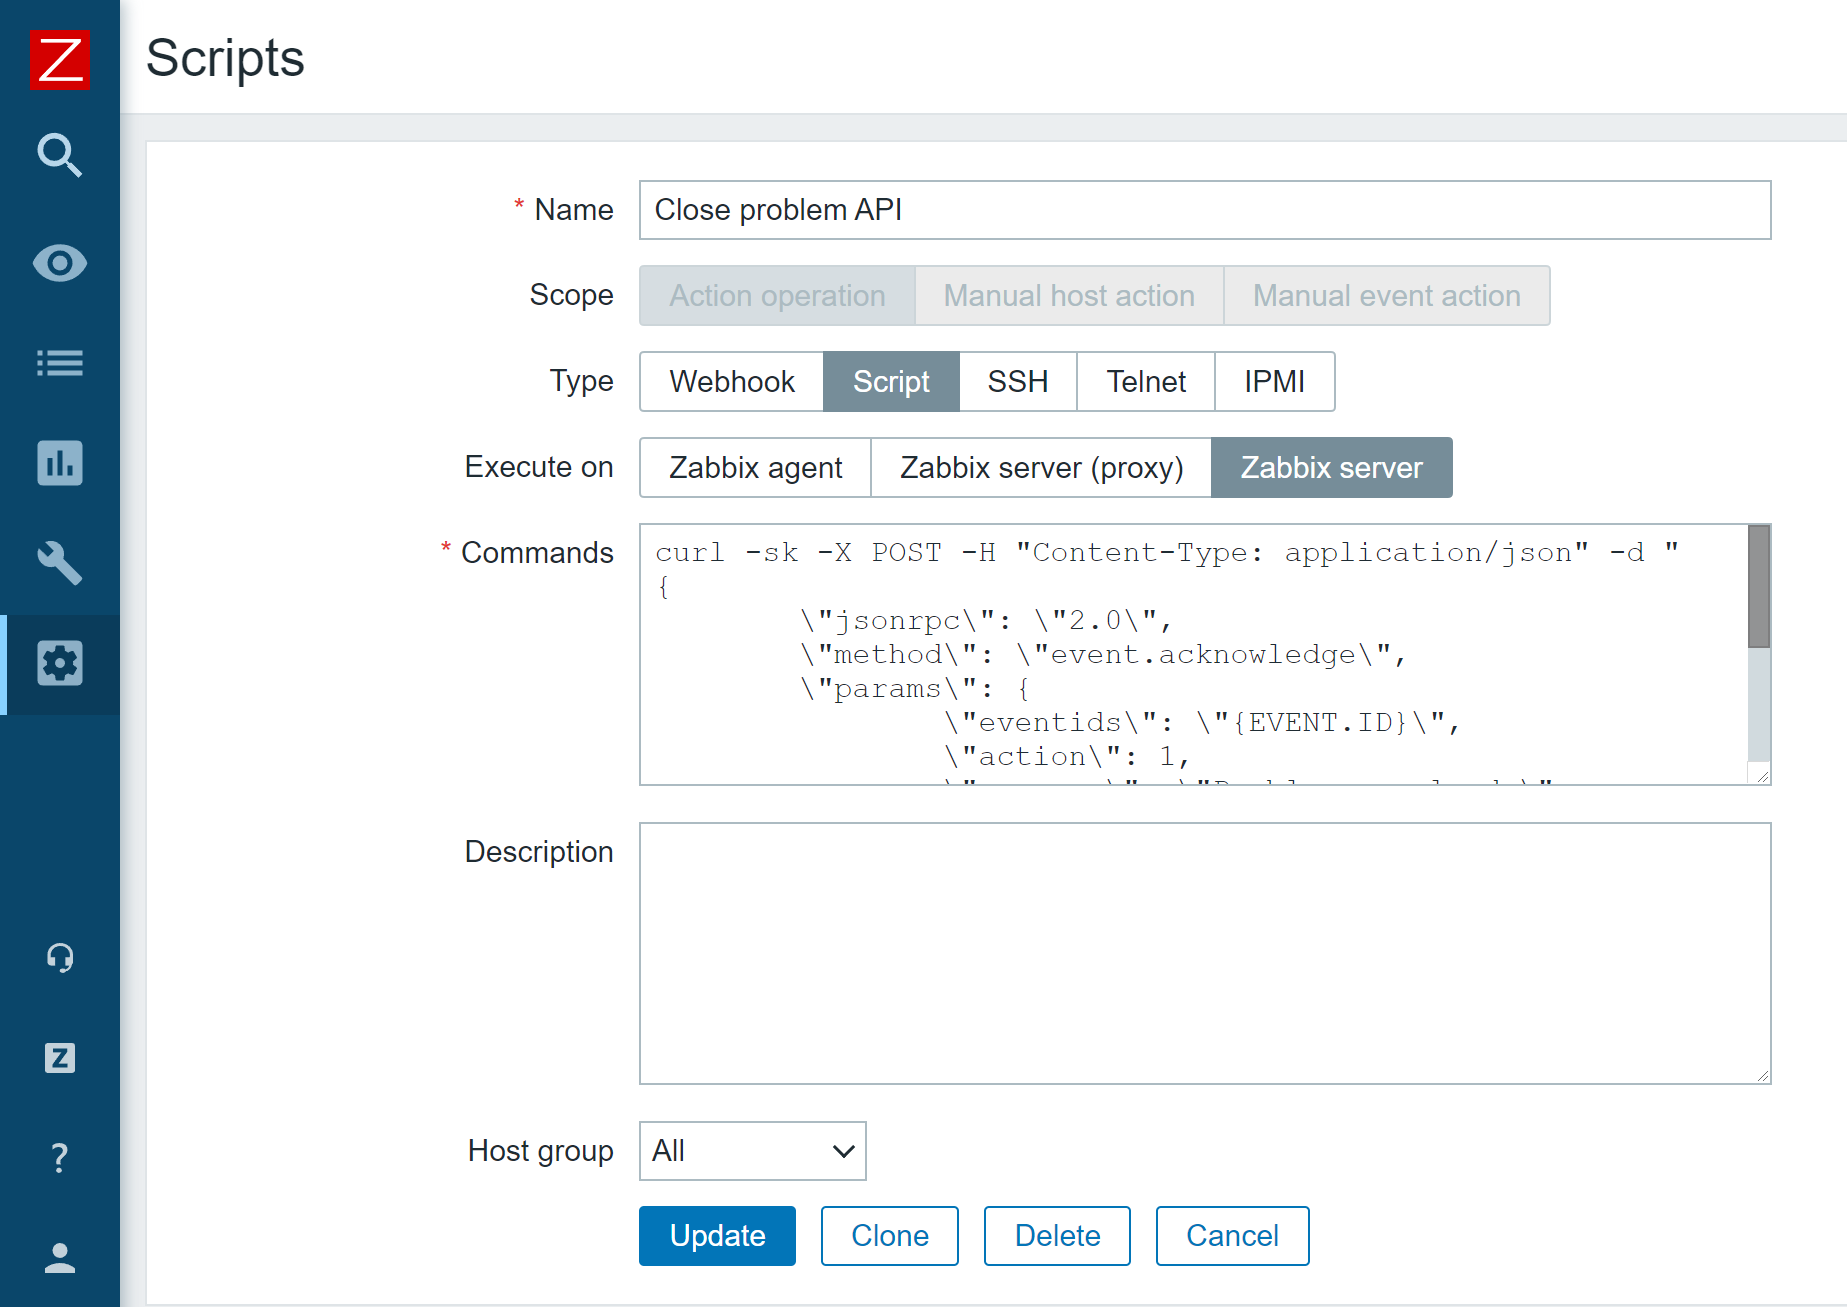
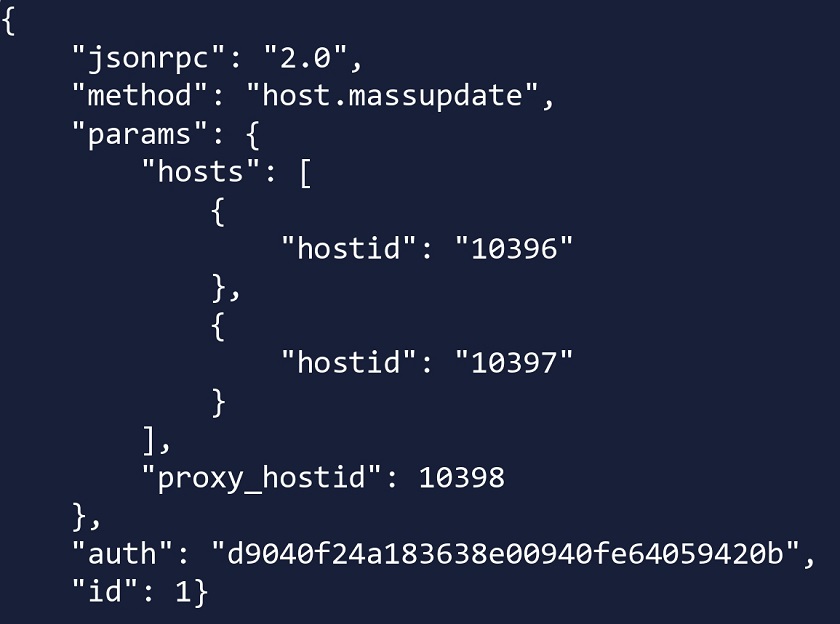
Another approach for Zabbix proxy HA can also be implemented by using Zabbix API scripts. We can essentially have two proxies running without the need to have the HA suite. In this case, if proxy A is down, we can use Zabbix API to move a host from proxy A to proxy B.
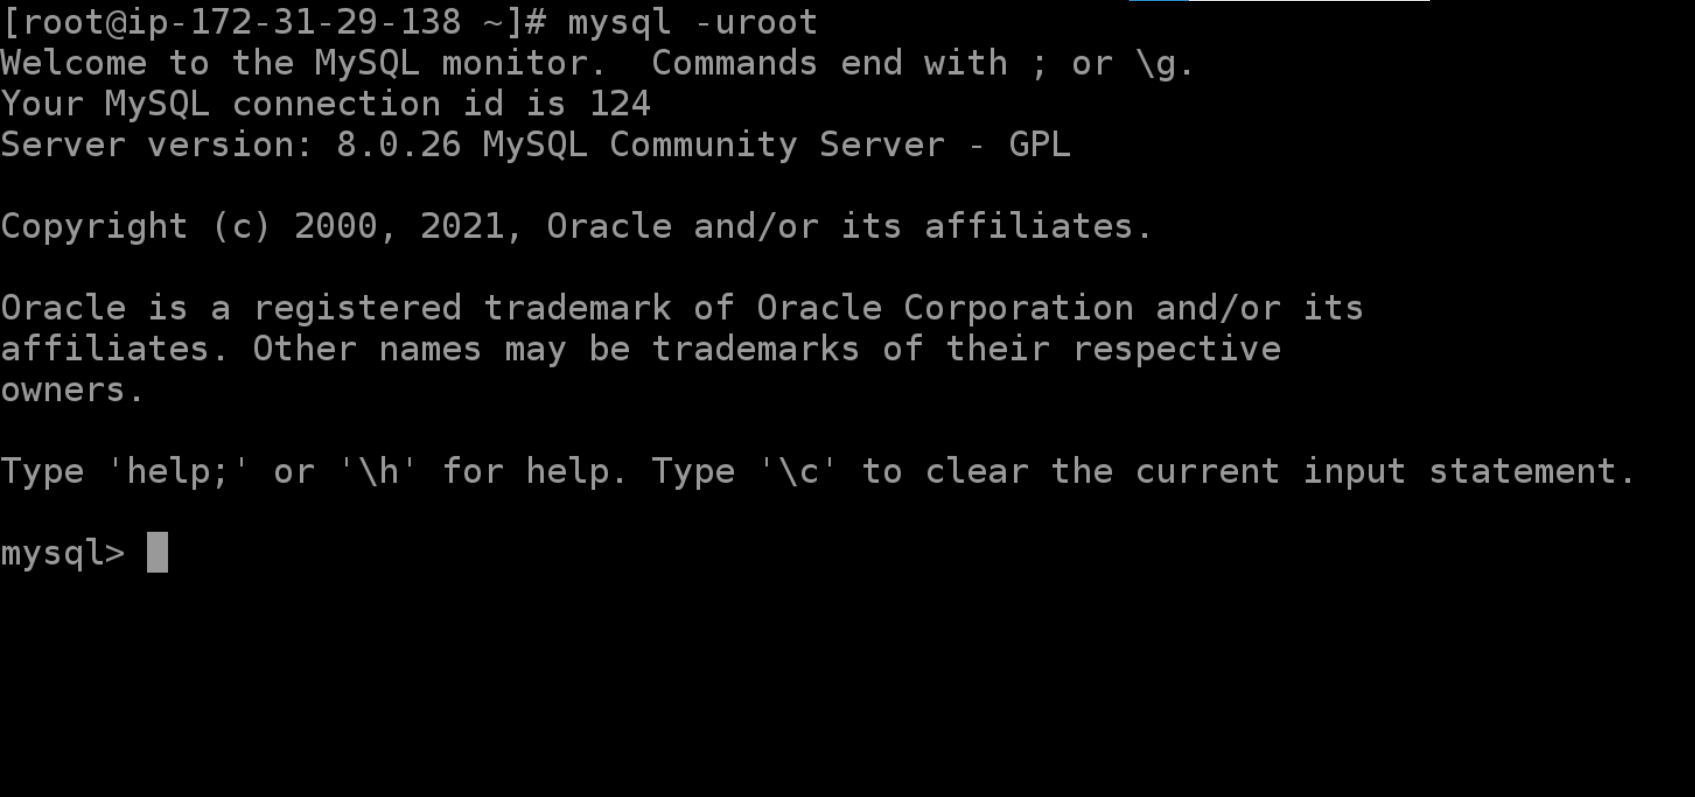
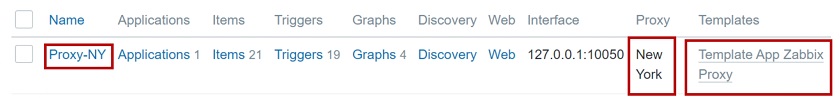
 Using Zabbix API script to change the proxy
Here, host.massupdate is used to change the proxy on the hosts. Combine this with a robust scripting logic and you end up with a very viable approach to move your hosts between proxies in failover scenarios.
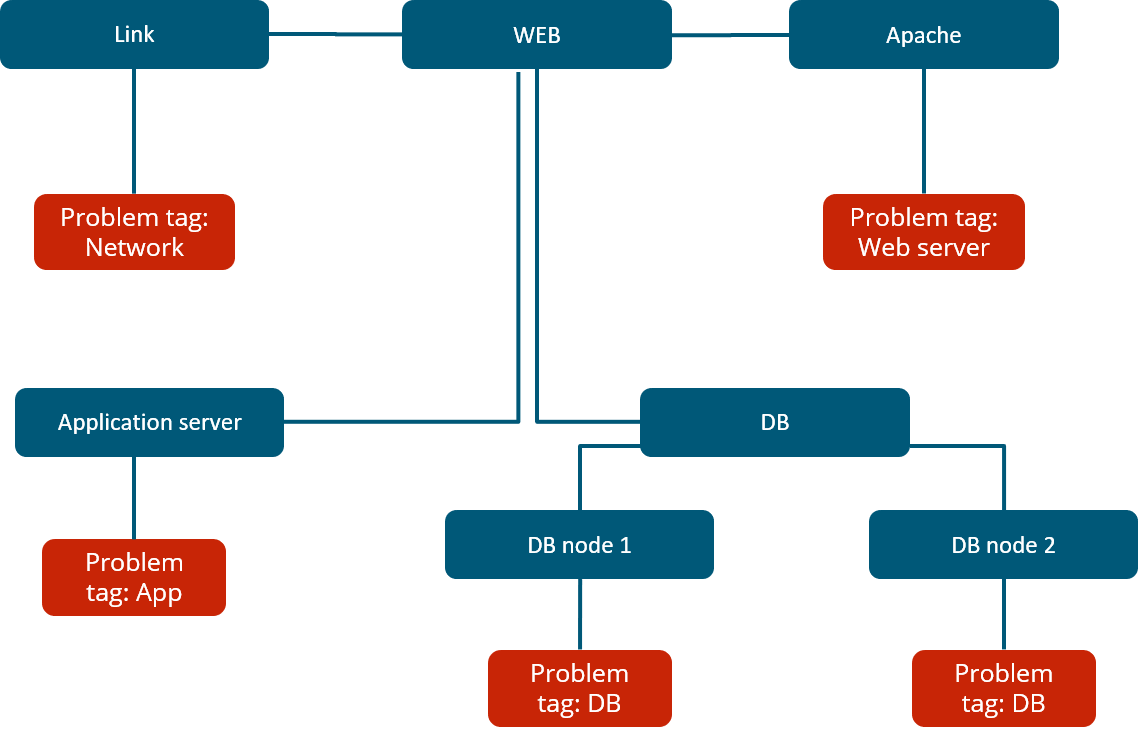
Database replication
We have covered the HA for Zabbix server backend and let’s remember that with frontend servers, we can simply bring up additional frontends, for instance, by utilizing Docker containers. But what about the DB redundancy?
- Database replication can be used as a form of redundancy for the Zabbix DB. No matter the DB backend – Postgres, MySQL, Oracle, we can deploy multiple DB nodes and utilize the native DB replication or use third-party tools for replication, for instance, Galera Cluster.
- I personally prefer using native replication tools as it is a bit more simple and you don’t have to concern yourself with another configuration and management layer that could potentially fail and be a bother to troubleshoot. But this will depend on your requirements, design and skillset.
Let’s look at an example with MySQL replication. You can set it up in many different ways as multiple replication approaches are supported: master/slave, master/master, or even have multiple masters replicating to one another. It is completely up to you how to implement replication, especially if you are already experienced with such deployments.
Which approach is best? At the end of the day it will all depend on your company policies, database backend and a compromise between simplicty and extra redundancy. I definitely suggest delving deeper and studying use cases and articles for the DB backend of your choice, before you decide to go with any particular approach.
 Database replication
Database tuning is vital for the long term stability of your Zabbix instance. The database defaults might be sufficient for your home office, but for large multi-tenant environments with tens of thousands new values per second they will not suffice. The database defaults depend on the database backend and the database version used, but ideally, these should be tuned and tested, preferably during the design stage, before you have deployed your Zabbix instance in production.
After installing the database backend we need to take a look at the hardware resources available. Ideally, you have already estimated the hardware resources required for your instance and ensured that DB hosts have sufficient memory, CPU resources and storage has been selected according to the I/O requirements. Now, you can move on to tuning your database backend.
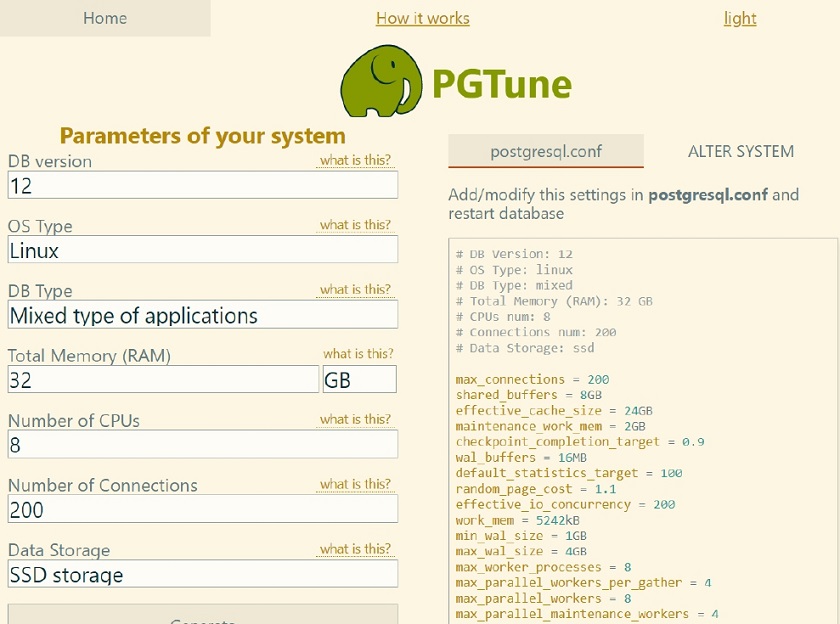
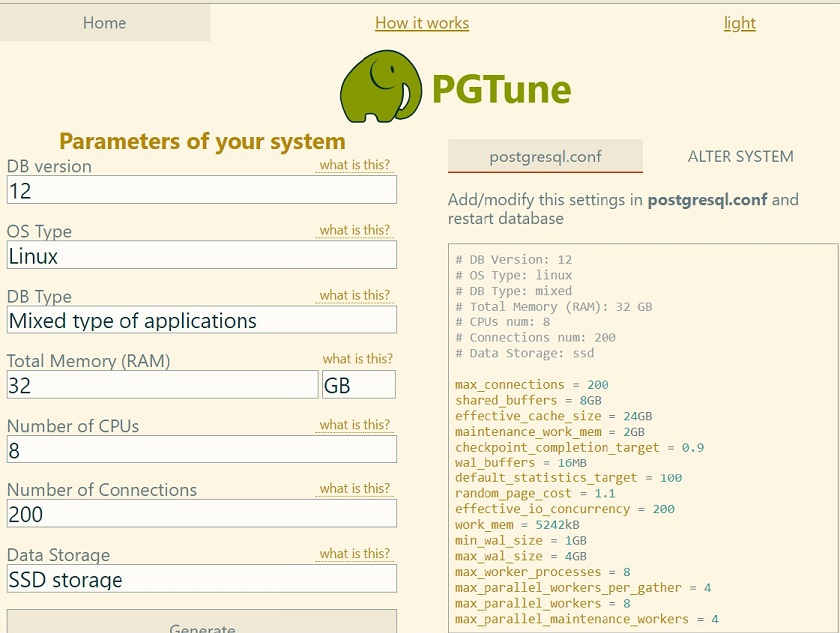
As an example with Postgres I used PGTune — an online database tuning tool. This is a simple estimate that should still provide you with a somewhat adequate configuration. Though ideally, you should have a DBA on board that is aware of what kind of data loads you will be dealing with to help you with an optimal database configuration.
Database performance tuning
History table partitioning
In such large environments, you will most likely see that housekeeper cannot keep up with the amount of data stored, unable to clean it up in a timely fashion with the housekeeper processes utilization reaching reaching 100 percent for 20-30 minutes at a time. This will have a negative effect on the overall database performance for the duration of housekeeping.
At this point, it is recommended to implement partitioning for history/trend tables. We can use Postgres with TimescaleDB plugin for this. Partitioning is supported out of the box, and you can configure it in Administration > General > Housekeeping.
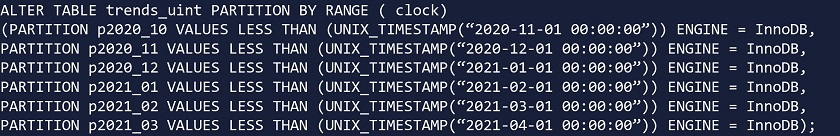
For MySQL and Oracle backends we would have to rely on custom partitioning scripts or procedures. In addition, community-provided partitioning scripts are publicly available.
As always – don’t forget to test 3rd party scripts in a test environment before deploying it in production!
 Community partitioning solution for MySQL
You can always create your own partitioning script, but you should be aware of what you’re doing and how things should be partitioned. We should always be partitioning only history and trend tables.
History table partitioning with TimescaleDB
- TimescaleDB plugin for PostgreSQL DB backends supports out-of-the-box partitioning. You don’t have to rely on community scripts.
- On TimescaleDB, we need to specify the chunk_time_interval parameter, which will define the partition chunk size.
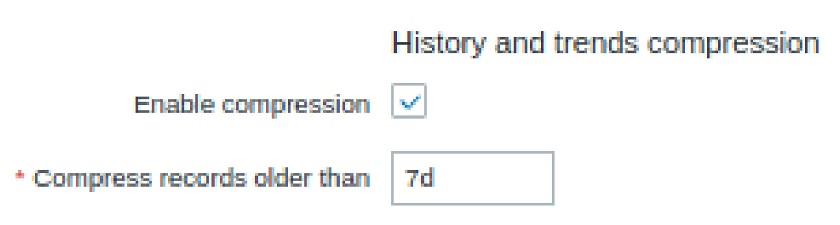
- In addition, we can also add compression of history/trends, which helps to reduce the history table size by 60-80 percent. Again, in such scenarios, your database is going to be huge — terabytes in size with hundreds of customers, each having thousands of metrics per second. So, compression is a really valuable asset.
- The only thing we have to take into account is that compressed data is read-only and cannot be changed post-compression. So, no more changes or inserts are possible for the compressed chunks.
 History and trends compression
To-do list
- Deploy the latest available Zabbix version. Ideally stick with an LTS version.
- Deploy proxy servers, define and configure HA/Replication on Zabbix proxies, as well as on Zabbix servers and databases.
- Implement partitioning to improve database performance.
- Implement throttling to reduce the volume of the incoming data.
- Tune your database! Either use online guides or consult with your DBA.
With our to-do list completed, we can have our Zabbix environment with deployed with redundancy in mind, providing monitoring as a service for hundreds of customers, multiple proxies running for each of the customers, HA in place, and Zabbix performing up to our expectations.
Questions & Answers
Question. Will Zabbix have its native HA solution? Will it be the whole package or does it involve installing individual components and maintaining them?
Answer. It’s planned on the roadmap to have a native HA solution in Zabbix 6.0. You should be able to get your hands on it when the 6.0 beta version gets released. Hopefully, you’ll be able to get your hands on it, test it out yourselves and give us feedback. From the looks of it it should be very much plug-and-play and will remove a lot of management overhead when comparing it with current HA implementation. Right now this is being developed only for the Zabbix backend server. As for the frontend – nothing is stopping you from having multiple frontends pointed at the same DB/Zabbix backend server.
Question. Can I run Zabbix on a single server and sell monitoring service to several customers with fully isolated environments, not just GUI, but also items, triggers, etc.
Answer. Yes, you can. You can have a single Zabbix instance and multiple customers being monitored by this instance. The only extra step that might be required is deploying proxies on the customer’s side. By using permission restrictions, proxy servers, roles, etc., we can then monitor multiple customers from a single Zabbix instance.
Question. When we change proxy, the agent configuration has to be updated. What about HA configuration on the proxy?
Answer. That really depends on the approach. If the agent is getting pointed at the virtual IP address and HA is managed by PCS, Corosync, or Pacemaker, then it should be fine as is and the VIP should just be on the currently active host. So, you’ll be essentially rerouted. With the HA by way of API approach, you can simply allow your agent to accept connections from both proxies. With ServerActive we can also specify multiple endpoints, so agents can actually be prepared for such an environment.
Question. How to merge two different instances into a single monitoring instance?
Answer. This is a complex task. First off, both instances need to have the same major Zabbix backend version. You might simply migrate the history from one instance to another, but then you will have some problems with underlying element IDs. So, in one instance you have your own set of items, triggers, users, etc. with your own set of IDs. These will most likely conflict with the set of IDs on the other instance.
You can do partial migration or use the export function to export your templates, hosts, value maps, network maps. I would try to export as much as I can as migration on SQL level will be a real pain. It is possible if you’re stubborn enough, but it can end up being a really complex task that can take days if not weeks to fully implement and test.
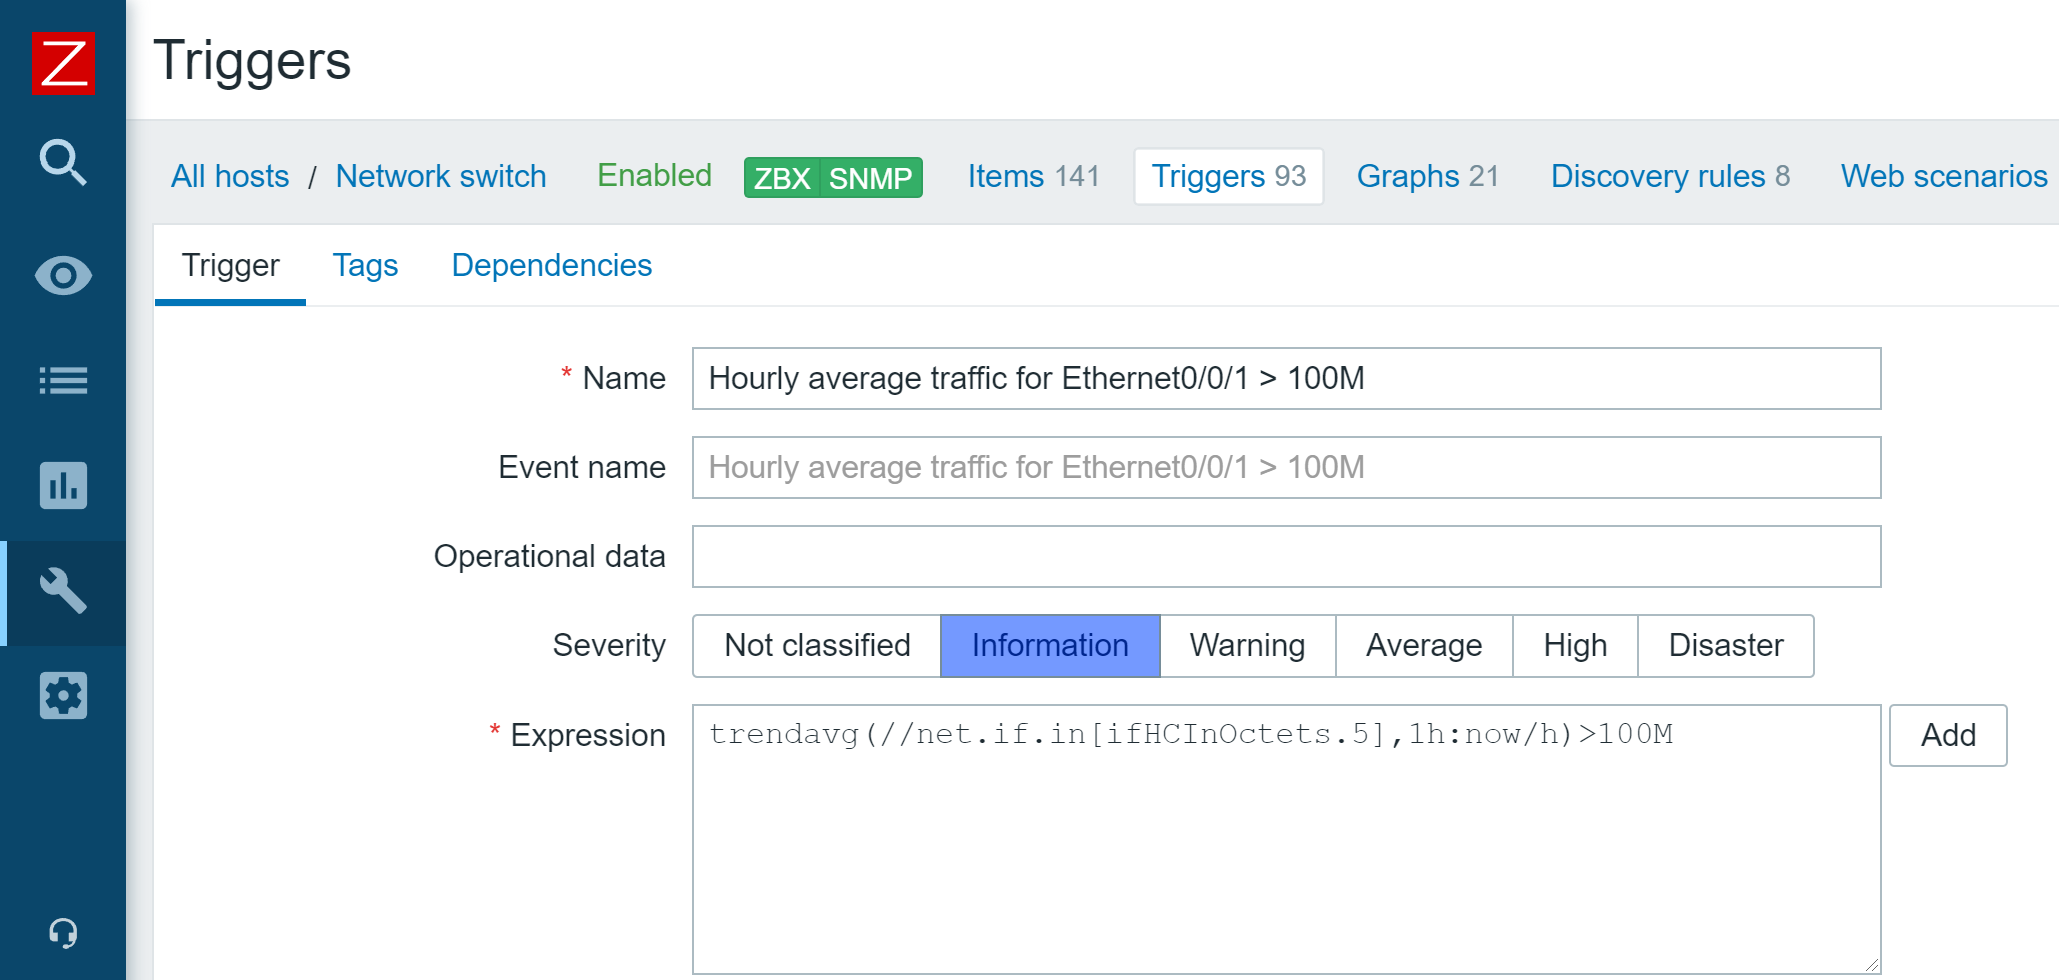
Question. Do subgroups relate to templates as well?
Answer. Subgroups relate to templates in a way where we can also define permissions to reading and modifying templates. For templates, you can also create per-customer templates and assign them to host groups. Users that have access to these host groups can then read or modify the templates.