All posts by Benjamin Smith

Debugging AWS Step Functions executions with the new console experience

Post Syndicated from Benjamin Smith original https://aws.amazon.com/blogs/compute/debugging-aws-step-functions-executions-with-the-new-console-experience/

Today, AWS Step Functions introduces a new opt-in console experience that makes it easier to analyze, debug, and optimize Standard Workflows.

Builders create Step Functions workflows to orchestrate multiple services into business-critical applications with minimal code. Customers wanted better ways to debug workflow executions and analyze the payload as it passes through each state.

This blog post explains the new capabilities of the enhanced Step Functions executions page. It shows how to debug workflows quickly, sort and filter on state events, and view the input and output path processing for each state.

Overview

The new Executions Details page allows you to inspect executions using three different view types: Graph view, Table view, and Event view. It has multi-level navigation enhancements for analyzing the map state feature, the ability to search execution history based on unique attributes and improved events, and table navigation with filtering, sorting, and pagination. For a full list of all the feature enhancements, see the Step Functions documentation.

Getting started

To get started, go to the Step Functions state machines page in the AWS Management Console:

  1. Choose any standard workflow from the list.
  2. From the workflows executions list page, choose an execution to analyze.
  3. Choose the New executions page button:

An enhanced execution summary section at the top of the page contains some new information:

  1. You can copy the execution ARN to the clipboard by choosing the copy icon.
  2. This section now shows the number of state transitions for the execution. This is helpful in optimizing the cost of your workflows. With Step Functions, you pay for the number of state transitions used per month for each state transition over the AWS Free Tier.
  3. You can view the total execution duration.

The following execution summary is a new section that displays execution errors. This helps to find the root cause of any workflow faults or failures:

Choosing the between execution views

The following examples show how to use the new execution views to inspect a workflow execution. This example focuses on the Order Processing Workflow that powers Serverlesspresso. Serverlesspresso is an interactive serverless application showcased at AWS re:Invent and AWS Summits. It allows attendees to order coffee from their smartphones. Each order starts a workflow execution.

Graph view

The graph view provides a visual representation of the workflow execution path. It shows which states succeeded, failed, or are currently in progress, and any errors caught. The legend at the bottom of the graph helps to decode each color.

To access the Graph view, choose the Graph view from the view navigation, as shown in the following screenshot. There is a new option to render the graph vertically or horizontally, which you can choose from the Layout option.


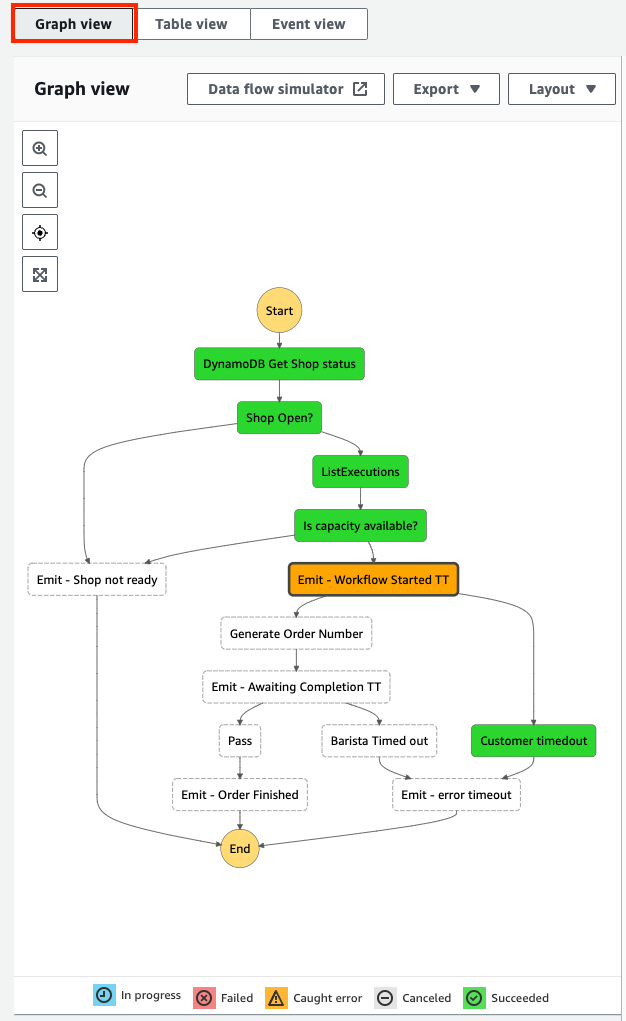
The graph view shows that the workflow caught an error at the Emit–Workflow Started TT state. I choose this state from the graph to view more details about it.

The Events tab

Each state in a workflow execution moves through a sequence of events, from TaskStateEntered to TaskStateExited. The Events tab, shown in the following image, displays all the events for the selected state, with their corresponding timestamp.

You can drill down into an event to see its output. In this case, the TaskTimedOut event happens to the selected state with the error message “States.Timeout”. This corresponds with the Caught error shown in the Graph view.

The Input & Output tab

Amazon States Language (ASL) enables you to filter and manipulate data at various stages of a workflow state’s execution using paths. A path is a string beginning with $ that lets you identify and filter subsets of JSON text. Learning how to apply these filters helps to build efficient workflows with minimal state transitions.

Select the Input & Output tab, and then toggle the Advanced view option to display the payload after each path process is applied.

This is useful for checking what each JSON path evaluates to. For example, the following images show how I configure the state Parameters, along with the Task input. This is what the parameters evaluate to after Step Functions applies the JSON path processing:

State Details and Definition tabs

The new execution page lets you view a state’s definition and execution details in isolation from the other states. The task details section contains additional information such as the Duration, Heartbeat, Started After and Timeout values.

Table view

The Table view provides a tabular representation of each state. Use this view to access information quickly about a state’s duration, resources, or status. A new timeline column shows the relative duration that each state took to complete. You can configure which columns are displayed.

To search and filter the table based on unique attributes such as state name or error type, start typing into the search input. Use the predictive autocomplete to define the search criteria. You can also choose a relative or absolute time range to filter by.

Event view

Step Functions stores all changes to state as a sequence of events to give you more visibility into the execution. The event view allows you to find and investigate a particular state event quickly by using the search and sort options:

  1. Choose the Timestamp column header to list events in reverse order of occurrence.
  2. Choose the arrow in the left-most column to reveal more details about each event
  3. Use the search input to search by keyword, state name, event type, or attribute.
  4. The date button lets you filter events by date or time.

Map State

The map state (“Type”: “Map”) allows you to run a set of steps for each element of an input array. The Step Functions execution page now helps you investigate and debug workflows using the Map state with the following enhancements:

  1. A hierarchical table view of steps for each iteration.
  2. An integrations overview, showing the execution summary at a glance.
  3. A paginated list of every event across all iterations.

The following Serverlesspresso workflow processes orders in batches. The map state iterates over each order, sanitizes each item, and checks it is currently in stock. If the item is not in stock, the map state throws a failure. If it is in stock, the order is recorded to a database, and a new event is emitted onto the serverless event bus.

The workflow runs for a new batch of orders and produces the following executions results page:

Using the Graph view:

  1. You can step through each iteration using the Map iteration viewer
  2. See the summary status in the iterations overview section

The Table view shows a hierarchical list of each iteration and I can drill down into the execution that failed to investigate further.

Use the Event view to search for failed executions to quickly filter the results:

Conclusion

Today, Step Functions is launching a new opt-in console experience to help builders analyse, debug, and optimize Step Functions Standard Workflows. These enhancements include three different ways to view your workflow executions, better visibility into workflows that use the Map state, fast access to workflow faults and failures, and new tools to search and sort workflow executions. This blog post shows how to use the new views to debug workflows, sort and filter on state events, and view the input and output path processing for each state.

The new console executions experience is generally available in AWS Regions where Step Functions is available.

For more information on building applications with Step Functions, visit serverlessland.com.

Optimizing AWS Lambda function performance for Java

Post Syndicated from Benjamin Smith original https://aws.amazon.com/blogs/compute/optimizing-aws-lambda-function-performance-for-java/

This post is written by Mark Sailes, Senior Specialist Solutions Architect.

This blog post shows how to optimize the performance of AWS Lambda functions written in Java, without altering any of the function code. It shows how Java virtual machine (JVM) settings affect the startup time and performance. You also learn how you can benchmark your applications to test these changes.

When a Lambda function is invoked for the first time, or when Lambda is horizontally scaling to handle additional requests, an execution environment is created. The first phase in the execution environment’s lifecycle is initialization (Init).

For Java managed runtimes, a new JVM is started and your application code is loaded. This is called a cold start. Subsequent requests then reuse this execution environment. This means that the Init phase does not need to run again. The JVM will already be started. This is called a warm start.

In latency-sensitive applications such as customer facing APIs, it’s important to reduce latency where possible to give the best possible experience. Cold starts can increase the latency for APIs when they occur.

How can you improve cold start latency?

Changing the tiered compilation level can help you to reduce cold start latency. By setting the tiered compilation level to 1, the JVM uses the C1 compiler. This compiler quickly produces optimized native code but it does not generate any profiling data and never uses the C2 compiler.

Tiered compilation is a feature of the Java virtual machine (JVM). It allows the JVM to make best use of both of the just-in-time (JIT) compilers. The C1 compiler is optimized for fast start-up time. The C2 compiler is optimized for the best overall performance but uses more memory and takes a longer time to achieve it.

There are five different levels of tiered compilation. Level 0 is where Java byte code is interpreted. Level 4 is where the C2 compiler analyses profiling data collected during application startup. It observes code usage over a period of time to find the best optimizations. Choosing the correct level can help you optimize your performance.

Changing the tiered compilation level to 1 can reduce cold start times by up to 60%. Thanks to changes in the Lambda execution environment, you can do this in one step with an environment variable for all Java managed runtimes.

Language-specific environment variables

Lambda supports the customization of the Java runtime via language-specific environment variables. The environment variable JAVA_TOOL_OPTIONS allows you to specify additional command line arguments to be used when Java is launched. Using this environment variable, you can change various aspects of the JVM configuration including garbage collection functionality, memory settings as well as the configuration for tiered compilation. To change the tiered compilation level to 1 you would set the value of JAVA_TOOL_OPTIONS to “-XXx:+TieredCompilation -XX:TieredStopAtLevel=1”. When the Java managed runtime starts any value set will be included in the program arguments. For more information on how you can collect and analyses garbage collection data read our Field Notes: Monitoring the Java Virtual Machine Garbage Collection on AWS Lambda.

Customer facing APIs

The following diagram is an example architecture that might be used to create a customer-facing API. Amazon API Gateway is used to manage a REST API and is integrated with Lambda to handle requests. The Lambda function reads and writes data to Amazon DynamoDB to serve the requests.

This is an example use case, which would benefit from optimization. The shorter the duration of each request made to the API the better the customer experience will be.

You can explore the code for this example in the GitHub repo: https://github.com/aws-samples/aws-lambda-java-tiered-compilation-example. The project includes the Lambda function source code, infrastructure as code template, and instructions to deploy it to your own AWS account.

Measuring cold starts

Before you add the environment variable to your Lambda function, measure the current duration for a request. One way to do this is by using the test functionality in the Lambda console.

The following screenshot is a summary from a test invoke, run from the console. You can see that it is a cold start because it includes an Init duration value. If the summary doesn’t include an Init duration, it is a warm start. In this case, the duration is 5,313ms.

Applying the optimization

This change can be configured using AWS Serverless Application Model (AWS SAM), AWS Cloud Development Kit (CDK), AWS CloudFormation, or from within the AWS Management Console.

Using the AWS Management Console:

  1. Navigate to the AWS Lambda console.
  2. Choose Functions and choose the Lambda function to update.
  3. From the menu, choose the Configuration tab and Environment variables. Choose Edit.
  4. Choose Add environment variable. Add the following:
    – Key: JAVA_TOOL_OPTIONS
    – Value: -XXx:+TieredCompilation -XX:TieredStopAtLevel=1

  5. Choose Save. You can verify that the changes are applied by invoking the function and viewing the log events in Amazon CloudWatch. The log line Picked up _JAVA_OPTIONS: -XX:+TieredCompilation -XX:TieredStopAtLevel=1 is added by the JVM during startup.

Checking if performance has improved

Invoke the Lambda function again to see if performance has improved.

The following screenshot shows the results of a test for a function with tiered compilation set to level 1. The duration is 2,169 ms. The cold start duration has decreased by 3,144 ms (59%).

Other use cases

This optimization can be applied to other use cases. Examples could include image resizing, document generation and near real-time ETL pipelines. The common trait being that they do a small number of discrete pieces of work in each execution.

The function code doesn’t have as many candidates for further optimization with the C2 compiler. Even if the C2 compiler did make further optimizations there wouldn’t be enough usage of those optimizations to decrease the total execution time. Instead of allowing this extra compilation to happen, you can tell the JVM not to use the C2 compiler and only use C1.

This optimization may not be suitable if a Lambda function is running for minutes or is repeating the same piece of code thousands of times within the same execution. Frequently executed sections of code are called hot spots, and are prime candidate for further optimization with the C2 compiler.

The C2 compiler analyses profiling data collected as the application runs, and produce a more efficient way to execute that piece of code. After the optimization by the C2 compiler that section of code would execute quicker. Because it is repeated thousands of times in a single Lambda invocation, the overhead of the optimization is worth it overall. An example use case where this would happen is in Monte Carlo simulations. Simulations of random events are calculated thousands, millions, or even billions of times to analyze the most likely outcomes.

Conclusion

In this post, you learn how to improve Lambda cold start performance by up to 60% for functions running the Java runtime. Thanks to the recent changes in the Java execution environment, you can implement these optimizations by adding a single environment variable.

This optimization is suitable for Java workloads such as customer-facing APIs, just-in-time image resizing, near real-time data processing pipelines, and other short-running processes. For more information on tired compilation, read about Tiered Compilation in JVM.

For more serverless learning resources, visit Serverless Land.

Mocking service integrations with AWS Step Functions Local

Post Syndicated from Benjamin Smith original https://aws.amazon.com/blogs/compute/mocking-service-integrations-with-aws-step-functions-local/

This post is written by Sam Dengler, Principal Specialist Solutions Architect, and Dhiraj Mahapatro, Senior Specialist Solutions Architect.

AWS Step Functions now supports over 200 AWS Service integrations via AWS SDK Integration. Developers want to build and test control flow logic for workflows using branching logicerror handling, and retries. This allows for precise workflow execution with deterministic results. Additionally, developers use Step Functions’ input and output processing features to transform data as it enters and exits tasks.

Developers can test their state machines locally using Step Functions Local before deploying them to an AWS account. However state machines that use service integrations like AWS Lambda, Amazon SQS, or Amazon SNS require Step Functions Local to perform calls to AWS service endpoints. Often, developers want to test the control and data flows of their state machine executions in isolation, without any dependency on service integration availability.

Today, AWS is releasing Mocked Service Integrations for Step Functions Local. This allows developers to define sample outputs from AWS service integrations. You can combine them into test case scenarios to validate workflow control and data flow definitions. You can find the code used in this post in the Step Functions examples GitHub repository.

Sales lead generation sample workflow

In this example, new sales leads are created in a customer relationship management system. This triggers the sample workflow execution using input data, which provides information about the contact.

Using the sales lead data, the workflow first validates the contact’s identity and address. If valid, it uses Step Functions’ AWS SDK integration for Amazon Comprehend to call the DetectSentiment API. It uses the sales lead’s comments as input for sentiment analysis.

If the comments have a positive sentiment, it adds the sales leads information to a DynamoDB table for follow-up. The event is published to Amazon EventBridge to notify subscribers.

If the sales lead data is invalid or a negative sentiment is detected, it publishes events to EventBridge for notification. No record is added to the Amazon DynamoDB table. The following Step Functions Workflow Studio diagram shows the control logic:

The full workflow definition is available in the code repository. Note the workflow task names in the diagram, such as DetectSentiment, which are important when defining the mocked responses.

Sentiment analysis test case

In this example, you test a scenario in which:

  1. The identity and address are successfully validated using a Lambda function.
  2. A positive sentiment is detected using the Comprehend.DetectSentiment API after three retries.
  3. A contact item is written to a DynamoDB table successfully
  4. An event is published to an EventBridge event bus successfully

The execution path for this test scenario is shown in the following diagram (the red and green numbers have been added). 0 represents the first execution; 1, 2, and 3 represent the max retry attempts (MaxAttempts), in case of an InternalServerException.

Mocked response configuration

To use service integration mocking, create a mock configuration file with sections specifying mock AWS service responses. These are grouped into test cases that can be activated when executing state machines locally. The following example provides code snippets and the full mock configuration is available in the code repository.

To mock a successful Lambda function invocation, define a mock response that conforms to the Lambda.Invoke API response elements. Associate it to the first request attempt:

"CheckIdentityLambdaMockedSuccess": {
  "0": {
    "Return": {
      "StatusCode": 200,
      "Payload": {
        "statusCode": 200,
        "body": "{\"approved\":true,\"message\":\"identity validation passed\"
}"
      }
    }
  }
}

To mock the DetectSentiment retry behavior, define failure and successful mock responses that conform to the Comprehend.DetectSentiment API call. Associate the failure mocks to three request attempts, and associate the successful mock to the fourth attempt:

"DetectSentimentRetryOnErrorWithSuccess": {
  "0-2": {
    "Throw": {
      "Error": "InternalServerException",
      "Cause": "Server Exception while calling DetectSentiment API in Comprehend Service"
    }
  },
  "3": {
    "Return": {
      "Sentiment": "POSITIVE",
      "SentimentScore": {
        "Mixed": 0.00012647535,
        "Negative": 0.00008031699,
        "Neutral": 0.0051454515,
        "Positive": 0.9946478
      }
    }
  }
}

Note that Step Functions Local does not validate the structure of the mocked responses. Ensure that your mocked responses conform to actual responses before testing. To review the structure of service responses, either perform the actual service calls using Step Functions or view the documentation for those services.

Next, associate the mocked responses to a test case identifier:

"RetryOnServiceExceptionTest": {
  "Check Identity": "CheckIdentityLambdaMockedSuccess",
  "Check Address": "CheckAddressLambdaMockedSuccess",
  "DetectSentiment": "DetectSentimentRetryOnErrorWithSuccess",
  "Add to FollowUp": "AddToFollowUpSuccess",
  "CustomerAddedToFollowup": "CustomerAddedToFollowupSuccess"
}

With the test case and mock responses configured, you can use them for testing with Step Functions Local.

Test case execution using Step Functions Local

The Step Functions Developer Guide describes the steps used to set up Step Functions Local on your workstation and create a state machine.

After these steps are complete, you can run a workflow locally using the start-execution AWS CLI command. Activate the mocked responses by appending a pound sign and the test case identifier to the state machine ARN:

aws stepfunctions start-execution \
  --endpoint http://localhost:8083 \
  --state-machine arn:aws:states:us-east-1:123456789012:stateMachine: LeadGenerationStateMachine#RetryOnServiceExceptionTest \
  --input file://events/sfn_valid_input.json

Test case validation

To validate the workflow executed correctly in the test case, examine the state machine execution events using the StepFunctions.GetExecutionHistory API. This ensures that the correct states are used. There are a variety of validation tools available. This post shows how to achieve this using the AWS CLI filtering feature using JMESPath syntax.

In this test case, you validate the TaskFailed and TaskSucceeded events match the retry definition for the DetectSentiment task, which specifies three retries. Use the following AWS CLI command to get the execution history and filter on the execution events:

aws stepfunctions get-execution-history \
  --endpoint http://localhost:8083 \
  --execution-arn <ExecutionArn>
  --query 'events[?(type==`TaskFailed` && contains(taskFailedEventDetails.cause, `Server Exception while calling DetectSentiment API in Comprehend Service`)) || (type==`TaskSucceeded` && taskSucceededEventDetails.resource==`comprehend:detectSentiment`)]'

The results include matching events:

{
  "timestamp": "2022-01-13T17:24:32.276000-05:00",
  "type": "TaskFailed",
  "id": 19,
  "previousEventId": 18,
  "taskFailedEventDetails": {
    "error": "InternalServerException",
    "cause": "Server Exception while calling DetectSentiment API in Comprehend Service"
  }
}

These results should be compared to the test acceptance criteria to verify the execution behavior. Test cases, acceptance criteria, and validation expressions vary by customer and use case. These techniques are flexible to accommodate various happy path and error scenarios. To explore additional sample test cases and examples, visit the example code repository.

Conclusion

This post introduces a new robust way to test AWS Step Functions state machines in isolation. With mocking, developers get more control over the type of scenarios that a state machine can handle, leading to assertion of multiple behaviors. Testing a state machine with mocks can also be part of the software release. Asserting on behaviors like error handling, branching, parallel, dynamic parallel (map state) helps test the entire state machine’s behavior. For any new behavior in the state machine, such as a new type of exception from a state, you can mock and add as a test.

See the Step Functions Developer Guide for more information on service mocking with Step Functions Local. The sample application covers basic scenarios of testing a state machine. You can use a similar approach for complex scenarios including other Step Functions flows, like map and wait.

For more serverless learning resources, visit Serverless Land.

Filtering event sources for AWS Lambda functions

Post Syndicated from Benjamin Smith original https://aws.amazon.com/blogs/compute/filtering-event-sources-for-aws-lambda-functions/

This post is written by Heeki Park, Principal Specialist Solutions Architect – Serverless.

When an AWS Lambda function is configured with an event source, the Lambda service triggers a Lambda function for each message or record. The exact behavior depends on the choice of event source and the configuration of the event source mapping. The event source mapping defines how the Lambda service handles incoming messages or records from the event source.

Today, AWS announces the ability to filter messages before the invocation of a Lambda function. Filtering is supported for the following event sources: Amazon Kinesis Data Streams, Amazon DynamoDB Streams, and Amazon SQS. This helps reduce requests made to your Lambda functions, may simplify code, and can reduce overall cost.

Overview

Consider a logistics company with a fleet of vehicles in the field. Each vehicle is enabled with sensors and 4G/5G connectivity to emit telemetry data into Kinesis Data Streams:

  • In one scenario, they use machine learning models to infer the health of vehicles based on each payload of telemetry data, which is outlined in example 2 on the Lambda pricing page.
  • In another scenario, they want to invoke a function, but only when tire pressure is low on any of the tires.

If tire pressure is low, the company notifies the maintenance team to check the tires when the vehicle returns. The process checks if the warehouse has enough spare replacements. Optionally, it notifies the purchasing team to buy additional tires.

The application responds to the stream of incoming messages and runs business logic if tire pressure is below 32 psi. Each vehicle in the field emits telemetry as follows:

{
    "time": "2021-11-09 13:32:04",
    "fleet_id": "fleet-452",
    "vehicle_id": "a42bb15c-43eb-11ec-81d3-0242ac130003",
    "lat": 47.616226213162406,
    "lon": -122.33989110734133,
    "speed": 43,
    "odometer": 43519,
    "tire_pressure": [41, 40, 31, 41],
    "weather_temp": 76,
    "weather_pressure": 1013,
    "weather_humidity": 66,
    "weather_wind_speed": 8,
    "weather_wind_dir": "ne"
}

To process all messages from a fleet of vehicles, you configure a filter matching the fleet id in the following example. The Lambda service applies the filter pattern against the full payload that it receives.

The schema of the payload for Kinesis and DynamoDB Streams is shown under the “kinesis” attribute in the example Kinesis record event. When building filters for Kinesis or DynamoDB Streams, you filter the payload under the “data” attribute. The schema of the payload for SQS is shown in the array of records in the example SQS message event. When working with SQS, you filter the payload under the “body” attribute:

{
    "data": {
        "fleet_id": ["fleet-452"]
    }
}

To process all messages associated with a specific vehicle, configure a filter on only that vehicle id. The fleet id is kept in the example to show that it matches on both of those filter criteria:

{
    "data": {
        "fleet_id": ["fleet-452"],
        "vehicle_id": ["a42bb15c-43eb-11ec-81d3-0242ac130003"]
    }
}

To process all messages associated with that fleet but only if tire pressure is below 32 psi, you configure the following rule pattern. This pattern searches the array under tire_pressure to match values less than 32:

{
    "data": {
        "fleet_id": ["fleet-452"],
        "tire_pressure": [{"numeric": ["<", 32]}]
    }
}

To create the event source mapping with this filter criteria with an AWS CLI command, run the following command.

aws lambda create-event-source-mapping \
--function-name fleet-tire-pressure-evaluator \
--batch-size 100 \
--starting-position LATEST \
--event-source-arn arn:aws:kinesis:us-east-1:0123456789012:stream/fleet-telemetry \
--filter-criteria '{"Filters": [{"Pattern": "{\"tire_pressure\": [{\"numeric\": [\"<\", 32]}]}"}]}'

For the CLI, the value for Pattern in the filter criteria requires the double quotes to be escaped in order to be properly captured.

Alternatively, to create the event source mapping with this filter criteria with an AWS Serverless Application Model (AWS SAM) template, use the following snippet.

Events: 
  TirePressureEvent: 
    Type: Kinesis    
    Properties: 
      BatchSize: 100
      StartingPosition: LATEST
      Stream: "arn:aws:kinesis:us-east-1:0123456789012:stream/fleet-telemetry"
      Filters: 
        - Pattern: "{\"data\": {\"tire_pressure\": [{\"numeric\": [\"<\", 32]}]}}"

For the AWS SAM template, the value for Pattern in the filter criteria does not require escaped double quotes.

For more information on how to create filters, refer to examples of event pattern rules in EventBridge, as Lambda filters messages in the same way.

Reducing costs with event filtering

By configuring the event source with this filter criteria, you can reduce the number of messages that are used to invoke your Lambda function.

Using the example from the Lambda pricing page, with a fleet of 10,000 vehicles in the field, each is emitting telemetry once an hour. Each month, the vehicles emit 10,000 * 24 * 31 = 7,440,000 messages, which trigger the same number of Lambda invocations. You configure the function with 256 MB of memory and the average duration of the function is 100 ms. In this example, vehicles emit low-pressure telemetry once every 31 days.

Without filtering, the cost of the application is:

  • Monthly request charges → 7.44M * $0.20/million = $1.49
  • Monthly compute duration (seconds) → 7.44M * 0.1 seconds = 0.744M seconds
  • Monthly compute (GB-s) → 256MB/1024MB * 0.744M seconds = 0.186M GB-s
  • Monthly compute charges → 0.186M GB-s * $0.0000166667 = $3.10
  • Monthly total charges = $1.49 + $3.10 = $4.59

With filtering, the cost of the application is:

  • Monthly request charges → (7.44M / 31)* $0.20/million = $0.05
  • Monthly compute duration (seconds) → (7.44M / 31) * 0.1 seconds = 0.024M seconds
  • Monthly compute (GB-s) → 256MB/1024MB * 0.024M seconds = 0.006M GB-s
  • Monthly compute charges → 0.006M GB-s * $0.0000166667 = $0.10
  • Monthly total charges = $0.05 + $0.10 = $0.15

By using filtering, the cost is reduced from $4.59 to $0.15, a 96.7% cost reduction.

Designing and implementing event filtering

In addition to reducing cost, the functions now operate more efficiently. This is because they no longer iterate through arrays of messages to filter out messages. The Lambda service filters the messages that it receives from the source before batching and sending them as the payload for the function invocation. This is the order of operations:

Event flow with filtering

Event flow with filtering

As you design filter criteria, keep in mind a few additional properties. The event source mapping allows up to five patterns. Each pattern can be up to 2048 characters. As the Lambda service receives messages and filters them with the pattern, it fills the batch per the normal event source behavior.

For example, if the maximum batch size is set to 100 records and the maximum batching window is set to 10 seconds, the Lambda service filters and accumulates records in a batch until one of those two conditions is satisfied. In the case where 100 records that meet the filter criteria come during the batching window, the Lambda service triggers a function with those filtered 100 records in the payload.

If fewer than 100 records meeting the filter criteria arrive during the batch window, Lambda triggers a function with the filtered records that came during the batch window at the end of the 10-second batch window. Be sure to configure the batch window to match your latency requirements.

The Lambda service ignores filtered messages and treats them as successfully processed. For Kinesis Data Streams and DynamoDB Streams, the iterator advances past the records that were sent via the event source mapping.

For SQS, the messages are deleted from the queue without any additional processing. With SQS, be sure that the messages that are filtered out are not required. For example, you have an Amazon SNS topic with multiple SQS queues subscribed. The Lambda functions consuming each of those SQS queues process different subsets of messages. You could use filters on SNS but that would require the message publisher to add attributes to the messages that it sends. You could instead use filters on the event source mapping for SQS. Now the publisher does not need to make any changes, as the filter is applied on the messages payload directly.

Conclusion

Lambda now supports the ability to filter messages based on a criteria that you define. This can reduce the number of messages that your functions process, may reduce cost, and can simplify code.

You can now build applications for specific use cases that use only a subset of the messages that flow through your event-driven architectures. This can help optimize the compute efficiency of your functions.

Learn more about this capability in our AWS Lambda Developer Guide.

Introducing AWS SAM Pipelines: Automatically generate deployment pipelines for serverless applications

Post Syndicated from Benjamin Smith original https://aws.amazon.com/blogs/compute/introducing-aws-sam-pipelines-automatically-generate-deployment-pipelines-for-serverless-applications/

Today, AWS announces the public preview of AWS SAM Pipelines, a new capability of AWS Serverless Application Model (AWS SAM) CLI. AWS SAM Pipelines makes it easier to create secure continuous integration and deployment (CI/CD) pipelines for your organizations preferred continuous integration and continuous deployment (CI/CD) system.

This blog post shows how to use AWS SAM Pipelines to create a CI/CD deployment pipeline configuration file that integrates with GitLab CI/CD.

AWS SAM Pipelines

A deployment pipeline is an automated sequence of steps that are performed to release a new version of an application. They are defined by a pipeline template file. AWS SAM Pipelines provides templates for popular CI/CD systems such as AWS CodePipeline, Jenkins, GitHub Actions, and GitLab CI/CD. Pipeline templates include AWS deployment best practices to help with multi-account and multi-Region deployments. AWS environments such as dev and production typically exist in different AWS accounts. This allows development teams to configure safe deployment pipelines, without making unintended changes to infrastructure. You can also supply your own custom pipeline templates to help to standardize pipelines across development teams.

AWS SAM Pipelines is composed of two commands:

  1. sam pipeline bootstrap, a configuration command that creates the AWS resources required to create a pipeline.
  2. sam pipeline init, an initialization command that creates a pipeline file for your preferred CI/CD system. For example, a Jenkinsfile for Jenkins or a .gitlab-ci.yml file for GitLab CI/CD.

Having two separate commands allows you to manage the credentials for operators and developer separately. Operators can use sam pipeline bootstrap to provision AWS pipeline resources. This can reduce the risk of production errors and operational costs. Developers can then focus on building without having to set up the pipeline infrastructure by running the sam pipeline init command.

You can also combine these two commands by running sam pipeline init –bootstrap. This takes you through the entire guided bootstrap and initialization process.

Getting started

The following steps show how to use AWS SAM Pipelines to create a deployment pipeline for GitLab CI/CD. GitLab is an AWS Partner Network (APN) member to build, review, and deploy code. AWS SAM Pipelines creates two deployment pipelines, one for a feature branch, and one for a main branch. Each pipeline runs as a separate environment in separate AWS accounts. Each time you make a commit to the repository’s feature branch, the pipeline builds, tests, and deploys a serverless application in the development account. For each commit to the Main branch, the pipeline builds, tests, and deploys to a production account.

Prerequisites

  • An AWS account with permissions to create the necessary resources.
  • Install AWS Command Line Interface (CLI) and AWS SAM CLI.
  • A verified GitLab account: This post assumes you have the required permissions to configure GitLab projects, create pipelines, and configure GitLab variables.
  • Create a new GitLab project and clone it to your local environment

Create a serverless application

Use the AWS SAM CLI to create a new serverless application from a Quick Start Template.

Run the following AWS SAM CLI command in the root directory of the repository and follow the prompts. For this example, can select any of the application templates:

sam init

Creating pipeline deployment resources

The sam pipeline bootstrap command creates the AWS resources and permissions required to deploy application artifacts from your code repository into your AWS environments.

For this reason, AWS SAM Pipelines creates IAM users and roles to allow you to deploy applications across multiple accounts. AWS SAM Pipelines creates these deployment resources following the principal of least privilege:

Run the following command in a terminal window:

sam pipeline init --bootstrap

This guides you through a series of questions to help create a .gitlab-ci.yml file. The --bootstrap option enables you to set up AWS pipeline stage resources before the template file is initialized:

  1. Enter 1, to choose AWS Quick Start Pipeline Templates
  2. Enter 2 to choose to create a GitLab CI/CD template file, which includes a two stage pipeline.
  3. Next AWS SAM reports “No bootstrapped resources were detected.” and asks if you want to set up a new CI/CD stage. Enter Y to set up a new stage:

Set up the dev stage by answering the following questions:

  1. Enter “dev” for the Stage name.
  2. AWS SAM CLI detects your AWS CLI credentials file. It uses a named profile to create the required resources for this stage. If you have a development profile, select that, otherwise select the default profile.
  3. Enter a Region for the stage name (for example, “eu-west-2”).
  4. Keep the pipeline IAM user ARN and pipeline and CloudFormation execution role ARNs blank to generate these resources automatically.
  5. An Amazon S3 bucket is required to store application build artifacts during the deployment process. Keep this option blank for AWS SAM Pipelines to generate a new S3 bucket.If your serverless application uses AWS Lambda functions packaged as a container image, you must create or specify an Amazon ECR Image repository. The bootstrap command configures the required permissions to access this ECR repository.
  6. Enter N to specify you are not using Lambda functions packages as container images.
  7. Press “Enter” to confirm the resources to be created.

AWS SAM Pipelines creates a PipelineUser with an associated ACCESS_KEY_ID and SECRET_ACCESS_KEY which GitLab uses to deploy artifacts to your AWS accounts. An S3 bucket is created along with two roles PipelineExecutionRole and CloudFormationExecutionRole.

Make a note of these values. You use these in the following steps to configure the production deployment environment and CI/CD provider.

Creating the production stage

The AWS SAM Pipeline command automatically detects that a second stage is required to complete the GitLab template, and prompts you to go through the set-up process for this:

  1. Enter “Y” to continue to build the next pipeline stage resources.
  2. When prompted for Stage Name, enter “prod”.
  3. When asked to Select a credential source, choose a suitable named profile from your AWS config file. The following example shows that a named profile called “prod” is selected.
  4. Enter a Region to deploy the resources to. The example uses the eu-west-1 Region.
  5. Press enter to use the same Pipeline IAM user ARN created in the previous step.
  6. When prompted for the pipeline execution role ARN and the CloudFormation execution role ARN, leave blank to allow the bootstrap process to create them.
  7. Provide the same answers as in the previous steps 5-7.

The AWS resources and permissions are now created to run the deployment pipeline for a dev and prod stage. The definition of these two stages is saved in .aws-sam/pipeline/pipelineconfig.toml.

AWS SAM Pipelines now automatically continues the walkthrough to create a GitLab deployment pipeline file.

Creating a deployment pipeline file

The following questions help create a .gitlab-ci.yml file. GitLab uses this file to run the CI/CD pipeline to build and deploy the application. When prompted, enter the name for both the dev and Prod stages. Use the following example to help answer the questions:

Deployment pipeline file

A .gitlab-ci.yml pipeline file is generated. The file contains a number of environment variables, which reference the details from AWS SAM pipeline bootstrap command. This includes using the AWS_ACCESS_KEY_ID and AWS_SECRET_ACCESS_KEY securely stored in the GitLab CI/CD repository.

The pipeline file contains a build and deploy stage for a branch that follows the naming pattern ‘feature-*’. The build process assumes the TESTING_PIPELINE_EXECUTION_ROLE in the testing account to deploy the application. sam build uses the AWS SAM template file previously created. It builds the application artifacts using the default AWS SAM build images. You can further customize the sam build –use-container command if necessary.

By default the Docker image used to create the build artifact is pulled from Amazon ECR Public. The default Node.js 14 image in this example is based on the language specified during sam init. To pull a different container image, use the --build-image option as specified in the documentation.

sam deploy deploys the application to a new stack in the dev stage using the TESTING_CLOUDFORMATION_EXECUTION_ROLE.The following code shows how this configured in the .gitlab-ci.yml file.

build-and-deploy-feature:
stage: build
only:
- /^feature-.*$/
script:
- . assume-role.sh ${TESTING_PIPELINE_EXECUTION_ROLE} feature-deployment
- sam build --template ${SAM_TEMPLATE} --use-container
- sam deploy --stack-name features-${CI_COMMIT_REF_NAME}-cfn-stack
--capabilities CAPABILITY_IAM
--region ${TESTING_REGION}
--s3-bucket ${TESTING_ARTIFACTS_BUCKET}
--no-fail-on-empty-changeset
--role-arn ${TESTING_CLOUDFORMATION_EXECUTION_ROLE}

The file also contains separate build and deployments stages for the main branch. sam package prepares the application artifacts. The build process then assumes the role in the production stage and prepares the application artifacts for production. You can customize the file to include testing phases, and manual approval steps, if necessary.

Configure GitLab CI/CD credentials

GitLab CI/CD uses the AWS_ACCESS_KEY_ID and AWS_SECRET_ACCESS_KEY to authenticate to your AWS account. The values are associated with a new user generated in the previous sam pipeline init --bootstrap step. Save these values securely in GitLab’s CI/CD variables section:

  1. Navigate to Settings > CI/CD > Variables and choose expand.
  2. Choose Add variable, and enter in the key name and value for the AWS_SECRET_ACCESS_KEY noted down in the previous steps:
  3. Repeat this process for the AWS_ACCESS_KEY_ID:

Creating a feature branch

Create a new branch in your GitLab CI/CD project named feature-1:

  1. In the GitLab CI/CD menu, choose Branches from the Repository section. Choose New branch.
  2. For Branch name, enter branch “feature-1” and in the Create from field choose main.
  3. Choose Create branch.

Configure the new feature-1 branch to be protected so it can access the protected GitLab CI/D variables.

  1. From the GitLab CI/CD main menu, choose to Settings then choose Repository.
  2. Choose Expand in the Protected Branches section
  3. Select the feature-1 branch in the Branch field and set Allowed to merge and Allowed to push to Maintainers.
  4. Choose Protect

Trigger a deployment pipeline run

1. Add the AWS SAM application files to the repository and push the branch changes to GitLab CI/CD:

git checkout -b feature-1
git add .
git commit -am “added sam application”
git push --set-upstream origin feature-1 

This triggers a new pipeline run that deploys the application to the dev environment. The following screenshot shows GitLab’s CI/CD page.

AWS CloudFormation shows that a new stack has been created in the dev stage account. It is named after the feature branch:

To deploy the feature to production, make a pull request to merge the feature-1 branch into the main branch:

  1. In GitLab CI/CD, navigate to Merge requests and choose New merge request.
  2. On the following screen, choose feature-1 as the Source branch and main as the Target branch.
  3. Choose Compare branches and continue, and then choose Create merge request.
  4. Choose Merge

This merges the feature-1 branch to the main branch, triggering the pipeline to run the production build, testing, and deployment steps:

Conclusion

AWS SAM Pipelines is a new feature of the AWS SAM CLI that helps organizations quickly create pipeline files for their preferred CI/CD system. AWS provides a default set of pipeline templates that follow best practices for popular CI/CD systems such as AWS CodePipeline, Jenkins, GitHub Actions, and GitLab CI/CD. Organizations can also supply their custom pipeline templates via Git repositories to standardize custom pipelines across hundreds of application development teams. This post shows how to use AWS SAM Pipelines to create a CI/CD deployment pipeline for GitLab.

Watch guided video tutorials to learn how to create deployment pipelines for GitHub Actions, GitLab CI/CD, and Jenkins.

For more learning resources, visit https://serverlessland.com/explore/sam-pipelines.

Prototyping at speed with AWS Step Functions new Workflow Studio

Post Syndicated from Benjamin Smith original https://aws.amazon.com/blogs/compute/prototyping-at-speed-with-aws-step-functions-new-workflow-studio/

AWS recently introduced Workflow Studio for AWS Step Functions. This is a new visual builder for creating Step Functions workflows in the AWS Management Console. This post shows how to use the Workflow Studio for rapid workflow prototyping. It also explains how to transition to local development, integrating the prototype with your infrastructure as code templates.

Since its release in December 2016, developers have been building Step Functions workflows with Amazon States Language (ASL) to orchestrate multiple services into business-critical applications. Developers wanted faster ways to prototype and build orchestration workflows without writing custom code or using additional services.

­­­­­­

What’s new?

The new Step Functions Workflow Studio provides an additional workflow building experience. Developers and business users can now build prototype workflows quickly with a graphical user interface in the Step Functions console.

These workflo­­­ws can include all the same workflow states, patterns, and service integrations available when building with ASL. Each state is configured using editable forms. The workflow ASL definition can be exported for further editing in the console or in your local integrated development environment (IDE). Workflow Studio can build new workflows or edit a pre-existing workflow. To get started with Workflow Studio, see this introduction video.

Business users

Workflow Studio provides new opportunities for a more diverse range of users to build step functions workflows. Business users and those in non-technical roles can quickly create workflow prototypes. This can help to reason about and understand business processes before passing to a developer to add business logic and configure service integrations.

Rapid workflow prototyping

Workflow Studio allows you to create placeholders for AWS Lambda functions and other service integrations using the ‘drag-and-drop’ interface. This means that resources do not need to exist before designing the workflow. Once a workflow is prototyped you can save and continue to edit in the console or copy the ASL definition to your local IDE. You can then incorporate the workflow with application resources and infrastructure as code templates.

In the following steps, I use Workflow Studio to build the workflow described in this post. The full application template is found in this GitHub repository. The workflow analyzes web form submissions for negative sentiment. It generates a case reference number and saves the data in an Amazon DynamoDB table. The workflow returns the case reference number and message sentiment score.

To start fast prototyping for this workflow with the visual studio:

  1. Log into the Step Functions console and choose Create state machine.
  2. Choose Design your workflow visually from the authoring method section. This opens up Workflow Studio.
  3. Choose AWS Lambda Invoke from the Actions menu and drag it into the workflow.
  4. Choose the Configuration tab from the Form panel and enter the name Detect Sentiment in the State name field.
  5. In the function name field, choose Enter Function Name.
  6. Enter ${DetectSentiment} into the function name parameters field. This is a dynamic reference to a value that is provided by an Infrastructure-as-code template.

    The Workflow Studio provides an interface to add input and output path processing configurations to the workflow.
  7. Choose the Output tab and select Combine input and result with ResultPath. Selecting this option uses the ResultPath filter to add the result into the original state input. The specified path indicates where to add the result.
  8. Enter $.SentimentResults into the path ResultsPath text input.
  9. View the workflow ASL definition by choosing Definition from the top menu. This shows:
    1. The state is named Detect Sentiment.
    2. The Lambda function name uses a dynamic reference to ${DetectSentiment}. This is provided by the infrastructure-as-code template, explained in the following steps.
    3. A default retry configuration is defined.
    4. The ResultPath is configured.

Continue building the workflow this way, adding more Task and Flow states. A completed workflow looks as follows:

Transitioning to local development

Once the workflow is created in the Workflow Studio, you can export the ASL definition to a local IDE to incorporate into an infrastructure as code template. The template describes all the AWS resources that make up the application:

  1. To copy the ASL definition, choose the Definition button in the top navigation, and copy the entire ASL workflow definition to the clipboard.
  2. Create a new directory in your local filesystem named statemachine and save the definition to a file in this directory named sfn-template.asl.json. The following screenshot shows how the workflow appears in your IDE when rendered with the AWS Toolkit for Visual Studio Code.

  3. AWS Serverless Application Model (AWS SAM) is an open-source infrastructure as code framework for building serverless applications.
  4. Create an AWS SAM template named template.yaml to describe the application resources. A completed version of this file is found in this GitHub repository.
  5. Create a directory for each Lambda function. Within each directory, save the function code to a file called app.js. The function code, can be found in this GitHub repository. The final application file directory looks as follows:
    root
    ┣ LambdaFunctions/
    ┃ ┣ GenerateReferenceNumber/
    ┃ ┃ ┗ app.js
    ┃ ┣ detectSentiment/
    ┃ ┃ ┗ app.js
    ┃ ┗ sendEmailConfirmation/
    ┃   ┗ app.js
    ┣ statemachine/
    ┃ ┗ sfn-template.asl.json
    ┗ template.yaml

The full application can be found in this GitHub repository.

The AWS SAM template describes the Step Functions workflow’s security permissions and allows for dynamic referencing of the resources described within the template such as the Lambda functions and DynamoDB table:

##########################################################################
#   STEP FUNCTION                                                        #
##########################################################################

  ProcessFormStateMachineExpressSync:
    Type: AWS::Serverless::StateMachine # More info about State Machine Resource: https://docs.aws.amazon.com/serverless-application-model/latest/developerguide/sam-resource-statemachine.html
    Properties:
      DefinitionUri: statemachine/sfn-template.asl.json
      DefinitionSubstitutions:
        NotifyAdminWithSES: !Ref NotifyAdminWithSES
        GenerateRefernceNumber: !Ref GenerateRefernceNumber
        DetectSentiment: !Ref DetectSentiment
        DDBTable: !Ref FormDataTable
      Policies: # Find out more about SAM policy templates: https://docs.aws.amazon.com/serverless-application-model/latest/developerguide/serverless-policy-templates.html
        - LambdaInvokePolicy:
            FunctionName: !Ref NotifyAdminWithSES
        - LambdaInvokePolicy:
            FunctionName: !Ref DetectSentiment
        - LambdaInvokePolicy:
            FunctionName: !Ref GenerateRefernceNumber
        - DynamoDBWritePolicy:
            TableName: !Ref FormDataTable
      Type: EXPRESS
  • The DefinitionURI value provides the location of the ASL definition that is exported from the Workflow Studio, in statemachine/sfn-template.asl.json.
  • The DefinitionSubstitutions values provide the names of the resources used within the workflow. Here you see $.DetectSentiment Lambda function name passed to the workflow definition. This was entered into the Workflow Studio in the previous steps.

The application is deployed using the AWS SAM CLI. Follow these steps in the GitHub repository to deploy the application.

Once the application is deployed, the workflow can be edited by updating the ASL definition in the Step Functions console or the local template file. It can also be edited from the drag-and-snap interface in the Workflow Studio. Any edits made in the AWS Management Console should be copied back to the local template file.

Conclusion

The AWS Step Functions Workflow Studio is a new visual builder for creating Step Functions workflows in the AWS Management Console. The drag-and-drop interface can be used to build new or edit existing workflows quickly. Each state is configured using editable forms, with the ASL definition visible and available for export as you build.

This post shows how to use the Workflow Studio for rapid workflow prototyping. It explains how to export the ASL definition to your local IDE and integrate it with your infrastructure as code application templates.

The Workflow Studio is included in Step Functions pricing at no additional fee and is available in all regions where Step Functions is available. To get started, visit https://aws.amazon.com/stepfunctions.

Getting started with serverless for developers part 5: Sandbox developer account

Post Syndicated from Benjamin Smith original https://aws.amazon.com/blogs/compute/getting-started-with-serverless-for-developers-part-5-sandbox-developer-account/

This is part 5 of the Getting started with serverless series. In part 4, you learn how the developer workflow for building serverless applications differs to a traditional developer workflow. You see how to test business logic locally before deploying to an AWS account.

In this post, you learn how to secure and manage access to your AWS Lambda functions. I show how to invoke Lambda functions in a sandbox developer account directly from an integrated developer environment (IDE) and view output logs in near-real-time. Finally, I show how this helps to test for infrastructure and security configurations before committing changes to the main branch.

A sandbox developer account

Serverless services like Lambda and Amazon API Gateway are pay-per-use, this means developers no longer need to share multiple environments (for example, dev, staging, and production). Instead, every developer can have their own sandboxed AWS developer account. This allows developers to not have to replicate everything to their local environment but rather test with real resources in the cloud.

You can still run code locally during the development of a feature. In post 4, I show how I run Lambda function code locally, using a test harness. This allows me to maintain a fast inner loop, iteratively updating and locally testing code. If my Lambda function interacts with other AWS infrastructure, I deploy them to a sandboxed AWS developer account. This allows me to test my Lambda function code locally while still being able to access managed services in the cloud.

However, it is useful to deploy your function code to a Lambda function in a sandboxed developer account. A sandbox developer account is an AWS account allocated to a developer on a 1:1 basis. It should give developers as much freedom as possible while still protecting resources and budget.

This allows you to test for security configurations and ensure that your Lambda function code behaves as expected when run in the Lambda execution environment:

Creating a sandboxed developer account

The following best practices can help to minimize costs and prevent unauthorized usage.

After creating a sandbox account, it can be useful to associate a named profile with it. A named profile is a collection of credentials that you can apply to an AWS Command Line Interface (AWS CLI) command. When you specify a profile to run a command, the settings and credentials are used to run that command. The AWS CLI supports multiple named profiles that are stored in the config and credentials files.

Configure profiles by adding entries to the config and credentials files. To learn more about named profiles refer to the AWS CLI documentation.

In the following example I configure my credentials file with two named profiles.

The profile named prod is my production account, and the profile named default is my sandbox developer account. The CLI automatically uses the profile named default, if no --profile option is specified in a CLI command.

[default]
aws_access_key_id=AKIAIOSFODNN7EXAMPLE
aws_secret_access_key=wJalrXUtnFEMI/K7MDENG/bPxRfiCYEXAMPLEKEY

[dev]
aws_access_key_id=AKIAIOSFODNN7EXAMPLE
aws_secret_access_key=wJalBBUtnFEMI/&7MDENG/bPxRfiCYEXAMPLEKEY

[prod]
aws_access_key_id=AKIAI44QH8DHBEXAMPLE
aws_secret_access_key=je7MtGbClwBF/2Zp9Utk/h3yCo8nvbEXAMPLEKEY

AWS Lambda security permissions

AWS Identity and Access Management (IAM) is the service used to manage access to AWS services. Lambda is fully integrated with IAM, allowing you to control precisely what each Lambda function can do within the AWS Cloud. There are two important things that define the scope of permissions in Lambda functions:

The resource policy: Defines which events are authorized to invoke the function.

The execution role policy: Limits what the Lambda function is authorized to do.

Using IAM roles to describe a Lambda function’s permissions, decouples it’s security configuration from the code. This helps reduce the complexity of a lambda function, making it easier to maintain.

A Lambda function’s resource and execution policy should be granted the minimum required permissions for the function to perform it’s task effectively. This is sometimes referred to as the rule of least privilege. As you develop a Lambda function, you expand the scope of this policy to allow access to other resources as required.

When building Lambda-based applications with frameworks such as AWS SAM, you describe both policies in the application’s template.

The following steps show how I deploy and test a Lambda function in a sandbox developer account from within my IDE.

Before you start

All the code relating to this example application can be found in this GitHub repository. To deploy this stage of the application, follow the steps from post 1 to clone the sample application.

  1. Run the following command from the root directory of the cloned repository:
    cd ./part_5
  2. After creating a sandbox developer account, deploy the example application into it by specifying the corresponding profile name in the AWS SAM CLI command. You can omit this if you named the profile default:
    sam deploy --config-file ../samconfig.toml  –guided  --profile default

    This produces the following output:

    Make a note of the StarWebhookLambdaFunctionName, you will use this in the following steps.

Logging with serverless applications

After deploying your serverless application to the sandboxed developer account, you need to verify that it’s operating properly. Lambda automatically monitors functions on your behalf, reporting metrics through Amazon CloudWatch. It collects data in the form of logs, metrics, and events and provides a unified view of AWS resources, applications, and services.

To help simplify troubleshooting, the AWS Serverless Application Model CLI (AWS SAM CLI) has a command called sam logs. This command lets you fetch CloudWatch Logs generated by your Lambda function from the command line.

Run the following command in a terminal window to view a live tail of logs generated by the StarWebhookHandler Lambda function. Replace StarWebhookLambdaFunctionName with the Lambda function name generated by your deployment:

sam logs -n StarWebhookLambdaFunctionName --tail

Checking Lambda function permissions in a sandbox developer account

I open a new terminal window and invoke the StarWebhookHandler Lambda function directly from my IDE by running the following AWS SAM CLI command. To invoke the function I pass an example payload located in events/testEvent.json.

aws lambda invoke --function-name <<replace-with-function-name>> \
--payload fileb://events/testEvent.json  \
out.txt

The following screenshot shows my two terminal windows side by side.

The response returned by the CLI command is on the right. The left window shows the tail of logs generated by the Lambda function. I observe that the CLI invocation shows a status 200 response, but the Lambda function logs report an ‘AccessDenied’ error. The function does not have the required permissions to write to Amazon S3.

I edit the Lambda function policy definition, adding permission for my Lambda function to write to an S3 bucket. I run sam build and sam deploy to re-deploy the application to the sandbox developer account. I invoke the Lambda function again. The logs show the following:

  1. The Lambda function responds with “StatusCode 200″.
  2. The Lambda function billed duration, memory size and running duration.
  3. The Lambda function has successfully copied the file to S3

IAM permission errors such as these may not be detected when running the function code locally. This is one of the advantages of deploying and running Lambda functions in a sandboxed developer account while developing an application.

Conclusion

This post explains the advantages of using a sandbox developer account. It shows how to deploy your business logic to a Lambda function in a sandboxed developer account. You are introduced to IAM policies, which control precisely what each Lambda function can do within the AWS Cloud. You learn that CloudWatch provides a unified view of logs for all AWS resources.

Finally, I show how to use the AWS SAM CLI and AWS CLI to invoke a Lambda function in the cloud and view its log output directly from the IDE. This helps to test for security configurations and to ensure that your business logic behaves as expected when run in the Lambda service. Invoking functions and observing their log output directly from your IDE helps to reduce context switching as you build.

Getting Started with serverless for developers: Part 4 – Local developer workflow

Post Syndicated from Benjamin Smith original https://aws.amazon.com/blogs/compute/getting-started-with-serverless-for-developers-part-4-local-developer-workflow/

This blog is part 4 of the “Getting started with serverless for developers” series, helping developers start building serverless applications from their IDE.

Many “getting started” guides demonstrate how to build serverless applications from within the AWS Management Console. However, most developers spend the majority of their time building from within their local integrated development environment (IDE).

The next two blog posts in this series focus on the serverless developer workflow. They describe how to check logs, test, and iterate on business logic while building locally, and how this differs from traditional applications.

This blog post explains how the developer workflow for building serverless applications differs from a traditional developer workflow. It shows the methods that I use to test business logic locally before deploying to a sandbox AWS developer account, and how to test against cloud services as you build. This eliminates the need to deploy to the AWS Cloud each time you want to test a code change.

Traditional developer workflow

Developers typically use the following workflow cycle before committing code to the main branch:

  1. Write code.
  2. Save code.
  3. Run code.
  4. Check results.

This is sometimes referred to as the inner loop, shown as follows:

With traditional (non-serverless) applications, developers commonly create a development environment on their local machine. This local development environment keeps parity with the staging and production environments. It allows developers to test their application locally end-to-end before committing code to the main branch.

Serverless developer workflow

Part 2: the business logic, explains how serverless applications use managed services that abstract away the need for developers to patch and scale their application infrastructure. This means that the code base in a serverless application is focused purely on business logic, allowing managed services to handle other important layers such as:

  • Authorization
  • Presentation
  • Database
  • Application integration
  • Notification

A good serverless developer workflow enables developers to test and iterate on business logic quickly. It allows them to check that the business logic runs correctly with the managed services that compose an application.

To achieve this, the best approach is not to try and emulate managed services on your local development machine. Instead, your local code should interact directly with real cloud services in a sandboxed AWS account.

This approach lets you rapidly test and iterate on business logic locally, deploying to the development environment to test for infrastructure, security, and environment configuration changes. Once the business logic is ready in the development environment, it can be deployed to other environments (test, staging, production) via CI/CD automation or manually triggered commands.

The following sections explain how I test business logic locally using a custom-written test harness. Each time I create a Lambda function I create a directory to hold:

  1. The function code.
  2. A relative package.json.
  3. A file called testharness.js.

The test harness file is used to run the Lambda function code on my local development machine. It is configured to mock environment variables loaded from a file named `env.json` and loads a JSON test event payload located in the events directory.

Testing Lambda function code locally with a test harness

Part 2: the business logic, explains the anatomy of a Lambda function and its handler:

A small Lambda function

Note that the function handler receives an input payload called an event object. To test the local function code effectively, use a test event object that represents the production event object.

The serverless application introduced in getting started with serverless part 1, shows that Amazon API Gateway invokes the Lambda function.

This invocation contains an event object with a JSON representation of the HTTP request. The event object has a defined structure. Follow the steps in this GitHub repository to see how to create a test event object.

Before you start

To deploy this stage of the application, follow the steps from post 1 to clone and deploy the sample application.

  1. Run the following commands from the root directory of the cloned repository:
    cd ./part_4/src_starred
    npm install

The following steps show how I configure my testharness.js file to run my function code:

// Mock event
const event = require('../events/testEvent.json')
// Mock environment variables
const environmentVars = require('../env.json')
process.env.AWS_REGION = environmentVars.AWS_REGION
process.env.localTest = true
process.env.slackEndpoint= environmentVars.slackEndpoint
process.env.bucket = environmentVars.bucket
// Lambda handler
const { handler } = require('./app')
const main = async () => {
  console.time('localTest')
  console.dir(await handler(event))
  console.timeEnd('localTest')
}
main().catch(error => console.error(error))
  1. A test event object is loaded into a variable called event.
  2. The environment variables required by the Lambda function are defined in env.json and loaded.
  3. The Lambda function code is loaded into a variable called handler
  4. The Lambda function code is run synchronously
  5. The console shows output from the Lambda function code, along with any errors that occur.

I run my test harness file by entering the following command in a terminal window:

$ node testharness.js

This produces the following output:

The output indicates that the function code ran without error, it returned a 200 status code and completed in 30.999 ms.

To generate an error in the function code,  I change the app.js file by commenting out the following line:

//const axios = require('axios');

I save the file and run the test harness again. I see the following response in the terminal window:

f

This indicates an error in my function code that I must resolve before deploying to my AWS account.

By iteratively updating and locally testing my code, I maintain a fast inner loop. This eliminates the need to deploy to the AWS Cloud each time I want to test a code change.

Testing against cloud resources

In many instances, a Lambda function interacts with other cloud resources. This could be via an SDK or some other native integration. In this case, you should deploy those resources to a sandboxed AWS developer account.

In the following example, I update a Lambda function to log each inbound HTTP request to a bucket in Amazon S3, a highly scalable object storage service running in the AWS cloud. To do this, I use the JavaScript SDK:

s3.putObject(params, function(err, data)

I update the AWS Serverless Application Model (AWS SAM) template to define a new S3 bucket:

SrcBucket:
Type: AWS::S3::Bucket

I change into the part_4 directory then build and deploy the application with the following commands:

cd ../part_4
sam build
sam deploy --guided --config-file ../samconfig.toml

After deploying, the output shows:

I copy the new bucket value to the environment variable defined in in /part_4/env.json .

"slackEndpoint": "Insert_Slack_Endpoint",
"bucket" : "Insert_S3_Bucket_Name"
}

Now I am ready to test the local Lambda function code against cloud resources in my sandbox AWS development account. I run a new local test with the following command:

node testHarness.js

The terminal returns:

This indicates that the Lambda function code completed without error. I can verify this by checking the contents of the S3 bucket using the AWS Command Line Interface (AWS CLI):

aws s3 ls s3://githubtoslackapp-srcbucket-ge4wkt9dljwa

This returns the following, confirming that the request object has been saved to S3 and the application code is running correctly:

Conclusion

Using managed services to build serverless applications helps developers focus on business logic. It also changes the developer workflow compared with building traditional (non-serverless) applications.

A good serverless developer workflow enables developers to test and iterate on business logic quickly while still being able to interact with cloud services. This blog post shows how I achieve this by using a test harness to run function code locally and deploying application resources to a sandboxed developer account.

In the next blog post, I show how to invoke Lambda functions deployed to sandboxed developer account, without leaving your IDE. This lets you test for infrastructure, security, and environment configuration changes while building.

Analyzing Freshdesk data using Amazon EventBridge and Amazon Athena

Post Syndicated from Benjamin Smith original https://aws.amazon.com/blogs/compute/analyzing-freshdesk-data-using-amazon-eventbridge-and-amazon-athena/

This post is written by Shashi Shankar, Application Architect, Shared Delivery Teams

Freshdesk is an omnichannel customer service platform by Freshworks. It provides automation services to help speed up customer support processes.

The Freshworks connector to Amazon EventBridge allows real time streaming of Freshdesk events with minimal configuration and setup. This integration provides real-time insights into customer support operations without the operational overhead of provisioning and maintaining any servers.

In this blog post, I walk through a serverless approach to ingest and analyze Freshdesk data. This solution uses EventBridge, Amazon Kinesis Data Firehose, Amazon S3, and Amazon Athena. I also look at examples of customer service questions that can be answered using this approach.

The following diagram shows a high-level architecture of the proposed solution:

  1. When a Freshdesk ticket is updated or created, the Freshworks connector pushes event data to the Amazon EventBridge partner event bus.
  2. A rule on the partner event bus pushes the event data to Kinesis Data Firehose.
  3. Kinesis Data Firehose batches data before sending to S3. An AWS Lambda function transforms the data by adding a new line to each record before sending.
  4. Kinesis Data Firehose delivers the batch of records to S3.
  5. Athena is used to query relevant data from S3 using standard SQL.

The walkthrough shows you how to:

  1. Add the EventBridge app to Freshdesk account.
  2. Configure a Freshworks partner event bus in EventBridge.
  3. Deploy a Kinesis Data Firehose stream, a Lambda function, and an S3 bucket.
  4. Set up a custom rule on the event bus to push data to Kinesis Data Firehose.
  5. Generate sample Freshdesk data to validate the ingestion process.
  6. Set up a table in Athena to query the S3 bucket.
  7. Query and analyze data

Pre-requisites

  • A Freshdesk account (which can be created here).
  • An AWS account.
  • AWS Serverless Application Model (AWS SAM CLI), installed and configured.

Adding the Amazon EventBridge app to a Freshdesk account

  1. Log in to your Freshdesk account and navigate to Admin Helpdesk Productivity Apps. Search for EventBridge:
  2. Choose the Amazon EventBridge icon and choose Install.
  • Enter your AWS account number in the AWS Account ID field.
  • Enter “OnTicketCreate”, “OnTicketUpdate” in the Events field.
  • Enter the AWS Region to send the Freshdesk events in the Region field. This walkthrough uses the us-east-1 Region.

Configuring a Freshworks partner event bus in EventBridge

Once previous step is completed, a partner event source is automatically created in the EventBridge console. Copy the partner event source name to a clipboard.

  1. Clone the GitHub repo and deploy the AWS SAM template:
    git clone https://github.com/aws-samples/amazon-eventbridge-freshdesk-example.git
    cd ./amazon-eventbridge-freshdesk-example
    sam deploy --guided
  2. PartnerEventSource – Enter partner event source name copied from the previous step.
  3. S3BucketName – Enter an S3 bucket name to store Freshdesk ticket event data.

The AWS SAM template creates an association between the partner event source and event bus:

    Type: AWS::Events::EventBus
    Properties:
      EventSourceName: !Ref PartnerEventSource
      Name: !Ref PartnerEventSource

The template creates a Kinesis Data Firehose delivery stream, Lambda function, and S3 bucket to process and store the events from Freshdesk tickets. It also adds a rule to the custom event bus with the Kinesis Data Firehose stream as the target:

  PushToFirehoseRule:
    Type: "AWS::Events::Rule"
    Properties:
      Description: Test Freshdesk Events Rule
      EventBusName: !Ref PartnerEventSource
      EventPattern:
        account: [!Ref AWS::AccountId]
      Name: freshdeskeventrule
      State: ENABLED
      Targets:
        - Arn:
            Fn::GetAtt:
              - "FirehoseDeliveryStream"
              - "Arn"
          Id: "idfreshdeskeventrule"
          RoleArn: !GetAtt EventRuleTargetIamRole.Arn

  EventRuleTargetIamRole:
    Type: AWS::IAM::Role
    Properties:
      AssumeRolePolicyDocument:
        Version: "2012-10-17"
        Statement:
          - Sid: ""
            Effect: "Allow"
            Principal:
              Service:
                - "events.amazonaws.com"
            Action:
              - "sts:AssumeRole"
      Path: "/"
      Policies:
        - PolicyName: Invoke_Firehose
          PolicyDocument:
            Version: "2012-10-17"
            Statement:
              - Effect: "Allow"
                Action:
                  - "firehose:PutRecord"
                  - "firehose:PutRecordBatch"
                Resource:
                  - !GetAtt FirehoseDeliveryStream.Arn

Generating sample Freshdesk data to validate the ingestion process:

To generate sample Freshdesk data, login to the Freshdesk account and browse to the “Tickets” screen as shown:

Follow the steps to simulate two customer service operations:

  1. To create a ticket of type “Refund”. Choose the New button and enter the details:
  2. Update an existing ticket and change the priority to “Urgent”.
  3. Within a few minutes of updating the ticket, the data is pushed via the Freshworks connector to the S3 bucket created using the AWS SAM template. To verify this, browse to the S3 bucket and see that a new object with the ticket data is created:

You can also use the S3 Select option under object actions to view the raw JSON data that is sent from the partner system. You are now ready to analyze the data using Athena.

Setting up a table in Athena to query the S3 bucket

If you are familiar with Apache Hive, you may find creating tables on Athena helpful. You can create tables by writing the DDL statement in the query editor or by using the wizard or JDBC driver. To create a table in Athena:

  1. Copy and paste the following DDL statement in the Athena query editor to create a Freshdesk’s events table. For this example, the table is created in the default database.
  2. Replace S3_Bucket_Name in the following query with the name of the S3 bucket created by deploying the previous AWS SAM template:
CREATE EXTERNAL TABLE ` freshdeskevents`(
  `id` string COMMENT 'from deserializer', 
  `detail-type` string COMMENT 'from deserializer', 
  `source` string COMMENT 'from deserializer', 
  `account` string COMMENT 'from deserializer', 
  `time` string COMMENT 'from deserializer', 
  `region` string COMMENT 'from deserializer', 
  `detail` struct<ticket:struct<subject:string,description:string,is_description_truncated:boolean,description_text:string,is_description_text_truncated:boolean,due_by:string,fr_due_by:string,fr_escalated:boolean,is_escalated:boolean,fwd_emails:array<string>,reply_cc_emails:array<string>,email_config_id:string,id:int,group_id:bigint,product_id:string,company_id:string,requester_id:bigint,responder_id:bigint,status:int,priority:int,type:string,tags:array<string>,spam:boolean,source:int,tweet_id:string,cc_emails:array<string>,to_emails:string,created_at:string,updated_at:string,attachments:array<string>,custom_fields:string,changes:struct<responder_id:array<bigint>,ticket_type:array<string>,status:array<int>,status_details:array<struct<id:int,name:string>>,group_id:array<bigint>>>,requester:struct<id:bigint,name:string,email:string,mobile:string,phone:string,language:string,created_at:string>> COMMENT 'from deserializer')
ROW FORMAT SERDE 
  'org.openx.data.jsonserde.JsonSerDe' 
WITH SERDEPROPERTIES ( 
  'paths'='account,detail,detail-type,id,region,resources,source,time,version') 
STORED AS INPUTFORMAT 
  'org.apache.hadoop.mapred.TextInputFormat' 
OUTPUTFORMAT 
  'org.apache.hadoop.hive.ql.io.HiveIgnoreKeyTextOutputFormat'
LOCATION  's3://S3_Bucket_Name/'

The table is created on the data stored in S3 and is ready to be queried. Note that table freshdeskevents points at the bucket s3://S3_Bucket_Name/. As more data is added to the bucket, the table automatically grows, providing a near-real-time data analysis experience.

Querying and analyzing data

You can use the following examples to get started with querying the Athena table.

  1. To get all the events data, run:
SELECT * FROM default.freshdeskevents  limit 10

The preceding output has a detail column containing the details related to the ticket. Tickets can be filtered on nested notations to build more insightful queries. Also, the detail-type column provides classification of tickets as new (onTicketCreate) vs updated (onTicketUpdate).

  1. To show new tickets created today with the type “Refund”:
SELECT detail.ticket.subject,detail.ticket.description_text, detail.ticket.type  FROM default.freshdeskevents
where detail.ticket.type = 'Refund' and "detail-type" = 'onTicketCreate' and date(from_iso8601_timestamp(time)) = date(current_date)
  1. All tickets with an “Urgent” priority but not assigned to an agent:
SELECT "detail-type", detail.ticket.responder_id,detail.ticket.priority, detail.ticket.subject, detail.ticket.type  FROM default.freshdeskevents
where detail.ticket.responder_id is null and detail.ticket.priority = 4

Conclusion

In this blog post, you learn how to configure Freshworks partner event source from the Freshdesk console. Once a partner event source is configured, an AWS SAM template is deployed that creates a custom event bus by attaching the partner event source. A Kinesis Data Firehose, Lambda function, and S3 bucket is used to ingest Freshdesk’s ticket events data for analysis. An EventBridge rule is configured to route the event data to the S3 bucket.

Once event data starts flowing into the S3 bucket, an Amazon Athena table is created to run queries and analyze the ticket events data. Alternative customer service data analysis use cases can be built on the architecture shown in this blog.

To learn more about other partner integrations and the native capabilities of EventBridge, visit the AWS Compute Blog.

Node.js 14.x runtime now available in AWS Lambda

Post Syndicated from Benjamin Smith original https://aws.amazon.com/blogs/compute/node-js-14-x-runtime-now-available-in-aws-lambda/

You can now develop AWS Lambda functions using the Node.js 14.x runtime. This is the current Long Term Support (LTS) version of Node.js. Start using this new version today by specifying a runtime parameter value of nodejs14.x when creating or updating functions or by using the appropriate managed runtime base image.

Language Updates

Node.js 14 is a stable release and brings several new features, including:

  • Updated V8 engine
  • Diagnostic reporting
  • Updated Node streams

V8 engine updated To V8.1

Node.js 14.x is powered by V8 version 8.1, which is a significant upgrade from the V8 7.4 engine powering the previous Node.js 12.x. This upgrade brings performance enhancements and some notable new features:

  • Nullish Coalescing ?? A logical operator that returns its right-hand side operand when its left-hand side operand is not defined or null.
    const newVersion = null ?? ‘this works great’ ;
    console.log(newVersion);
    // expected output: "this works great"
    
    const nullishTest = 0 ?? 36;
    console.log(nullishTest);
    // expected output: 0 because 0 is not the same as null or undefined

This new operator is useful for debugging and error handling in your Lambda functions when values unexpectedly return null or undefined.

  • Intl.DateTimeFormat – This feature enables numberingSystem and calendar options.
    const newVersion = null ?? ‘this works great’ ;
    console.log(newVersion);
    // expected output: "this works great"
    
    const nullishTest = 0 ?? 36;
    console.log(nullishTest);
    // expected output: 0 because 0 is not the same as null or undefined
  • Intl.DisplayNames – Offers the consistent translation of region, language, and script display names.
    const date = new Date(Date.UTC(2021, 01, 20, 3, 23, 16, 738));
    // Results below assume UTC timezone - your results may vary
    
    // Specify date formatting for language
    console.log(new Intl.DateTimeFormat('en-US').format(date));
    // expected output: "2/20/2021"
  • Optional Chaining ?. – Use this operator to access a property’s value within a chain without needing to validate each reference. This removes the requirement of checking for the existence of a deeply nested property using the && operator or lodash.get:
    const player = {
      name: 'Roxie',
      superpower: {
        value: 'flight',
      }
    };
    
    // Using the && operator
    if (player && player.superpower && player.superpower.value) {
      // do something with player.superpower.value
    }
    
    // Using the ?. operator
    if (player?.superpower?.value) {
      // do something with player.superpower.value
    }
    

Diagnostic reporting

Diagnostic reporting is now a stable feature in Node.js 14. This option allows you to generate a JSON-formatted report on demand or when certain events occur. This helps to diagnose problems such as slow performance, memory leaks, unexpected errors, and more.

The following example generates a report from within a Lambda function, and outputs the results to Amazon Cloudwatch for further inspection.

const report = process.report.getReport();
console.log(typeof report === 'object'); // true

// Similar to process.report.writeReport() output
console.log(JSON.stringify(report, null, 2));

See the official docs on diagnostic reporting in Node.js to learn other ways to use the command.

Updated node streams

The streams APIs has been updated to help remove ambiguity and streamline behaviours across the various parts of Node.js core.

Runtime Updates

To help keep Lambda functions secure, AWS updates Node.js 14 with all minor updates released by the Node.js community when using the zip archive format. For Lambda functions packaged as a container image, pull, rebuild and deploy the latest base image from DockerHub or Amazon ECR Public.

Deprecation schedule

AWS will be deprecating Node.js 10 according to the end of life schedule provided by the community. Node.js 10 reaches end of life on April 30, 2021. After March 30, 2021 you can no longer create a Node.js 10 Lambda function. The ability to update a function will be disabled after May 28, 2021 . More information on can be found in the runtime support policy.

You can migrate Existing Node.js 12 functions to the new runtime by making any necessary changes to code for compatibility with Node.js 14, and changing the function’s runtime configuration to “nodejs14.x”. Lambda functions running on Node.js 14 will have 2 full years of support.

Amazon Linux 2

Node.js 14 managed runtime, like Node.js 12, Java 11, and Python 3.8, is based on an Amazon Linux 2 execution environment. Amazon Linux 2 provides a secure, stable, and high-performance execution environment to develop and run cloud and enterprise applications.

Next steps

Get started building with Node.js 14 today by specifying a runtime parameter value of nodejs14.x when creating your Lambda functions using the zip archive packaging format. You can also build Lambda functions in Node.js 14 by deploying your function code as a container image using the Node.js 14 AWS base image for Lambda. You can read about the Node.js programming model in the AWS Lambda documentation to learn more about writing functions in Node.js 14.

For existing Node.js functions, migrate to the new runtime by changing the function’s runtime configuration to nodejs14.x

Happy coding with Node.js 14!

Building PHP Lambda functions with Docker container images

Post Syndicated from Benjamin Smith original https://aws.amazon.com/blogs/compute/building-php-lambda-functions-with-docker-container-images/

At re:Invent 2020, AWS announced that you can package and deploy AWS Lambda functions as container images. Packaging AWS Lambda functions as container images brings some notable benefits for developers running custom runtimes, such as PHP. This blog post explains those benefits and shows how to use the new container image support for Lambda functions to build serverless PHP applications.

Overview

Many PHP developers are familiar with building applications as containers to create a portable artifact for easier deployment. Packaging applications as containers helps to maintain consistent PHP versions, package versions, and configurations settings across multiple environments.

The new container image support for Lambda allows you to use familiar container tooling to build your applications. It also allows you to transition your applications into a serverless event-driven model. This brings the benefits of having no infrastructure to manage, automated scalability and a pay-per-use billing.

The advantages of an event-driven model for PHP applications are explained across the blog series “The serverless LAMP stack”. It explores the concepts, methods, and reasons for creating serverless applications with PHP. The architectural patterns and service limits in this blog series apply to functions packaged using both container image and zip archive formats, with some key exceptions:

Zip archive Container image
Maximum package size 250 MB 10 GB
Lambda layers Supported Include in image
Lambda Extensions Supported Include in image

Custom runtimes with container images

For custom runtimes such as PHP, Lambda provides base images containing the required Amazon Linux or Amazon Linux 2 operating system. Extend this to include your own runtime by implementing the Lambda Runtime API in a bootstrap file.

Before container image support for Lambda, a custom runtime is packaged using the .zip format. This required the developer to:

  1. Set up an Amazon Linux environment compatible with the Lambda execution environment.
  2. Install compilation dependencies and compile a version of PHP.
  3. Save the compiled PHP binary together with a bootstrap file and package as a .zip.
  4. Publish the .zip as a runtime layer.
  5. Add the runtime layer to a Lambda function.

Any edits to the custom runtime such as new packages, PHP versions, modules, or dependences require the process to be repeated. This process can be time consuming and prone to error.

Creating a custom PHP runtime using the new container image support for Lambda can simplify changing the runtime environment. Dockerfiles allow you to have a fully scripted, faster, and portable build process without setting up an Amazon Linux environment.

This GitHub repository contains a custom PHP runtime for Lambda functions packaged as a container image. The following Dockerfile uses the base image for Amazon Linux provided by AWS. The instructions perform the following:

  • Install system-wide Linux packages (zip, curl, tar).
  • Download and compile PHP.
  • Download and install composer dependency manager and dependencies.
  • Move PHP binaries, bootstrap, and vendor dependencies into a directory that Lambda can read from.
  • Set the container entrypoint.
#Lambda base image Amazon Linux
FROM public.ecr.aws/lambda/provided as builder 
# Set desired PHP Version
ARG php_version="7.3.6"
RUN yum clean all && \
    yum install -y autoconf \
                bison \
                bzip2-devel \
                gcc \
                gcc-c++ \
                git \
                gzip \
                libcurl-devel \
                libxml2-devel \
                make \
                openssl-devel \
                tar \
                unzip \
                zip

# Download the PHP source, compile, and install both PHP and Composer
RUN curl -sL https://github.com/php/php-src/archive/php-${php_version}.tar.gz | tar -xvz && \
    cd php-src-php-${php_version} && \
    ./buildconf --force && \
    ./configure --prefix=/opt/php-7-bin/ --with-openssl --with-curl --with-zlib --without-pear --enable-bcmath --with-bz2 --enable-mbstring --with-mysqli && \
    make -j 5 && \
    make install && \
    /opt/php-7-bin/bin/php -v && \
    curl -sS https://getcomposer.org/installer | /opt/php-7-bin/bin/php -- --install-dir=/opt/php-7-bin/bin/ --filename=composer

# Prepare runtime files
# RUN mkdir -p /lambda-php-runtime/bin && \
    # cp /opt/php-7-bin/bin/php /lambda-php-runtime/bin/php
COPY runtime/bootstrap /lambda-php-runtime/
RUN chmod 0755 /lambda-php-runtime/bootstrap

# Install Guzzle, prepare vendor files
RUN mkdir /lambda-php-vendor && \
    cd /lambda-php-vendor && \
    /opt/php-7-bin/bin/php /opt/php-7-bin/bin/composer require guzzlehttp/guzzle

###### Create runtime image ######
FROM public.ecr.aws/lambda/provided as runtime
# Layer 1: PHP Binaries
COPY --from=builder /opt/php-7-bin /var/lang
# Layer 2: Runtime Interface Client
COPY --from=builder /lambda-php-runtime /var/runtime
# Layer 3: Vendor
COPY --from=builder /lambda-php-vendor/vendor /opt/vendor

COPY src/ /var/task/

CMD [ "index" ]

To deploy this Lambda function, follow the instructions in the GitHub repository.

All runtime-related instructions are saved in the Dockerfile, which makes the custom runtime simpler to manage, update, and test. You can add additional Linux packages by appending to the yum install command. To install alternative PHP versions, change the php_version argument. Import additional PHP modules by adding to the compile command.

View the complete application in the following file tree:

project/
┣ runtime/
┃ ┗ bootstrap
┣ src/
┃ ┗ index.php
┗ Dockerfile

The Lambda function code is stored in the src directory in a file named index.php. This contains the Lambda function handler “index()”.

A bootstrap file is in the ‘runtime’ directory. This uses the Lambda runtime API to communicate with the Lambda execution environment.

The shebang hash sequence at the beginning of the bootstrap script instructs Lambda to run the file with the PHP executable, set by the Dockerfile.

All environment variables used in the bootstrap are set by the Lambda execution environment when running in the AWS Cloud. When running locally, the Lambda Runtime Interface Emulator (RIE) sets these values.

#!/var/lang/bin/php

Testing locally with the Lambda RIE

Using container image support for Lambda makes it easier for PHP developers to test Lambda functions locally. The previous container image example builds from the Lambda base image provided by AWS. This base image contains the Lambda RIE.

This is a proxy for Lambda’s Runtime and Extensions APIs. It acts as a lightweight web server that converts HTTP requests to JSON events and maintains functional parity with the Lambda Runtime API in the AWS Cloud. This allows developers to test functions locally using familiar tools such as cURL and the Docker CLI.

  1. Build the previous custom runtime image using the Docker build command:
    docker build -t phpmyfuntion .
  2. Run the function locally using the Docker run command, bound to port 9000:
    docker run -p 9000:8080 phpmyfuntion:latest
  3. This command starts up a local endpoint at:
    localhost:9000/2015-03-31/functions/function/invocations
  4. Post an event to this endpoint using a curl command. The Lambda function payload is provided by using the -d flag. This is a valid Json object required by the Runtime Interface Emulator:
    curl "http://localhost:9000/2015-03-31/functions/function/invocations" -d '{"queryStringParameters": {"name":"Ben"}}'
  5. A 200 status response is returned:

Building web applications with Bref container images

Bref is an open source runtime Lambda layer for PHP. Using the bref-fpm layer, you can build applications with traditional PHP frameworks such as Symfony and Laravel. Bref’s implementation of the FastCGI protocol returns an HTTP response instead of a JSON response. When using the zip archive format to package Lambda functions, Bref’s custom runtime is provided to the function as a Lambda layer. Functions packaged as container images do not support adding Lambda layers to the function configuration. In addition to runtime layers, Bref also provides a number of Docker images. These images use the Lambda runtime API to form a runtime interface client that communicates with the Lambda execution environment.

The following example shows how to compose a Dockerfile that uses the bref php-74-fpm container image:

# Uses PHP 74-fpm.0, as the base image
FROM bref/php-74-fpm
# download composer for dependency management
RUN curl -s https://getcomposer.org/installer | php
# install bref using composer
RUN php composer.phar require bref/bref
# copy the project files into a Location that the Lambda service can read from
COPY . /var/task
#set the function handler entry point
CMD _HANDLER=index.php /opt/bootstrap
  1. The first line sets the base image to use bref/php-74-fpm.
  2. Composer, a dependency manager for PHP is installed.
  3. Composer’s require command is used to add the bref package to the composer.json file.
  4. The project files are then copied into the /var/task directory, where the function code runs from.
  5. The function handler is set along with Bref’s bootstrap file.

The steps to build and deploy this image to the Amazon Elastic Container Registry are the same for any runtime, and explained in this announcement blog post.

Conclusion

The new container image support for Lambda functions allows developers to package Lambda functions of up to 10 GB in size. Using the container image format and a Dockerfile can make it easier to build and update functions with custom runtimes such as PHP.

Developers can include specific language versions, modules, and package dependencies. The Amazon Linux and Amazon Linux 2 base images give developers a starting point to customize the runtime. With the Lambda Runtime Interface Emulator, it’s simpler for developers to test Lambda functions locally. PHP developers can use existing third-party images, such as bref-fpm, to create web applications in a single Lambda function.

Visit serverlessland.com for more information on building serverless PHP applications.

New Synchronous Express Workflows for AWS Step Functions

Post Syndicated from Benjamin Smith original https://aws.amazon.com/blogs/compute/new-synchronous-express-workflows-for-aws-step-functions/

Today, AWS is introducing Synchronous Express Workflows for AWS Step Functions. This is a new way to run Express Workflows to orchestrate AWS services at high-throughput.

Developers have been using asynchronous Express Workflows since December 2019 for workloads that require higher event rates and shorter durations. Customers were looking for ways to receive an immediate response from their Express Workflows without having to write additional code or introduce additional services.

What’s new?

Synchronous Express Workflows allow developers to quickly receive the workflow response without needing to poll additional services or build a custom solution. This is useful for high-volume microservice orchestration and fast compute tasks that communicate via HTTPS.

Getting started

You can build and run Synchronous Express Workflows using the AWS Management Console, the AWS Serverless Application Model (AWS SAM), the AWS Cloud Development Kit (AWS CDK), AWS CLI, or AWS CloudFormation.

To create Synchronous Express Workflows from the AWS Management Console:

  1. Navigate to the Step Functions console and choose Create State machine.
  2. Choose Author with code snippets. Choose Express.
    This generates a sample workflow definition that you can change once the workflow is created.
  3. Choose Next, then choose Create state machine. It may take a moment for the workflow to deploy.

Starting Synchronous Express Workflows

When starting an Express Workflow, a new Type parameter is required. To start a synchronous workflow from the AWS Management Console:

  1. Navigate to the Step Functions console.
  2. Choose an Express Workflow from the list.
  3. Choose Start execution.

    Here you have an option to run the Express Workflow as a synchronous or asynchronous type.
  4. Choose Synchronous and choose Start execution.

  5. Expand Details in the results message to view the output.

Monitoring, logging and tracing

Enable logging to inspect and debug Synchronous Express Workflows. All execution history is sent to CloudWatch Logs. Use the Monitoring and Logging tabs in the Step Functions console to gain visibility into Express Workflow executions.

The Monitoring tab shows six graphs with CloudWatch metrics for Execution Errors, Execution Succeeded, Execution Duration, Billed Duration, Billed Memory, and Executions Started. The Logging tab shows recent logs and the logging configuration, with a link to CloudWatch Logs.

Enable X-Ray tracing to view trace maps and timelines of the underlying components that make up a workflow. This helps to discover performance issues, detect permission problems, and track requests made to and from other AWS services.

Creating an example workflow

The following example uses Amazon API Gateway HTTP APIs to start an Express Workflow synchronously. The workflow analyses web form submissions for negative sentiment. It generates a case reference number and saves the data in an Amazon DynamoDB table. The workflow returns the case reference number and message sentiment score.

  1. The API endpoint is generated by an API Gateway HTTP APIs. A POST request is made to the API which invokes the workflow. It contains the contact form’s message body.
  2. The message sentiment is analyzed by Amazon Comprehend.
  3. The Lambda function generates a case reference number, which is recorded in the DynamoDB table.
  4. The workflow choice state branches based on the detected sentiment.
  5. If a negative sentiment is detected, a notification is sent to an administrator via Amazon Simple Email Service (SES).
  6. When the workflow completes, it returns a ticketID to API Gateway.
  7. API Gateway returns the ticketID in the API response.

The code for this application can be found in this GitHub repository. Three important files define the application and its resources:

Deploying the application

Clone the GitHub repository and deploy with the AWS SAM CLI:

$ git clone https://github.com/aws-samples/contact-form-processing-with-synchronous-express-workflows.git
$ cd contact-form-processing-with-synchronous-express-workflows 
$ sam build 
$ sam deploy -g

This deploys 12 resources, including a Synchronous Express Workflow, three Lambda functions, an API Gateway HTTP API endpoint, and all the AWS Identity & Access Management (IAM) roles and permissions required for the application to run.

Note the HTTP APIs endpoint and workflow ARN outputs.

Testing Synchronous Express Workflows:

A new StartSyncExecution AWS CLI command is used to run the synchronous Express Workflow:

aws stepfunctions start-sync-execution \
--state-machine-arn <your-workflow-arn> \
--input "{\"message\" : \"This is bad service\"}"

The response is received once the workflow completes. It contains the workflow output (sentiment and ticketid), the executionARN, and some execution metadata.

Starting the workflow from HTTP API Gateway:

The application deploys an API Gateway HTTP API, with a Step Functions integration. This is configured in the api.yaml file. It starts the state machine with the POST body provided as the input payload.

Trigger the workflow with a POST request, using the API HTTP API endpoint generated from the deploy step. Enter the following CURL command into the terminal:

curl --location --request POST '<YOUR-HTTP-API-ENDPOINT>' \
--header 'Content-Type: application/json' \
--data-raw '{"message":" This is bad service"}'

The POST request returns a 200 status response. The output field of the response contains the sentiment results (negative) and the generated ticketId (jc4t8i).

Putting it all together

You can use this application to power a web form backend to help expedite customer complaints. In the following example, a frontend application submits form data via an AJAX POST request. The application waits for the response, and presents the user with a message appropriate to the detected sentiment, and a case reference number.

If a negative sentiment is returned in the API response, the user is informed of their case number:

Setting IAM permissions

Before a user or service can start a Synchronous Express Workflow, it must be granted permission to perform the states:StartSyncExecution API operation. This is a new state-machine level permission. Existing Express Workflows can be run synchronously once the correct IAM permissions for StartSyncExecution are granted.

The example application applies this to a policy within the HttpApiRole in the AWS SAM template. This role is added to the HTTP API integration within the api.yaml file.

Conclusion

Step Functions Synchronous Express Workflows allow developers to receive a workflow response without having to poll additional services. This helps developers orchestrate microservices without needing to write additional code to handle errors, retries, and run parallel tasks. They can be invoked in response to events such as HTTP requests via API Gateway, from a parent state machine, or by calling the StartSyncExecution API action.

This feature is available in all Regions where AWS Step Functions is available. View the AWS Regions table to learn more.

For more serverless learning resources, visit Serverless Land.

Introducing Amazon API Gateway service integration for AWS Step Functions

Post Syndicated from Benjamin Smith original https://aws.amazon.com/blogs/compute/introducing-amazon-api-gateway-service-integration-for-aws-step-functions/

AWS Step Functions now integrates with Amazon API Gateway to enable backend orchestration with minimal code and built-in error handling.

API Gateway is a fully managed service that makes it easy for developers to create, publish, maintain, monitor, and secure APIs at any scale. These APIs enable applications to access data, business logic, or functionality from your backend services.

Step Functions allows you to build resilient serverless orchestration workflows with AWS services such as AWS Lambda, Amazon SNS, Amazon DynamoDB, and more. AWS Step Functions integrates with a number of services natively. Using Amazon States Language (ASL), you can coordinate these services directly from a task state.

What’s new?

The new Step Functions integration with API Gateway provides an additional resource type, arn:aws:states:::apigateway:invoke and can be used with both Standard and Express workflows. It allows customers to call API Gateway REST APIs and API Gateway HTTP APIs directly from a workflow, using one of two integration patterns:

  1. Request-Response: calling a service and let Step Functions progress to the next state immediately after it receives an HTTP response. This pattern is supported by Standard and Express Workflows.
  2. Wait-for-Callback: calling a service with a task token and have Step Functions wait until that token is returned with a payload. This pattern is supported by Standard Workflows.

The new integration is configured with the following Amazon States Language parameter fields:

  • ApiEndpoint: The API root endpoint.
  • Path: The API resource path.
  • Method: The HTTP request method.
  • HTTP headers: Custom HTTP headers.
  • RequestBody: The body for the API request.
  • Stage: The API Gateway deployment stage.
  • AuthType: The authentication type.

Refer to the documentation for more information on API Gateway fields and concepts.

Getting started

The API Gateway integration with Step Functions is configured using AWS Serverless Application Model (AWS SAM), the AWS Command Line Interface (AWS CLI), AWS CloudFormation or from within the AWS Management Console.

To get started with Step Functions and API Gateway using the AWS Management Console:

  1. Go to the Step Functions page of the AWS Management Console.
  2. Choose Run a sample project and choose Make a call to API Gateway.The Definition section shows the ASL that makes up the example workflow. The following example shows the new API Gateway resource and its parameters:
  3. Review example Definition, then choose Next.
  4. Choose Deploy resources.

This deploys a Step Functions standard workflow and a REST API with a /pets resource containing a GET and a POST method. It also deploys an IAM role with the required permissions to invoke the API endpoint from Step Functions.

The RequestBody field lets you customize the API’s request input. This can be a static input or a dynamic input taken from the workflow payload.

Running the workflow

  1. Choose the newly created state machine from the Step Functions page of the AWS Management Console
  2. Choose Start execution.
  3. Paste the following JSON into the input field:
    {
      "NewPet": {
        "type": "turtle",
        "price": 74.99
      }
    }
  4. Choose Start execution
  5. Choose the Retrieve Pet Store Data step, then choose the Step output tab.

This shows the successful responseBody output from the “Add to pet store” POST request and the response from the “Retrieve Pet Store Data” GET request.

Access control

The API Gateway integration supports AWS Identity and Access Management (IAM) authentication and authorization. This includes IAM roles, policies, and tags.

AWS IAM roles and policies offer flexible and robust access controls that can be applied to an entire API or individual methods. This controls who can create, manage, or invoke your REST API or HTTP API.

Tag-based access control allows you to set more fine-grained access control for all API Gateway resources. Specify tag key-value pairs to categorize API Gateway resources by purpose, owner, or other criteria. This can be used to manage access for both REST APIs and HTTP APIs.

API Gateway resource policies are JSON policy documents that control whether a specified principal (typically an IAM user or role) can invoke the API. Resource policies can be used to grant access to a REST API via AWS Step Functions. This could be for users in a different AWS account or only for specified source IP address ranges or CIDR blocks.

To configure access control for the API Gateway integration, set the AuthType parameter to one of the following:

  1. {“AuthType””: “NO_AUTH”}
    Call the API directly without any authorization. This is the default setting.
  2. {“AuthType””: “IAM_ROLE”}
    Step Functions assumes the state machine execution role and signs the request with credentials using Signature Version 4.
  3. {“AuthType””: “RESOURCE_POLICY”}
    Step Functions signs the request with the service principal and calls the API endpoint.

Orchestrating microservices

Customers are already using Step Functions’ built in failure handling, decision branching, and parallel processing to orchestrate application backends. Development teams are using API Gateway to manage access to their backend microservices. This helps to standardize request, response formats and decouple business logic from routing logic. It reduces complexity by allowing developers to offload responsibilities of authentication, throttling, load balancing and more. The new API Gateway integration enables developers to build robust workflows using API Gateway endpoints to orchestrate microservices. These microservices can be serverless or container-based.

The following example shows how to orchestrate a microservice with Step Functions using API Gateway to access AWS services. The example code for this application can be found in this GitHub repository.

To run the application:

  1. Clone the GitHub repository:
    $ git clone https://github.com/aws-samples/example-step-functions-integration-api-gateway.git
    $ cd example-step-functions-integration-api-gateway
  2. Deploy the application using AWS SAM CLI, accepting all the default parameter inputs:
    $ sam build && sam deploy -g

    This deploys 17 resources including a Step Functions standard workflow, an API Gateway REST API with three resource endpoints, 3 Lambda functions, and a DynamoDB table. Make a note of the StockTradingStateMachineArn value. You can find this in the command line output or in the Applications section of the AWS Lambda Console:


  3. Manually trigger the workflow from a terminal window:
    aws stepFunctions start-execution \
    --state-machine-arn <StockTradingStateMachineArnValue>

The response looks like:


When the workflow is run, a Lambda function is invoked via a GET request from API Gateway to the /check resource. This returns a random stock value between 1 and 100. This value is evaluated in the Buy or Sell choice step, depending on if it is less or more than 50. The Sell and Buy states use the API Gateway integration to invoke a Lambda function, with a POST method. A stock_value is provided in the POST request body. A transaction_result is returned in the ResponseBody and provided to the next state. The final state writes a log of the transition to a DynamoDB table.

Defining the resource with an AWS SAM template

The Step Functions resource is defined in this AWS SAM template. The DefinitionSubstitutions field is used to pass template parameters to the workflow definition.

StockTradingStateMachine:
    Type: AWS::Serverless::StateMachine # More info about State Machine Resource: https://docs.aws.amazon.com/serverless-application-model/latest/developerguide/sam-resource-statemachine.html
    Properties:
      DefinitionUri: statemachine/stock_trader.asl.json
      DefinitionSubstitutions:
        StockCheckPath: !Ref CheckPath
        StockSellPath: !Ref SellPath
        StockBuyPath: !Ref BuyPath
        APIEndPoint: !Sub "${ServerlessRestApi}.execute-api.${AWS::Region}.amazonaws.com"
        DDBPutItem: !Sub arn:${AWS::Partition}:states:::dynamodb:putItem
        DDBTable: !Ref TransactionTable

The workflow is defined on a separate file (/statemachine/stock_trader.asl.json).

The following code block defines the Check Stock Value state. The new resource, arn:aws:states:::apigateway:invoke declares the API Gateway service integration type.

The parameters object holds the required fields to configure the service integration. The Path and ApiEndpoint values are provided by the DefinitionsSubstitutions field in the AWS SAM template. The RequestBody input is defined dynamically using Amazon States Language. The .$ at the end of the field name RequestBody specifies that the parameter use a path to reference a JSON node in the input.

"Check Stock Value": {
  "Type": "Task",
  "Resource": "arn:aws:states:::apigateway:invoke",
  "Parameters": {
      "ApiEndpoint":"${APIEndPoint}",
      "Method":"GET",
      "Stage":"Prod",
      "Path":"${StockCheckPath}",
      "RequestBody.$":"$",
      "AuthType":"NO_AUTH"
  },
  "Retry": [
      {
          "ErrorEquals": [
              "States.TaskFailed"
          ],
          "IntervalSeconds": 15,
          "MaxAttempts": 5,
          "BackoffRate": 1.5
      }
  ],
  "Next": "Buy or Sell?"
},

The deployment process validates the ApiEndpoint value. The service integration builds the API endpoint URL from the information provided in the parameters block in the format https://[APIendpoint]/[Stage]/[Path].

Conclusion

The Step Functions integration with API Gateway provides customers with the ability to call REST APIs and HTTP APIs directly from a Step Functions workflow.

Step Functions’ built in error handling helps developers reduce code and decouple business logic. Developers can combine this with API Gateway to offload responsibilities of authentication, throttling, load balancing and more. This enables developers to orchestrate microservices deployed on containers or Lambda functions via API Gateway without managing infrastructure.

This feature is available in all Regions where both AWS Step Functions and Amazon API Gateway are available. View the AWS Regions table to learn more. For pricing information, see Step Functions pricing. Normal service limits of API Gateway and service limits of Step Functions apply.

For more serverless learning resources, visit Serverless Land.

Building Serverless Land: Part 2 – An auto-building static site

Post Syndicated from Benjamin Smith original https://aws.amazon.com/blogs/compute/building-serverless-land-part-2-an-auto-building-static-site/

In this two-part blog series, I show how serverlessland.com is built. This is a static website that brings together all the latest blogs, videos, and training for AWS serverless. It automatically aggregates content from a number of sources. The content exists in a static JSON file, which generates a new static site each time it is updated. The result is a low-maintenance, low-latency serverless website, with almost limitless scalability.

A companion blog post explains how to build an automated content aggregation workflow to create and update the site’s content. In this post, you learn how to build a static website with an automated deployment pipeline that re-builds on each GitHub commit. The site content is stored in JSON files in the same repository as the code base. The example code can be found in this GitHub repository.

The growing adoption of serverless technologies generates increasing amounts of helpful and insightful content from the developer community. This content can be difficult to discover. Serverless Land helps channel this into a single searchable location. By collating this into a static website, users can enjoy a browsing experience with fast page load speeds.

The serverless nature of the site means that developers don’t need to manage infrastructure or scalability. The use of AWS Amplify Console to automatically deploy directly from GitHub enables a regular release cadence with a fast transition from prototype to production.

Static websites

A static site is served to the user’s web browser exactly as stored. This contrasts to dynamic webpages, which are generated by a web application. Static websites often provide improved performance for end users and have fewer or no dependant systems, such as databases or application servers. They may also be more cost-effective and secure than dynamic websites by using cloud storage, instead of a hosted environment.

A static site generator is a tool that generates a static website from a website’s configuration and content. Content can come from a headless content management system, through a REST API, or from data referenced within the website’s file system. The output of a static site generator is a set of static files that form the website.

Serverless Land uses a static site generator for Vue.js called Nuxt.js. Each time content is updated, Nuxt.js regenerates the static site, building the HTML for each page route and storing it in a file.

The architecture

Serverless Land static website architecture

When the content.json file is committed to GitHub, a new build process is triggered in AWS Amplify Console.

Deploying AWS Amplify

AWS Amplify helps developers to build secure and scalable full stack cloud applications. AWS Amplify Console is a tool within Amplify that provides a user interface with a git-based workflow for hosting static sites. Deploy applications by connecting to an existing repository (GitHub, BitBucket Cloud, GitLab, and AWS CodeCommit) to set up a fully managed, nearly continuous deployment pipeline.

This means that any changes committed to the repository trigger the pipeline to build, test, and deploy the changes to the target environment. It also provides instant content delivery network (CDN) cache invalidation, atomic deploys, password protection, and redirects without the need to manage any servers.

Building the static website

  1. To get started, use the Nuxt.js scaffolding tool to deploy a boiler plate application. Make sure you have npx installed (npx is shipped by default with npm version 5.2.0 and above).
    $ npx create-nuxt-app content-aggregator

    The scaffolding tool asks some questions, answer as follows:Nuxt.js scaffolding tool inputs

  2. Navigate to the project directory and launch it with:
    $ cd content-aggregator
    $ npm run dev

    The application is now running on http://localhost:3000.The pages directory contains your application views and routes. Nuxt.js reads the .vue files inside this directory and automatically creates the router configuration.

  3. Create a new file in the /pages directory named blogs.vue:$ touch pages/blogs.vue
  4. Copy the contents of this file into pages/blogs.vue.
  5. Create a new file in /components directory named Post.vue :$ touch components/Post.vue
  6. Copy the contents of this file into components/Post.vue.
  7. Create a new file in /assets named content.json and copy the contents of this file into it.$ touch /assets/content.json

The blogs Vue component

The blogs page is a Vue component with some special attributes and functions added to make development of your application easier. The following code imports the content.json file into the variable blogPosts. This file stores the static website’s array of aggregated blog post content.

import blogPosts from '../assets/content.json'

An array named blogPosts is initialized:

data(){
    return{
      blogPosts: []
    }
  },

The array is then loaded with the contents of content.json.

 mounted(){
    this.blogPosts = blogPosts
  },

In the component template, the v-for directive renders a list of post items based on the blogPosts array. It requires a special syntax in the form of blog in blogPosts, where blogPosts is the source data array and blog is an alias for the array element being iterated on. The Post component is rendered for each iteration. Since components have isolated scopes of their own, a :post prop is used to pass the iterated data into the Post component:

<ul>
  <li v-for="blog in blogPosts" :key="blog">
     <Post :post="blog" />
  </li>
</ul>

The post data is then displayed by the following template in components/Post.vue.

<template>
    <div class="hello">
      <h3>{{ post.title }} </h3>
      <div class="img-holder">
          <img :src="post.image" />
      </div>
      <p>{{ post.intro }} </p>
      <p>Published on {{post.date}}, by {{ post.author }} p>
      <a :href="post.link"> Read article</a>
    </div>
</template>

This forms the framework for the static website. The /blogs page displays content from /assets/content.json via the Post component. To view this, go to http://localhost:3000/blogs in your browser:

The /blogs page

Add a new item to the content.json file and rebuild the static website to display new posts on the blogs page. The previous content was generated using the aggregation workflow explained in this companion blog post.

Connect to Amplify Console

Clone the web application to a GitHub repository and connect it to Amplify Console to automate the rebuild and deployment process:

  1. Upload the code to a new GitHub repository named ‘content-aggregator’.
  2. In the AWS Management Console, go to the Amplify Console and choose Connect app.
  3. Choose GitHub then Continue.
  4. Authorize to your GitHub account, then in the Recently updated repositories drop-down select the ‘content-aggregator’ repository.
  5. In the Branch field, leave the default as master and choose Next.
  6. In the Build and test settings choose edit.
  7. Replace - npm run build with – npm run generate.
  8. Replace baseDirectory: / with baseDirectory: dist

    This runs the nuxt generate command each time an application build process is triggered. The nuxt.config.js file has a target property with the value of static set. This generates the web application into static files. Nuxt.js creates a dist directory with everything inside ready to be deployed on a static hosting service.
  9. Choose Save then Next.
  10. Review the Repository details and App settings are correct. Choose Save and deploy.

    Amplify Console deployment

Once the deployment process has completed and is verified, choose the URL generated by Amplify Console. Append /blogs to the URL, to see the static website blogs page.

Any edits pushed to the repository’s content.json file trigger a new deployment in Amplify Console that regenerates the static website. This companion blog post explains how to set up an automated content aggregator to add new items to the content.json file from an RSS feed.

Conclusion

This blog post shows how to create a static website with vue.js using the nuxt.js static site generator. The site’s content is generated from a single JSON file, stored in the site’s assets directory. It is automatically deployed and re-generated by Amplify Console each time a new commit is pushed to the GitHub repository. By automating updates to the content.json file you can create low-maintenance, low-latency static websites with almost limitless scalability.

This application framework is used together with this automated content aggregator to pull together articles for http://serverlessland.com. Serverless Land brings together all the latest blogs, videos, and training for AWS Serverless. Download the code from this GitHub repository to start building your own automated content aggregation platform.

Building Serverless Land: Part 1 – Automating content aggregation

Post Syndicated from Benjamin Smith original https://aws.amazon.com/blogs/compute/building-serverless-land-part-1-automating-content-aggregation/

In this two part blog series, I show how serverlessland.com is built. This is a static website that brings together all the latest blogs, videos, and training for AWS Serverless. It automatically aggregates content from a number of sources. The content exists in static JSON files, which generate a new site build each time they are updated. The result is a low-maintenance, low-latency serverless website, with almost limitless scalability.

This blog post explains how to automate the aggregation of content from multiple RSS feeds into a JSON file stored in GitHub. This workflow uses AWS Lambda and AWS Step Functions, triggered by Amazon EventBridge. The application can be downloaded and deployed from this GitHub repository.

The growing adoption of serverless technologies generates increasing amounts of helpful and insightful content from the developer community. This content can be difficult to discover. Serverless Land helps channel this into a single searchable location. By automating the collection of this content with scheduled serverless workflows, the process robustly scales to near infinite numbers. The Step Functions MAP state allows for dynamic parallel processing of multiple content sources, without the need to alter code. On-boarding a new content source is as fast and simple as making a single CLI command.

The architecture

Automating content aggregation with AWS Step Functions

The application consists of six Lambda functions orchestrated by a Step Functions workflow:

  1. The workflow is triggered every 2 hours by an EventBridge scheduler. The schedule event passes an RSS feed URL to the workflow.
  2. The first task invokes a Lambda function that runs an HTTP GET request to the RSS feed. It returns an array of recent blog URLs. The array of blog URLs is provided as the input to a MAP state. The MAP state type makes it possible to run a set of steps for each element of an input array in parallel. The number of items in the array can be different for each execution. This is referred to as dynamic parallelism.
  3. The next task invokes a Lambda function that uses the GitHub REST API to retrieve the static website’s JSON content file.
  4. The first Lambda function in the MAP state runs an HTTP GET request to the blog post URL provided in the payload. The URL is scraped for content and an object containing detailed metadata about the blog post is returned in the response.
  5. The blog post metadata is compared against the website’s JSON content file in GitHub.
  6. A CHOICE state determines if the blog post metadata has already been committed to the repository.
  7. If the blog post is new, it is added to an array of “content to commit”.
  8. As the workflow exits the MAP state, the results are passed to the final Lambda function. This uses a single git commit to add each blog post object to the website’s JSON content file in GitHub. This triggers an event that rebuilds the static site.

Using Secrets in AWS Lambda

Two of the Lambda functions require a GitHub personal access token to commit files to a repository. Sensitive credentials or secrets such as this should be stored separate to the function code. Use AWS Systems Manager Parameter Store to store the personal access token as an encrypted string. The AWS Serverless Application Model (AWS SAM) template grants each Lambda function permission to access and decrypt the string in order to use it.

  1. Follow these steps to create a personal access token that grants permission to update files to repositories in your GitHub account.
  2. Use the AWS Command Line Interface (AWS CLI) to create a new parameter named GitHubAPIKey:
aws ssm put-parameter \
--name /GitHubAPIKey \
--value ReplaceThisWithYourGitHubAPIKey \
--type SecureString

{
    "Version": 1,
    "Tier": "Standard"
}

Deploying the application

  1. Fork this GitHub repository to your GitHub Account.
  2. Clone the forked repository to your local machine and deploy the application using AWS SAM.
  3. In a terminal, enter:
    git clone https://github.com/aws-samples/content-aggregator-example
    sam deploy -g
  4. Enter the required parameters when prompted.

This deploys the application defined in the AWS SAM template file (template.yaml).

The business logic

Each Lambda function is written in Node.js and is stored inside a directory that contains the package dependencies in a `node_modules` folder. These are defined for each function by its relative package.json file. The function dependencies are bundled and deployed using the sam build && deploy -g command.

The GetRepoContents and WriteToGitHub Lambda functions use the octokit/rest.js library to communicate with GitHub. The library authenticates to GitHub by using the GitHub API key held in Parameter Store. The AWS SDK for Node.js is used to obtain the API key from Parameter Store. With a single synchronous call, it retrieves and decrypts the parameter value. This is then used to authenticate to GitHub.

const AWS = require('aws-sdk');
const SSM = new AWS.SSM();


//get Github API Key and Authenticate
    const singleParam = { Name: '/GitHubAPIKey ',WithDecryption: true };
    const GITHUB_ACCESS_TOKEN = await SSM.getParameter(singleParam).promise();
    const octokit = await  new Octokit({
      auth: GITHUB_ACCESS_TOKEN.Parameter.Value,
    })

Lambda environment variables are used to store non-sensitive key value data such as the repository name and JSON file location. These can be entered when deploying with AWS SAM guided deploy command.

Environment:
        Variables:
          GitHubRepo: !Ref GitHubRepo
          JSONFile: !Ref JSONFile

The GetRepoContents function makes a synchronous HTTP request to the GitHub repository to retrieve the contents of the website’s JSON file. The response SHA and file contents are returned from the Lambda function and acts as the input to the next task in the Step Functions workflow. This SHA is used in final step of the workflow to save all new blog posts in a single commit.

Map state iterations

The MAP state runs concurrently for each element in the input array (each blog post URL).

Each iteration must compare a blog post URL to the existing JSON content file and decide whether to ignore the post. To do this, the MAP state requires both the input array of blog post URLs and the existing JSON file contents. The ItemsPath, ResultPath, and Parameters are used to achieve this:

  • The ItemsPath sets input array path to $.RSSBlogs.body.
  • The ResultPath states that the output of the branches is placed in $.mapResults.
  • The Parameters block replaces the input to the iterations with a JSON node. This contains both the current item data from the context object ($$.Map.Item.Value) and the contents of the GitHub JSON file ($.RepoBlogs).
"Type":"Map",
    "InputPath": "$",
    "ItemsPath": "$.RSSBlogs.body",
    "ResultPath": "$.mapResults",
    "Parameters": {
        "BlogUrl.$": "$$.Map.Item.Value",
        "RepoBlogs.$": "$.RepoBlogs"
     },
    "MaxConcurrency": 0,
    "Iterator": {
       "StartAt": "getMeta",

The Step Functions resource

The AWS SAM template uses the following Step Functions resource definition to create a Step Functions state machine:

  MyStateMachine:
    Type: AWS::Serverless::StateMachine
    Properties:
      DefinitionUri: statemachine/my_state_machine.asl.JSON
      DefinitionSubstitutions:
        GetBlogPostArn: !GetAtt GetBlogPost.Arn
        GetUrlsArn: !GetAtt GetUrls.Arn
        WriteToGitHubArn: !GetAtt WriteToGitHub.Arn
        CompareAgainstRepoArn: !GetAtt CompareAgainstRepo.Arn
        GetRepoContentsArn: !GetAtt GetRepoContents.Arn
        AddToListArn: !GetAtt AddToList.Arn
      Role: !GetAtt StateMachineRole.Arn

The actual workflow definition is defined in a separate file (statemachine/my_state_machine.asl.JSON). The DefinitionSubstitutions property specifies mappings for placeholder variables. This enables the template to inject Lambda function ARNs obtained by the GetAtt intrinsic function during template translation:

Step Functions mappings with placeholder variables

A state machine execution role is defined within the AWS SAM template. It grants the `Lambda invoke function` action. This is tightly scoped to the six Lambda functions that are used in the workflow. It is the minimum set of permissions required for the Step Functions to carry out its task. Additional permissions can be granted as necessary, which follows the zero-trust security model.

Action: lambda:InvokeFunction
Resource:
- !GetAtt GetBlogPost.Arn
- !GetAtt GetUrls.Arn
- !GetAtt CompareAgainstRepo.Arn
- !GetAtt WriteToGitHub.Arn
- !GetAtt AddToList.Arn
- !GetAtt GetRepoContents.Arn

The Step Functions workflow definition is authored using the AWS Toolkit for Visual Studio Code. The Step Functions support allows developers to quickly generate workflow definitions from selectable examples. The render tool and automatic linting can help you debug and understand the workflow during development. Read more about the toolkit in this launch post.

Scheduling events and adding new feeds

The AWS SAM template creates a new EventBridge rule on the default event bus. This rule is scheduled to invoke the Step Functions workflow every 2 hours. A valid JSON string containing an RSS feed URL is sent as the input payload. The feed URL is obtained from a template parameter and can be set on deployment. The AWS Compute Blog is set as the default feed URL. To aggregate additional blog feeds, create a new rule to invoke the Step Functions workflow. Provide the RSS feed URL as valid JSON input string in the following format:

{“feedUrl”:”replace-this-with-your-rss-url”}

ScheduledEventRule:
    Type: "AWS::Events::Rule"
    Properties:
      Description: "Scheduled event to trigger Step Functions state machine"
      ScheduleExpression: rate(2 hours)
      State: "ENABLED"
      Targets:
        -
          Arn: !Ref MyStateMachine
          Id: !GetAtt MyStateMachine.Name
          RoleArn: !GetAtt ScheduledEventIAMRole.Arn
          Input: !Sub
            - >
              {
                "feedUrl" : "${RssFeedUrl}"
              }
            - RssFeedUrl: !Ref RSSFeed

A completed workflow with step output

Conclusion

This blog post shows how to automate the aggregation of content from multiple RSS feeds into a single JSON file using serverless workflows.

The Step Functions MAP state allows for dynamic parallel processing of each item. The recent increase in state payload size limit means that the contents of the static JSON file can be held within the workflow context. The application decision logic is separated from the business logic and events.

Lambda functions are scoped to finite business logic with Step Functions states managing decision logic and iterations. EventBridge is used to manage the inbound business events. The zero-trust security model is followed with minimum permissions granted to each service and Parameter Store used to hold encrypted secrets.

This application is used to pull together articles for http://serverlessland.com. Serverless land brings together all the latest blogs, videos, and training for AWS Serverless. Download the code from this GitHub repository to start building your own automated content aggregation platform.

The serverless LAMP stack part 6: From MVC to serverless microservices

Post Syndicated from Benjamin Smith original https://aws.amazon.com/blogs/compute/the-serverless-lamp-stack-part-6-from-mvc-to-serverless-microservices/

In this post, you learn how to build serverless PHP applications using microservices.

I show how to move from using a single Lambda function as scalable web host with an MVC framework, to a decoupled microservice model. The accompanying code examples for this blog post can be found in this GitHub repository.

The MVC architectural pattern

A traditional LAMP stack often implements the Model-View-Controller (MVC) architecture. This is a well-established way of separating application logic into three parts: the model, the view, and the controller.

  • Model: This part is responsible for managing the data of the application. Its role is to retrieve raw information from the database or receive user input from the controller.
  • View: This component focuses on the display. Data received from the model is presented to the user. Any response from the user is also recognized and sent to the controller component.
  • Controller: This part is responsible for the application logic. It responds to the user input and performs interactions on the data model objects.

The MVC principal of decoupling data, logic, and presentation layers means that changes in one layer have minimal impact on the others. This speeds the development process and makes it easier to update layouts, change business rules, and add new features. Components are more adaptable for reuse and refactoring, and allow for a degree of simultaneous development.

The serverless LAMP stack

The serverless LAMP stack

The preceding serverless LAMP stack architecture is first discussed in this post. A web application is split in to two components. A single AWS Lambda function contains the application’s MVC framework. Each response is synchronously returned via Amazon API Gateway. This architecture addresses the scalability challenge that is often seen in traditional LAMP stack applications. It scales automatically with a managed infrastructure and a pay-per-use billing model. However, the serverless paradigm makes it possible to apply the MVC principles of decoupling and reusability to an even greater degree.

The “Lambda-lith”

The preceding architecture represents a serverless monolith or “Lambda-lith”. A single Lambda function contains the entire business logic within an MVC framework. This implementation can be used to “lift and shift” from a legacy MVC to a serverless application. Simple applications often start this way too, but as the application grows more complex over time new challenges can occur.


day1-day100

Lambda Day 1 to day 100

A Lambda-lith is often maintained in a single repository that contains the entire application logic. This is sometimes referred to as a mono-repo.

Lamba-lith monorepo

Lamba-lith monorepo

A mono-repo makes it harder to separate responsibility of ownership between development teams. Consequently, projects in a mono-repo are prone to depend on each other, creating tight coupling. The tightly coupled code base with all of its interconnected modules be challenging to maintain a regular release cadence. Any small fix can require updates to other parts of the code base, making maintenance challenging without fracturing the whole application. Onboarding can be slow as new developers take time to learn and understand the code base and all of the interdependencies.

By applying the following principles, Lambda-lith MVC applications can be refactored into decoupled serverless microservices.

Divide into independent Lambda functions with finite business logic

The following example illustrates a Lambda-lith with all business and routing logic stored in a single Lambda function. Every request is routed to this function from API Gateway. The function code base contains a `router.php` file to direct requests to the correct model, view, or controller.

This is similar to a traditional LAMP stack implementation in which a web server such as Apache or NGINX routes all requests to a single index.php function. However, it’s often more practical to split applications into multiple functions or services.

Lambda as a web server

In the following example, this Lambda function is split into multiple functions based on each CRUD operation. The internal routing logic is now decoupled from the business logic. The API Gateway service uses rules to route requests to the correct Lambda function. This allows each function to scale independently and updates can be made to one function without impacting another.

Routing decoupled from business logic

Build micro-perimeters to enforce strict verification of every person or service.

Traditional MVC applications often use a castle-and-moat security model. This provides security by placing a perimeter around the entire application to protect it from malicious actors. This perimeter guards the application or network by verifying requests and user identities at the point of entry or exit.

This is typically achieved with firewalls, proxy servers, honeypots, and other intrusion prevention tools. It assumes that activity inside the perimeter is safe. However, a network vulnerability may provide access to everything inside.

Microservice-based applications allow developers to apply a “zero trust” security model. This enables developers to build micro-perimeters around each resource. This is sometimes referred to as the principle of least privilege. It ensures that each request, service, or user can access only the data or resource that is necessary for its legitimate purpose. Even with a vulnerability, the blast radius is limited only to the service within that micro-perimeter.

Castle-and-moat vs zero trust security model

Use AWS Identity and Access Management (IAM) resource policies and execution roles to decouple business logic from security posture. Lambda resource policies define the events and services that are authorized to invoke the function. Lambda execution roles place constraints the resource or service the Lambda function has access to. When defining resource policies and execution roles, start with a minimum set of permissions and grant additional permissions as necessary.

Create building blocks based on common functionality

Each component is a single building block that makes up an application together with other blocks. These blocks form microservices that deliver a set of capabilities on a specific domain. This makes is easy to change, upgrade, and replace with no impact on the remaining microservice components. This creates natural ownership boundaries to help organize repositories.

Development teams can then easily be assigned ownership to individual microservice repositories. Use the AWS Serverless Application Model (AWS SAM) to organize microservices into multiple code repositories, as explained in this blog post.

Use messages to connect and communicate between microservices.

In traditional MVC applications, one part of the application uses method calls to communicate with the other parts. With serverless microservices, the code base is spread across short-lived stateless functions and services. Communication between these services is achieved using asynchronous messages or synchronous HTTP requests.

Synchronous communication

In this method, a service calls an API and waits for a response from the receiving service before proceeding. Use API Gateway to create a front door to your backend microservices. API Gateway is a fully managed service for creating and managing RESTful and WebSocket APIs.

Using API Gateway to transport data addresses common concerns such as authorization, API tokens, access control and rate limiting from your code, and helps to reduce code complexity. API Gateway can also be used for synchronous internal microservice communications where the services have clear separation, strict authentication requirements, or have been deployed across accounts.

The following architecture demonstrates an application that is deployed across two accounts. The Booking microservice, invokes a loyalty booking function via API Gateway that exists in the Loyalty points account.

Synchronous internal microservice communications

Asynchronous communication

In this pattern, a service sends a message without waiting for a response, and one or more services process the message asynchronously. Here, the services involved do not directly communicate with each other. Instead, services publish messages to a broker such as Amazon Simple Queue Service (SQS) or Amazon EventBridge. Other services can choose to subscribe to the topic in the broker that they care about. This enables further decoupling of business logic from data transportation and reduces your code complexity.

Use services instead of code, where possible

A service-first mindset is an important part of serverless application development. Each line of code you write may limit your project’s responsiveness to change and adds cognitive overhead for new developers. Using an appropriate AWS service for each domain (messaging, storage, orchestration) helps to build faster. Embracing this mind-set allows developers to focus on solving those unique challenges that add the most value to their customers.

By applying these principles to refactor an MVC Lambda-lith, I build the following CRUD API microservice. This application can be deployed from this GitHub repository. It uses an AWS Serverless Application Model (AWS SAM) template to define an HTTP API, 5 Lambda functions, an Amazon DynamoDB table and all the IAM roles required.

All routing logic and authentication is managed by Amazon API Gateway. Each Lambda function has limited scope and minimal business logic. It uses a lightweight custom-built PHP runtime, explained in this post. Each Lambda function uses the AWS PHP SDK to interact with the DynamoDB table. This architecture is suitable as a serverless microservice for a website backend.

A serverless API microservice with PHP

Conclusion

In this post, I show how to move from using a single Lambda function as a scalable web host with an MVC framework, to a decoupled microservice model. I explain the principles that can be applied to help transition an MCV application into a collection of microservices and show the benefits of doing so. I provide code examples for a serverless PHP CRUD microservice with a deployable AWS SAM template.

PHP development teams can transition from Lambda-lith MVC applications to a decoupled microservice model. This allows them to focus on shipping code to delight their customers without managing infrastructure.

Find more resources for building serverless PHP applications at ServerlessLand.com.

Introducing AWS X-Ray new integration with AWS Step Functions

Post Syndicated from Benjamin Smith original https://aws.amazon.com/blogs/compute/introducing-aws-x-ray-new-integration-with-aws-step-functions/

AWS Step Functions now integrates with AWS X-Ray to provide a comprehensive tracing experience for serverless orchestration workflows.

Step Functions allows you to build resilient serverless orchestration workflows with AWS services such as AWS Lambda, Amazon SNS, Amazon DynamoDB, and more. Step Functions provides a history of executions for a given state machine in the AWS Management Console or with Amazon CloudWatch Logs.

AWS X-Ray is a distributed tracing system that helps developers analyze and debug their applications. It traces requests as they travel through the individual services and resources that make up an application. This provides an end-to-end view of how an application is performing.

What is new?

The new Step Functions integration with X-Ray provides an additional workflow monitoring experience. Developers can now view maps and timelines of the underlying components that make up a Step Functions workflow. This helps to discover performance issues, detect permission problems, and track requests made to and from other AWS services.

The Step Functions integration with X-Ray can be analyzed in three constructs:

Service map: The service map view shows information about a Step Functions workflow and all of its downstream services. This enables developers to identify services where errors are occurring, connections with high latency, or traces for requests that are unsuccessful among the large set of services within their account. The service map aggregates data from specific time intervals from one minute through six hours and has a 30-day retention.

Trace map view: The trace map view shows in-depth information from a single trace as it moves through each service. Resources are listed in the order in which they are invoked.

Trace timeline: The trace timeline view shows the propagation of a trace through the workflow and is paired with a time scale called a latency distribution histogram. This shows how long it takes for a service to complete its requests. The trace is composed of segments and sub-segments. A segment represents the Step Functions execution. Subsegments each represent a state transition.

Getting Started

X-Ray tracing is enabled using AWS Serverless Application Model (AWS SAM), AWS CloudFormation or from within the AWS Management Console. To get started with Step Functions and X-Ray using the AWS Management Console:

  1. Go to the Step Functions page of the AWS Management Console.
  2. Choose Get Started, review the Hello World example, then choose Next.
  3. Check Enable X-Ray tracing from the Tracing section.

Workflow visibility

The following Step Functions workflow example is invoked via Amazon EventBridge when a new file is uploaded to an Amazon S3 bucket. The workflow uses Amazon Textract to detect text from an image file. It translates the text into multiple languages using Amazon Translate and saves the results into an Amazon DynamoDB table. X-Ray has been enabled for this workflow.

To view the X-Ray service map for this workflow, I choose the X-Ray trace map link at the top of the Step Functions Execution details page:

The service map is generated from trace data sent through the workflow. Toggling the Service Icons displays each individual service in this workload. The size of each node is weighted by traffic or health, depending on the selection.

This shows the error percentage and average response times for each downstream service. T/min is the number of traces sent per minute in the selected time range. The following map shows a 67% error rate for the Step Functions workflow.

Accelerated troubleshooting

By drilling down through the service map, to the individual trace map, I quickly pinpoint the error in this workflow. I choose the Step Functions service from the trace map. This opens the service details panel. I then choose View traces. The trace data shows that from a group of nine responses, 3 completed successfully and 6 completed with error. This correlates with the response times listed for each individual trace. Three traces complete in over 5 seconds, while 6 took less than 3 seconds.

Choosing one of the faster traces opens the trace timeline map. This illustrates the aggregate response time for the workflow and each of its states. It shows a state named Read text from image invoked by a Lambda Function. This takes 2.3 seconds of the workflow’s total 2.9 seconds to complete.

A warning icon indicates that an error has occurred in this Lambda function. Hovering the curser over the icon, reveals that the property “Blocks” is undefined. This shows that an error occurred within the Lambda function (no text was found within the image). The Lambda function did not have sufficient error handling to manage this error gracefully, so the workflow exited.

Here’s how that same state execution failure looks in the Step Functions Graph inspector.

Performance profiling

The visualizations provided in the service map are useful for estimating the average latency in a workflow, but issues are often indicated by statistical outliers. To help investigate these, the Response distribution graph shows a distribution of latencies for each state within a workflow, and its downstream services.

Latency is the amount of time between when a request starts and when it completes. It shows duration on the x-axis, and the percentage of requests that match each duration on the y-axis. Additional filters are applied to find traces by duration or status code. This helps to discover patterns and to identify specific cases and clients with issues at a given percentile.

Sampling

X-Ray applies a sampling algorithm to determine which requests to trace. A sampling rate of 100% is used for state machines with an execution rate of less than one per second. State machines running at a rate greater than one execution per second default to a 5% sampling rate. Configure the sampling rate to determine what percentage of traces to sample. Enable trace sampling with the AWS Command Line Interface (AWS CLI) using the CreateStateMachine and UpdateStateMachine APIs with the enable-Trace-Sampling attribute:

--enable-trace-sampling true

It can also be configured in the AWS Management Console.

Trace data retention and limits

X-Ray retains tracing data for up to 30 days with a single trace holding up to 7 days of execution data. The current minimum guaranteed trace size is 100Kb, which equates to approximately 80 state transitions.   The actual number of state transitions supported will depend on the upstream and downstream calls and duration of the workflow. When the trace size limit is reached, the trace cannot be updated with new segments or updates to existing segments. The traces that have reached the limit are indicated with a banner in the X-Ray console.

For a full service comparison of X-Ray trace data and Step Functions execution history, please refer to the documentation.

Conclusion

The Step Functions integration with X-Ray provides a single monitoring dashboard for workflows running at scale. It provides a high-level system overview of all workflow resources and the ability to drill down to view detailed timelines of workflow executions. You can now use the orchestration capabilities of Step Functions with the tracing, visualization, and debug capabilities of AWS X-Ray.

This enables developers to reduce problem resolution times by visually identifying errors in resources and viewing error rates across workflow executions. You can profile and improve application performance by identifying outliers while analyzing and debugging high latency and jitter in workflow executions.

This feature is available in all Regions where both AWS Step Functions and AWS X-Ray are available. View the AWS Regions table to learn more. For pricing information, see AWS X-Ray pricing.

To learn more about Step Functions, read the Developer Guide. For more serverless learning resources, visit https://serverlessland.com.

Jump-starting your serverless development environment

Post Syndicated from Benjamin Smith original https://aws.amazon.com/blogs/compute/jump-starting-your-serverless-development-environment/

Developers building serverless applications often wonder how they can jump-start their local development environment. This blog post provides a broad guide for those developers wanting to set up a development environment for building serverless applications.

serverless development environment

AWS and open source tools for a serverless development environment .

To use AWS Lambda and other AWS services, create and activate an AWS account.

Command line tooling

Command line tools are scripts, programs, and libraries that enable rapid application development and interactions from within a command line shell.

The AWS CLI

The AWS Command Line Interface (AWS CLI) is an open source tool that enables developers to interact with AWS services using a command line shell. In many cases, the AWS CLI increases developer velocity for building cloud resources and enables automating repetitive tasks. It is an important piece of any serverless developer’s toolkit. Follow these instructions to install and configure the AWS CLI on your operating system.

AWS enables you to build infrastructure with code. This provides a single source of truth for AWS resources. It enables development teams to use version control and create deployment pipelines for their cloud infrastructure. AWS CloudFormation provides a common language to model and provision these application resources in your cloud environment.

AWS Serverless Application Model (AWS SAM CLI)

AWS Serverless Application Model (AWS SAM) is an extension for CloudFormation that further simplifies the process of building serverless application resources.

It provides shorthand syntax to define Lambda functions, APIs, databases, and event source mappings. During deployment, the AWS SAM syntax is transformed into AWS CloudFormation syntax, enabling you to build serverless applications faster.

The AWS SAM CLI is an open source command line tool used to locally build, test, debug, and deploy serverless applications defined with AWS SAM templates.

Install AWS SAM CLI on your operating system.

Test the installation by initializing a new quick start project with the following command:

$ sam init
  1. Choose 1 for the “Quick Start Templates
  2. Choose 1 for the “Node.js runtime
  3. Use the default name.

The generated /sam-app/template.yaml contains all the resource definitions for your serverless application. This includes a Lambda function with a REST API endpoint, along with the necessary IAM permissions.

Resources:
  HelloWorldFunction:
    Type: AWS::Serverless::Function # More info about Function Resource: https://github.com/awslabs/serverless-application-model/blob/master/versions/2016-10-31.md#awsserverlessfunction
    Properties:
      CodeUri: hello-world/
      Handler: app.lambdaHandler
      Runtime: nodejs12.x
      Events:
        HelloWorld:
          Type: Api # More info about API Event Source: https://github.com/awslabs/serverless-application-model/blob/master/versions/2016-10-31.md#api
          Properties:
            Path: /hello
            Method: get

Deploy this application using the AWS SAM CLI guided deploy:

$ sam deploy -g

Local testing with AWS SAM CLI

The AWS SAM CLI requires Docker containers to simulate the AWS Lambda runtime environment on your local development environment. To test locally, install Docker Engine and run the Lambda function with following command:

$ sam local invoke "HelloWorldFunction" -e events/event.json

The first time this function is invoked, Docker downloads the lambci/lambda:nodejs12.x container image. It then invokes the Lambda function with a pre-defined event JSON file.

Helper tools

There are a number of open source tools and packages available to help you monitor, author, and optimize your Lambda-based applications. Some of the most popular tools are shown in the following list.

Template validation tooling

CloudFormation Linter is a validation tool that helps with your CloudFormation development cycle. It analyses CloudFormation YAML and JSON templates to resolve and validate intrinsic functions and resource properties. By analyzing your templates before deploying them, you can save valuable development time and build automated validation into your deployment release cycle.

Follow these instructions to install the tool.

Once, installed, run the cfn-lint command with the path to your AWS SAM template provided as the first argument:

cfn-lint template.yaml
AWS SAM template validation with cfn-lint

AWS SAM template validation with cfn-lint

The following example shows that the template is not valid because the !GettAtt function does not evaluate correctly.

IDE tooling

Use AWS IDE plugins to author and invoke Lambda functions from within your existing integrated development environment (IDE). AWS IDE toolkits are available for PyCharm, IntelliJ. Visual Studio.

The AWS Toolkit for Visual Studio Code provides an integrated experience for developing serverless applications. It enables you to invoke Lambda functions, specify function configurations, locally debug, and deploy—all conveniently from within the editor. The toolkit supports Node.js, Python, and .NET.

The AWS Toolkit for Visual Studio Code

From Visual Studio Code, choose the Extensions icon on the Activity Bar. In the Search Extensions in Marketplace box, enter AWS Toolkit and then choose AWS Toolkit for Visual Studio Code as shown in the following example. This opens a new tab in the editor showing the toolkit’s installation page. Choose the Install button in the header to add the extension.

AWS Toolkit extension for Visual Studio Code

AWS Toolkit extension for Visual Studio Code

AWS Cloud9

Another option to build a development environment without having to install anything locally is to use AWS Cloud9. AWS Cloud9 is a cloud-based integrated development environment (IDE) for writing, running, and debugging code from within the browser.

It provides a seamless experience for developing serverless applications. It has a preconfigured development environment that includes AWS CLI, AWS SAM CLI, SDKs, code libraries, and many useful plugins. AWS Cloud9 also provides an environment for locally testing and debugging AWS Lambda functions. This eliminates the need to upload your code to the Lambda console. It allows developers to iterate on code directly, saving time, and improving code quality.

Follow this guide to set up AWS Cloud9 in your AWS environment.

Advanced tooling

Efficient configuration of Lambda functions is critical when expecting optimal cost and performance of your serverless applications. Lambda allows you to control the memory (RAM) allocation for each function.

Lambda charges based on the number of function requests and the duration, the time it takes for your code to run. The price for duration depends on the amount of RAM you allocate to your function. A smaller RAM allocation may reduce the performance of your application if your function is running compute-heavy workloads. If performance needs outweigh cost, you can increase the memory allocation.

Cost and performance optimization tooling

AWS Lambda power tuner is an open source tool that uses an AWS Step Functions state machine to suggest cost and performance optimizations for your Lambda functions. It invokes a given function with multiple memory configurations. It analyzes the execution log results to determine and suggest power configurations that minimize cost and maximize performance.

To deploy the tool:

  1. Clone the repository as follows:
    $ git clone https://github.com/alexcasalboni/aws-lambda-power-tuning.git
  2. Create an Amazon S3 bucket and enter the deployment configurations in /scripts/deploy.sh:
    # config
    BUCKET_NAME=your-sam-templates-bucket
    STACK_NAME=lambda-power-tuning
    PowerValues='128,512,1024,1536,3008'
  3. Run the deploy.sh script from your terminal, this uses the AWS SAM CLI to deploy the application:
    $ bash scripts/deploy.sh
  4. Run the power tuning tool from the terminal using the AWS CLI:
    aws stepfunctions start-execution \
    --state-machine-arn arn:aws:states:us-east-1:0123456789:stateMachine:powerTuningStateMachine-Vywm3ozPB6Am \
    --input "{\"lambdaARN\": \"arn:aws:lambda:us-east-1:1234567890:function:testytest\", \"powerValues\":[128,256,512,1024,2048],\"num\":50,\"payload\":{},\"parallelInvocation\":true,\"strategy\":\"cost\"}" \
    --output json
  5. The Step Functions execution output produces a link to a visual summary of the suggested results:

    AWS Lambda power tuning results

    AWS Lambda power tuning results

Monitoring and debugging tooling

Sls-dev-tools is an open source serverless tool that delivers serverless metrics directly to the terminal. It provides developers with feedback on their serverless application’s metrics and key bindings that deploy, open, and manipulate stack resources. Bringing this data directly to your terminal or IDE, reduces context switching between the developer environment and the web interfaces. This can increase application development speed and improve user experience.

Follow these instructions to install the tool onto your development environment.

To open the tool, run the following command:

$ Sls-dev-tools

Follow the in-terminal interface to choose which stack to monitor or edit.

The following example shows how the tool can be used to invoke a Lambda function with a custom payload from within the IDE.

Invoke an AWS Lambda function with a custom payload using sls-dev-tools

Invoke an AWS Lambda function with a custom payload using sls-dev-tools

Serverless database tooling

NoSQL Workbench for Amazon DynamoDB is a GUI application for modern database development and operations. It provides a visual IDE tool for data modeling and visualization with query development features to help build serverless applications with Amazon DynamoDB tables. Define data models using one or more tables and visualize the data model to see how it works in different scenarios. Run or simulate operations and generate the code for Python, JavaScript (Node.js), or Java.

Choose the correct operating system link to download and install NoSQL Workbench on your development machine.

The following example illustrates a connection to a DynamoDB table. A data scan is built using the GUI, with Node.js code generated for inclusion in a Lambda function:

Connecting to an Amazon DynamoBD table with NoSQL Workbench for AmazonDynamoDB

Connecting to an Amazon DynamoDB table with NoSQL Workbench for Amazon DynamoDB

Generating query code with NoSQL Workbench for Amazon DynamoDB

Generating query code with NoSQL Workbench for Amazon DynamoDB

Conclusion

Building serverless applications allows developers to focus on business logic instead of managing and operating infrastructure. This is achieved by using managed services. Developers often struggle with knowing which tools, libraries, and frameworks are available to help with this new approach to building applications. This post shows tools that builders can use to create a serverless developer environment to help accelerate software development.

This list represents AWS and open source tools but does not include our APN Partners. For partner offers, check here.

Read more to start building serverless applications.