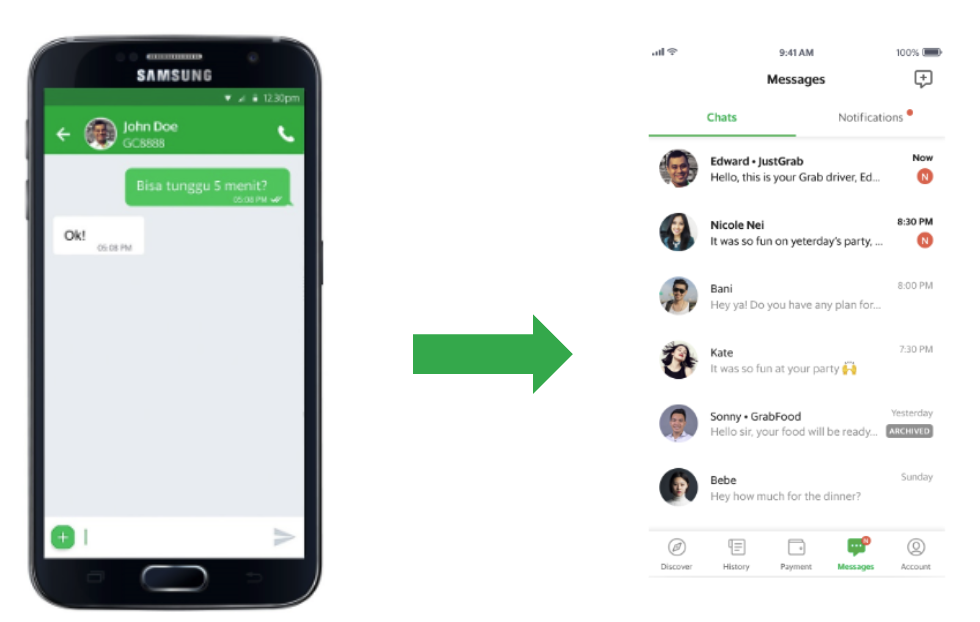
Since 2016, Grab has been using GrabChat, a built-in messaging feature to connect our users with delivery-partners or driver-partners. However, as the Grab superapp grew to include more features, the limitations of the old system became apparent. GrabChat could only handle two-party chats because that’s what it was designed to do. To make our messaging feature more extensible for future features, we decided to redesign the messaging experience, which is now called Message Center.
Migrating from the old GrabChat to the new Message Center
To some, building our own chat function might not be the ideal approach, especially with open source alternatives like Signal. However, Grab’s business requirements introduce some level of complexity, which required us to develop our own solution.
Some of these requirements include, but are not limited to:
Handle multiple user types (passengers, driver-partners, consumers, delivery-partners, customer support agents, merchant-partners, etc.) with custom user interface (UI) rendering logic and behaviour.
Enable other Grab backend services to send system generated messages (e.g. your driver is reaching) and customise push notifications.
Persist message state even if users uninstall and reinstall their apps. Users should be able to receive undelivered messages even if they were offline for hours.
Provide translation options for non-native speakers.
Filter profanities in the chat.
Allow users to handle group chats. This feature might come in handy in future if there needs to be communication between passengers, driver-partners, and delivery-partners.
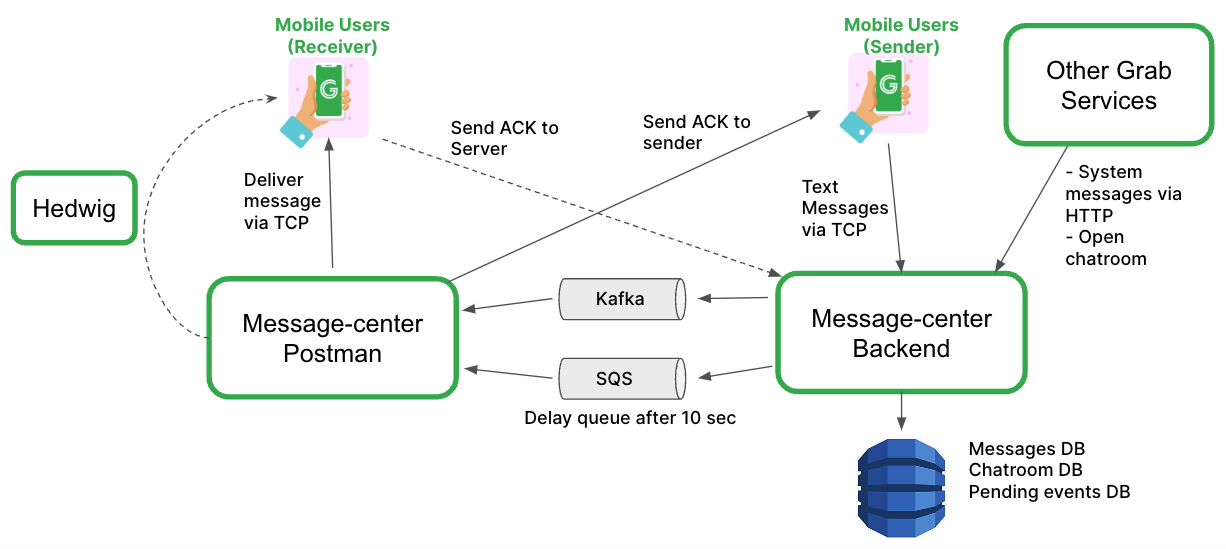
Solution architecture
Message Center architecture
The new Message Center was designed to have two components:
Message-center backend: Message processor service that handles logical and database operations.
Message-center postman: Message delivery service that can scale independently from the backend service.
This architecture allows the services to be sufficiently decoupled and scale independently. For example, if you have a group chat with N participants and each message sent results in N messages being delivered, this architecture would enable message-center postman to scale accordingly to handle the higher load.
As Grab delivers millions of events a day via the Message Center service, we need to ensure that our system can handle high throughput. As such, we are using Apache Kafka as the low-latency high-throughput event stream connecting both services and Amazon SQS as a redundant delay queue that attempts a retry 10 seconds later.
Another important aspect for this service is the ability to support low-latency and bi-directional communications from the client to the server. That’s why we chose Transmission Control Protocol (TCP) as the main protocol for client-server communication. Mobile and web clients connect to Hermes, Grab’s TCP gateway service, which then digests the TCP packets and proxies the payloads to Message Center via gRPC. If both recipients and senders are online, the message is successfully delivered in a matter of milliseconds.
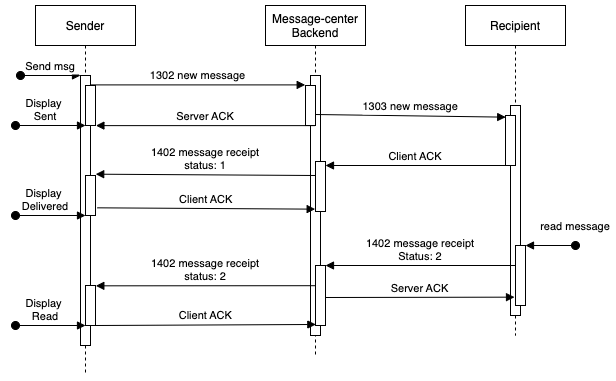
Unlike HTTP, individual TCP packets do not require a response so there is an inherent uncertainty in whether the messages were successfully delivered. Message delivery can fail due to several reasons, such as the client terminating the connection but the server’s connection remaining established. This is why we built a system of acknowledgements (ACKs) between the client and server, which ensures that every event is received by the receiving party.
The following diagram shows the high-level sequence of events when sending a message.
Events involved in sending a message on Message Center
Following the sequence of events involved in sending a message and updating its status for the sender from sending to sent to delivered to read, the process can get very complicated quickly. For example, the sender will retry the 1302 TCP new message until it receives a server ACK. Similarly, the server will also keep attempting to send the 1402 TCP message receipt or 1303 TCP message unless it receives a client ACK. With this in mind, we knew we had to give special attention to the ACK implementation, to prevent infinite retries on the client and server, which can quickly cascade to a system-wide failure.
Lastly, we also had to consider dropped TCP connections on mobile devices, which happens quite frequently. What happens then? Message Center relies on Hedwig, another in-house notification service, to send push notifications to the mobile device when it receives a failed response from Hermes. Message Center also maintains a user-events DynamoDB database, which updates the state of every pending event of the client to delivered whenever a client ACK is received.
Every time the mobile client reconnects to Hermes, it also sends a special TCP message to notify Message Center that the client is back online, and then the server retries sending all the pending events to the client.
Learnings/Conclusion
With large-scale features like Message Center, it’s important to:
Decouple services so that each microservice can function and scale as needed.
Understand our feature requirements well so that we can make the best choices and design for extensibility.
Implement safeguards to prevent system timeouts, infinite loops, or other failures from cascading to the entire system, i.e. rate limiting, message batching, and idempotent eventIDs.
Join us
Grab is the leading superapp platform in Southeast Asia, providing everyday services that matter to consumers. More than just a ride-hailing and food delivery app, Grab offers a wide range of on-demand services in the region, including mobility, food, package and grocery delivery services, mobile payments, and financial services across 428 cities in eight countries.
Powered by technology and driven by heart, our mission is to drive Southeast Asia forward by creating economic empowerment for everyone. If this mission speaks to you, join our team today!
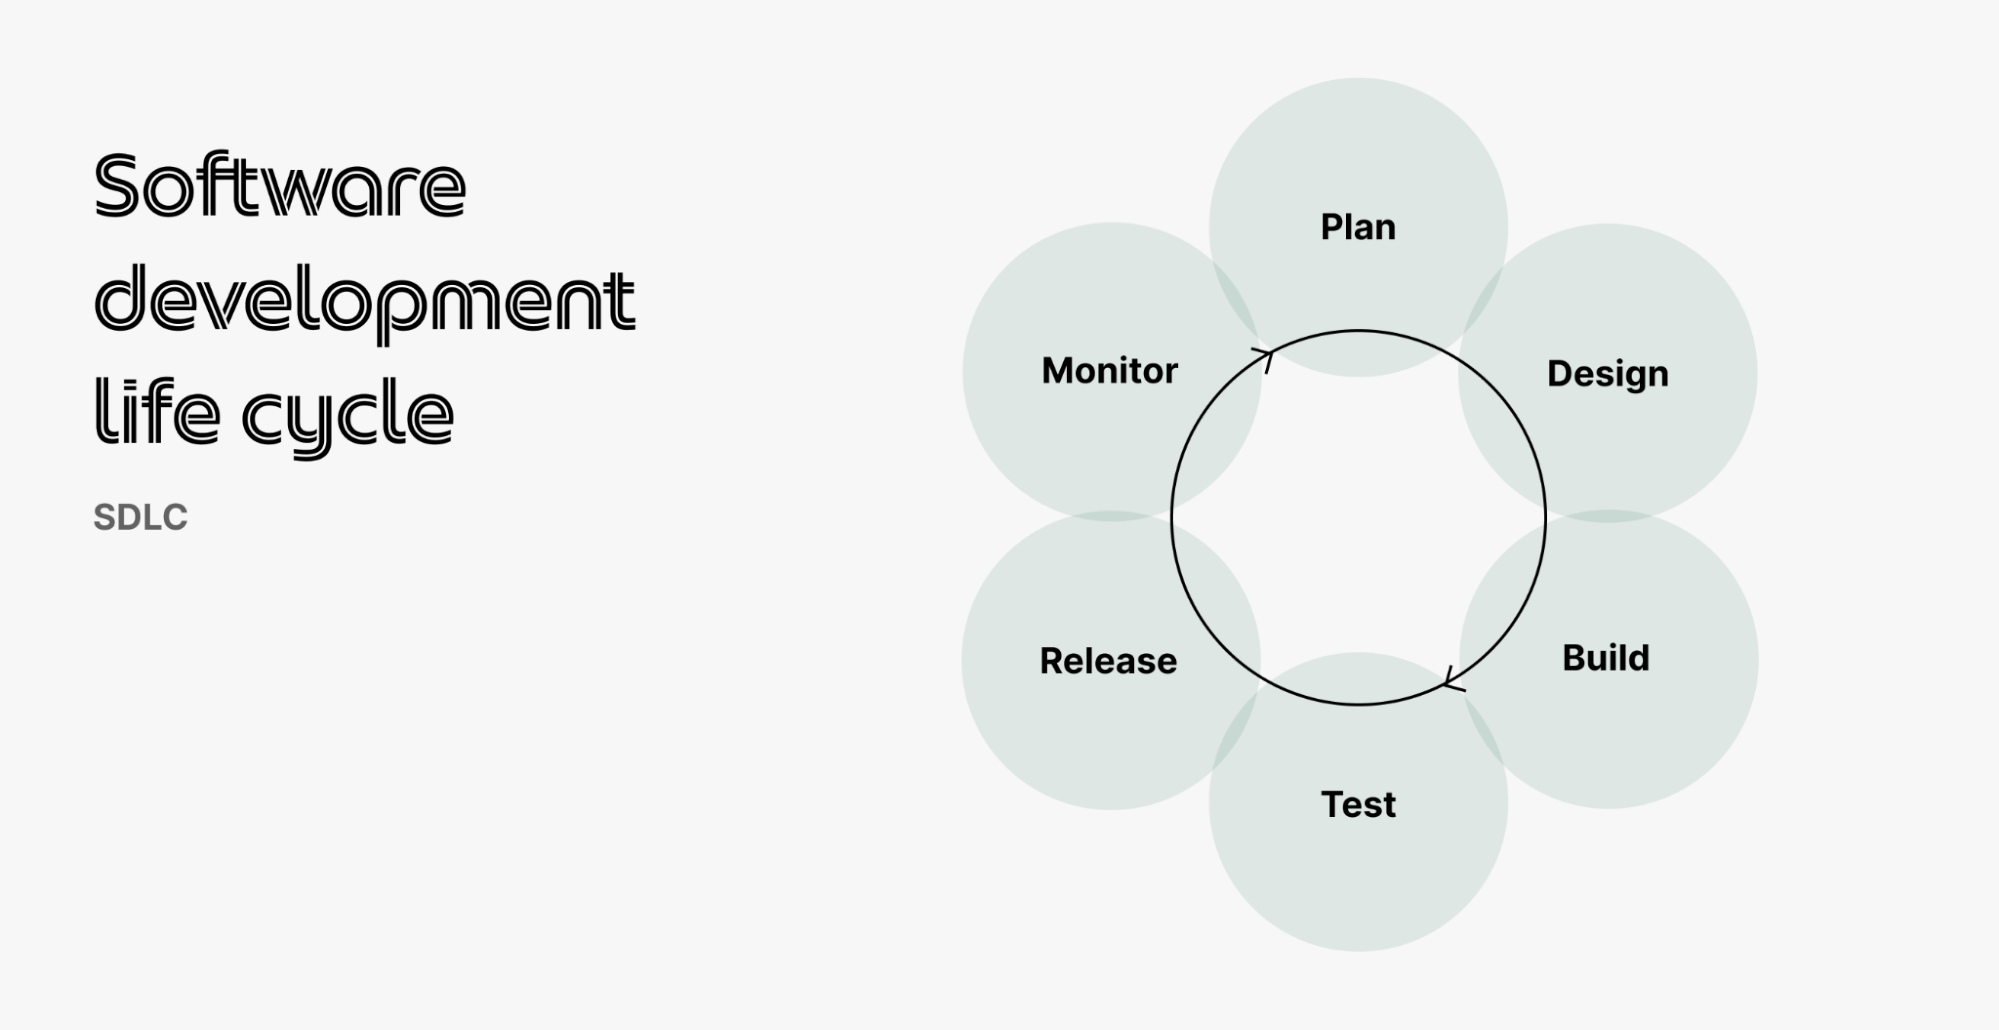
To achieve our vision of becoming the leading superapp in Southeast Asia, we constantly need to balance development velocity with maintaining the high quality of the Grab app. Like most tech companies, we started out with the traditional software development lifecycle (SDLC) but as our app evolved, we soon noticed several challenges like high feature bugs and production issues.
In this article, we dive deeper into our quality improvement journey that officially began in 2019, the challenges we faced along the way, and where we stand as of 2022.
Background
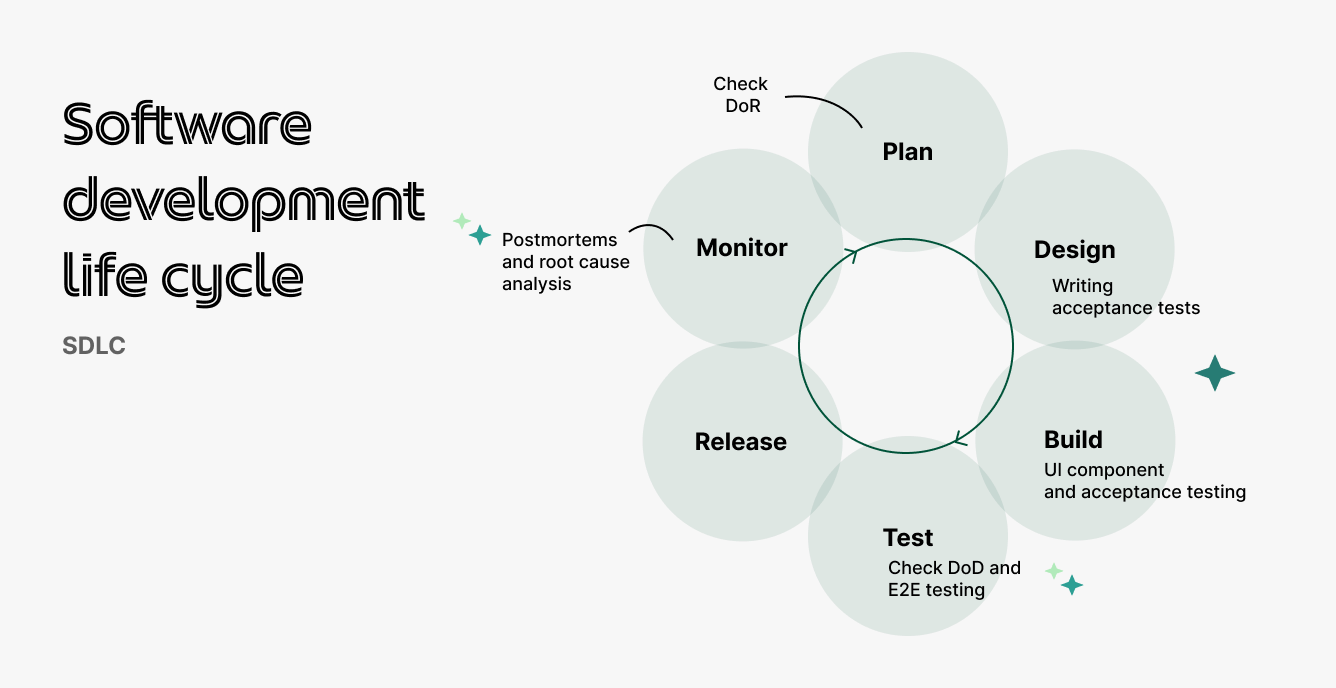
Figure 1 – Software development life cycle (SDLC) sample
When Grab first started in 2012, we were using the Agile SDLC (Figure 1) across all teams and features. This meant that every new feature went through the entire process and was only released to app distribution platforms (PlayStore or AppStore) after the quality assurance (QA) team manually tested and signed off on it.
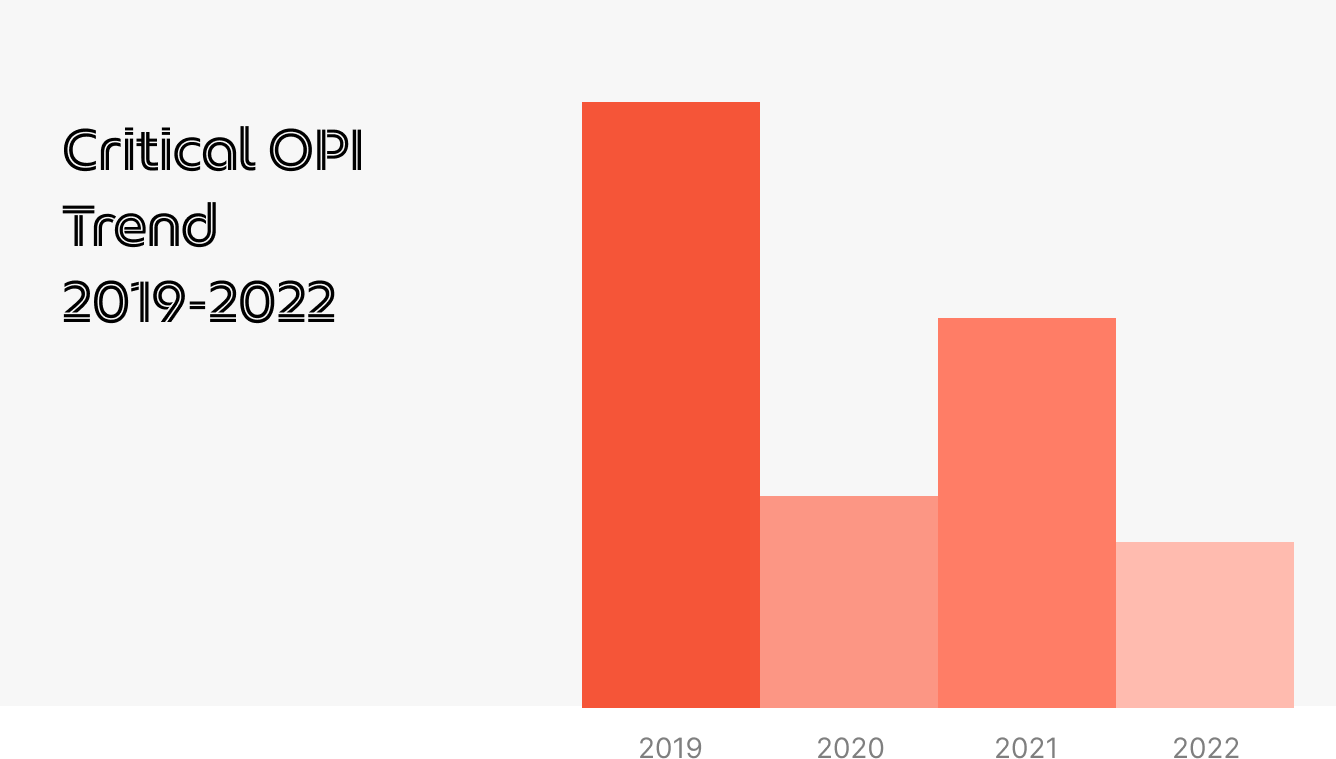
Over time, we discovered that feature testing took longer, with more bugs being reported and impact areas that needed to be tested. This was the same for regression testing as QA engineers had to manually test each feature in the app before a release. Despite the best efforts of our QA teams, there were still many major and critical production issues reported on our app – the highest numbers were in 2019 (Figure 2).
Figure 2 – Critical open production issue (OPI) trend
This surge in production issues and feature bugs was directly impacting our users’ experience on our app. To directly address the high production issues and slow testing process, we changed our testing strategy and adopted shift-left testing.
Solution
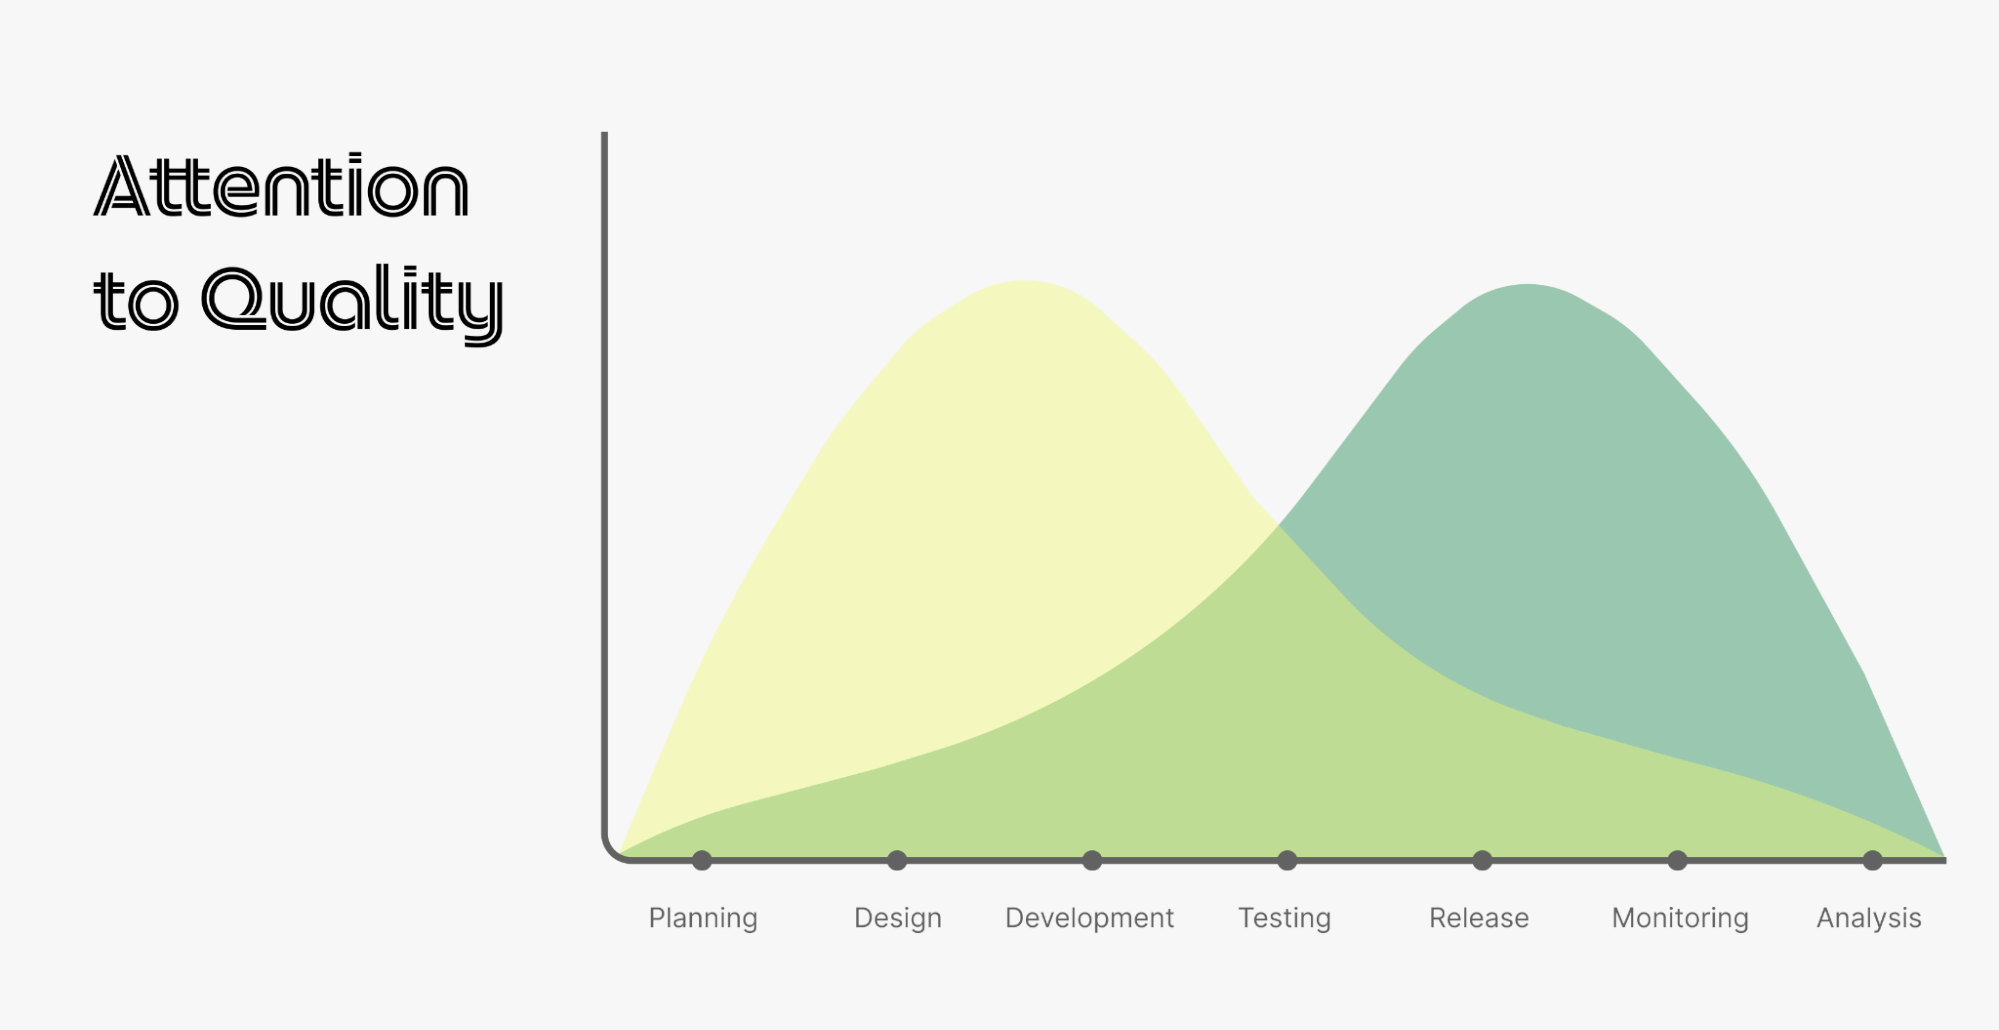
Shift-left testing is an approach that brings testing forward to the early phases of software development. This means testing can start as early as the planning and design phases.
Figure 3 – Shift-left testing
By adopting shift-left testing, engineering teams at Grab are able to proactively prevent possible defect leakage in the early stages of testing, directly addressing our users’ concerns without delaying delivery times.
With shift-left testing, we made three significant changes to our SDLC:
Software engineers conduct acceptance testing
Incorporate Definition of Ready (DoR) and Definition of Done (DoD)
Balanced testing strategy
Let’s dive deeper into how we implemented each change, the challenges, and learnings we gained along the way.
Software engineers conduct acceptance testing
Acceptance testing determines whether a feature satisfies the defined acceptance criteria, which helps the team evaluate if the feature fulfills our consumers’ needs. Typically, acceptance testing is done after development. But our QA engineers still discovered many bugs and the cost of fixing bugs at this stage is more expensive and time-consuming. We also realised that the most common root causes of bugs were associated with insufficient requirements, vague details, or missing test cases.
With shift-left testing, QA engineers start writing test cases before development starts and these acceptance tests will be executed by the software engineers during development. Writing acceptance tests early helps identify potential gaps in the requirements before development begins. It also prevents possible bugs and streamlines the testing process as engineers can find and fix bugs even before the testing phase. This is because they can execute the test cases directly during the development stage.
On top of that, QA and Product managers also made Given/When/Then (GWT) the standard for acceptance criteria and test cases, making them easier for all stakeholders to understand.
Step by Step style
GWT format
Open the Grab app
Navigate to home feed
Tap on merchant entry point card
Check that merchant landing page is shown
Given user opens the app And user navigates to the home feed When the user taps on the merchant entry point card Then the user should see the merchant’s landing page
By enabling software engineers to conduct acceptance testing, we minimised back-and-forth discussions within the team regarding bug fixes and also, influenced a significant shift in perspective – quality is everyone’s responsibility.
Another key aspect of shift-left testing is for teams to agree on a standard of quality in earlier stages of the SDLC. To do that, we started incorporating Definition of Ready (DoR) and Definition of Done (DoD) in our tasks.
Incorporate Definition of Ready (DoR) and Definition of Done (DoD)
As mentioned, quality checks can be done before development even begins and can start as early as backlog grooming and sprint planning. The team needs to agree on a standard for work products such as requirements, design, engineering solutions, and test cases. Having this alignment helps reduce the possibility of unclear requirements or misunderstandings that may lead to re-work or a low-quality feature.
To enforce consistent quality of work products, everyone in the team should have access to these products and should follow DoRs and DoDs as standards in completing their tasks.
DoR: Explicit criteria that an epic, user story, or task must meet before it can be accepted into an upcoming sprint.
DoD: List of criteria to fulfill before we can mark the epic, user story, or task complete, or the entry or exit criteria for each story state transitions.
Including DoRs and DoDs have proven to improve delivery pace and quality. One of the first teams to adopt this observed significant improvements in their delivery speed and app quality – consistently delivering over 90% of task commitments, minimising technical debt, and reducing manual testing times.
Unfortunately, having these two changes alone were not sufficient – testing was still manually intensive and time consuming. To ease the load on our QA engineers, we needed to develop a balanced testing strategy.
Balanced testing strategy
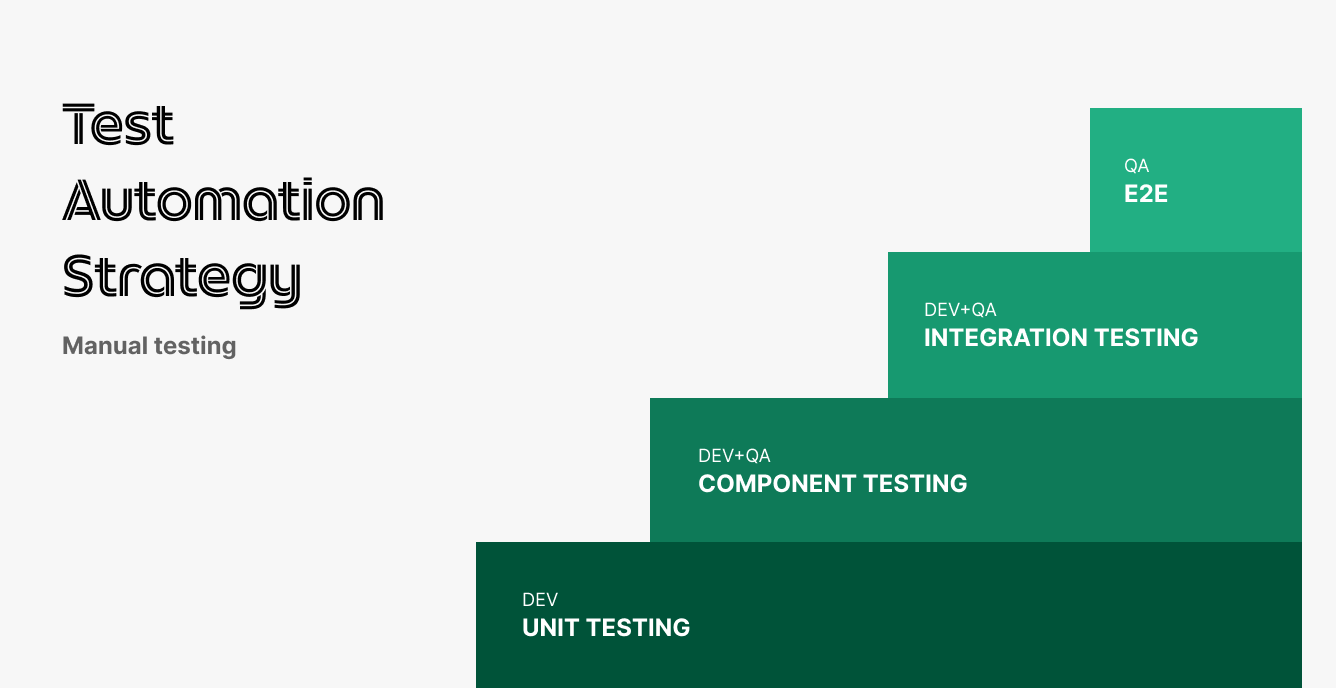
Figure 4 – Test automation strategy
Our initial automation strategy only included unit testing, but we have since enhanced our testing strategy to be more balanced.
Unit testing
UI component testing
Backend integration testing
End-to-End (E2E) testing
Simply having good coverage in one layer does not guarantee good quality of an app or new feature. It is important for teams to test vigorously with different types of testing to ensure that we cover all possible scenarios before a release.
As you already know, unit tests are written and executed by software engineers during the development phases. Let’s look at what the remaining three layers mean.
UI component testing
This type of testing focuses on individual components within the application and is useful for testing specific use cases of a service or feature. To reduce manual effort from QA engineers, teams started exploring automation and introduced a mobile testing framework for component testing.
This UI component testing framework used mocked API responses to test screens and interactions on the elements. These UI component tests were automatically executed whenever the pipeline was run, which helped to reduce manual regression efforts. With shift-left testing, we also revised the DoD for new features to include at least 70% coverage of UI component tests.
Backend integration testing
Backend integration testing is especially important if your application regularly interacts with backend services, much like the Grab app. This means we need to ensure the quality and stability of these backend services. Since Grab started its journey toward becoming a superapp, more teams started performing backend integration tests like API integration tests.
Our backend integration tests also covered positive and negative test cases to determine the happy and unhappy paths. At the moment, majority of Grab teams have complete test coverage for happy path use cases and are continuously improving coverage for other use cases.
End-to-End (E2E) testing
E2E tests are important because they simulate the entire user experience from start to end, ensuring that the system works as expected. We started exploring E2E testing frameworks, from as early as 2015, to automate tests for critical services like logging in and booking a ride.
But as Grab introduced more services, off-the-shelf solutions were no longer a viable option, as we noticed issues like automation limitations and increased test flakiness. We needed a framework that is compatible with existing processes, stable enough to reduce flakiness, scalable, and easy to learn.
With this criteria in mind, our QA engineering teams built an internal E2E framework that could make API calls, test different account-based scenarios, and provide many other features. Multiple pilot teams have started implementing tests with the E2E framework, which has helped to reduce regression efforts. We are continuously improving the framework by adding new capabilities to cover more test scenarios.
Now that we’ve covered all the changes we implemented with shift-left testing, let’s take a look at how this changed our SDLC.
Impact
Figure 5 – Updated SDLC process
Since the implementation of shift-left testing, we have improved our app quality without compromising our project delivery pace. Compared to 2019, we observed the following improvements within the Grab superapp in 2022:
Production issues with “Major and Critical” severity bugs found in production were reduced by 60%
Bugs found in development phase with “Major and Critical” severity were reduced by 40%
What’s next?
Through this journey, we recognise that there’s no such thing as a bug-free app – no matter how much we test, production issues still happen occasionally. To minimise the occurrence of bugs, we’re regularly conducting root cause analyses and writing postmortem reports for production incidents. These allow us to retrospect with other teams and come up with corrective actions and prevention plans. Through these continuous learnings and improvements, we can continue to shape the future of the Grab superapp.
Special thanks to Sori Han for designing the images in this article.
Join us
Grab is the leading superapp platform in Southeast Asia, providing everyday services that matter to consumers. More than just a ride-hailing and food delivery app, Grab offers a wide range of on-demand services in the region, including mobility, food, package and grocery delivery services, mobile payments, and financial services across 428 cities in eight countries.
Powered by technology and driven by heart, our mission is to drive Southeast Asia forward by creating economic empowerment for everyone. If this mission speaks to you, join our team today!
In the current technology landscape, startups are developing rapidly. This usually leads to an increase in the number of engineers in teams, with the goal of increasing the speed of product development and delivery frequency. However, this growth often leads to a diverse selection of technology stacks being used by different teams within the same organisation.
Having different technology stacks within a team could lead to a bigger problem in the future, especially if documentation is not well-maintained. The best course of action is to pick just one technology stack for your projects, but it begs the question, “How do I choose the best technology stack for my projects?”.
One such example is OVO, which is an Indonesian payments, rewards, and financial services platform within Grab. We share our process and analysis to determine the best technology stack that complies with precise standards. By the end of the article, you may also learn to choose the best technology stack for your needs.
Background
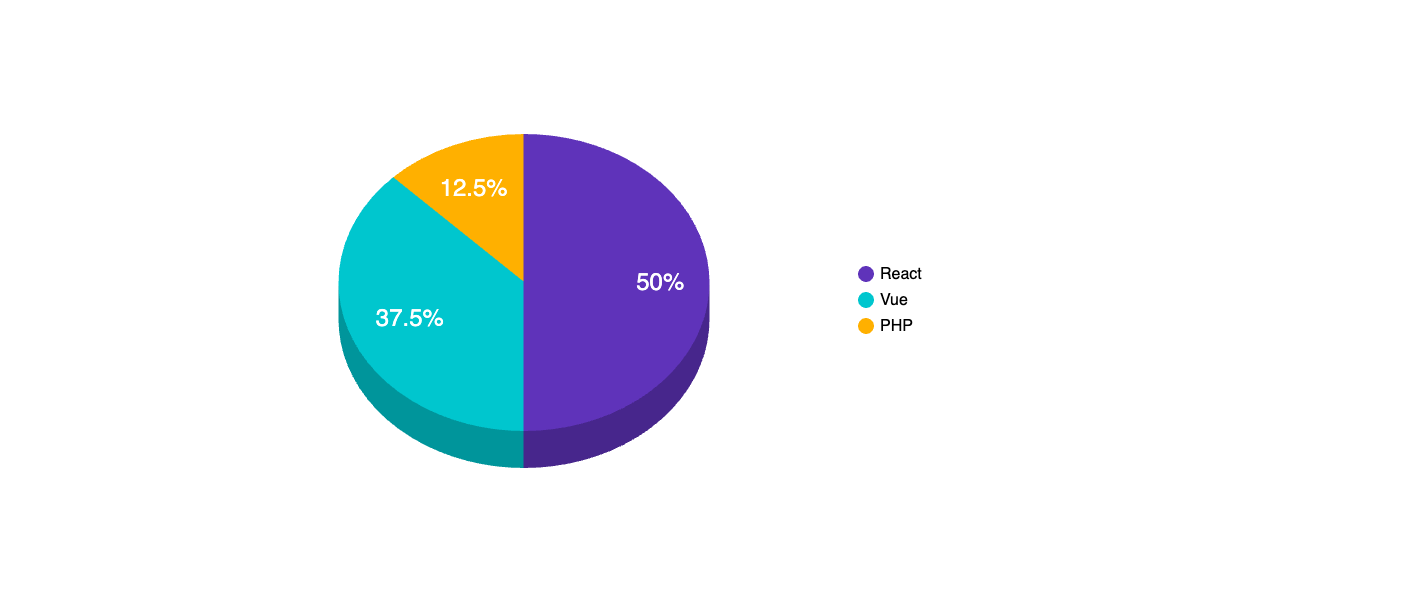
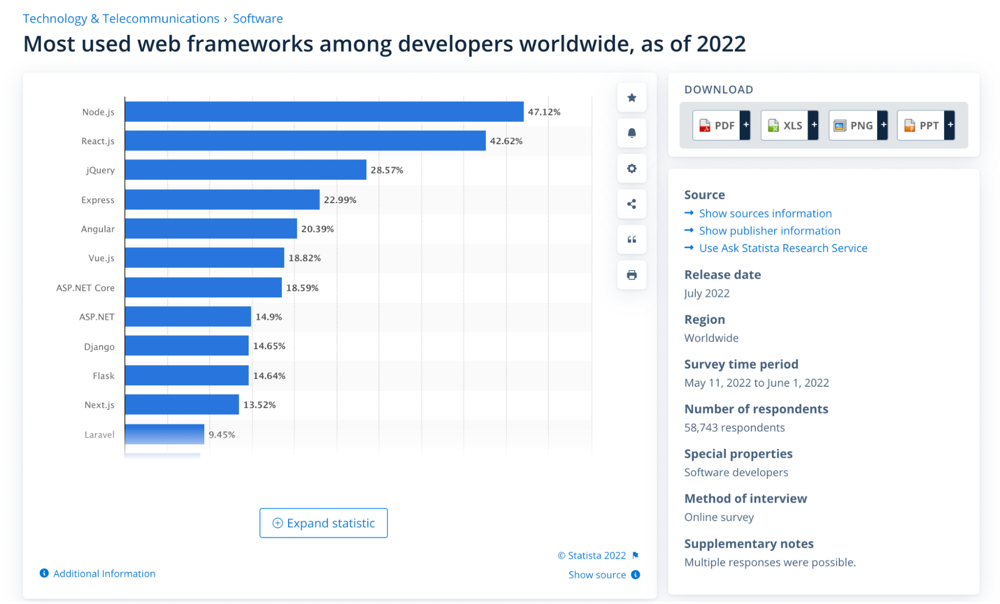
In recent years, we have seen massive growth in modern web technologies, such as React, Angular, Vue, Svelte, Django, TypeScript, and many more. Each technology has its benefits. However, having so many choices can be confusing when you must determine which technologies are best for your projects. To narrow down the choices, a few aspects, such as scalability, stability, and usage in the market, must be considered.
That’s the problem that we used to face. Most of our legacy services were not standardised and were written in different languages like PHP, React, and Vue. Also, the documentation for these legacy services is not well-structured or regularly updated.
Current technology stack usage in OVO
We realised that we had two main problems:
Various technology stacks (PHP, Vue, React, Nuxt, and Go) maintained simultaneously, with incomplete documentation, may consume a lot of time to understand the code, especially for engineers unfamiliar with the frameworks or even a new hire.
Context switching when reviewing code makes it hard to review other teammates’ merge requests on complex projects and quickly offer better code suggestions.
To prevent these problems from recurring, teams must use one primary technology stack.
After detailed comparisons, we narrowed our choices to two options – React and Vue – because we have developed projects in both technologies and already have the user interface (UI) library in each technology stack.
Next, we conducted a more detailed research and exploration for each technology. The main goals were to find the unique features, scalability, ease of migration, and compatibility for the UI library for React and Vue. To test the compatibility of each UI library, we also used a sample UI on one of our upcoming projects and sliced it.
Here’s a quick summary of our exploration:
Metrics
Vue
React
UI Library Compatibility
Doesn’t require much component development
Doesn’t require much component development
Scalability
Easier to upgrade, slower in releasing major updates, clear migration guide
Quicker release of major versions, supports gradual updates
Latest version (v18) of React gradual updates, doesn’t support IE
From this table, we found that the differences between these frameworks are miniscule, making it tough for us to determine which to use. Ultimately, we decided to step back and see the Big Why.
Solution
The Big Why here was “Why do we need to standardise our technology stack?”. We wanted to ease the onboarding process for new hires and reduce the complexity, like context switching, during code reviews, which ultimately saves time.
As Kleppmann (2017) states, “The majority of the cost of software is in its ongoing maintenance”. In this case, the biggest cost was time. Increasing the ease of maintenance would reduce the cost, so we decided to use maintainability as our north star metric.
Kleppmann (2017) also highlighted three design principles in any software system:
Operability: Make it easy to keep the system running.
Simplicity: Easy for new engineers to understand the system by minimising complexity.
Evolvability: Make it easy for engineers to make changes to the system in the future.
Keeping these design principles in mind, we defined three metrics that our selected tech stack must achieve:
Scalability
Keeping software and platforms up to date
Anticipating possible future problems
Stability of the library and documentation
Establishing good practices and tools for development
Usage in the market
The popularity of the library or framework and variety of coding best practices
Metrics
Vue
React
Scalability
Framework
Operability Easier to update because there aren’t many approaches to writing Vue.
Evolvability Since Vue is a framework, it needs fewer steps to upgrade.
Library Supports gradual updates but there will be many different approaches when upgrading React on our services.
Stability of the library and documentation
Has standardised documentation
Has many versions of documentation
Usage on Market
Smaller market share.
Simplicity We can reduce complexity for new hires, as the Vue standard in OVO remains consistent with standards in other companies.
After conducting a detailed comparison between Vue and React, we decided to use Vue as our primary tech stack as it best aligns with Kleppmann’s three design principles and our north star metric of maintainability. Even though we noticed a few disadvantages to using Vue, such as smaller market share, we found that Vue is still the better option as it complies with all our metrics.
Moving forward, we will only use one tech stack across our projects but we decided not to migrate technology for existing projects. This allows us to continue exploring and learning about other technologies’ developments. One of the things we need to do is ensure that our current projects are kept up-to-date.
Implementation
After deciding on the primary technology stack, we had to do the following:
Define a boilerplate for future Vue projects, which will include items like a general library or dependencies, implementation for unit testing, and folder structure, to align with our north star metric.
Update our existing UI library with new components and the latest Vue version.
Perform periodic upgrades to existing React services and create a standardised code structure with proper documentation.
With these practices in place, we can ensure that future projects will be standardised, making them easier for engineers to maintain.
Impact
There are a few key benefits of standardising our technology stack.
Scalability and maintainability: It’s much easier to scale and maintain projects using the same technology stack. For example, when implementing security patches on all projects due to certain vulnerabilities in the system or libraries, we will need one patch for each technology. With only one stack, we only need to implement one patch across all projects, saving a lot of time.
Faster onboarding process: The onboarding process is simplified for new hires because we have standardisation between all services, which will minimise the amount of context switching and lower the learning curve.
Faster deliveries: When it’s easier to implement a change, there’s a compounding impact where the delivery process is shortened and release to production is quicker. Ultimately, faster deliveries of a new product or feature will help increase revenue.
Learnings/Conclusion
For every big decision, it is important to take a step back and understand the Big Why or the main motivation behind it, in order to remain objective. That’s why after we identified maintainability as our north star metric, it was easier to narrow down the choices and make detailed comparisons.
The north star metric, or deciding factor, might differ vastly, but it depends on the problems you are trying to solve.
References
Kleppmann, M. (2017). Designing Data-Intensive Applications. Beijing: O’Reilly. ISBN: 978-1-4493-7332-0
Grab is the leading superapp platform in Southeast Asia, providing everyday services that matter to consumers. More than just a ride-hailing and food delivery app, Grab offers a wide range of on-demand services in the region, including mobility, food, package and grocery delivery services, mobile payments, and financial services across 428 cities in eight countries.
Powered by technology and driven by heart, our mission is to drive Southeast Asia forward by creating economic empowerment for everyone. If this mission speaks to you, join our team today!
Grab has always regarded security as one of our top priorities; this is especially important for data platform teams. We need to control access to data and resources in order to protect our consumers and ensure compliance with various, continuously evolving security standards.
Additionally, we want to keep the process convenient, simple, and easily scalable for teams. However, as Grab continues to grow, we have more services and resources to manage and it becomes increasingly difficult to keep the process frictionless. That’s why we decided to move from Role-Based Access Control (RBAC) to Attribute-Based Access Control (ABAC) for our Kafka Control Plane (KCP).
In this article, you will learn how Grab’s streaming data platform team (Coban) deleted manual role and permission management of hundreds of roles and resources, and reduced operational overhead of requesting or approving permissions to zero by moving from RBAC to ABAC.
Introduction
Kafka is widely used across Grab teams as a streaming platform. For decentralised Kafka resource (e.g. topic) management, teams have the right to create, update, or delete based on their needs. As the data platform team, we implemented a KCP to ensure that these operations are only performed by authorised parties, especially on multi-tenant Kafka clusters.
For internal access management, Grab uses its own Identity and Access Management (IAM) service, based on RBAC, to support authentication and authorisation processes:
Authentication verifies the identity of a user or service, for example, if the provided token is valid or expired.
Authorisation determines their access rights, for example, whether users can only update and/or delete their own Kafka topics.
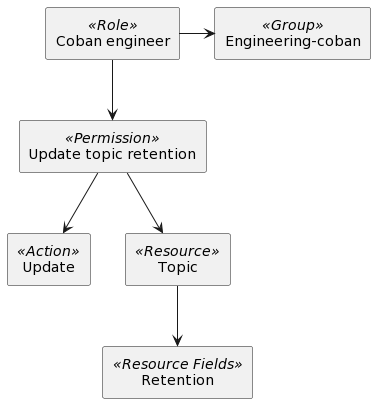
In RBAC, roles, permissions, actions, resources, and the relationships between them need to be defined in the IAM service. They are used to determine whether a user can access a certain resource.
In the following example, we can see how IAM concepts come together. The Coban engineer role belongs to the Engineering-coban group and has permission to update the retention topic. Any engineer added to the Engineering-coban group will also be able to update the topic retention.
Following the same concept, each team using the KCP has its own roles, permissions, and resources created in the system. However, there are some disadvantages to this approach:
It leads to a significant growth in the number of access control artifacts both platform and user teams need to manage, and increased time and effort to debug access control issues. We start off by finding which group the engineer belongs to and locating the group that should be used for KCP, and then trace to role and permissions.
All group membership access requests of new joiners need to be reviewed and approved by their direct managers. This leads to a lot of backlog as new joiners might have multiple groups to join and managers might not be able to review them timely. In some cases, roles need to be re-applied or renewed every 90 days, which further adds to the delay.
Group memberships are not updated to reflect active members in the team, leaving some engineers with access they don’t need and others with access they should have but don’t.
Solution
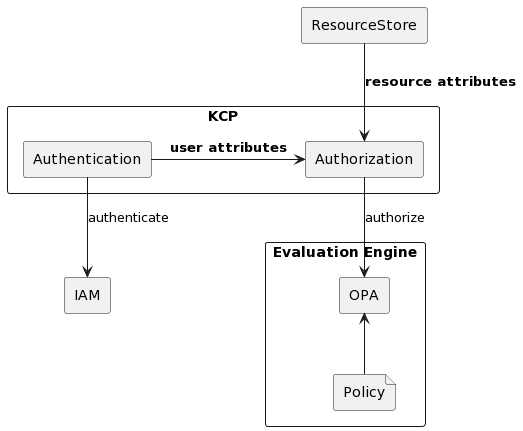
With ABAC, access management becomes a lot easier. Any new joiner to a specific team gets the same access rights as everyone on that team – no need for manual approval from a manager. However, for ABAC to work, we need these components in place:
User attributes: Who is the subject (actor) of a request?
Resource attributes: Which object (resource) does the actor want to deal with?
Evaluation engine: How do we decide if the actor is allowed to perform the action on the resource?
User attributes
All users have certain attributes depending on the department or team they belong to. This data is then stored and synced automatically with the human resource management system (HRMS) tool, which acts as a source of truth for Grab-wide data, every time a user switches teams, roles, or leaves the company.
Resource attributes
Resource provisioning is an authenticated operation. This means that KCP knows who sent the requests and what each request/action is about. Similarly, resource attributes can be derived from their creators. For new resource provisioning, it is possible to capture the resource tags and store them after authentication. For existing resources, a major challenge was the need to backfill the tagging and ensure a seamless transition from the user’s perspective. In the past, all resource provisioning operations were done by a centralised platform team and most of the existing resource attributes are still under platform team’s ownership.
Evaluation engine
We chose to use Open Policy Agent (OPA) as our policy evaluation engine mainly for its wide community support, applicable feature set, and extensibility to other tools and platforms in our system. This is also currently used by our team for Kafka authorisation. The policies are written in Rego, the default language supported by OPA.
Architecture and implementation
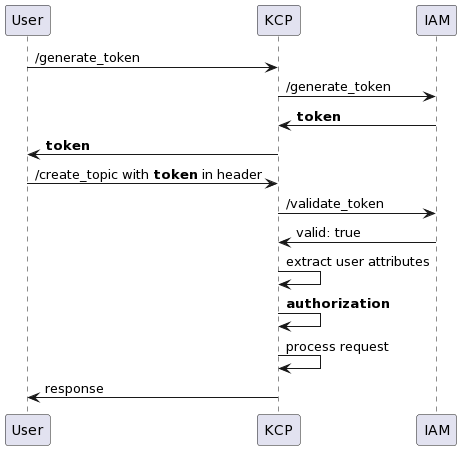
With ABAC, the access control process looks like this:
User attributes
Authentication is handled by the IAM service. In the /generate_token call, a user requests an authentication token from KCP before calling an authenticated endpoint. KCP then calls IAM to generate a token and returns it to the user.
In the /create_topic call, the user includes the generated token in the request header. KCP takes the token and verifies the token validity with IAM. User attributes are then extracted from the token payload for later use in request authorisation.
Some of the common attributes we use for our policy are user identifier, department code, and team code, which provide details like a user’s department and work scope.
When it comes to data governance and central platform and identity teams, one of the major challenges was standardising the set of attributes to be used for clear and consistent ABAC policies across platforms so that their lifecycle and changes could be governed. This was an important shift in the mental model for attribute management over the RBAC model.
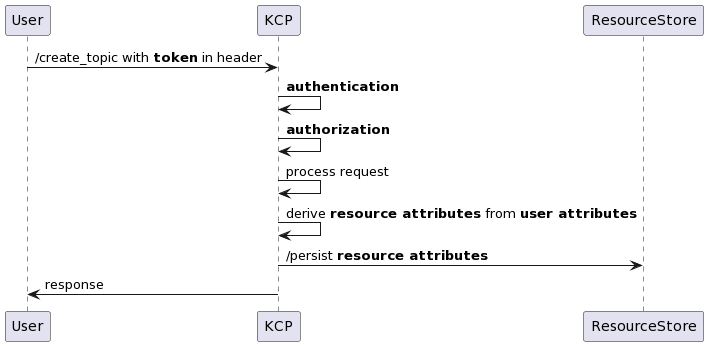
Resource attributes
For newly created resources, attributes will be derived from user attributes that are captured during the authentication process.
Previously with RBAC, existing resources did not have the required attributes. Since migrating to ABAC, the implementation has tagged newly created resources and ensured that their attributes are up to standard. IAM was also still doing the actual authorisation using RBAC.
It is also important to note that we collaborated with data governance teams to backfill Kafka resource ownership. Having accurate ownership of resources like data lake or Kafka topics enabled us to move toward a self-service model and remove bottlenecks from centralised platform teams.
After identifying most of the resource ownership, we started switching over to ABAC. The transition was smooth and had no impact on user experience. The remaining unidentified resources were tagged to lost-and-found and could be reclaimed by service teams when they needed permission to manage them.
Open Policy Agent
The most common question when implementing the policy is “how do you define ownership by attributes?”. With respect to the principle of least privilege, each policy must be sufficiently strict to limit access to only the relevant parties. In the end, we aligned as an organisation on defining ownership by department and team.
We created a simple example below to demonstrate how to define a policy:
In this example, we start with denying access to everyone. If the updateTopic endpoint is called and the department and team attributes between user and resource are matched, access is allowed.
With a similar scenario, we would need 1 role, 1 action, 1 resource, and 1 mapping (a.k.a permission) between action and resource. We will need to keep adding resources and permissions when we have new resources created. Compared to the policy above, no other changes are required.
With ABAC, there are no further setup or access requests needed when a user changes teams. The user will be tagged to different attributes, automatically granted access to the new team’s resources, and excluded from the previous team’s resources.
Another consideration we had was making sure that the policy is well-written and transparent in terms of change history. We decided to include this as part of our application code so every change is accounted for in the unit test and review process.
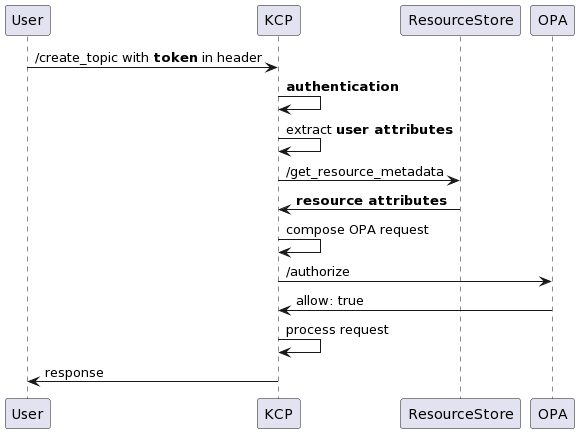
Authorisation
The last part of the ABAC process is authorisation logic. We added the logic to the middleware so that we could make a call to OPA for authorisation.
To ensure token validity after authentication, KCP extracts user attributes from the token payload and fetches resource attributes from the resource store. It combines the request metadata such as method and endpoint, along with the user and resource attributes into an OPA request. OPA then evaluates the request based on the redefined policy above and returns a response.
Auditability
For ABAC authorisation, there are two key areas of consideration:
Who made changes to the policy, who deployed, and when the change was made
Who accessed what resource and when
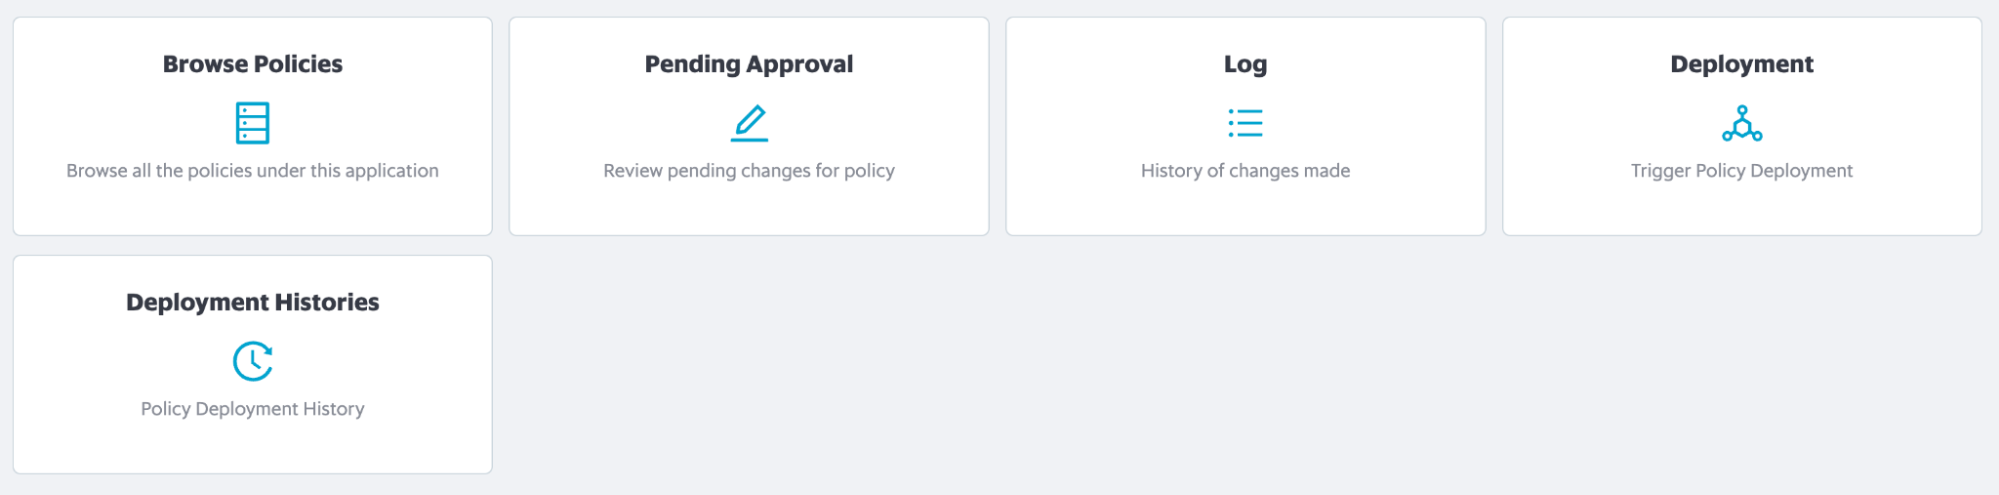
We manage policies in a dedicated GitLab repository and changes are submitted via merge requests. Based on the commit history, we can easily tell who made changes, reviewed, approved, and deployed the policy.
For resource access, OPA produces a decision log containing user attributes, resource attributes, and the authorisation decision for every call it serves. The log is kept for five days in Kibana for debugging purposes, then moved to S3 where it is kept for 28 days.
Impact
The move to ABAC authorisation has improved our controls as compared to the previous RBAC model, with the biggest impact being fewer resources to manage. Some other benefits include:
Optimised resource allocation: Discarded over 200 roles, 200 permissions, and almost 3000 unused resources from IAM services, simplifying our debugging process. Now, we can simply check the user and resource attributes as needed.
Simplified resource management: In the three months we have been using ABAC, about 600 resources have been added without any increase in complexity for authorisation, which is significantly lesser than the RBAC model.
Reduction in delays and waiting time: Engineers no longer have to wait for approval for KCP access.
Better governance over resource ownership and costs: ABAC allowed us to have a standardised and accurate tagging system of almost 3000 resources.
Learnings
Although ABAC does provide significant improvements over RBAC, it comes with its own caveats:
It needs a reliable and comprehensive attribute tagging system to function properly. This only became possible after roughly three months of identifying and tagging the ownership of existing resources by both automated and manual methods.
Tags should be kept up to date with the company’s growth. Teams could lose access to their resources if they are wrongly tagged. It needs a mechanism to keep up with changes, or people will unexpectedly lose access when user and resource attributes are changed.
What’s next?
To keep up with organisational growth, KCP needs to start listening to the IAM stream, which is where all IAM changes are published. This will allow KCP to regularly update user attributes and refresh resource attributes when restructuring occurs, allowing authorisation to be done with the right data.
Constant collaboration with HR to ensure that we maintain sufficient user attributes (no extra unused information) that remain clean so ABAC works as expected.
Grab is the leading superapp platform in Southeast Asia, providing everyday services that matter to consumers. More than just a ride-hailing and food delivery app, Grab offers a wide range of on-demand services in the region, including mobility, food, package and grocery delivery services, mobile payments, and financial services across 428 cities in eight countries.
Powered by technology and driven by heart, our mission is to drive Southeast Asia forward by creating economic empowerment for everyone. If this mission speaks to you, join our team today!
Grab’s real-time data platform team, Coban, has been managing infrastructure resources via Infrastructure-as-code (IaC). Through the IaC approach, Terraform is used to maintain infrastructure consistency, automation, and ease of deployment of our streaming infrastructure, notably:
With Grab’s exponential growth, there needs to be a better way to scale infrastructure automatically. Moving towards GitOps processes benefits us in many ways:
Versioned and immutable: With our source code being stored in Git repositories, the desired state of infrastructure is stored in an environment that enforces immutability, versioning, and retention of version history, which helps with auditing and traceability.
Faster deployment: By automating the process of deploying resources after code is merged, we eliminate manual steps and improve overall engineering productivity while maintaining consistency.
Easier rollbacks: It’s as simple as making a revert for a Git commit as compared to creating a merge request (MR) and commenting Atlantis commands, which add extra steps and contribute to a higher mean-time-to-resolve (MTTR) for incidents.
Background
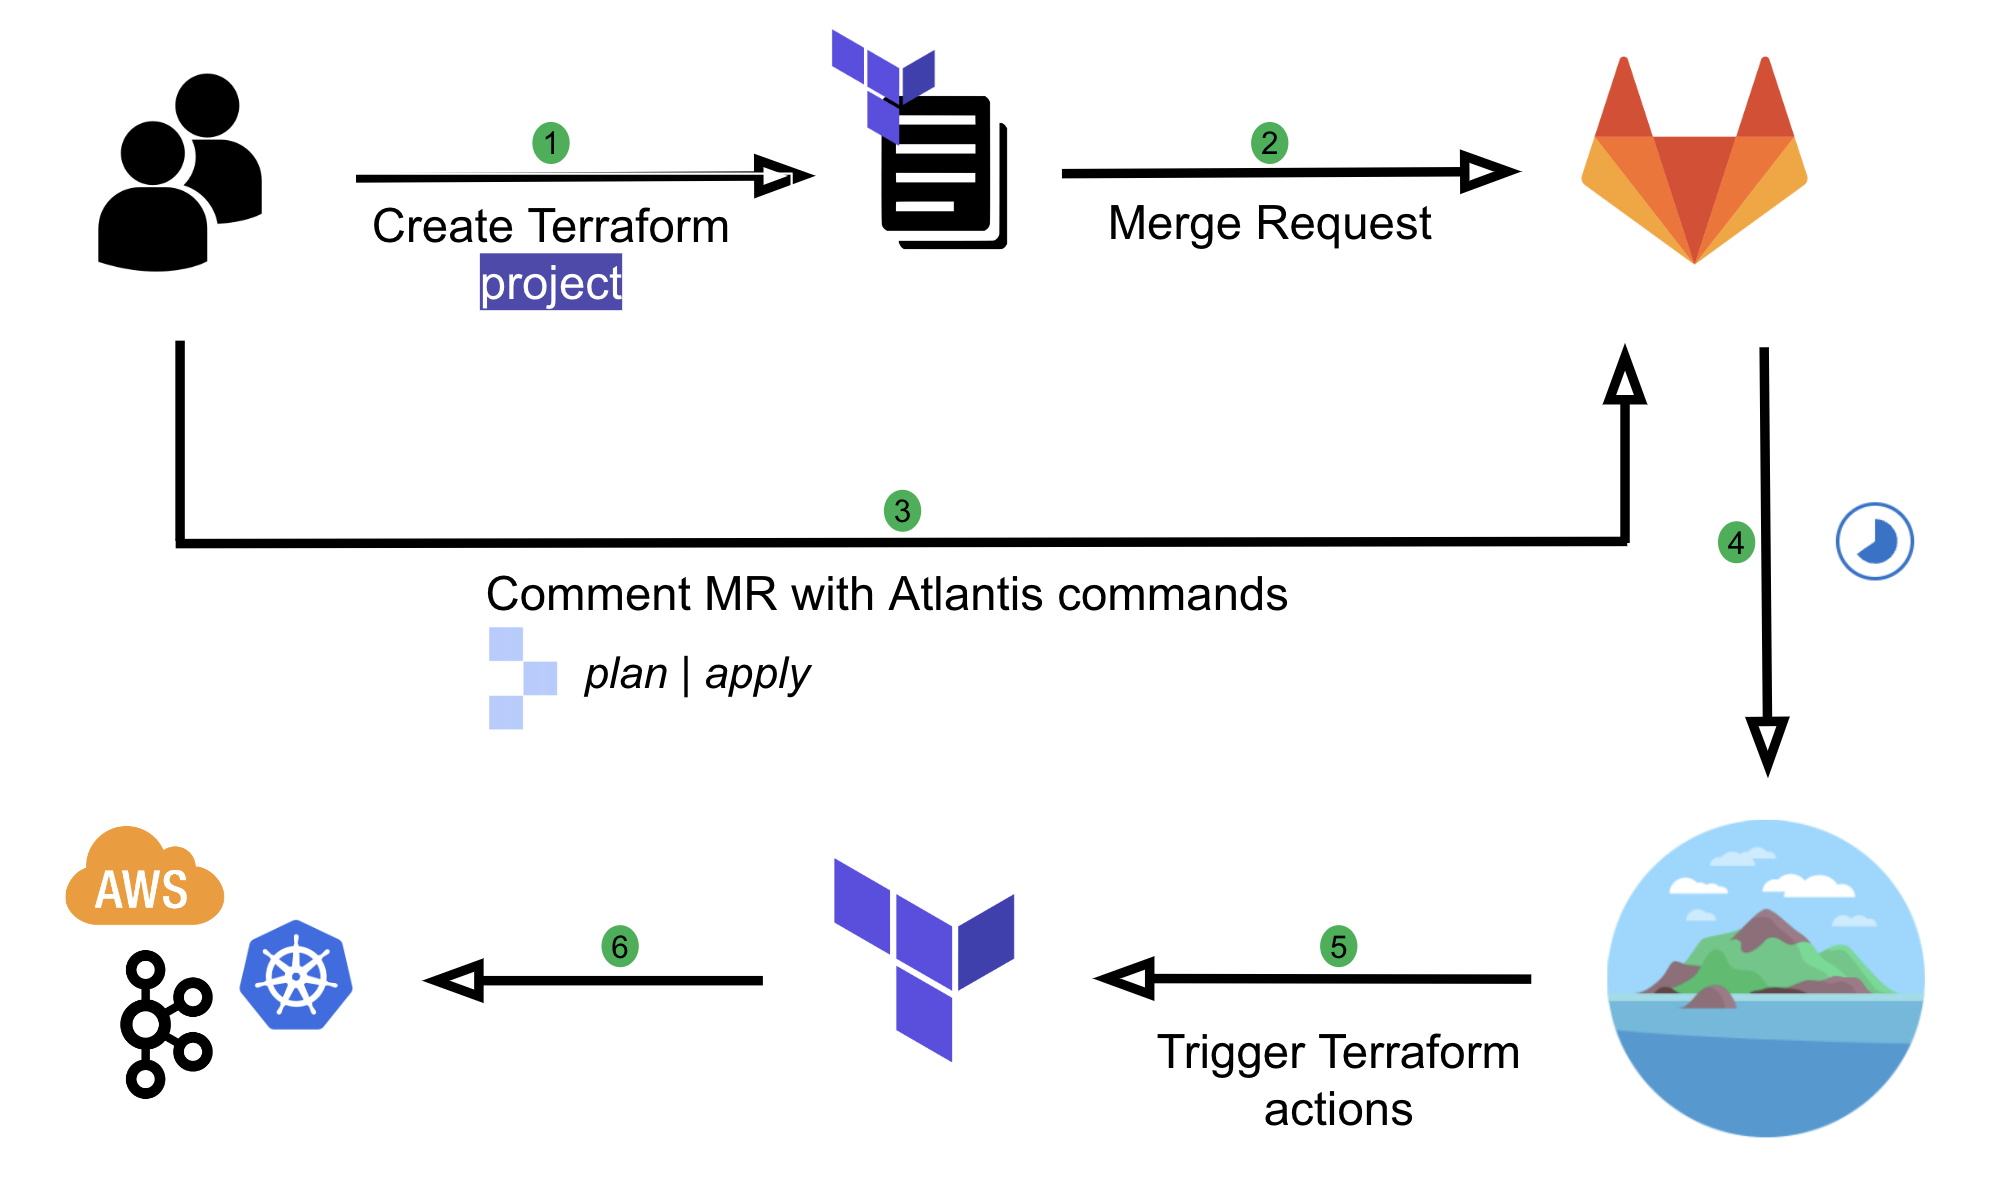
Originally, Coban implemented automation on Terraform resources using Atlantis, an application that operates based on user comments on MRs.
Fig. 1 User flow with Atlantis
We have come a long way with Atlantis. It has helped us to automate our workflows and enable self-service capabilities for our engineers. However, there were a few limitations in our setup, which we wanted to improve:
Course grained: There is no way to restrict the kind of Terraform resources users can create, which introduces security issues. For example, if a user is one of the Code owners, they can create another IAM role with Admin privileges with approval from their own team anywhere in the repository.
Limited automation: Users are still required to make comments in their MR such as atlantis apply. This requires the learning of Atlantis commands and is prone to human errors.
Limited capability: Having to rely entirely on Terraform and Hashicorp Configuration Language (HCL) functions to validate user input comes with limitations. For example, the ability to validate an input variable based on the value of another has been a requested feature for a long time.
Not adhering to Don’t Repeat Yourself (DRY) principle: Users need to create an entire Terraform project with boilerplate codes such as Terraform environment, local variables, and Terraform provider configurations to create a simple resource such as a Kafka topic.
Solution
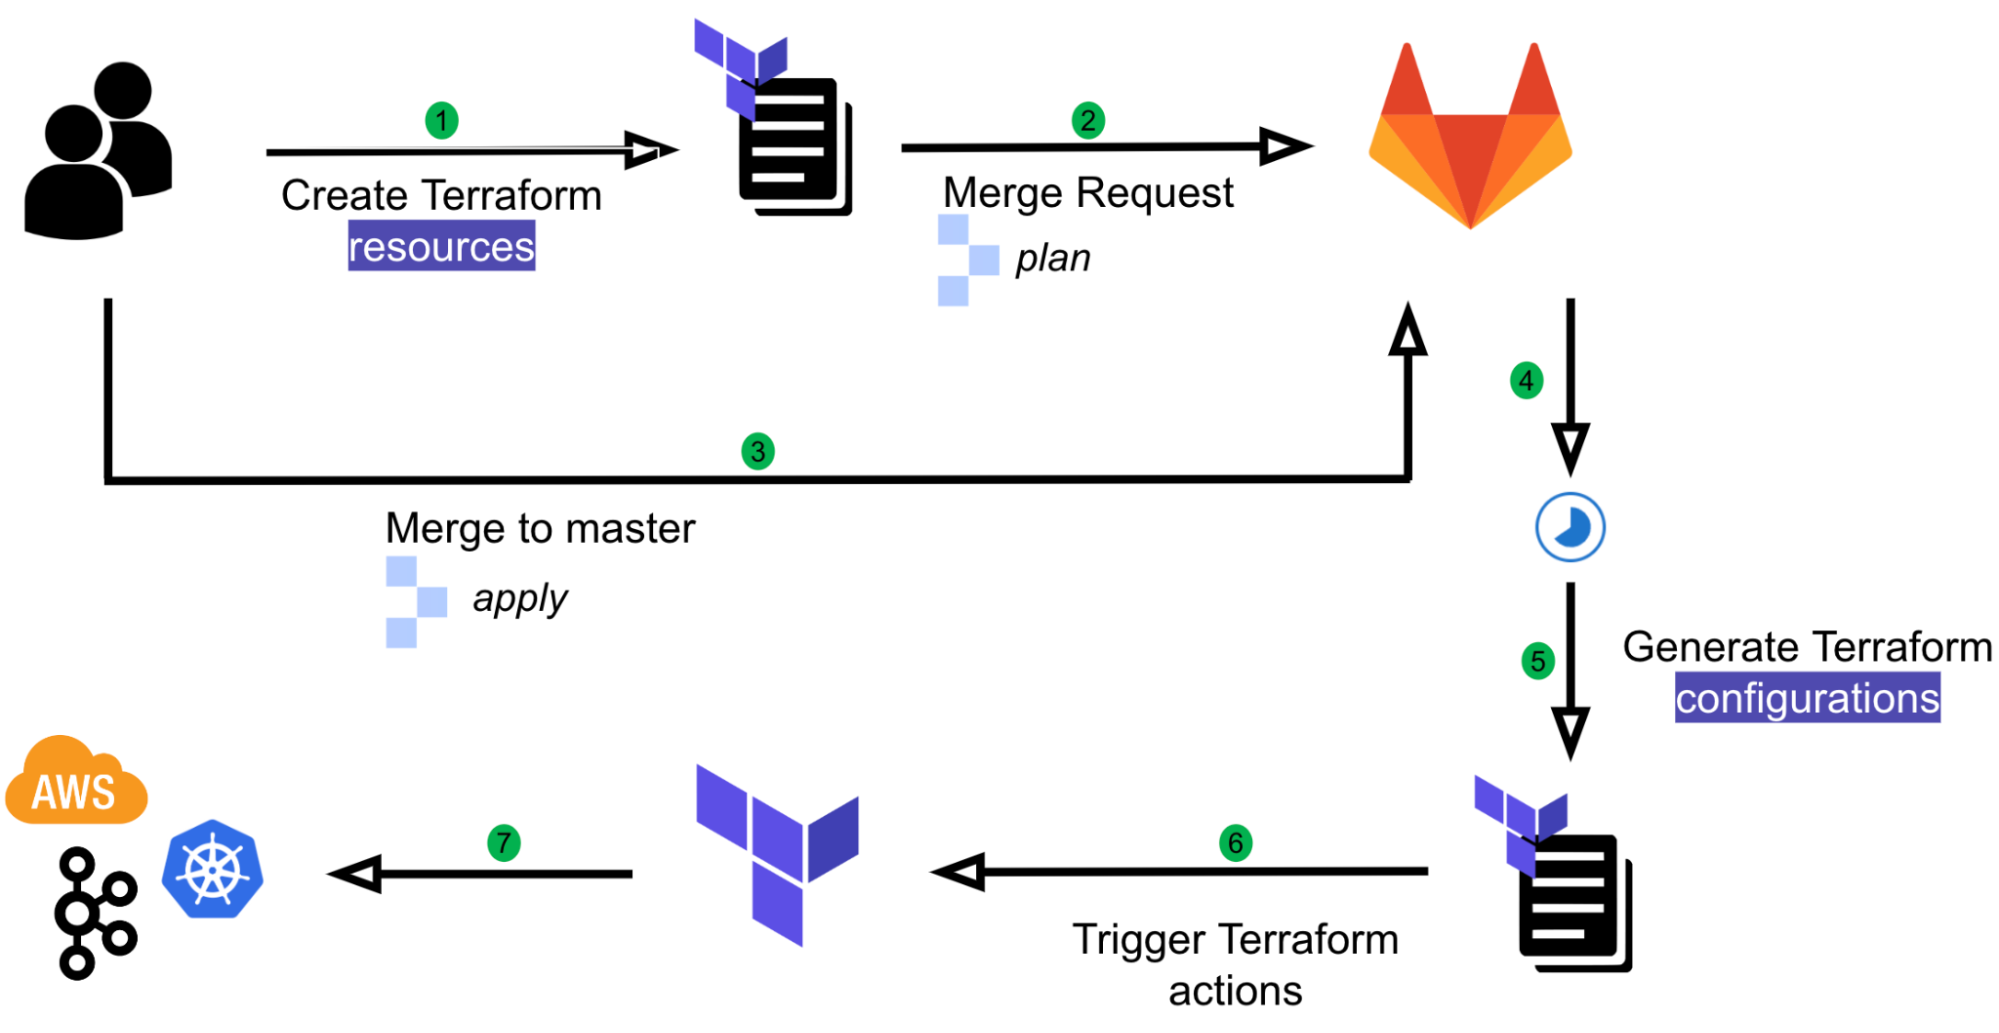
We have developed an in-house GitOps solution named Khone. Its name was inspired by the Khone Phapheng Waterfall. We have evaluated some of the best and most widely used GitOps products available but chose not to go with any as the majority of them aim to support Kubernetes native or custom resources, and we needed infrastructure provisioning that is beyond Kubernetes. With our approach, we have full control of the entire user flow and its implementation, and thus we benefit from:
Security: The ability to secure the pipeline with many customised scripts and workflows.
Simple user experience (UX): Simplified user flow and prevents human errors with automation.
DRY: Minimise boilerplate codes. Users only need to create a single Terraform resource and not an entire Terraform project.
Fig. 2 User flow with Khone
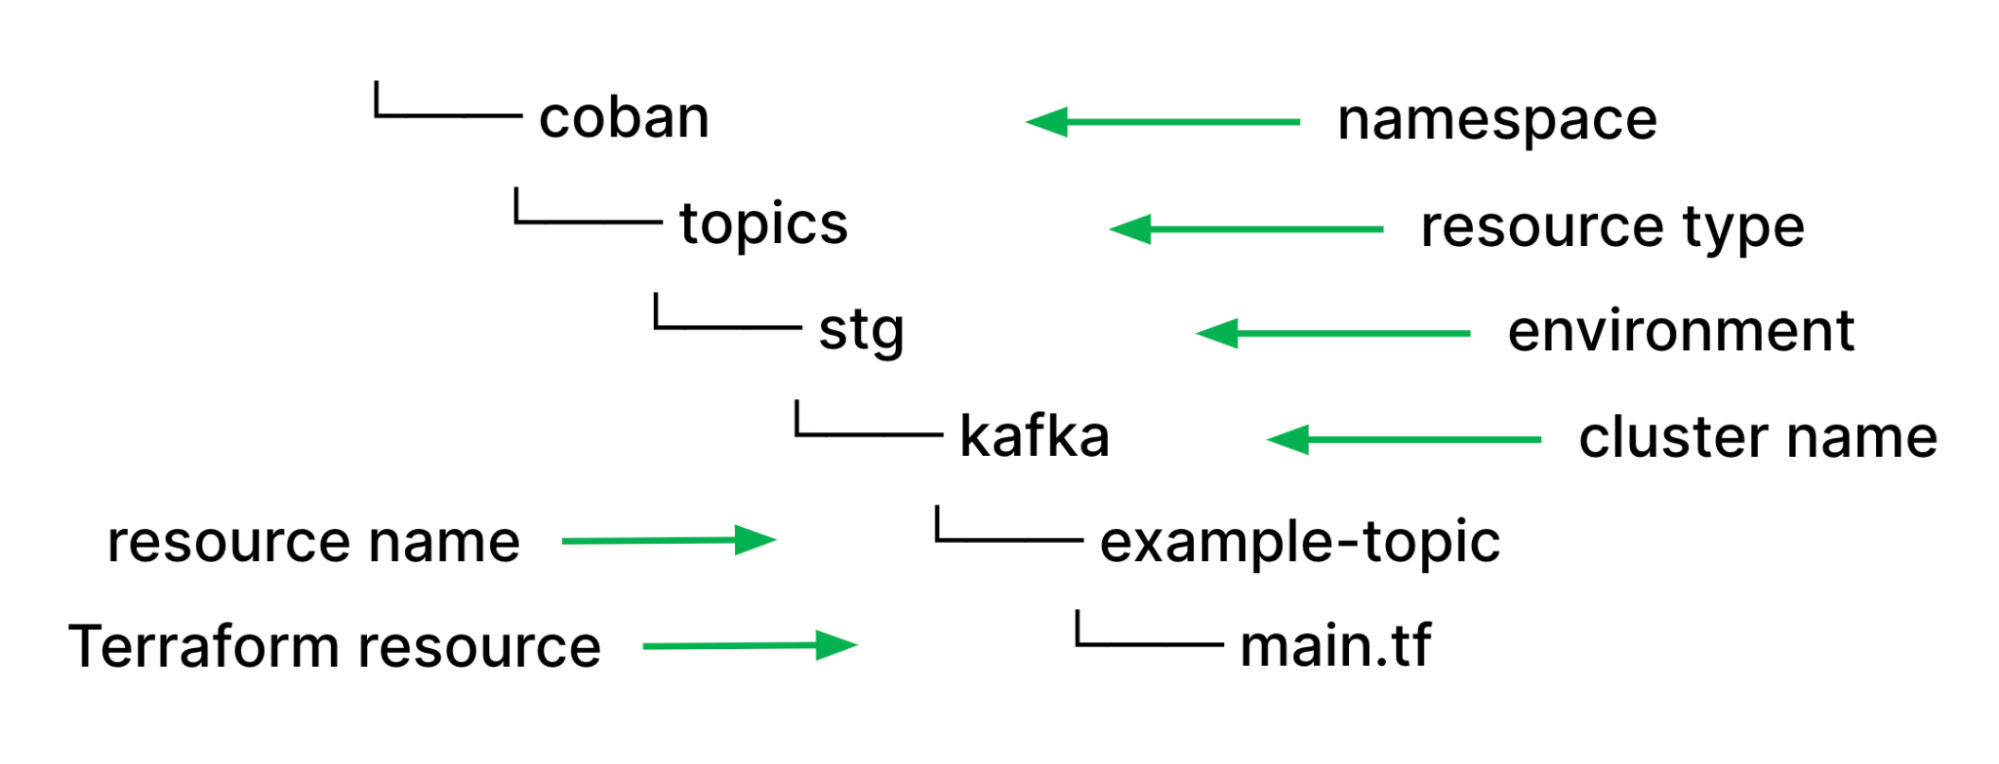
With all types of streaming infrastructure resources that we support, be it Kafka topics or Flink pipelines, we have identified they all have common properties such as namespace, environment, or cluster name such as Kafka cluster and Kubernetes cluster. As such, using those values as file paths help us to easily validate users input and de-couple them from the resource specific configuration properties in their HCL source code. Moreover, it helps to remove redundant information to maintain consistency. If the piece of information is in the file path, it won’t be elsewhere in resource definition.
Fig. 3 Khone directory structure
With this approach, we can utilise our pipeline scripts, which are written in Python and perform validations on the types of resources and resource names using Regular Expressions (Regex) without relying on HCL functions. Furthermore, we helped prevent human errors and improved developers’ efficiency by deriving these properties and reducing boilerplate codes by automatically parsing out other necessary configurations such as Kafka brokers endpoint from the cluster name and environment.
Pipeline stages
Khone’s pipeline implementation is designed with three stages. Each stage has different duties and responsibilities in verifying user input and securely creating the resources.
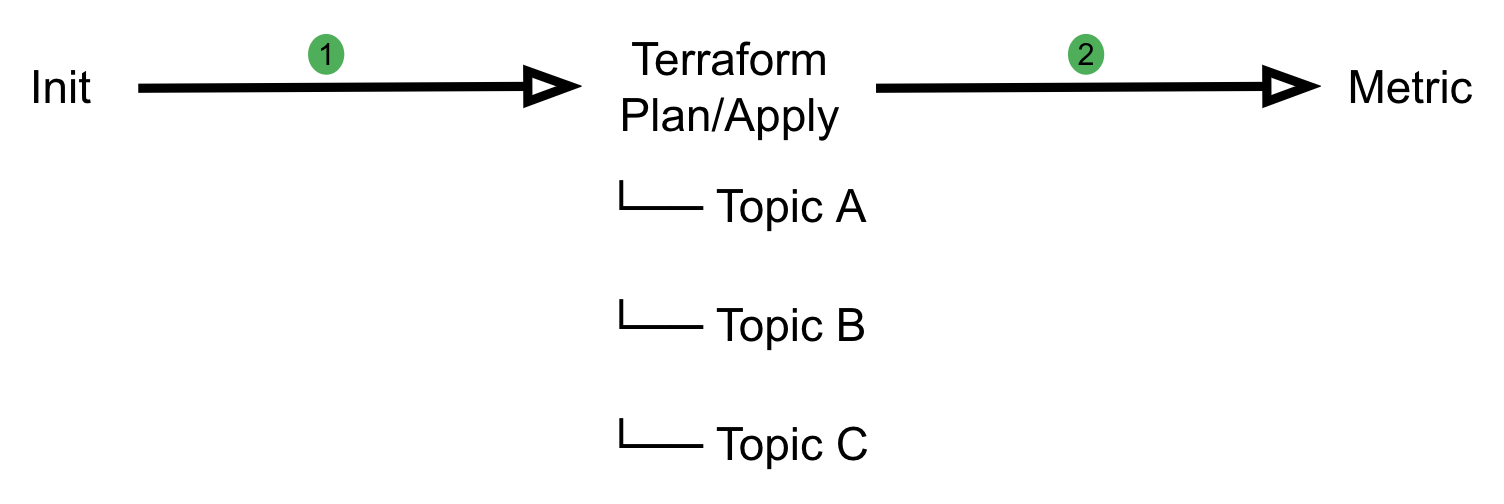
Fig. 4 An example of a Khone pipeline
Initialisation stage
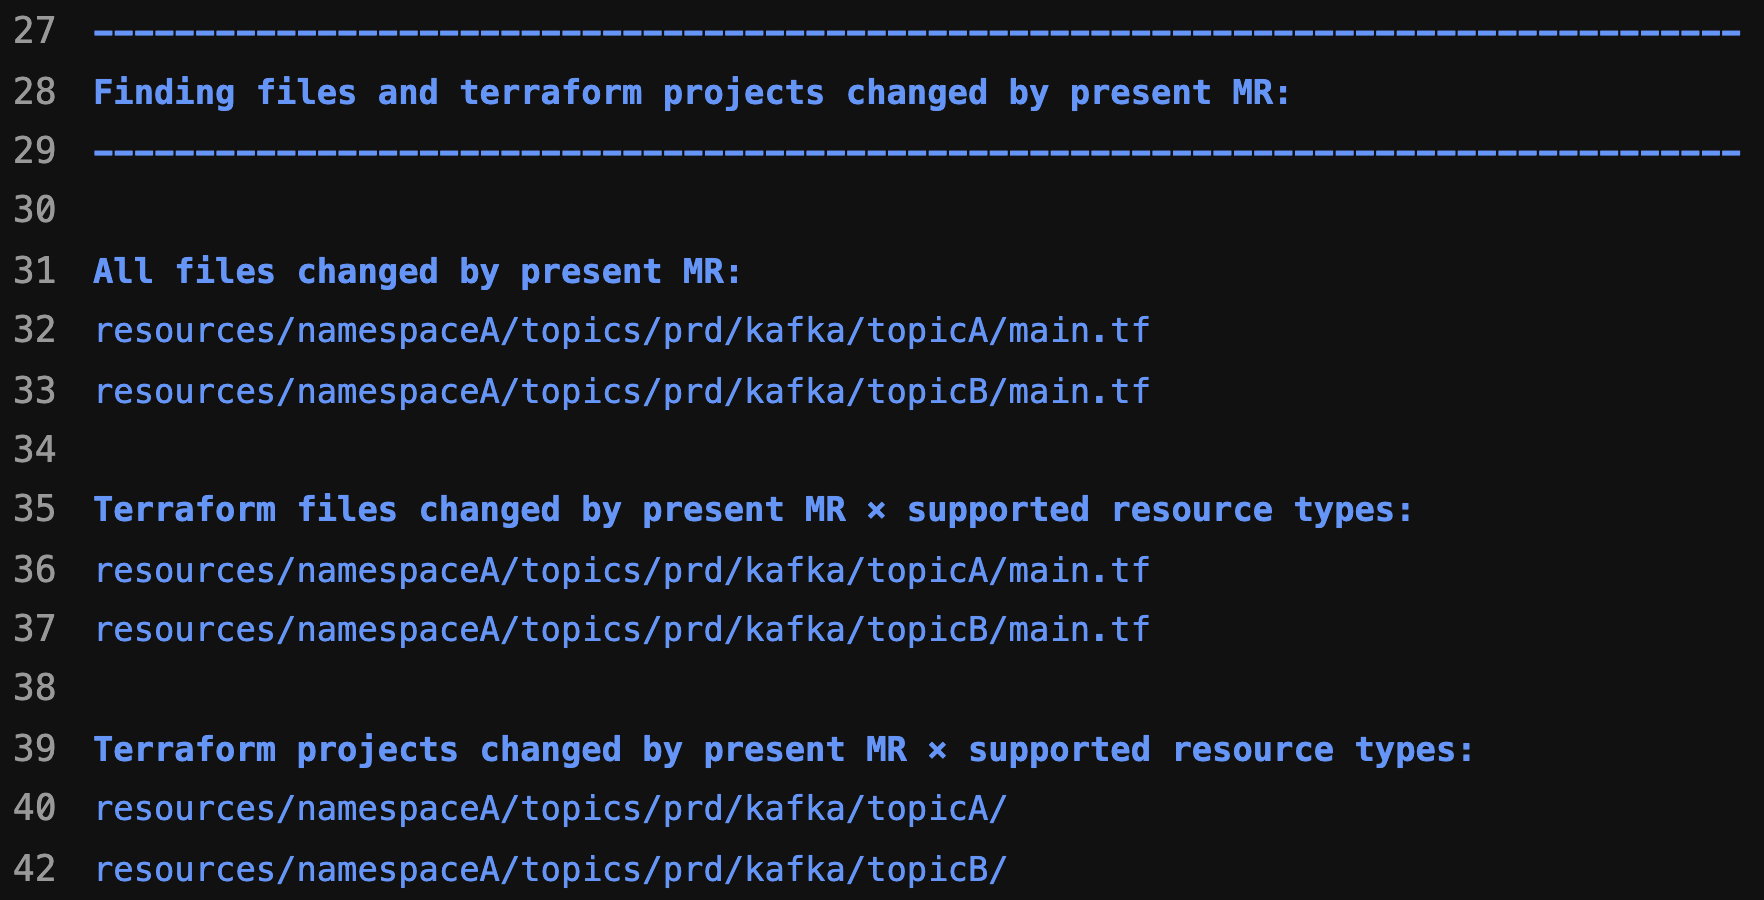
At this stage, we categorise the changes into Deleted, Created or Changed resources and filter out unsupported resource types. We also prevent users from creating unintended resources by validating them based on resource path and inspecting the HCL source code in their Terraform module. This stage also prepares artefacts for subsequent stages.
Fig. 5 Terraform changes detected by Khone
Terraform stage
This is a downstream pipeline that runs either the Terraform plan or Terraform apply command depending on the state of the MR, which can either be pending review or merged. Individual jobs run in parallel for each resource change, which helps with performance and reduces the overall pipeline run time.
For each individual job, we implemented multiple security checkpoints such as:
Code inspection: We use the python-hcl2 library to read HCL content of Terraform resources to perform validation, restrict the types of Terraform resources users can create, and ensure that resources have the intended configurations. We also validate whitelisted Terraform module source endpoint based on the declared resource type. This enables us to inherit the flexibility of Python as a programming language and perform validations more dynamically rather than relying on HCL functions.
Resource validation: We validate configurations based on resource path to ensure users are following the correct and intended directory structure.
Linting and formatting: Perform HCL code linting and formatting using Terraform CLI to ensure code consistency.
Furthermore, our Terraform module independently validates parameters by verifying the working directory instead of relying on user input, acting as an additional layer of defence for validation.
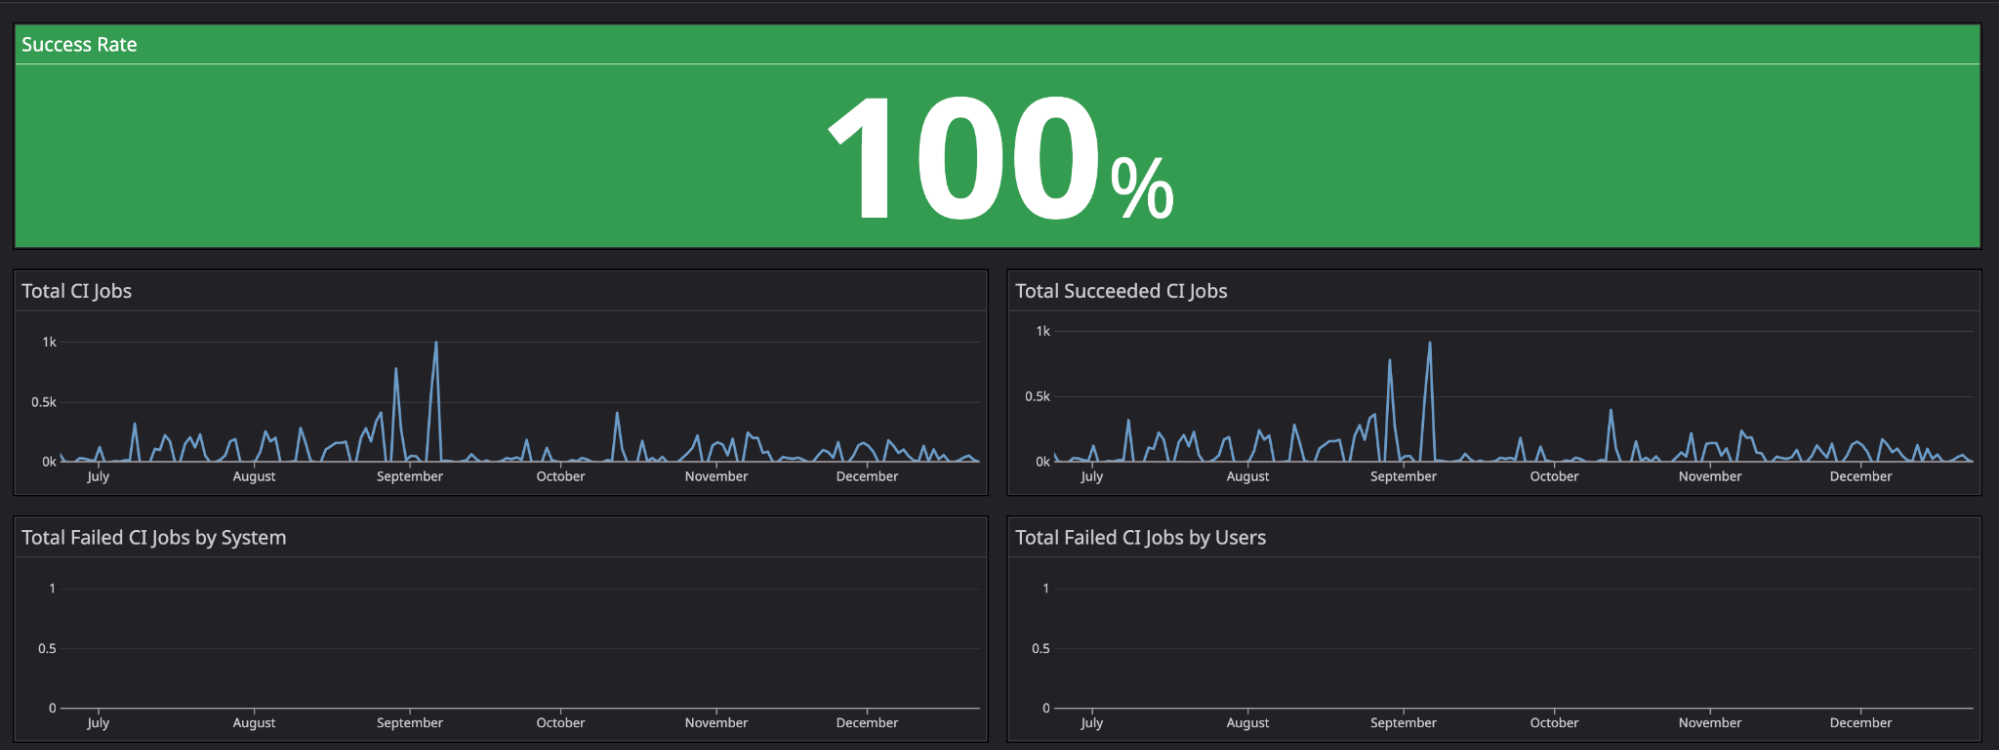
In this stage, we consolidate previous jobs’ status and publish our pipeline metrics such as success or error rate.
For our metrics, we identified actual users by omitting users from Coban. This helps us measure success metrics more consistently as we could isolate metrics from test continuous integration/continuous deployment (CI/CD) pipelines.
For the second half of 2022, we achieved a 100% uptime for Khone pipelines.
Fig. 6 Khone’s success metrics for the second half of 2022
Preventing pipeline config tampering
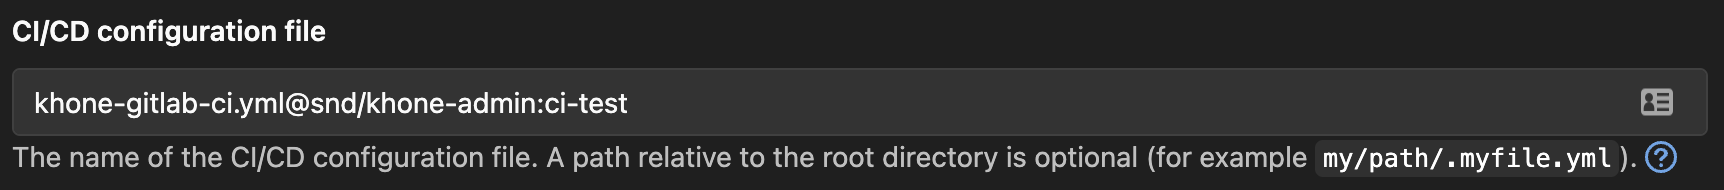
By default, with each repository on GitLab that has CI/CD pipelines enabled, owners or administrators would need to have a pipeline config file at the root directory of the repository with the name .gitlab-ci.yml. Other scripts may also be stored somewhere within the repository.
With this setup, whenever a user creates an MR, if the pipeline config file is modified as part of the MR, the modified version of the config file will be immediately reflected in the pipeline’s run. Users can exploit this by running arbitrary code on the privileged GitLab runner.
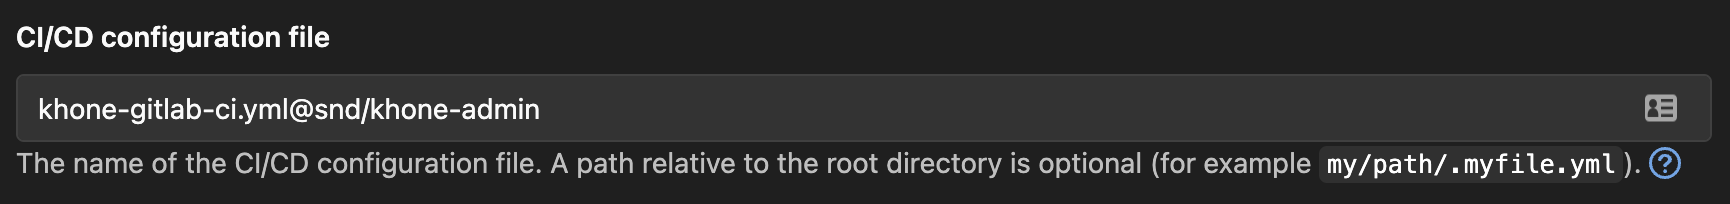
In order to prevent this, we utilise GitLab’s remote pipeline config functionality. We have created another private repository, khone-admin, and stored our pipeline config there.
Fig. 7 Khone’s remote pipeline config
In Fig. 7, our configuration is set to a file called khone-gitlab-ci.yml residing in the khone-admin repository under snd group.
Preventing pipeline scripts tampering
We had scripts that ran before the MR and they were approved and merged to perform preliminary checks or validations. They were also used to run the Terraform plan command. Users could modify these existing scripts to perform malicious actions. For example, they could bypass all validations and directly run the Terraform apply command to create unintended resources.
This can be prevented by storing all of our scripts in the khone-admin repository and cloning them in each stage of our pipeline using the before_script clause.
Even though this adds an overhead to each of our pipeline jobs and increases run time, the amount is insignificant as we have optimised the process by using shallow cloning. The Git clone command included in the above script with depth=1 and single-branch flag has reduced the time it takes to clone the scripts down to only 0.59 seconds.
Testing our pipeline
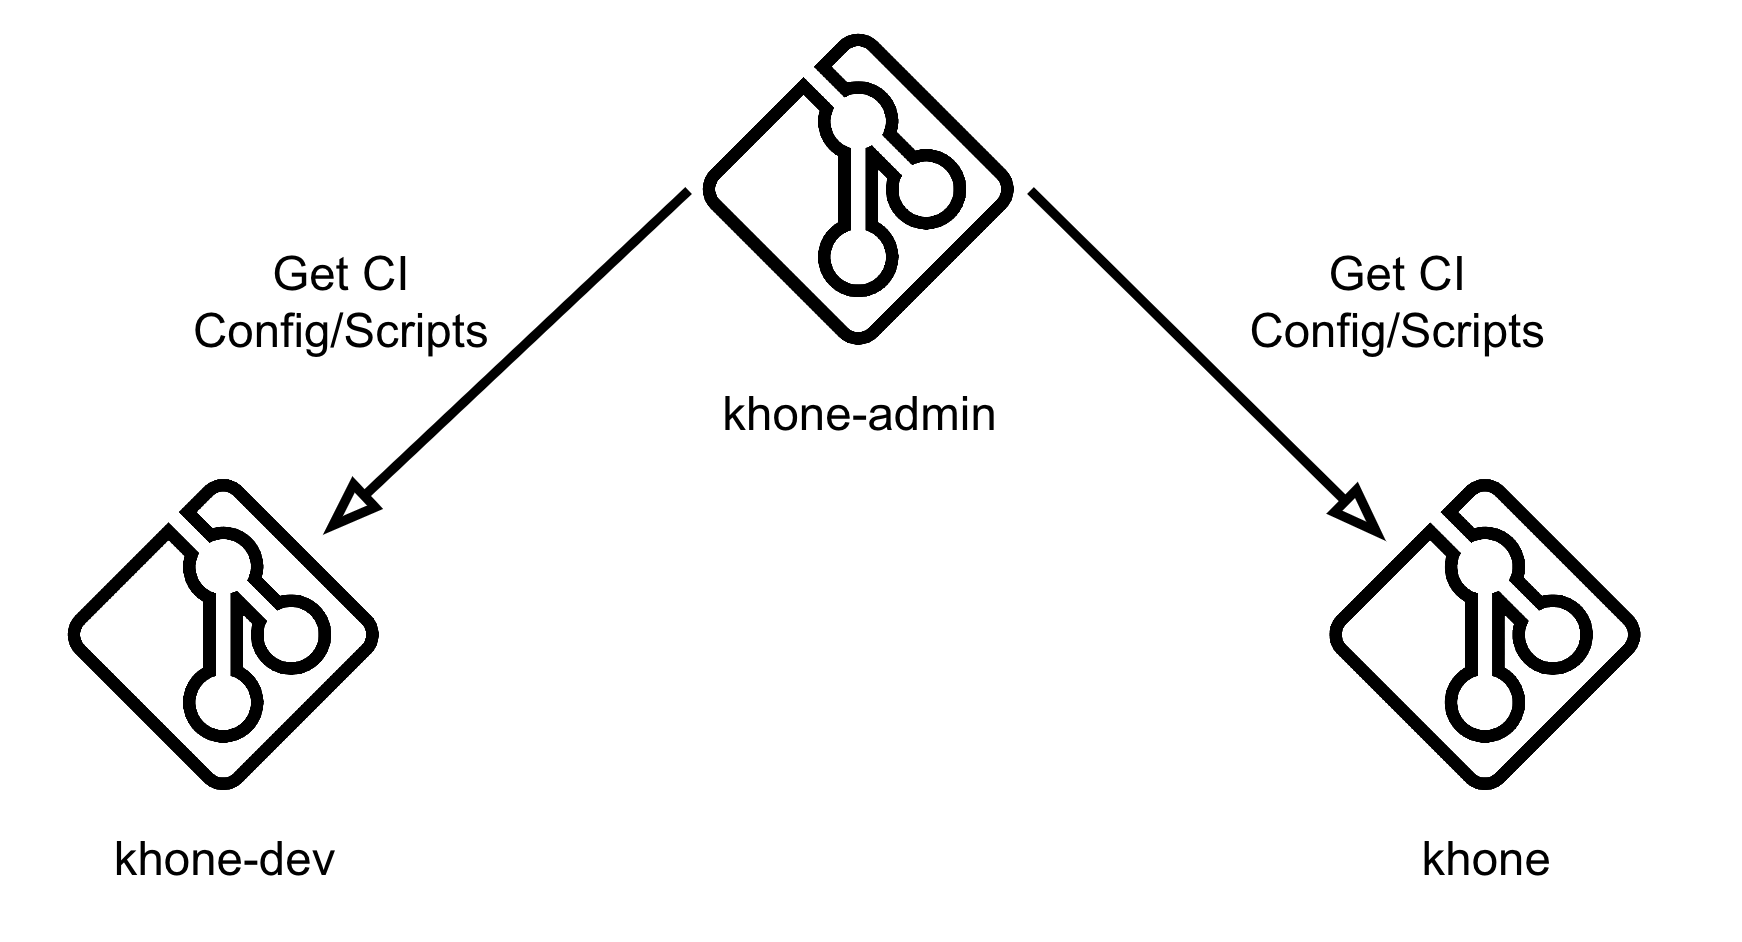
With all the security measures implemented for Khone, this raises a question of how did we test the pipeline? We have done this by setting up an additional repository called khone-dev.
Fig. 8 Repositories relationship
Pipeline config
Within this khone-dev repository, we have set up a remote pipeline config file following this format:
<File Name>@<Repository Ref>:<Branch Name>
Fig. 9 Khone-dev’s remote pipeline config
In Fig. 9, our configuration is set to a file called khone-gitlab-ci.yml residing in the khone-admin repository under the snd group and under a branch named ci-test. With this approach, we can test our pipeline config without having to merge it to master branch that affects the main Khone repository. As a security measure, we only allow users within a certain GitLab group to push changes to this branch.
Pipeline scripts
Following the same method for pipeline scripts, instead of cloning from the master branch in the khone-admin repository, we have implemented a logic to clone them from the branch matching our lightweight directory access protocol (LDAP) user account if it exists. We utilised the GITLAB_USER_LOGIN environment variable that is injected by GitLab to each individual CI job to get the respective LDAP account to perform this logic.
default:
  before_script:
    - rm -rf khone_admin
    - |
      if git ls-remote --exit-code --heads "https://gitlab-ci-token:${CI_JOB_TOKEN}@gitlab.myteksi.net/snd/khone-admin.git" "$GITLAB_USER_LOGIN" > /dev/null; then
        echo "Cloning khone-admin from dev branch ${GITLAB_USER_LOGIN}"
        git clone --depth 1 --branch "$GITLAB_USER_LOGIN" --single-branch "https://gitlab-ci-token:${CI_JOB_TOKEN}@gitlab.myteksi.net/snd/khone-admin.git" khone_admin
      else
        echo "Dev branch ${GITLAB_USER_LOGIN} not found, cloning from master instead"
        git clone --depth 1 --single-branch "https://gitlab-ci-token:${CI_JOB_TOKEN}@gitlab.myteksi.net/snd/khone-admin.git" khone_admin
      fi
What’s next?
With security being our main focus for our Khone GitOps pipeline, we plan to abide by the principle of least privilege and implement separate GitLab runners for different types of resources and assign them with just enough IAM roles and policies, and minimal network security group rules to access our Kafka or Kubernetes clusters.
Furthermore, we also plan to maintain high standards and stability by including unit tests in our CI scripts to ensure that every change is well-tested before being deployed.
Special thanks to Fabrice Harbulot for kicking off this project and building a strong foundation for it.
Join us
Grab is the leading superapp platform in Southeast Asia, providing everyday services that matter to consumers. More than just a ride-hailing and food delivery app, Grab offers a wide range of on-demand services in the region, including mobility, food, package and grocery delivery services, mobile payments, and financial services across 428 cities in eight countries.
Powered by technology and driven by heart, our mission is to drive Southeast Asia forward by creating economic empowerment for everyone. If this mission speaks to you, join our team today!
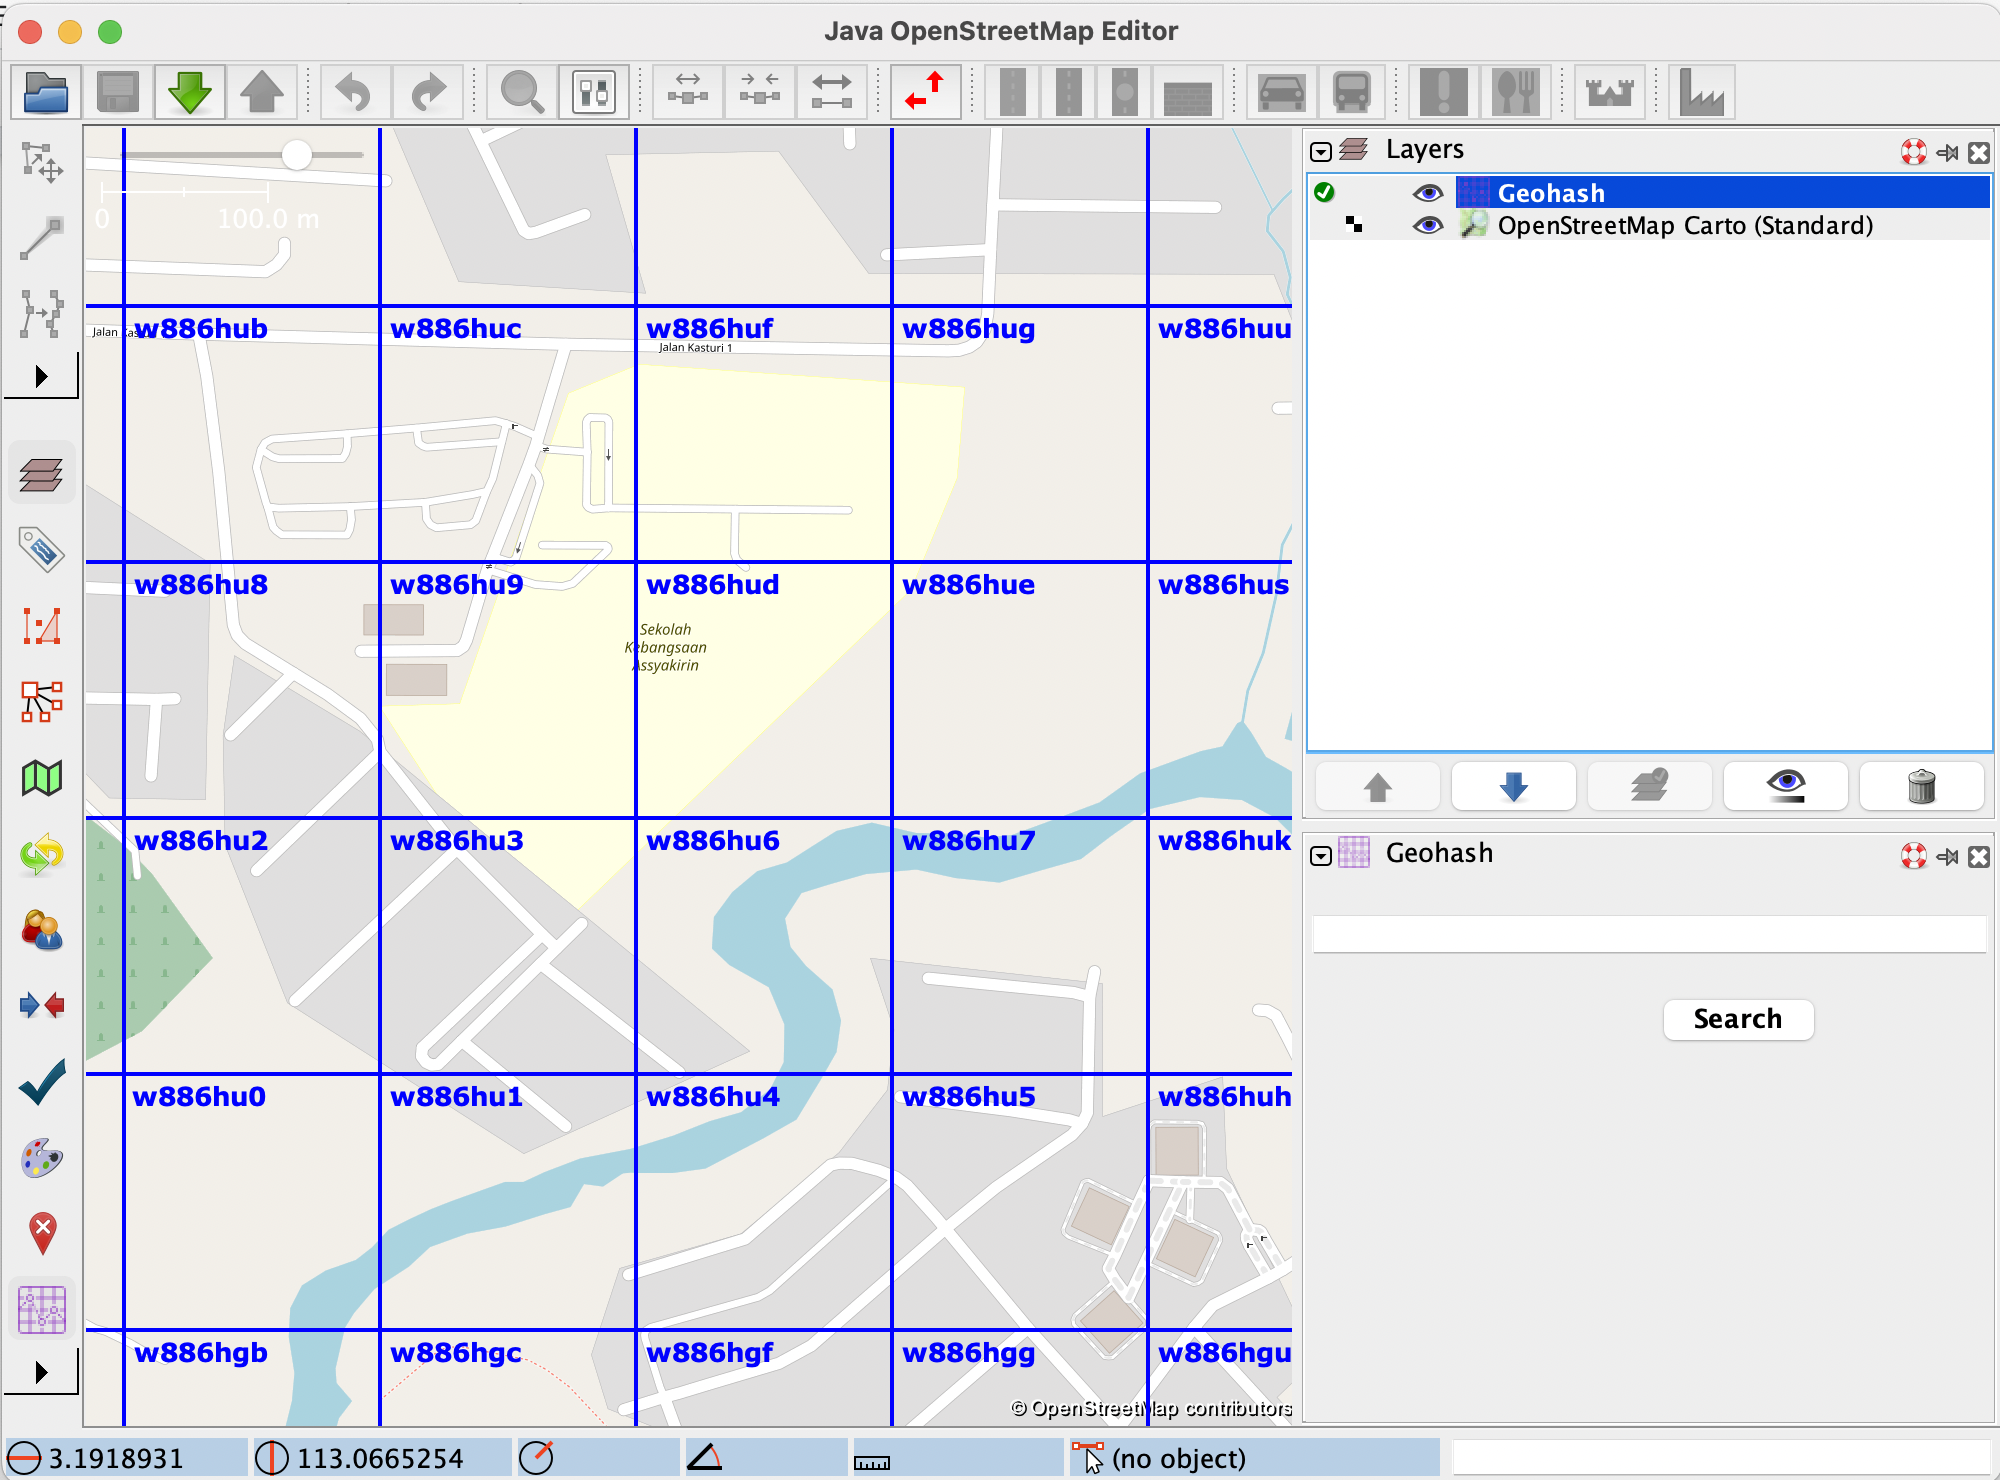
Geohash is an encoding system with a unique identifier for each region on the planet. Therefore, all geohash units can be associated with an individual set of digits and letters.
Geohash is a plugin built by Grab that is available in the Java OpenStreetMap Editor (JOSM) tool, which comes in handy for those who work on precise areas based on geohash units.
Background
Up until recently, users of the Geohash JOSM plugin were unable to stop the displaying of new geohashes with every zoom-in or zoom-out. This meant that every time they changed the zoom, new geohashes would be displayed, and this became bothersome for many users when it was unneeded. The previous behaviour of the plugin when zooming in and out is depicted in the following short video:
This led to the implementation of the zoom freeze feature, which helps users toggle between Enable zoom freeze and Disable zoom freeze, based on their needs.
Solution
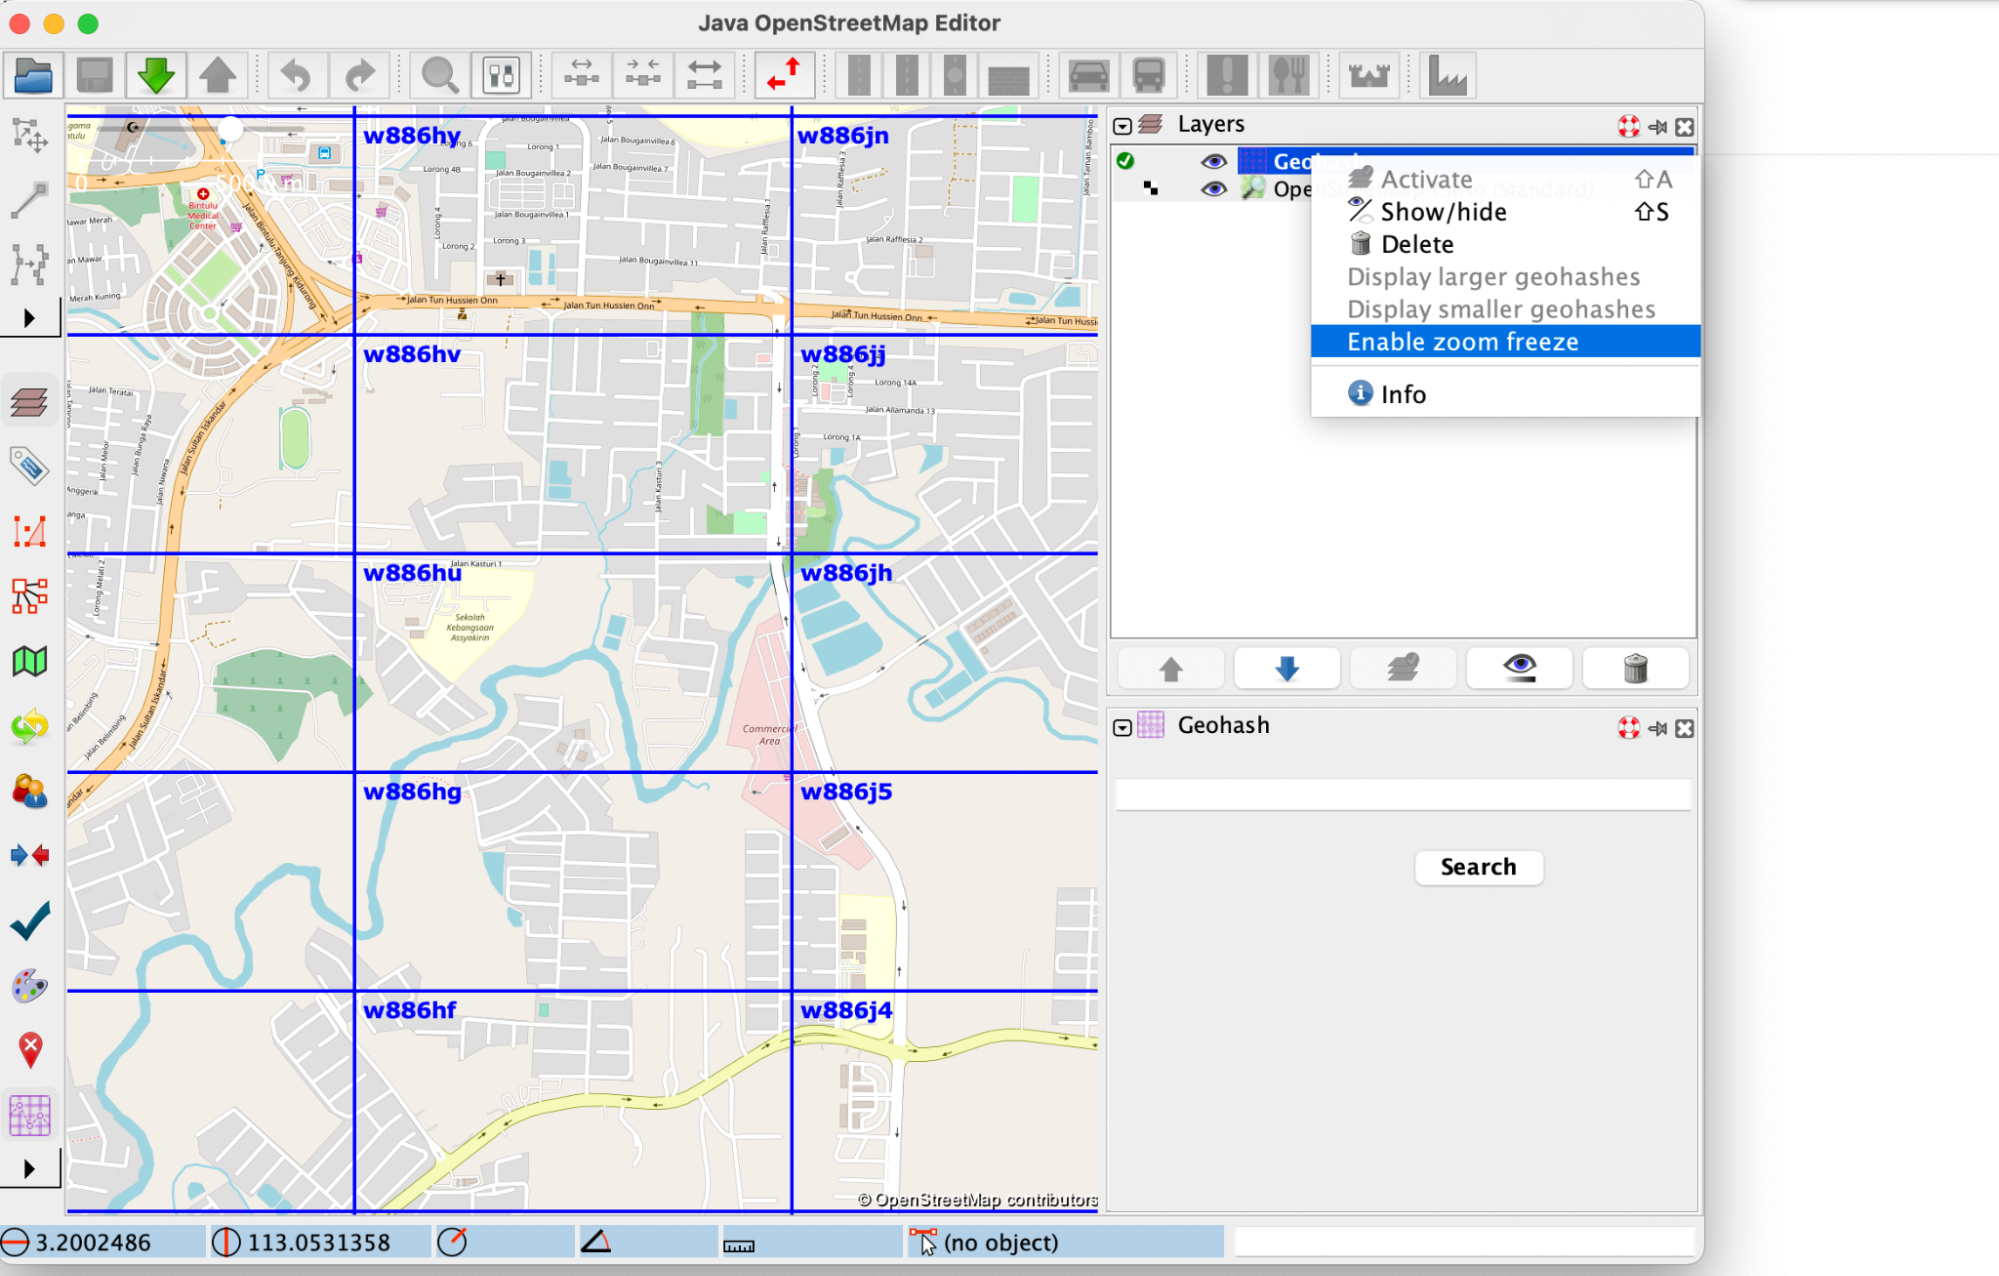
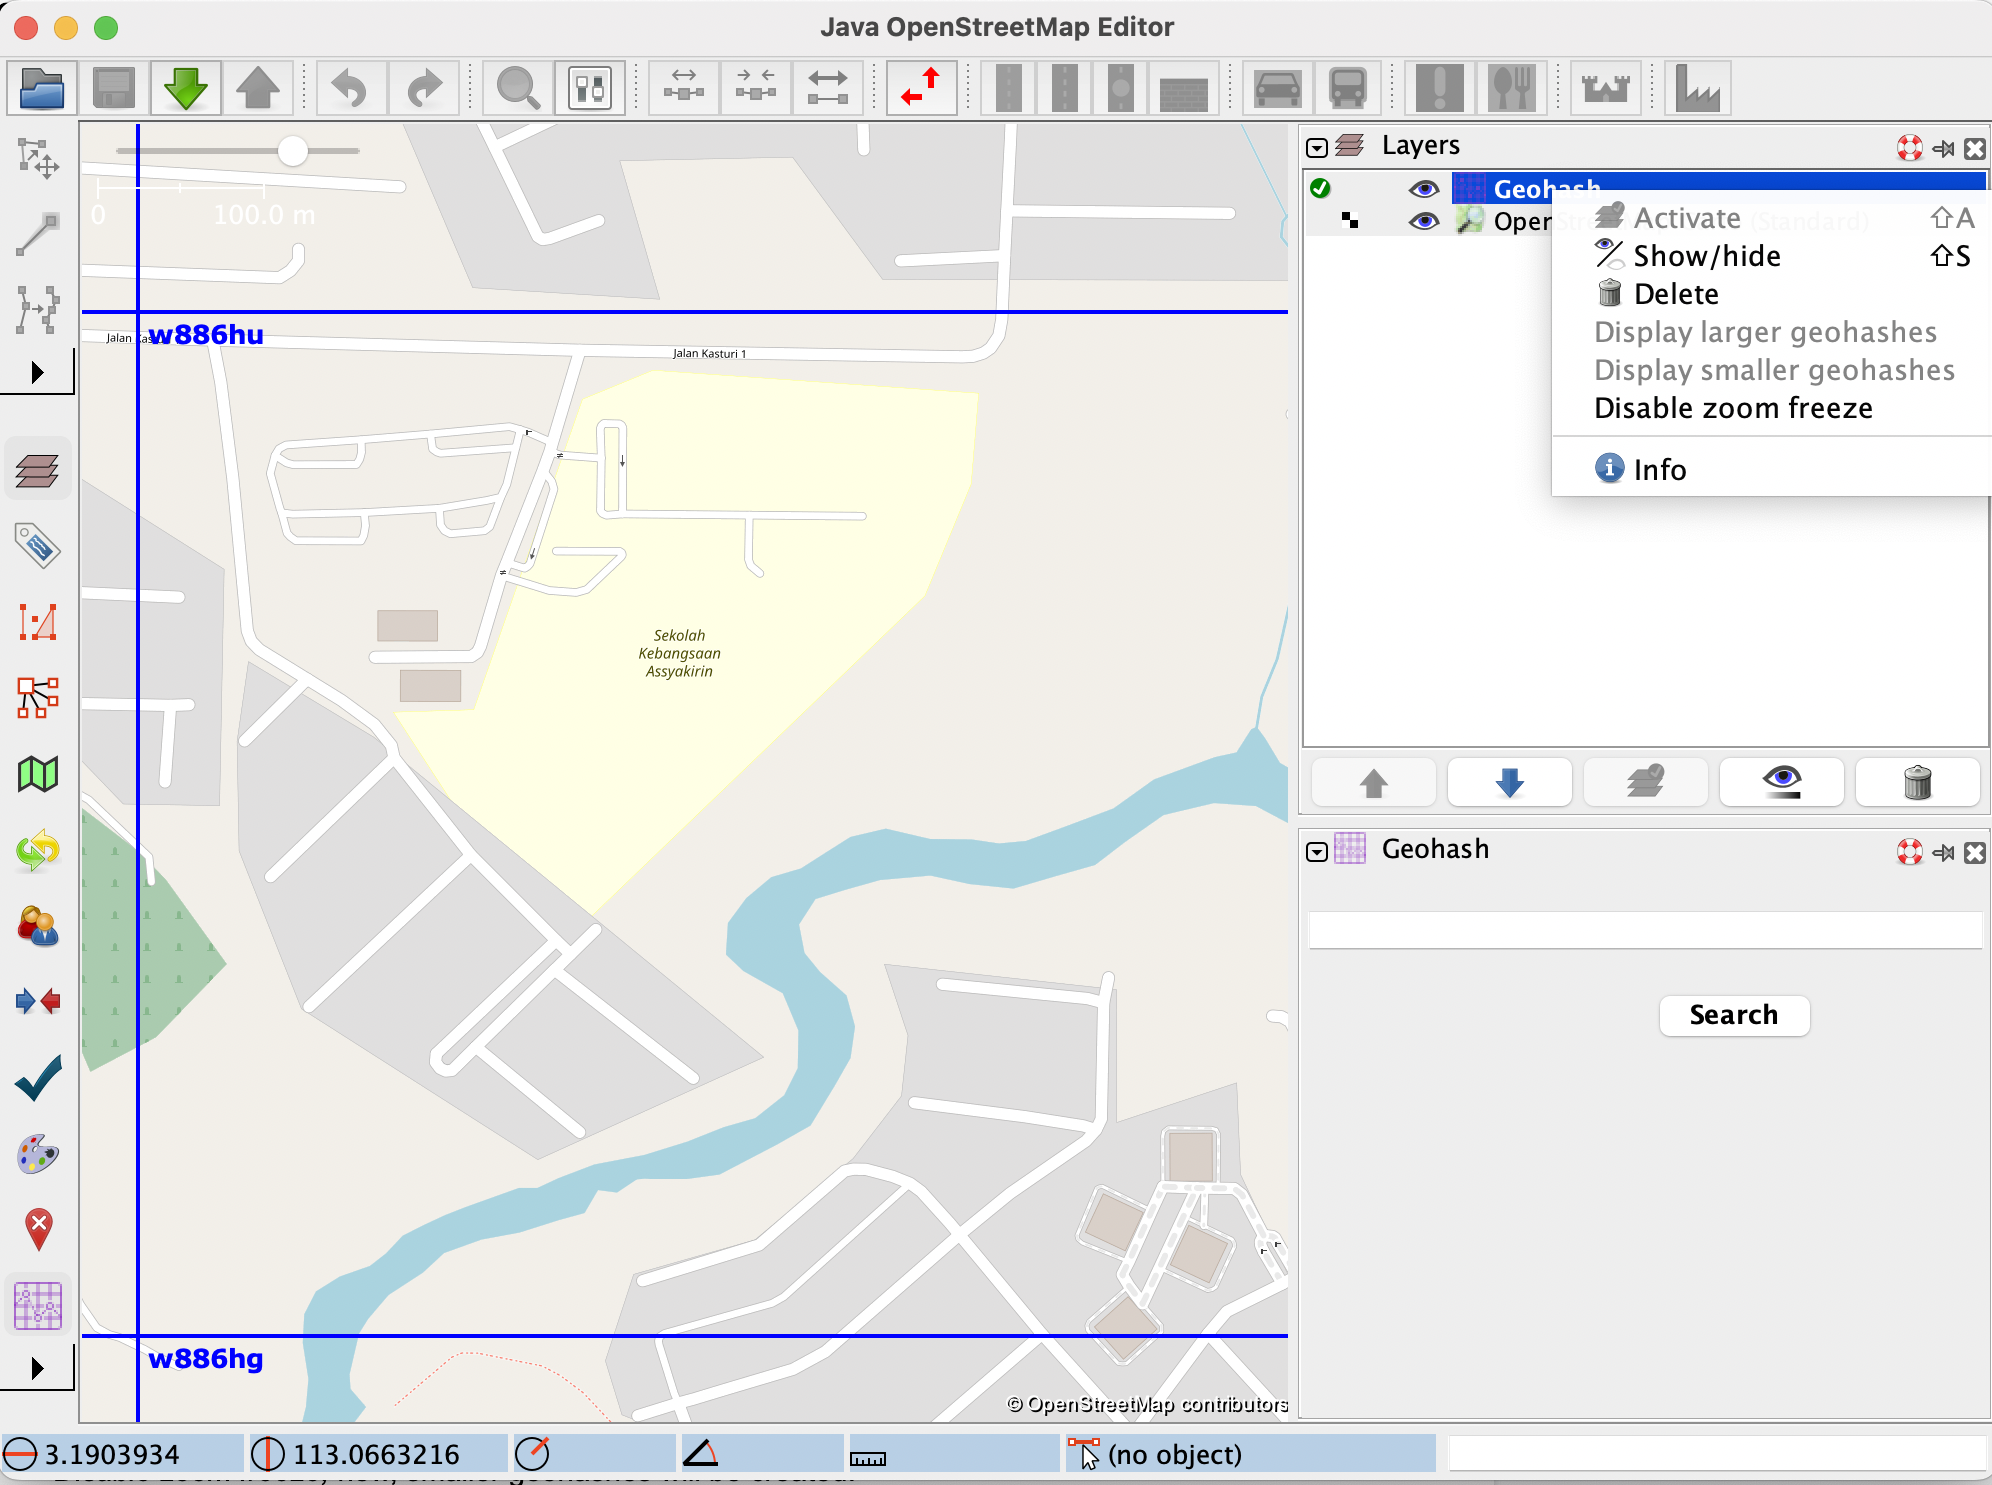
As you can see in the following image, a new label was created with the purpose of freezing or unfreezing the display of new geohashes with each zoom change:
By default, this label says “Enable zoom freeze”, and when zoom freezing is enabled, the label changes to “Disable zoom freeze”.
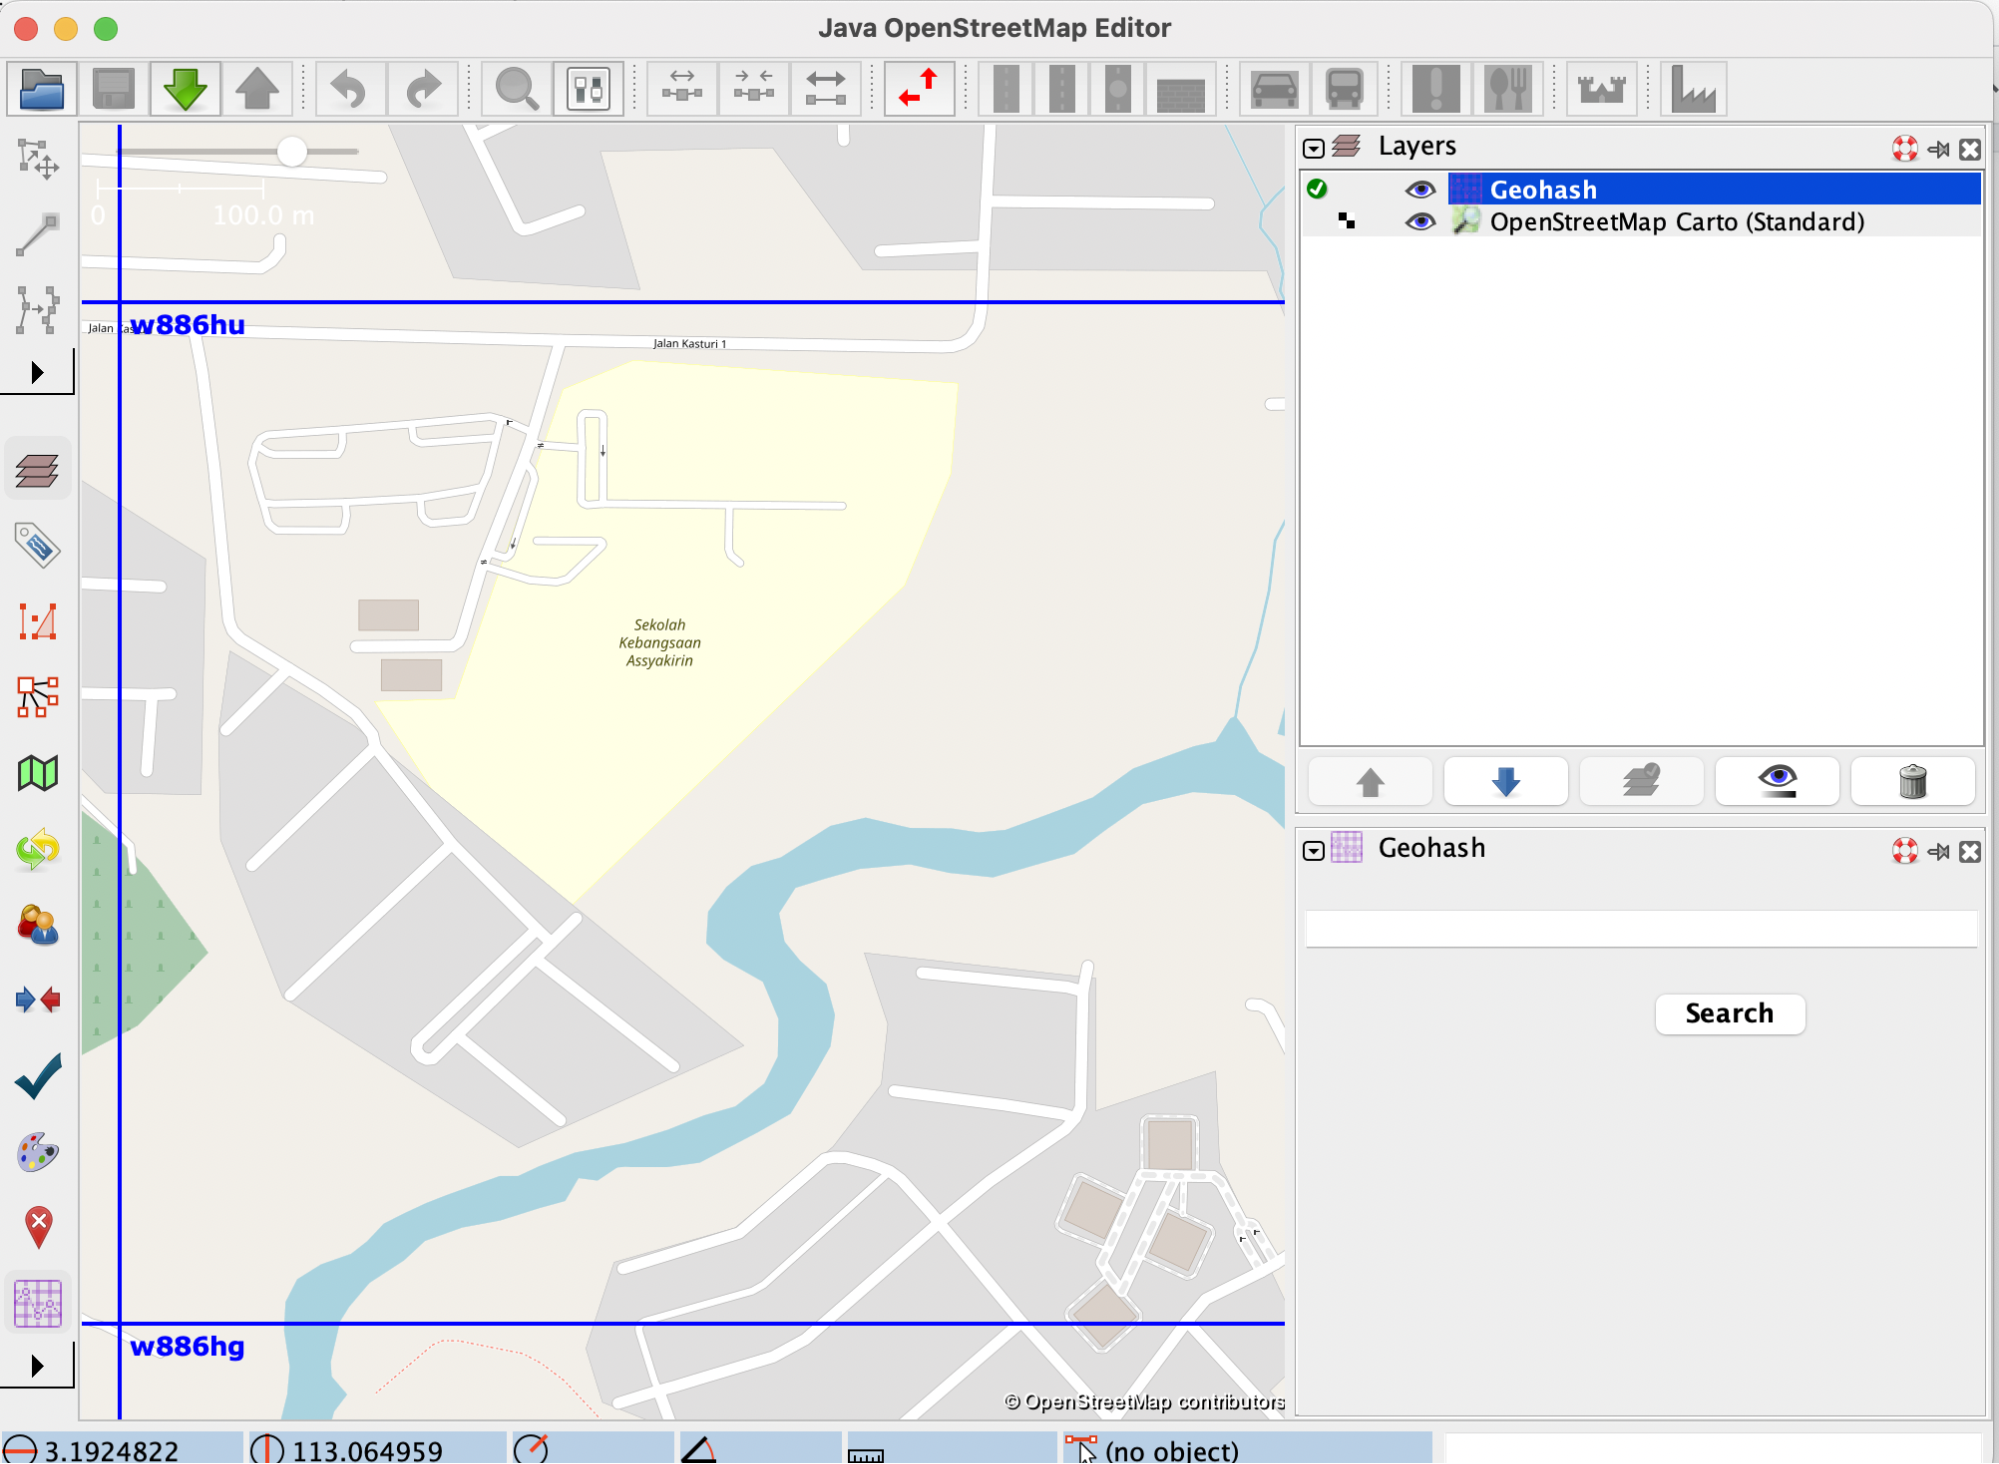
In order to see how zoom freezing works, let’s consider the following example: a user wants to zoom inside the geohash with the code w886hu, without triggering the display of smaller geohashes inside of it. For this purpose, the user will enable the zoom freezing feature by clicking on the label, and then they will proceed with the zoom. The map will look like this:
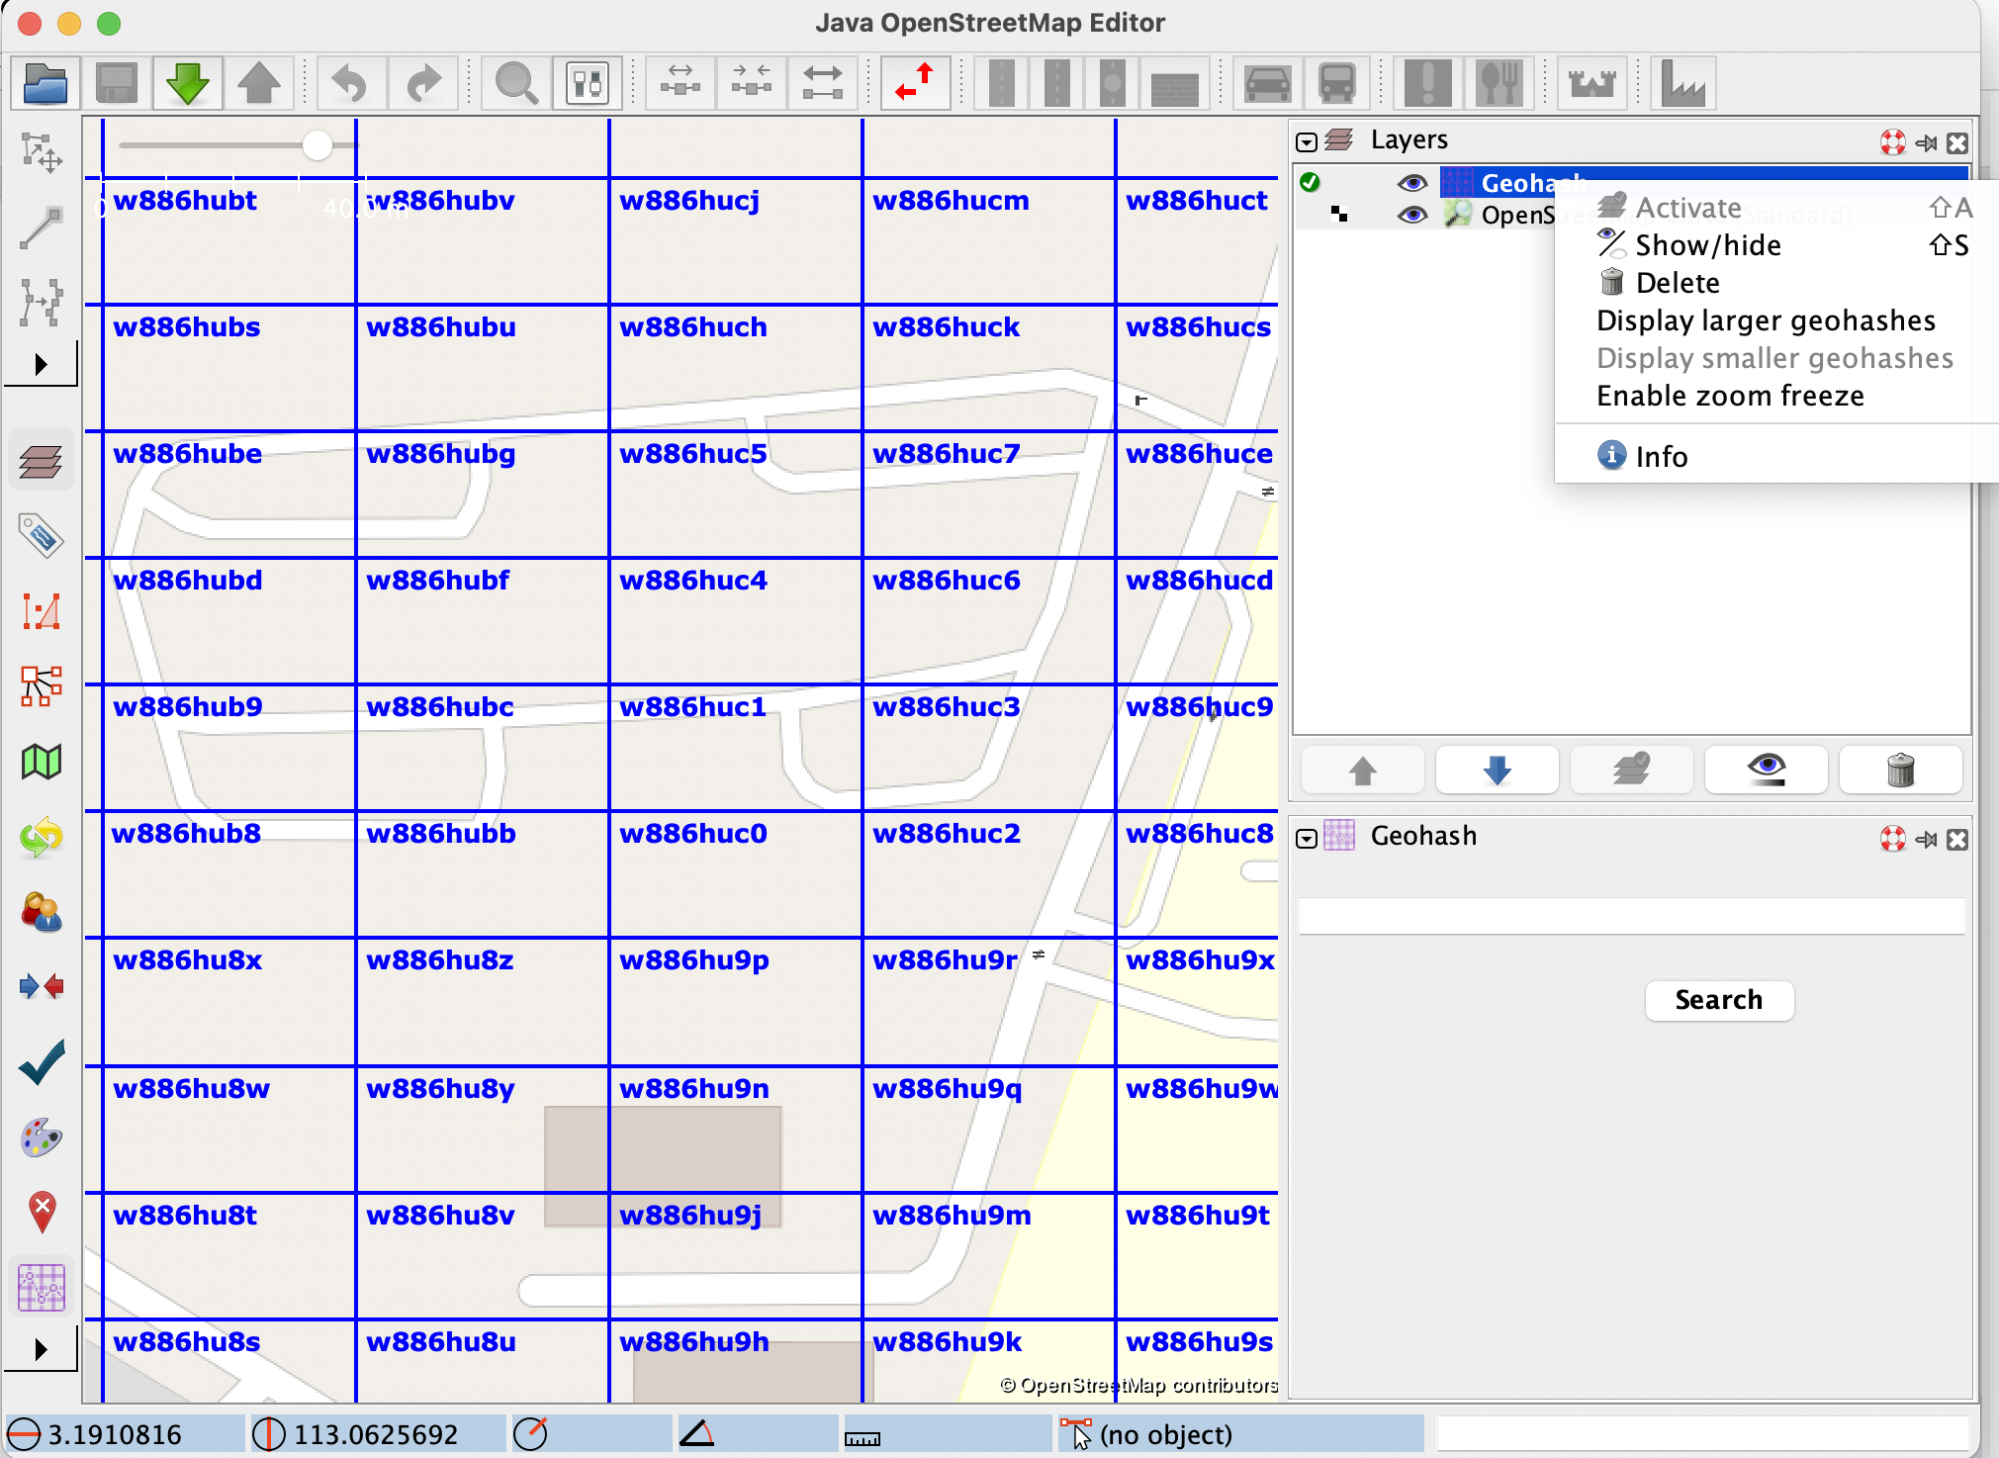
It is apparent from the image that no new geohashes were created. Now, let’s say the user has finished what they wanted to do, and wants to go back to the “normal” geohash visualisation mode, which means disabling the zoom freeze option. After clicking on the label that now says ‘Disable zoom freeze’, new, smaller geohashes will be displayed, according to the current zoom level:
The functionality is illustrated in the following short video:
Another effect that enabling zoom freeze has is that it disables the ‘Display larger geohashes’ and ‘Display smaller geohashes’ options, since the geohashes are now fixed. The following images show how these options work before and after disabling zoom freeze:
To conclude, we believe that the release of this new feature will benefit users by making it more comfortable for them to zoom in and out of a map. By turning off the display of new geohashes when this is unwanted, map readability is improved, and this translates to a better user experience.
Impact/Limitations
In order to start using this new feature, users need to update the Geohash JOSM plugin.
Grab is the leading superapp platform in Southeast Asia, providing everyday services that matter to consumers. More than just a ride-hailing and food delivery app, Grab offers a wide range of on-demand services in the region, including mobility, food, package and grocery delivery services, mobile payments, and financial services across 428 cities in eight countries.
Powered by technology and driven by heart, our mission is to drive Southeast Asia forward by creating economic empowerment for everyone. If this mission speaks to you, join our team today!
In the present age, data linkages can generate significant business value. Whether we want to learn about the relationships between users in online social networks, between users and products in e-commerce, or understand credit relationships in financial networks, the capability to understand and analyse large amounts of highly interrelated data is becoming more important to businesses.
As the amount of consumer data grows, the GrabDefence team must continuously enhance fraud detection on mobile devices to proactively identify the presence of fraudulent or malicious users. Even simple financial transactions between users must be monitored for transaction loops and money laundering. To preemptively detect such scenarios, we need a graph service platform to help discover data linkages.
Background
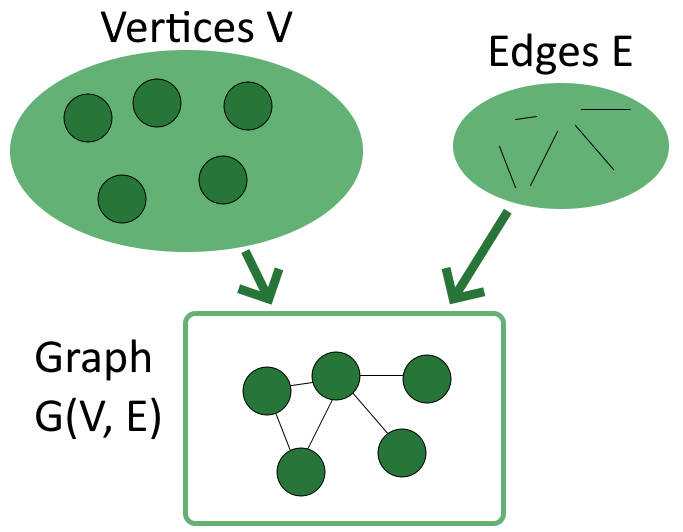
As mentioned in an earlier article, a graph is a model representation of the association of entities and holds knowledge in a structured way by marginalising entities and relationships. In other words, graphs hold a natural interpretability of linked data and graph technology plays an important role. Since the early days, large tech companies started to create their own graph technology infrastructure, which is used for things like social relationship mining, web search, and sorting and recommendation systems with great commercial success.
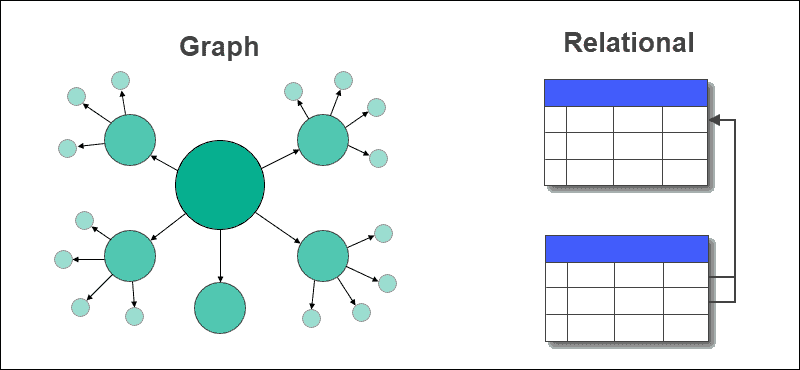
As graph technology was developed, the amount of data gathered from graphs started to grow as well, leading to a need for graph databases. Graph databases1 are used to store, manipulate, and access graph data on the basis of graph models. It is similar to the relational database with the feature of Online Transactional Processing (OLTP), which supports transactions, persistence, and other features.
A key concept of graphs is the edge or relationship between entities. The graph relates the data items in the store to a collection of nodes and edges, the edges representing the relationships between the nodes. These relationships allow data in the store to be linked directly and retrieved with one operation.
With graph databases, relationships between data can be queried fast as they are perpetually stored in the database. Additionally, relationships can be intuitively visualised using graph databases, making them useful for heavily interconnected data. To have real-time graph search capabilities, we must leverage the graph service platform and graph databases.
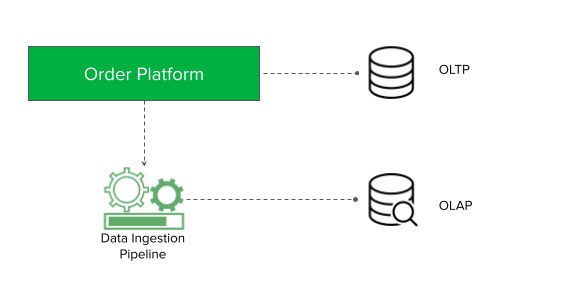
Architecture details
Graph services with graph databases are Platforms as a Service (PaaS) that encapsulate the underlying implementation of graph technology and support easier discovery of data association relationships with graph technologies.
They also provide universal graph operation APIs and service management for users. This means that users do not need to build graph runtime environments independently and can explore the value of data with graph service directly.
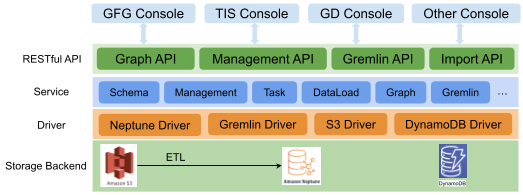
Fig. 1 Graph service platform system architecture
As shown in Fig. 1, the system can be divided into four layers:
Storage backend – Different forms of data (for example, CSV files) are stored in Amazon S3, graph data stores in Neptune and meta configuration stores in DynamoDB.
Driver – Contains drivers such as Gremlin, Neptune, S3, and DynamoDB.
Service – Manages clusters, instances, databases etc, provides management API, includes schema and data load management, graph operation logic, and other graph algorithms.
RESTful APIs – Currently supports the standard and uniform formats provided by the system, the Management API, Search API for OLTP, and Analysis API for online analytical processing (OLAP).
How it works
Graph flow
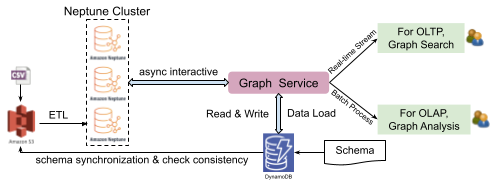
Fig. 2 Graph flow
CSV files stored in Amazon S3 are processed by extract, transform, and load (ETL) tools to generate graph data. This data is then managed by an Amazon Neptune DB cluster, which can only be accessed by users through graph service. Graph service converts user requests into asynchronous interactions with Neptune Cluster, which returns the results to users.
When users launch data load tasks, graph service synchronises the entity and attribute information with the CSV file in S3, and the schema stored in DynamoDB. The data is only imported into Neptune if there are no inconsistencies.
The most important component in the system is the graph service, which provides RESTful APIs for two scenarios: graph search for real-time streams and graph analysis for batch processing. At the same time, the graph service manages clusters, databases, instances, users, tasks, and meta configurations stored in DynamoDB, which implements features of service monitor and data loading offline or stream ingress online.
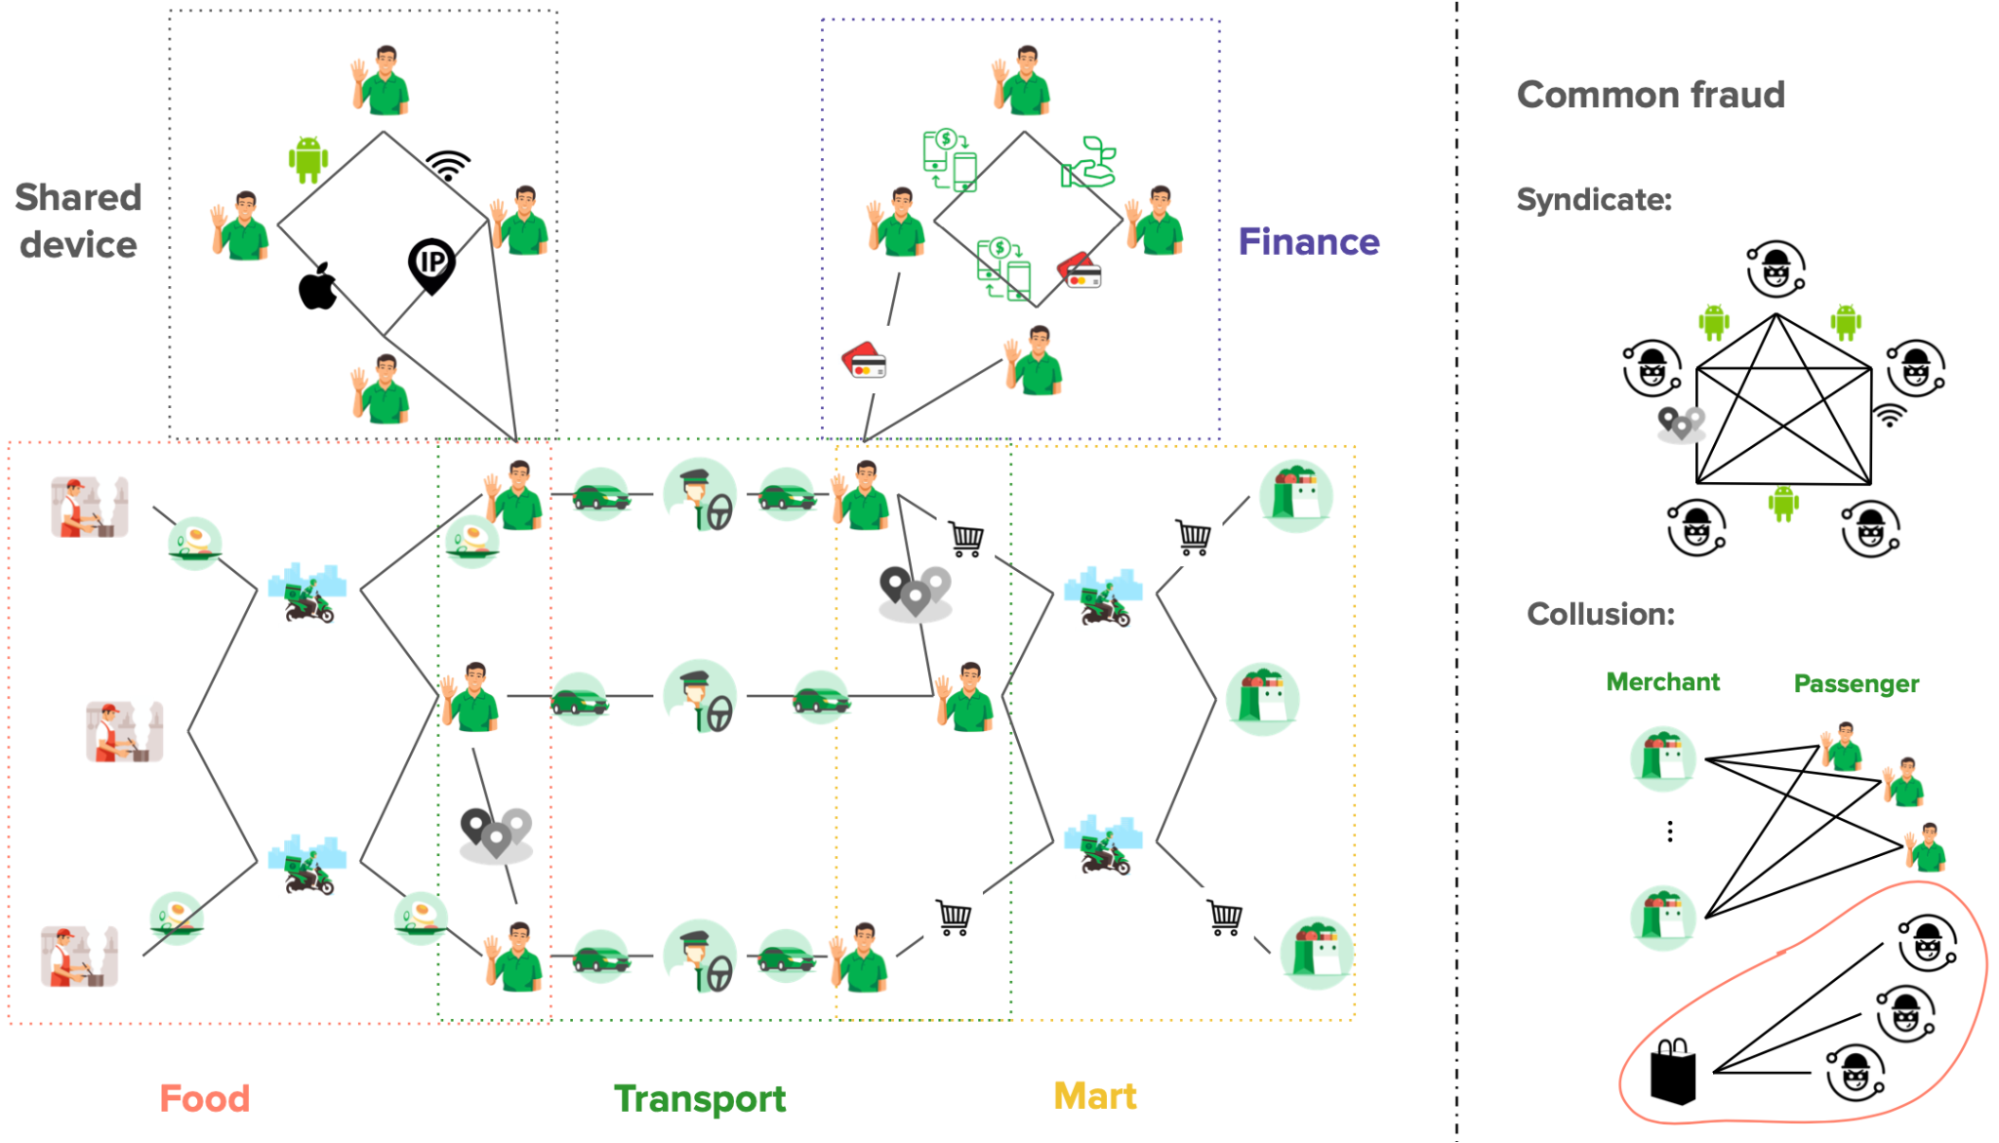
Use case in fraud detection
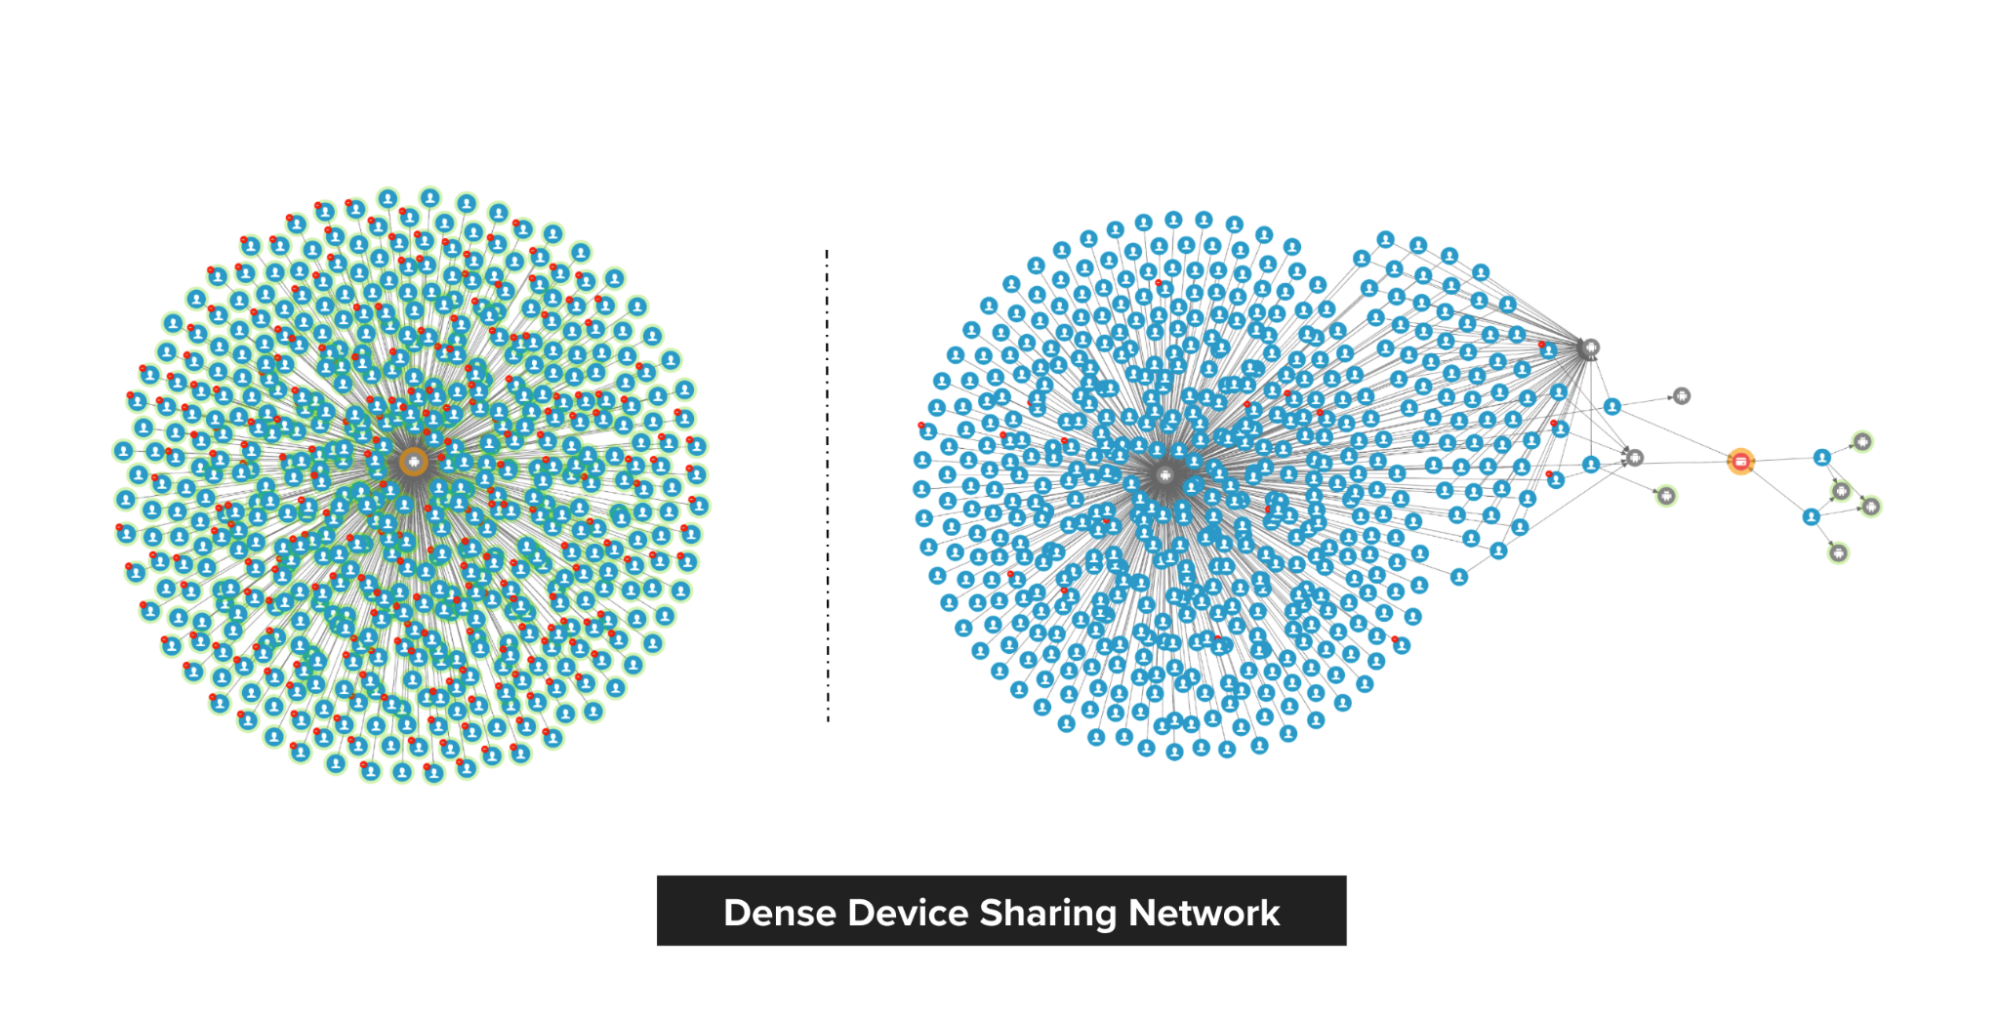
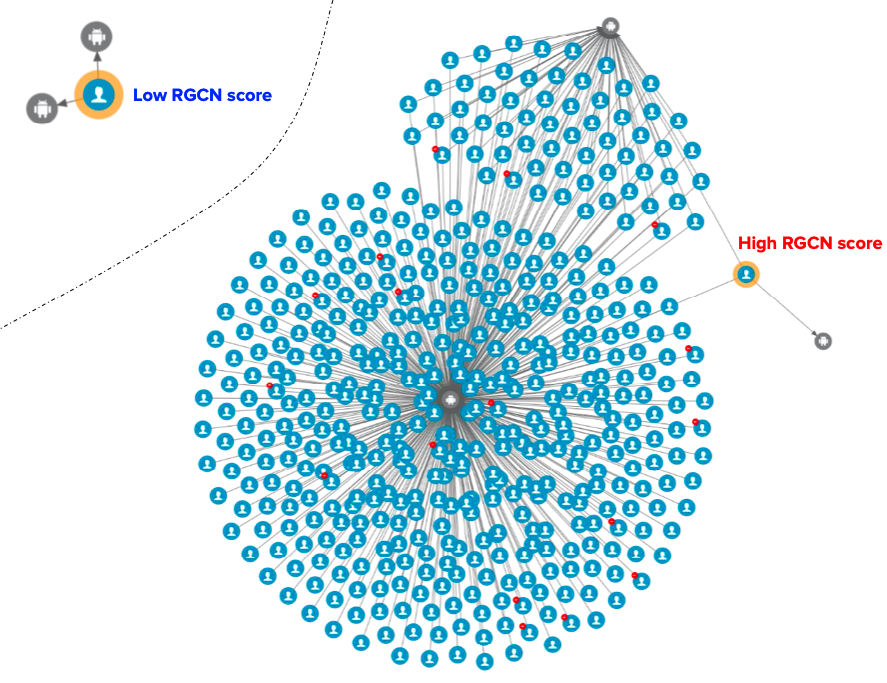
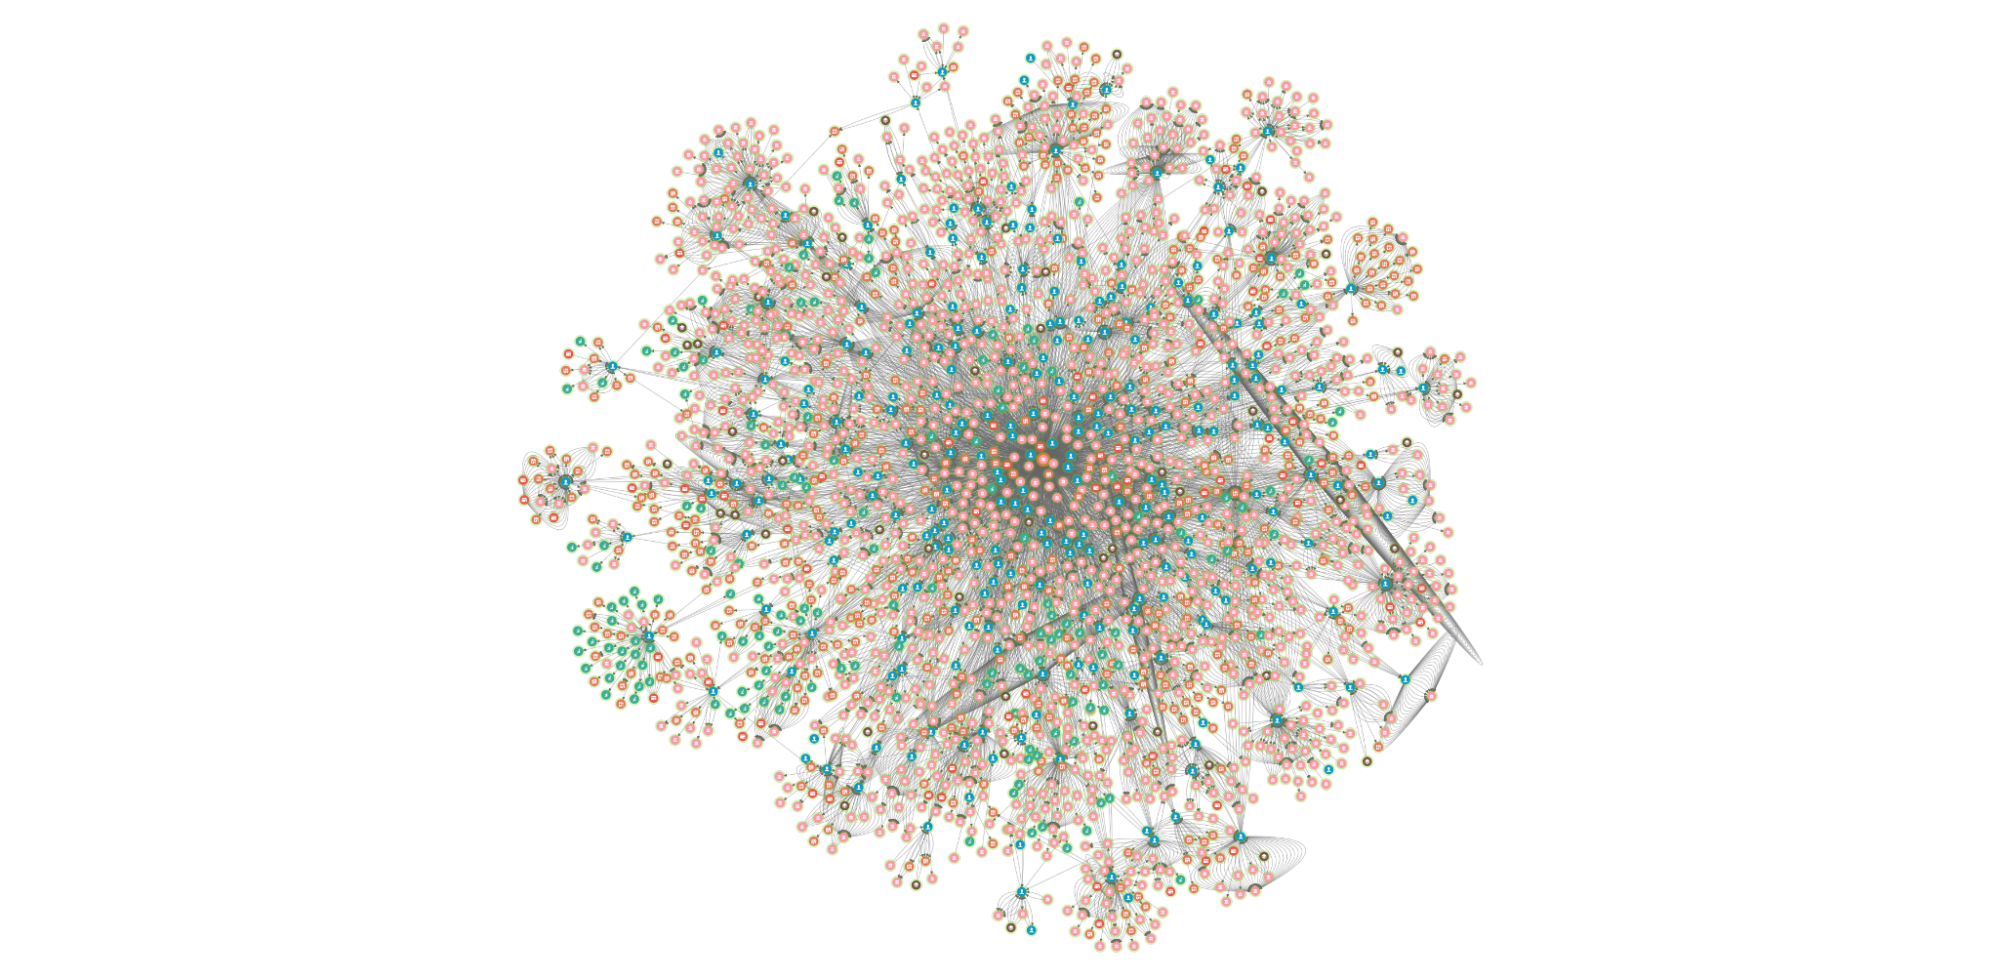
In Grab’s mobility business, we have come across situations where multiple accounts use shared physical devices to maximise their earning potential. With the graph capabilities provided by the graph service platform, we can clearly see the connections between multiple accounts and shared devices.
Historical device and account data are stored in the graph service platform via offline data loading or online stream injection. If the device and account data exists in the graph service platform, we can find the adjacent account IDs or the shared device IDs by using the device ID or account ID respectively specified in the user request.
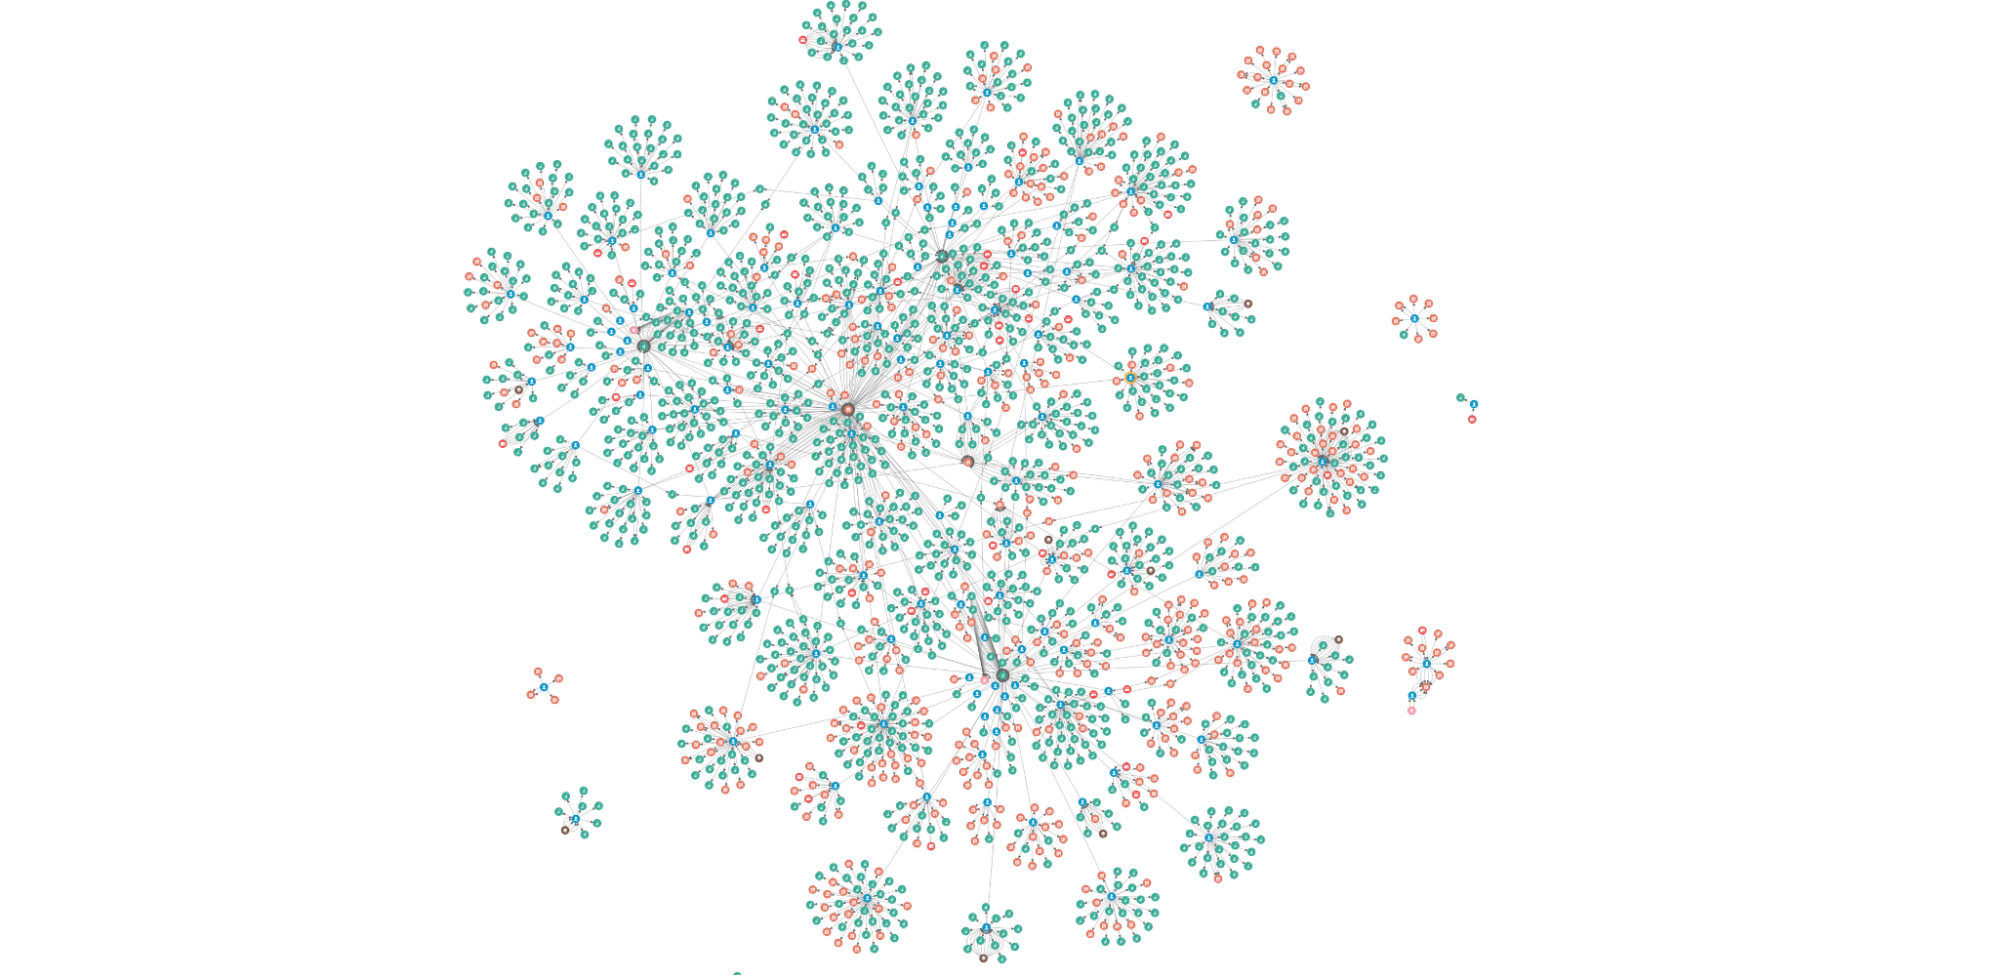
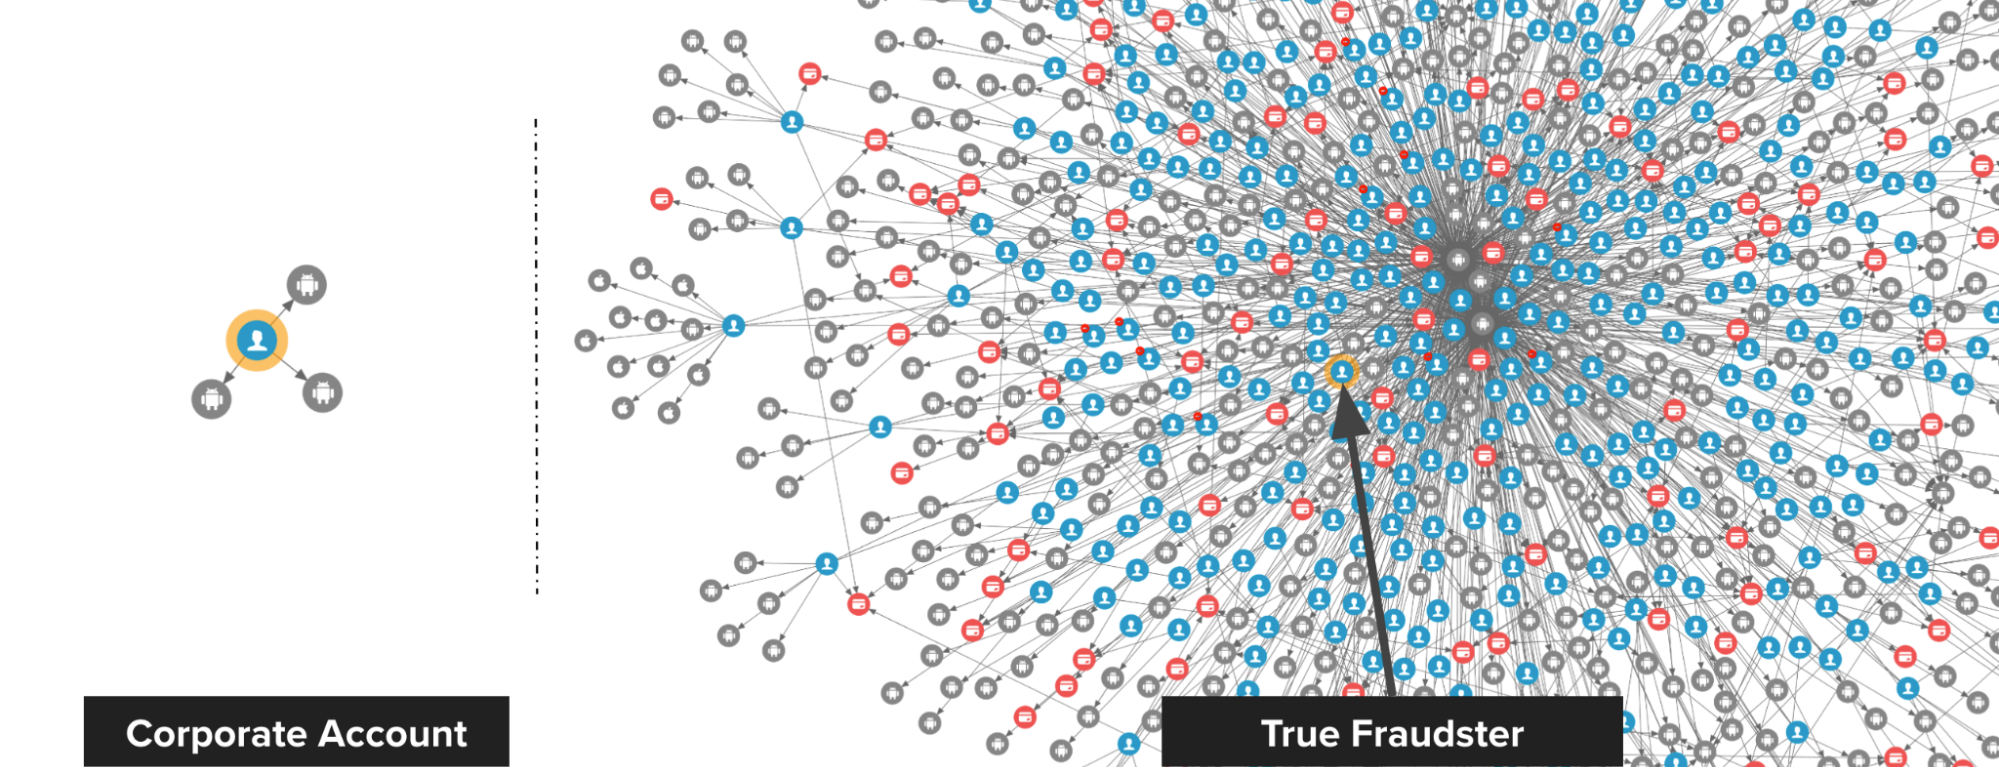
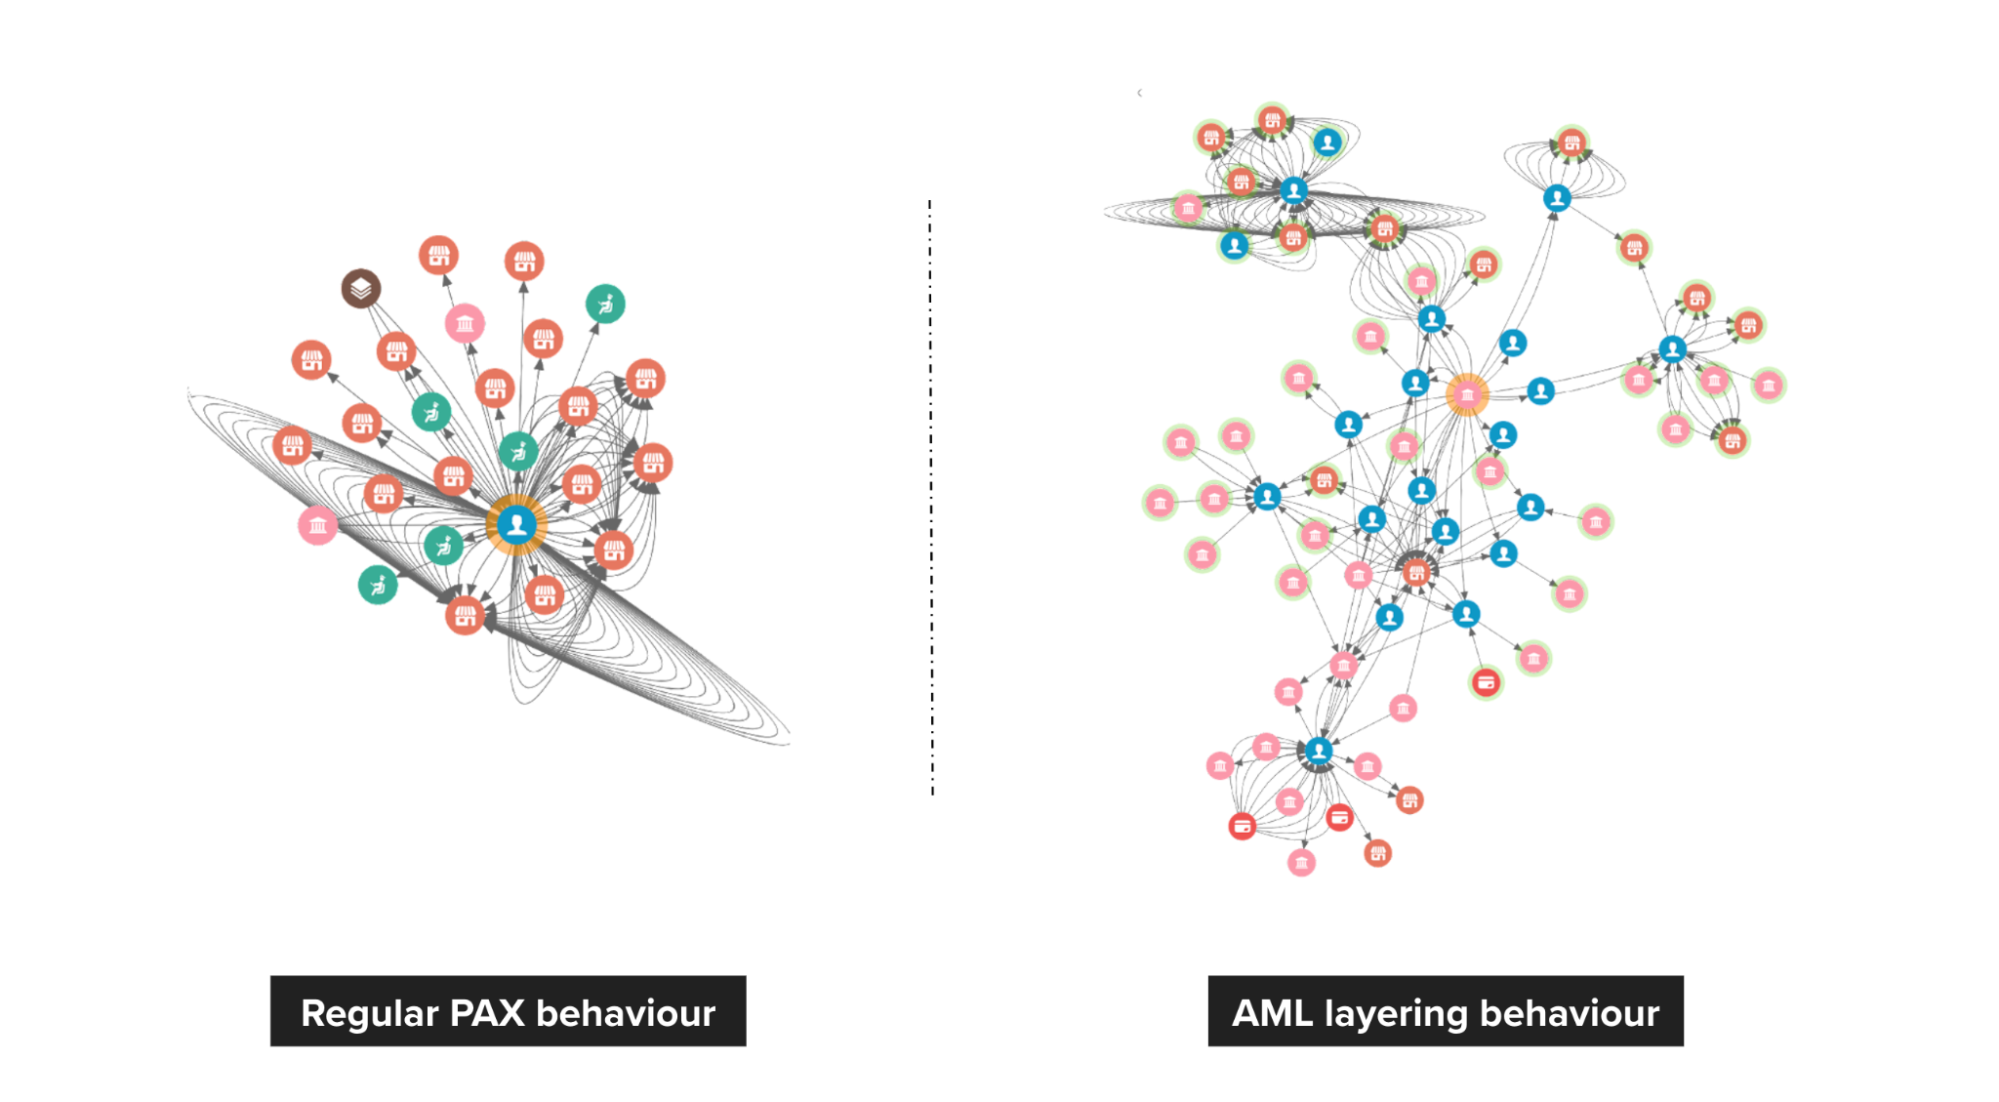
In our experience, fraudsters tend to share physical resources to maximise their revenue. The following image shows a device that is shared by many users. With our Graph Visualisation platform based on graph service, you can see exactly what this pattern looks like.
Fig 3. Example of a device being shared with many users
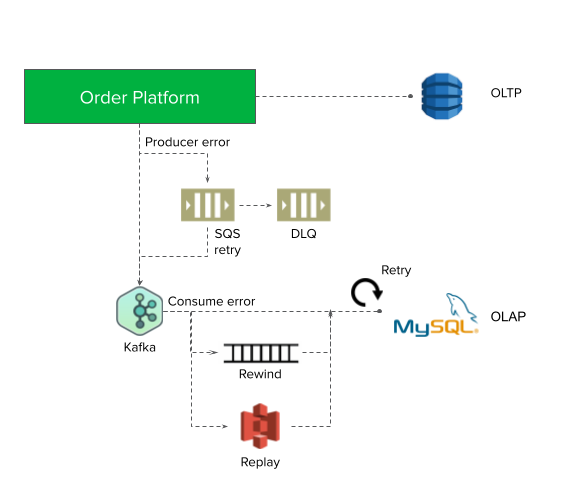
Data injection
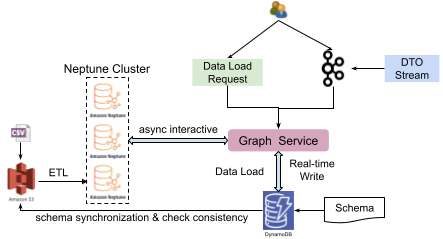
Fig. 4 Data injection
Graph service also supports data injection features, including data load by request (task with a type of data load) and real-time stream write by Kafka.
When connected to GrabDefence’s infrastructure, Confluent with Kafka is used as the streaming engine. The purpose of using Kafka as a streaming write engine is two-fold: to provide primary user authentication and to relieve the pressure on Neptune.
Impact
Graph service supports data management of Labelled Property Graphs and provides the capability to add, delete, update, and get vertices, edges, and properties for some graph models. Graph traversal and searching relationships with RESTful APIs are also more convenient with graph service.
Businesses usually do not need to focus on the underlying data storage, just designing graph schemas for model definition according to their needs. With the graph service platform, platforms or systems can be built for personalised search, intelligent Q&A, financial fraud, etc.
For big organisations, extensive graph algorithms provide the power to mine various entity connectivity relationships in massive amounts of data. The growth and expansion of new businesses is driven by discovering the value of data.
What’s next?
Fig. 5 Graph-centric ecosystems
We are building an integrated graph ecosystem inside and outside Grab. The infrastructure and service, or APIs are key components in graph-centric ecosystems; they provide graph arithmetic and basic capabilities of graphs in relation to search, computing, analysis etc. Besides that, we will also consider incorporating applications such as risk prediction and fraud detection in order to serve our current business needs.
Join us
Grab is the leading superapp platform in Southeast Asia, providing everyday services that matter to consumers. More than just a ride-hailing and food delivery app, Grab offers a wide range of on-demand services in the region, including mobility, food, package and grocery delivery services, mobile payments, and financial services across 428 cities in eight countries.
Powered by technology and driven by heart, our mission is to drive Southeast Asia forward by creating economic empowerment for everyone. If this mission speaks to you, join our team today!
Grab’s real-time data platform team, also known as Coban, has been operating large-scale Kafka clusters for all Grab verticals, with a strong focus on ensuring a best-in-class-performance and 99.99% availability.
Security has always been one of Grab’s top priorities and as fraudsters continue to evolve, there is an increased need to continue strengthening the security of our data streaming platform. One of the ways of doing this is to move from a pure network-based access control to state-of-the-art security and zero trust by default, such as:
Authentication: The identity of any remote systems – clients and servers – is established and ascertained first, prior to any further communications.
Authorisation: Access to Kafka is granted based on the principle of least privilege; no access is given by default. Kafka clients are associated with the whitelisted Kafka topics and permissions – consume or produce – they strictly need. Also, granted access is auditable.
Confidentiality: All in-transit traffic is encrypted.
Solution
We decided to use mutual Transport Layer Security (mTLS) for authentication and encryption. mTLS enables clients to authenticate servers, and servers to reciprocally authenticate clients.
Kafka supports other authentication mechanisms, like OAuth, or Salted Challenge Response Authentication Mechanism (SCRAM), but we chose mTLS because it is able to verify the peer’s identity offline. This verification ability means that systems do not need an active connection to an authentication server to ascertain the identity of a peer. This enables operating in disparate network environments, where all parties do not necessarily have access to such a central authority.
We opted for Hashicorp Vault and its PKI engine to dynamically generate clients and servers’ certificates. This enables us to enforce the usage of short-lived certificates for clients, which is a way to mitigate the potential impact of a client certificate being compromised or maliciously shared. We said zero trust, right?
For authorisation, we chose Policy-Based Access Control (PBAC), a more scalable solution than Role-Based Access Control (RBAC), and the Open Policy Agent (OPA) as our policy engine, for its wide community support.
To integrate mTLS and the OPA with Kafka, we leveraged Strimzi, the Kafka on Kubernetes operator. In a previous article, we have alluded to Strimzi and hinted at how it would help with scalability and cloud agnosticism. Built-in security is undoubtedly an additional driver of our adoption of Strimzi.
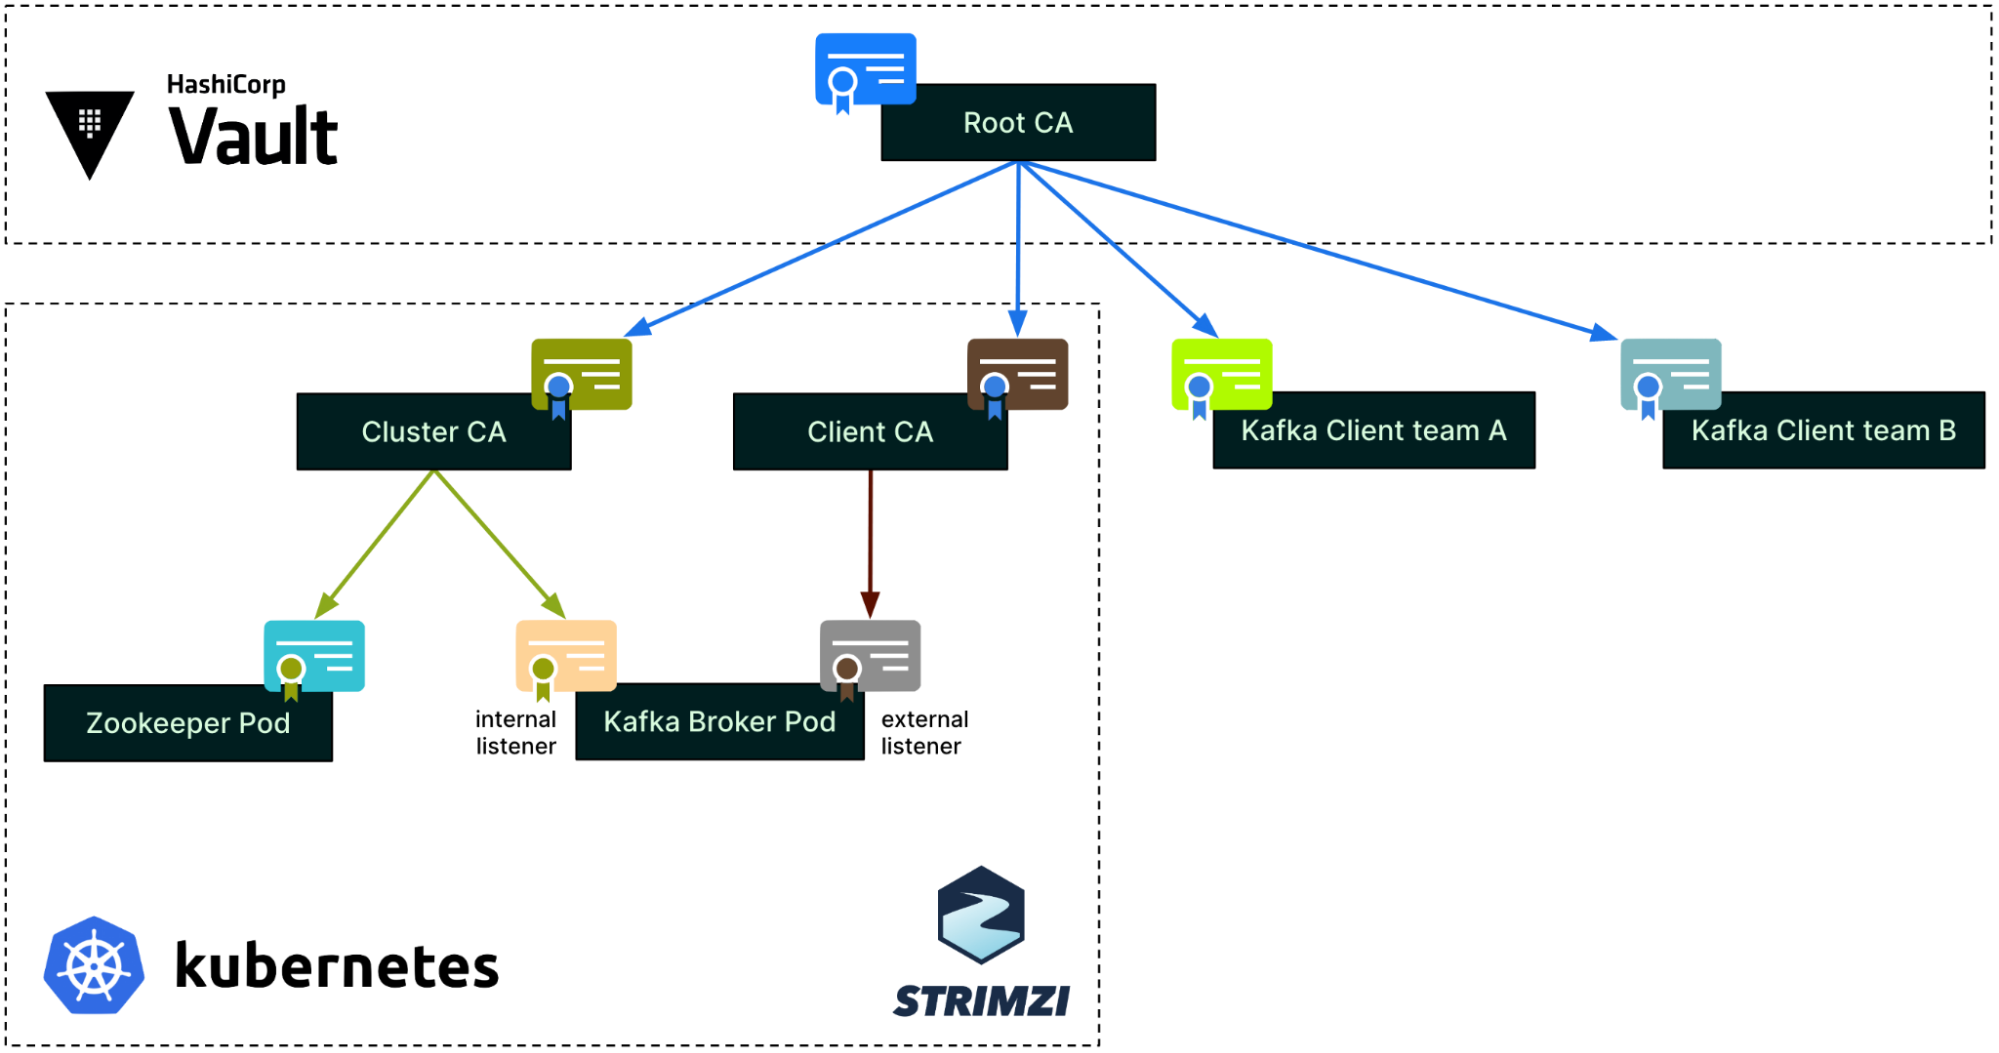
Server authentication
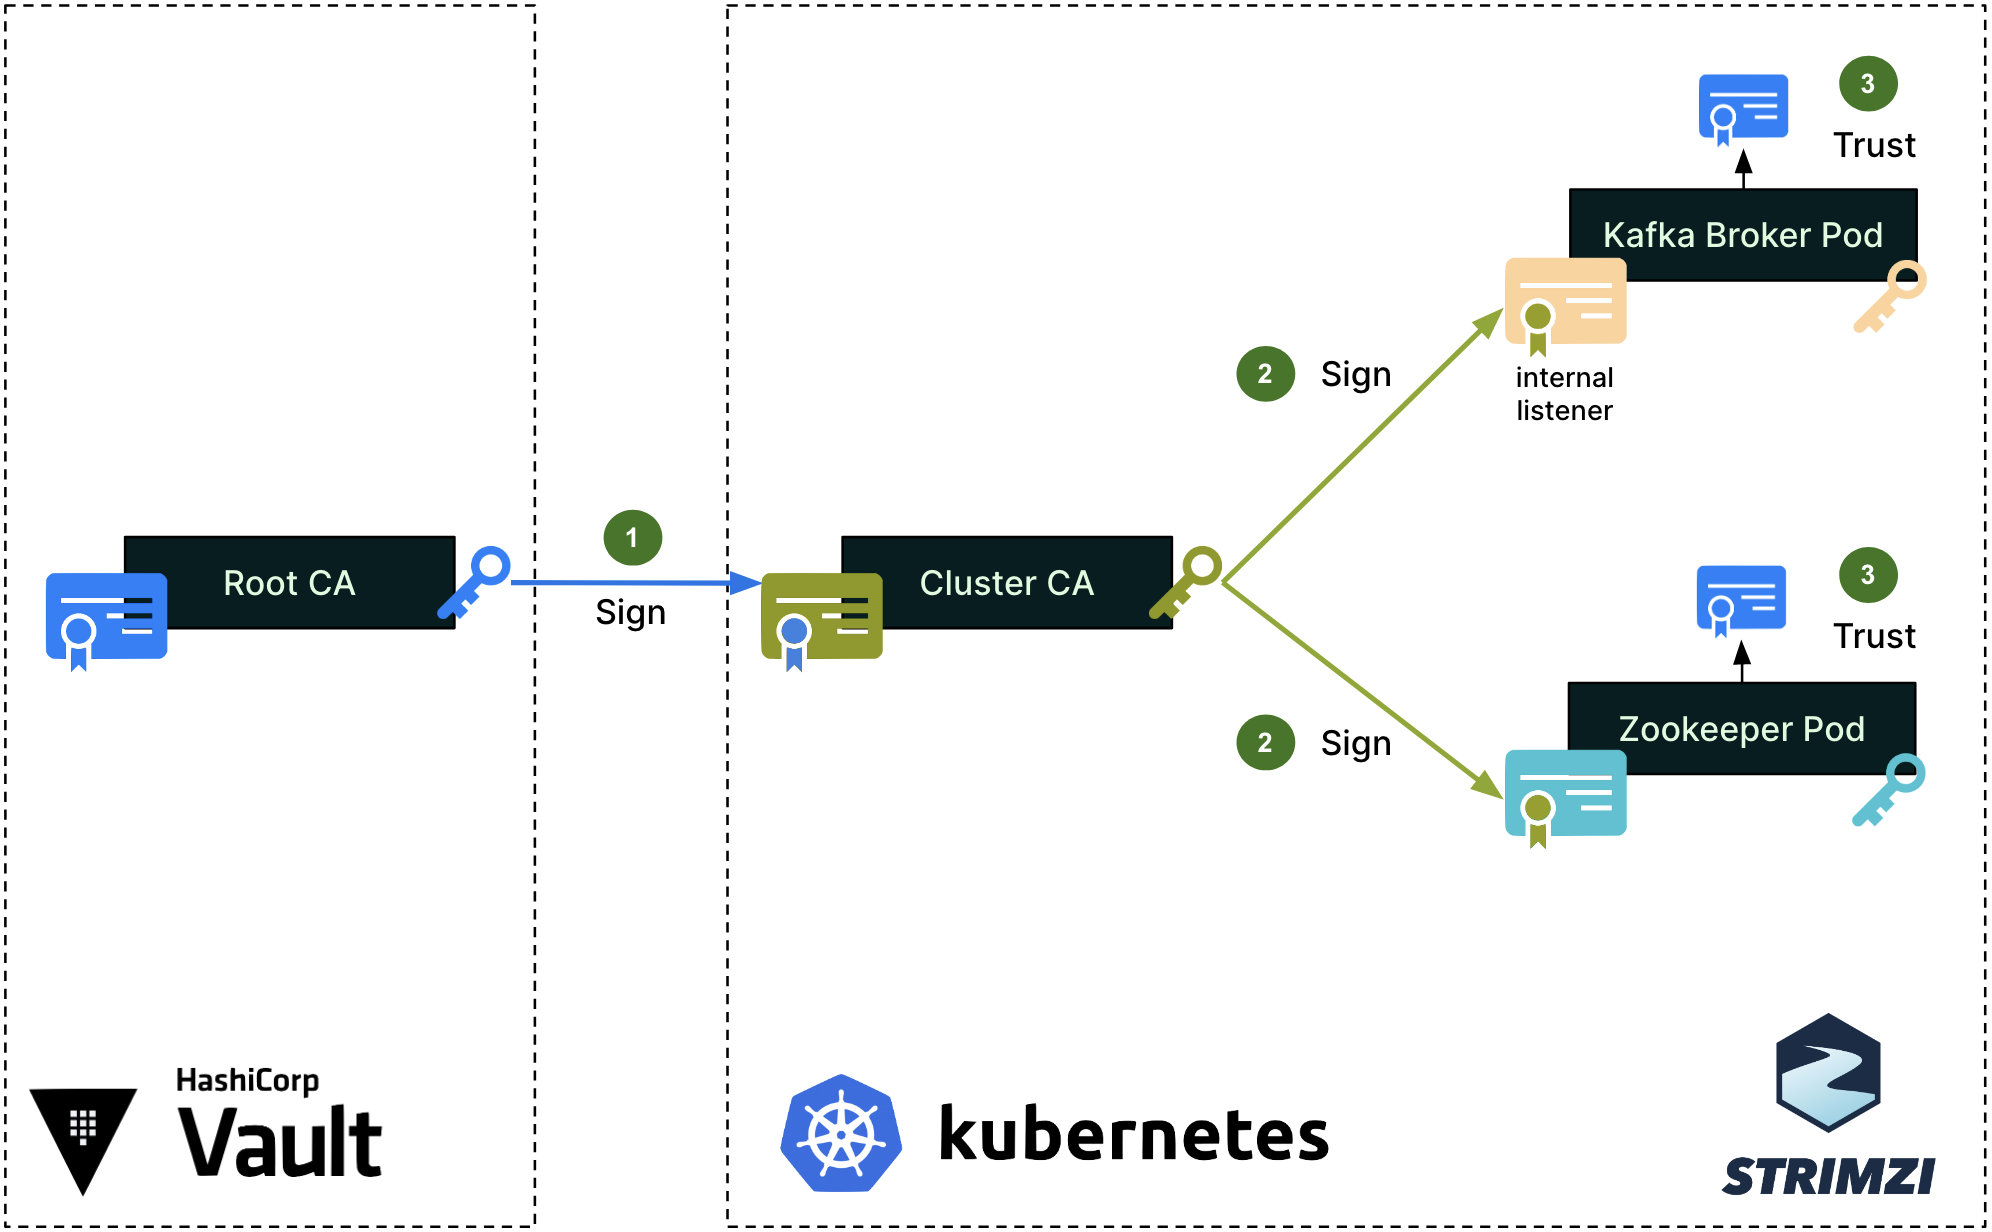
Figure 1 – Server authentication process for internal cluster communications
We first set up a single Root Certificate Authority (CA) for each environment (staging, production, etc.). This Root CA, in blue on the diagram, is securely managed by the Hashicorp Vault cluster. Note that the color of the certificates, keys, signing arrows and signatures on the diagrams are consistent throughout this article.
To secure the cluster’s internal communications, like the communications between the Kafka broker and Zookeeper pods, Strimzi sets up a Cluster CA, which is signed by the Root CA (step 1). The Cluster CA is then used to sign the individual Kafka broker and zookeeper certificates (step 2). Lastly, the Root CA’s public certificate is imported into the truststores of both the Kafka broker and Zookeeper (step 3), so that all pods can mutually verify their certificates when authenticating one with the other.
Strimzi’s embedded Cluster CA dynamically generates valid individual certificates when spinning up new Kafka and Zookeeper pods. The signing operation (step 2) is handled automatically by Strimzi.
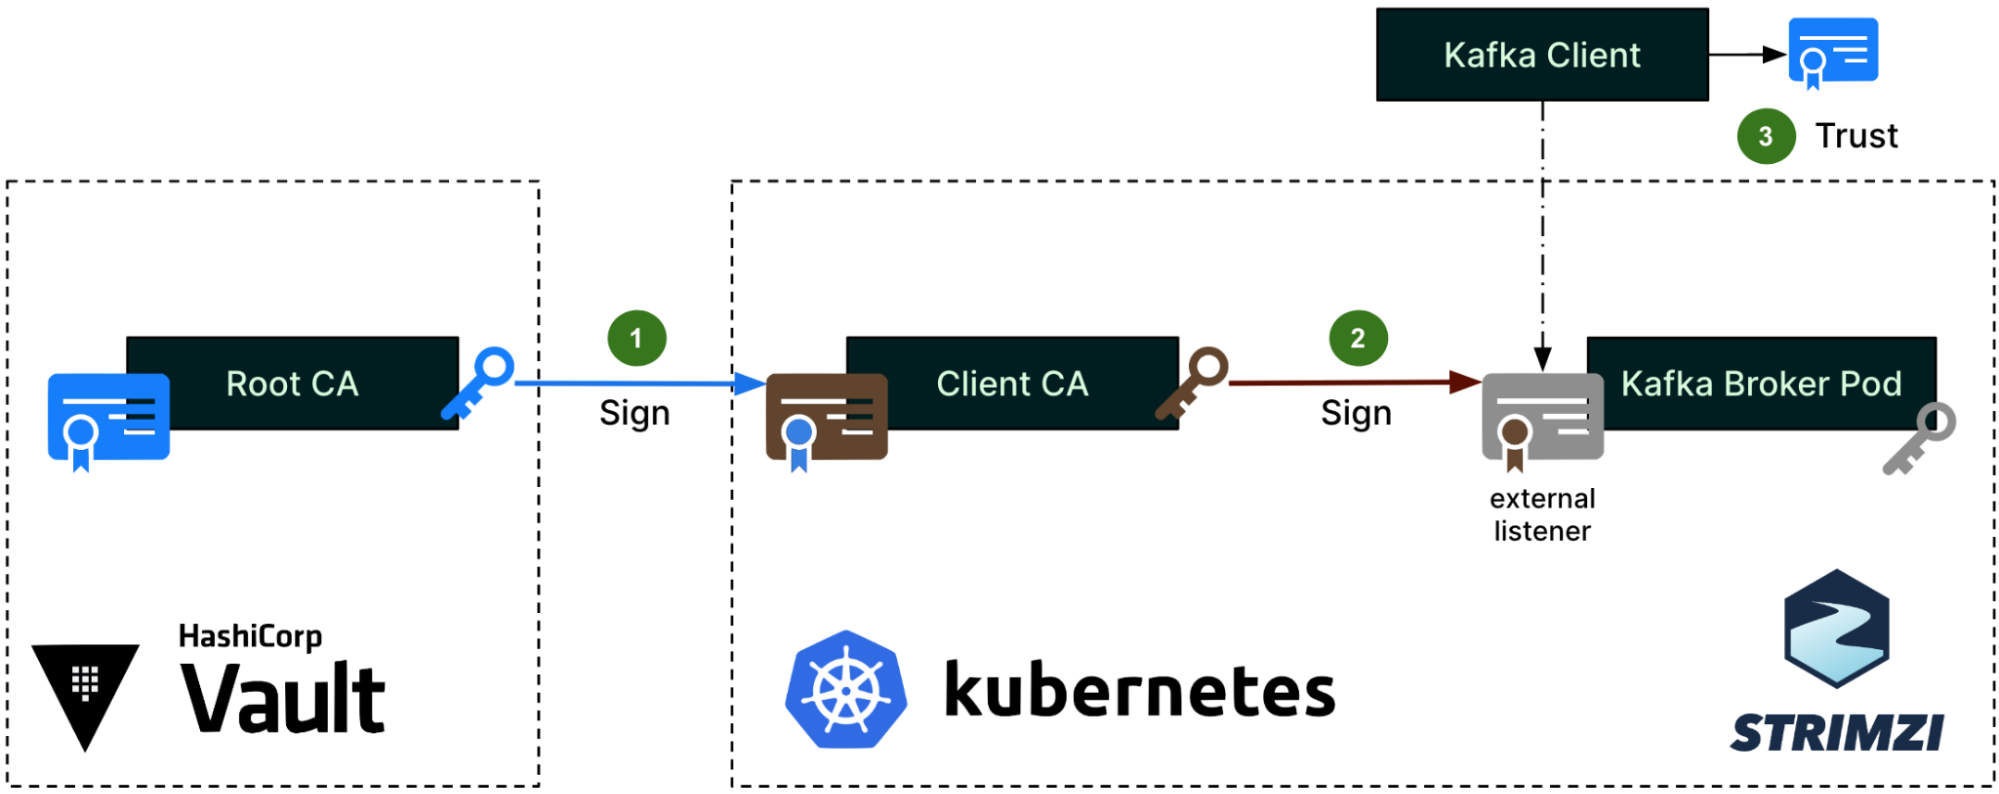
For client access to Kafka brokers, Strimzi creates a different set of intermediate CA and server certificates, as shown in the next diagram.
Figure 2 – Server authentication process for client access to Kafka brokers
The same Root CA from Figure 1 now signs a different intermediate CA, which the Strimzi community calls the Client CA (step 1). This naming is misleading since it does not actually sign any client certificates, but only the server certificates (step 2) that are set up on the external listener of the Kafka brokers. These server certificates are for the Kafka clients to authenticate the servers. This time, the Root CA’s public certificate will be imported into the Kafka Client truststore (step 3).
Client authentication
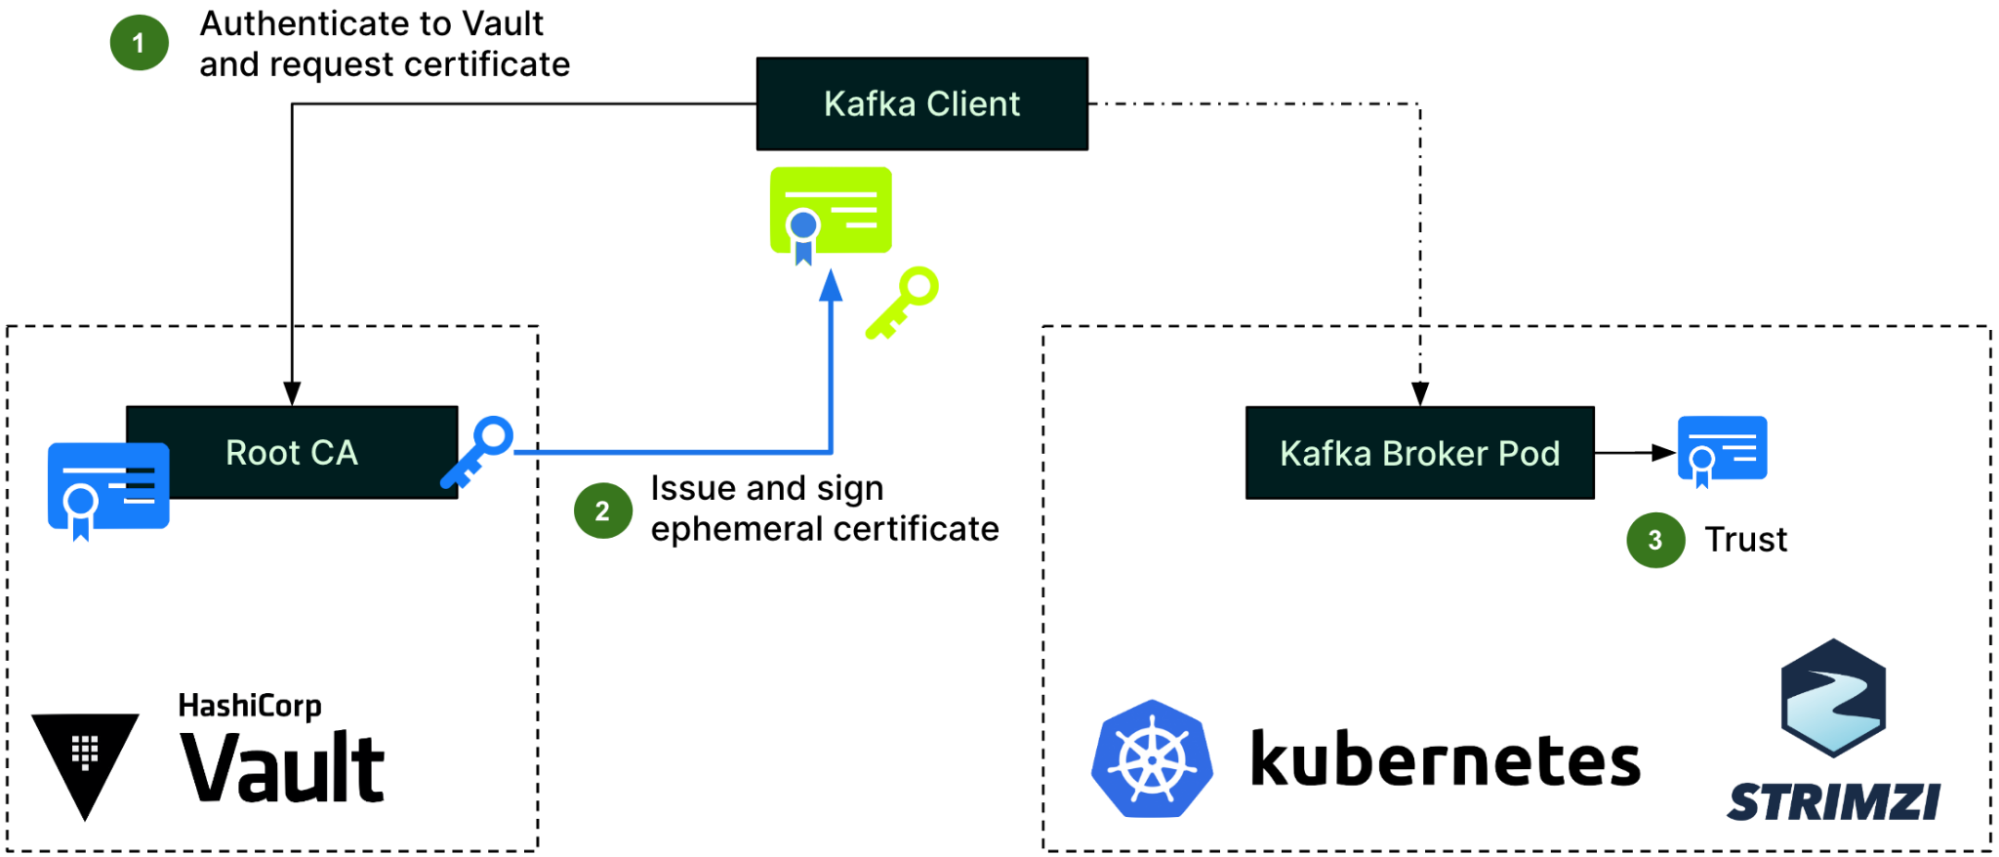
Figure 3 – Client authentication process
For client authentication, the Kafka client first needs to authenticate to Hashicorp Vault and request an ephemeral certificate from the Vault PKI engine (step 1). Vault then issues a certificate and signs it using its Root CA (step 2). With this certificate, the client can now authenticate to Kafka brokers, who will use the Root CA’s public certificate already in their truststore, as previously described (step 3).
CA tree
Putting together the three different authentication processes we have just covered, the CA tree now looks like this. Note that this is a simplified view for a single environment, a single cluster, and two clients only.
Figure 4 – Complete certificate authority tree
As mentioned earlier, each environment (staging, production, etc.) has its own Root CA. Within an environment, each Strimzi cluster has its own pair of intermediate CAs: the Cluster CA and the Client CA. At the leaf level, the Zookeeper and Kafka broker pods each have their own individual certificates.
On the right side of the diagram, each Kafka client can get an ephemeral certificate from Hashicorp Vault whenever they need to connect to Kafka. Each team or application has a dedicated Vault PKI role in Hashicorp Vault, restricting what can be requested for its certificate (e.g., Subject, TTL, etc.).
Strimzi deployment
We heavily use Terraform to manage and provision our Kafka and Kafka-related components. This enables us to quickly and reliably spin up new clusters and perform cluster scaling operations.
Under the hood, Strimzi Kafka deployment is a Kubernetes deployment. To increase the performance and the reliability of the Kafka cluster, we create dedicated Kubernetes nodes for each Strimzi Kafka broker and each Zookeeper pod, using Kubernetes taints and tolerations. This ensures that all resources of a single node are dedicated solely to either a single Kafka broker or a single Zookeeper pod.
We also decided to go with a single Kafka cluster by Kubernetes cluster to make the management easier.
Client setup
Coban provides backend microservice teams from all Grab verticals with a popular Kafka SDK in Golang, to standardise how teams utilise Coban Kafka clusters. Adding mTLS support mostly boils down to upgrading our SDK.
Our enhanced SDK provides a default mTLS configuration that works out of the box for most teams, while still allowing customisation, e.g., for teams that have their own Hashicorp Vault Infrastructure for compliance reasons. Similarly, clients can choose among various Vault auth methods such as AWS or Kubernetes to authenticate to Hashicorp Vault, or even implement their own logic for getting a valid client certificate.
To mitigate the potential risk of a user maliciously sharing their application’s certificate with other applications or users, we limit the maximum Time-To-Live (TTL) for any given certificate. This also removes the overhead of maintaining a Certificate Revocation List (CRL). Additionally, our SDK stores the certificate and its associated private key in memory only, never on disk, hence reducing the attack surface.
In our case, Hashicorp Vault is a dependency. To prevent it from reducing the overall availability of our data streaming platform, we have added two features to our SDK – a configurable retry mechanism and automatic renewal of clients’ short-lived certificates when two thirds of their TTL is reached. The upgraded SDK also produces new metrics around this certificate renewal process, enabling better monitoring and alerting.
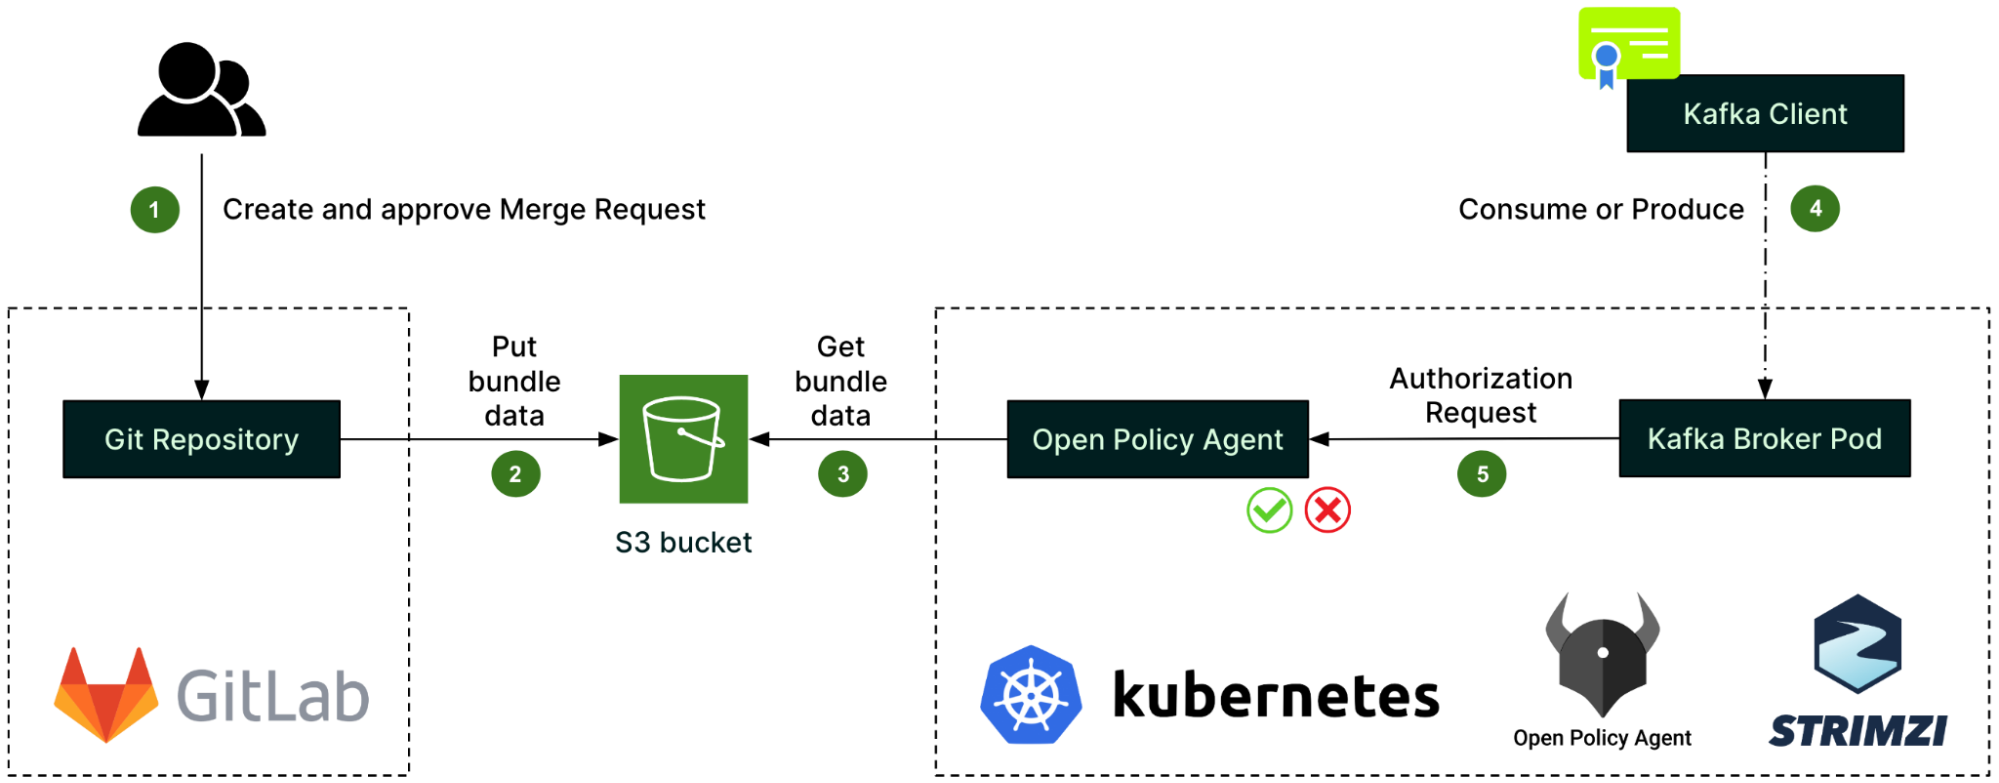
Authorisation
Figure 5 – Authorisation process before a client can access a Kafka record
For authorisation, we set up the Open Policy Agent (OPA) as a standalone deployment in the Kubernetes cluster, and configured Strimzi to integrate the Kafka brokers with that OPA.
OPA policies – written in the Rego language – describe the authorisation logic. They are created in a GitLab repository along with the authorisation rules, called data sources (step 1). Whenever there is a change, a GitLab CI pipeline automatically creates a bundle of the policies and data sources, and pushes it to an S3 bucket (step 2). From there, it is fetched by the OPA (step 3).
When a client – identified by its TLS certificate’s Subject – attempts to consume or produce a Kafka record (step 4), the Kafka broker pod first issues an authorisation request to the OPA (step 5) before processing the client’s request. The outcome of the authorisation request is then cached by the Kafka broker pod to improve performance.
As the core component of the authorisation process, the OPA is deployed with the same high availability as the Kafka cluster itself, i.e. spread across the same number of Availability Zones. Also, we decided to go with one dedicated OPA by Kafka cluster instead of having a unique global OPA shared between multiple clusters. This is to reduce the blast radius of any OPA incidents.
For monitoring and alerting around authorisation, we submitted an Open Source contribution in the opa-kafka-plugin project in order to enable the OPA authoriser to expose some metrics. Our contribution to the open source code allows us to monitor various aspects of the OPA, such as the number of authorised and unauthorised requests, as well as the cache hit-and-miss rates. Also, we set up alerts for suspicious activity such as unauthorised requests.
Finally, as a platform team, we need to make authorisation a scalable, self-service process. Thus, we rely on the Git repository’s permissions to let Kafka topics’ owners approve the data source changes pertaining to their topics.
Teams who need their applications to access a Kafka topic would write and submit a JSON data source as simple as this:
GitLab CI unit tests and business logic checks are set up in the Git repository to ensure that the submitted changes are valid. After that, the change would be submitted to the topic’s owner for review and approval.
What’s next?
The performance impact of this security design is significant compared to unauthenticated, unauthorised, plaintext Kafka. We observed a drop in throughput, mostly due to the low performance of encryption and decryption in Java, and are currently benchmarking different encryption ciphers to mitigate this.
Also, on authorisation, our current PBAC design is pretty static, with a list of applications granted access for each topic. In the future, we plan to move to Attribute-Based Access Control (ABAC), creating dynamic policies based on teams and topics’ metadata. For example, teams could be granted read and write access to all of their own topics by default. Leveraging a versatile component such as the OPA as our authorisation controller enables this evolution.
Join us
Grab is the leading superapp platform in Southeast Asia, providing everyday services that matter to consumers. More than just a ride-hailing and food delivery app, Grab offers a wide range of on-demand services in the region, including mobility, food, package and grocery delivery services, mobile payments, and financial services across 428 cities in eight countries.
Powered by technology and driven by heart, our mission is to drive Southeast Asia forward by creating economic empowerment for everyone. If this mission speaks to you, join our team today!
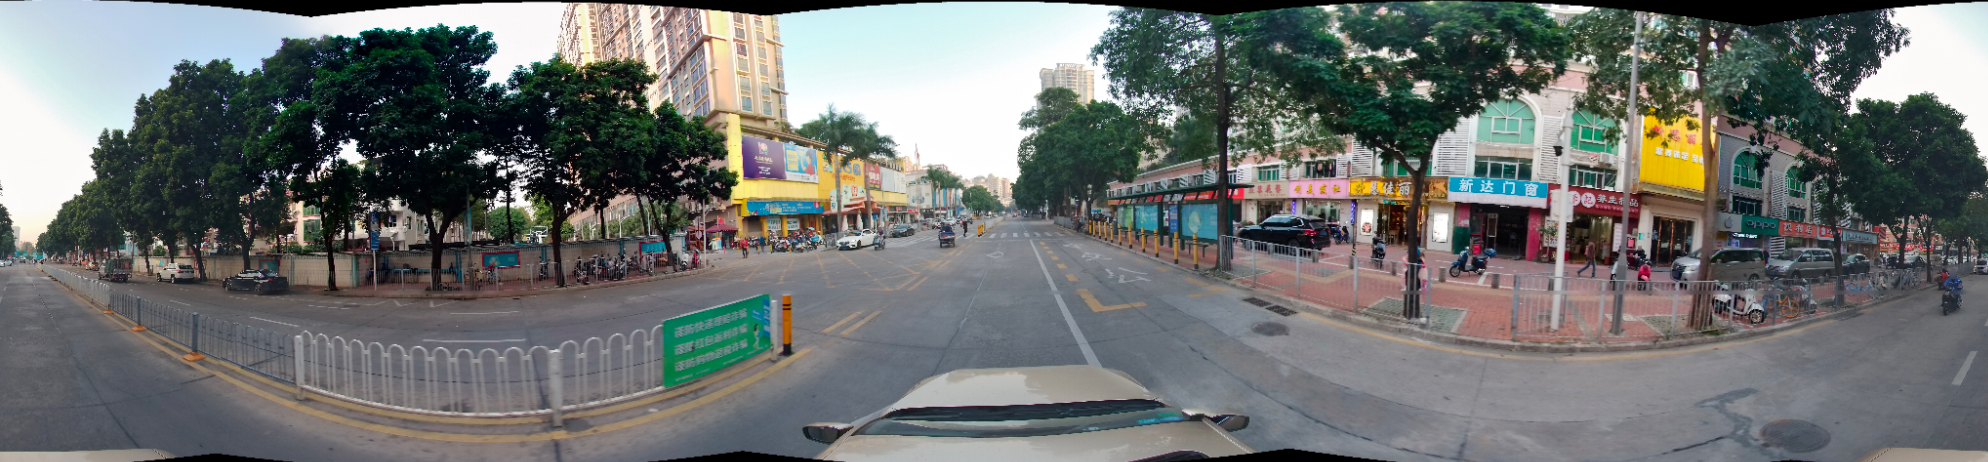
The foundation for making any map is in imagery, but due to the complexity and dynamism of the real world, it is difficult for companies to collect high-quality, fresh images in an efficient yet low-cost manner. This is the case for Grab’s Geo team as well.
Traditional map-making methods rely on professional-grade cameras that provide high resolution images to collect mapping imagery. These images are rich in content and detail, providing a good snapshot of the real world. However, we see two major challenges with this approach.
The first is high cost. Professional cameras are too expensive to use at scale, especially in an emerging region like Southeast Asia. Apart from high equipment cost, operational cost is also high as local operation teams need professional training before collecting imagery.
The other major challenge, related to the first, is that imagery will not be refreshed in a timely manner because of the high cost and operational effort required. It typically takes months or years before imagery is refreshed, which means maps get outdated easily.
Compared to traditional collection methods, there are more affordable alternatives that some emerging map providers are using, such as crowdsourced collection done with smartphones or other consumer-grade action cameras. This allows more timely imagery refresh at a much lower cost.
That said, there are several challenges with crowdsourcing imagery, such as:
Inconsistent quality in collected images.
Low operational efficiency as cameras and smartphones are not optimised for mapping.
Unreliable location accuracy.
In order to solve the challenges above, we started building our own artificial intelligence (AI) camera called KartaCam.
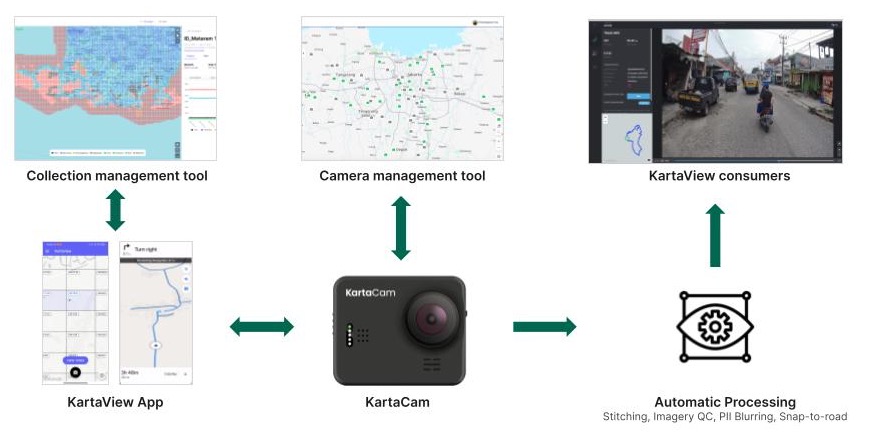
What is KartaCam?
Designed specifically for map-making, KartaCam is a lightweight camera that is easy to operate. It is everything you need for accurate and efficient image collection. KartaCam is powered by edge AI, and mainly comprises a camera module, a dual-band Global Navigation Satellite System (GNSS) module, and a built-in 4G Long-Term Evolution (LTE) module.
KartaCam
Camera module
The camera module or optical design of KartaCam focuses on several key features:
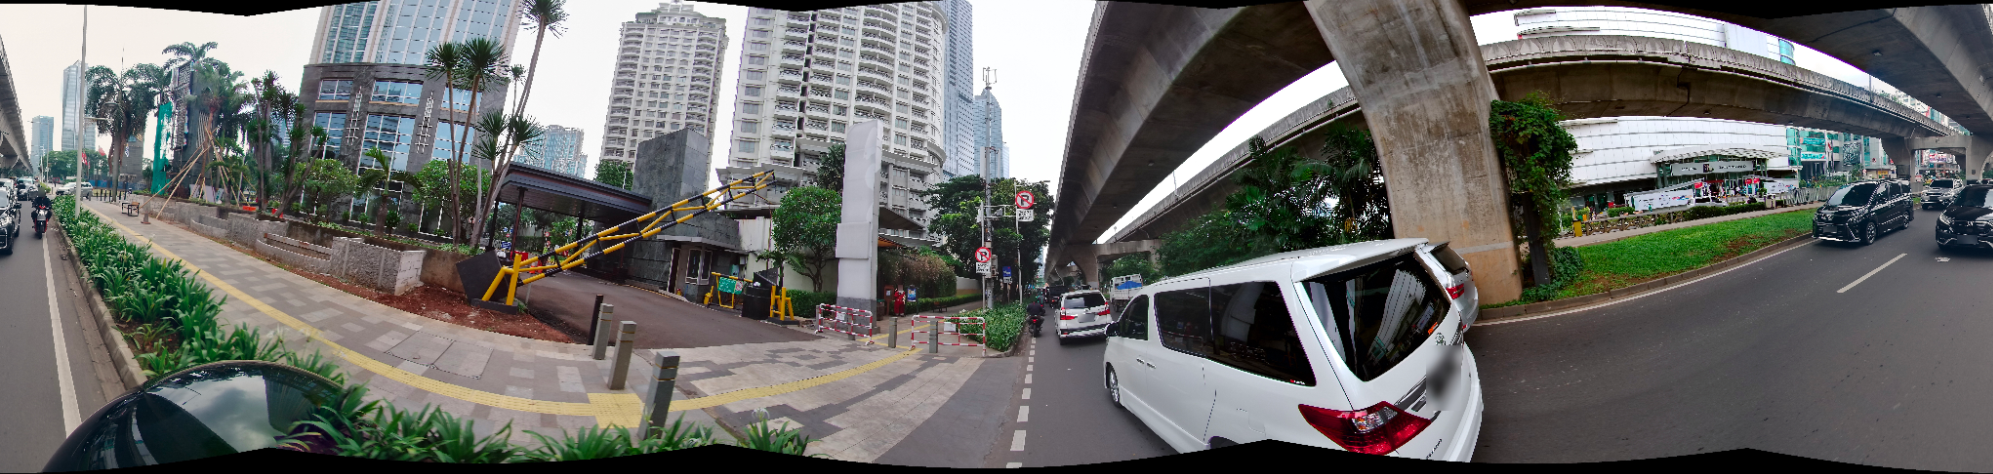
Wide field of vision (FOV): A wide FOV to capture as many scenes and details as possible without requiring additional trips. A single KartaCam has a wide lens FOV of >150° and when we use four KartaCams together, each facing a different direction, we increase the FOV to 360°.
High image quality: A combination of high-definition optical lens and a high-resolution pixel image sensor can help to achieve better image quality. KartaCam uses a high-quality 12MP image sensor.
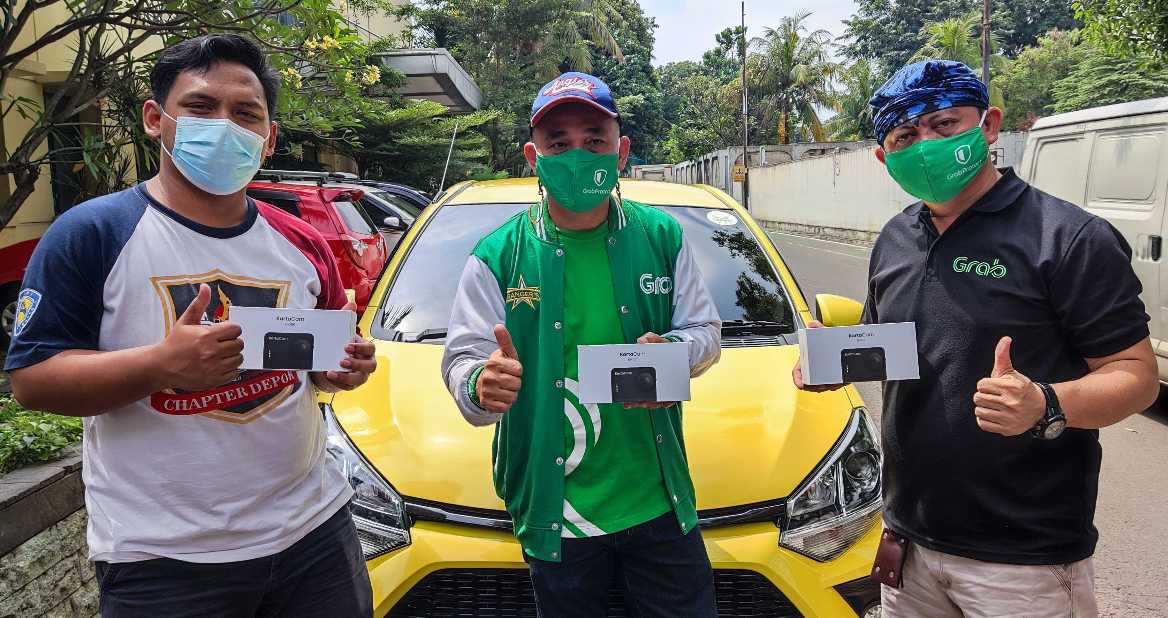
Ease of use: Portable and easy to start using for people with little to no photography training. At Grab, we can easily deploy KartaCam to our fleet of driver-partners to map our region as they regularly travel these roads while ferrying passengers or making deliveries.
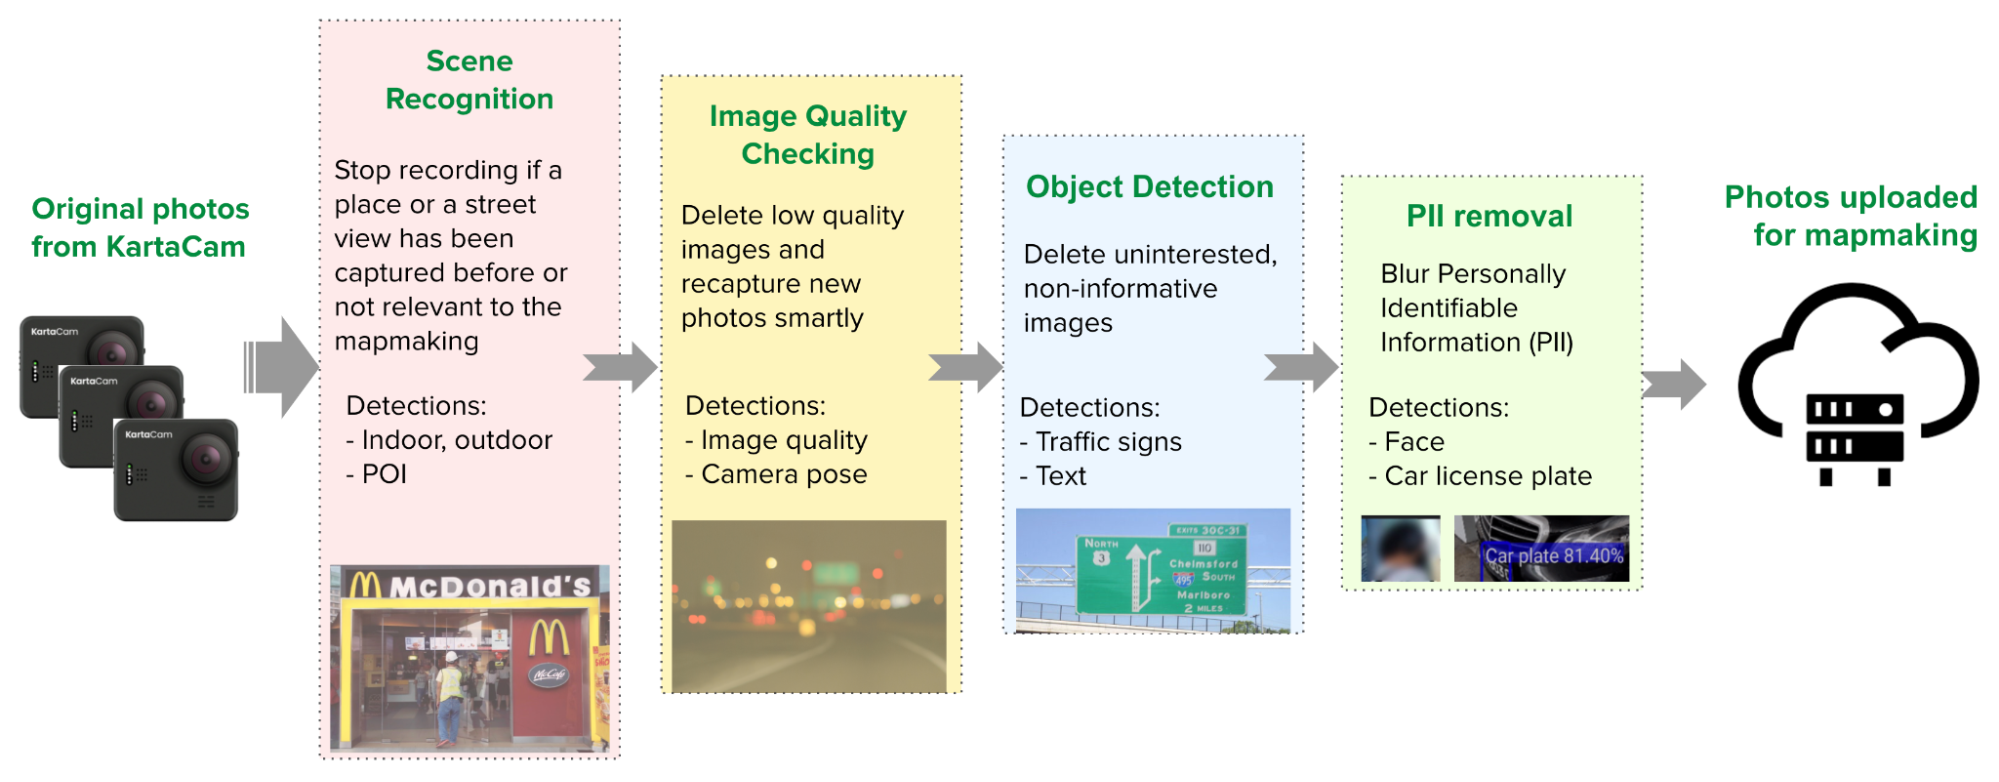
Edge AI for smart capturing on edge
Each KartaCam device is also equipped with edge AI, which enables AI computations to operate closer to the actual data – in our case, imagery collection. With edge AI, we can make decisions about imagery collection (i.e. upload, delete or recapture) at the device-level.
To help with these decisions, we use a series of edge AI models and algorithms that are executed immediately after each image capture such as:
Scene recognition model: For efficient map-making, we ensure that we make the right screen verdicts, meaning we only upload and process the right scene images. Unqualified images such as indoor, raining, and cloudy images are deleted directly on the KartaCam device. Joint detection algorithms are deployed in some instances to improve the accuracy of scene verdicts. For example, to detect indoor recording we look at a combination of driver moving speed, Inertial Measurement Units (IMU) data and edge AI image detection.
Image quality (IQ) checking AI model: The quality of the images collected is paramount for map-making. Only qualified images judged by our IQ classification algorithm will be uploaded while those that are blurry or considered low-quality will be deleted. Once an unqualified image is detected (usually within the next second), a new image is captured, improving the success rate of collection.
Object detection AI model: Only roadside images that contain relevant map-making content such as traffic signs, lights, and Point of Interest (POI) text are uploaded.
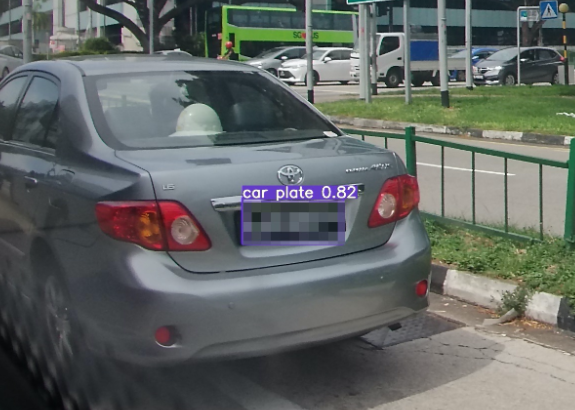
Privacy information detection: Edge AI also helps protect privacy when collecting street images for map-making. It automatically blurs private information such as pedestrians’ faces and car plate numbers before uploading, ensuring adequate privacy protection.
Better positioning with a dual-band GNSS module
The Global Positioning System (GPS) mainly uses two frequency bands: L1 and L5. Most traditional phone or GPS modules only support the legacy GPS L1 band, while modern GPS modules support both L1 and L5. KartaCam leverages the L5 band which provides improved signal structure, transmission capabilities, and a wider bandwidth that can reduce multipath error, interference, and noise impacts. In addition, KartaCam uses a fine-tuned high-quality ceramic antenna that, together with the dual frequency band GPS module, greatly improves positioning accuracy.
Keeping KartaCam connected
KartaCam has a built-in 4G LTE module that ensures it is always connected and can be remotely managed. The KartaCam management portal can monitor camera settings like resolution and capturing intervals, even in edge AI machine learning models. This makes it easy for Grab’s map ops team and drivers to configure their cameras and upload captured images in a timely manner.
Enhancing KartaCam
KartaCam 360: Capturing a panorama view
To improve single collection trip efficiency, we group four KartaCams together to collect 360° images. The four cameras can be synchronised within milliseconds and the collected images are stitched together in a panoramic view.
With KartaCam 360, we can increase the number of images collected in a single trip. According to Grab’s benchmark testing in Singapore and Jakarta, the POI information collected by KartaCam 360 is comparable to that of professional cameras, which cost about 20x more.
KartaCam 360 & Scooter mount
Image sample from KartaCam 360
KartaCam and the image collection workflow
KartaCam, together with other GrabMaps imagery tools, provides a highly efficient, end-to-end, low-cost, and edge AI-powered smart solution to map the region. KartaCam is fully integrated as part of our map-making workflow.
Our map-making solution includes the following components:
Collection management tool – Platform that defines map collection tasks for our driver-partners.
KartaView application – Mobile application provides map collection tasks and handles crowdsourced imagery collection.
KartaCam – Camera device connected to KartaView via Bluetooth and equipped with edge automatic processing for imagery capturing according to the task accepted.
Camera management tool – Handles camera parameters and settings for all KartaCam devices and can remotely control the KartaCam.
Automatic processing – Collected images are processed for quality check, stitching, and personal identification information (PII) blurring.
KartaView imagery platform – Processed images are then uploaded and the driver-partner receives payment.
In a future article, we will dive deeper into the technology behind KartaView and its role in GrabMaps.
Impact
At the moment, Grab is rolling out thousands of KartaCams to all locations across Southeast Asia where Grab operates. This saves operational costs while improving the efficiency and quality of our data collection.
Better data quality and more map attributes
Due to the excellent image quality, wide FOV coverage, accurate GPS positioning, and sensor data, the 360° images captured by KartaCam 360 also register detailed map attributes like POIs, traffic signs, and address plates. This will help us build a high quality map with rich and accurate content.
Reducing operational costs
Based on our research, the hardware cost for KartaCam 360 is significantly lower compared to similar professional cameras in the market. This makes it a more feasible option to scale up in Southeast Asia as the preferred tool for crowdsourcing imagery collection.
With image quality checks and detection conducted at the edge, we can avoid re-collections and also ensure that only qualified images are uploaded. These result in saving time as well as operational and upload costs.
Upholding privacy standards
KartaCam automatically blurs captured images that contain PII, like faces and licence plates directly from the edge devices. This means that all sensitive information is removed at this stage and is never uploaded to Grab servers.
On-the-edge blurring example
What’s next?
Moving forward, Grab will continue to enhance KartaCam’s performance in the following aspects:
Further improve image quality with better image sensors, unique optical components, and state-of-art Image Signal Processor (ISP).
Make KartaCam compatible with Light Detection And Ranging (LIDAR) for high-definition collection and indoor use cases.
Improve GNSS module performance with higher sampling frequency and accuracy, and integrate new technology like Real-Time Kinematic (RTK) and Precise Point Positioning (PPP) solutions to further improve the positioning accuracy. When combined with sensor fusion from IMU sensors, we can improve positioning accuracy for map-making further.
Improve usability, integration, and enhance imagery collection and portability for KartaCam so driver-partners can easily capture mapping data.
Explore new product concepts for future passive street imagery collection.
To find out more about how KartaCam delivers comprehensive cost-effective mapping data, check out this article.
Join us
Grab is the leading superapp platform in Southeast Asia, providing everyday services that matter to consumers. More than just a ride-hailing and food delivery app, Grab offers a wide range of on-demand services in the region, including mobility, food, package and grocery delivery services, mobile payments, and financial services across 428 cities in eight countries.
Powered by technology and driven by heart, our mission is to drive Southeast Asia forward by creating economic empowerment for everyone. If this mission speaks to you, join our team today!
Grab has grown rapidly in the past few years. It has expanded its business from ride hailing to food and grocery delivery, financial services, and more. Fraud detection is challenging in Grab, because new fraud patterns always arise whenever we introduce a new business product. We cannot afford to develop a new model whenever a new fraud pattern appears as it is time consuming and introduces a cold start problem, that is no protection at the early stage. We need a general fraud detection framework to better protect Grab from various unknown fraud risks.
Our key observation is that although Grab has many different business verticals, the entities within those businesses are connected to each other (Figure 1. Left), for example, two passengers may be connected by a Wi-Fi router or phone device, a merchant may be connected to a passenger by a food order, and so on. A graph provides an elegant way to capture the spatial correlation among different entities in the Grab ecosystem. A common fraud shows clear patterns on a graph, for example, a fraud syndicate tends to share physical devices, and collusion happens between a merchant and an isolated set of passengers (Figure 1. Right).
Figure 1. Left: The graph captures different correlations in the Grab ecosystem. Right: The graph shows that common fraud has clear patterns.
We believe graphs can help us discover subtle traces and complicated fraud patterns more effectively. Graph-based solutions will be a sustainable foundation for us to fight against known and unknown fraud risks.
Why graph?
The most common fraud detection methods include the rule engine and the decision tree-based models, for example, boosted tree, random forest, and so on. Rules are a set of simple logical expressions designed by human experts to target a particular fraud problem. They are good for simple fraud detection, but they usually do not work well in complicated fraud or unknown fraud cases.
Fraud detection methods
Utilises correlations (Higher is better)
Detects unknown fraud (Higher is better)
Requires feature engineering (Lower is better)
Depends on labels (Lower is better)
Rule engine
Low
N/A
N/A
Low
Decision tree
Low
Low
High
High
Graph model
High
High
Low
Low
Table 1. Graph vs. common fraud detection methods.
Decision tree-based models have been dominating fraud detection and Kaggle competitions for structured or tabular data in the past few years. With that said, the performance of a tree-based model is highly dependent on the quality of labels and feature engineering, which is often hard to obtain in real life. In addition, it usually does not work well in unknown fraud which has not been seen in the labels.
On the other hand, a graph-based model requires little amount of feature engineering and it is applicable to unknown fraud detection with less dependence on labels, because it utilises the structural correlations on the graph.
In particular, fraudsters tend to show strong correlations on a graph, because they have to share physical properties such as personal identities, phone devices, Wi-Fi routers, delivery addresses, and so on, to reduce cost and maximise revenue as shown in Figure 2 (left). An example of such strong correlations is shown in Figure 2 (right), where the entities on the graph are densely connected, and the known fraudsters are highlighted in red. Those strong correlations on the graph are the key reasons that make the graph based approach a sustainable foundation for various fraud detection tasks.
Figure 2. Fraudsters tend to share physical properties to reduce cost (left), and they are densely connected as shown on a graph (right).
Semi-supervised graph learning
Unlike traditional decision tree-based models, the graph-based machine learning model can utilise the graph’s correlations and achieve great performance even with few labels. The semi-supervised Graph Convolutional Network model has been extremely popular in recent years 1. It has proven its success in many fraud detection tasks across industries, for example, e-commerce fraud, financial fraud, internet traffic fraud, etc.
We apply the Relational Graph Convolutional Network (RGCN) 2 for fraud detection in Grab’s ecosystem. Figure 3 shows the overall architecture of RGCN. It takes a graph as input, and the graph passes through several graph convolutional layers to get node embeddings. The final layer outputs a fraud probability for each node. At each graph convolutional layer, the information is propagated along the neighbourhood nodes within the graph, that is nodes that are close on the graph are similar to each other.
Fig 3. A semi-supervised Relational Graph Convolutional Network model.
We train the RGCN model on a graph with millions of nodes and edges, where only a few percentages of the nodes on the graph have labels. The semi-supervised graph model has little dependency on the labels, which makes it a robust model for tackling various types of unknown fraud.
Figure 4 shows the overall performance of the RGCN model. On the left is the Receiver Operating Characteristic (ROC) curve on the label dataset, in particular, the Area Under the Receiver Operating Characteristic (AUROC) value is close to 1, which means the RGCN model can fit the label data quite well. The right column shows the low dimensional projections of the node embeddings on the label dataset. It is clear that the embeddings of the genuine passenger are well separated from the embeddings of the fraud passenger. The model can distinguish between a fraud and a genuine passenger quite well.
Fig 4. Left: ROC curve of the RGCN model on the label dataset. Right: Low dimensional projections of the graph node embeddings.
Finally, we would like to share a few tips that will make the RGCN model work well in practice.
Use less than three convolutional layers: The node feature will be over-smoothed if there are many convolutional layers, that is all the nodes on the graph look similar.
Node features are important: Domain knowledge of the node can be formulated as node features for the graph model, and rich node features are likely to boost the model performance.
Graph explainability
Unlike other deep network models, graph neural network models usually come with great explainability, that is why a user is classified as fraudulent. For example, fraudulent accounts are likely to share hardware devices and form dense clusters on the graph, and those fraud clusters can be easily spotted on a graph visualiser 3.
Figure 5 shows an example where graph visualisation helps to explain the model prediction scores. The genuine passenger with a low RGCN score does not share devices with other passengers, while the fraudulent passenger with a high RGCN score shares devices with many other passengers, that is, dense clusters.
Figure 5. Upper left: A genuine passenger with a low RGCN score has no device sharing with other passengers. Bottom right: A fraudulent user with a high RGCN score shares devices with many other passengers.
Closing thoughts
Graphs provide a sustainable foundation for combating many different types of fraud risks. Fraudsters are evolving very fast these days, and the best traditional rules or models can do is to chase after those fraudsters given that a fraud pattern has already been discovered. This is suboptimal as the damage has already been done on the platform. With the help of graph models, we can potentially detect those fraudsters before any fraudulent activity has been conducted, thus reducing the fraud cost.
The graph structural information can significantly boost the model performance without much dependence on labels, which is often hard to get and might have a large bias in fraud detection tasks. We have shown that with only a small percentage of labelled nodes on the graph, our model can already achieve great performance.
With that said, there are also many challenges to making a graph model work well in practice. We are working towards solving the following challenges we are facing.
Feature initialisation: Sometimes, it is hard to initialise the node feature, for example, a device node does not carry many semantic meanings. We have explored self-supervised pre-training 4 to help the feature initialisation, and the preliminary results are promising.
Real-time model prediction: Realtime graph model prediction is challenging because real-time graph updating is a heavy operation in most cases. One possible solution is to do batch real-time prediction to reduce the overhead.
Noisy connections: Some connections on the graph are inherently noisy on the graph, for example, two users sharing the same IP address does not necessarily mean they are physically connected. The IP might come from a mobile network. One possible solution is to use the attention mechanism in the graph convolutional kernel and control the message passing based on the type of connection and node profiles.
Join us
Grab is the leading superapp platform in Southeast Asia, providing everyday services that matter to consumers. More than just a ride-hailing and food delivery app, Grab offers a wide range of on-demand services in the region, including mobility, food, package and grocery delivery services, mobile payments, and financial services across 428 cities in eight countries.
Powered by technology and driven by heart, our mission is to drive Southeast Asia forward by creating economic empowerment for everyone. If this mission speaks to you, join our team today!
References
T. Kipf and M. Welling, “Semi-supervised classification with graph convolutional networks,” in ICLR, 2017 ↩
Schlichtkrull, Michael, et al. “Modeling relational data with graph convolutional networks.” European semantic web conference. Springer, Cham, 2018. ↩
Our consumers used to face a few common pain points while searching for food with the Grab app. Sometimes, the results would include merchants that were not yet operational or locations that were out of the delivery radius. Other times, no alternatives were provided. The search system would also have difficulties handling typos, keywords in different languages, synonyms, and even word spacing issues, resulting in a suboptimal user experience.
Over the past few months, our search team has been building a query expansion framework that can solve these issues. When a user query comes in, it expands the query to a few related keywords based on semantic relevance and user intention. These expanded words are then searched with the original query to recall more results that are high-quality and diversified. Now let’s take a deeper look at how it works.
Query expansion framework
Building the query expansion corpus
We used two different approaches to produce query expansion candidates: manual annotation for top keywords and data mining based on user rewrites.
Manual annotation for top keywords
Search has a pronounced fat head phenomenon. The most frequent thousand of keywords account for more than 70% of the total search traffic. Therefore, handling these keywords well can improve the overall search quality a lot. We manually annotated the possible expansion candidates for these common keywords to cover the most popular merchants, items and alternatives. For instance, “McDonald’s” is annotated with {“burger”, “western”}.
Data mining based on user rewrites
We observed that sometimes users tend to rewrite their queries if they are not satisfied with the search result. As a pilot study, we checked the user rewrite records within some user search sessions and found several interesting samples:
{Ya Kun Kaya Toast,Starbucks}
{healthy,Subway}
{Muni,Muji}
{奶茶,koi}
{Roti,Indian}
We can see that besides spelling corrections, users’ rewrite behaviour also reveals deep semantic relations between these pairs that cannot be easily captured by lexical similarity, such as similar merchants, merchant attributes, language differences, cuisine types, and so on. We can leverage the user’s knowledge to build a query expansion corpus to improve the diversity of the search result and user experience. Furthermore, we can use the wisdom of the crowd to find some common patterns with higher confidence.
Based on this intuition, we leveraged the high volume of search click data available in Grab to generate high-quality expansion pairs at the user session level. To augment the original queries, we collected rewrite pairs that happened to multiple users and multiple times in a time period. Specifically, we used the heuristic rules below to collect the rewrite pairs:
Select the sessions where there are at least two distinct queries (rewrite session)
Collect adjacent query pairs in the search session where the second query leads to a click but the first does not (effective rewrite)
Filter out the sample pairs with time interval longer than 30 seconds in between, as users are more likely to change their mind on what to look for in these pairs (single intention)
Count the occurrences and filter out the low-frequency pairs (confidence management)
After we have the mining pairs, we categorised and annotated the rewrite types to gain a deeper understanding of the user’s rewrite behaviour. A few samples mined from the Singapore area data are shown in the table below.
Original query
Rewrite query
Frequency in a month
Distinct user count
Type
playmade by 丸作
playmade
697
666
Drop keywords
mcdonald’s
burger
573
535
Merchant -> Food
Bubble tea
koi
293
287
Food -> Merchant
Kfc
McDonald’s
238
234
Merchant -> Merchant
cake
birthday cake
206
205
Add words
麦当劳
mcdonald’s
205
199
Locale change
4 fingers
4fingers
165
162
Space correction
krc
kfc
126
124
Spelling correction
5 guys
five guys
120
120
Number synonym
koi the
koi thé
45
44
Tone change
We further computed the percentages of some categories, as shown in the figure below.
Figure 1. The donut chart illustrates the percentages of the distinct user counts for different types of rewrites.
Apart from adding words, dropping words and spelling corrections, a significant portion of the rewrites are in the category of Other. It is more semantic driven, such as merchant to merchant, or merchant to cuisine. Those rewrites are useful for capturing deeper connections between queries and can be a powerful diversifier to query expansion.
Grouping
After all the rewrite pairs were discovered offline through data mining, we grouped the query pairs by the original query to get the expansion candidates of each query. For serving efficiency, we limited the max number of expansion candidates to three.
Query expansion serving
Expansion matching architecture
The expansion matching architecture benefits from the recent search architecture upgrade, where the system flow is changed to a query understanding, multi-recall and result fusion flow. In particular, a query goes through the query understanding module and gets augmented with additional information. In this case, the query understanding module takes in the keyword and expands it to multiple synonyms, for example, KFC will be expanded to fried chicken. The original query together with its expansions are sent together to the search engine under the multi-recall framework. After that, results from multiple recallers with different keywords are fused together.
Continuous monitoring and feedback loop
It’s important to make sure the expansion pairs are relevant and up-to-date. We run the data mining pipeline periodically to capture the new user rewrite behaviours. Meanwhile, we also monitor the expansion pairs’ contribution to the search result by measuring the net contribution of recall or user interaction that the particular query brings, and eliminate the obsolete pairs in an automatic way. This reflects our effort to build an adaptive system.
Results
We conducted online A/B experiments across 6 countries in Southeast Asia to evaluate the expanded queries generated by our system. We set up 3 groups:
Control group, where no query is expanded.
Treatment group 1, where we expanded the queries based on manual annotations only.
Treatment group 2, where we expanded the queries using the data mining approach.
We observed decent uplift in click-through rate and conversion rate from both treatment groups. Furthermore, in treatment group 2, the data mining approach produced even better results.
Future work
Data mining enhancement
Currently, the data mining approach can only identify the pairs from the same search session by one user. This limits the number of linked pairs. Some potential enhancements include:
Augment expansion pairs by associating queries from different users who click on the same merchant/item, for example, using a click graph. This can capture relevant queries across user sessions.
Build a probabilistic model on top of the current transition pairs. Currently, all the transition pairs are equally weighted but apparently, the transitions that happen more often should carry higher probability/weights.
Ads application
Query expansion can be applied to advertising and would increase ads fill rate. With “KFC” expanded to “fried chicken”, the sponsored merchants who buy the keyword “fried chicken” would be eligible to show up when the user searches “KFC”. This would enable Grab to provide more relevant sponsored content to our users, which helps not only the consumers but also the merchants.
Special thanks to Zhengmin Xu and Daniel Ng for proofreading this article.
Join us
Grab is the leading superapp platform in Southeast Asia, providing everyday services that matter to consumers. More than just a ride-hailing and food delivery app, Grab offers a wide range of on-demand services in the region, including mobility, food, package and grocery delivery services, mobile payments, and financial services across 428 cities in eight countries.
Powered by technology and driven by heart, our mission is to drive Southeast Asia forward by creating economic empowerment for everyone. If this mission speaks to you, join our team today!
“Telematics”, a cross between the words telecommunications and informatics, was coined in the late 1970s to refer to the use of communication technologies in facilitating exchange of information. In the modern day, such technologies may include cloud platforms, mobile networks, and wireless transmissions (e.g., Bluetooth). Although the initial intention is for a more general scope, telematics is now specifically used to refer to vehicle telematics where details of vehicle movements are tracked for use cases such as driving safety, driver profiling, fleet optimisation, and productivity improvements.
We’ve previously published this article to share how Grab uses telematics to improve driver safety. In this blog post, we dive deeper into how telematics technology is used at Grab to encourage safer driving for our driver and delivery partners.
Background
At Grab, the safety of our users and their experience on our platform is our highest priority. By encouraging safer driving habits from our driver and delivery partners, road traffic accidents can be minimised, potentially reducing property damage, injuries, and even fatalities. Safe driving also helps ensure smoother rides and a more pleasant experience for consumers using our platform.
To encourage safer driving, we should:
Have a data-driven approach to understand how our driver and delivery partners are driving.
Help partners better understand how to improve their driving by summarising key driving history into a personalised Driving Safety Report.
Understanding driving behaviour
One of the most direct forms of driving assessment is consumer feedback or complaints. However, the frequency and coverage of this feedback is not very high as they are only applicable to transport verticals like JustGrab or GrabBike and not delivery verticals like GrabFood or GrabExpress. Plus, most driver partners tend not to receive any driving-related feedback (whether positive or negative), even for the transport verticals.
A more comprehensive method of assessing driving behaviour is to use the driving data collected during Grab bookings. To make sense of these data, we focus on selected driving manoeuvres (e.g., braking, acceleration, cornering, speeding) and detect the number of instances where our data shows unsafe driving in each of these areas.
We acknowledge that the detected instances may be subjected to errors and may not provide the complete picture of what’s happening on the ground (e.g., partners may be forced to do an emergency brake due to someone swerving into their lane).
To address this, we have incorporated several fail-safe checks into our detection logic to minimise erroneous detection. Also, any assessment of driving behaviour will be based on an aggregation of these unsafe driving instances over a large amount of driving data. For example, individual harsh braking instances may be inconclusive but if a driver partner displays multiple counts consistently across many bookings, it is likely that the partner may be used to unsafe driving practices like tailgating or is distracted while driving.
Telematics for detecting unsafe driving
For Grab to consistently ensure our consumers’ safety, we need to proactively detect unsafe driving behaviour before an accident occurs. However, it is not feasible for someone to be with our driver and delivery partners all the time to observe their driving behaviour. We should leverage sensor data to monitor these driving behaviour at scale.
Traditionally, a specialised “black box” inertial measurement unit (IMU) equipped with sensors such as accelerometers, gyroscopes, and GPS needs to be installed in alignment with the vehicle to directly measure vehicular acceleration and speed. In this manner, it would be straightforward to detect unsafe driving instances using this data. Unfortunately, the cost of purchasing and installing such devices for all our partners is prohibitively high and it would be hard to scale.
Instead, we can leverage a device that all partners already have: their mobile phone. Modern smartphones already contain similar sensors to those in IMUs and data can be collected through the telematics SDK. More details on telematics data collection can be found in a recently published Grab tech blog article1.
It’s important to note that telematics data are collected at a sufficiently high sampling frequency (much more than 1 Hz) to minimise inaccuracies in detecting unsafe driving instances characterised by sharp acceleration impulses.
Processing mobile sensor data to detect unsafe driving
Unlike specialised IMUs installed in vehicles, mobile sensor data have added challenges to detecting unsafe driving.
Accounting for orientation: Phone vs. vehicle
The phone is usually in a different orientation compared to the vehicle. Strictly speaking, the phone accelerometer sensor measures the accelerations of the phone and not the vehicle acceleration. To infer vehicle acceleration from phone sensor data, we developed a customised processing algorithm optimised specifically for Grab’s data.
First, the orientation offset of the phone with respect to the vehicle is defined using Euler angles: roll, pitch and yaw. In data windows with no net acceleration of the vehicle (e.g., no braking, turning motion), the only acceleration measured by the accelerometer is gravitational acceleration. Roll and pitch angles can then be determined through trigonometric manipulation. The complete triaxial accelerations of the phone are then rotated to the horizontal plane and the yaw angle is determined by principal component analysis (PCA).
An assumption here is that there will be sufficient braking and acceleration manoeuvring for PCA to determine the correct forward direction. This Euler angles determination is done periodically to account for any movement of phones during the trip. Finally, the raw phone accelerations are rotated to the vehicle orientation through a matrix multiplication with the rotation matrix derived from the Euler angles (see Figure 1).
Figure 1: Inference of vehicle acceleration from the phone sensor data. Smartphone and car images modified from designs found in Freepik.com.
Handling variations in data quality
Our processing algorithm is optimised to be highly robust and handle large variations in data quality that is expected from bookings on the Grab platform. There are many reported methods for processing mobile data to reorientate telematics data for four wheel vehicles23.
However, with the prevalent use of motorcycles on our platform, especially for delivery verticals, we observed that data collected from two wheel vehicles tend to be noisier due to differences in phone stability and vehicular vibrations. Data noise can be exacerbated if partners hold the phone in their hand or place it in their pockets while driving.
In addition, we also expect a wide variation in data quality and sensor availability from different phone models, such as older, low-end models to the newest, flagship models. A good example to illustrate the robustness of our algorithm is having different strategies to handle different degrees of data noise. For example, a simple low-pass filter is used for low noise data, while more complex variational decomposition and Kalman filter approaches are used for high noise data.
Detecting behaviour anomalies with thresholds
Once the vehicular accelerations are inferred, we can use a thresholding approach (see Figure 2) to detect unsafe driving instances.
For unsafe acceleration and braking, a peak finding algorithm is used to detect acceleration peaks beyond a threshold in the longitudinal (forward/backward) direction. For unsafe cornering, older and lower end phones are usually not equipped with gyroscope sensors, so we should look for peaks of lateral (sidewards) acceleration (which constitutes the centripetal acceleration during the turn) beyond a threshold. GPS bearing data that coarsely measures the orientation of the vehicle is then used to confirm that a cornering and not lane change instance is being detected. The thresholds selected are fine-tuned on Grab’s data using initial values based on published literature4 and other sources.
To reduce false positive detection, no unsafe driving instances will be flagged when:
Large discrepancies are observed between speeds derived from integrating the longitudinal (forward/backward) acceleration and speeds directly measured by the GPS sensor.
Large phone motions are detected. For example, when the phone falls to the seat from the dashboard, accelerations recorded on the phone sensor will deviate significantly from the vehicle accelerations.
GPS speed is very low before and after the unsafe driving instance is detected. This is limited to data collected from motorcycles which is usually used by delivery partners. It implies that the partner is walking and not in a vehicle. For example, a GrabFood delivery partner may be collecting the food from the merchant partner on foot, so no unsafe driving instances should be detected.
Figure 2: Animation showing unsafe driving detection by thresholding. Dotted lines in acceleration charts indicate selected thresholds. Map tiles by stamen design.
Detecting speeding instances from GPS speeds and map data
To define speeding along a stretch of road, we used a rule-based method by comparing raw speeds from GPS pings with speeding thresholds for that road. Although GPS speeds are generally accurate (subjected to minimal GPS errors), we need to take more precautions to ensure the right speeding thresholds are determined.
These thresholds are set using known speed limits from available map data or hourly aggregated speed statistics where speed limits are not available. The coverage and accuracy of known speed limits is continuously being improved by our in-house mapping initiatives and validated comprehensively by the respective local ground teams in selected cities.
Aggregating GPS pings from Grab driver and delivery partners can be a helpful proxy to actual speed limits by defining speeding violations as outliers from socially acceptable speeds derived from partners collectively. To reliably compute aggregated speed statistics, a representative speed profile for each stretch of road must first be inferred from raw GPS pings (see Figure 3).
As ping sampling intervals are fixed, more pings tend to be recorded for slower speeds. To correct the bias in the speed profile, we reweigh ping counts by using speed values as weights. Furthermore, to minimise distortions in the speed profile from vehicles driving at lower-than-expected speeds due to high traffic volumes, only pings from free-flowing traffic are used when inferring the speed profile.
Free-flowing traffic is defined by speeds higher than the median speed on each defined road category (e.g., small residential roads, normal primary roads, large expressways). To ensure extremely high speeds are flagged regardless of the speed of other drivers, maximum threshold values for aggregated speeds are set for each road category using heuristics based on the maximum known speed limit of that road category.
Figure 3: Steps to infer a representative speed profile for computing aggregated speed statistics.
Besides a representative speed profile, hourly aggregation should also include data from a sufficient number of unique drivers depending on speed variability. To obtain enough data, hourly aggregations are performed on the same day of the week over multiple weeks. This way, we have a comprehensive time-specific speed profile that accounts for traffic quality (e.g., peak hour traffic, traffic differences between weekdays/weekends) and driving conditions (e.g., visibility difference between day/night).
When detecting speeding violations, the GPS pings used are snapped-to-road and stationary pings, pings with unrealistic speeds, while pings with low GPS accuracy (e.g., when the vehicle is in a tunnel) are excluded. A speeding violation is defined as a sequence of consecutive GPS pings that exceed the speeding threshold. The following checks were put in place to minimise erroneous flagging of speeding violations:
Removal of duplicated (or stale) GPS pings.
Sufficient speed buffer given to take into account GPS errors.
Sustained speeding for a prolonged period of time is required to exclude transient speeding events (e.g., during lane change).
Driving safety report
The driving safety report is a platform safety product that driver and delivery partners can access via their driver profile page on the Grab Driver Application (see Figure 4). It is updated daily and aims to create awareness regarding driving habits by summarising key information from the processed data into a personalised report that can be easily consumed.
Individual reports of each driving manoeuvre (e.g., braking, acceleration, cornering and speeding) are available for daily and weekly views. Partners can also get more detailed information of each individual instance such as when these unsafe driving instances were detected.
Figure 4: Driving safety report for driver and delivery partners using four wheel vehicles. a) Actionable insights feature circled by red dotted lines. b) Daily view of various unsafe driving instances where more details of each instance can be viewed by tapping on “See details”.
Actionable insights
Besides compiling the instances of unsafe driving in a report to create awareness, we are also using these data to provide some actionable recommendations for our partners to improve their driving.
With unsafe driving feedback from consumers and reported road traffic accident data from our platform, we also train machine learning models to identify patterns in the detected unsafe driving instances and estimate the likelihood of partners receiving unsafe driving feedback or getting into accidents. One use case is to compute a safe driving score that equates a four-wheel partner’s driving behaviour to a numerical value where a higher score indicates a safer driver.
Additionally, we use Shapley additive explanation (SHAP) approaches to determine which driving manoeuvre contributes the most to increasing the likelihood of partners receiving unsafe driving feedback or getting into accidents. This information is included as an actionable insight in the driving safety report and helps partners to identify the key area to improve their driving.
What’s next?
At the moment, Grab performs telematics processing and unsafe driving detections after the trip and updates the report the next day. One of the biggest improvements would be to share this information with partners faster. We are actively working on developing a real-time processing algorithm that addresses this and also, satisfies the robustness requirements such that partners are immediately aware after an unsafe driving instance is detected.
Besides detecting typical unsafe driving manoeuvres, we are also exploring other use cases for mobile sensor data in road safety such as detection of poor road conditions, counterflow driving against traffic, and phone usage leading to distracted driving.
Join us
Grab is the leading superapp platform in Southeast Asia, providing everyday services that matter to consumers. More than just a ride-hailing and food delivery app, Grab offers a wide range of on-demand services in the region, including mobility, food, package and grocery delivery services, mobile payments, and financial services across 428 cities in eight countries.
Powered by technology and driven by heart, our mission is to drive Southeast Asia forward by creating economic empowerment for everyone. If this mission speaks to you, join our team today!
References
Burhan, W. (2022). How telematics helps Grab to improve safety. Grab Tech Blog. https://engineering.grab.com/telematics-at-grab ↩
Mohan, P., Padmanabhan, V.N. and Ramjee, R. (2008).Nericell: rich monitoring of road and traffic conditions using mobile smartphones. SenSys ‘08: Proceedings of the 6th ACM conference on Embedded network sensor systems, 312-336. https://doi.org/10.1145/1460412.1460444 ↩
Yarlagadda, J. and Pawar, D.S. (2022). Heterogeneity in the Driver Behavior: An Exploratory Study Using Real-Time Driving Data. Journal of Advanced Transportation. vol. 2022, Article ID 4509071. https://doi.org/10.1155/2022/4509071 ↩
Analysts need to analyse and simulate a rule on historical data to check the performance and accuracy of the rule. Backtesting enables analysts to run simulations of the rules and manage the results from the rule engine UI.
Backtesting helps analysts to:
Define the desired impact of the rule for our business and users.
Evaluate the accuracy of the rule based on historical data.
Compare and analyse results with data points, such as known false positives, user segments, risk profile of a user or transaction, and so on.
Currently, the analytics process to test performance of a rule is not standardised, and is inaccurate and inefficient. Analysts from different teams have different approaches:
Offline process using Presto tables. This process is lengthy and inaccurate.
Offline process based on the rule engine payload. The setup takes time, and the process is not streamlined.
Running rules in shadow mode. This process takes days to get the desired result.
A team in Grab uses different rule engines to manage rules and do backtesting. This doubles the effort for analysts and engineers.
In our vision for backtesting, it should allow analysts to:
Efficiently run and manage their jobs.
Create custom metrics, reports and dimensions for backtesting.
Add external data points and metrics to do a deep dive.
For the purpose of establishing a minimum viable product (MVP), backtesting will support basic capabilities and enable analysts to access required metrics and data points. Thus, analysts can:
Run backtesting jobs from the rule engine UI.
Get fixed reports and dimensions for every checkpoint.
Get access to relevant data to analyse backtesting results.
Background
Assume a simple use case: A rule to detect the transaction risk.
Each transaction has a transaction_id, user_id, currency, amount, timestamp. The rule engine also provides a treatment (Approve or Decline) based on the rule logic for the transaction.
In this specific use case, we would like to see what will be the aggregation number of the total transactions, total distinct users, and the sum of the amount, based on the dimensions of date, treatment, and currency in the last couple of weeks.
The result may look like the following data:
Dimension
Dimension
Dimension
metric
metric
metric
Date
Treatment
Currency
Total tx
Distinct user
Total amount
2020-05-1
Approve
SGD
100
80
10020
2020-05-1
Decline
SGD
50
40
450
2020-05-1
Approve
MYR
110
100
1200
2020-05-1
Decline
MYR
30
15
400
* This data does not reflect actual Grab data and is for illustrative purposes only.
Solution
Use a cloud-agnostic Spark-based data pipeline to replay any existing or proposed rule to check performance.
Use a Web Portal to:
Create or select a rule to replay, with replay time range.
Display and download the result, such as total events and hit counts.
Replay any existing or proposed rule for checking performance.
Allow users to create or select a rule to replay in the rule engine UI, with provided replay time range.
Display the replay result in the rule engine UI, such as total events and hit counts.
Provide a way to download all testing results in the rule engine UI (for example, all rule responses).
Remove dependency on the specific cloud provider stack, so other teams in Grab can use it instead of Google Cloud Platform (GCP).
Architecture details
The rule editor UI reacts to the user input. Its engine sends a job command to the Amazon Simple Queue Service (SQS) to initialise the job. After that, the rule editor also performs the following processes in the background:
Lambda listens to the request SQS queue and invokes a job via the Spark jobs API.
The job fetches the executable artifacts, data source. After the job is completed, the job script saves the result sheet as required to S3.
The Spark script pushes the job final status (success, failure, timeout) through the shutdown hook to respond to the SQS queue.
The rule editor engine listens to response callback messages, and processes the job metadata to the database, or sends notifications.
The rule editor displays the job metadata on the UI.
The package pipeline builds and deploys the executable artifacts to S3 as a manageable structure.
The Spark script takes the filter logic as its input parameters.
Workflow
Historical data preparation
The historical events are published by the rule engine through Kafka, and stored into the S3 bucket based on time. The Backtesting system then fetches these data for testing based on the time range requested.
By using a Kubernetes stream pipeline, we also save the trust inference stream to Trust AWS subaccount. With the customer bucket and file format, we can improve the efficiency of the data processing, and also avoid any delay from the data lake.
Description: Following the fields of steam definition, the engine name would be ruleengine, or catwalk. The predict-name would be preride (checkpoint name), or cnpu (model name).
File Format: avro
File Compression: Snappy
There is no auto retention on sub-account S3. We will implement the archive process in the future.
The default pipeline and the new pipeline will run in parallel until the Data Engineering team is ready to retire the default pipeline.
Backtesting
Upon scheduling, the Backtesting Portal sends a message to SQS, which is then captured by the listening Lambda.
Lambda invokes a Spark job over the AWS elastic mapreduce engine (EMR).
The EMR engine fetches the executable artifacts containing the rule script and historical data from S3, and starts a Spark job to apply the rule script over historical data. Depending on the size of data, the Spark cluster will scale automatically to ensure timely completion.
Once completed, a report file is generated and available on Backtesting UI.
UI
Learnings and conclusions
After the release, here’s what our data analysers had to say:
For trust analysts, testing a rule on historical data happens outside the rule engine UI and is not user-friendly, leading to analysts wasting significant time.
For financial analysts, as analysts migrate to the rule engine UI, the existing solution will be deprecated with no other solution.
An alternative to simulate a rule; we no longer need to run a rule in shadow mode because we can use historical data to determine the outcome. This new approach saves us weeks of effort on the rule onboarding process.
What’s next?
The underlying Spark jobs in this tool were developed by knowledgeable data engineers, which is a disadvantage because it requires a high level of expertise to modify the analytics. To mitigate this restriction, we are looking into using domain-specific language (DSL) to allow users to input desired attributes and dimensions, and provide the job release pipeline for self-serving jobs.
Thanks to Jia Long Loh for the support on the offline infrastructure engineering.
Join us
Grab is the leading superapp platform in Southeast Asia, providing everyday services that matter to consumers. More than just a ride-hailing and food delivery app, Grab offers a wide range of on-demand services in the region, including mobility, food, package and grocery delivery services, mobile payments, and financial services across 428 cities in eight countries.
Powered by technology and driven by heart, our mission is to drive Southeast Asia forward by creating economic empowerment for everyone. If this mission speaks to you, join our team today!
In the real world, after a passenger places a GrabFood order from the Grab App, the merchant-partner will prepare the order. A driver-partner will then collect the food and deliver it to the passenger. Have you ever wondered what happens in the backend system? The Grab Order Platform is a distributed system that processes millions of GrabFood or GrabMart orders every day. This post aims to share the journey of how we designed the database solution that powers the order platform.
Background
What are the design goals when building the database solution? We collected the requirements by analysing query patterns and traffic patterns.
Query patterns
Here are some important query examples that the Order Platform supports:
Write queries:
a. Create an order.
b. Update an order.
Read queries:
a. Get order by id.
b. Get ongoing orders by passenger id.
c. Get historical orders by various conditions.
d. Get order statistics (for example, get the number of orders)
We can break down queries into two categories: transactional queries and analytical queries. Transactional queries are critical to online order creation and completion, including the write queries and read queries such as 2a or 2b. Analytical queries like 2c and 2d retrieves historical orders or order statistics on demand. Analytical queries are not essential to the oncall order processing.
Traffic patterns
Grab’s Order Platform processes a significant amount of transaction data every month.
During peak hours, the write Queries per Second (QPS) is three times of primary key reads; whilst the range Queries per Second are four times of the primary key reads.
Design goals
From the query and traffic patterns, we arrived at the following three design goals:
Stability – the database solution must be able to handle high read and write QPS. Online order processing queries must have high availability. Even when some part of the system is down, we must be able to provide a degraded experience to the end users allowing them to still be able to create and complete an order.
Scalability and cost – the database solution must be able to support fast evolution of business requirements, given now we handle up to a million orders per month. The solution must also be cost effective at a large scale.
Consistency – strong consistency for transactional queries, and eventually consistency for analytical queries.
Solution
The first design principle towards a stable and scalable database solution is to use different databases to serve transactional and analytical queries, also known as OLTP and OLAP queries. An OLTP database serves queries critical to online order processing. This table keeps data for only a short period of time. Meanwhile, an OLAP database has the same set of data, but serves our historical and statistical queries. This database keeps data for a longer time.
What are the benefits from this design principle? From a stability point of view, we can choose different databases which can better fulfil our different query patterns and QPS requirements. An OLTP database is the single source of truth for online order processing; any failure in the OLAP database will not affect online transactions. From a scalability and cost point of view, we can choose a flexible database for OLAP to support our fast evolution of business requirements. We can maintain less data in our OLTP database while keeping some older data in our OLAP database.
To ensure that the data in both databases are consistent, we introduced the second design principle – data ingestion pipeline. In Figure 1, Order Platform writes data to the OLTP database to process online orders and asynchronously pushes the data into the data ingestion pipeline. The data ingestion pipeline ensures that the OLAP database data is eventually consistent.
Figure 1: Order Platform database solution overview
Architecture details
OLTP database
There are two categories of OLTP queries, the key-value queries (for example, load by order id) and the batch queries (for example, Get ongoing orders by passenger id). We use DynamoDB as the database to support these OLTP queries.
Why DynamoDB?
Scalable and highly available: the tables of DynamoDB are partitioned and each partition is three-way replicated.
Support for strong consistent reads by primary key.
DynamoDB has a mechanism called adaptive capacity to handle hotkey traffic. Internally, DynamoDB will distribute higher capacity to high-traffic partitions, and isolate frequently accessed items to a dedicated partition. This way, the hotkey can utilise the full capacity of an entire partition, which is up to 3000 read capacity units and 1000 write capacity units.
In each DynamoDB table, it has many items with attributes. In each item, it has a partition key and sort key. The partition key is used for key-value queries, and the sort key is used for range queries. In our case, the table contains multiple order items. The partition key is order ID. We can easily support key-value queries by the partition key.
order_id (PK)
state
pax_id
created_at
pax_id_gsi
order1
Ongoing
Alice
9:00am
order2
Ongoing
Alice
9:30am
order3
Completed
Alice
8:30am
Batch queries like ‘Get ongoing orders by passenger id’ are supported by DynamoDB Global Secondary Index (GSI). A GSI is like a normal DynamoDB table, which also has keys and attributes.
In our case, we have a GSI table where the partition key is the pax_id_gsi. The attribute pax_id_gsi is linked to the main table. It is eventually consistent with the main table that is maintained by DynamoDB. If the Order Platform queries ongoing orders for Alice, two items will be returned from the GSI table.
pax_id_gsi (PK)
created_at (SK)
order_id
Alice
9:00am
order1
Alice
9:30am
order2
We also make use of an advanced feature of GSI named sparse index to support ongoing order queries. When we update order status from ongoing to completed, at the same time, we set the pax_id_gsi to empty, so that the linked item in the GSI will be automatically deleted by DynamoDB. At any time, the GSI table only stores the ongoing orders. We use a sparse index mechanism to control our table size for better performance and to be more cost effective.
The next problem is data retention. This is achieved with the DynamoDB Time To Live (TTL) feature. DynamoDB will auto-scan expired items and delete them. But the challenge is when we add TTL to big tables, it will bring a heavy load to the background scanner and might result in an outage. Our solution is to only add a TTL attribute to the new items in the table. Then, we manually delete the items without TTL attributes, and run a script to delete items with TTL attributes that are too old. After this process, the table size will be quite small, so we can enable the TTL feature on the TTL attribute that we previously added without any concern. The retention period of our DynamoDB data is three months.
Costwise, DynamoDB is charged by storage size and the provision of the read write capability. The provision capability is actually auto scalable. The cost is on-demand. So it’s generally cheaper than RDS.
OLAP database
We use MySQL RDS as the database to support historical and statistical OLAP queries.
Why not Aurora? We choose RDS mainly because it is a mature database solution. Even if Aurora can provide better high-availability, RDS is enough to support our less critical use cases. Costwise, Aurora charges by data storage and the number of requested Input/Output Operations per Second (IOPS). RDS charges only by data storage. As we are using General Purpose (SSD) storage, IOPS is free and supports up to 16k IOPS.
We use MySQL partitioning for data retention. The order table is partitioned by creation time monthly. Since the data access pattern is mostly by month, the partition key can reduce cross-partition queries. Partitions older than six months are dropped at the beginning of each month.
Data ingestion pipeline
Figure 3: Data Ingestion Pipeline Architecture.
A Kafka stream is used to process data in the data ingestion pipeline. We choose the Kafka stream, because it has 99.95% SLA. It is not restricted by the OLTP and OLAP database types.
Even if Kafka can provide 99.95% SLA, there is still the chance of stream producer failures. When the producer fails, we will store the message in an Amazon Simple Queue Service (SQS) and retry. If the retry also fails, it will be moved to the SQS dead letter queue (DLQ), to be consumed at a later time.
On the stream consumer side, we use back-off retry at both stream and database levels to ensure consistency. In a worst-case scenario, we can rewind the stream events from Kafka.
It is important for the data ingestion pipeline to handle duplicate messages and out-of-order messages.
Duplicate messages are handled by the database level unique key (for example, order ID + creation time).
For the out-of-order messages, we implemented the following two mechanisms:
Version update: we only update the most recently updated data. The precision of the update time is in microseconds, which is enough for most of the use cases.
Upsert: if the update events occur before the create events, we simulate an upsert operation.
Impact
After launching our solution this year, we have saved significantly on cloud costs. In the earlier solution, Order Platform synchronously writes to DynamoDB and Aurora and the data is kept forever.
Conclusion
In terms of stability, we use DynamoDB as the critical OLTP database to ensure high availability for online order processing. Scalability wise, we use RDS as the OLAP database to support our quickly evolving business requirements by using a rich, multiple index. Cost efficiency is achieved by data retention in both databases. For consistency, we built a single source of truth OLTP database and an OLAP database that is eventually consistent with the help of the data ingestion pipeline.
What’s next?
Currently, the database solution is running on the production environment. Even though the database solution is proven to be stable, scalable and consistent, we still see some potential areas of improvement.
We use MySQL RDS for OLAP data storage. Even though MySQL is stable and cost effective, it is difficult to serve more complicated queries like free text search. Hence, we plan to explore other NoSQL databases like ElasticSearch.
We hope this post helps you understand how we store Grab orders and fulfil the queries from the Grab Order Platform.
Grab is the leading superapp platform in Southeast Asia, providing everyday services that matter to consumers. More than just a ride-hailing and food delivery app, Grab offers a wide range of on-demand services in the region, including mobility, food, package and grocery delivery services, mobile payments, and financial services across 428 cities in eight countries.
Powered by technology and driven by heart, our mission is to drive Southeast Asia forward by creating economic empowerment for everyone. If this mission speaks to you, join our team today!
Knowledge management is often one of the biggest challenges most companies face internally. Teams spend several working hours trying to either inefficiently look for information or constantly asking colleagues about information already documented somewhere. A lot of time is spent on the internal employee communication channels (in our case, Slack) simply trying to figure out answers to repetitive questions. On our journey to automate the responses to these repetitive questions, we needed first to figure out exactly how much time and effort is spent by on-call engineers answering such repetitive questions.
We soon identified that many of the internal engineering tools’ on-call activities involve answering users’ (internal users) questions on various Slack channels. Many of these questions have already been asked or documented on the wiki. These inquiries hinder on-call engineers’ productivity and affect their ability to focus on operational tasks. Once we figured out that on-call employees spend a lot of time answering Slack queries, we decided on a journey to determine the top questions.
We considered smaller groups of teams for this study and found out that:
The topmost user queries are “How do I do ABC?” or “Is XYZ broken?”.
The second most commonly asked questions revolve around access requests, approvals, or other permissions. The answer to such questions is often URLs to existing documentation.
These findings informed us that we didn’t just need an artificial intelligence (AI) based autoresponder to repetitive questions. We must, in fact, also leverage these channels’ chat histories to identify patterns.
Gathering user votes for shortlisted vendors
In light of saving costs and time and considering the quality of existing solutions already available in the market, we decided not to reinvent the wheel and instead purchase an existing product. And to figure out which product to purchase, we needed to do a comparative analysis. And thus began our vendor comparison journey!
While comparing the feature sets offered by different vendors, we understood that our users need to play a part in this decision-making process. However, sharing our vendor analysis with our users and allowing them to choose the bot of their choice posed several challenges:
Users could be biased towards known bots (from previous experiences).
Users could be biased towards big brands with a preconceived notion that big brands mean better features and better user support.
Users may likely pick the most expensive vendor, assuming that a higher cost means higher efficiency.
To ensure that we receive unbiased feedback, here’s how we opened users up to voting. We highlighted the top features of each vendor’s bot compared to other shortlisted bots. We hid the names of the bots to avoid brand attraction. At a high level, here’s what the categorisation looked like:
Features
Vendor 1 (name hidden)
Vendor 2 (name hidden)
Vendor 3 (name hidden)
Enables crowdsourcing, everyone is incentivised to participate. Participants/SME names are visible. Everyone can access the web UI and see how the responses configured on the bot.
–
–
Lowers discussions on channels by providing easy ways to raise tickets to the team instead of discussing on Slack.
–
Only a specific set of admins (or oncall engineers) feed and maintain the bot thus ensuring information authenticity and reliability.
Easy bot feeding mechanism/web UI to update FAQs.
–
Superior natural language processing capabilities.
–
Please vote
Vendor 1
Vendor 2
Vendor 3
Although none of the options had all the features our users wanted, about 60% chose Vendor 1 (OneBar). From this, we discovered the core features that our users needed while keeping them involved in the decision-making process.
Matching our requirements with available vendors’ feature sets
Although our users made their preferences clear, we still needed to ensure that the feature sets available in the market suited our internal requirements in terms of the setup and the features available in portals that we envisioned replacing. As part of our requirements gathering process, here are some of the critical conditions that became more and more prominent:
An ability to crowdsource Slack discussions/conclusions and save them directly from Slack (preferably with a single command).
An ability to auto-respond to Slack queries without calling the bot manually.
The bot must be able to respond to queries only on the preconfigured Slack channel (not a Slack-wide auto-responder that is already available).
Ability to auto-detect frequently asked questions on the channels would mean less work for platform engineers to feed the bot manually and periodically.
A trusted and secured data storage setup and a responsive customer support team.
Proof of concept
We considered several tools (including some of the tools used by our HR for auto-answering employee questions). We then decided to do a complete proof of concept (POC) with OneBar to check if it fulfils our internal requirements.
These were the phases in which we conducted the POC for the shortlisted vendor (OneBar):
Phase 1: Study the traffic, see what insights OneBar shows and what it could/should potentially show. Then think about how an ideal oncall or support should behave in such an environment. i.e. we could identify specific messages in history and describe what should’ve happened to each one of them.
Phase 2: Create required records in OneBar and configure it to match the desired behaviour as closely as possible.
Phase 3: Let the tool run for a couple of weeks and then evaluate how well it responds to questions, how often people search directly, how much information they add, etc. Onebar adds all these metrics in the app making it easier to monitor activity.
In addition to the Onebar POC, we investigated other solutions and did a thorough vendor comparison and analysis. After running the POC and investigating other vendors, we decided to use OneBar as its features best meet our needs.
Prioritising Slack channels
While we had multiple Slack channels that we’d love to have enabled the shortlisted bot on, our initial contract limited our use of the bot to only 20 channels. We could not use OneBar to auto-scan more than 20 Slack channels.
Users could still chat directly with the bot to get answers to FAQs based on what was fed to the bot’s knowledge base (KB). They could also access the web login, which displays its KB, other valuable features, and additional features for admins/experts.
Slack channels that we enabled the licensed features on were prioritised based on:
Most messages sent on the channel per month, i.e. most active channels.
Most members impacted, i.e. channels with a large member count.
To do this, we used Slack analytics reports and identified the channels that fit our prioritisation criteria.
Change is difficult but often essential
Once we’d onboarded the vendor, we began training and educating employees on using this new Knowledge Management system for all their FAQs. It was a challenge as change is always complex but essential for growth.
A series of tech talks and training conducted across the company and at more minor scales also helped guide users about the bot’s features and capabilities.
At the start, we suffered from a lack of data resulting in incorrect responses from the bot. But as the team became increasingly aware of the features and learned more about its capabilities, the bot’s number of KB items grew, resulting in a much more efficient experience. It took us around one quarter to feed the bot consistently to see accurate and frequent responses from it.
Crowdsourcing our internal glossary
With an increasing number of acronyms and company-specific words emerging each year, the number of acronyms and company-specific abbreviations that new joiners face is immense.
We solved this issue by using the bot’s channel-specific KB feature. We created a specific Slack channel dedicated to storing and retrieving definitions of acronyms and other words. This solution turned out to be a big hit with our users.
And who fed the bot with the terms and glossary items? Who better than our onboarding employees to train the bot to help other onboarders. A targeted campaign dedicated to feeding the bot excited many of our onboarders. They began to play around with the bot’s features and provide it with as many glossary items as possible, thus winning swags!
In a matter of weeks, the user base grew from a couple of hundred to around 3000. This effort was also called out in one of our company-wide All Hands meetings, a big win for our team!
Join us
Grab is the leading superapp platform in Southeast Asia, providing everyday services that matter to consumers. More than just a ride-hailing and food delivery app, Grab offers a wide range of on-demand services in the region, including mobility, food, package and grocery delivery services, mobile payments, and financial services across 428 cities in eight countries.
Powered by technology and driven by heart, our mission is to drive Southeast Asia forward by creating economic empowerment for everyone. If this mission speaks to you, join our team today!
Detecting fraud schemes used to require investigations using large amounts and varying types of data that come from many different anti-fraud systems. Investigators then need to combine the different types of data and use statistical methods to uncover suspicious claims, which is time consuming and inefficient in most cases.
We are always looking for ways to improve fraud investigation methods and stay one step ahead of our ever-growing fraudsters. In the introductory blog of this series, we’ve mentioned experimenting with a set of Graph Network technologies, including Graph Visualisation.
In this post, we will introduce our Graph Visualisation Platform and briefly illustrate how it makes fraud investigations easier and more effective.
Why visualise a graph?
If you’re a fan of crime shows, you would have come across scenes like a detective putting together evidence, such as pictures, notes and articles, on a board and connecting them with thumb tacks and yarn. When you look at the board, it’s easy to see the relationships between the different pieces of evidence. That’s what graphs do, especially in fraud detection.
In the same way, while graph data is the raw material of an investigation, some of the most interesting relationships are often inferred rather than modelled directly in the data. Visualising these relationships can give a unique “big picture” of the data that is difficult or impossible to obtain with traditional relational tables and business intelligence tools.
On the other hand, graph visualisation enhances the quick identification of relationships and significant structures because it is an intuitive way to help detect patterns. Plus, the human brain processes visual information much faster; that’s where our Graph Visualisation platform comes in.
What is the Graph Visualisation platform?
Graph Visualisation platform is a full-featured investigation platform that can reveal hidden connections and context in data by transforming raw records into highly visual and interactive maps. From there, investigators can grab any data point and quickly see relationships, patterns, and anomalies, and if necessary, drill down to investigate further.
This is all done without writing a manual query, switching between anti-fraud systems, or having to think about data science! These are some of the interactions on the platform that easily make anomalies or relevant patterns stand out.
Expanding the data
To date, we have over three billion nodes and edges in our storage system. It is not possible (nor necessary) to show all of the data at once. The platform allows the user to grab any data point and easily expand to view the relationships.
Timeline tracking and history replay
The Graph Visualisation platform’s interactive time filter lets you see temporal relationships within your data and clearly reveals the chronological progression of events. You can start with a specific time of interest, track everything that happens after, then quickly focus on the time and relationships that matter most.
10X investigations
Here are a few examples of how the Graph Visualisation platform facilitates fraud investigations.
Appeal confirmation
The following image shows the difference between a true fraudster and a falsely identified one. On the left, we have a Grab rental corporate account that was falsely detected by a fraud rule. Upon review, we discovered that there is no suspicious connection to this account, thus the account got unblocked.
On the right, we have a passenger that was blocked by the system and they appealed. Investigations showed that the passenger is, in fact, part of an extremely dense device-sharing network, so we maintained our decision to block.
Modus operandi discovery
Passenger sharing device
Fraudsters tend to share physical resources to maximise their revenue. With our Graph Visualisation platform, you can see exactly how this pattern looks like. The image below shows a device that is shared by a lot of fraudsters.
Anti-money laundering (AML)
On the left, we see a pattern of healthy spending on Grab. However, on the right, we can see that passengers are highly connected, and it has frequent large amount transfers to other payment providers.
Closing thoughts
Graph Visualisation is an intuitive way to investigate suspicious connections and potential patterns of crime. Investigators can directly interact with any data point to get the details they need and literally view the relationships in the data to make fast, accurate, and defensible decisions.
While fraud detection is a good use case for Graph Visualisation, it’s not the only possibility. Graph Visualisation can help make anything more efficient and intelligent, especially if you have highly connected data.
In the next part of this blog series, we will talk about the Graph service platform and the importance of building graph services with graph databases. Check out the other articles in this series:
Grab is the leading superapp platform in Southeast Asia, providing everyday services that matter to consumers. More than just a ride-hailing and food delivery app, Grab offers a wide range of on-demand services in the region, including mobility, food, package and grocery delivery services, mobile payments, and financial services across 428 cities in eight countries.
Powered by technology and driven by heart, our mission is to drive Southeast Asia forward by creating economic empowerment for everyone. If this mission speaks to you, join our team today!
Facial recognition technology is one of the many modern technologies that previously only appeared in science fiction movies. The roots of this technology can be traced back to the 1960s and have since grown dramatically due to the rise of deep learning techniques and accelerated digital transformation in recent years.
In this blog post, we will talk about the various applications of facial recognition technology in Grab, as well as provide details of the technical components that build up this technology.
Application of facial recognition technology
At Grab, we believe in prevention, protection, and action to create a safer every day for our consumers, partners, and the community as a whole. All selfies collected by Grab are handled according to Grab’s Privacy Policy and securely protected under privacy legislation in the countries in which we operate. We will elaborate in detail in a section further below.
One key incident prevention method is to verify the identity of both our consumers and partners:
From the perspective of protecting the safety of passengers, having a reliable driver authentication process can avoid unauthorized people from delivering a ride. This ensures that trips on Grab are only completed by registered licensed driver-partners that have passed our comprehensive background checks.
From the perspective of protecting the safety of driver-partners, verifying the identity of new passengers using facial recognition technology helps to deter crimes targeting our driver-partners and make incident investigations easier.
Safety incidents that arise from lack of identity verification
Facial recognition technology is also leveraged to improve Grab digital financial services, particularly in facilitating the “electronic Know Your Customer” (e-KYC) process. KYC is a standard regulatory requirement in the financial services industry to verify the identity of customers, which commonly serves to deter financial crime, such as money laundering.
Traditionally, customers are required to visit a physical counter to verify their government-issued ID as proof of identity. Today, with the widespread use of mobile devices, coupled with the maturity of facial recognition technologies, the process has become much more seamless and can be done entirely digitally.
Figure 1: GrabPay wallet e-KYC regulatory requirements in the Philippines
Overview of facial recognition technology
Figure 2: Face recognition flow
The typical facial recognition pipeline involves multiple stages, which starts with image preprocessing, face anti-spoof, followed by feature extraction, and finally the downstream applications – face verification or face search.
The most common image preprocessing techniques for face recognition tasks are face detection and face alignment. The face detection algorithm locates the face region in an image, and is usually followed by face alignment, which identifies the key facial landmarks (e.g. left eye, right eye, nose, etc.) and transforms them into a standardised coordinate space. Both of these preprocessing steps aim to ensure a consistent quality of input data for downstream applications.
Face anti-spoof refers to the process of ensuring that the user-submitted facial image is legitimate. This is to prevent fraudulent users from stealing identities (impersonating someone else by using a printed photo or replaying videos from mobile screens) or hiding identities (e.g. wearing a mask). The main approach here is to extract low-level spoofing cues, such as the moiré pattern, using various machine learning techniques to determine whether the image is spoofed.
After passing the anti-spoof checks, the user-submitted images are sent for face feature extraction, where important features that can be used to distinguish one person from another are extracted. Ideally, we want the feature extraction model to produce embeddings (i.e. high-dimensional vectors) with small intra-class distance (i.e. faces of the same person) and large inter-class distance (i.e. faces of different people), so that the aforementioned downstream applications (i.e. face verification and face search) become a straightforward task – thresholding the distance between embeddings.
Face verification is one of the key applications of facial recognition and it answers the question, “Is this the same person?”. As previously alluded to, this can be achieved by comparing the distance between embeddings generated from a template image (e.g. government-issued ID or profile picture) and a query image submitted by the user. A short distance indicates that both images belong to the same person, whereas a large distance indicates that these images are taken from different people.
Face search, on the other hand, tackles the question, “Who is this person?”, which can be framed as a vector/embedding similarity search problem. Image embeddings belonging to the same person would be highly similar, thus ranked higher, in search results. This is particularly useful for deterring criminals from re-onboarding to our platform by blocking new selfies that match a criminal profile in our criminal denylist database.
Face anti-spoof
For face anti-spoof, the most common methods used to attack the facial recognition system are screen replay and printed paper. To distinguish these spoof attacks from genuine faces, we need to solve two main challenges.
The first challenge is to obtain enough data of spoof attacks to enable the training of models. The second challenge is to carefully train the model to focus on the subtle differences between spoofed and genuine cases instead of overfitting to other background information.
Figure 3: Original face (left), screen replay attack (middle), synthetic data with a moiré pattern (right)
Collecting large volumes of spoof data is naturally hard since spoof cases in product flows are very rare. To overcome this problem, one option is to synthesise large volumes of spoof data instead of collecting the real spoof data. More specifically, we synthesise moiré patterns on genuine face images that we have, and use the synthetic data as the screen replay attack data. This allows our model to use small amounts of real spoof data and sufficiently identify spoofing, while collecting more data to train the model.
Figure 4: Data preparation with patch data
On the other hand, a spoofed face image contains lots of information with subtle spoof cues such as moiré patterns that cannot be detected by the naked eye. As such, it’s important to train the model to identify spoof cues instead of focusing on the possible domain bias between the spoof data and genuine data. To achieve this, we need to change the way we prepare the training data.
Instead of using the entire selfie image as the model input, we firstly detect and crop the face area, then evenly split the cropped face area into several patches. These patches are used as input to train the model. During inference, images are also split into patches the same way and the final result will be the average of outputs from all patches. After this data preprocessing, the patches will contain less global semantic information and more local structure features, making it easier for the model to learn and distinguish spoofed and genuine images.
Face verification
“Data is food for AI.” – Andrew Ng, founder of Google Brain
The key success factors of artificial intelligence (AI) models are undoubtedly driven by the volume and quality of data we hold. At Grab, we have one of the largest and most comprehensive face datasets, covering a wide range of demographic groups in Southeast Asia. This gives us a strong advantage to build a highly robust and unbiased facial recognition model that serves the region better.
As mentioned earlier, all selfies collected by Grab are securely protected under privacy legislation in the countries in which we operate. We take reasonable legal, organisational and technical measures to ensure that your Personal Data is protected, which includes measures to prevent Personal Data from getting lost, or used or accessed in an unauthorised way. We limit access to these Personal Data to our employees on a need to know basis. Those processing any Personal Data will only do so in an authorised manner and are required to treat the information with confidentiality.
Also, selfie data will not be shared with any other parties, including our driver, delivery partners or any other third parties without proper authorisation from the account holder. They are strictly used to improve and enhance our products and services, and not used as a means to collect personal identifiable data. Any disclosure of personal data will be handled in accordance with Grab Privacy Policy.
Other than data, model architecture also plays an important role, especially when handling less common face verification scenarios, such as ”selfie to ID photo” and “selfie to masked selfie” verifications.
The main challenge of “selfie to ID photo” verification is the shallow nature of the dataset, i.e. a large number of unique identities, but a low number of image samples per identity. This type of dataset lacks representation in intra-class diversity, which would commonly lead to model collapse during model training. Besides, “selfie to ID photo” verification also poses numerous challenges that are different from general facial recognition, such as aging (old ID photo), attrited ID card (normal wear and tear), and domain difference between printed ID photo and real-life selfie photo.
To address these issues, we leveraged a novel training method named semi-Siamese training (SST) 2, which is proposed by Du et al. (2020). The key idea is to enlarge intra-class diversity by ensuring that the backbone Siamese networks have similar parameters, but are not entirely identical, hence the name “semi-Siamese”.
Just like typical Siamese network architecture, feature vectors generated by the subnetworks are compared to compute the loss functions, such as Arc-softmax, Triplet loss, and Large margin cosine loss, all of which aim to reduce intra-class distance while increasing the inter-class distances. With the usage of the semi-Siamese backbone network, intra-class diversity is further promoted as it is guaranteed by the difference between the subnetworks, making the training convergence more stable.
Figure 6: Masked face verification
Another type of face verification problem we need to solve these days is the “selfie to masked selfie” verification. To pass this type of face verification, users are required to take off their masks as previous face verification models are unable to verify people with masks on. However, removing face masks to do face verification is inconvenient and risky in a crowded environment, which is a pain for many of our driver-partners who need to do verification from time to time.
To help ease this issue, we developed a face verification model that can verify people even while they are wearing masks. This is done by adding masked selfies into the training data and training the model with both masked and unmasked selfies. This not only enables the model to perform verification for people with masks on, but also helps to increase the accuracy of verifying those without masks. On top of that, masked selfies act as data augmentation and help to train the model with stronger ability of extracting features from the face.
Face search
As previously mentioned, once embeddings are produced by the facial recognition models, face search is fundamentally no different from face verification. Both processes use the distance between embeddings to decide whether the faces belong to the same person. The only difference here is that face search is more computationally expensive, since face verification is a 1-to-1 comparison, whereas face search is a 1-to-N comparison (N=size of the database).
In practice, there are many ways to significantly reduce the complexity of the search algorithm from O(N), such as using Inverted File Index (IVF) and Hierarchical Navigable Small World (HNSW) graphs. Besides, there are also various methods to increase the query speed, such as accelerating the distance computation using GPU, or approximating the distances using compressed vectors. This problem is also commonly known as Approximate Nearest Neighbor (ANN). Some of the great open-sourced vector similarity search libraries that can help to solve this problem are ScaNN3 (by Google), FAISS4(by Facebook), and Annoy (by Spotify).
What’s next?
In summary, facial recognition technology is an effective crime prevention and reduction tool to strengthen the safety of our platform and users. While the enforcement of selfie collection by itself is already a strong deterrent against fraudsters misusing our platform, leveraging facial recognition technology raises the bar by helping us to quickly and accurately identify these offenders.
As technologies advance, face spoofing patterns also evolve. We need to continuously monitor spoofing trends and actively improve our face anti-spoof algorithms to proactively ensure our users’ safety.
With the rapid growth of facial recognition technology, there is also a growing concern regarding data privacy issues. At Grab, consumer privacy and safety remain our top priorities and we continuously look for ways to improve our existing safeguards.
In May 2022, Grab was recognised by the Infocomm Media Development Authority in Singapore for its stringent data protection policies and processes through the award of Data Protection Trustmark (DPTM) certification. This recognition reinforces our belief that we can continue to draw the benefits from facial recognition technology, while avoiding any misuse of it. As the saying goes, “Technology is not inherently good or evil. It’s all about how people choose to use it”.
Join us
Grab is the leading superapp platform in Southeast Asia, providing everyday services that matter to consumers. More than just a ride-hailing and food delivery app, Grab offers a wide range of on-demand services in the region, including mobility, food, package and grocery delivery services, mobile payments, and financial services across 428 cities in eight countries.
Powered by technology and driven by heart, our mission is to drive Southeast Asia forward by creating economic empowerment for everyone. If this mission speaks to you, join our team today!
References
Niu, D., Guo R., and Wang, Y. (2021). Moiré Attack (MA): A New Potential Risk of Screen Photos. Advances in Neural Information Processing Systems. https://papers.nips.cc/paper/2021/hash/db9eeb7e678863649bce209842e0d164-Abstract.html ↩
Du, H., Shi, H., Liu, Y., Wang, J., Lei, Z., Zeng, D., & Mei, T. (2020). Semi-Siamese Training for Shallow Face Learning. European Conference on Computer Vision, 36–53. Springer. ↩
Guo, R., Sun, P., Lindgren, E., Geng, Q., Simcha, D., Chern, F., & Kumar, S. (2020). Accelerating Large-Scale Inference with Anisotropic Vector Quantization. International Conference on Machine Learning. https://arxiv.org/abs/1908.10396 ↩
Johnson, J., Douze, M., & Jégou, H. (2019). Billion-scale similarity search with GPUs. IEEE Transactions on Big Data, 7(3), 535–547. ↩
In an introductory article, we talked about the importance of Graph Networks in fraud detection. In this article, we will be adding some further context on graphs, graph technology and some common use cases.
Connectivity is the most prominent feature of today’s networks and systems. From molecular interactions, social networks and communication systems to power grids, shopping experiences or even supply chains, networks relating to real-world systems are not random. This means that these connections are not static and can be displayed differently at different times. Simple statistical analysis is insufficient to effectively characterise, let alone forecast, networked system behaviour.
As the world becomes more interconnected and systems become more complex, it is more important to employ technologies that are built to take advantage of relationships and their dynamic properties. There is no doubt that graphs have sparked a lot of attention because they are seen as a means to get insights from related data. Graph theory-based approaches show the concepts underlying the behaviour of massively complex systems and networks.
What are graphs?
Graphs are mathematical models frequently used in network science, which is a set of technological tools that may be applied to almost any subject. To put it simply, graphs are mathematical representations of complex systems.
Origin of graphs
The first graph was produced in 1736 in the city of Königsberg, now known as Kaliningrad, Russia. In this city, there were two islands with two mainland sections that were connected by seven different bridges.
Famed mathematician Euler wanted to plot a journey through the entire city by crossing each bridge only once. Euler proceeded to abstract the four regions of the city and the seven bridges into edges but he demonstrated that the problem was unsolvable. A simplified abstract graph is shown in Fig 1.
Fig 1 Abstraction graph
The graph’s four dots represent Königsberg’s four zones, while the lines represent the seven bridges that connect them. Zones connected by an even number of bridges is clearly navigable because several paths to enter and exit are available. Zones connected by an odd number of bridges can only be used as starting or terminating locations because the same route can only be taken once.
The number of edges associated with a node is known as the node degree. If two nodes have odd degrees and the rest have even degrees, the Königsberg problem could be solved. For example, exactly two regions must have an even number of bridges while the rest have an odd number of bridges. However, as illustrated in Fig 1, no Königsberg location has an even number of bridges, rendering this problem unsolvable.
Definition of graphs
A graph is a structure that consists of vertices and edges. Vertices, or nodes, are the objects in a problem, while edges are the links that connect vertices in a graph.
Vertices are the fundamental elements that a graph requires to function; there should be at least one in a graph. Vertices are mathematical abstractions that refer to objects that are linked by a condition.
On the other hand, edges are optional as graphs can still be defined without any edges. An edge is a link or connection between any two vertices in a graph, including a connection between a vertex and itself. The idea is that if two vertices are present, there is a relationship between them.
We usually indicate V={v1, v2, …, vn} as the set of vertices, and E = {e1, e2, …, em} as the set of edges. From there, we can define a graph G as a structure G(V, E) which models the relationship between the two sets:
Fig 2 Graph structure
It is worth noting that the order of the two sets within parentheses matters, because we usually express the vertices first, followed by the edges. A graph H(X, Y) is therefore a structure that models the relationship between the set of vertices X and the set of edges Y, not the other way around.
Graph data model
Now that we have covered graphs and their typical components, let us move on to graph data models, which help to translate a conceptual view of your data to a logical model. Two common graph data formats are Resource Description Framework (RDF) and Labelled Property Graph (LPG).
Resource Description Framework (RDF)
RDF is typically used for metadata and facilitates standardised exchange of data based on their relationships. RDFs typically consist of a triple: a subject, a predicate, and an object. A collection of such triples is an RDF graph. This can be depicted as a node and a directed edge diagram, with each triple representing a node-edge-node graph, as shown in Fig 3.
Literals – data type value, i.e. text, integer, etc.
Blank nodes – have no identification; similar to anonymous or existential variables.
Let us use an example to illustrate this. We have a person with the name Art and we want to plot all his relationships. In this case, the IRI is http://example.org/art and this can be shortened by defining a prefix like ex.
In this example, the IRI http://xmlns.com/foaf/0.1/knows defines the relationship knows. We define foaf as the prefix for http://xmlns.com/foaf/0.1/. The following code snippet shows how a graph like this will look.
In the last two lines, you can see how a literal and blank node would be depicted in an RDF graph. The variable foaf:age is a literal node with the integer value of 23, while foaf:based_near is an anonymous spatial entity with a node identifier of underscore. Outside the context of this graph, o1 is a data identifier with no meaning.
Multiple IRIs, intended for use in RDF graphs, are typically stored in an RDF vocabulary. These IRIs often begin with a common substring known as a namespace IRI. In some cases, namespace IRIs are also associated with a short name known as a namespace prefix. In the example above, http://xmlns.com/foaf/0.1/ is the namespace IRI and foaf and ex are namespace prefixes.
Note: RDF graphs are considered atemporal as they provide a static snapshot of data. They can use appropriate language extensions to communicate information about events or other dynamic properties of entities.
An RDF dataset is a set of RDF graphs that includes one or more named graphs as well as exactly one default graph. A default graph is one that can be empty, and has no associated IRI or name, while each named graph has an IRI or a blank node corresponding to the RDF graph and its name. If there is no named graph specified in a query, the default graph is queried (hence its name).
Labelled Property Graph (LPG)
A labelled property graph is made up of nodes, links, and properties. Each node is given a label and a set of characteristics in the form of arbitrary key-value pairs. The keys are strings, and the values can be any data type. A relationship is then defined by adding a directed edge that is labelled and connects two nodes with a set of properties.
In Fig 4, we have an LPG that shows two nodes: art and bea. The bea node has two characteristics, age and proximity, that are connected by a known edge. This edge has the attribute since because it commemorates the year that art and bea first met.
Fig 4 Labelled Property Graph: Example 1
Nodes, edges and properties must be defined when designing an LPG data model. In this scenario, based_near might not be applicable to all vertices, but they should be defined. You might be wondering, why not represent the city Seattle as a node and add an edge marked as based_near that connects a person and the city?
In general, if there is a value linked to a large number of other nodes in the network and it requires additional properties to correlate with other nodes, it should be represented as a node. In this scenario, the architecture defined in Fig 5 is more appropriate for traversing based_near connections. It also gives us the ability to link any new attributes to the based_near relationship.
Fig 5 Labelled Property Graph: Example 2
Now that we have the context of graphs, let us talk about graph databases, how they help with large data queries and the part they play in Graph Technology.
Graph database
A graph database is a type of NoSQL database that stores data using network topology. The idea is derived from LPG, which represents data sets with vertices, edges, and attributes.
Vertices are instances or entities of data that represent any object to be tracked, such as people, accounts, locations, etc.
Edges are the critical concepts in graph databases which represent relationships between vertices. The connections have a direction that can be unidirectional (one-way) or bidirectional (two-way).
Properties represent descriptive information associated with vertices. In some cases, edges have properties as well.
Graph databases provide a more conceptual view of data that is closer to reality. Modelling complex linkages becomes simpler because interconnections between data points are given the same weight as the data itself.
Graph database vs. relational database
Relational databases are currently the industry norm and take a structured approach to data, usually in the form of tables. On the other hand, graph databases are agile and focus on immediate relationship understanding. Neither type is designed to replace the other, so it is important to know what each database type has to offer.
Fig 6 Graph database vs relational database
There is a domain for both graph and relational databases. Graph databases outperform typical relational databases, especially in use cases involving complicated relationships, as they take a more naturalistic and flowing approach to data.
The key distinctions between graph and relational databases are summarised in the following table:
Type
Graph
Relational
Format
Nodes and edges with properties
Tables with rows and columns
Relationships
Represented with edges between nodes
Created using foreign keys between tables
Flexibility
Flexible
Rigid
Complex queries
Quick and responsive
Requires complex joins
Use case
Systems with highly connected relationships
Transaction focused systems with more straightforward relationships
Table. 1 Graph vs. Relational Databases
Advantages and disadvantages
Every database type has its advantages and disadvantages; knowing the distinctions as well as potential options for specific challenges is crucial. Graph databases are a rapidly evolving technology with improved functions compared with other database types.
Advantages
Some advantages of graph databases include:
Agile and flexible structures.
Explicit relationship representation between entities.
Real-time query output – speed depends on the number of relationships.
Disadvantages
The general disadvantages of graph databases are:
No standardised query language; depends on the platform used.
Not suitable for transactional-based systems.
Small user base, making it hard to find troubleshooting support.
Graph technology
Graph technology is the next step in improving analytics delivery. Traditional analytics is insufficient to meet complicated business operations, distribution, and analytical concerns as data quantities expand.
Graph technology aids in the discovery of unknown correlations in data that would otherwise go undetected or unanalysed. When the term graph is used to describe a topic, three distinct concepts come to mind: graph theory, graph analytics, and graph data management.
Graph theory – A mathematical notion that uses stack ordering to find paths, linkages, and networks of logical or physical objects, as well as their relationships. Can be used to model molecules, telephone lines, transport routes, manufacturing processes, and many other things.
Graph analytics – The application of graph theory to uncover nodes, edges, and data linkages that may be assigned semantic attributes. Can examine potentially interesting connections in data found in traditional analysis solutions, using node and edge relationships.
Graph database – A type of storage for data generated by graph analytics. Filling a knowledge graph, which is a model in data that indicates a common usage of acquired knowledge or data sets expressing a frequently held notion, is a typical use case for graph analytics output.
While the architecture and terminology are sometimes misunderstood, graph analytics’ output can be viewed through visualisation tools, knowledge graphs, particular applications, and even some advanced dashboard capabilities of business intelligence tools. All three concepts above are frequently used to improve system efficiency and even to assist in dynamic data management. In this approach, graph theory and analysis are inextricably linked, and analysis may always rely on graph databases.
Graph-centric user stories
Fraud detection
Traditional fraud prevention methods concentrate on discrete data points such as individual accounts, devices, or IP addresses. However, today’s sophisticated fraudsters avoid detection by building fraud rings using stolen and fake identities. To detect such fraud rings, we need to look beyond individual data points to the linkages that connect them.
Graph technology greatly transcends the capabilities of a relational database, by revealing hard-to-find patterns. Enterprise businesses also employ Graph technology to supplement their existing fraud detection skills to tackle a wide range of financial crimes, including first-party bank fraud, fraud, and money laundering.
Real-time recommendations
An online business’s success depends on systems that can generate meaningful recommendations in real time. To do so, we need the capacity to correlate product, customer, inventory, supplier, logistical, and even social sentiment data in real time. Furthermore, a real-time recommendation engine must be able to record any new interests displayed during the consumer’s current visit in real time, which batch processing cannot do.
Graph databases outperform relational and other NoSQL data stores in terms of delivering real-time suggestions. Graph databases can easily integrate different types of data to get insights into consumer requirements and product trends, making them an increasingly popular alternative to traditional relational databases.
Supply chain management
With complicated scenarios like supply chains, there are many different parties involved and companies need to stay vigilant in detecting issues like fraud, contamination, high-risk areas or unknown product sources. This means that there is a need to efficiently process large amounts of data and ensure transparency throughout the supply chain.
To have a transparent supply chain, relationships between each product and party need to be mapped out, which means there will be deep linkages. Graph databases are great for these as they are designed to search and analyse data with deep links. This means they can process enormous amounts of data without performance issues.
Identity and access management
Managing multiple changing roles, groups, products and authorisations can be difficult, especially in large organisations. Graph technology integrates your data and allows quick and effective identity and access control. It also allows you to track all identity and access authorisations and inheritances with significant depth and real-time insights.
Network and IT operations
Because of the scale and complexity of network and IT infrastructure, you need a configuration management database (CMDB) that is far more capable than relational databases. Neptune is an example of a CMDB and graph database that allows you to correlate your network, data centre, and IT assets to aid troubleshooting, impact analysis, and capacity or outage planning.
A graph database allows you to integrate various monitoring tools and acquire important insights into the complicated relationships that exist between various network or data centre processes. Possible applications of graphs in network and IT operations range from dependency management to automated microservice monitoring.
Risk assessment and monitoring
Risk assessment is crucial in the fintech business. With multiple sources of credit data such as ecommerce sites, mobile wallets and loan repayment records, it can be difficult to accurately assess an individual’s credit risk. Graph Technology makes it possible to combine these data sources, quantify an individual’s fraud risk and even generate full credit reviews.
One clear example of this is IceKredit, which employs artificial intelligence (AI) and machine learning (ML) techniques to make better risk-based decisions. With Graph technology, IceKredit has also successfully detected unreported links and increased efficiency of financial crime investigations.
Social network
Whether you’re using stated social connections or inferring links based on behaviour, social graph databases like Neptune introduce possibilities for building new social networks or integrating existing social graphs into commercial applications.
Having a data model that is identical to your domain model allows you to better understand your data, communicate more effectively, and save time. By decreasing the time spent data modelling, graph databases increase the quality and speed of development for your social network application.
Artificial intelligence (AI) and machine learning (ML)
AI and ML use statistical and analytical approaches to find patterns in data and provide insights. However, there are two prevalent concerns that arise – the quality of data and effectiveness of the analytics. Some AI and ML solutions have poor accuracy because there is not enough training data or variants that have a high correlation to the outcome.
These ML data issues can be solved with graph databases as it’s possible to connect and traverse links, as well as supplement raw data. With Graph technology, ML systems can recognise each column as a “feature” and each connection as a distinct characteristic, and then be able to identify data patterns and train themselves to recognise these relationships.
Conclusion
Graphs are a great way to visually represent complex systems and can be used to easily detect patterns or relationships between entities. To help improve graphs’ ability to detect patterns early, businesses should consider using Graph technology, which is the next step in improving analytics delivery.
Graph technology typically consists of:
Graph theory – Used to find paths, linkages and networks of logical or physical objects.
Graph analytics – Application of graph theory to uncover nodes, edges, and data linkages.
Graph database – Storage for data generated by graph analytics.
Although predominantly used in fraud detection, Graph technology has many other use cases such as making real-time recommendations based on consumer behaviour, identity and access control, risk assessment and monitoring, AI and ML, and many more.
Check out our next blog article, where we will be talking about how our Graph Visualisation Platform enhances Grab’s fraud detection methods.
Grab is the leading superapp platform in Southeast Asia, providing everyday services that matter to consumers. More than just a ride-hailing and food delivery app, Grab offers a wide range of on-demand services in the region, including mobility, food, package and grocery delivery services, mobile payments, and financial services across 428 cities in eight countries.
Powered by technology and driven by heart, our mission is to drive Southeast Asia forward by creating economic empowerment for everyone. If this mission speaks to you, join our team today!
Trustworthy experiments are key to making sound decisions, so analysts and data scientists put a lot of effort into analysing them and making business impacts. An extension of Grab’s Experimentation (GrabX) platform, Automated Experiment Analysis is one of Grab’s data products that helps automate statistical analyses of experiments. It also provides automatic experimental data pipelines and customised tests for different types of experiments.
Designed to help Grab in its journey of innovation and data-driven decision making, the data product helps to:
Standardise and automate the basic experiment analysis process on Grab experiments.
Ensure post-experiment results are reproducible under a company-wide standard, and easily reviewed by each other.
Democratise the institutional knowledge of experimentation across functions.
Background
Today, the GrabX platform provides the ability to define, configure, and execute online controlled experiments (OCEs), often called A/B tests, to gather trustworthy data and make data-driven decisions about how to improve our products.
Before the automated analysis, each experiment was analysed manually on an ad-hoc basis. This manual and federated model brings in several challenges at the company level:
Inefficiency: Repetitive nature of data pipeline building and basic post-experiment analyses incur large costs and deplete the analysts’ bandwidth from running deeper analyses.
Lack of quality control: Risk of unstandardised, inaccurate or late results as the platform cannot exercise data-governance/control or extend offerings to Grab’s other entities.
Lack of scalability and availability: GrabX users have varied backgrounds and skills, making their approaches to experiments different and not easily transferable/shared. E.g. Some teams may use more advanced techniques to speed up their experiments without using too much resources but these techniques are not transferable without considerable training.
Solution
Architecture details
Architecture diagram
When users set up experiments on GrabX, they can configure the success metrics they are interested in. These metrics configurations are then stored in the metadata as “bronze”, “silver”, and “gold” datasets depending on the corresponding step in the automated data pipeline process.
Metrics configuration and “bronze” datasets
In this project, we have developed a metrics glossary that stores information about what the metrics are and how they are computed. The metrics glossary is stored in CosmoDB and serves as an API Endpoint for GrabX so users can pick from the list of available metrics. If a metric is not available, users can input their custom metrics definition.
This metrics selection, as an analysis configuration, is then stored as a “bronze” dataset in Azure Data Lake as metadata, together with the experiment configurations. Once the experiment starts, the data pipeline gathers all experiment subjects and their assigned experiment groups from our clickstream tracking system.
In this case, the experiment subject refers to the facets of the experiment. For example, if the experiment subject is a user, then the user will go through the same experience throughout the entire experimentation period.
Metrics computation and “silver” datasets
In this step, the metrics engine gathers all metrics data based on the metrics configuration and computes the metrics for each experiment subject. This computed data is then stored as a “silver” dataset and is the foundation dataset for all statistical analyses.
“Silver” datasets are then passed through the “Decision Engine” to get the final “gold” datasets, which contain the experiment results.
Results visualisation and ”gold” datasets
In “gold” datasets, we have the result of the experiment, along with some custom messages we want to show our users. These are saved in sets of fact and dim tables (typically used in star schemas).
For users to visualise the result on GrabX, we leverage the embedded Power BI visualisation. We build the visualisation using a “gold” dataset and embed it to each experiment page with a fixed filter. By doing so, users can experience the end-to-end flow directly from GrabX.
Implementation
The implementation consists of four key engineering components:
Analysis configuration setup
A data pipeline
Automatic analysis
Results visualisation
Analysis configuration is part of the experiment setup process where users select success metrics they are interested in. This is an essential configuration for post-experiment analysis, in addition to the usual experiment configurations (e.g. sampling strategies).
It ensures that the reported experiment results will align with the hypothesis setup, which helps avoid one of the common pitfalls in OCEs 1.
There are three types of metrics available:
Pre-defined metrics: These metrics are already defined in the Scribe datamart, e.g. Gross Merchandise Value (GMV) per pax.
Event-based metrics: Users can specify an ad-hoc metric in the form of a funnel with event names for funnel start and end.
Build your own metrics: Users have the flexibility to define a metric in the form of a SQL query.
A data pipeline here mainly consists of data sourcing and data processing. We use Azure Data Factory to schedule ETL pipelines so we can calculate the metrics and statistical analysis. ETL jobs are written in spark and run using Databricks.
Data pipelines are streamlined to the following:
Load experiments and metrics metadata, defined at the experiment creation stage.
Load experiment and clickstream events.
Load experiment assignments. An experiment assignment maps a randomisation unit ID to the corresponding experiment or variant IDs.
Merge the data mentioned above for each experiment variant, and obtain sufficient data to do a deeper results analysis.
Automatic analysis uses an internal python package “Decision Engine”, which decouples the dataset and statistical tests, so that we can incrementally improve applications of advanced techniques. It provides a comprehensive set of test results at the variant level, which include statistics, p-values, confidence intervals, and the test choices that correspond to the experiment configurations. It’s a crowdsourced project which allows all to contribute what they believe should be included in fundamental post-experiment analysis.
Results visualisation leverages PowerBI, which is embedded in the GrabX UI, so users can run the experiments and review the results on a single platform.
Impact
At the individual user level, Automated Experiment Analysis is designed to enable analysts and data scientists to associate metrics with experiments, and present the experiment results in a standardised and comprehensive manner. It speeds up the decision-making process and frees up the bandwidths of analysts and data scientists to conduct deeper analyses.
At the user community level, it improves the efficiency of running experimental analysis by capturing all experiments, their results, and the launch decision within a single platform.
Learnings/Conclusion
Automated Experiment Analysis is the first building block to boost the trustworthiness of OCEs in Grab. Not all types of experiments are fully onboard, and they might not need to be. Through this journey, we believe these key learnings would be useful for experimenters and platform teams:
To standardise and simplify several experimental analysis steps, there needs to be automation data pipelines, analytics tools, and a metrics store in the infrastructure.
The “Decision Engine” analytics tool should be decoupled from the other engineering components, so that it can be incrementally improved in future.
To democratise knowledge and ensure service coverage, many components need to have a crowdsourcing feature, e.g. the metrics store has a BYOM function, and “Decision Engine” is an open-sourced internal python package.
Tracking implementation is important. To standardise data pipelines and achieve scalability, we need to standardise the way we implement tracking.
What’s next?
A centralised metric store – We built a metric calculation dictionary, which currently contains around 30-40 basic business metrics, but its functionality is limited to GrabX Experimentation use case.
If the metric store is expected to serve more general uses, it needs to be further enriched by allowing some “smarts”, e.g. fabric-agnostic metrics computations 2, other types of data slicing, and some considerations with real-time metrics or signals.
An end-to-end experiment guide rail – Currently, we provide automatic data analysis after an experiment is done, but no guardrail features at multiple experiment stages, e.g. sampling strategy choices, sample size recommendation from the planning stage, and data quality check during/after the experiment windows. Without the end-to-end guardrails, running experiments will be very prone to pitfalls. We therefore plan to add some degree of automation to ensure experiments adhere to the standards used by the post-experimental analysis.
A more comprehensive analysis toolbox – The current state of the project mainly focuses on infrastructure development, so it starts with basic frequentist’s A/B testing approaches. In future versions, it can be extended to include sequential testing, CUPED 3, attribution analysis, Causal Forest, heterogeneous treatment effects, etc.
Join us
Grab is the leading superapp platform in Southeast Asia, providing everyday services that matter to consumers. More than just a ride-hailing and food delivery app, Grab offers a wide range of on-demand services in the region, including mobility, food, package and grocery delivery services, mobile payments, and financial services across 428 cities in eight countries.
Powered by technology and driven by heart, our mission is to drive Southeast Asia forward by creating economic empowerment for everyone. If this mission speaks to you, join our team today!
References
Dmitriev, P., Gupta, S., Kim, D. W., & Vaz, G. (2017, August). A dirty dozen: twelve common metric interpretation pitfalls in online controlled experiments. In Proceedings of the 23rd ACM SIGKDD international conference on knowledge discovery and data mining (pp. 1427-1436). ↩
Deng, A., Xu, Y., Kohavi, R., & Walker, T. (2013, February). Improving the sensitivity of online controlled experiments by utilising pre-experiment data. In Proceedings of the sixth ACM international conference on Web search and data mining (pp. 123-132). ↩
Prior to 2021, Grab’s search architecture was designed to only support textual matching, which takes in a user query and looks for exact matches within the ecosystem through an inverted index. This legacy system meant that only textual matching results could be fetched.
In the second half of 2021, the Deliveries search team worked on improving this architecture to make it smarter, more scalable and also unlock future growth for different search use cases at Grab. The figure below shows a simplified overview of the legacy architecture.
Legacy architecture
Problem statement
With the legacy system, we noticed several problems.
Search results were textually matched without considering intention and context
If a user types in a query “Roti Prata” (flatbread), he is likely looking for Roti Prata dishes and those matches with the dish name should be prioritised compared with matches with the merchant-partner’s name or matches with other entities.
In the legacy system, all entities whose names partially matched “Roti Prata” were displayed and ranked according to hard coded weights, and matches with merchant-partner names were always prioritised, even if the user intention was clearly to search for the “Roti Prata” dish itself.
This problem was more common in Mart, as users often intended to search for items instead of shops. Besides the lack of intention recognition, the search system was also unable to take context into consideration; users searching the same keyword query at different times and locations could have different objectives. E.g. if users search for “Bread” in the day, they may be likely to look for cafes while searches at night could be for breakfast the next day.
Search results from multiple business verticals were not blended effectively
In Grab’s context, results from multiple verticals were often merged. For example, in Mart searches, Ads and Mart organic search results were displayed together; in Food searches, Ads, Food and Mart organic results were blended together.
In the legacy architecture, multiple business verticals were merged on the Deliveries API layer, which resulted in the leak of abstraction and loss of useful data as data from the search recall stage was also not taken into account during the merge stage.
Inability to quickly scale to new search use cases and difficulty in reusing existing components
The legacy code base was not written in a structured way that could scale to new use cases easily. If new search use cases cannot be built on top of an existing system, it can be rather tedious to keep rebuilding the function every time there is a new search use case.
Solution
In this section, solutions from both architecture and implementation perspectives are presented to address the above problem statements.
Architecture
In the new architecture, the flow is extended from lexical recall only to multi-layer including boosting, multi-recall, and ranking. The addition of boosting enables capabilities like intent recognition and query expansion, while the change from single lexical recall to multi-recall opens up the potential for other recall methods, e.g. embedding based and graph based.
These help address the first problem statement. Furthermore, the multi-recall framework enables fetching results from multiple business verticals, addressing the second problem statement. In the new framework, results from different verticals and different recall methods were grouped and ranked together without any leak of abstraction or loss of useful data from search recall stage in ranking.
Upgraded architecture
Implementation
We believe that the key to a platform’s success is modularisation and flexible assembling of plugins to enable quick product iteration. That is why we implemented a combination of a framework defined by the platform and plugins provided by service teams. In this implementation, plugins are assembled through configurations, which addresses the third problem statement and has two advantages:
Separation of concern. With the main flow abstracted and maintained by the platform, service team developers could focus on the application logic by writing plugins and fitting them into the main flow. In this case, developers without search experience could quickly enable new search flows.
Reusing plugins and economies of scale. With more use cases onboarded, more plugins are written by service teams and these plugins are reusable assets, resulting in scale effect. For example, an Ads recall plugin could be reused in Food keyword or non-keyword searches, Mart keyword or non-keyword searches and universal search flows as all these searches contain non-organic Ads. Similarly, a Mart recall plugin could be reused in Mart keyword or non-keyword searches, universal search and Food keyword search flows, as all these flows contain Mart results. With more plugins accumulated on our platform, developers might be able to ship a new search flow by just reusing and assembling the existing plugins.
Conclusion
Our platform now has a smart search with intent recognition and semantic (embedding-based) search. The process of adding new modules is also more straightforward and adds intention recognition to the boosting step as well as embedding as an additional recall to the multi-recall step. These modules can be easily reused by other use cases.
On top of that, we also have a mixed Ads and an organic framework. This means that data in the recall stage is taken into consideration and Ads can now be ranked together with organic results, e.g. text relevance.
With a modularised design and plugins provided by the platform, it is easier for clients to use our platform with a simple onboarding process. Furthermore, plugins can be reused to cater to new use cases and achieve a scale effect.
Join us
Grab is the leading superapp platform in Southeast Asia, providing everyday services that matter to consumers. More than just a ride-hailing and food delivery app, Grab offers a wide range of on-demand services in the region, including mobility, food, package and grocery delivery services, mobile payments, and financial services across 428 cities in eight countries.
Powered by technology and driven by heart, our mission is to drive Southeast Asia forward by creating economic empowerment for everyone. If this mission speaks to you, join our team today!
The collective thoughts of the interwebz
Manage Consent
To provide the best experiences, we use technologies like cookies to store and/or access device information. Consenting to these technologies will allow us to process data such as browsing behavior or unique IDs on this site. Not consenting or withdrawing consent, may adversely affect certain features and functions.
Functional
Always active
The technical storage or access is strictly necessary for the legitimate purpose of enabling the use of a specific service explicitly requested by the subscriber or user, or for the sole purpose of carrying out the transmission of a communication over an electronic communications network.
Preferences
The technical storage or access is necessary for the legitimate purpose of storing preferences that are not requested by the subscriber or user.
Statistics
The technical storage or access that is used exclusively for statistical purposes.The technical storage or access that is used exclusively for anonymous statistical purposes. Without a subpoena, voluntary compliance on the part of your Internet Service Provider, or additional records from a third party, information stored or retrieved for this purpose alone cannot usually be used to identify you.
Marketing
The technical storage or access is required to create user profiles to send advertising, or to track the user on a website or across several websites for similar marketing purposes.