Post Syndicated from Grab Tech original https://engineering.grab.com/rethinking-streaming-processing-data-exploration
Introduction
In this digital age, companies collect multitudes of data that enable the tracking of business metrics and performance. Over the years, data analytics tools for data storage and processing have evolved from the days of Excel sheets and macros to more advanced Map Reduce model tools like Spark, Hadoop, and Hive. This evolution has allowed companies, including Grab, to perform modern analytics on the data ingested into the Data Lake, empowering them to make better data-driven business decisions. This form of data will be referenced within this document as “Offline Data”.
With innovations in stream processing technology like Spark and Flink, there is now more interest in unlocking value from streaming data. This form of continuously-generated data in high volume will be referenced within this document as “Online Data”. In the context of Grab, the streaming data is usually materialised as Kafka topics (“Kafka Stream”) as the result of stream processing in its framework. This data is largely unexplored until they are eventually sunk into the Data Lake as Offline Data, part of the data journey (see Figure 1 below). This induces some data latency before the data can be used by data analysts to inform decisions.
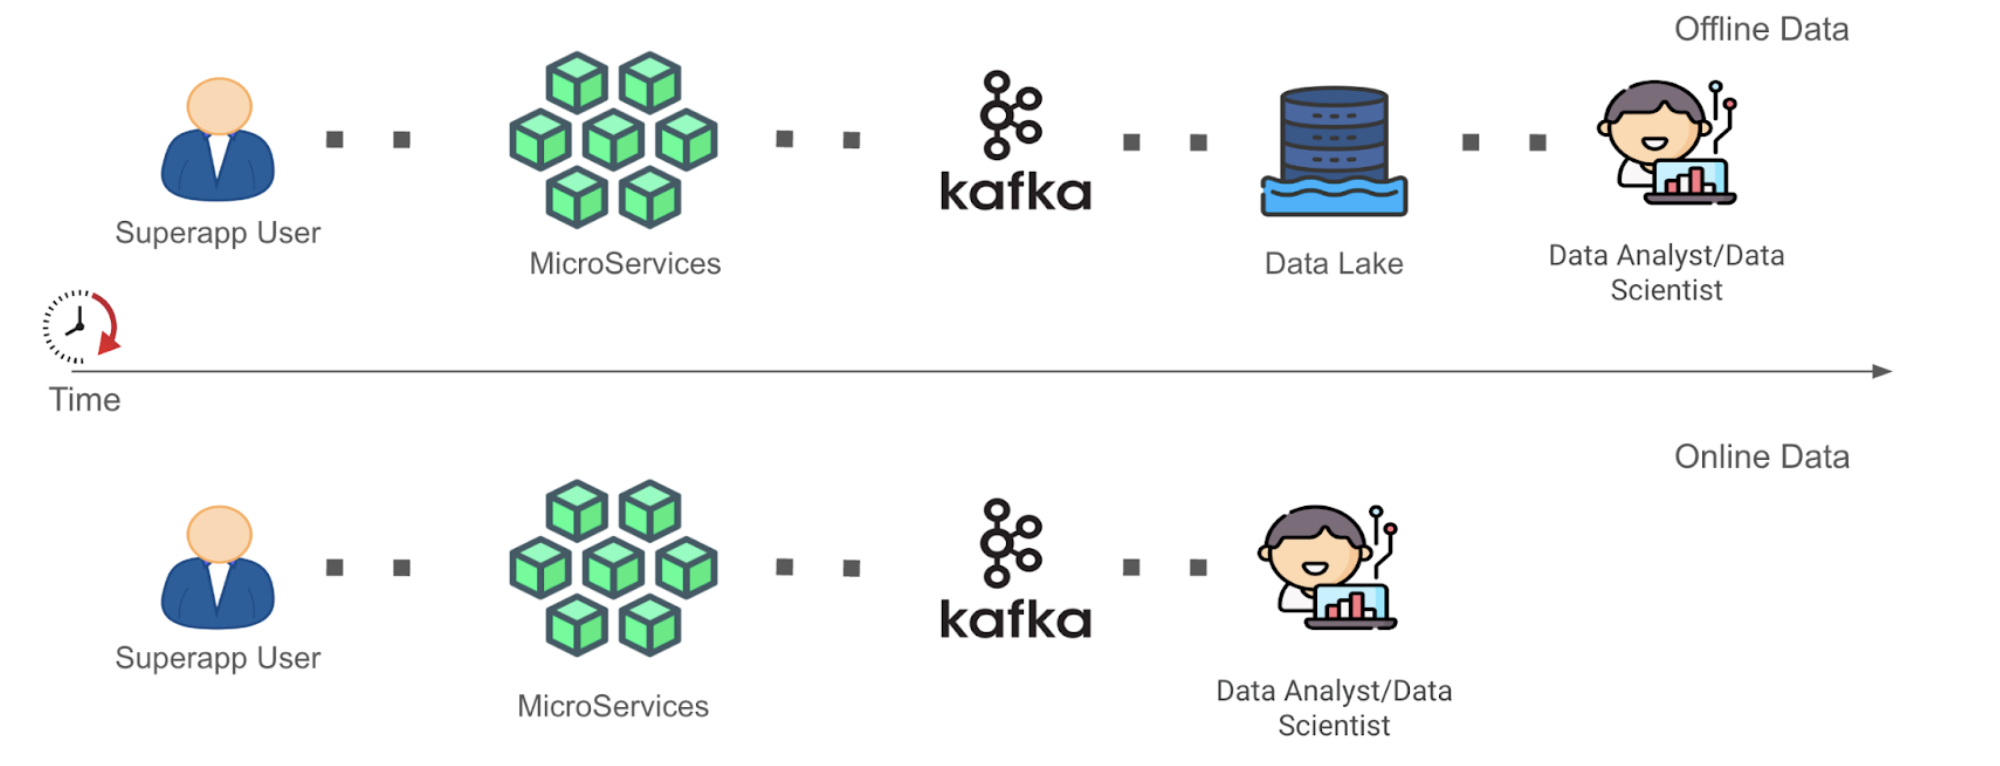
As seen in Figure 1 above, the Time to Value (“TTV”) of Online Data is shorter as compared to that of Offline Data in a simplified data journey from data generation to data analysis where complexities of data cleaning and transformation have been removed. This is because the role of the data analyst or data scientist (“Data End User”) has been enabled forward to the Kafka stage for Online Data instead of the Data Lake stage for Offline Data. We recognise that allowing earlier data exploration on Online Data allows Data End Users to build context around the data inputs they are using in an earlier stage. This can help them process Offline Data more meaningfully in subsequent stages. We are interested in opening up the possibility for Data End Users to at least explore the Online Data before they architect a full solution to clean and/or process the data directly or more efficiently post-ingestion into the Data Lake. After their data exploration, the users would have more information to decide whether to spin up a stream processing pipeline for Online Data, or to continue processing Offline Data with their current solution, but with a more refined understanding and logic strategy against their source data inputs. However, of course, in this blog, we acknowledge that not all analysis on Online Data could be done in this manner.
Problem statement
Online Data is underutilised within Grab mainly because of, among other reasons, difficulty in performing data exploration on data that is not yet properly stored in the Data Lake.
For the purpose of this blog post, we will focus only on the problem of exploration of Online Data because this problem is the precursor to allowing us to fully democratise such data.
The problem of data exploration manifests itself when Data End Users need to find the proper data inputs to base and develop their data models. These users would then often need to parse through a multitude of documentation and connect with multiple upstream data producers, to know the range of data signals that are currently available and understand what each data signal is trying to measure.
Given the ephemeral nature of Online Data, this implies that the lack of correct tool adoption to seamlessly perform quick tests with application logic on Online Data disincentivises the Data End Users to work on these Online Data. Testing such logic on Offline Data is generally much easier since iteration testing on the exact same dataset is possible.
This difficulty in performing data exploration including ad hoc queries on Online Data has therefore made development of stream processing applications hard for Data End Users, creating headwinds in Grab’s aim to evolve from making data-driven business decisions to also making data-driven operation decisions. Doing both would allow Grab to react much quicker to abrupt changes in its business landscape.
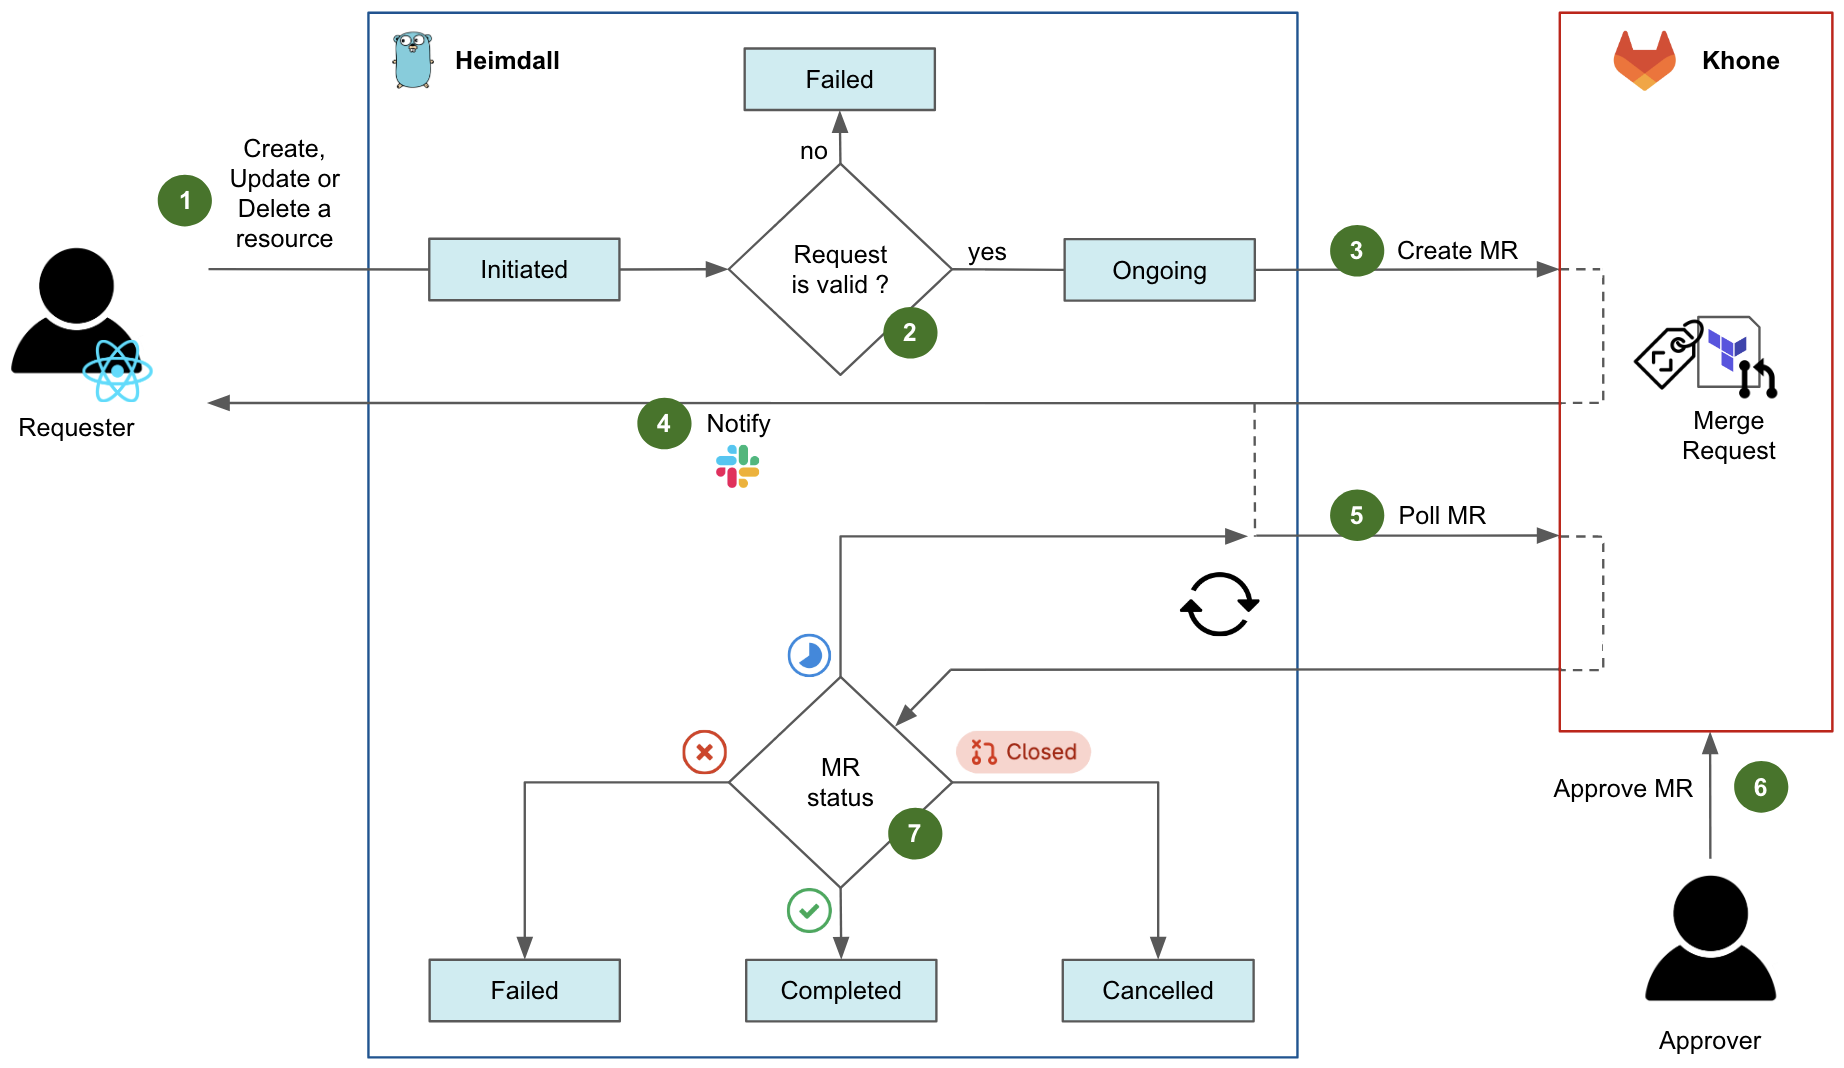
Adoption of Zeppelin notebook environment
To address the difficulty in performing data exploration on Online Data, we have adopted Apache Zeppelin, a web-based notebook that enables data-drive, interactive data analytics with the support of multiple interpreters to work with various data processing backends e.g. Spark, Flink. The full solution of the adopted Zeppelin notebook environment is enabled seamlessly within our internal data-streaming platform, through its control plane. If you are interested, you may check out our previous blog post titled An elegant platform for more details on the abovementioned streaming platform and its control plane.
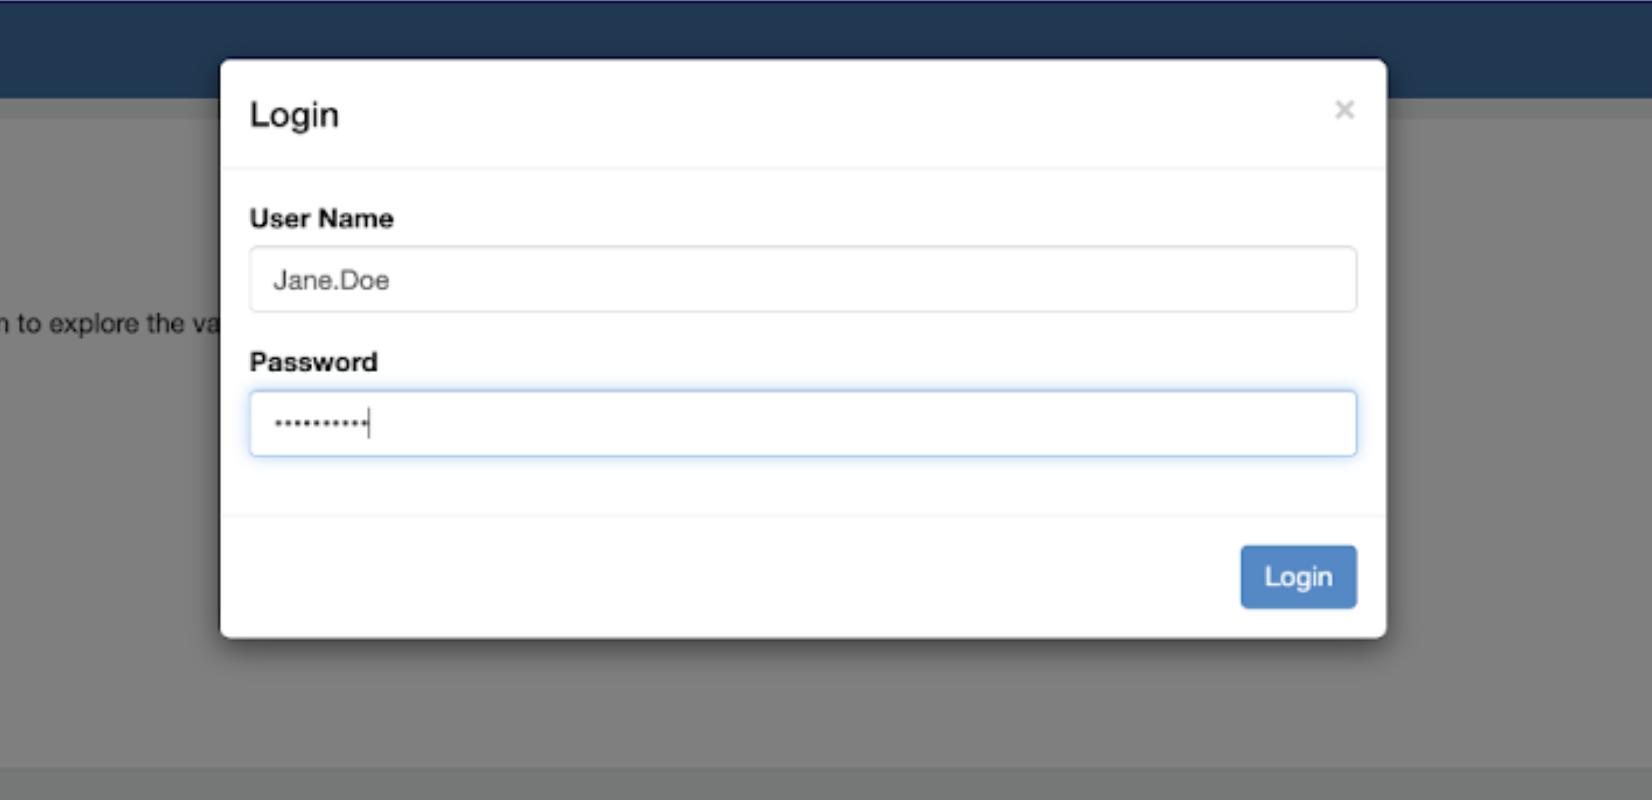
As seen from Figure 2 above, after successful creation of the Zeppelin cluster, users can log in with their generated credentials delivered to them via the integrated instant messenger, and start using the notebook environment.
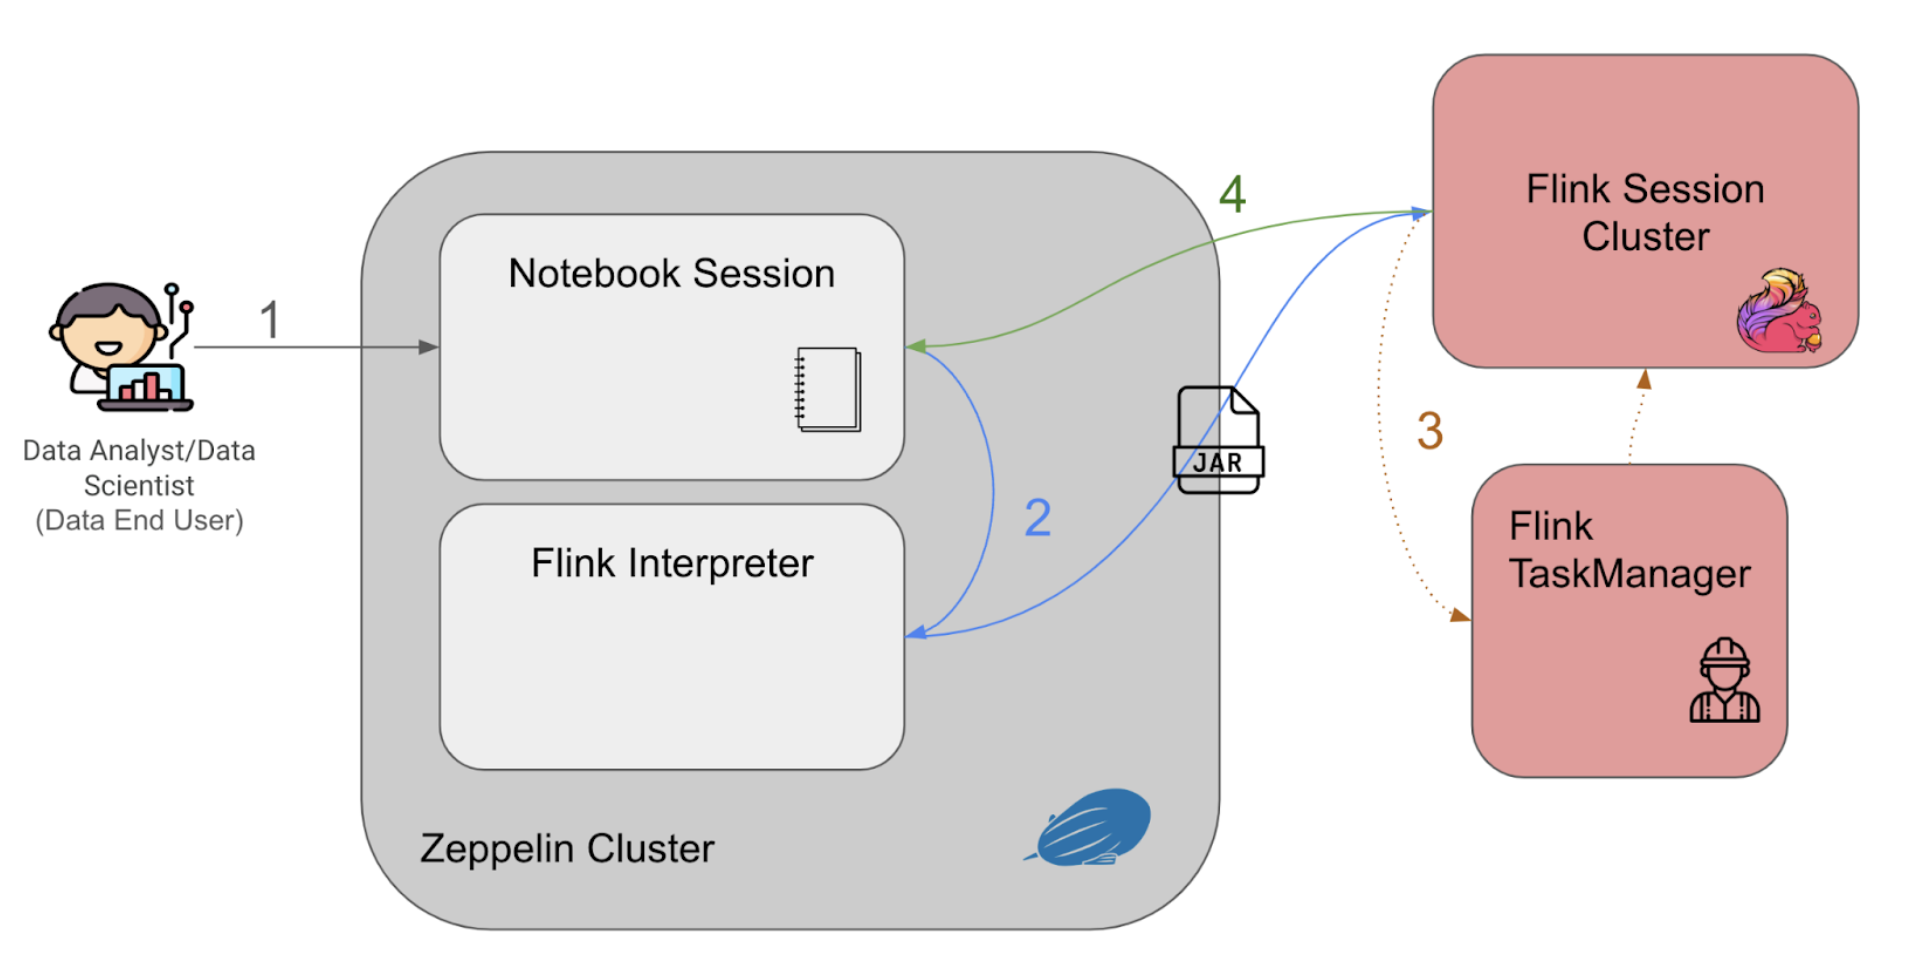
Figure 3 above explains the Zeppelin notebook programme flow as follows:
- The users enter their queries into the notebook session and run querying statements interactively with the established web-based notebook session.
- The queries are passed to the Flink interpreter within the cluster to generate the Flink job as a Jar file, to be then submitted to a Flink session cluster.
- When the Flink session cluster job manager receives the job, it would spin up the corresponding Flink task managers (workers) to run the application and retrieve the results.
- The query results would then be piped back to the notebook session, to be displayed back to the user on the notebook session.
Data query and visualisation
Note: All variable names, schema, values, and other details used in this article are only created for use as examples.
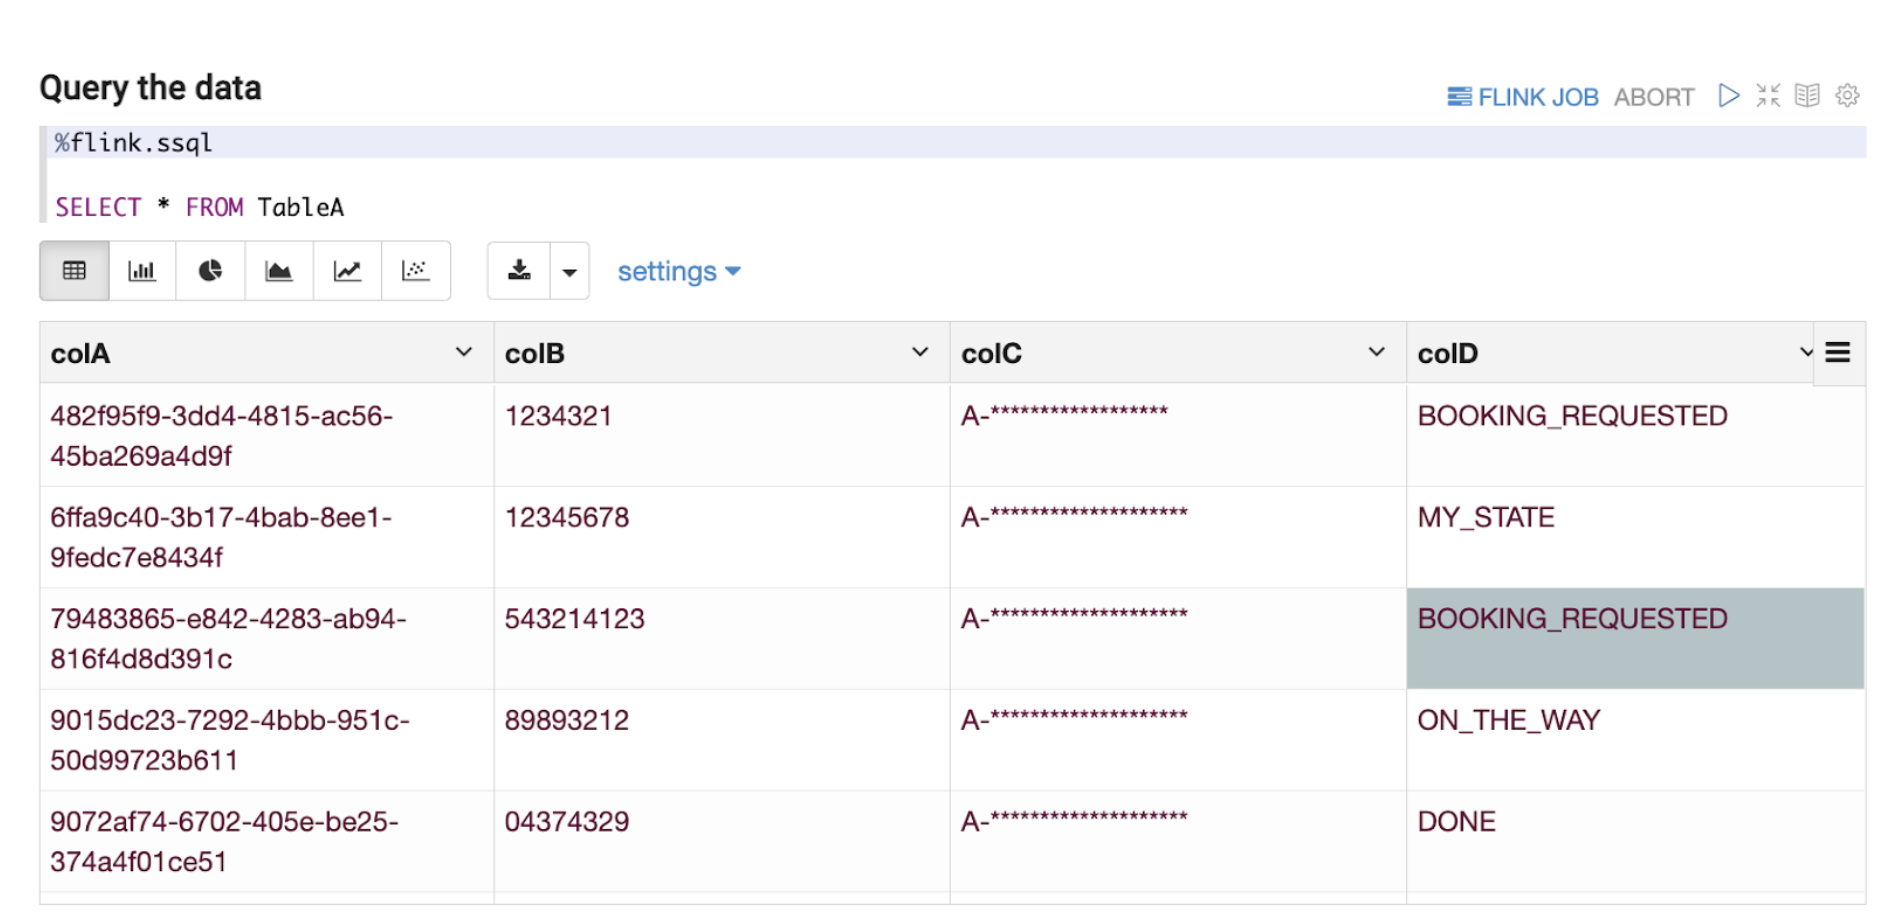
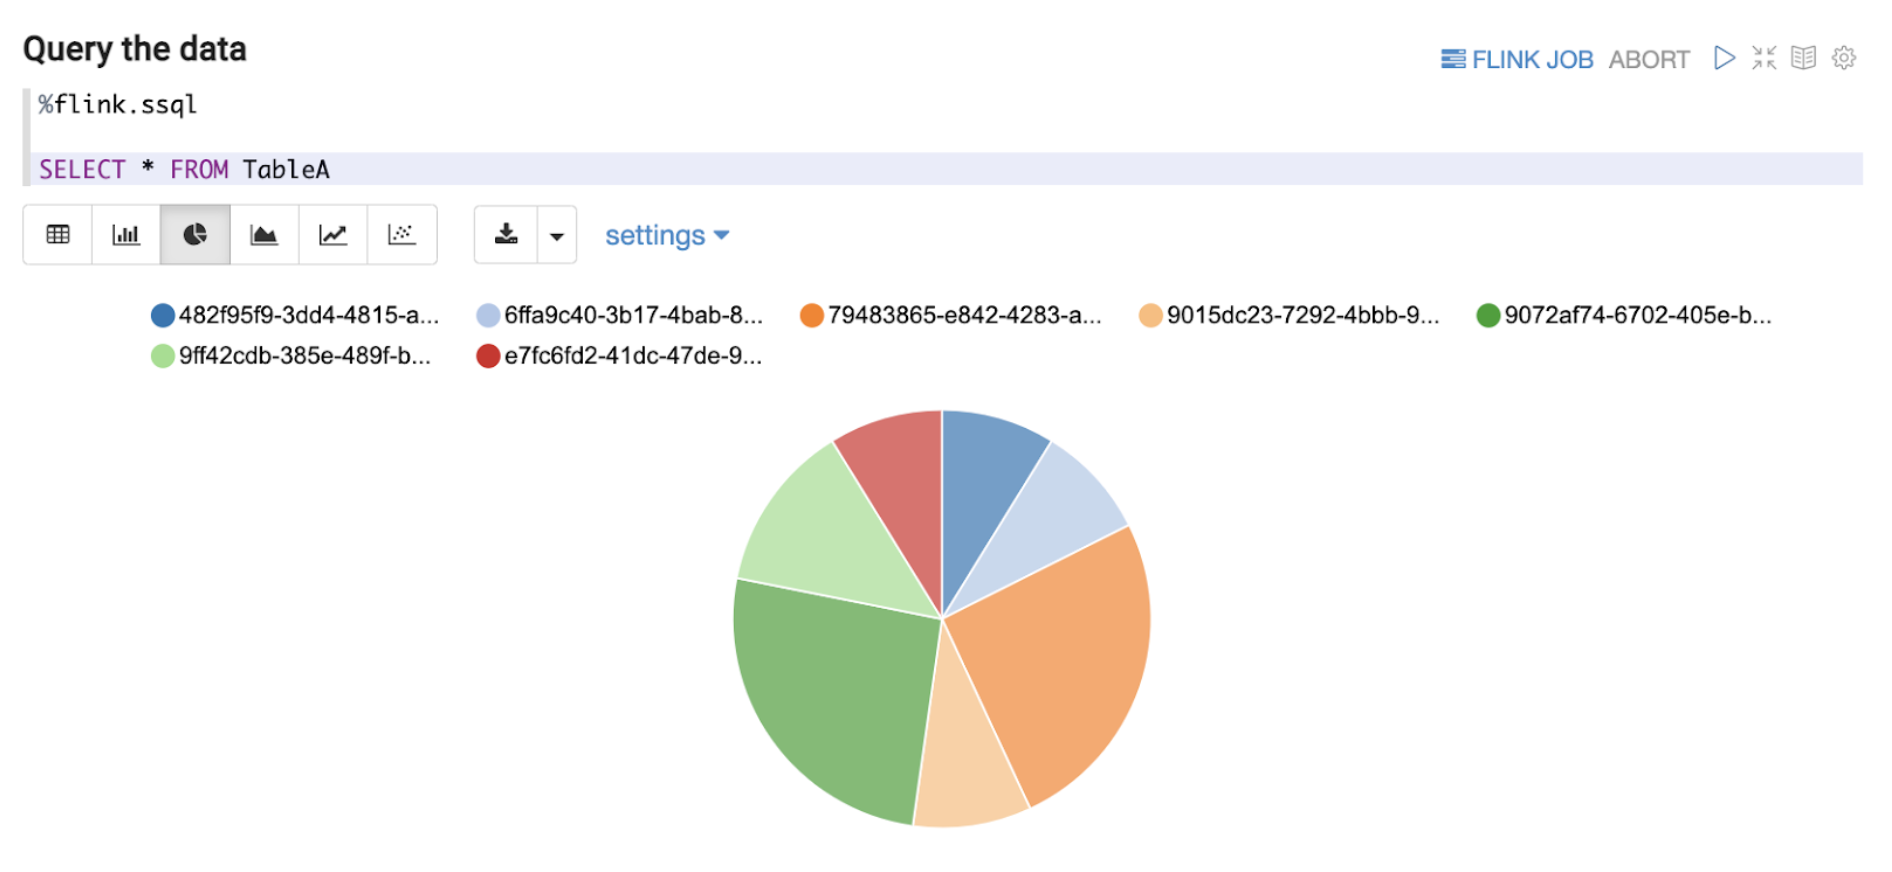
Flink has a planned roadmap to create a unified streaming language for both stream processing and data analytics. In line with the roadmap, we have based our Zeppelin solution on supporting Structured Query Language (“SQL”) as the query language of choice as seen in Figure 4 above. Data End Users can now write queries in SQL, which is a language that they are comfortable with, and perform adequate data exploration.
As discussed in this section, data exploration on streaming data at the Kafka stage by adopting the right tool enables Data End Users to seamlessly have visibility to quickly understand the current schema of a Kafka topic (explained more in the next section. This kind of data exploration also enables Data End Users to understand the type of data the Kafka topic represents, such as the ability to determine if a country code data field is in alpha-2 or alpha-3 format while the data is still part of streaming data. This might seem inconsequential and immediately identifiable even in Offline Data, but by enabling data exploration at an earlier stage in the data journey for Online Data, Data End Users have the opportunity to react much more quickly. For example, a change of expected country code format from the data producer would usually lead to errors in the downstream joins or other stream processing pipelines due to incompatible parsing or filtering of the modified country codes. Instead of waiting for the data to be ingested to Offline Data, users can investigate the issue with Online Data retrieved from Kafka.
Note: All variable names, schema, values, and other details used in this article are only created for use as examples.
Besides query features, Zeppelin notebook provides simple visualisation and analytics of the off-the-shelf data as presented above in Figure 5. Furthermore, users are now able to perform interactive ad hoc queries on Online Data. These queries will eventually become much more advanced and/or effective SQL queries to be deployed as a streaming pipeline later on in the data journey. This reduces the inertia in setting up a separate development environment or learning other programming languages like Java or Scala during the development of streaming pipelines. With Zeppelin’s notebook environment, our Data End Users are more empowered to quickly derive value from Online Data.
Need for a more dynamic table schema derivation process
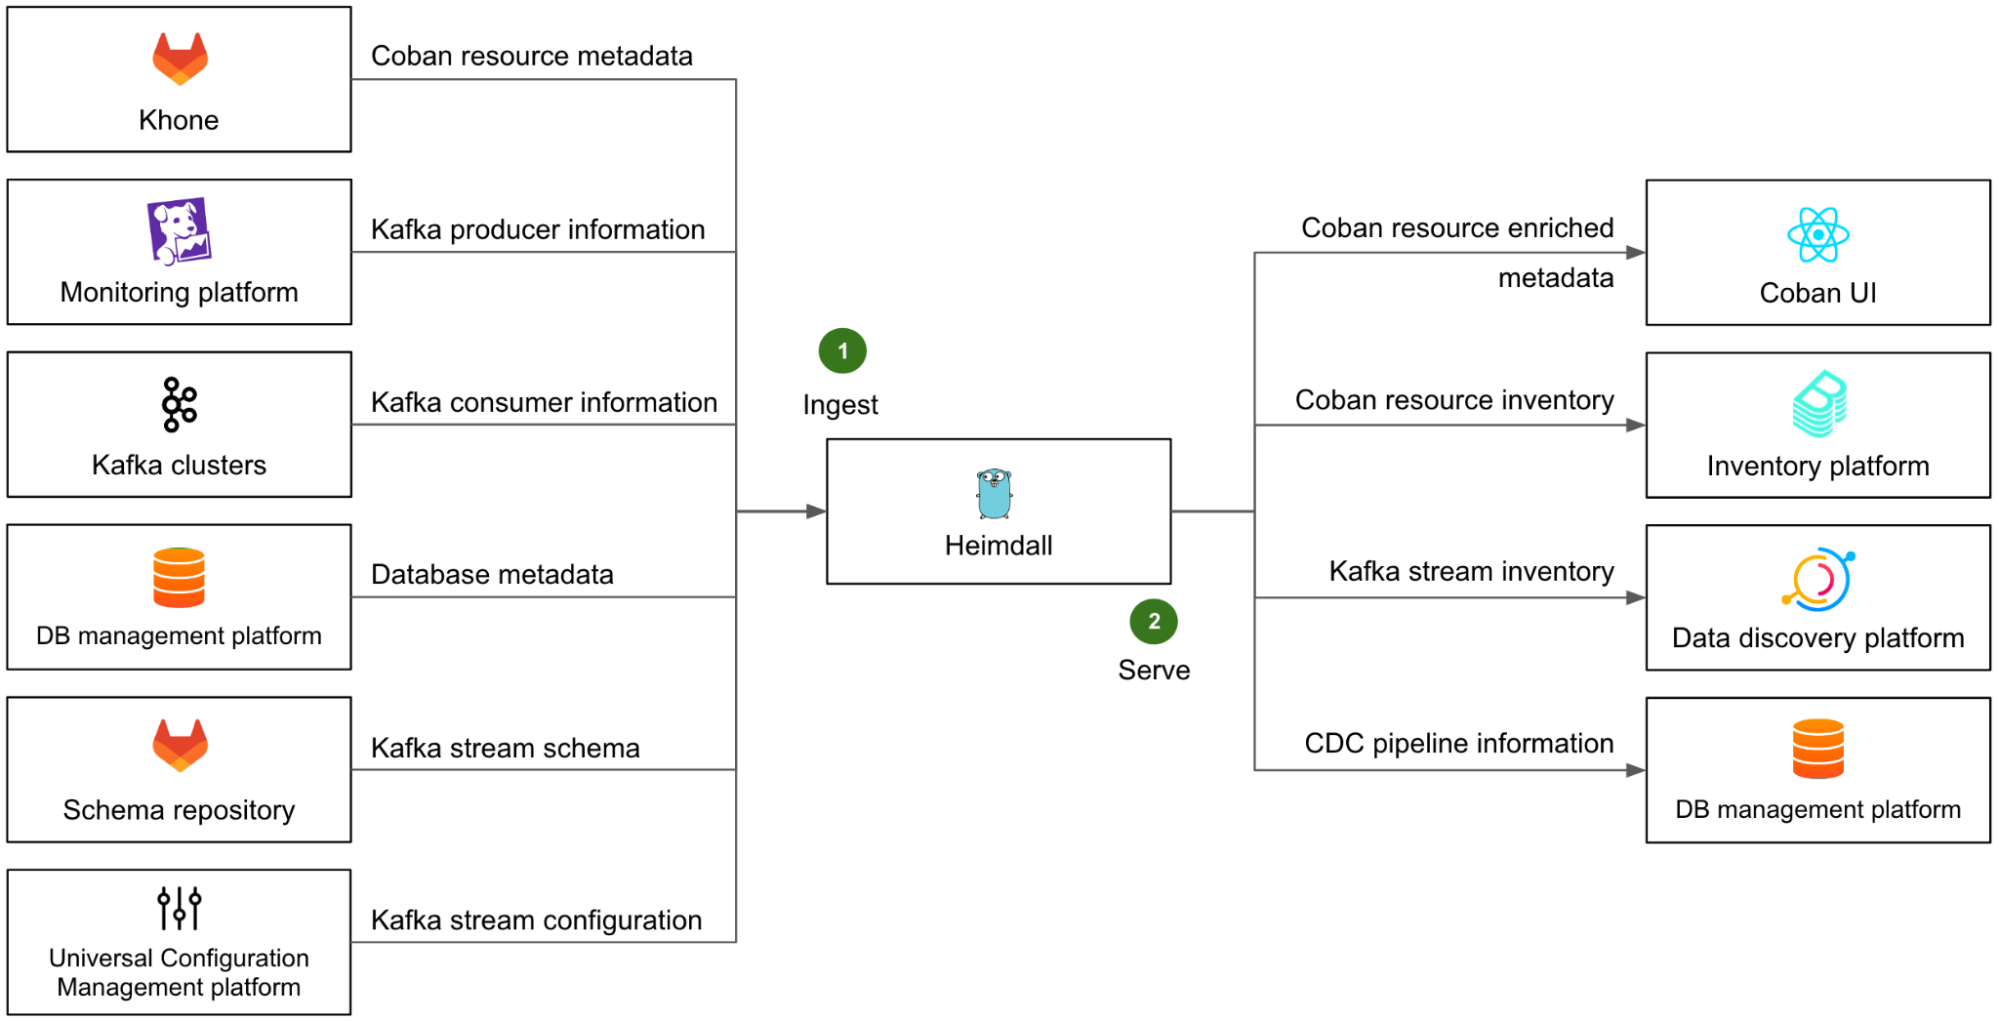
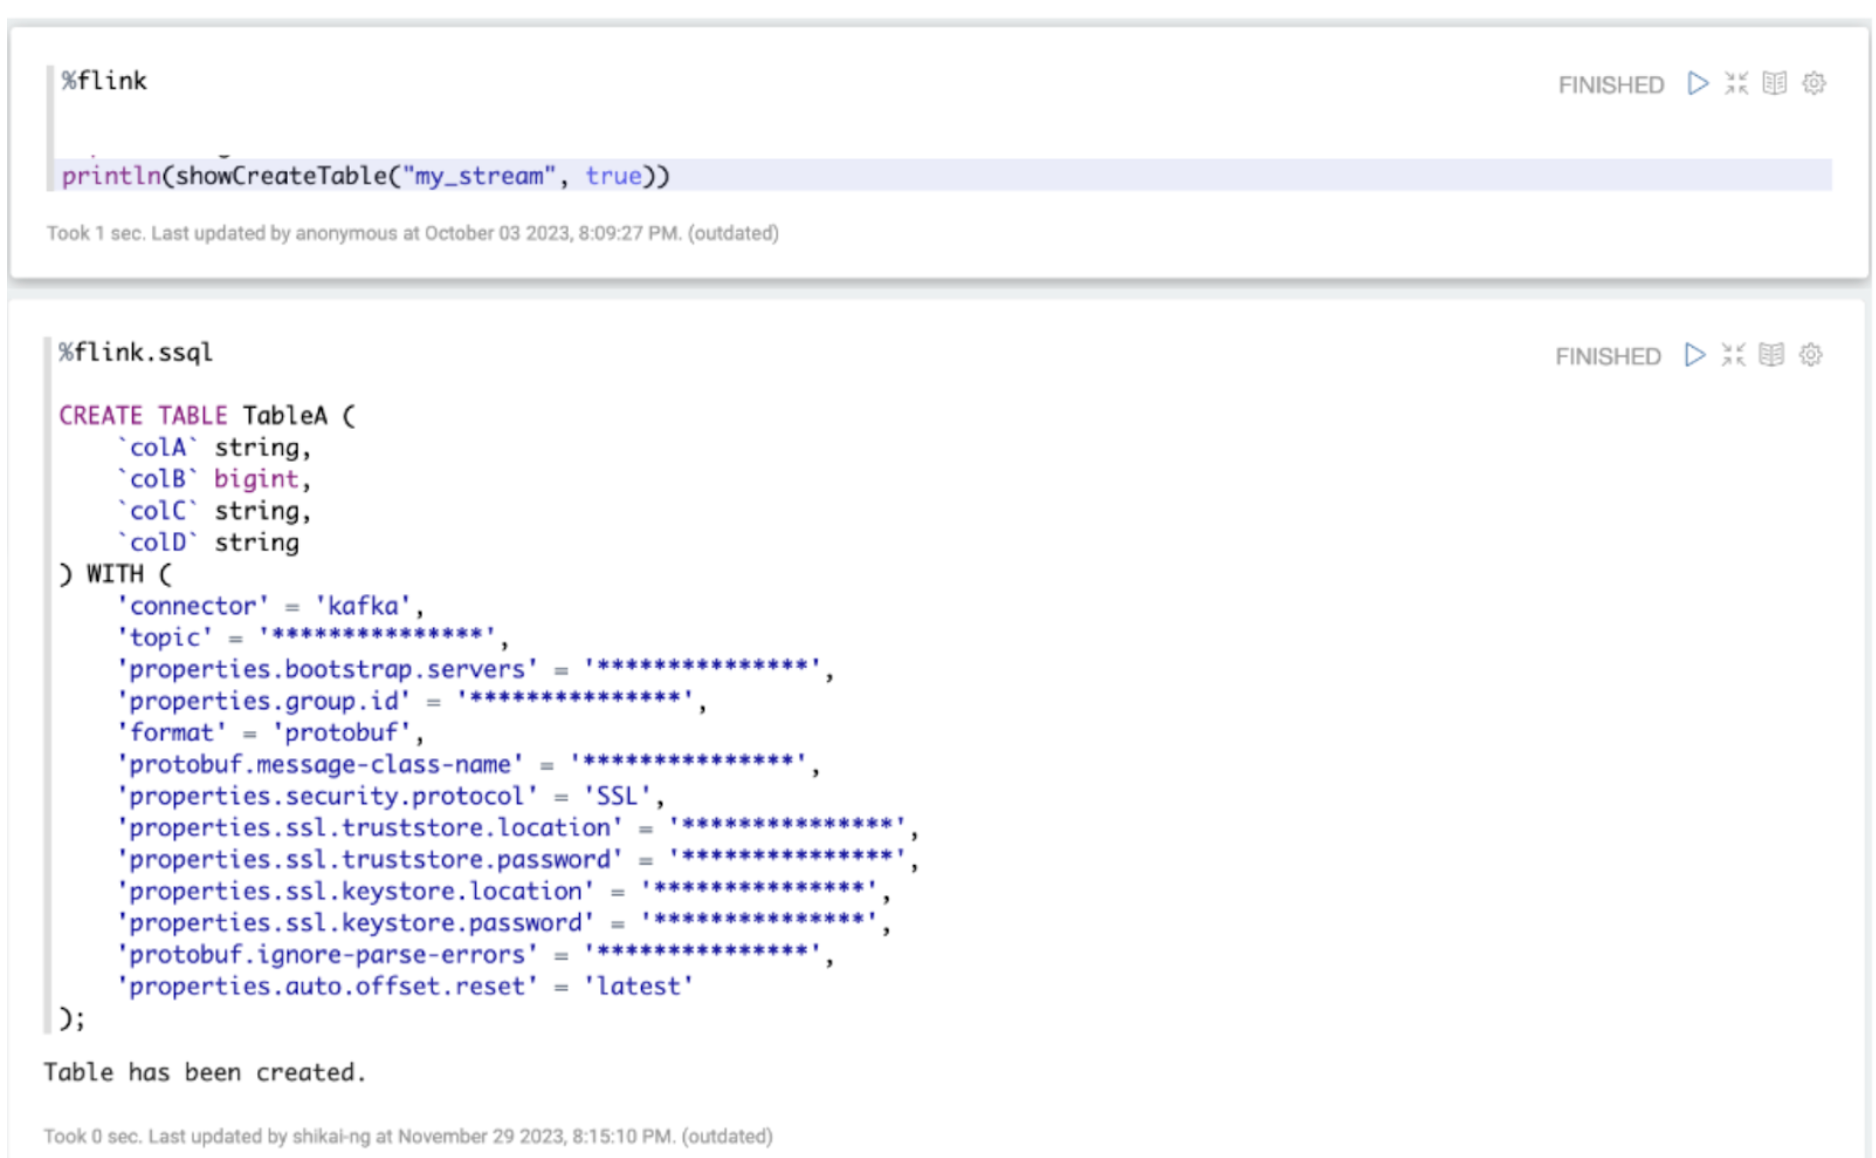
For the Data End Users performing data exploration on Online Data, we see a need for these users to derive the Data Definition Language (“DDL”) associated with a Kafka stream at an earlier stage of the data journey. Within Grab, even though Kafka streams are transmitted in Protobuf format and are thus structured, both the schema and the corresponding DDL changes are added over time as new fields. Typically, the data producer (service owners) and the data engineers responsible for the data ingestion pipeline coordinate to perform such updates. Since the Data End Users are not involved in such schema update processes nor do they directly interact with the data producers, many of them find the discovery of changes in the current Kafka stream schema an issue. Granted that this is an issue our metadata platform is actively solving using Datahub, we hope to also solve the challenge by being able to derive the DDL more dynamically within the tooling, for data exploration on Online Data to reduce friction.
Note: All variable names, schema, values, and other details used in this article are only created for use as examples.
As seen from Figure 6 above, we have an integrated tooling for Data End Users to derive the DDL associated with a Kafka stream using SQL language. A Kafka stream in Grab’s context is a logical concept describing a Kafka topic, associating it with its metadata like Kafka bootstrap servers and associated Java class created by Protoc. This tool maps the Protobuf schema definition of a Kafka stream to a DDL, allowing it to be expressed and used in SQL language. This reduces the manual effort involved in creating these table definitions from scratch based on the associated Protobuf schema. Users can now derive the DDL associated with a Kafka stream more easily.
Mitigating risks arising from data exploration on Online Data – data access authorisation/audit
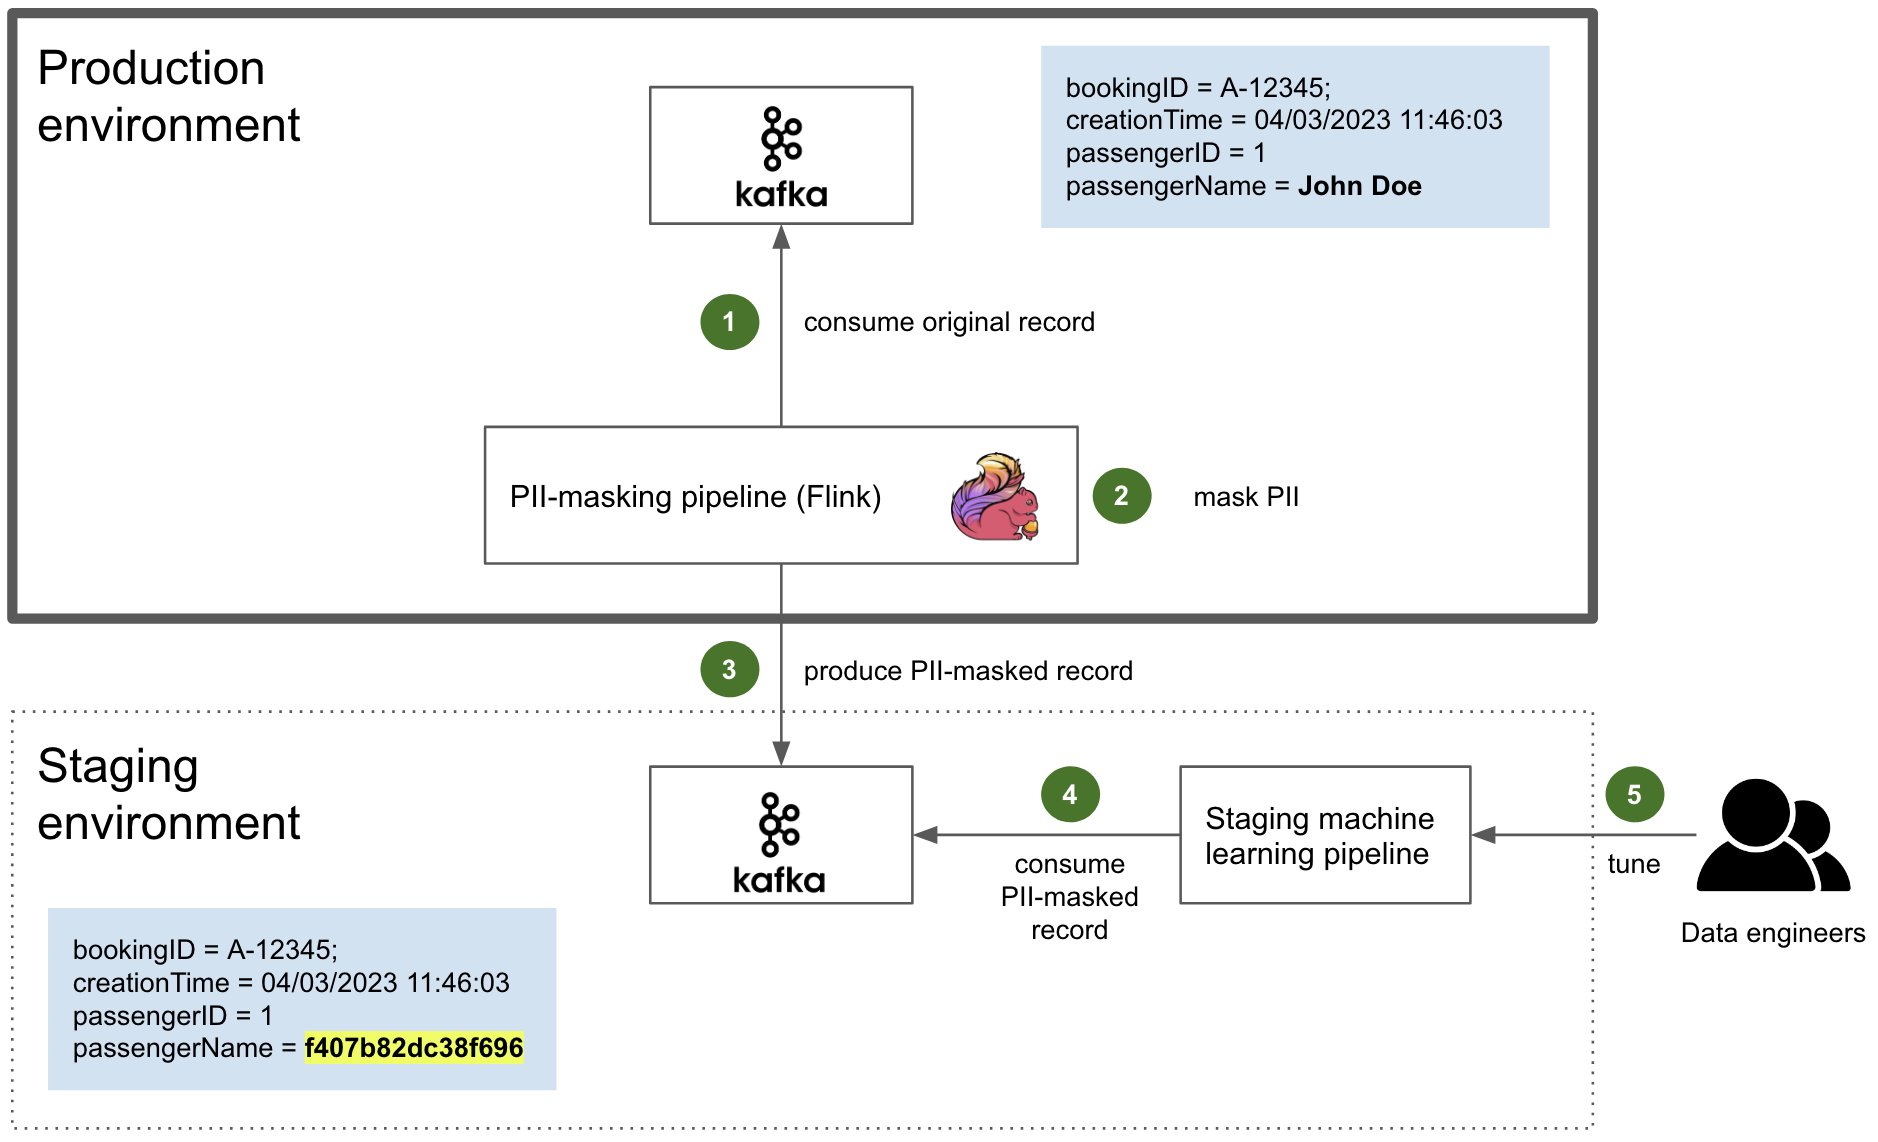
While we rethink stream processing and are open to options that enable data exploration on Online Data as mentioned above, we realised that new security requirements related to data access authorisation and maintaining proper audit trail have emerged. Even with Personally Identifiable Information (PII) obfuscation enforcement by our streaming pipeline, it means we need to implement stricter guardrails in place along with audit trails to ensure users only have access to what they are allowed to, and this access can be removed in a break-glass scenario. If you are interested, you may check out our previous blog post titled PII masking for privacy-grade machine learning for more details about how we enforce PII masking on machine learning data streaming pipelines.
To enable data access authorisation, we utilised Strimzi, the operator of running Kafka on Kubernetes. We integrated Strimzi’s Open Policy Agent (OPA) with Kafka to define policies that authorise specific read-only user access to specific Kafka Topics. The identification of users is done via mutualTLS (mTLS) connection with our Kafka clusters, where their user details are part of the SSL certificate details used for authentication.
With these tools in place, each user’s request to explore Online Data would be properly logged, and each data access can be controlled by an OPA policy managed by a central team.
If you are interested, you may check out our previous post Zero trust with Kafka where we discussed our efforts to continue strengthening the security of our data-streaming platform.
Impact
With the proliferation of our data-streaming platform, we expect to see improvements in the way our data becomes gradually democratised. We have already been receiving use cases from the Data End Users who are interested in validating a chain of events on Online Data, i.e. retrieving information of all events associated with a particular booking, which is not currently something that can be done easily.
More importantly, the tools in place for data exploration on Online Data form the foundation required for us to embark on our next step of the stream processing journey. This foundation makes the development and validation of the stream processing logic much quicker. This occurs when ad hoc queries in a notebook environment are possible, removing the need for local developer environment setups and the need to go through the whole pipeline deployment process for eventual validation of the developed logic. We believe that this would prove to reduce our lead time in creating stream processing pipelines significantly.
What’s next?
Our next step is to rethink further how our stream processing pipelines are defined and start to provision SQL as the unified streaming language of our pipelines. This helps facilitate better discussion between upstream data producers, data engineers, and Data End Users, since SQL is the common language among these stakeholders.
We will also explore handling schema discovery in a more controlled manner by utilising a Hive catalogue to store our Kafka table definitions. This removes the need for users to retrieve and run the table DDL statement for every session, making the data exploration experience even more seamless.
References
[2] An elegant platform | Grab engineering blog.
[3] Apache Flink | Roadmap on Unified SQL Platform.
[4] ISO | ISO 3166 Country Codes.
[7] Protoc | Protocol buffer compiler installation.
[8] PII masking for privacy-grade machine learning | Grab engineering blog.
[9] Zero trust with Kafka | Grab engineering blog.
[10] Open Policy Agent (OPA) | Policy-based control for cloud native environments.
[11] Strimzi | Using Open Policy Agent with Strimzi and Apache Kafka.
[12] Confluent Documentation | Configure mTLS authentication and RBAC for kafka brokers.
Join us
Grab is the leading superapp platform in Southeast Asia, providing everyday services that matter to consumers. More than just a ride-hailing and food delivery app, Grab offers a wide range of on-demand services in the region, including mobility, food, package and grocery delivery services, mobile payments, and financial services across 428 cities in eight countries.
Powered by technology and driven by heart, our mission is to drive Southeast Asia forward by creating economic empowerment for everyone. If this mission speaks to you, join our team today!