Избори 2022: предварителен списък на секциите в чужбина

Post Syndicated from original https://yurukov.net/blog/2022/ns2022-avtomatichni-sekcii/

В полунощ беше публикувано решението на ЦИК за автоматично отваряне на секции в чужбина на база активността от предходни избори. Изброени са 734 секции, но това няма да е окончателният списък. Дали на тези места ще има секции въобще зависи не само от това дали чуждестранните власти разрешат, но най-вече дали местната българска организация намери място и събере доброволци за комисията и организацията.

Малко се е променило в последните три десетилетия и българската диаспора все още изнася цялата информационна кампания и голяма част от организацията на изборите на свой гръб и за своя сметка. Докато немалко секции се създават в консулства и посолства по подразбиране, огромна част от тях имат много малко гласоподаватели, защото са дипломатически мисии далеч от диаспорите ни.

Затова е важно подаването на заявления за гласуване в чужбина. Благодарение на усилията за промяна на Изборния кодекс след падането на кабинета на ГЕРБ, вече се отварят автоматично секции на база активност от предходни избори. Това означава, че не се налага да се борим за всяка отделна секция и конкретна бройка. Помага и при страни като Германия, където разрешение за секциите следва да се иска преди да завърши кампанията по събиране на заявления, т.е. да се знае къде българите искаме да гласуваме.

Все пак заявленията са важни, за да се отварят допълнителни секции например там, където на на одобреното място, село или град, не е възможно най-вече по логистични причини. Също така ускорява гласуването, тъй като името ви вече ще присъства в избирателните списъци и не се налага да се вписва всичко наново. Не на последно място е лакмус за активността на българите в чужбина, макар честите промени на условията за отваряне на секции да правят сравнението между различни кампании безпредметно.

Очакваме електронният формуляр за заявление за гласуване да бъде пуснат още утре на страницата на ЦИК. Веднага след това ще започна да събирам данните в Glasuvam.org, както правя в последните 10 години. Данните от предишната кампания ще намерите тук като карта и като таблица.

The post Избори 2022: предварителен списък на секциите в чужбина first appeared on Блогът на Юруков.

Friday Squid Blogging: SQUID Acronym for Making Conscious Choices

Post Syndicated from Bruce Schneier original https://www.schneier.com/blog/archives/2022/08/friday-squid-blogging-squid-acronym-for-making-conscious-choices.html

I think the U is forced:

SQUID consists of five steps: Stop, Question, Understand, Imagine, and Decide.

As usual, you can also use this squid post to talk about the security stories in the news that I haven’t covered.

Read my blog posting guidelines here.

Metasploit Weekly Wrap-Up

Post Syndicated from Jeffrey Martin original https://blog.rapid7.com/2022/08/12/metasploit-weekly-wrap-up-171/

Putting in the work!

Metasploit Weekly Wrap-Up

This week we’re extra grateful for the fantastic contributions our community makes to Metasploit. The Metasploit team landed more than 5 PRs each from Ron Bowes and bcoles, adding some great new capabilities.

Ron Bowes contributed four new modules targeting UnRAR, Zimbra, and ManageEngine ADAudit Plus. These modules offer Metasploit users some excellent new vectors to leverage against targets.

Contributions from bcoles offer improvements to various session interactions to make gathering data on targets more robust and consistent.

Have you seen Cassandra?

Are you using tools to visualize your data? If you are using cassandra-web, a tool made specifically to help you "see" what Cassandra holds, there are new toys for attackers to use to access much more. The new module from krastanoel targets cassandra-web <= 0.5.0 with a directory traversal to read lots of those sensitive details off the target.

New module content (6)

  • Cassandra Web File Read Vulnerability by Jeremy Brown and krastanoel – This module exploits an unauthenticated directory traversal vulnerability in Cassandra Web version 0.5.0 and earlier, allowing arbitrary file read with the web server privileges.
  • UnRAR Path Traversal (CVE-2022-30333) by Ron Bowes and Simon Scannell, which exploits CVE-2022-30333 – This adds two modules for CVE-2022-30333, a symlink-based path traversal vulnerability in unRAR 6.11 and earlier (open-source version 6.1.6 and earlier). The first module creates a .rar with an arbitrary payload that will be extracted to an arbitrary location. The other one specifically targets Zimbra versions 9.0.0 Patch 24 (and earlier) and 8.8.15 Patch 31 (and earlier). These versions use unRAR to scan incoming email and arbitrary command execution is possible if the installed UnRAR on the OS is vulnerable to the same symlink-based path traversal vulnerability. This module generates the .rar file that will need to be emailed to the vulnerable Zimbra server to trigger the payload.
  • Webmin Package Updates RCE by Christophe De La Fuente and Emir Polat, which exploits CVE-2022-36446 – This module exploits an arbitrary command injection in Webmin versions prior to 1.997.
  • UnRAR Path Traversal in Zimbra (CVE-2022-30333) by Ron Bowes and Simon Scannell, which exploits CVE-2022-30333 – This adds two modules for CVE-2022-30333, a symlink-based path traversal vulnerability in unRAR 6.11 and earlier (open source version 6.1.6 and earlier). The first module creates a .rar with an arbitrary payload that will be extracted to an arbitrary location. The other one specifically targets Zimbra versions 9.0.0 Patch 24 (and earlier) and 8.8.15 Patch 31 (and earlier). These versions use unRAR to scan incoming email and arbitrary command execution is possible if the installed UnRAR on the OS is vulnerable to the same symlink-based path traversal vulnerability. This module generates the .rar file that will need to be emailed to the vulnerable Zimbra server to trigger the payload.
  • Zimbra zmslapd arbitrary module load by Darren Martyn and Ron Bowes, which exploits CVE-2022-37393 – This PR adds a local exploit for Zimbra to go from the zimbra user to root by using a sudo-able executable that can load an arbitrary .so file.
  • ManageEngine ADAudit Plus CVE-2022-28219 by Naveen Sunkavally and Ron Bowes, which exploits CVE-2022-28219 – This adds a module that leverages a Java deserialization, directory traversal, and a blind XXE injection vulnerability to gain unauthenticated code execution again vulnerable versions of ManageEngine ADAudit Plus.

Enhancements and features (6)

  • #16800 from adfoster-r7 – This adds support for OpenSSL 3 compatibility with legacy ciphers.
  • #16841 from bcoles – This updates the post/windows/gather/enum_powershell_env module with a code cleanup and expands the module to support non-Meterpreter session types such as shell sessions and PowerShell sessions.
  • #16873 from bcoles – This PR cleans up enum_artifacts, adds documentation, error handling, YAML file parsing, and support for non-meterpreter sessions.
  • #16875 from bcoles – This PR removes the Remove enum_putty Meterpreter script in favor for the existing post module.
  • #16876 from bcoles – Removed the enum_logged_on_users Meterpreter script in favor for the existing post module
  • #16878 from bcoles – Adds partial support for non-Meterpreter sessions for the enum_logged_on_users post module as well as makes use of the read_profile_list method. Resolves Rubocop and msftidy_docs violations.

Bugs fixed (1)

  • #16872 from bcoles – This PR fixes shell_registry_getvalinfo which was truncating registry values at the first space and normalize_key which was causing a crash when only a hive name was passed to the function when running on a shell session.

Get it

As always, you can update to the latest Metasploit Framework with msfupdate
and you can get more details on the changes since the last blog post from
GitHub:

If you are a git user, you can clone the Metasploit Framework repo (master branch) for the latest.
To install fresh without using git, you can use the open-source-only Nightly Installers or the
binary installers (which also include the commercial edition).

Amazon EMR on EKS gets up to 19% performance boost running on AWS Graviton3 Processors vs. Graviton2

Post Syndicated from Melody Yang original https://aws.amazon.com/blogs/big-data/amazon-emr-on-eks-gets-up-to-19-performance-boost-running-on-aws-graviton3-processors-vs-graviton2/

Amazon EMR on EKS is a deployment option that enables you to run Spark workloads on Amazon Elastic Kubernetes Service (Amazon EKS) easily. It allows you to innovate faster with the latest Apache Spark on Kubernetes architecture while benefiting from the performance-optimized Spark runtime powered by Amazon EMR. This deployment option elects Amazon EKS as its underlying compute to orchestrate containerized Spark applications with better price performance.

AWS continually innovates to provide choice and better price-performance for our customers, and the third-generation Graviton processor is the next step in the journey. Amazon EMR on EKS now supports Amazon Elastic Compute Cloud (Amazon EC2) C7g—the latest AWS Graviton3 instance family. On a single EKS cluster, we measured EMR runtime for Apache Spark performance by comparing C7g with C6g families across selected instance sizes of 4XL, 8XL and 12XL. We are excited to observe a maximum 19% performance gain over the 6th generation C6g Graviton2 instances, which leads to a 15% cost reduction.

In this post, we discuss the performance test results that we observed while running the same EMR Spark runtime on different Graviton-based EC2 instance types.

For some use cases, such as the benchmark test, running a data pipeline that requires a mix of CPU types for the granular-level cost efficiency, or migrating an existing application from Intel to Graviton-based instances, we usually spin up different clusters that host separate types of processors, such as x86_64 vs. arm64. However, Amazon EMR on EKS has made it easier. In this post, we also provide guidance on running Spark with multiple CPU architectures in a common EKS cluster, so that we can save significant time and effort on setting up a separate cluster to isolate the workloads.

Infrastructure innovation

AWS Graviton3 is the latest generation of AWS-designed Arm-based processors, and C7g is the first Graviton3 instance in AWS. The C family is designed for compute-intensive workloads, including batch processing, distributed analytics, data transformations, log analysis, and more. Additionally, C7g instances are the first in the cloud to feature DDR5 memory, which provides 50% higher memory bandwidth compared to DDR4 memory, to enable high-speed access to data in memory. All these innovations are well-suited for big data workloads, especially the in-memory processing framework Apache Spark.

The following table summarizes the technical specifications for the tested instance types:

Instance Name vCPUs Memory (GiB) EBS-Optimized Bandwidth (Gbps) Network Bandwidth (Gbps) On-Demand Hourly Rate
c6g.4xlarge 16 32 4.75 Up to 10 $0.544
c7g.4xlarge 16 32 Up to 10 Up to 15 $0.58
c6g.8xlarge 32 64 9 12 $1.088
c7g.8xlarge 32 64 10 15 $1.16
c6g.12xlarge 48 96 13.5 20 $1.632
c7g.12xlarge 48 96 15 22.5 $1.74

These instances are all built on AWS Nitro System, a collection of AWS-designed hardware and software innovations. The Nitro System offloads the CPU virtualization, storage, and networking functions to dedicated hardware and software, delivering performance that is nearly indistinguishable from bare metal. Especially, C7g instances have included support for Elastic Fabric Adapter (EFA), which becomes the standard on this instance family. It allows our applications to communicate directly with network interface cards providing lower and more consistent latency. Additionally, these are all Amazon EBS-optimized instances, and C7g provides higher dedicated bandwidth for EBS volumes, which can result in better I/O performance contributing to quicker read/write operations in Spark.

Performance test results

To quantify performance, we ran TPC-DS benchmark queries for Spark with a 3TB scale. These queries are derived from TPC-DS standard SQL scripts, and the test results are not comparable to other published TPC-DS benchmark outcomes. Apart from the benchmark standards, a single Amazon EMR 6.6 Spark runtime (compatible with Apache Spark version 3.2.0) was used as the data processing engine across six different managed node groups on an EKS cluster: C6g_4, C7g_4,C6g_8, C7g_8, C6g_12, C7g_12. These groups are named after instance type to distinguish the underlying compute resources. Each group can automatically scale between 1 and 30 nodes within its corresponding instance type. Architecting the EKS cluster in such a way, we can run and compare our experiments in parallel, each of which is hosted in a single node group, i.e., an isolated compute environment on a common EKS cluster. It also makes it possible to run an application with multiple CPU architectures on the single cluster. Check out the sample EKS cluster configuration and benchmark job examples for more details.

We measure the Graviton performance and cost improvements using two calculations: total query runtime and geometric mean of the total runtime. The following table shows the results for equivalent sized C6g and C7g instances and the same Spark configurations.

Benchmark Attributes 12 XL 8 XL 4 XL
Task parallelism (spark.executor.core*spark.executor.instances) 188 cores (4*47) 188 cores (4*47) 188 cores (4*47)
spark.executor.memory 6 GB 6 GB 6 GB
Number of EC2 instances 5 7 16
EBS volume 4 * 128 GB io1 disk 4 * 128 GB io1 disk 4 * 128 GB io1 disk
Provisioned IOPS per volume 6400 6400 6400
Total query runtime on C6g (sec) 2099 2098 2042
Total query runtime on C7g (sec) 1728 1738 1660
Total run time improvement with C7g 18% 17% 19%
Geometric mean query time on C6g (sec) 9.74 9.88 9.77
Geometric mean query time on C7g (sec) 8.40 8.32 8.08
Geometric mean improvement with C7g 13.8% 15.8% 17.3%
EMR on EKS memory usage cost on C6g (per run) $0.28 $0.28 $0.28
EMR on EKS vCPU usage cost on C6g (per run) $1.26 $1.25 $1.24
Total cost per benchmark run on C6g (EC2 + EKS cluster + EMR price) $6.36 $6.02 $6.52
EMR on EKS memory usage cost on C7g (per run) $0.23 $0.23 $0.22
EMR on EKS vCPU usage cost on C7g (per run) $1.04 $1.03 $0.99
Total cost per benchmark run on C7g (EC2 + EKS cluster + EMR price) $5.49 $5.23 $5.54
Estimated cost reduction with C7g 13.7% 13.2% 15%

The total number of cores and memory are identical across all benchmarked instances, and four provisioned IOPS SSD disks were attached to each EBS-optimized instance for the optimal disk I/O performance. To allow for comparison, these configurations were intentionally chosen to match with settings in other EMR on EKS benchmarks. Check out the previous benchmark blog post Amazon EMR on Amazon EKS provides up to 61% lower costs and up to 68% performance improvement for Spark workloads for C5 instances based on x86_64 Intel CPU.

The table indicates C7g instances have consistent performance improvement compared to equivalent C6g Graviton2 instances. Our test results showed 17–19% improvement in total query runtime for selected instance sizes, and 13.8–17.3% improvement in geometric mean. On cost, we observed 13.2–15% cost reduction on C7g performance tests compared to C6g while running the 104 TPC-DS benchmark queries.

Data shuffle in a Spark workload

Generally, big data frameworks schedule computation tasks for different nodes in parallel to achieve optimal performance. To proceed with its computation, a node must have the results of computations from upstream. This requires moving intermediate data from multiple servers to the nodes where data is required, which is termed as shuffling data. In many Spark workloads, data shuffle is an inevitable operation, so it plays an important role in performance assessments. This operation may involve a high rate of disk I/O, network data transmission, and could burn a significant amount of CPU cycles.

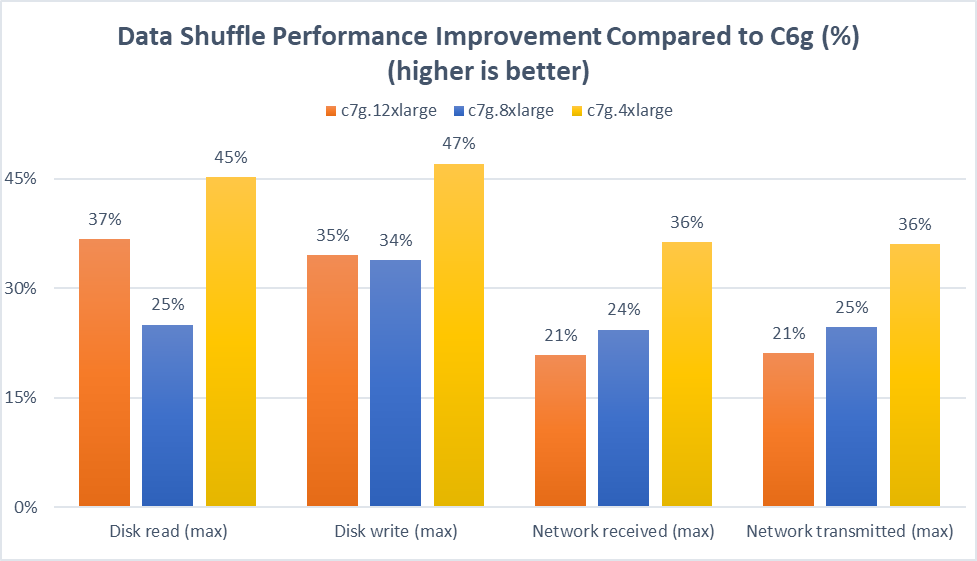
If your workload is I/O bound or bottlenecked by current data shuffle performance, one recommendation is to benchmark on improved hardware. Overall, C7g offers better EBS and network bandwidth compared to equivalent C6g instance types, which may help you optimize performance. Therefore, in the same benchmark test, we captured the following extra information, which is broken down into per-instance-type network/IO improvements.

Based on the TPC-DS query test result, this graph illustrates the percentage increases of data shuffle operations in four categories: maximum disk read and write, and maximum network received and transmitted. In comparison to c6g instances, the disk read performance improved between 25–45%, whereas the disk write performance increase was 34–47%. On the network throughput comparison, we observed an increase of 21–36%.

Run an Amazon EMR on EKS job with multiple CPU architectures

If you’re evaluating migrating to Graviton instances for Amazon EMR on EKS workloads, we recommend testing the Spark workloads based on your real-world use cases. If you need to run workloads across multiple processor architectures, for example test the performance for Intel and Arm CPUs, follow the walkthrough in this section to get started with some concrete ideas.

Build a single multi-arch Docker image

To build a single multi-arch Docker image (x86_64 and arm64), complete the following steps:

  1. Get the Docker Buildx CLI extension.Docker Buildx is a CLI plugin that extends the Docker command to support the multi-architecture feature. Upgrade to the latest Docker desktop or manually download the CLI binary. For more details, check out Working with Buildx.
  2. Validate the version after the installation:
    docker buildx version

  3. Create a new builder that gives access to the new multi-architecture features (you only have to perform this task once):
    docker buildx create --name mybuilder --use

  4. Log in to your own Amazon ECR registry:
    AWS_REGION=us-east-1
    ACCOUNT_ID=$(aws sts get-caller-identity --query Account --output text)
    ECR_URL=$ACCOUNT_ID.dkr.ecr.$AWS_REGION.amazonaws.com
    aws ecr get-login-password --region $AWS_REGION | docker login --username AWS --password-stdin $ECR_URL

  5. Get the EMR Spark base image from AWS:
    SRC_ECR_URL=755674844232.dkr.ecr.us-east-1.amazonaws.com
    docker pull $SRC_ECR_URL/spark/emr-6.6.0:latest
    aws ecr get-login-password --region us-east-1 | docker login --username AWS --password-stdin $SRC_ECR_URL

  6. Build and push a custom Docker image.

In this case, we build a single Spark benchmark utility docker image on top of Amazon EMR 6.6. It supports both Intel and Arm processor architectures:

  • linux/amd64 – x86_64 (also known as AMD64 or Intel 64)
  • linux/arm64 – Arm
docker buildx build \
--platform linux/amd64,linux/arm64 \
-t $ECR_URL/eks-spark-benchmark:emr6.6 \
-f docker/benchmark-util/Dockerfile \
--build-arg SPARK_BASE_IMAGE=$SRC_ECR_URL/spark/emr-6.6.0:latest \
--push .

Submit Amazon EMR on EKS jobs with and without Graviton

For our first example, we submit a benchmark job to the Graviton3 node group that spins up c7g.4xlarge instances.

The following is not a complete script. Check out the full version of the example on GitHub.

aws emr-containers start-job-run \
--virtual-cluster-id $VIRTUAL_CLUSTER_ID \
--name emr66-c7-4xl \
--execution-role-arn $EMR_ROLE_ARN \
--release-label emr-6.6.0-latest \
--job-driver '{
    "sparkSubmitJobDriver": {
    "entryPoint": "local:///usr/lib/spark/examples/jars/eks-spark-benchmark-assembly-1.0.jar",
    "entryPointArguments":[.......],
    "sparkSubmitParameters": "........"}}' \
--configuration-overrides '{
"applicationConfiguration": [{
    "classification": "spark-defaults",
    "properties": {
        "spark.kubernetes.container.image": "'$ECR_URL'/eks-spark-benchmark:emr6.6",
        "spark.kubernetes.node.selector.eks.amazonaws.com/nodegroup": “C7g_4”
}}]}'

In the following example, we run the same job on non-Graviton C5 instances with Intel 64 CPU. The full version of the script is available on GitHub.

aws emr-containers start-job-run \
--virtual-cluster-id $VIRTUAL_CLUSTER_ID \
--name emr66-c5-4xl \
--execution-role-arn $EMR_ROLE_ARN \
--release-label emr-6.6.0-latest \
--job-driver '{
    "sparkSubmitJobDriver": {
    "entryPoint": "local:///usr/lib/spark/examples/jars/eks-spark-benchmark-assembly-1.0.jar",
    "entryPointArguments":[.......],
    "sparkSubmitParameters": "........"}}' \    
--configuration-overrides '{
"applicationConfiguration": [{
    "classification": "spark-defaults",
    "properties": {
        "spark.kubernetes.container.image": "'$ECR_URL'/eks-spark-benchmark:emr6.6",
        "spark.kubernetes.node.selector.eks.amazonaws.com/nodegroup”: “C5_4”
}}]}'

Summary

In May 2022, the Graviton3 instance family was made available to Amazon EMR on EKS. After running the performance-optimized EMR Spark runtime on the selected latest Arm-based Graviton3 instances, we observed up to 19% performance increase and up to 15% cost savings compared to C6g Graviton2 instances. Because Amazon EMR on EKS offers 100% API compatibility with open-source Apache Spark, you can quickly step into the evaluation process with no application changes.

If you’re wondering how much performance gain you can achieve with your use case, try out the benchmark solution or the EMR on EKS Workshop. You can also contact your AWS Solutions Architects, who can be of assistance alongside your innovation journey.


About the author

Melody Yang is a Senior Big Data Solution Architect for Amazon EMR at AWS. She is an experienced analytics leader working with AWS customers to provide best practice guidance and technical advice in order to assist their success in data transformation. Her areas of interests are open-source frameworks and automation, data engineering and DataOps.

Документи на „Биволъ“ „Ние ще разтоварваме“. 200 мутри тероризират Капитан-Андреево с фалшиви пълномощни

Post Syndicated from Николай Марченко original https://bivol.bg/%D0%BD%D0%B8%D0%B5-%D1%89%D0%B5-%D1%80%D0%B0%D0%B7%D1%82%D0%BE%D0%B2%D0%B0%D1%80%D0%B2%D0%B0%D0%BC%D0%B5-200-%D0%BC%D1%83%D1%82%D1%80%D0%B8-%D1%82%D0%B5%D1%80%D0%BE%D1%80%D0%B8.html

петък 12 август 2022


Около 200 души от 4 ключови фирми на Керопе Чакърян – Ами, Красимир Каменов – Къро и укриващия се в Дубай наркобос Христофорос Никос Аманатидис – Таки са с пропуски…

Crawler Hints supports Microsoft’s IndexNow in helping users find new content

Post Syndicated from Alex Krivit original https://blog.cloudflare.com/crawler-hints-supports-microsofts-indexnow-in-helping-users-find-new-content/

Crawler Hints supports Microsoft’s IndexNow in helping users find new content

Crawler Hints supports Microsoft’s IndexNow in helping users find new content

The web is constantly changing. Whether it’s news or updates to your social feed, it’s a constant flow of information. As a user, that’s great. But have you ever stopped to think how search engines deal with all the change?

It turns out, they “index” the web on a regular basis — sending bots out, to constantly crawl webpages, looking for changes. Today, bot traffic accounts for about 30% of total traffic on the Internet, and given how foundational search is to using the Internet, it should come as no surprise that search engine bots make up a large proportion of that what might come as a surprise is how inefficient the model is, though: we estimate that over 50% of crawler traffic is wasted effort.

This has a huge impact. There’s all the additional capacity that owners of websites need to bake into their site to absorb the bots crawling all over it. There’s the transmission of the data. There’s the CPU cost of running the bots. And when you’re running at the scale of the Internet, all of this has a pretty big environmental footprint.

Part of the problem, though, is nobody had really stopped to ask: maybe there’s a better way?

Right now, the model for indexing websites is the same as it has been since the 1990s: a “pull” model, where the search engine sends a crawler out to a website after a predetermined amount of time. During Impact Week last year, we asked: what about flipping the model on its head? What about moving to a push model, where a website could simply ping a search engine to let it know an update had been made?

There are a heap of advantages to such a model. The website wins: it’s not dealing with unnecessary crawls. It also makes sure that as soon as there’s an update to its content, it’s reflected in the search engine — it doesn’t need to wait for the next crawl. The website owner wins because they don’t need to manage distinct search engine crawl submissions. The search engine wins, too: it saves money on crawl costs, and it can make sure it gets the latest content.

Of course, this needs work to be done on both sides of the equation. The websites need a mechanism to alert the search engines; and the search engines need a mechanism to receive the alert, so they know when to do the crawl.

Crawler Hints — Cloudflare’s Solution for Websites

Solving this problem is why we launched Crawler Hints. Cloudflare sits in a unique position on the Internet — we’re serving on average 36 million HTTP requests per second. That represents a lot of websites. It also means we’re uniquely positioned to help solve this problem:  to help give crawlers hints about when they should recrawl if new content has been added or if content on a site has recently changed.

With Crawler Hints, we send signals to web indexers based on cache data and origin status codes to help them understand when content has likely changed or been added to a site. The aim is to increase the number of relevant crawls as well as drastically reduce the number of crawls that don’t find fresh content, saving bandwidth and compute for both indexers and sites alike, and improving the experience of using the search engines.

But, of course, that’s just half the equation.

IndexNow Protocol — the Search Engine Moves from Pull to Push

Websites alerting the search engine about changes is useless if the search engines aren’t listening — and they simply continue to crawl the way they always have. Of course, search engines are incredibly complicated, and changing the way they operate is no easy task.

The IndexNow Protocol is a standard developed by Microsoft, Seznam.cz and Yandex, and it represents a major shift in the way search engines operate. Using IndexNow, search engines have a mechanism by which they can receive signals from Crawler Hints. Once they have that signal, they can shift their crawlers from a pull model to a push model.

In a recent update, Microsoft has announced that millions of websites are now using IndexNow to signal to search engine crawlers when their content needs to be crawled and IndexNow was used to index/crawl about 7% of all new URLs clicked when someone is selecting from web search results.

On the Cloudflare side, since the release of Crawler Hints in October 2021, Crawler Hints has processed about six-hundred-billion signals to IndexNow.

That’s a lot of saved crawls.

How to enable Crawler Hints

By enabling Crawler Hints on your website, with the simple click of a button, Cloudflare will take care of signaling to these search engines when your content has changed via the IndexNow API. You don’t need to do anything else!

Crawler Hints is free to use and available to all Cloudflare customers. If you’d like to see how Crawler Hints can benefit how your website is indexed by the world’s biggest search engines, please feel free to opt-into the service by:

  1. Sign in to your Cloudflare Account.
  2. In the dashboard, navigate to the Cache tab.
  3. Click on the Configuration section.
  4. Locate the Crawler Hints and enable.
Crawler Hints supports Microsoft’s IndexNow in helping users find new content

Upon enabling Crawler Hints, Cloudflare will share when content on your site has changed and needs to be re-crawled with search engines using the IndexNow protocol (this blog can help if you’re interested in finding out more about how the mechanism works).

What’s Next?

Going forward, because the benefits are so substantial for site owners, search operators, and the environment, we plan to start defaulting Crawler Hints on for all our customers. We’re also hopeful that Google, the world’s largest search engine and most wasteful user of Internet resources, will adopt IndexNow or a similar standard and lower the burden of search crawling on the planet.

When we think of helping to build a better Internet, this is exactly what comes to mind: creating and supporting standards that make it operate better, greener, faster. We’re really excited about the work to date, and will continue to work to improve the signaling to ensure the most valuable information is being sent to the search engines in a timely manner. This includes incorporating additional signals such as etags, last-modified headers, and content hash differences. Adding these signals will help further inform crawlers when they should reindex sites, and how often they need to return to a particular site to check if it’s been changed. This is only the beginning. We will continue testing more signals and working with industry partners so that we can help crawlers run efficiently with these hints.

And finally: if you’re on Cloudflare, and you’d like to be part of this revolution in how search engines operate on the web (it’s free!), simply follow the instructions in the section above.

Accelerate deployments on AWS with effective governance

Post Syndicated from Rostislav Markov original https://aws.amazon.com/blogs/architecture/accelerate-deployments-on-aws-with-effective-governance/

Amazon Web Services (AWS) users ask how to accelerate their teams’ deployments on AWS while maintaining compliance with security controls. In this blog post, we describe common governance models introduced in mature organizations to manage their teams’ AWS deployments. These models are best used to increase the maturity of your cloud infrastructure deployments.

Governance models for AWS deployments

We distinguish three common models used by mature cloud adopters to manage their infrastructure deployments on AWS. The models differ in what they control: the infrastructure code, deployment toolchain, or provisioned AWS resources. We define the models as follows:

  1. Central pattern library, which offers a repository of curated deployment templates that application teams can re-use with their deployments.
  2. Continuous Integration/Continuous Delivery (CI/CD) as a service, which offers a toolchain standard to be re-used by application teams.
  3. Centrally managed infrastructure, which allows application teams to deploy AWS resources managed by central operations teams.

The decision of how much responsibility you shift to application teams depends on their autonomy, operating model, application type, and rate of change. The three models can be used in tandem to address different use cases and maximize impact. Typically, organizations start by gathering pre-approved deployment templates in a central pattern library.

Model 1: Central pattern library

With this model, cloud platform engineers publish a central pattern library from which teams can reference infrastructure as code templates. Application teams reuse the templates by forking the central repository or by copying the templates into their own repository. Application teams can also manage their own deployment AWS account and pipeline with AWS CodePipeline), as well as the resource-provisioning process, while reusing templates from the central pattern library with a service like AWS CodeCommit. Figure 1 provides an overview of this governance model.

Deployment governance with central pattern library

Figure 1. Deployment governance with central pattern library

The central pattern library represents the least intrusive form of enablement via reusable assets. Application teams appreciate the central pattern library model, as it allows them to maintain autonomy over their deployment process and toolchain. Reusing existing templates speeds up the creation of your teams’ first infrastructure templates and eases policy adherence, such as tagging policies and security controls.

After the reusable templates are in the application team’s repository, incremental updates can be pulled from the central library when the template has been enhanced. This allows teams to pull when they see fit. Changes to the team’s repository will trigger the pipeline to deploy the associated infrastructure code.

With the central pattern library model, application teams need to manage resource configuration and CI/CD toolchain on their own in order to gain the benefits of automated deployments. Model 2 addresses this.

Model 2: CI/CD as a service

In Model 2, application teams launch a governed deployment pipeline from AWS Service Catalog. This includes the infrastructure code needed to run the application and “hello world” source code to show the end-to-end deployment flow.

Cloud platform engineers develop the service catalog portfolio (in this case the CI/CD toolchain). Then, application teams can launch AWS Service Catalog products, which deploy an instance of the pipeline code and populated Git repository (Figure 2).

The pipeline is initiated immediately after the repository is populated, which results in the “hello world” application being deployed to the first environment. The infrastructure code (for example, Amazon Elastic Compute Cloud [Amazon EC2] and AWS Fargate) will be located in the application team’s repository. Incremental updates can be pulled by launching a product update from AWS Service Catalog. This allows application teams to pull when they see fit.

Deployment governance with CI/CD as a service

Figure 2. Deployment governance with CI/CD as a service

This governance model is particularly suitable for mature developer organizations with full-stack responsibility or platform projects, as it provides end-to-end deployment automation to provision resources across multiple teams and AWS accounts. This model also adds security controls over the deployment process.

Since there is little room for teams to adapt the toolchain standard, the model can be perceived as very opinionated. The model expects application teams to manage their own infrastructure. Model 3 addresses this.

Model 3: Centrally managed infrastructure

This model allows application teams to provision resources managed by a central operations team as self-service. Cloud platform engineers publish infrastructure portfolios to AWS Service Catalog with pre-approved configuration by central teams (Figure 3). These portfolios can be shared with all AWS accounts used by application engineers.

Provisioning AWS resources via AWS Service Catalog products ensures resource configuration fulfills central operations requirements. Compared with Model 2, the pre-populated infrastructure templates launch AWS Service Catalog products, as opposed to directly referencing the API of the corresponding AWS service (for example Amazon EC2). This locks down how infrastructure is configured and provisioned.

Deployment governance with centrally managed infrastructure

Figure 3. Deployment governance with centrally managed infrastructure

In our experience, it is essential to manage the variety of AWS Service Catalog products. This avoids proliferation of products with many templates differing slightly. Centrally managed infrastructure propagates an “on-premises” mindset so it should be used only in cases where application teams cannot own the full stack.

Models 2 and 3 can be combined for application engineers to launch both deployment toolchain and resources as AWS Service Catalog products (Figure 4), while also maintaining the opportunity to provision from pre-populated infrastructure templates in the team repository. After the code is in their repository, incremental updates can be pulled by running an update from the provisioned AWS Service Catalog product. This allows the application team to pull an update as needed while avoiding manual deployments of service catalog products.

Using AWS Service Catalog to automate CI/CD and infrastructure resource provisioning

Figure 4. Using AWS Service Catalog to automate CI/CD and infrastructure resource provisioning

Comparing models

The three governance models differ along the following aspects (see Table 1):

  • Governance level: What component is managed centrally by cloud platform engineers?
  • Role of application engineers: What is the responsibility split and operating model?
  • Use case: When is each model applicable?

Table 1. Governance models for managing infrastructure deployments


Model 1: Central pattern library Model 2: CI/CD as a service Model 3: Centrally managed infrastructure
Governance level Centrally defined infrastructure templates Centrally defined deployment toolchain Centrally defined provisioning and management of AWS resources
Role of cloud platform engineers Manage pattern library and policy checks Manage deployment toolchain and stage checks Manage resource provisioning (including CI/CD)
Role of application teams Manage deployment toolchain and resource provisioning Manage resource provisioning Manage application integration
Use case Federated governance with application teams maintaining autonomy over application and infrastructure Platform projects or development organizations with strong preference for pre-defined deployment standards including toolchain Applications without development teams (e.g., “commercial-off-the-shelf”) or with separation of duty (e.g., infrastructure operations teams)

Conclusion

In this blog post, we distinguished three common governance models to manage the deployment of AWS resources. The three models can be used in tandem to address different use cases and maximize impact in your organization. The decision of how much responsibility is shifted to application teams depends on your organizational setup and use case.

Want to learn more?

[$] A fuzzy issue of responsible disclosure

Post Syndicated from original https://lwn.net/Articles/904293/

Fuzz testing is the process of supplying a program with random inputs and
watching to see what breaks; it has been responsible for the identification
of vast numbers of bugs in recent years — and the fixing of many of them.
Developers generally appreciate bug reports, but they can sometimes be a
bit less enthusiastic about a flood of reports from automated fuzzing
systems. A recent discussion around filesystem fuzzing highlighted two
points of view on whether the current fuzz-testing activity is a good
thing.

Introducing bidirectional event integrations with Salesforce and Amazon EventBridge

Post Syndicated from James Beswick original https://aws.amazon.com/blogs/compute/introducing-bidirectional-event-integrations-with-salesforce-and-amazon-eventbridge/

This post is written by Alseny Diallo, Prototype Solutions Architect and Rohan Mehta, Associate Cloud Application Architect.

AWS now supports Salesforce as a partner event source for Amazon EventBridge, allowing you to send Salesforce events to AWS. You can also configure Salesforce with EventBridge API Destinations and send EventBridge events to Salesforce. These integrations enable you to act on changes to your Salesforce data in real-time and build custom applications with EventBridge and over 100 built-in sources and targets.

In this blog post, you learn how to set up a bidirectional integration between Salesforce and EventBridge and use cases for working with Salesforce events. You see an example application for interacting with Salesforce support case events with automated workflows for detecting sentiment with AWS AI/ML services and enriching support cases with customer order data.

Integration overview

Salesforce is a customer relationship management (CRM) platform that gives companies a single, shared view of customers across their marketing, sales, commerce, and service departments. Salesforce Event Relays for AWS enable bidirectional event flows between Salesforce and AWS through EventBridge.

Amazon EventBridge is a serverless event bus that makes it easier to build event-driven applications at scale using events generated from your applications, integrated software as a service (SaaS) applications, and AWS services. EventBridge partner event source integrations enable customers to receive events from over 30 SaaS applications and ingest them into their AWS applications.

Salesforce as a partner event source for EventBridge makes it easier to build event-driven applications that span customers’ data in Salesforce and applications running on AWS. Customers can send events from Salesforce to EventBridge and vice versa without having to write custom code or manage an integration.

EventBridge joins Amazon AppFlow as a way to integrate Salesforce with AWS. The Salesforce Amazon AppFlow integration is well suited for use cases that require ingesting large volumes of data, like a daily scheduled data transfer sending Salesforce records into an Amazon Redshift data warehouse or an Amazon S3 data lake. The Salesforce EventBridge integration is a good fit for real-time processing of changes to individual Salesforce records.

Use cases

Customers can act on new or modified Salesforce records through integrations with a variety of EventBridge targets, including AWS Lambda, AWS Step Functions, and API Gateway. The integration can enable use cases across industries that must act on customer events in real time.

  • Retailers can automatically unify their Salesforce data with AWS data sources. When a new customer support case is created in Salesforce, enrich the support case with recent order data from that customer retrieved from an orders database running on AWS.
  • Media and entertainment providers can augment their omnichannel experiences with AWS AI/ML services to increase customer engagement. When a new customer account is created in Salesforce, use Amazon Personalize and Amazon Simple Email Service to send a welcome email with personalized media recommendations.
  • Insurers can automate form processing workflows. When a new insurance claim form PDF is uploaded to Salesforce, extract the submitted information with Amazon Textract and orchestrate processing the claim information with AWS Step Functions.

Solution overview

The example application shows how the integration can enhance customer support experiences by unifying support tickets with customer order data, detecting customer sentiment, and automating support case workflows.

Reference architecture

  1. A new case is created in Salesforce and an event is sent to an EventBridge partner event bus.
  2. If the event matches the EventBridge rule, the rule sends the event to both the Enrich Case and Case Processor Workflows in parallel.
  3. The Enrich Case Workflow uses the Customer ID in the event payload to query the Orders table for the customer’s recent order. If this step fails, the event is sent to an Amazon SQS dead letter queue.
  4. The Enrich Case Workflow publishes a new event with the customer’s recent order to an EventBridge custom event bus.
  5. The Case Processor Workflow performs sentiment analysis on the support case content and sends a customized text message to the customer. See the diagram below for details on the workflow.
  6. The Case Processor Workflow publishes a new event with the sentiment analysis results to the custom event bus.
  7. EventBridge rules match the events published to the associated rules: CaseProcessorEventRule and EnrichCaseAppEventRule.
  8. These rules send the events to EventBridge API Destinations. API Destinations sends the events to Salesforce HTTP endpoints to create two Salesforce Platform Events.
  9. Salesforce data is updated with the two Platform Events:
    1. The support case record is updated with the customer’s recent order details and the support case sentiment.
    2. If the support case sentiment is negative, a task is created for an agent to follow up with the customer.

The Case Processor workflow uses Step Functions to process the Salesforce events.

Case processor workflow

  1. Detect the sentiment of the customer feedback using Amazon Comprehend. This is positive, negative, or neutral.
  2. Check if the customer phone number is a mobile number and can receive SMS using Amazon Pinpoint’s mobile number validation endpoint.
  3. If the customer did not provide a mobile number, bypass the SMS steps and put an event with the detected sentiment onto the custom event bus.
  4. If the customer provided a mobile number, send them an SMS with the appropriate message based on the sentiment of their case.
    1. If sentiment is positive or neutral, the message is thanking the customer for their feedback.
    2. If the sentiment is negative, the message offers additional support.
  5. The state machine then puts an event with the sentiment analysis results onto the custom event bus.

Prerequisites

Environment setup

  1. Follow the instructions here to set up your Salesforce Event Relay. Once you have an event bus created with the partner event source, proceed to step 2.
  2. Copy the ARN of the event bus.
  3. Create a Salesforce Connected App. This is used for the API Destinations configuration to send updates back into Salesforce.
  4. You can create a new user within Salesforce with appropriate API permissions to update records. The user name and password is used by the API Destinations configuration.
  5. The example provided by Salesforce uses a Platform Event called “Carbon Comparison”. For this sample app, you create three custom platform events with the following configurations:
    1. Customer Support Case (Salesforce to AWS):
      Customer support case
    2. Processed Support Case (AWS to Salesforce):
      Processed Support case
    3. Enrich Case (AWS to Salesforce):
      Enrich case example
  6. This example application assumes that a custom Sentiment field is added to the Salesforce Case record type. See this link for how to create custom fields in Salesforce.
  7. The example application uses Salesforce Flows to trigger outbound platform events and handle inbound platform events. See this link for how to use Salesforce Flows to build event driven applications on Salesforce.
  8. Clone the AWS SAM template here.
    sam build
    sam deploy —guided

    For the parameter prompts, enter:

  • SalesforceOauthClientId and SalesforceOauthClientSecret: Use the values created with the Connected App in step 3.
  • SalesforceUsername and SalesforcePassword: Use the values created for the new user in step 4.
  • SalesforceOauthUrl: Salesforce URL for OAuth authentication
  • SalesforceCaseProcessorEndpointUrl: Salesforce URL for creating a new Processed Support Case Platform Event object, in this case: https://MyDomainName.my.salesforce.com/services/data/v54.0/sobjects/Processed_Support_Case__e
  • SFEnrichCaseEndpointUrl: Salesforce URL for creating a new Enrich Case Platform Event object, in this case: https://MyDomainName.my.salesforce.com/services/data/v54.0/sobjects/Enrich_Case__e
  • SalesforcePartnerEventBusArn: Use the value from step 2.
  • SalesforcePartnerEventPattern: The detail-type value should be the API name of the custom platform event, in thiscase: {“detail-type”: [“Customer_Support_Case__e”]}

Conclusion

This blog shows how to act on changes to your Salesforce data in real-time using the new Salesforce partner event source integration with EventBridge. The example demonstrated how your Salesforce data can be processed and enriched with custom AWS applications and updates sent back to Salesforce using EventBridge API Destinations.

To learn more about EventBridge partner event sources and API Destinations, see the EventBridge Developer Guide. For more serverless resources, visit Serverless Land.

Twitter Exposes Personal Information for 5.4 Million Accounts

Post Syndicated from Bruce Schneier original https://www.schneier.com/blog/archives/2022/08/twitter-exposes-personal-information-for-5-4-million-accounts.html

Twitter accidentally exposed the personal information—including phone numbers and email addresses—for 5.4 million accounts. And someone was trying to sell this information.

In January 2022, we received a report through our bug bounty program of a vulnerability in Twitter’s systems. As a result of the vulnerability, if someone submitted an email address or phone number to Twitter’s systems, Twitter’s systems would tell the person what Twitter account the submitted email addresses or phone number was associated with, if any. This bug resulted from an update to our code in June 2021. When we learned about this, we immediately investigated and fixed it. At that time, we had no evidence to suggest someone had taken advantage of the vulnerability.

In July 2022, we learned through a press report that someone had potentially leveraged this and was offering to sell the information they had compiled. After reviewing a sample of the available data for sale, we confirmed that a bad actor had taken advantage of the issue before it was addressed.

This includes anonymous accounts.

This comment has it right:

So after forcing users to enter a phone number to continue using twitter, despite twitter having no need to know the users phone number, they then leak the phone numbers and associated accounts. Great.

But it gets worse… After being told of the leak in January, rather than disclosing the fact millions of users data had been open for anyone who looked, they quietly fixed it and hoped nobody else had found it.

It was only when the press started to notice they finally disclosed the leak.

That isn’t just one bug causing a security leak—it’s a chain of bad decisions and bad security culture, and if anything should attract government fines for lax data security, this is it.

Twitter’s blog post unhelpfully goes on to say:

If you operate a pseudonymous Twitter account, we understand the risks an incident like this can introduce and deeply regret that this happened. To keep your identity as veiled as possible, we recommend not adding a publicly known phone number or email address to your Twitter account.

Three news articles.

3 Mistakes Companies Make in Their Detection and Response Programs

Post Syndicated from Jake Godgart original https://blog.rapid7.com/2022/08/12/3-mistakes-companies-make-in-their-detection-and-response-programs/

3 Mistakes Companies Make in Their Detection and Response Programs

The goal of a detection and response (D&R) program is to act as quickly as possible to identify and remove threats while minimizing any fallout. Many organizations have identified the need for D&R as a critical piece of their security program, but it’s often the hardest — and most costly — piece to implement and run.

As a result, D&R programs tend to suffer from common mistakes, and security teams often run into obstacles that hamper the value a solid program can deliver.

Recognizing this fact, our team of security experts at Rapid7 has put together a list of the top mistakes companies make in their D&R programs as well as tips to overcome or avoid them entirely.

1. Trying to analyze too much data

To have a successful and truly comprehensive D&R program, you should have complete visibility across your modern environment – from endpoints to users, cloud, network, and all other avenues attackers may enter. With all this visibility, you may think you need all the data you can get your hands on. The reality? Data “analysis paralysis” is real.

While data fuels detection and response, too much of it will leave you wading through thousands of false positives and alert noise, making it hard to focus on the needle in a haystack full of other needles. The more data, the harder it is to understand which of those needles are sharp and which are dull.

So it ends up being about collecting the right data without turning your program into an alert machine. It’s key to understand which event sources to connect to your SIEM or XDR platform and what information is the most relevant. Typically, you’re on the right path if you’re aligning your event sources with use cases. The most impactful event sources we usually see ingested are:

  • Endpoint agents (including start/stop processes)
  • DHCP
  • LDAP
  • DNS
  • Cloud services (O365, IIS, load balancers)
  • VPN
  • Firewall
  • Web proxy
  • Active Directory for user attribution
  • For even greater detail, throw on network sensors, IDS, deception technology, and other log types

At the end of the day, gaining visibility into your assets, understanding user behaviors, collecting system logs, and piecing it all together will help you build a clearer picture of your environment. But analyzing all that data can prove challenging, especially for larger-scale environments.

That’s where Managed Security Service Providers (MSSP) and Managed Detection and Response (MDR) providers can come in to offload that element to a 24×7 team of experts.

2. Not prioritizing risks and outcomes

Not all D&R programs will focus on the same objectives. Different companies have different risks. For example, healthcare providers and retail chains will likely deal with threats unique to their respective industries. Hospitals, in particular, are prime targets for ransomware. Something as simple as not having two-factor authentication in place could leave a privileged account susceptible to a brute-force attack, creating wide-open access to medical records. It’s not overstating to say that could ultimately make it more difficult to save lives.

Taking this into account, your D&R program should identify the risks and outcomes that will directly impact your business. One of the big mistakes companies make is trying to cover all the bases while ignoring more targeted, industry-specific threats.

As mentioned above, healthcare is a heavily targeted industry. Phishing attacks like credential harvesting are extremely common. As we should all know by now, it can be disastrous for even one employee to click a suspicious link or open an attachment in an email. In the healthcare sector, customer and patient data were leaked about 58% of the time, or in about 25 out of 43 incidents. Adversaries can now move laterally with greater ease, quickly escalating privileges and getting what they want faster. And when extortion is the name of the game, the goal is often to disrupt mission-critical business operations. This can cripple a hospital’s ability to run, holding data for ransom and attempting to tarnish a company’s reputation in the process.

3. Finding help in the wrong place

Building a modern security operations center (SOC) today requires significant investments. An internal 24×7 SOC operation essentially needs around a dozen security personnel, a comprehensive security playbook with best practices clearly defined and outlined, and a suite of security tools that all go toward providing 24/7 monitoring. Compound these requirements with the cybersecurity skills shortage, and not many organizations will be able to set up or manage an internal SOC, let alone helm a fully operational D&R program. In a recent Forrester Consulting Total Economic Impact™ (TEI) study commissioned by Rapid7, it was identified that Rapid7’s MDR service was able to prevent security teams from hiring five full-time analysts – each at an annual salary of at least $135,000.

There are two critical mistakes organizations make that can send D&R programs down the wrong path:

  • Choosing to go it all alone and set up your own SOC without the right people and expertise
  • Partnering with a provider that doesn’t understand your needs or can’t deliver on what they promise

Partnering with an MDR provider is an effective way to ramp up security monitoring capabilities and fill this gap. But first, it’s important to evaluate an MDR partner across the following criteria:

  • Headcount and expertise: How experienced are the MDR analysts? Does the provider offer alert triage and investigation as well as digital forensics and incident response (DFIR) expertise?
  • Technology: What level of visibility will you have across the environment? And what detection methods will be used to find threats?
  • Collaboration and partnership: What do daily/monthly service interactions look like? Is the provider simply focused on security operations, or will they also help you advance your maturity?
  • Threat hunting: Will they go beyond real-time threat monitoring and offer targeted, human-driven threat hunting for unknown threats?
  • Process and service expectations: How will they help you achieve rapid time-to-value?
  • Managed response and incident response (IR) expertise: How will they respond on your behalf, and what will they do if an incident becomes a breach?
  • Security orchestration, automation, and response (SOAR): Will they leverage SOAR to automate processes?
  • Pricing: Will they price their solution to ensure transparency, predictability, and value?

An extension of your team

Services like MDR can enable you to obtain 24/7, remotely delivered SOC capabilities when you have limited or no existing internal detection and response expertise or need to augment your existing security operations team.

The key questions and critical areas of consideration discussed above can help you find the MDR partner who will best serve your needs — one who will provide the necessary MDR capabilities that can serve your short- and long-term needs. After all, the most important thing is that your organization comes out the other side better protected in the face of today’s threats.

Looking for more key considerations and questions to ask on your D&R journey to keeping your business secure? Check out our 2022 MDR Buyer’s Guide that details everything you need to know about evaluating MDR solutions.

Additional reading:

NEVER MISS A BLOG

Get the latest stories, expertise, and news about security today.

Security updates for Friday

Post Syndicated from original https://lwn.net/Articles/904549/

Security updates have been issued by Debian (gnutls28, libtirpc, postgresql-11, and samba), Fedora (microcode_ctl, wpebackend-fdo, and xen), Oracle (.NET 6.0, galera, mariadb, and mysql-selinux, and kernel), SUSE (dbus-1 and python-numpy), and Ubuntu (booth).

A Taxonomy of Access Control

Post Syndicated from Bruce Schneier original https://www.schneier.com/blog/archives/2022/08/a-taxonomy-of-access-control.html

My personal definition of a brilliant idea is one that is immediately obvious once it’s explained, but no one has thought of it before. I can’t believe that no one has described this taxonomy of access control before Ittay Eyal laid it out in this paper. The paper is about cryptocurrency wallet design, but the ideas are more general. Ittay points out that a key—or an account, or anything similar—can be in one of four states:

safe Only the user has access,
loss No one has access,
leak Both the user and the adversary have access, or
theft Only the adversary has access.

Once you know these states, you can assign probabilities of transitioning from one state to another (someone hacks your account and locks you out, you forgot your own password, etc.) and then build optimal security and reliability to deal with it. It’s a truly elegant way of conceptualizing the problem.

What’s Up, Home? – Did You Really Turn Off Your Camera?

Post Syndicated from Janne Pikkarainen original https://blog.zabbix.com/whats-up-home-did-you-really-turn-off-your-camera/22697/

Can you monitor your webcam activity with Zabbix? Of course you can! By day, I work as a monitoring technical lead in a global cyber security company. By night, I monitor my home with Zabbix & Grafana and do some weird experiments with them. Welcome to my weekly blog about this project.

In a world where we work remote and have our web cameras on much of the time, you totally can forget to turn it off (or forget to toggle that physical webcam blindfold). Or, a Bad Hombre can lure something nasty to your computer and silently record your activities with it for any later evil consumption.

Scary, huh? Zabbix to the rescue!

Ssssshhhhh! Be very quiet, I am setting up a trap for uninvited visitors

Underneath, this thing works with a combination of zabbix_sender (spawned on my MacBook) and a Zabbix trapper item …

No alt text provided for this image

… with some preprocessing applied to it:

No alt text provided for this image

See, it works!

Easy bits first: See, this works!

Here’s latest data:

Webcam power status latest data

And here’s a graph:

Webcam power status graph

In other words, my Zabbix can now tell if the web camera is on or not. I did not do any triggers for this yet, and for the most part this is just an inspirational post for y’all. Use Zabbix trigger conditions and create alerts such as:

  • Webcam is on but no usual webcam needing software (Teams, Zoom…) is found
  • Webcam is on even if the screen is locked
  • Webcam is on even if user is not logged in
  • Webcam is on in the middle of the night
  • Webcam is on even if nobody is home (according to your IoT monitoring setup)

This easily could add another layer to your security and privacy, as any suspicious usage of web camera (or, with similar technique, a microphone) can be detected in real time.

No alt text provided for this image

Headbang time

So, since I mostly use Mac for any webcam needs, I needed to get this working with a Mac. Unfortunately, as a Mac admin, I wear a yellow belt. For what it’s worth, I have an ancient MacBook Pro Retina mid-2012, running macOS Catalina.

First I thought this would be somehow easy, as I am already forwarding all the macOS syslog entries to my home syslog server (which is just the Raspberry Pi that also runs Zabbix & Grafana). Naive me thought that I could just look for kCameraStreamStart/Stop events via that log.

Little did I know, and this is where I request your help to make this sensible. I can see the log entries on my macOS in real-time with

log stream | grep “kCameraStream”

… but that does not want to save the thing in a log file if I try standard redirection with > or piping to tee or any other command, at least not without specifying a timeout value and then restarting the command.

Then there seems to be /etc/asl.conf and /etc/asl/ directory with many files, but my asl-fu is weak and I have no idea how to make it forward logs to remote syslog. I found out that in theory there’s a file parameter and I could store messages to file, which the standard syslog could then forward to my syslog server…. but I did not try out that route yet.

I know I could get the webcam status by using lsof but the trouble is that if the camera was on just for a very short time, it is possible to miss that with lsof.

For now, I have this terrible, terrible thing running background to see if the concept works, and I would like to get rid of this.

while true; do log show –last 2m | grep kCamera | tail -n1 | xargs -I ‘{}’ zabbix_sender -z my.zabbix.server -s “Personal MacBook Pro” -k webcam.power -o ‘{}’ ; sleep 30; done

So, how to make this as smooth as possible with Mac? Basically I just would need to forward more logs to my central log server, but did not yet figure out, how to do that.

I think that with Linux I could detect the use of /dev/video0 via audit log or setup an incron hook to trigger if /dev/video0 get accessed, but not totally sure as these are some murky waters for me, I am not usually spying my webcam.

I have been working at Forcepoint since 2014 and my co-workers have to stand the pain that is my stupid t-shirts.

This post was originally published on the author’s LinkedIn account

The post What’s Up, Home? – Did You Really Turn Off Your Camera? appeared first on Zabbix Blog.

The collective thoughts of the interwebz