Ransomware Takeaways From Q1 2022

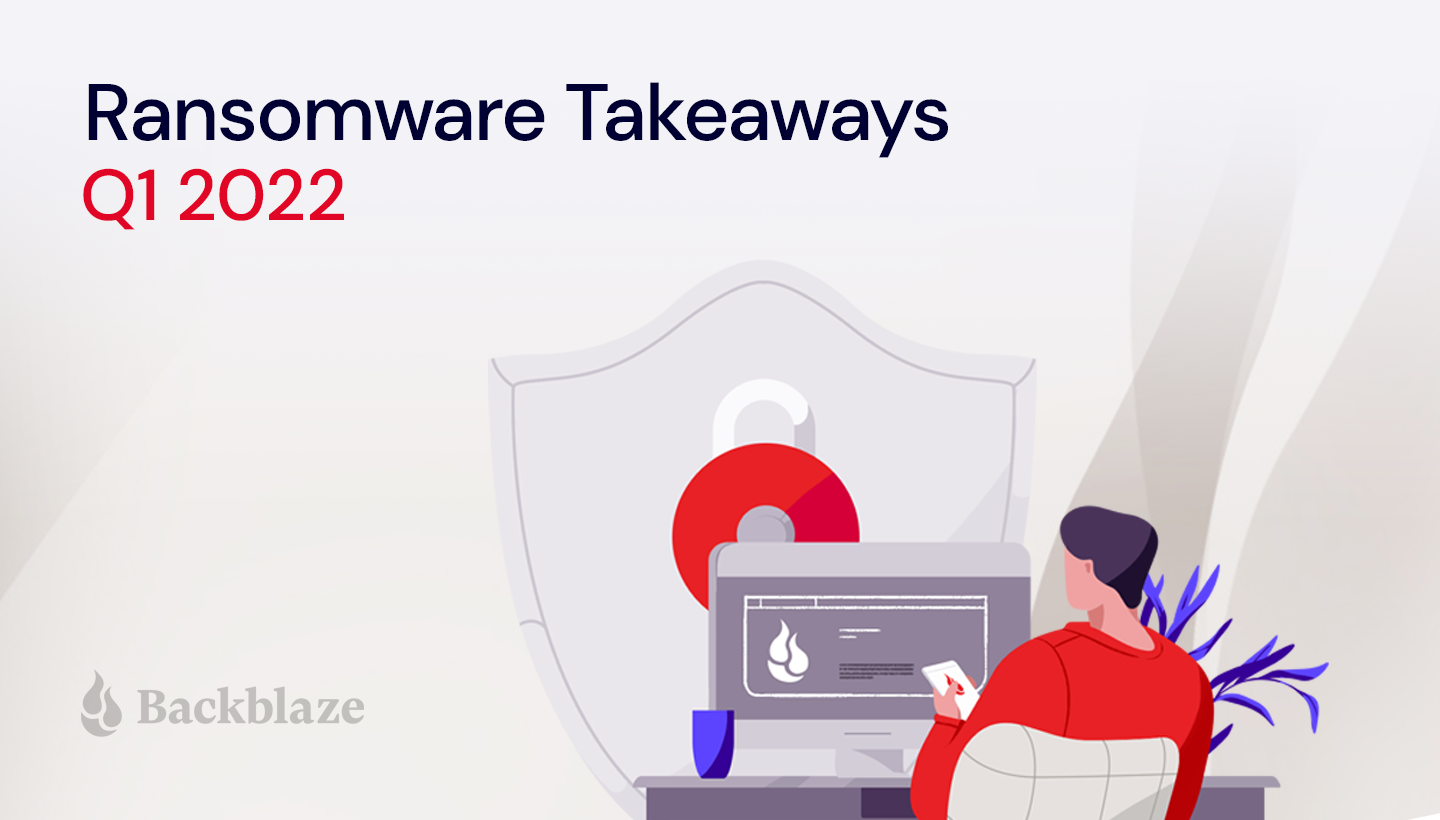
Post Syndicated from Molly Clancy original https://www.backblaze.com/blog/ransomware-takeaways-from-q1-2022/

The impact of the war in Ukraine is evolving in real time, particularly when it comes to the ransomware landscape. Needless to say, it dominated the ransomware conversation throughout Q1 2022. This quarter, we’re digging into some of the consequences from the invasion and what it means for you in addition to a few broader domestic developments.

Why? Staying up to date on ransomware trends can help you prepare your security infrastructure in the short and long term to protect your valuable data. In this series, we share five key takeaways based on what we saw over the previous quarter. Here’s what we observed in Q1 2022.

This post is a part of our ongoing series on ransomware. Take a look at our other posts for more information on how businesses can defend themselves against a ransomware attack, and more.

➔ Download The Complete Guide to Ransomware E-book

1. Sanctions and International Attention May Have Depressed Some Ransomware Activity

Following the ground invasion, ransomware attacks seemed to go eerily quiet especially when government officials predicted cyberattacks could be a key tactic. That’s not to say attacks weren’t being carried out without being reported, but the radio silence was notable enough that a few media outlets wondered why.

International attention may be one reason—cybercriminals tend to be wary of the spotlight. Having the world’s eyes on a region where much cybercrime originates seems to have pushed cybercriminals into the shadows. The sanctions imposed on Russia have made it more difficult for cybercrime syndicates based in the country to receive, convert, and disperse payment from victims. The war also may have caused some chaos within ransomware syndicates and fomented fears that cyberinsurers would not pay for claims. As a result, we’ve seen a slowing of ransomware incidents in the first quarter, but that may not last.

Key Takeaway: While ransomware attacks may be down short-term, no one should be lulled into thinking the threat is gone, especially with government agencies on high alert and warnings from the highest levels that businesses should still be on guard.

2. Long-term Socioeconomic Impacts Could Trigger a New Wave of Cybercrime

As part of their ongoing analysis, cyber security consultants Coveware, illustrated how the socioeconomic precarity caused by sanctions could lead to a larger number of people turning to cybercrime as a way to support themselves. In their reporting, they analyzed the number of trained cyber security professionals who they’d expect to be out of work given Russia’s rising unemployment rate in order to estimate a pool of potential new ransomware operators. To double the number of individuals currently acting as ransomware operators, they found that only 7% of the newly unemployed workforce would have to convert to cybercrime.

They note, however, that it remains to be seen what impact a larger labor pool would have since new entrants looking for fast cash may not be as willing to put in the time and effort to carry out big game tactics that typified the first half of 2021. As such, Coveware would expect to see an increase in attacks on small to medium-sized enterprises (which already make up the largest portion of ransomware victims today) and a decline in ransom demands with new operators hoping to make paying up more attractive for victims.

Key Takeaway: If the threat materializes, new entrants to the ransomware game are likely to try to fly under the radar, which means we would expect to see a larger number of small to medium-sized businesses targeted with ransoms that won’t make headlines, but that nonetheless hurt the businesses affected.

3. One Ransomware Operator Paid the Price for Russian Allegiance; Others Declared Neutrality

In February, ransomware group Conti declared their support for Russian actions and threatened to retaliate against Western entities targeting Russian infrastructure. But Conti appears to have miscalculated the loyalty of its affiliates, many of whom are likely pro-Ukraine. The declaration backfired when one of their affiliates leaked chat logs following the announcement. Shortly after, LockBit, another prolific ransomware group, took a cue from Conti’s blunder, declaring neutrality and swearing off any attacks against Russia’s many enemies. Their reasoning? Surprisingly inclusive for an organized crime syndicate:

“Our community consists of many nationalities of the world, most of our pentesters are from the CIS including Russians and Ukrainians, but we also have Americans, Englishmen, Chinese, French, Arabs, Jews, and many others in our team… We are all simple and peaceful people, we are all Earthlings.”

As we know, the ransomware economy is a wide, interconnected network of actors with varying political allegiances. The actions of LockBit may assuage some fears that Russia would be able to weaponize the cybercrime groups that have been allowed to operate with impunity within its borders, but that’s no reason to rest easy.

Key Takeaway: LockBit’s actions and words reinforce the one thing we know for sure about cybercriminals: Despite varying political allegiances, they’re unified by money and they will come after it if it’s easy for the taking.

4. CISA Reports the Globalized Threat of Ransomware Increased in 2021

The U.S. Cybersecurity and Infrastructure Security Agency (CISA) released a statement in March summarizing the trends they saw throughout 2021. They outlined a number of tactics that we saw throughout the year as well, including:

  • Targeting attacks on holidays and weekends.
  • Targeting managed service providers.
  • Targeting backups stored in on-premises devices and in the cloud.

Among others, these tactics pose a threat to critical infrastructure, healthcare, financial institutions, education, businesses, and nonprofits globally.

Key Takeaway: The advisory outlines 18 mitigation strategies businesses and organizations can take to protect themselves from ransomware, including some of the top strategies as we see it: protecting cloud storage by backing up to multiple locations, requiring MFA for access, and encrypting data in the cloud.

5. Russia Could Use Ransomware to Offset Sanctions

Despite our first observation that ransomware attacks slowed somewhat early in the quarter, the Financial Crimes Enforcement Network (FinCEN) issued an alert in March that Russia may employ state-sponsored actors to evade sanctions and bring in cryptocurrency by ramping up attacks. They warned financial institutions, specifically, to be vigilant against these threats to help thwart attempts by state-sponsored Russian actors to extort ransomware payments.

The warnings follow an increase in phishing and distributed denial-of-service (DDoS) attacks that have persisted throughout the year and increased toward the end of February into March as reported by Google’s Threat Analysis Group. In reports from ThreatPost covering the alert as well as Google’s observations, cybersecurity experts seemed doubtful that ransomware payouts would make much of a dent in alleviating the sanctions, and noted that opportunities to use ransomware were more likely on an individual level.

Key Takeaway: The warnings serve as a reminder that both individual actors and state-sponsored entities have ransomware tools at their disposal to use as a means to retaliate against sanctions or simply support themselves, and that the best course of action is to shore up defenses before the anticipated threats materialize.

What This All Means for You

The changing political landscape will continue to shape the ransomware economy in new and unexpected ways. Being better prepared to avoid or mitigate the effects of ransomware makes more and more sense when you can’t be sure what to expect. Ransomware protection doesn’t have to be costly or confusing. Check out our ransomware protection solutions to get started.

The post Ransomware Takeaways From Q1 2022 appeared first on Backblaze Blog | Cloud Storage & Cloud Backup.

How we reduced our CI YAML files from 1800 lines to 50 lines

Post Syndicated from Grab Tech original https://engineering.grab.com/how-we-reduced-our-ci-yaml

This article illustrates how the Cauldron Machine Learning (ML) Platform team uses GitLab parent-child pipelines to dynamically generate GitLab CI files to solve several limitations of GitLab for large repositories, namely:

  • Limitations to the number of includes (100 by default).
  • Simplifying the GitLab CI file from 1800 lines to 50 lines.
  • Reducing the need for nested gitlab-ci yml files.

Introduction

Cauldron is the Machine Learning (ML) Platform team at Grab. The Cauldron team provides tools for ML practitioners to manage the end to end lifecycle of ML models, from training to deployment. GitLab and its tooling are an integral part of our stack, for continuous delivery of machine learning.

One of our core products is MerLin Pipelines. Each team has a dedicated repo to maintain the code for their ML pipelines. Each pipeline has its own subfolder. We rely heavily on GitLab rules to detect specific changes to trigger deployments for the different stages of different pipelines (for example, model serving with Catwalk, and so on).

Background

Approach 1: Nested child files

Our initial approach was to rely heavily on static code generation to generate the child gitlab-ci.yml files in individual stages. See Figure 1 for an example directory structure. These nested yml files are pre-generated by our cli and committed to the repository.

Figure 1: Example directory structure with nested gitlab-ci.yml files.


Child gitlab-ci.yml files are added by using the include keyword.

Figure 2: Example root .gitlab-ci.yml file, and include clauses.


Figure 3: Example child .gitlab-ci.yml file for a given stage (Deploy Model) in a pipeline (pipeline 1).
Figure 3: Example child `.gitlab-ci.yml` file for a given stage (Deploy Model) in a pipeline (pipeline 1).


As teams add more pipelines and stages, we soon hit a limitation in this approach:

There was a soft limit in the number of includes that could be in the base .gitlab-ci.yml file.

It became evident that this approach would not scale to our use-cases.

Approach 2: Dynamically generating a big CI file

Our next attempt to solve this problem was to try to inject and inline the nested child gitlab-ci.yml contents into the root gitlab-ci.yml file, so that we no longer needed to rely on the in-built GitLab “include” clause.

To achieve it, we wrote a utility that parsed a raw gitlab-ci file, walked the tree to retrieve all “included” child gitlab-ci files, and to replace the includes to generate a final big gitlab-ci.yml file.

Figure 4 illustrates the resulting file is generated from Figure 3.

Figure 4: “Fat” YAML file generated through this approach, assumes the original raw file of Figure 3.


This approach solved our issues temporarily. Unfortunately, we ended up with GitLab files that were up to 1800 lines long. There is also a soft limit to the size of gitlab-ci.yml files. It became evident that we would eventually hit the limits of this approach.

Solution

Our initial attempt at using static code generation put us partially there. We were able to pre-generate and infer the stage and pipeline names from the information available to us. Code generation was definitely needed, but upfront generation of code had some key limitations, as shown above. We needed a way to improve on this, to somehow generate GitLab stages on the fly. After some research, we stumbled upon Dynamic Child Pipelines.

Quoting the official website:

Instead of running a child pipeline from a static YAML file, you can define a job that runs your own script to generate a YAML file, which is then used to trigger a child pipeline.

This technique can be very powerful in generating pipelines targeting content that changed or to build a matrix of targets and architectures.

We were already on the right track. We just needed to combine code generation with child pipelines, to dynamically generate the necessary stages on the fly.

Architecture details

Figure 5: Flow diagram of how we use dynamic yaml generation. The user raises a merge request in a branch, and subsequently merges the branch to master.


Implementation

The user Git flow can be seen in Figure 5, where the user modifies or adds some files in their respective Git team repo. As a refresher, a typical repo structure consists of pipelines and stages (see Figure 1). We would need to extract the information necessary from the branch environment in Figure 5, and have a stage to programmatically generate the proper stages (for example, Figure 3).

In short, our requirements can be summarized as:

  1. Detecting the files being changed in the Git branch.
  2. Extracting the information needed from the files that have changed.
  3. Passing this to be templated into the necessary stages.

Let’s take a very simple example, where a user is modifying a file in stage_1 in pipeline_1 in Figure 1. Our desired output would be:

Figure 6: Desired output that should be dynamically generated.


Our template would be in the form of:

Figure 7: Example template, and information needed. Let’s call it template\_file.yml.
Figure 7: Example template, and information needed. Let’s call it template_file.yml.


First, we need to detect the files being modified in the branch. We achieve this with native git diff commands, checking against the base of the branch to track what files are being modified in the merge request. The output (let’s call it diff.txt) would be in the form of:

M        pipelines/pipeline_1/stage_1/modelserving.yaml
Figure 8: Example diff.txt generated from git diff.

We must extract the yellow and green information from the line, corresponding to pipeline_name and stage_name.

Figure 9: Information that needs to be extracted from the file.


We take a very simple approach here, by introducing a concept called stop patterns.

Stop patterns are defined as a comma separated list of variable names, and the words to stop at. The colon (:) denotes how many levels before the stop word to stop.

For example, the stop pattern:

pipeline_name:pipelines

tells the parser to look for the folder pipelines and stop before that, extracting pipeline_1 from the example above tagged to the variable name pipeline_name.

The stop pattern with two colons (::):

stage_name::pipelines

tells the parser to stop two levels before the folder pipelines, and extract stage_1 as stage_name.

Our cli tool allows the stop patterns to be comma separated, so the final command would be:

cauldron_repo_util diff.txt template_file.yml
pipeline_name:pipelines,stage_name::pipelines > generated.yml

We elected to write the util in Rust due to its high performance, and its rich templating libraries (for example, Tera) and decent cli libraries (clap).

Combining all these together, we are able to extract the information needed from git diff, and use stop patterns to extract the necessary information to be passed into the template. Stop patterns are flexible enough to support different types of folder structures.

Figure 10: Example Rust code snippet for parsing the Git diff file.


When triggering pipelines in the master branch (see right side of Figure 5), the flow is the same, with a small caveat that we must retrieve the same diff.txt file from the source branch. We achieve this by using the rich GitLab API, retrieving the pipeline artifacts and using the same util above to generate the necessary GitLab steps dynamically.

Impact

After implementing this change, our biggest success was reducing one of the biggest ML pipeline Git repositories from 1800 lines to 50 lines. This approach keeps the size of the .gitlab-ci.yaml file constant at 50 lines, and ensures that it scales with however many pipelines are added.

Our users, the machine learning practitioners, also find it more productive as they no longer need to worry about GitLab yaml files.

Learnings and conclusion

With some creativity, and the flexibility of GitLab Child Pipelines, we were able to invest some engineering effort into making the configuration re-usable, adhering to DRY principles.


Special thanks to the Cauldron ML Platform team.


What’s next

We might open source our solution.

References

Join us

Grab is the leading superapp platform in Southeast Asia, providing everyday services that matter to consumers. More than just a ride-hailing and food delivery app, Grab offers a wide range of on-demand services in the region, including mobility, food, package and grocery delivery services, mobile payments, and financial services across 428 cities in eight countries.

Powered by technology and driven by heart, our mission is to drive Southeast Asia forward by creating economic empowerment for everyone. If this mission speaks to you, join our team today!

[$] Super Python (part 1)

Post Syndicated from original https://lwn.net/Articles/891398/

A mega-thread in the python-ideas mailing list is hardly surprising, of
course; we
have covered quite a few of them over the years. A recent example
helps shine a light into a dark—or at least dim—corner of the Python
language: the super()
built-in function
for use by methods in class hierarchies.
There are some, perhaps surprising, aspects to super() along with
wrinkles in how to properly use it. But it has been part of the language
for a long time, so changes to its behavior, as was suggested in the
thread, are pretty unlikely.

Mourning Pedro Francisco

Post Syndicated from original https://lwn.net/Articles/891868/

Luis Falcon brings the sad news that Pedro Francisco has
passed on. “Pedro created and managed MasGNULinux, a Spanish blog with news about Free
Software and GNU/Linux. MasGNULinux was the best reference in the latest
Free Software projects for the Spanish speaking community.

Docker Container Monitoring With Zabbix

Post Syndicated from Dmitry Lambert original https://blog.zabbix.com/docker-container-monitoring-with-zabbix/20175/

In this blog post, I will cover Docker container monitoring with Zabbix. We will use the official Docker by Zabbix agent 2 template to make things as simple as possible. The template download link and configuration steps can be found on the Zabbix Integrations page. If you require a visual guide, I invite you to check out my video covering this topic.

Importing the official Docker template

Importing the Docker by Zabbix agent 2 template

Since we will be using the official Docker by Zabbix agent 2 template, first, we need to make sure that the template is actually available in our Zabbix instance. The template is available for Zabbix versions 5.0, 5.4, and 6.0. If you cannot find this template under Configuration – Templates, chances are that you haven’t imported it into your environment after upgrading Zabbix to one of the aforementioned versions. Remember that Zabbix does not modify or import any templates during the upgrade process, so we will have to import the template manually. If that is so, simply download the template from the official Zabbix git page (or use the link in the introduction) and import it into your Zabbix instance by using the Import button in the Configuration – Templates section.

Installing and configuring Zabbix agent 2

Before we get started with configuring our host, we first have to install Zabbix agent 2 and configure it according to the template guidelines. Follow the steps in the download section of the Zabbix website and install the zabbix-agent2 package. Feel free to use any other agent deployment methods if you want to (like compiling the agent from the source files)

Installing Zabbix agent2 from packages takes just a few simple steps:

Install the Zabbix repository package:

rpm -Uvh https://repo.zabbix.com/zabbix/6.0/rhel/8/x86_64/zabbix-release-6.0-1.el8.noarch.rpm

Install the Zabbix agent 2 package:

dnf install zabbix-agent2

Configure the Server parameter by populating it with your Zabbix server/proxy address

vi /etc/zabbix/zabbix_agent2.conf
### Option: Server
# List of comma delimited IP addresses, optionally in CIDR notation, or DNS names of Zabbix servers and Zabbix proxies.
# Incoming connections will be accepted only from the hosts listed here.
# If IPv6 support is enabled then '127.0.0.1', '::127.0.0.1', '::ffff:127.0.0.1' are treated equally
# and '::/0' will allow any IPv4 or IPv6 address.
# '0.0.0.0/0' can be used to allow any IPv4 address.
# Example: Server=127.0.0.1,192.168.1.0/24,::1,2001:db8::/32,zabbix.example.com
#
# Mandatory: yes, if StartAgents is not explicitly set to 0
# Default:
# Server=

Server=192.168.50.49

Plugin specific Zabbix agent 2 configuration

Zabbix agent 2 provides plugin-specific configuration parameters. Mostly these are optional parameters related to a specific plugin. You can find the full list of plugin-specific configuration parameters in the Zabbix documentation. In the newer versions of Zabbix agent 2, the plugin-specific parameters are defined in separate plugin configuration files, located in /etc/zabbix/zabbix_agent2.d/plugins.d/, while in older versions, they are defined directly in the zabbix_agent2.conf file.

For the Zabbix agent 2 Docker plugin, we have to provide the Docker daemon unix-socket location. This can be done by specifying the following plugin parameter:

### Option: Plugins.Docker.Endpoint
# Docker API endpoint.
#
# Mandatory: no
# Default: unix:///var/run/docker.sock
# Plugins.Docker.Endpoint=unix:///var/run/docker.sock

The default socket location will be correct for your Docker environment – in that case, you can leave the configuration file as-is.

Once we have made the necessary changes in the Zabbix agent 2 configuration files, start and enable the agent:

systemctl enable zabbix-agent2 --now

Check if the Zabbix agent2 is running:

tail -f /var/log/zabbix/zabbix_agent2.log

Before we move on to Zabbix frontend, I would like to point your attention to the Docker socket file permission – the zabbix user needs to have access to the Docker socket file. The zabbix user should be added to the docker group to resolve the following error messages.

[Docker] cannot fetch data: Get http://1.28/info: dial unix /var/run/docker.sock: connect: permission denied
ZBX_NOTSUPPORTED: Cannot fetch data.

You can add the zabbix user to the Docker group by executing the following command:

usermod -aG docker zabbix

Configuring the docker host

Configuring the host representing our Docker environment

After importing the template, we have to create a host which will represent our Docker instance. Give the host a name and assign it to a Host group – I will assign it to the Linux servers host group. Assign the Docker by Zabbix agent 2 template to the host. Since the template uses Zabbix agent 2 to collect the metrics, we also have to add an agent interface on this host. The address of the interface should point to the machine running your Docker containers. Finish up the host configuration by clicking the Add button.

Docker by Zabbix agent 2 template

Regular docker template items

The template contains a set of regular items for the general Docker instance metrics, such as the number of available images, Docker architecture information, the total number of containers, and more.

Docker tempalte Low-level discovery rules

On top of that, the template also gathers container and image-specific information by using low-level discovery rules.

Once Zabbix discovers your containers and images, these low-level discovery rules will then be used to create items, triggers, and graphs from prototypes for each of your containers and images. This way, we can monitor container or image-specific metrics, such as container memory, network information, container status, and more.

Docker templates Low-level discovery item prototypes

Verifying the host and template configuration

To verify that the agent and the host are configured correctly, we can use Zabbix get command-line tool and try to poll our agent. If you haven’t installed Zabbix get, do so on your Zabbix server or Zabbix proxy host:

dnf install zabbix-get

Now we can use zabbix-get to verify that our agent can obtain the Docker-related metrics. Execute the following command:

zabbix_get -s docker-host -k docker.info

Use the -s parameter to specify your agent host’s host name or IP address. The -k parameter specifies the item key for which we wish to obtain the metrics by polling the agent with Zabbix get.

zabbix_get -s 192.168.50.141 -k docker.info

{"Id":"SJYT:SATE:7XZE:7GEC:XFUD:KZO5:NYFI:L7M5:4RGO:P2KX:QJFD:TAVY","Containers":2,"ContainersRunning":2,"ContainersPaused":0,"ContainersStopped":0,"Images":2,"Driver":"overlay2","MemoryLimit":true,"SwapLimit":true,"KernelMemory":true,"KernelMemoryTCP":true,"CpuCfsPeriod":true,"CpuCfsQuota":true,"CPUShares":true,"CPUSet":true,"PidsLimit":true,"IPv4Forwarding":true,"BridgeNfIptables":true,"BridgeNfIP6tables":true,"Debug":false,"NFd":39,"OomKillDisable":true,"NGoroutines":43,"LoggingDriver":"json-file","CgroupDriver":"cgroupfs","NEventsListener":0,"KernelVersion":"5.4.17-2136.300.7.el8uek.x86_64","OperatingSystem":"Oracle Linux Server 8.5","OSVersion":"8.5","OSType":"linux","Architecture":"x86_64","IndexServerAddress":"https://index.docker.io/v1/","NCPU":1,"MemTotal":1776848896,"DockerRootDir":"/var/lib/docker","Name":"localhost.localdomain","ExperimentalBuild":false,"ServerVersion":"20.10.14","ClusterStore":"","ClusterAdvertise":"","DefaultRuntime":"runc","LiveRestoreEnabled":false,"InitBinary":"docker-init","SecurityOptions":["name=seccomp,profile=default"],"Warnings":null}

In addition, we can also use the low-level discovery key – docker.containers.discovery[false] to check the result of the low-level discovery.

zabbix_get -s 192.168.50.141 -k docker.containers.discovery[false]

[{"{#ID}":"a1ad32f5ee680937806bba62a1aa37909a8a6663d8d3268db01edb1ac66a49e2","{#NAME}":"/apache-server"},{"{#ID}":"120d59f3c8b416aaeeba50378dee7ae1eb89cb7ffc6cc75afdfedb9bc8cae12e","{#NAME}":"/mysql-server"}]

We can see that Zabbix will discover and start monitoring two containers – apache-server and mysql-server. Any agent low-level discovery rule or item can be checked with Zabbix get.

Docker template in action

Discovered items on our Docker host

Now that we have configured our agent and host, applied the Docker template, and verified that everything is working, we should be able to see the discovered entities in the frontend.

Collected Docker container metrics

In addition, our metrics should have also started coming in. We can check the Latest data section and verify that they are indeed getting collected.

Macros inherited from the Docker template

Lastly, we have a few additional options for further modifying the template and the results of our low-level discovery. If you open the Macros section of your host and select Inherited and host macros, you will notice that there are 4 macros inherited from the Docker template. These macros are responsible for filtering in/out the discovered containers and images. Feel free to modify these values if you wish to filter in/out the discovery of these entities as per your requirements.

Notice that the container discovery item also has one parameter, which is defined as false on the template:

  • docker.containers.discovery[false] – Discover only running containers
  • docker.containers.discovery[true] – Discover all containers, no matter their state.

And that’s it! We successfully imported the template, installed and configured Zabbix agent 2, created a host, and applied the Docker template. Finally – our Zabbix instance is now monitoring our Docker environment! If you have any other questions or comments, feel free to leave a response in the comments section of this post.


The post Docker Container Monitoring With Zabbix appeared first on Zabbix Blog.

McIntyre: Firmware – what are we going to do about it?

Post Syndicated from original https://lwn.net/Articles/891767/

Steve McIntyre argues that
Debian needs to rethink its approach to non-free firmware.

Today, a user with a new laptop from most vendors will struggle to
use it at all with our firmware-free Debian installation
media. Modern laptops normally don’t come with wired ethernet
now. There won’t be any usable graphics on the laptop’s screen. A
visually-impaired user won’t get any audio prompts. These
experiences are not acceptable, by any measure.

10 years of stories behind Guix (Guix blog)

Post Syndicated from original https://lwn.net/Articles/891752/

Over on the blog for the GNU Guix project, which is a “transactional package manager and an advanced distribution of the GNU system that respects user freedom“, the project reflects on its ten-year journey. The post consists of personal accounts from around two dozen contributors about the project, its history, and its community.

It’s been ten years today since the very first commit to what was already called Guix—the unimaginative name is a homage to Guile and Nix, which Guix started by blending together. On April 18th, 2012, there was very little to see and no actual “project”. The project formed in the following months and became a collective adventure around a shared vision.

Ten years later, it’s amazing to see what more than 600 people achieved, with 94K commits, countless hours of translation, system administration, web design work, and no less than 175 blog posts to share our enthusiasm at each major milestone. It’s been quite a ride!

AWS Week in Review – April 18, 2022

Post Syndicated from Antje Barth original https://aws.amazon.com/blogs/aws/aws-week-in-review-april-18-2022/

This post is part of our Week in Review series. Check back each week for a quick roundup of interesting news and announcements from AWS!

Here we are with another roundup of the most significant AWS launches from the previous week. Among the news, we have a new deployment option for Amazon FSx for NetApp ONTAP, performance and scaling improvements done in AWS Fargate, and an update on the AWS AI & ML Scholarship program.

Last Week’s Launches
Here are some launches that caught my attention last week:

Amazon FSx for NetApp ONTAP introduces a single Availability Zone (AZ) deployment option – Amazon FSx for NetApp ONTAP allows you to launch and run fully managed ONTAP file systems in the cloud. With the new single-AZ deployment option, you can now implement use cases that need storage replicated within an Availability Zone but do not require resiliency across AZs. This could be use cases such as development and test workloads or storing secondary copies of data already stored on-premises or in other AWS Regions. Check out Jeff’s launch blog post to learn more.

Amazon FSx for NetApp ONTAP - Single AZ Deployment

AWS Fargate now delivers faster scaling of applications – AWS Fargate is a serverless compute engine for containers that works with both Amazon Elastic Container Service (Amazon ECS) and Amazon Elastic Kubernetes Service (Amazon EKS). The team has made several improvements over the last year that enable you to scale applications up to 16X faster, making it easier to build and run applications at a larger scale on Fargate. Check out Nathan’s blog post to learn more.

AWS Fargate now delivers faster scaling of applications

AWS AI & ML Scholarship Program opens applications for underrepresented and underserved students – You can now apply for the AWS AI & ML Scholarship Program that will launch this summer. The scholarship program aims to help underserved and underrepresented high school and college students learn foundational ML concepts to prepare them for careers in AI and ML. The program uses AWS DeepRacer Student to teach foundational ML concepts, offer hands-on learning, and track scholarship prerequisites. Check out Anastacia’s blog post for more information and how to apply.

Apply for the AWS AI & ML Scholarship Program through AWS DeepRacer Student

AWS App Runner launches AWS X-Ray support – AWS App Runner is a fully managed service that developers can use to quickly deploy containerized web applications and APIs at scale with little to no infrastructure experience. App Runner now supports tracing as part of its observability suite. You can trace your containerized applications in AWS X-Ray by instrumenting applications with the AWS Distro for OpenTelemetry (ADOT). Check out Yiming’s blog post for more information.

For a full list of AWS announcements, be sure to keep an eye on the What’s New at AWS page.

Other AWS News
Here are additional news and a blog post that caught my attention:

AWS Open-Source News and Updates – My colleague Ricardo Sueiras writes this weekly open-source newsletter in which he highlights new open-source projects, tools, and demos from the AWS Community. Read edition #108 here.

Scheduling Jupyter Notebooks with AWS Orbit Workbench – In this blog post, Olalekan Elesin, Head of Data Platform & Data Architect at HRS Group and AWS Machine Learning Hero, describes how the HRS Group is scheduling Jupyter Notebooks with AWS Orbit Workbench. AWS Orbit Workbench is an open-source framework that provides a single, unified experience for your data, analytics and machine learning projects. Check out Olalekan’s blog post to learn more.

Upcoming AWS Events
Check your calendars and sign up for these AWS events:

AWS SummitThe AWS Summit season is in full swing – The next AWS Summits are taking place in San Francisco (on April 20-21), London (on April 27), Madrid (on May 4-5) and Korea (online, on May 10-11). AWS Global Summits are free events that bring the cloud computing community together to connect, collaborate, and learn about AWS. Summits are held in major cities around the world. Besides in-person summits, we also offer a series of online summits across the regions. Find an AWS Summit near you, and get notified when registration opens in your area.

.NET Enterprise Developer Day EMEA .NET Enterprise Developer Day EMEA 2022 is a free, one-day virtual conference providing enterprise developers with the most relevant information to swiftly and efficiently migrate and modernize their .NET applications and workloads on AWS. It takes place online on April 26. Attendees can also opt-in to attend the free, virtual DeveloperWeek Europe event, taking place April 27-28.

AWS Innovate - Data EditionAWS Innovate – Data Edition Americas AWS Innovate Online Conference – Data Edition is a free virtual event designed to inspire and empower you to make better decisions and innovate faster with your data. You learn about key concepts, business use cases, and best practices from AWS experts in over 30 technical and business sessions. This event takes place on May 11.

That’s all for this week. Check back next Monday for another Week in Review!

Antje

Git 2.36.0 released

Post Syndicated from original https://lwn.net/Articles/891733/

Version 2.36.0 of the Git
source-code management system is out. As usual, the list of new features
is long; this GitHub
blog post
covers some of the highlights:

But this [merge conflict] output can be understandably difficult to
interpret. In Git 2.36, --remerge-diff takes a different
approach. Instead of showing you the diffs between the merge
resolution and each parent simultaneously, --remerge-diff
shows you the diff between the file with merge conflicts, and the
resolution.

[$] User events — but not quite yet

Post Syndicated from original https://lwn.net/Articles/889607/

The ftrace and perf subsystems provide visibility into the workings of the
kernel; by activating existing tracepoints, interested developers can see
what is happening at specific points in the code. As much as kernel
developers may resist the notion, though, not all events of interest on a
system happen within the kernel. Administrators will often want to look
inside user-space processes as well; they would be even happier with a
mechanism that allows the simultaneous tracing of events in both the kernel
and user space. The user-events
subsystem
, developed by Beau Belgrave and added
during the 5.18 merge window,
promises that capability, but users will almost certainly have to wait
another cycle to gain access to it.

Highlights from Git 2.36

Post Syndicated from Taylor Blau original https://github.blog/2022-04-18-highlights-from-git-2-36/

The open source Git project just released Git 2.36, with features and bug fixes from over 96 contributors, 26 of them new. We last caught up with you on the latest in Git back when 2.35 was released.

To celebrate this most recent release, here’s GitHub’s look at some of the most interesting features and changes introduced since last time.

Review merge conflict resolution with –remerge-diff

Returning readers may remember our coverage of merge ort, the from-scratch rewrite of Git’s recursive merge engine.

This release brings another new feature powered by ort, which is the --remerge-diff option. To explain what --remerge-diff is and why you might be excited about it, let’s take a step back and talk about git show.

When given a commit git show will print out that commit’s log message as well as its diff. But it has slightly different behavior when given a merge commit, especially one that had merge conflicts. If you’ve ever passed a conflicted merge to git show, you might be familiar with this output:

If you look closely, you might notice that there are actually two columns of diff markers (the + and - characters to indicate lines added and removed). These come from the output of git diff-tree -cc, which is showing us the diff between each parent and the post-image of the given commit simultaneously.

In this particular example, the conflict occurs because one side has an extra argument in the dwim_ref() call, and the other includes an updated comment to use reflect renaming a variable from sha1 to oid. The left-most markers show the latter resolution, and the right-most markers show the former.

But this output can be understandably difficult to interpret. In Git 2.36, --remerge-diff takes a different approach. Instead of showing you the diffs between the merge resolution and each parent simultaneously, --remerge-diff shows you the diff between the file with merge conflicts, and the resolution.

The above shows the output of git show with --remerge-diff on the same conflicted merge commit as before. Here, we can see the diff3-style conflicts (shown in red, since the merge commit removes the conflict markers during resolution) along with the resolution. By more clearly indicating which parts of the conflict were left as-is, we can more easily see how the given commit resolved its conflicts, instead of trying to weave-together the simultaneous diff output from git diff-tree -cc.

Reconstructing these merges is made possible using ort. The ort engine is significantly faster than its predecessor, recursive, and can reconstruct all conflicted merge in linux.git in about 3 seconds (as compared to diff-tree -cc, which takes more than 30 seconds to perform the same operation
[source]).

Give it a whirl in your Git repositories on 2.36 by running git show --remerge-diff on some merge conflicts in your history.

[source]

More flexible fsync configuration

If you have ever looked around in your repository’s .git directory, you’ll notice a variety of files: objects, references, reflogs, packfiles, configuration, and the like. Git writes these objects to keep track of the state of your repository, creating new object files when you make new commits, update references, repack your repository, and so on.

Most likely, you haven’t had to think too hard about how these files are written and updated. If you’re curious about these details, then read on! When any application writes changes to your filesystem, those changes aren’t immediately persisted, since writing to the external storage medium is significantly slower than updating your filesystem’s in-memory caches.

Instead, changes are staged in memory and periodically flushed to disk at which point the changes are (usually, though disks and controllers can have their own write caches, too) written to the physical storage medium.

Aside from following standard best-practices (like writing new files to a temporary location and then atomically moving them into place), Git has had a somewhat limited set of configuration available to tune how and when it calls fsync, mostly limited to core.fsyncObjectFiles, which, when set, causes Git to call fsync() when creating new loose object files. (Git has had non-configurable fsync() calls scattered throughout its codebase for things like writing packfiles, the commit-graph, multi-pack index, and so on).

Git 2.36 introduces a significantly more flexible set of configuration options to tune how and when Git will explicitly fsync lots of different kinds of files, not just if it fsyncs loose objects.

At the heart of this new change are two new configuration variables:
core.fsync and core.fsyncMethod. The former lets you pick a comma-separated list of which parts of Git’s internal data structures you want to be explicitly flushed after writing. The full list can be found in the documentation, but you can pick from things like pack (to fsync files in $GIT_DIR/objects/pack) or loose-object (to fsync loose objects), to reference (to fsync references in the $GIT_DIR/refs directory). There are also aggregate options like objects (which implies both loose-object and pack), along with others like derived-metadata, committed, and all.

You can also tune how Git ensures the durability of components included in your core.fsync configuration by setting the core.fsyncMethod to either fsync (which calls fsync(), or issues a special fcntl() on macOS), or writeout-only, which schedules the written data for flushing, though does not guarantee that metadata like directory entries are updated as part of the flush operation.

Most users won’t need to change these defaults. But for server operators who have many Git repositories living on hardware that may suddenly lose power, having these new knobs to tune will provide new opportunities to enhance the durability of written data.

[source, source, source]

Stricter repository ownership checks

If you haven’t seen our blog post from last week announcing the security patches for versions 2.35 and earlier, let me give you a brief recap.

Beginning in Git 2.35.2, Git changed its default behavior to prevent you from executing git commands in a repository owned by a different user than the current one. This is designed to prevent git invocations from unintentionally executing commands which the repository owner configured.

You can bypass this check by setting the new safe.directory configuration to include trusted repositories owned by other users. If you can’t upgrade immediately, our blog post outlines some steps you can take to mitigate your risk, though the safest thing you can do is upgrade to the latest version of Git.

Since publishing that blog post, the safe.directory option now interprets the value * to consider all Git repositories as safe, regardless of their owner. You can set this in your --global config to opt-out of the new behavior in situations where it makes sense.

[source]

Tidbits

Now that we have looked at some of the bigger features in detail, let’s turn to a handful of smaller topics from this release.

  • If you’ve ever spent time poking around in the internals of one of your Git repositories, you may have come across the git cat-file command. Reminiscent of cat, this command is useful for printing out the raw contents of Git objects in your repository. cat-file has a handful of other modes that go beyond just printing the contents of an object. Instead of printing out one object at a time, it can accept a stream of objects (via stdin) when passed the --batch or --batch-check command-line arguments. These two similarly-named options have slightly different outputs: --batch instructs cat-file to just print out each object’s contents, while --batch-check is used to print out information about the object itself, like its type and size1.

    But what if you want to dynamically switch between the two? Before, the only way was to run two separate copies of the cat-file command in the same repository, one in --batch mode and the other in --batch-check mode. In Git 2.36, you no longer need to do this. You can instead run a single git cat-file command with the new --batch-command mode. This mode lets you ask for the type of output you want for each object. Its input looks either like contents <object>, or info <object>, which correspond to the output you’d get from --batch, or --batch-check, respectively.

    For server operators who may have long-running cat-file commands intended to service multiple requests, --batch-command accepts a new flush command, which flushes the output buffer upon receipt.

    [source, source]

  • Speaking of Git internals, if you’ve ever needed to script around the contents of a tree object in your repository, then there’s no doubt that git ls-tree has come in handy.

    If you aren’t familiar with ls-tree, the gist is that it allows you to list the contents of a tree objects, optionally recursing through nested sub-trees. Its output looks something like this:

    $ git ls-tree HEAD -- builtin/
    100644 blob 3ffb86a43384f21cad4fdcc0d8549e37dba12227  builtin/add.c
    100644 blob 0f4111bafa0b0810ae29903509a0af74073013ff  builtin/am.c
    100644 blob 58ff977a2314e2878ee0c7d3bcd9874b71bfdeef  builtin/annotate.c
    100644 blob 3f099b960565ff2944209ba514ea7274dad852f5  builtin/apply.c
    100644 blob 7176b041b6d85b5760c91f94fcdde551a38d147f  builtin/archive.c
    [...]
    

    Previously, the customizability of ls-tree‘s output was somewhat limited. You could restrict the output to just the filenames with --name-only, print absolute paths with --full-name, or abbreviate the object IDs with --abbrev, but that was about it.

    In Git 2.36, you have a lot more control about how ls-tree‘s should look. There’s a new --object-only option to complement --name-only. But if you really want to customize its output, the new --format option is your best bet. You can select from any combination and order of the each entry’s mode, type, name, and size.

    Here’s a fun example of where something like this might come in handy. Let’s say you’re interested in the distribution of file-sizes of blobs in your repository. Before, to get a list of object sizes, you would have had to do either:

    $ git ls-tree ... | awk '{ print $3 }' | git cat-file --batch-check='%(objectsize)'
    

    or (ab)use the --long format and pull out the file sizes of blobs:

    $ git ls-tree -l | awk '{ print $4 }'
    

    but now you can ask for just the file sizes directly, making it much more convenient to script around them:

    $ dist () {
     ruby -lne 'print 10 ** (Math.log10($_.to_i).ceil)' | sort -n | uniq -c
    }
    $ git ls-tree --format='%(objectsize)' HEAD:builtin/ | dist
      8 1000
     59 10000
     53 100000
      2 1000000
    

    …showing us that we have 8 files that are between 1-10 KiB in size, 59 files between 10-100 KiB, 53 files between 100 KiB and 1 MiB, and 2 files larger than 1 MiB.

    [source, source, source, source]

  • If you’ve ever tried to track down a bug using Git, then you’re familiar with the git bisect command. If you haven’t, here’s a quick primer. git bisect takes two revisions of your repository, one corresponding to a known “good” state, and another corresponding to some broken state. The idea is then to run a binary search between those two points in history to find the first commit which transitioned the good state to the broken state.

    If you aren’t a frequent bisect user, you may not have heard of the git bisect run command. Instead of requiring you to classify whether each point along the search is good or bad, you can supply a script which Git will execute for you, using its exit status to classify each revision for you.

    This can be useful when trying to figure out which commit broke the build, which you can do by running:

    $ git bisect start <bad> <good>
    $ git bisect run make
    

    which will run make along the binary search between <bad> and <good>, outputting the first commit which broke compilation.

    But what about automating more complicated tests? It can often be useful to write a one-off shell script which runs some test for you, and then hand that off to git bisect. Here, you might do something like:

    $ vi test.sh
    # type type type
    $ git bisect run test.sh
    

    See the problem? We forgot to mark test.sh as executable! In previous versions of Git, git bisect would incorrectly carry on the search, classifying each revision as broken. In Git 2.36, git bisect will detect that you forgot to mark the script as executable, and halt the search early.

    [source]

  • When you run git fetch, your Git client communicates with the remote to carry out a process called negotiation to determine which objects the server needs to send to complete your request. Roughly speaking, your client and the server mutually advertise what they have at the tips of each reference, then your client lists which objects it wants, and the server sends back all objects between the requested objects and the ones you already have.

    This works well because Git always expects to maintain closure over reachable objects2, meaning that if you have some reachable object in your repository, you also have all of its ancestors.

    In other words, it’s fine for the Git server to omit objects you already have, since the combination of the objects it sends along with the ones you already have should be sufficient to assemble the branches and tags your client asked for.

    But if your repository is corrupt, then you may need the server to send you objects which are reachable from ones you already have, in which case it isn’t good enough for the server to just send you the objects between what you have and want. In the past, getting into a situation like this may have led you to re-clone your entire repository.

    Git 2.36 ships with a new option to git fetch which makes it easier to recover from certain kinds of repository corruption. By passing the new --refetch option, you can instruct git fetch to fetch all objects from the remote, regardless of which objects you already have, which is useful when the contents of your objects directory are suspect.

    [source]

  • Returning readers may remember our earlier discussions about the sparse index and sparse checkouts, which make it possible to only have part of your repository checked out at a time.

    Over the last handful of releases, more and more commands have become compatible with the sparse index. This release is no exception, with four more Git commands joining the pack. Git 2.36 brings sparse index support to git clean, git checkout-index, git update-index, and git read-tree.

    If you haven’t used these commands, there’s no need to worry: adding support to these plumbing commands is designed to lay the ground work for building a sparse index-aware git stash. In the meantime, sparse index support already exists in the commands that you are most likely already familiar with, like git status, git commit, git checkout, and more.

    As an added bonus, git sparse-checkout (which is used to enable the sparse checkout feature and dictate which parts of your repository you want checked out) gained support for the command-line completion Git ships in its contrib directory.

    [source, source, source]

  • Returning readers may remember our previous coverage on partial clones, a relatively new feature in Git which allows you to initialize your clones by downloading just some of the objects in your repository.

    If you used this feature in the past with git clone‘s --recurse-submodules flag, the partial clone filter was only applied to the top-level repository, cloning all of the objects in the submodules.

    This has been fixed in the latest release, where the --filter specification you use in your top-level clone is applied recursively to any submodules your repository might contain, too.

    [source, source]

  • While we’re talking about partial clones, now is a good time to mention partial bundles, which are new in Git 2.36. You may not have heard of Git bundles, which is a different way of transferring around parts of your repository.

    Roughly speaking, a bundle combines the data in a packfile, along with a list of references that are contained in the bundle. This allows you to capture information about the state of your repository into a single file that you can share. For example, the Git project uses bundles to share embargoed security releases with various Linux distribution maintainers. This allows us to send all of the objects which comprise a new release, along with the tags that point at them in a single file over email.

    In previous releases of Git, it was impossible to prepare a filtered bundle which you could apply to a partial clone. In Git 2.36, you can now prepare filtered bundles, whose contents are unpacked as if they arrived during a partial clone3. You can’t yet initialize a new clone from a partial bundle, but you can use it to fetch objects into a bare repository:

    $ git bundle create --filter=blob:none ../partial.bundle v2.36.0
    $ cd ..
    $ git init --bare example.repo
    $ git fetch --filter=blob:none ../partial.bundle 'refs/tags/*:refs/tags/*'
    [ ... ]
    From ../example.bundle
    * [new tag]             v2.36.0 -> v2.36.0
    

    [source, source]

  • Lastly, let’s discuss a bug fix concerning Git’s multi-pack reachability bitmaps. If you have started to use this new feature, you may have noticed a handful of new files in your .git/objects/pack directory:

    $ ls .git/objects/pack/multi-pack-index*
    .git/objects/pack/multi-pack-index
    .git/objects/pack/multi-pack-index-33cd13fb5d4166389dbbd51cabdb04b9df882582.bitmap
    .git/objects/pack/multi-pack-index-33cd13fb5d4166389dbbd51cabdb04b9df882582.rev
    

    In order, these are: the multi-pack index (MIDX) itself, the reachability bitmap data, and the reverse-index which tells Git which bits correspond to what objects in your repository.

    These are all associated back to the MIDX via the MIDX’s checksum, which is how Git knows that the three belong together. This release fixes a bug where the .rev file could fall out-of-sync with the MIDX and its bitmap, leading Git to report incorrect results when using a multi-pack bitmap. This happens when changing the object order of the MIDX without changing the set of objects tracked by the MIDX.

    If your .rev file has a modification time that is significantly older than the MIDX and .bitmap, you may have been bitten by this bug4. Luckily this bug can be resolved by dropping and regenerating your bitmaps5. To prevent a MIDX bitmap and its .rev file from falling out of sync again, the contents of the .rev are now included in the MIDX itself, forcing the MIDX’s checksum to change whenever the object order changes.

    [source]

The rest of the iceberg

That’s just a sample of changes from the latest release. For more, check out the release notes for 2.36, or any previous version in the Git repository.


  1. You can ask for other attributes, too, like %(objectsize:disk) which shows how many bytes it takes Git to store the object on disk (which can be smaller than %(objectsize) if, for example, the object is stored as a delta against some other, similar object). 
  2. This isn’t quite true, because of things like shallow and partial clones, along with grafts, but the assumption is good enough for our purposes here. What matters it that outside of scenarios where we expect to be missing objects, the only time we don’t have a reachability closure is when the repository itself is corrupt. 
  3. In Git parlance, this would be a packfile from a promisor remote
  4. This isn’t entirely fool-proof, since it’s possible way of detecting that this bug occurred, since it’s possible your bitmaps were rewritten after first falling out-of-sync. When this happens, it’s possible that the corrupt bitmaps are propagated forward when generating new bitmaps. You can use git rev-list --test-bitmap HEAD to check if your bitmaps are OK. 
  5. By first running rm -f .git/objects/pack/multi-pack-index*, and then
    git repack -d --write-midx --write-bitmap-index

Write prepared data directly into JDBC-supported destinations using AWS Glue DataBrew

Post Syndicated from Dhiraj Thakur original https://aws.amazon.com/blogs/big-data/write-prepared-data-directly-into-jdbc-supported-destinations-using-aws-glue-databrew/

AWS Glue DataBrew offers over 250 pre-built transformations to automate data preparation tasks (such as filtering anomalies, standardizing formats, and correcting invalid values) that would otherwise require days or weeks writing hand-coded transformations.

You can now write cleaned and normalized data directly into JDBC-supported databases and data warehouses without having to move large amounts of data into intermediary data stores. In just a few clicks, you can configure recipe jobs to specify the following output destinations: Amazon Redshift, Snowflake, Microsoft SQL Server, MySQL, Oracle Database, and PostgreSQL.

In this post, we walk you through how to connect and transform data from an Amazon Simple Storage Service (Amazon S3) data lake and write prepared data directly into an Amazon Redshift destination on the DataBrew console.

Solution overview

The following diagram illustrates our solution architecture.

In our solution, DataBrew queries sales order data from an Amazon S3 data lake and performs the data transformation. Then the DataBrew job writes the final output to Amazon Redshift.

To implement the solution, you complete the following high-level steps:

  1. Create your datasets.
  2. Create a DataBrew project with the datasets.
  3. Build a transformation recipe in DataBrew.
  4. Run the DataBrew recipe.

Prerequisites

To complete this solution, you should have an AWS account. Make sure you have the required permissions to create the resources required as part of the solution.

For our use case, we use a mock dataset. You can download the data files from GitHub.

Complete the following prerequisite steps:

  1. On the Amazon S3 console, upload all three CSV files to an S3 bucket.
  2. Create the Amazon Redshift cluster to capture the product wise sales data.
  3. Set up a security group for Amazon Redshift.
  4. Create a schema in Amazon Redshift if required. For this post, we use the existing public schema.

Create datasets

To create the datasets, complete the following steps:

  1. On the Datasets page of the DataBrew console, choose Connect new dataset.
  2. For Dataset name, enter a name (for example, order).
  3. Enter the S3 bucket path where you uploaded the data files as part of the prerequisites.
  4. Choose Select the entire folder.
  5. For Selected file type, select CSV.
  6. For CSV delimiter, choose Comma.
  7. For Column header values, select Treat first row as header.
  8. Choose Create dataset.

Create a project using the datasets

To create your DataBrew project, complete the following steps:

  1. On the DataBrew console, on the Projects page, choose Create project.
  2. For Project Name, enter order-proj.
  3. For Attached recipe, choose Create new recipe.

The recipe name is populated automatically.

  1. For Select a dataset, select My datasets.
  2. Select the order dataset.
  3. For Role name, choose the AWS Identity and Access Management (IAM) role to be used with DataBrew.
  4. Choose Create project.

You can see a success message along with our Amazon S3 order table with 500 rows.

After the project is opened, a DataBrew interactive session is created. DataBrew retrieves sample data based on your sampling configuration selection.

Build a transformation recipe

In a DataBrew interactive session, you can cleanse and normalize your data using over 250 pre-built transformations. In this post, we use DataBrew to perform a few transforms and filter only valid orders with order amounts greater than $0.

To do this, you perform the following steps:

  1. On the Column menu, choose Delete.
  2. For Source columns, choose the columns order_id, timestamp, and transaction_date.
  3. Choose Apply.
  4. We filter the rows based on an amount value greater than $0.
  5. Choose Add to recipe to add the condition as a recipe step.
  6. To perform a custom sort based on state, on the Sort menu, choose Ascending.
  7. For Source, choose state_name.
  8. Select Sort by custom values.
  9. Specify an ordered list of state names separated by commas.
  10. Choose Apply.

The following screenshot shows the full recipe that we applied to our dataset.

Run the DataBrew recipe job on the full data

Now that we have built the recipe, we can create and run a DataBrew recipe job.

  1. On the project details page, choose Create job.
  2. For Job name, enter product-wise-sales-job.
  3. For Output to, choose JDBC.
  4. For connection name, choose Browse.
  5. Choose Add JDBC connection.
  6. For Connection name, enter a name (for example, redshift-connection).
  7. Provide details like the host, database name, and login credentials of your Amazon Redshift cluster.
  8. In the Network options section, choose the VPC, subnet, and security groups of your Amazon Redshift cluster.
  9. Choose Create connection.
  10. Provide a table prefix with schema name (for example, public.product_wise_sales).
  11. For Role name, choose the IAM role to be used with DataBrew.
  12. Choose Create and run job.
  13. Navigate to the Jobs page and wait for the product-wise-sales-job job to complete.
  14. Navigate to the Amazon Redshift cluster to confirm the output table starts with product_wise_sales_*.

Clean up

Delete the following resources that might accrue cost over time:

  • The Amazon Redshift cluster
  • The recipe job product-wise-sales-job
  • Input files stored in your S3 bucket
  • The job output stored in your S3 bucket
  • The IAM roles created as part of projects and jobs
  • The DataBrew project order-proj and its associated recipe order-proj-recipe
  • The DataBrew datasets

Conclusion

In this post, we saw how to how to connect and transform data from an Amazon S3 data lake and create a DataBrew dataset. We also saw how easily we can bring data from a data lake into DataBrew, seamlessly apply transformations, and write prepared data directly into an Amazon Redshift destination.

To learn more, refer to the DataBrew documentation.


About the Author

Dhiraj Thakur is a Solutions Architect with Amazon Web Services. He works with AWS customers and partners to provide guidance on enterprise cloud adoption, migration, and strategy. He is passionate about technology and enjoys building and experimenting in the analytics and AI/ML space.

Amit Mehrotra is a Solution Architecture leader with Amazon Web Services. He leads an org that customers cloud journey.

How MarketAxess® uses AWS Developer Tools to create scalable and secure CI/CD pipelines

Post Syndicated from Aaron Lima original https://aws.amazon.com/blogs/devops/how-marketaxess-uses-aws-developer-tools-to-create-scalable-and-secure-ci-cd-pipelines/

Very often,  enterprise organizations strive to adopt modern DevOps practices, tofocus on governance and security without sacrificing development velocity. In this guest post, Prashant Joshi, Senior Cloud Engineer at MarketAxess, explains how they use the AWS Cloud Development Kit (AWS CDK), AWS CodePipeline, and AWS CodeBuild to simplify the developer experience by dynamically provisioning pipelines and maintaining governance at MarketAxess.

Problem Statement

MarketAxess is a financial technology company that operates an e-trading platform, for institutional credit markets. As MarketAxess adopted DevOps firm-wide, we struggled to ensure pipeline consistency. We had developers using static code analysis and linting, but it wasn’t enforced. As more teams began to adopt DevOps practices, the importance of providing consistency over code quality, security scanning, and artifact management grew. However, we were challenged with increasing our engineering workforce and implementing best practices in the various pipelines. As a small team, we needed a way to reliably manage and scale pipelines while reducing engineering overhead. We thought about the DevOps tenets, as well as the importance of automation, and we decided to build automation that would provision pipelines for development teams.  These pipelines included best practices for Continuous Integration and Continuous Deployment (CI/CD). We wanted to build this automation with self-service, so that teams can get started developing a solution to a business problem, without having to spend too much time around the CI/CD aspects of their projects.

We chose the AWS CDK to deploy AWS CodePipeline, AWS CodeBuild, and AWS Identity and Access Management (IAM) resources, and used an API webhook using AWS Lambda and Amazon API Gateway for integration. In this post, we provide an example of how these services can be used to create dynamic cross account CI/CD pipelines.

Solution

In developing our solution, we wanted to accomplish three main goals:

  1. Standardization and Governance of Pipelines – We wanted to ensure consistent practices in each team’s pipeline to make sure of code quality and security.
  2. Simplified Developer Interaction – We wanted developers to focus mainly on interacting with the code repository for their project.
  3. Improve Management of Dynamically Provisioned Pipelines – Knowing that we would need to make changes, improvements, and enhancements, we wanted tools and a process that was flexible.

We achieved these goals using AWS CDK to automate the creation of CodePipeline and define mandatory actions in the pipeline. We also created a webhook using API Gateway to integrate with our Bitbucket repositories to automatically trigger the automation. The pipelines can dynamically be provisioned or updated based on the YAML manifest file submitted to the repository. We process the manifest file with Amazon Elastic Container Service (Amazon ECS) Fargate tasks, because we had containerized the processing components using Docker. However, with the release of container support in Lambda, we are now considering this as a potential replacement. These pipelines run CI stages based on the programing language defined by development teams in the manifest file, and they deploy a tested versioned artifact to the corresponding environments via standard Software Defined Lifecycle (SDLC) practices. As a part of CI stages, we semantically version our code and tag our commits accordingly. This lets us trace commit to pipeline execution. The following architecture diagram shows a CloudFormation pipeline generated via AWS CDK.

CloudFormation Pipeline Architecture Diagram

The process flow is as follows:

  1. Developer pushes a change to the repository.
  2. A webhook is triggered when the Pull Request is merged that creates or modifies the pipeline based on the manifest file submitted to the repository.
  3. This triggers a Lambda function that performs the following:
    1. Clones the repository from Internally hosted BitBucket repos.
    2. Uploads the repository to the source Amazon Simple Storage Service (Amazon S3) bucket, which is encrypted using Customer Managed Keys (CMK) with the AWS Key Management Service (KMS).
    3. An ECS Task is run, and a manifest file is passed which gives the project parameters. Pipelines are built according to these project parameters.
  4. An ECS Task processes the metadata file and runs cdk Logic, finally it triggers the pipeline.
    1. As source code is progressed through the pipeline, the build stage output to the artifact bucket. Pipeline artifacts are encrypted with a CMK. The IAM roles in the target account only have access to this bucket.

Additionally, through the power of the IAM integration with CodePipeline, the team could implement session tags with IAM roles and Okta to make sure that independent teams only approve pipelines, which are owned by respective teams. Furthermore, we use attribute-based tags to protect the production environment from unauthorized actions, so that deployment to production can only come through the pipeline.

The AWS CDK-based pipelines let MarketAxess enable teams to independently build and obtain immediate feedback, while still centrally governing CI and CD patterns. The solution took six months of two DevOps engineers working full time to build the cdk structure and support for the core languages and their corresponding CI and CD stages. We continue to iterate on the cdk code base and pipelines, incorporating feedback from our development community to ensure developer satisfaction.

Simplified Developer Interaction

Although we were enforcing standards via the automation, we still wanted to give development teams autonomy through a simple mechanism. We wanted developers to interact with our pipeline creation process through a pipeline manifest file that they submitted to their repository. An example of the manifest file schema is in the following screenshot:

Manifest File Schema

As shown above, the manifest lets developers define custom application configurations, while preserving consistent quality gates. This manifest is checked in to source control, and upon a commit to the code repository it triggers our automation. This lets our pipelines mutate on manifest file changes, and it makes sure that the latest commit goes through the latest quality gates. Each repository gets its own pipeline, and, to maintain the security of the pipeline, we used IAM Session Tags with Okta. We tag each pipeline and its associated resources with a unique attribute that is mapped to the development team so that they only have access to their pipelines, and only authorized individuals may approve production deployments.

Using AWS CDK, AWS CodePipeline, and other AWS Services, we have been able to improve the stability and quality of the code being delivered. CodePipeline and AWS CDK have helped us develop a cloud native pipeline solution that meets our governance best practices and compliance requirements. We met our three goals, and we can iterate and change easily moving forward.

Conclusion

Organizations that achieve the automation and self-service ideals of DevOps can build, release, and deploy features and apps to users faster and at higher levels of quality. In this post, we saw a real-life example of using Infrastructure as Code with AWS CDK to build a service that helps maintain governance and helps developers get work done. Here are two other posts that demonstrate using AWS Service Catalog to create secure DevOps pipelines or DevOps pipelines that deploy containerized applications.


Prashant Joshi

Prashant Joshi

Prashant Joshi is a Senior Cloud Engineer working in the Cloud Foundation team at MarketAxess. MarketAxess is a registered trademark of MarketAxess Holdings Inc.

AWS Partner Network (APN) – 10 Years and Going Strong

Post Syndicated from Jeff Barr original https://aws.amazon.com/blogs/aws/aws-partner-network-apn-10-years-and-going-strong/

AWS 10 Years with animated flamesTen years ago we launched AWS Partner Network (APN) in beta form for our partners and our customers. In his post for the beta launch, my then-colleague Jinesh Varia noted that:

Partners are an integral part of the AWS ecosystem as they enable customers and help them scale their business globally. Some of our greatest wins, particularly with enterprises, have been influenced by our Partners.

A decade later, as our customers work toward digital transformation, their needs are becoming more complex. As part of their transformation they are looking for innovation, differentiating solutions, and routinely ask us to refer them to partners with the right skills and the specialized capabilities that will help them to make the best of use AWS services.

The partners, in turn, are stepping up to the challenge and driving innovation on behalf of their customers in ways that transform multiple industries. This includes migration of workloads, modernization of existing code & architectures, and the development of cloud-native applications.

Thank You, Partners
AWS Partners all around the world are doing amazing work! Integrators like Presidio in the US, NEC in Japan, Versent in Australia, T-Systems International in Germany, and Compasso UOL in Latin America are delivering some exemplary transformations on AWS. On the product side, companies like Megazone Cloud (Asia/Pacific) are partnering with global ISVs such as Databricks, Datadog, and New Relic to help them go to market. Many other ISV Partners are working to reinvent their offerings in order to take advantage of specific AWS services and features. The list of such partners is long, and includes Infor, VTEX, and Iron Mountain, to name a few.

In 2021, AWS and our partners worked together to address hundreds of thousands of customer opportunities. Partners like Snowflake, logz.io, and Confluent have told us that AWS Partner program such as ISV Accelerate and AWS Global Startup Program are having a measurable impact on their businesses.

These are just a few examples (we have many more success stories), but the overall trend should be pretty clear — transformation is essential, and AWS Partners are ready, willing, and able to make it happen.

As part of our celebration of this important anniversary, the APN Blog will be sharing a series of success stories that focus on partner-driven customer transformation!

A Decade of Partner-Driven Innovation and Evolution
We launched APN in 2012 with a few hundred partners. Today, AWS customers can choose offerings from more than 100,000 partners in more than 150 countries.

A lot of this growth can be traced back to our first Leadership Principle, Customer Obsession. Most of our services and major features have their origins in customer requests and APN is no different: we build programs that are designed to meet specific, expressed needs of our customers. Today, we continue to seek and listen to partner feedback, use that feedback to innovate and to experiment, and to get it to market as quickly as possible.

Let’s take a quick trip through history and review some of the most interesting APN milestones of the last decade:

In 2012, we first announced the partner type (Consulting and Technology) model when APN came to life. With each partner type, partners could qualify for one of the three tiers (Select, Advanced, and Premier) and achieve benefits based on their tier.

In 2013, AWS Partners told us they wanted to stand out in the industry. To allow partners to differentiate their offerings to customers and show expertise in building solutions, we introduced the first two of what is now a very long list of competencies.

In 2014, we launched the AWS Managed Service Provider Program to help customers find partners who can help with migration to the AWS cloud, along with the AWS SaaS Factory program to support partners looking to build and accelerate delivery of SaaS (Software as a Service) solutions on behalf of their customers. We also launched the APN Blog channel to bring partner success stories with AWS and customers to life. Today, the APN Blog is one of the most popular blogs at AWS.

Next in 2016, customers started to ask us where to go when looking for a partner that can help design, migrate, manage, and optimize their workloads on AWS, or for partner-built tools that can help them achieve their goals. To help them more easily find the right partner and solution for their specific business needs, we launched the AWS Partner Solutions Finder, a new website where customers could search for, discover, and connect with AWS Partners.

In 2017, to allow partners to showcase their earned AWS designations to customers, we introduced the Badge Manager. The dynamic tool allows partners to build customized AWS Partner branded badges to highlight their success with AWS to customers.

In 2018, we launched several new programs and features to better support our partners gain AWS expertise and promote their offerings to customers including AWS Device Qualification program, AWS Well-Architected Partner Program, and several competencies.

In 2019, for mid-to-late stage startups seeking support with product development, go-to-market and co-sell, we launched the AWS Global Startup program. We also launched the AWS Service Ready Program to help customers find validated partner products that work with AWS services.

Next, in 2020 to help organizations co-sell, drive new business and accelerate sales cycles we launched the AWS ISV Accelerate program.

In 2021 our partners told us that they needed more (and faster) ways to work with AWS so that they could meet the ever-growing needs of their customers. We launched AWS Partner Paths in order to accelerate partner engagement with AWS.

Partner Paths replace technology and consulting partner type models—evolving to an offering type model. We now offer five Partner Paths—Software Path, Hardware Path, Training Path, Distribution Path, and Services Path—which represents consulting, professional, managed, or value-add resale services. This new framework provides a curated journey through partner resources, benefits, and programs.

Looking Ahead
As I mentioned earlier, Customer Obsession is central to everything that we do at AWS. We see partners as our customers, and we continue to obsess over ways to make it easier and more efficient for them to work with us. For example, we continue to focus on partner specialization and have developed a deep understanding of the ways that our customers find it to be of value.

Our goal is to empower partners with tools that make it easy for them to navigate through our selection of enablement resources, benefits, and programs and find those that help them to showcase their customer expertise and to get-to-market with AWS faster than ever. The new AWS Partner Central (login required) and AWS Partner Marketing Central experiences that we launched earlier this year are part of this focus.

To wrap up, I would like to once again thank our partner community for all of their support and feedback. We will continue to listen, learn, innovate, and work together with you to invent the future!

Jeff;

Анализ на Social Europe. Превод на “Биволъ” Защо Европа не може да се освободи от газовото лоби

Post Syndicated from Екип на Биволъ original https://bivol.bg/%D0%B7%D0%B0%D1%89%D0%BE-%D0%B5%D0%B2%D1%80%D0%BE%D0%BF%D0%B0-%D0%BD%D0%B5-%D0%BC%D0%BE%D0%B6%D0%B5-%D0%B4%D0%B0-%D1%81%D0%B5-%D0%BE%D1%81%D0%B2%D0%BE%D0%B1%D0%BE%D0%B4%D0%B8-%D0%BE%D1%82-%D0%B3%D0%B0.html

понеделник 18 април 2022


Нападението над Украйна извади на показ зависимостта на Европейския съюз (ЕС) от руски нефт и газ. Вносът им директно финансира войната на (президента на Руската федерация – бел. ред.) Владимир…

The collective thoughts of the interwebz