Post Syndicated from The History Guy: History Deserves to Be Remembered original https://www.youtube.com/watch?v=ULKDrkxXrvw
Security updates for Tuesday
Post Syndicated from original https://lwn.net/Articles/894499/
Security updates have been issued by Debian (kicad and qemu), Fedora (thunderbird), Oracle (expat), Red Hat (samba), Slackware (kernel), and SUSE (firefox, ldb, and rsyslog).
A storytelling approach for engaging girls in the Computing classroom: Pilot study results
Post Syndicated from Katharine Childs original https://www.raspberrypi.org/blog/gender-balance-in-computing-storytelling-approach-engaging-girls/
We’ve been running the Gender Balance in Computing programme of research since 2019, as part of the National Centre for Computing Education (NCCE) and with various partners. It’s a £2.4 million research programme funded by the Department for Education in England that aims to identify ways to encourage more girls and young women to engage with Computing and choose to study it further. The programme is made up of four separate areas of research, in which we are running a number of interventions.

The first independent evaluation report from the Behavioural Insights Team (BIT) on our series of interventions has now been published. It relates to an intervention within the research area ‘Teaching Approach’, evaluating our pilot study of teaching computing to Key Stage 1 children using a storytelling approach. The evaluators from BIT found that this pilot study produced evidence of promise for the storytelling approach. They recommend conducting a full-size trial to test how effective this approach is for engaging female pupils with Computing.
Teaching computing through storytelling
Like many Computing curricula around the world, the English National Curriculum emphasises the importance of teaching Computing through a range of content so that pupils can express themselves and develop their ideas using digital tools. Our ‘Teaching Approach’ project builds on research grounded in sociocultural learning theories that suggest teaching approaches that encourage collaboration and use a variety of contexts can make Computing a more inclusive subject for all learners. Within this project, we are running three different interventions, each with learners of different ages.

Evidence indicates that gender stereotypes around Computing develop early (1). Therefore we designed a trial — the first of its kind in England — to explore a storytelling approach for teaching Computing with younger children (6- to 7-year-olds). A small body of research suggests that using storytelling as a learning context for Computing can be engaging for both boys and girls. Research results indicate that:
- Teaching computing through storytelling and story-writing is effective for motivating 11- to 14-year-old girls to learn programming (2)
- Children who write computer programs to tell stories see Computing as a subject that is equally as easy or difficult for both boys and girls (3)
- In a non-formal learning space, primary-aged girls are more likely to choose a storybook beginner electronics activity rather than open-ended beginner electronics free play (4)
The pilot study and the evaluation methods
As combining evidence from research with older students and in non-formal education is experimental, we designed this storytelling trial as a small pilot study. Our aim was to generate early evidence as to how feasible a teaching approach that uses storytelling might be in the primary Computing classroom.
We recruited 53 schools to take part in the pilot study, which ran from April to July 2021. Many schools were still facing challenges due to the ongoing coronavirus pandemic, and we are very grateful to the teachers and learners who have taken part for their contribution to this important research.

To conduct the study, we created a free online training course, and a scheme of work, for schools to teach Computing concepts to 6- and 7-year olds using a storytelling approach. Over a sequence of the 12 lessons in the scheme of work, pupils used the ScratchJr programming environment to animate their own digital stories and learn about Computing concepts, such as sequence and repetition, linked to elements of stories, such as structure, rhyme, and speech.
To enable the independent evaluation of the effectiveness of the storytelling approach by BIT, schools were allocated either to an intervention group, which used the training course and the storytelling scheme of work, or to a control group, which taught Computing in their usual way and was not made aware that the approach being trialled involved storytelling. For their evaluation, BIT gathered data from both groups to compare them:
- They conducted surveys measuring learners’ attitudes toward computing and their intentions to study it in the future
- They carried out observations of lessons, interviews with teachers, and discussions with learners
- They ran a survey to gather feedback about the trial from teachers
The gathered data was assessed against five categories: evidence of promise, fidelity, acceptability, feasibility, and readiness for trial.
Main findings of the evaluation team
After analysing the data collected from observations, interviews, learner discussions, pupil surveys, and teacher surveys, the key finding of the independent evaluators was that the storytelling teaching approach had evidence of promise, and that it is worthwhile scaling up our intervention for a larger trial with more schools.
The evaluators’ teacher interviews confirmed the early development of gender stereotypes in the classroom. This highlights the importance of introducing Computing to young learners in a way that engages both boys and girls.
“I’ve really noticed how there’s already differences in views of what’s a boy, what’s a girl, the boys are getting in front of me, like, ‘I want a boy car, I don’t want a girl car’. Then we’ve got the other side where we’ve got fairy tales and princesses and, ‘Oh, I’m a bunny. Do you want to play with me?’”
Teacher (evaluation report, p. 22)
Teachers told the evaluators that pupils enjoyed personalising their stories in ScratchJr, and that they themselves felt positive about the use of storytelling to teach computing.
“I think [the storytelling aspect] gives them something real to work through, so it’s not… abstract… I think through the storytelling, they’re able to make it as funny or whatever they want, and it’s also their own interest. [Female student], she dotes on animals, so she’s always having giraffes and all of that, so it’s something that they can make their own connections too… Yes, I did really like the storytelling.”
Teacher (evaluation report, p. 26)
Teacher feedback provided some evidence that the storytelling lessons had equally increased both male and female pupils’ interest, confidence, and skills.

The independent evaluation team advised caution when interpreting the quantitative data from the pupil surveys, due to the small sample size in this pilot study and the high attrition rates caused by coronavirus-related disruptions. We ourselves would like to add that the study raises questions about the reliability of quantitative survey data collected from very young children using Likert scales, BIT’s chosen survey format for this evaluation. Although the evaluators have made some positive steps in creating a new survey suitable for young children, this research instrument may need further testing; the survey results would need to be interpreted in this light, and more research in this area would be recommended.
You can read the full evaluation report on the NCCE website.
Future directions
This intervention was based on one of the teaching approaches for which there was only early evidence of effectiveness, so it is a good outcome to have a larger trial recommended based on our pilot study. It’s often said that research ends up recommending more research, but in this case our small pilot project really does give robust evidence that we should trial the storytelling approach with more schools.

The independent evaluators collected feedback from both teachers and pupils that confirms the storytelling intervention we designed is feasible in the classroom. The feedback also indicates where we can make small adjustments that will refine and develop the training and scheme of work for a larger-scale study (evaluation report, p. 35), and we will consider this feedback carefully. While some teachers suggested that the training be shortened, less experienced teachers highlighted the need to ensure the training introduces teachers to all of the content covered in the lessons. This feedback helps us to better understand how Computing is taught in primary schools, and how this is influenced by the wide variety of experience and subject knowledge that teachers have. Interestingly, in the control group, some of the teachers reported that they also introduced coding to their learners by having them create stories. We would like to conduct further research into how schools introduce young learners to programming, and we’ll be continuing to reflect on how best to offer flexible content for teacher training related to our research studies.
We’re now looking at how to continue to investigate the effectiveness of the storytelling approach through a larger trial, alongside other projects in which we’re exploring female engagement in computing education through our recently established Raspberry Pi Computing Education Research Centre.
More evaluations are on the way for our other studies in the Gender Balance in Computing programme, including:
- Two other trials of teaching approaches
- Interventions in non-formal education contexts
- Trials of approaches to building a sense of belonging in Computing
- Research into the impact of timetabling and options evenings
If you would like to stay up-to-date with the research programme, you can sign up to the Gender Balance in Computing newsletter. We will also post our reflections on the projects on this blog when the evaluations are completed.
1 Mulvey, K. L. and Irvin, M. J. (2018). Judgments and reasoning about exclusion from counter-stereotypic STEM career choices in early childhood. Early Child. Res. Q. 44, 220–230. https://doi.org/10.1016/j.ecresq.2018.03.016
2 Kelleher, C., Pausch, R. and Kiesler, S. (2007). Storytelling alice motivates middle school girls to learn computer programming. In CHI ’07: Proceedings of the SIGCHI Conference on Human Factors in Computing Systems, 1455–1464. Association for Computing Machinery, New York, NY, USA. https://doi.org/10.1145/1240624.1240844
3 Zaidi, R., Freihofer, I. and Childress Townsend, G. (2017). Using Scratch and Female Role Models while Storytelling Improves Fifth-Grade Students’ Attitudes toward Computing. In SIGCSE ’17: Proceedings of the 2017 ACM SIGCSE Technical Symposium on Computer Science Education, 791–792. Association for Computing Machinery, New York, NY, USA. https://doi.org/10.1145/3017680.3022451
4 McLean, M., & Harlow, D. (2017). Designing inclusive STEM activities: A comparison of playful interactive experiences across gender. In IDC ’17: Proceedings of the 2017 Conference on Interaction Design and Children, 567–574. Association for Computing Machinery, New York, NY, USA. https://doi.org/10.1145/3078072.3084326
The post A storytelling approach for engaging girls in the Computing classroom: Pilot study results appeared first on Raspberry Pi.
Фоторепортаж на “Биволъ” Хиляди с протестна блокада пред посолството на агресора на 9 май
Post Syndicated from Николай Марченко original https://bivol.bg/%D1%85%D0%B8%D0%BB%D1%8F%D0%B4%D0%B8-%D1%81-%D0%BF%D1%80%D0%BE%D1%82%D0%B5%D1%81%D1%82%D0%BD%D0%B0-%D0%B1%D0%BB%D0%BE%D0%BA%D0%B0%D0%B4%D0%B0-%D0%BF%D1%80%D0%B5%D0%B4-%D0%BF%D0%BE%D1%81%D0%BE%D0%BB.html
вторник 10 май 2022

Хиляди българи, украинци и руснаци са излязли на протестното митинг – шествие “ДНЕС! Не на руския фашизъм!” в понеделник, 9 май. Протестиращите се разходиха по необичайно дългия пешеходен маршрут от…
Poettering: Fitting Everything Together
Post Syndicated from original https://lwn.net/Articles/894396/
Lennart Poettering designs
his ideal desktop operating system in great detail:
First and foremost, I think the focus must be on an image-based
design rather than a package-based one. For robustness and security
it is essential to operate with reproducible, immutable images that
describe the OS or large parts of it in full, rather than operating
always with fine-grained RPM/dpkg style packages. That’s not to say
that packages are not relevant (I actually think they matter a
lot!), but I think they should be less of a tool for deploying code
but more one of building the objects to deploy.
McQueen: Evolving a GNOME strategy for 2022 and beyond
Post Syndicated from original https://lwn.net/Articles/894395/
Robert McQueen describes
some initiatives being taken by the GNOME Foundation to attract more
users and developers to the platform.
There are many different threats to free access to computing and
information in today’s world. The GNOME desktop and apps need to
give users convenient and reliable access to technology which works
similarly to the tools they already use everyday, but keeps them
and their data safe from surveillance, censorship, filtering or
just being completely cut off from the Internet. We believe that we
can seek both philanthropic and grant funding for this work. It
will make GNOME a more appealing and comprehensive offering for the
many people who want to protect their privacy.
Come join us at Cloudflare Connect New York this Thursday!
Post Syndicated from Jen Taylor original https://blog.cloudflare.com/cloudflare-connect-nyc-2022/


We take a break from Platform Week to share big news – we’re going to New York this week for our Cloudflare Connect customer event.
We’re packing our bags, getting on planes and heading to New York to do our first live customer event since 2019 and we could not be more excited. It is time with you – the people building, delivering and securing the apps and networks we know and trust – that are the inspiration for the innovation we deliver. We can’t wait to spend time with you.
Our co-founder and CEO Matthew Prince will kick off the day with his view from the top. We’ll then be breaking out into focused conversations to dig in on our latest product news and roadmaps.
Excited about what we’re talking about for Platform Week? Come chat with the Workers team in person and hear more about the roadmap.
Intrigued by the latest DDoS stats we posted and want to learn more? Meet with the team analyzing the attacks and learn about where we go from here.
Not sure where to start your Zero Trust journey? We’ll talk you through what we’re seeing and introduce you to other customers who are in the process of rolling out Zero Trust solutions for their teams so you can learn from each other.
Don’t miss it! Register now – use the code BetterInternet to join us in-person for free. Not in New York? No worries – we’re coming to London, Sydney and San Francisco later this year.
[$] Dealing with negative dentries
Post Syndicated from original https://lwn.net/Articles/894098/
The problem of negative dentries accumulating in the dentry cache in an
unbounded manner, as we looked at back in
April, came up at the
2022 Linux Storage,
Filesystem, Memory-management and BPF Summit (LSFMM).
Negative dentries reflect failed file-name lookups, which are then cached,
saving an expensive operation if the file name in question is looked up
again. There is no mechanism to proactively prune back those cache
entries, however, so the cache keeps growing until memory pressure finally
causes the system to forcibly evict some of them, which can make the system
unresponsive for a long time or even cause a soft lockup.
Build a big data Lambda architecture for batch and real-time analytics using Amazon Redshift
Post Syndicated from Jagadish Kumar original https://aws.amazon.com/blogs/big-data/build-a-big-data-lambda-architecture-for-batch-and-real-time-analytics-using-amazon-redshift/
With real-time information about customers, products, and applications in hand, organizations can take action as events happen in their business application. For example, you can prevent financial fraud, deliver personalized offers, and identify and prevent failures before they occur in near real time. Although batch analytics provides abilities to analyze trends and process data at scale that allow processing data in time intervals (such as daily sales aggregations by individual store), real-time analytics is optimized for low-latency analytics, ensuring that data is available for querying in seconds. Both paradigms of data processing operate in silos, which results in data redundancy and operational overhead to maintain them. A big data Lambda architecture is a reference architecture pattern that allows for the seamless coexistence of the batch and near-real-time paradigms for large-scale data for analytics.
Amazon Redshift allows you to easily analyze all data types across your data warehouse, operational database, and data lake using standard SQL. In this post, we collect, process, and analyze data streams in real time. With data sharing, you can share live data across Amazon Redshift clusters for read purposes with relative security and ease out of the box. In this post, we discuss how we can harness the data sharing ability of Amazon Redshift to set up a big data Lambda architecture to allow both batch and near-real-time analytics.
Solution overview
Example Corp. is a leading electric automotive company that revolutionized the automotive industry. Example Corp. operationalizes the connected vehicle data and improves the effectiveness of various connected vehicle and fleet use cases, including predictive maintenance, in-vehicle service monetization, usage-based insurance. and delivering exceptional driver experiences. In this post, we explore the real-time and trend analytics using the connected vehicle data to illustrate the following use cases:
- Usage-based insurance – Usage-based insurance (UBI) relies on analysis of near-real-time data from the driver’s vehicle to access the risk profile of the driver. In addition, it also relies on the historical analysis (batch) of metrics (such as the number of miles driven in a year). The better the driver, the lower the premium.
- Fleet performance trends – The performance of a fleet (such as a taxi fleet) relies on the analysis of historical trends of data across the fleet (batch) as well as the ability to drill down to a single vehicle within the fleet for near-real-time analysis of metrics like fuel consumption or driver distraction.
Architecture overview
In this section, we discuss the overall architectural setup for the Lambda architecture solution.
The following diagram shows the implementation architecture and the different computational layers:
- Data ingestion from AWS IoT Core
- Batch layer
- Speed layer
- Serving layer

Data ingestion
Vehicle telemetry data is ingested into the cloud through AWS IoT Core and routed to Amazon Kinesis Data Streams. The Kinesis Data Streams layer acts as a separation layer for the speed layer and batch layer, where the incoming telemetry is consumed by the speed layer’s Amazon Redshift cluster and Amazon Kinesis Data Firehose, respectively.
Batch layer
Amazon Kinesis Data Firehose is a fully managed service that can batch, compress, transform, and encrypt your data streams before loading them into your Amazon Simple Storage Service (Amazon S3) data lake. Kinesis Data Firehose also allows you to specify a custom expression for the Amazon S3 prefix where data records are delivered. This provides the ability to filter the partitioned data and control the amount of data scanned by each query, thereby improving performance and reducing cost.
The batch layer persists data in Amazon S3 and is accessed directly by an Amazon Redshift Serverless endpoint (serving layer). With Amazon Redshift Serverless, you can efficiently query and retrieve structured and semistructured data from files in Amazon S3 without having to load the data into Amazon Redshift tables.
The batch layer can also optionally precompute results as batch views from the immutable Amazon S3 data lake and persist them as either native tables or materialized views for very high-performant use cases. You can create these precomputed batch views using AWS Glue, Amazon Redshift stored procedures, Amazon Redshift materialized views, or other options.
The batch views can be calculated as:
In this solution, we build a batch layer for Example Corp. for two types of queries:
- rapid_acceleration_by_year – The number of rapid accelerations by each driver aggregated per year
- total_miles_driven_by_year – The total number of miles driven by the fleet aggregated per year
For demonstration purposes, we use Amazon Redshift stored procedures to create the batch views as Amazon Redshift native tables from external tables using Amazon Redshift Spectrum.
Speed layer
The speed layer processes data streams in real time and aims to minimize latency by providing real-time views into the most recent data.
Amazon Redshift Streaming Ingestion uses SQL to connect with one or more Kinesis data streams simultaneously. The native streaming ingestion feature in Amazon Redshift lets you ingest data directly from Kinesis Data Streams and enables you to ingest hundreds of megabytes of data per second and query it at exceptionally low latency—in many cases only 10 seconds after entering the data stream.
The speed cluster uses materialized views to materialize a point-in-time view of a Kinesis data stream, as accumulated up to the time it is queried. The real-time views are computed using this layer, which provide a near-real-time view of the incoming telemetry stream.
The speed views can be calculated as a function of recent data unaccounted for in the batch views:
We calculate the speed views for these batch views as follows:
- rapid_acceleration_realtime – The number of rapid accelerations by each driver for recent data not accounted for in the batch view
rapid_acceleration_by_month - miles_driven_realtime – The number of miles driven by each driver for recent data not in
miles_driven_by_month
Serving layer
The serving layer comprises an Amazon Redshift Serverless endpoint and any consumption services such as Amazon QuickSight or Amazon SageMaker.
Amazon Redshift Serverless (preview) is a serverless option of Amazon Redshift that makes it easy to run and scale analytics in seconds without the need to set up and manage data warehouse infrastructure. With Amazon Redshift Serverless, any user—including data analysts, developers, business professionals, and data scientists—can get insights from data by simply loading and querying data in the data warehouse.
Amazon Redshift data sharing enables instant, granular, and fast data access across Amazon Redshift clusters without the need to maintain redundant copies of data.
The speed cluster provides outbound data shares of the real-time materialized views to the Amazon Redshift Serverless endpoint (serving cluster).
The serving cluster joins data from the batch layer and speed layer to get near-real-time and historical data for a particular function with minimal latency. The consumption layer (such as Amazon API Gateway or QuickSight) is only aware of the serving cluster, and all the batch and stream processing is abstracted from the consumption layer.
We can view the queries to the speed layer from data consumption layer as follows:
Deploy the CloudFormation template
We have provided an AWS CloudFormation template to demonstrate the solution. You can download and use this template to easily deploy the required AWS resources. This template has been tested in the us-east-1 Region.
The template requires you to provide the following parameters:
- DatabaseName – The name of the first database to be created for speed cluster
- NumberOfNodes – The number of compute nodes in the cluster.
- NodeType – The type of node to be provisioned
- MasterUserName – The user name that is associated with the master user account for the cluster that is being created
- MasterUserPassword – The password that is associated with the master user account
- InboundTraffic – The CIDR range to allow inbound traffic to the cluster
- PortNumber – The port number on which the cluster accepts incoming connections
- SQLForData – The source query to extract from AWS IOT Core topic
Prerequisites
When setting up this solution and using your own application data to push to Kinesis Data Streams, you can skip setting up the IoT Device Simulator and start creating your Amazon Redshift Serverless endpoint. This post uses the simulator to create related database objects and assumes use of the simulator in the solution walkthrough.
Set up the IoT Device Simulator
We use the IoT Device simulator to generate and simulate vehicle IoT data. The solution allows you to create and simulate hundreds of connected devices, without having to configure and manage physical devices or develop time-consuming scripts.
Use the following CloudFormation template to create the IoT Device Simulator in your account for trying out this solution.
Configure devices and simulations
To configure your devices and simulations, complete the following steps:
- Use the login information you received in the email you provided to log in to the IoT Device Simulator.
- Choose Device Types and Add Device Type.
- Choose Automotive Demo.
- For Device type name, enter
testVehicles. - For Topic, enter the topic where the sensor data is sent to AWS IoT Core.

- Save your settings.
- Choose Simulations and Add simulation.
- For Simulation name, enter
testSimulation. - For Simulation type¸ choose Automotive Demo.
- For Select a device type¸ choose the device type you created (
testVehicles). - For Number of devices, enter
15.

You can choose up to 100 devices per simulation. You can configure a higher number of devices to simulate large data.
- For Data transmission interval, enter
1. - For Data transmission duration, enter
300.
This configuration runs the simulation for 5 minutes.
- Choose Save.


Now you’re ready to simulate vehicle telemetry data to AWS IoT Core.
Create an Amazon Redshift Serverless endpoint
The solution uses an Amazon Redshift Serverless endpoint as the serving layer cluster. You can set up Amazon Redshift Serverless in your account.
Set up Amazon Redshift Query Editor V2
To query data, you can use Amazon Redshift Query Editor V2. For more information, refer to Introducing Amazon Redshift Query Editor V2, a Free Web-based Query Authoring Tool for Data Analysts.
Get namespaces for the provisioned speed layer cluster and Amazon Redshift Serverless
Connect to speed-cluster-iot (the speed layer cluster) through Query Editor V2 and run the following SQL:
Similarly, connect to the Amazon Redshift Serverless endpoint and get the namespace:
You can also get this information via the Amazon Redshift console.
Now that we have all the prerequisites set up, let’s go through the solution walkthrough.
Implement the solution
The workflow includes the following steps:
- Start the IoT simulation created in the previous section.
The vehicle IoT is simulated and ingested through IoT Device Simulator for the configured number of vehicles. The raw telemetry payload is sent to AWS IoT Core, which routes the data to Kinesis Data Streams.
At the batch layer, data is directly put from Kinesis Data Streams to Kinesis Data Firehose, which converts the data to parquet and delivers to Amazon with the prefix s3://<Bucketname>/vehicle_telematics_raw/year=<>/month=<>/day=<>/.
- When the simulation is complete, run the pre-created AWS Glue crawler
vehicle_iot_crawleron the AWS Glue console.
The serving layer Amazon Redshift Serverless endpoint can directly access data from the Amazon S3 data lake through Redshift Spectrum external tables. In this demo, we compute batch views through Redshift Spectrum and store them as Amazon Redshift tables using Amazon Redshift stored procedures.
- Connect to the Amazon Redshift Serverless endpoint through Query Editor V2 and create the stored procedures using the following SQL script.
- Run the two stored procedures to create the batch views:
The two stored procedures create batch views as Amazon Redshift native tables:
-
batchlayer_rapid_acceleration_by_yearbatchlayer_total_miles_by_year
You can also schedule these stored procedures as batch jobs. For more information, refer to Scheduling SQL queries on your Amazon Redshift data warehouse.
At the speed layer, the incoming data stream is read and materialized by the speed layer Amazon Redshift cluster in the materialized view vehicleiotstream_mv.
- Connect to the provisioned
speed-cluster-iotand run the following SQL script to create the required objects.
Two real-time views are created from this materialized view:
-
batchlayer_rapid_acceleration_by_yearbatchlayer_total_miles_by_year
- Refresh the materialized view
vehicleiotstream_mvat the required interval, which triggers Amazon Redshift to read from the stream and load data into the materialized view.
Refreshes are currently manual, but can be automated using the query scheduler.
The real-time views are shared as an outbound data share by the speed cluster to the serving cluster.
- Connect to
speed-cluster-iotand create an outbound data share (producer) with the following SQL: - Connect to
speed-cluster-iotand create an inbound data share (consumer) with the following SQL:
Now that the real-time views are available for the Amazon Redshift Serverless endpoint, we can run queries to get real-time metrics or historical trends with up-to-date data by accessing the batch and speed layers and joining them using the following queries.
For example, to calculate total rapid acceleration by year with up-to-the-minute data, you can run the following query:
Similarly, to calculate total miles driven by year with up-to-the-minute data, run the following query:
For only access to real-time data to power daily dashboards, you can run queries against real-time views shared to your Amazon Redshift Serverless cluster.
For example, to calculate the average speed per trip of your fleet, you can run the following SQL:
Because this demo uses the same data as a quick start, there are duplicates in this demonstration. In actual implementations, the serving cluster manages the data redundancy and duplication by creating views with date predicates that consume non-overlapping data from batch and real-time views and provide overall metrics to the consumption layer.
You can consume the data with QuickSight for dashboards, with API Gateway for API-based access, or via the Amazon Redshift Data API or SageMaker for AI and machine learning (ML) workloads. This is not included as part of the provided CloudFormation template.
Best practices
In this section, we discuss some best practices and lessons learned when using this solution.
Provisioned vs. serverless
The speed layer is a continuous ingestion layer reading data from the IoT streams often running 24/7 workloads. There is less idle time and variability in the workloads and it is advantageous to have a provisioned cluster supporting persistent workloads that can scale elastically.
The serving layer can be provisioned (in case of 24/7 workloads) or Amazon Redshift Serverless in case of sporadic or ad hoc workloads. In this post, we assumed sporadic workloads, so serverless is the best fit. In addition, the serving layer can house multiple Amazon Redshift clusters, each consuming their data share and serving downstream applications.
RA3 instances for data sharing
Amazon Redshift RA3 instances enable data sharing to allow you to securely and easily share live data across Amazon Redshift clusters for reads. You can combine the data that is ingested in near-real time with the historical data using the data share to provide personalized driving characteristics to determine the insurance recommendation.
You can also grant fine-grained access control to the underlying data in the producer to the consumer cluster as needed. Amazon Redshift offers comprehensive auditing capabilities using system tables and AWS CloudTrail to allow you to monitor the data sharing permissions and usage across all the consumers and revoke access instantly when necessary. The permissions are granted by the superusers from both the producer and the consumer clusters to define who gets access to what objects, similar to the grant commands used in the earlier section. You can use the following commands to audit the usage and activities for the data share.
Track all changes to the data share and the shared database imported from the data share with the following code:
Track data share access activity (usage), which is relevant only on the producer, with the following code:
Pause and Resume
You can pause the producer cluster when batch processing is complete to save costs. The pause and resume actions on Amazon Redshift allow you to easily pause and resume clusters that may not be in operation at all times. It allows you to create a regularly-scheduled time to initiate the pause and resume actions at specific times or you can manually initiate a pause and later a resume. Flexible on-demand pricing and per-second billing gives you greater control of costs of your Redshift compute clusters while maintaining your data in a way that is simple to manage.
Materialized views for fast access to data
Materialized views allow pre-composed results from complex queries on large tables for faster access. The producer cluster exposes data as materialized views to simplify access for the consumer cluster. This also allows flexibility at the producer cluster to update the underlying table structure to address new business use cases, without affecting consumer-dependent queries and enabling a loose coupling.
Conclusion
In this post, we demonstrated how to process and analyze large-scale data from streaming and batch sources using Amazon Redshift as the core of the platform guided by the Lambda architecture principles.
You started by collecting real-time data from connected vehicles, and storing the streaming data in an Amazon S3 data lake through Kinesis Data Firehose. The solution simultaneously processes the data for near-real-time analysis through Amazon Redshift streaming ingestion.
Through the data sharing feature, you were able to share live, up-to-date data to an Amazon Redshift Serverless endpoint (serving cluster), which merges the data from the speed layer (near-real time) and batch layer (batch analysis) to provide low-latency access to data from near-real-time analysis to historical trends.
Click here to get started with this solution today and let us know how you implemented this solution in your organization through the comments section.
About the Authors
 Jagadish Kumar is a Sr Analytics Specialist Solutions Architect at AWS. He is deeply passionate about Data Architecture and helps customers build analytics solutions at scale on AWS. He is an avid college football fan and enjoys reading, watching sports and riding motorcycle.
 Thiyagarajan Arumugam is a Big Data Solutions Architect at Amazon Web Services and designs customer architectures to process data at scale. Prior to AWS, he built data warehouse solutions at Amazon.com. In his free time, he enjoys all outdoor sports and practices the Indian classical drum mridangam.
 Eesha Kumar is an Analytics Solutions Architect with AWS. He works with customers to realize business value of data by helping them building solutions leveraging AWS platform and tools.
Debugging AWS Step Functions executions with the new console experience
Post Syndicated from Benjamin Smith original https://aws.amazon.com/blogs/compute/debugging-aws-step-functions-executions-with-the-new-console-experience/
Today, AWS Step Functions introduces a new opt-in console experience that makes it easier to analyze, debug, and optimize Standard Workflows.
Builders create Step Functions workflows to orchestrate multiple services into business-critical applications with minimal code. Customers wanted better ways to debug workflow executions and analyze the payload as it passes through each state.
This blog post explains the new capabilities of the enhanced Step Functions executions page. It shows how to debug workflows quickly, sort and filter on state events, and view the input and output path processing for each state.
Overview
The new Executions Details page allows you to inspect executions using three different view types: Graph view, Table view, and Event view. It has multi-level navigation enhancements for analyzing the map state feature, the ability to search execution history based on unique attributes and improved events, and table navigation with filtering, sorting, and pagination. For a full list of all the feature enhancements, see the Step Functions documentation.
Getting started
To get started, go to the Step Functions state machines page in the AWS Management Console:
- Choose any standard workflow from the list.
- From the workflows executions list page, choose an execution to analyze.
- Choose the New executions page button:

An enhanced execution summary section at the top of the page contains some new information:

- You can copy the execution ARN to the clipboard by choosing the copy icon.
- This section now shows the number of state transitions for the execution. This is helpful in optimizing the cost of your workflows. With Step Functions, you pay for the number of state transitions used per month for each state transition over the AWS Free Tier.
- You can view the total execution duration.
The following execution summary is a new section that displays execution errors. This helps to find the root cause of any workflow faults or failures:

Choosing the between execution views
The following examples show how to use the new execution views to inspect a workflow execution. This example focuses on the Order Processing Workflow that powers Serverlesspresso. Serverlesspresso is an interactive serverless application showcased at AWS re:Invent and AWS Summits. It allows attendees to order coffee from their smartphones. Each order starts a workflow execution.
Graph view
The graph view provides a visual representation of the workflow execution path. It shows which states succeeded, failed, or are currently in progress, and any errors caught. The legend at the bottom of the graph helps to decode each color.
To access the Graph view, choose the Graph view from the view navigation, as shown in the following screenshot. There is a new option to render the graph vertically or horizontally, which you can choose from the Layout option.
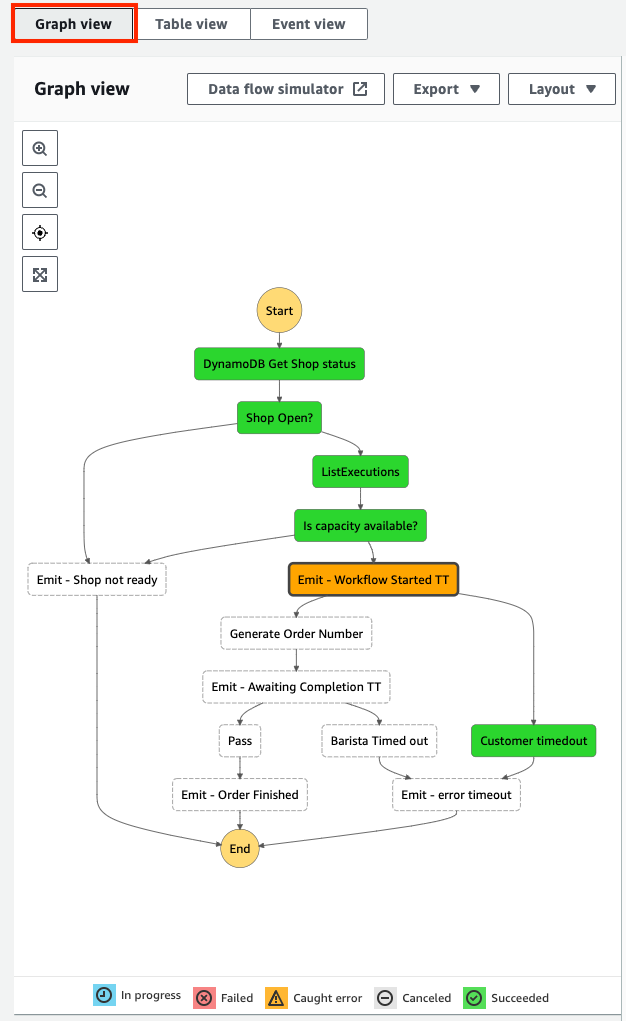
The graph view shows that the workflow caught an error at the Emit–Workflow Started TT state. I choose this state from the graph to view more details about it.
The Events tab
Each state in a workflow execution moves through a sequence of events, from TaskStateEntered to TaskStateExited. The Events tab, shown in the following image, displays all the events for the selected state, with their corresponding timestamp.
You can drill down into an event to see its output. In this case, the TaskTimedOut event happens to the selected state with the error message “States.Timeout”. This corresponds with the Caught error shown in the Graph view.

The Input & Output tab
Amazon States Language (ASL) enables you to filter and manipulate data at various stages of a workflow state’s execution using paths. A path is a string beginning with $ that lets you identify and filter subsets of JSON text. Learning how to apply these filters helps to build efficient workflows with minimal state transitions.
Select the Input & Output tab, and then toggle the Advanced view option to display the payload after each path process is applied.

This is useful for checking what each JSON path evaluates to. For example, the following images show how I configure the state Parameters, along with the Task input. This is what the parameters evaluate to after Step Functions applies the JSON path processing:

State Details and Definition tabs
The new execution page lets you view a state’s definition and execution details in isolation from the other states. The task details section contains additional information such as the Duration, Heartbeat, Started After and Timeout values.
Table view
The Table view provides a tabular representation of each state. Use this view to access information quickly about a state’s duration, resources, or status. A new timeline column shows the relative duration that each state took to complete. You can configure which columns are displayed.

To search and filter the table based on unique attributes such as state name or error type, start typing into the search input. Use the predictive autocomplete to define the search criteria. You can also choose a relative or absolute time range to filter by.

Event view
Step Functions stores all changes to state as a sequence of events to give you more visibility into the execution. The event view allows you to find and investigate a particular state event quickly by using the search and sort options:

- Choose the Timestamp column header to list events in reverse order of occurrence.
- Choose the arrow in the left-most column to reveal more details about each event
- Use the search input to search by keyword, state name, event type, or attribute.
- The date button lets you filter events by date or time.
Map State
The map state (“Type”: “Map”) allows you to run a set of steps for each element of an input array. The Step Functions execution page now helps you investigate and debug workflows using the Map state with the following enhancements:
- A hierarchical table view of steps for each iteration.
- An integrations overview, showing the execution summary at a glance.
- A paginated list of every event across all iterations.
The following Serverlesspresso workflow processes orders in batches. The map state iterates over each order, sanitizes each item, and checks it is currently in stock. If the item is not in stock, the map state throws a failure. If it is in stock, the order is recorded to a database, and a new event is emitted onto the serverless event bus.

The workflow runs for a new batch of orders and produces the following executions results page:
Using the Graph view:
- You can step through each iteration using the Map iteration viewer
- See the summary status in the iterations overview section

The Table view shows a hierarchical list of each iteration and I can drill down into the execution that failed to investigate further.

Use the Event view to search for failed executions to quickly filter the results:

Conclusion
Today, Step Functions is launching a new opt-in console experience to help builders analyse, debug, and optimize Step Functions Standard Workflows. These enhancements include three different ways to view your workflow executions, better visibility into workflows that use the Map state, fast access to workflow faults and failures, and new tools to search and sort workflow executions. This blog post shows how to use the new views to debug workflows, sort and filter on state events, and view the input and output path processing for each state.
The new console executions experience is generally available in AWS Regions where Step Functions is available.
For more information on building applications with Step Functions, visit serverlessland.com.
Active Exploitation of F5 BIG-IP iControl REST CVE-2022-1388
Post Syndicated from Ron Bowes original https://blog.rapid7.com/2022/05/09/active-exploitation-of-f5-big-ip-icontrol-rest-cve-2022-1388/

On May 4, 2022, F5 released an advisory listing several vulnerabilities, including CVE-2022-1388, a critical authentication bypass that leads to remote code execution in iControl REST with a CVSSv3 base score of 9.8.
The vulnerability affects several different versions of BIG-IP prior to 17.0.0, including:
- F5 BIG-IP 16.1.0 – 16.1.2 (patched in 16.1.2.2)
- F5 BIG-IP 15.1.0 – 15.1.5 (patched in 15.1.5.1)
- F5 BIG-IP 14.1.0 – 14.1.4 (patched in 14.1.4.6)
- F5 BIG-IP 13.1.0 – 13.1.4 (patched in 13.1.5)
- F5 BIG-IP 12.1.0 – 12.1.6 (no patch available, will not fix)
- F5 BIG-IP 11.6.1 – 11.6.5 (no patch available, will not fix)
On Monday, May 9, 2022, Horizon3 released a full proof of concept, which we successfully executed to get a root shell. Other groups have developed exploits as well.
Over the past few days, BinaryEdge has detected an increase in scanning and exploitation for F5 BIG-IP. Others on Twitter have also observed exploitation attempts. Due to the ease of exploiting this vulnerability, the public exploit code, and the fact that it provides root access, exploitation attempts are likely to increase.
Widespread exploitation is somewhat mitigated by the small number of internet-facing F5 BIG-IP devices, however; our best guess is that there are only about 2,500 targets on the internet.
Mitigation guidance
F5 customers should patch their BIG-IP devices as quickly as possible using F5’s upgrade instructions. Additionally, the management port for F5 BIG-IP devices (and any similar appliance) should be tightly controlled at the network level — only authorized users should be able to reach the management interface at all.
F5 also provides a workaround as part of their advisory. If patching and network segmentation are not possible, the workaround should prevent exploitation. We always advise patching rather than relying solely on workarounds.
Exploit attempts appear in at least two different log files:
- /var/log/audit
- /var/log/restjavad-audit.0.log
Because this vulnerability is a root compromise, successful exploitation may be very difficult to recover from. At a minimum, affected BIG-IP devices should be rebuilt from scratch, and certificates and passwords should be rotated.
Rapid7 customers
InsightVM and Nexpose customers can assess their exposure to CVE-2022-1388 with an authenticated vulnerability check in the May 5, 2022 content release. This release also includes authenticated vulnerability checks for additional CVEs in F5’s May 2022 security advisory.
Additional reading:
Benefits of migrating to event-driven architecture
Post Syndicated from Talia Nassi original https://aws.amazon.com/blogs/compute/benefits-of-migrating-to-event-driven-architecture/
Two common options when building applications are request-response and event-driven architecture. In request-response architecture, an application’s components communicate via API calls. The client sends a request and expects a response before performing the next task. In event-driven architecture, the client generates an event and can immediately move on to its next task. Different parts of the application then respond to the event as needed.

In this post, you learn about reasons to consider moving from request-response architecture to an event-driven architecture.
Challenges with request-response architecture
When starting to a build a new application, many developers default to a request-response architecture. A request-response architecture may tightly integrate components and those components communicate via synchronous calls. While a request-response approach is often easier to get started with, it can become challenging as your application grows in complexity.
In this post, I review an example request-response ecommerce application and demonstrate the challenges of tightly coupled integrations. Then I show you how building the same application with an event-driven architecture can give you increased scalability, fault tolerance, and developer velocity.
Close coordination between microservices
In a typical ecommerce application that uses a synchronous API, the client makes a request to place an order and the order service sends the request downstream to an invoice service. If successful, the order service responds with a success message or confirmation number.
In this initial stage, this is a straightforward connection between the two services. The challenge comes when you add more services that integrate with the order service.
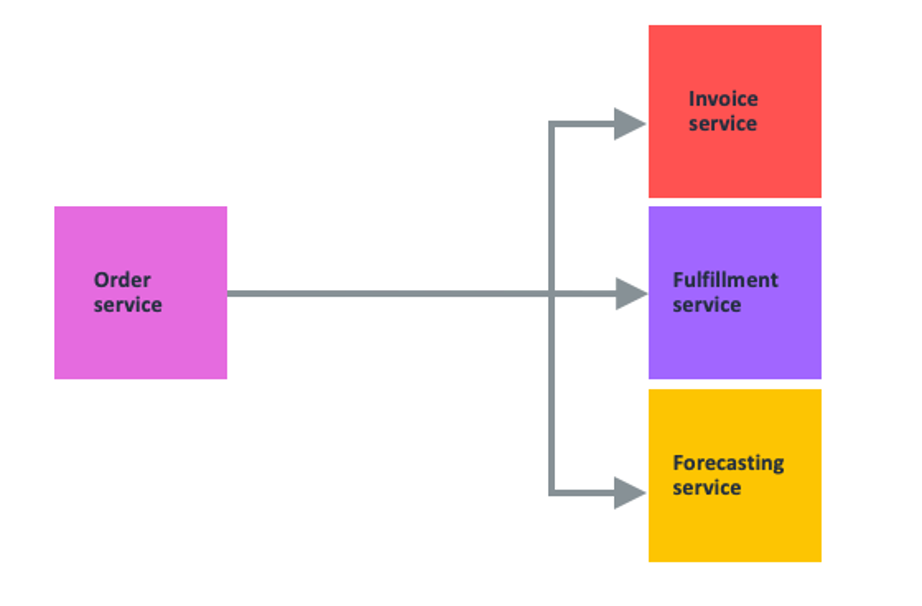
If you add a fulfillment service and a forecasting service, the order service has more responsibilities and more complexity. The order service must know how to call each service’s API, from the API call structure to the API’s retry semantics. If there are any backwards incompatible changes to the APIs, the order service team must update them. The system forwards heavy traffic spikes to the order service’s dependency, which may not have the same scaling capabilities. Also, dependent services may transmit errors back up the stack to the client.
Error handling and retries
Now, you add new downstream services for fulfillment and shipping orders to the ecommerce application.
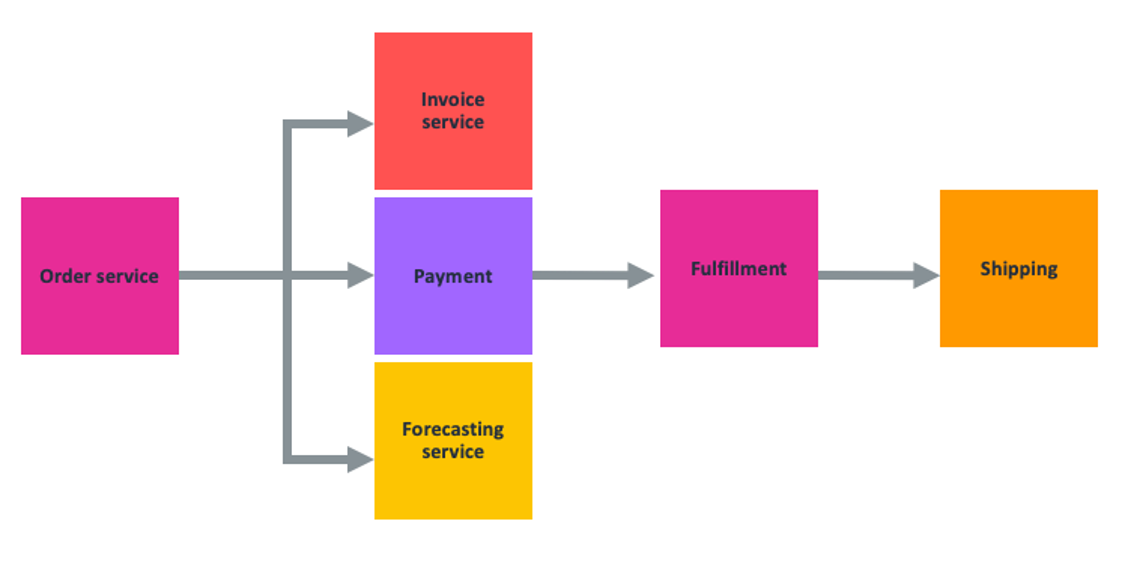
In the happy path, everything works as expected: The order service triggers invoicing, payment systems, and updates forecasting. Once payment clears, this triggers the fulfillment and packing of the order, and then informs the shipping service to request tracking information.
However, if the fulfillment center cannot find the product because they are out of stock, then fulfillment might have to alert the invoice service, then reverse the payment or issue a refund. If fulfillment fails, then the system that triggers shipping might fail as well. Forecasting must also be updated to reflect the change. This remediation workflow is all just to address one of the many potential “unhappy paths” that can occur in this API-driven ecommerce application.
Close coordination between development teams
In a synchronously integrated application, teams must coordinate any new services that are added to the application. This can slow down each development team’s ability to release new features. Imagine your team works on the payment service but you weren’t told that another team added a new rewards service. What now happens when the fulfillment service errors?
Fulfillment may orchestrate all the other services. Your payments team gets a message and you undo the payment, but you may not know who handles retries and error logic. If the rewards service changes vendors and has a new API, and does not tell your team, you may not be aware of the new service.
Ultimately, it can be hard to coordinate these orchestrations and workflows as systems become more complex and management adds more services. This is one reason that it can be beneficial to migrate to event-driven architecture.
Benefits of event-driven architecture
Event-driven architecture can help solve the problems of the close coordination of microservices, error handling and retries, and coordination between development teams.
Close coordination between microservices
In event-driven architecture, the publisher emits an event, which is acknowledged by the event bus. The event bus routes events to subscribers, which process events with self-contained business logic. There is no direct communication between publishers and subscribers.
Decoupled applications enable teams to act more independently, which can increase their velocity. For example, with an API-based integration, if your team wants to know about a change that happened in another team’s microservice, you might have to ask that team to make an API call to your service. Consequently, you may have to account for authentication, coordination with the other team over the structure of the API call. This causes back and forth between teams, which slows down development time. With an event-driven application, you can subscribe to events sent from your microservice and the event bus (for example, Amazon EventBridge) takes care of routing the event and handling authentication.
Error handling and retries
Another reason to migrate to event-driven architecture is to handle unpredictable traffic. Ecommerce websites like Amazon.com have variable amounts of traffic depending on the day. Once you place an order, several things happen.
First, Amazon checks your credit card to make sure that funds are available. Then, Amazon has to pack the merchandise and load onto trucks. That all happens in an Amazon fulfillment center. There is no synchronous API call for the Amazon backend to package and ship products. After the system confirms your payment, the front end puts together some information describing the event and puts your account number, credit card info, and what you bought in a packaged event and put it into the cloud and onto a queue. Later, another piece of software removes the event from the queue and starts the packaging and shipping.
The key point about this process is that these processes can all run at different rates. Normally, the rate at which customers place orders and the rate at which the warehouses can get the boxes packed are roughly equivalent. However, on busy days like Prime Day, customers place orders much more quickly than the warehouses can operate.
Ecommerce applications, like Amazon.com, must be able to scale up to handle unpredictable traffic. When a customer places an order, an event bus like Amazon EventBridge receives the event and all of the downstream microservices are able to select the order event for processing. Because each of the microservices can fail independently, there are no single points of failure.
Loose coordination between development teams
Event-driven architectures promote development team independence due to loose coupling between publishers and subscribers. Applications can subscribe to events with routing requirements and business logic that are separate from the publisher and other subscribers. This allows publishers and subscribers to change independently of each other, providing more flexibility to the overall architecture.
Decoupled applications also allow you to build new features faster. Adding new features or extending existing ones can be simpler with event-driven architectures because you either add new events, or modify existing ones. This process removes complexity in your application.
Conclusion
In this post, you learn about the challenges of developing applications with request-response architecture. In request-response architecture, the client must send a request and wait for a response before moving on to its next task. As applications grow in complexity, this tightly coupled architecture can cause issues. Event-driven architectures can increase scalability, fault tolerance, and developer velocity by decoupling components of your application.
For more serverless content, go to serverlessland.com.
Podcast Trailer: How to Start Over (With Olga Khazan)
Post Syndicated from The Atlantic original https://www.youtube.com/watch?v=YGUEHX9VyXU
AWS Week in Review – May 9, 2022
Post Syndicated from Danilo Poccia original https://aws.amazon.com/blogs/aws/aws-week-in-review-may-9-2022/
Another week starts, and here’s a collection of the most significant AWS news from the previous seven days. This week is also the one-year anniversary of CloudFront Functions. It’s exciting to see what customers have built during this first year.
Last Week’s Launches
Here are some launches that caught my attention last week:
Amazon RDS supports PostgreSQL 14 with three levels of cascaded read replicas – That’s 5 replicas per instance, supporting a maximum of 155 read replicas per source instance with up to 30X more read capacity. You can now build a more robust disaster recovery architecture with the capability to create Single-AZ or Multi-AZ cascaded read replica DB instances in same or cross Region.
Amazon RDS on AWS Outposts storage auto scaling – AWS Outposts extends AWS infrastructure, services, APIs, and tools to virtually any datacenter. With Amazon RDS on AWS Outposts, you can deploy managed DB instances in your on-premises environments. Now, you can turn on storage auto scaling when you create or modify DB instances by selecting a checkbox and specifying the maximum database storage size.
Amazon CodeGuru Reviewer suppression of files and folders in code reviews – With CodeGuru Reviewer, you can use automated reasoning and machine learning to detect potential code defects that are difficult to find and get suggestions for improvements. Now, you can prevent CodeGuru Reviewer from generating unwanted findings on certain files like test files, autogenerated files, or files that have not been recently updated.
Amazon EKS console now supports all standard Kubernetes resources to simplify cluster management – To make it easy to visualize and troubleshoot your applications, you can now use the console to see all standard Kubernetes API resource types (such as service resources, configuration and storage resources, authorization resources, policy resources, and more) running on your Amazon EKS cluster. More info in the blog post Introducing Kubernetes Resource View in Amazon EKS console.
AWS AppConfig feature flag Lambda Extension support for Arm/Graviton2 processors – Using AWS AppConfig, you can create feature flags or other dynamic configuration and safely deploy updates. The AWS AppConfig Lambda Extension allows you to access this feature flag and dynamic configuration data in your Lambda functions. You can now use the AWS AppConfig Lambda Extension from Lambda functions using the Arm/Graviton2 architecture.
AWS Serverless Application Model (SAM) CLI now supports enabling AWS X-Ray tracing – With the AWS SAM CLI you can initialize, build, package, test on local and cloud, and deploy serverless applications. With AWS X-Ray, you have an end-to-end view of requests as they travel through your application, making them easier to monitor and troubleshoot. Now, you can enable tracing by simply adding a flag to the sam init command.
Amazon Kinesis Video Streams image extraction – With Amazon Kinesis Video Streams you can capture, process, and store media streams. Now, you can also request images via API calls or configure automatic image generation based on metadata tags in ingested video. For example, you can use this to generate thumbnails for playback applications or to have more data for your machine learning pipelines.
AWS GameKit supports Android, iOS, and MacOS games developed with Unreal Engine – With AWS GameKit, you can build AWS-powered game features directly from the Unreal Editor with just a few clicks. Now, the AWS GameKit plugin for Unreal Engine supports building games for the Win64, MacOS, Android, and iOS platforms.
For a full list of AWS announcements, be sure to keep an eye on the What’s New at AWS page.
Other AWS News
Some other updates you might have missed:
 One-year anniversary of CloudFront Functions – I can’t believe it’s been one year since we launched CloudFront Functions. Now, we have tens of thousands of developers actively using CloudFront Functions, with trillions of invocations per month. You can use CloudFront Functions for HTTP header manipulation, URL rewrites and redirects, cache key manipulations/normalization, access authorization, and more. See some examples in this repo. Let’s see what customers built with CloudFront Functions:
- CloudFront Functions enables Formula 1 to authenticate users with more than 500K requests per second. The solution is using CloudFront Functions to evaluate if users have access to view the race livestream by validating a token in the request.
- Cloudinary is a media management company that helps its customers deliver content such as videos and images to users worldwide. For them, Lambda@Edge remains an excellent solution for applications that require heavy compute operations, but lightweight operations that require high scalability can now be run using CloudFront Functions. With CloudFront Functions, Cloudinary and its customers are seeing significantly increased performance. For example, one of Cloudinary’s customers began using CloudFront Functions, and in about two weeks it was seeing 20–30 percent better response times. The customer also estimates that they will see 75 percent cost savings.
- Based in Japan, DigitalCube is a web hosting provider for WordPress websites. Previously, DigitalCube spent several hours completing each of its update deployments. Now, they can deploy updates across thousands of distributions quickly. Using CloudFront Functions, they’ve reduced update deployment times from 4 hours to 2 minutes. In addition, faster updates and less maintenance work result in better quality throughout DigitalCube’s offerings. It’s now easier for them to test on AWS because they can run tests that affect thousands of distributions without having to scale internally or introduce downtime.
- Amazon.com is using CloudFront Functions to change the way it delivers static assets to customers globally. CloudFront Functions allows them to experiment with hyper-personalization at scale and optimal latency performance. They have been working closely with the CloudFront team during product development, and they like how it is easy to create, test, and deploy custom code and implement business logic at the edge.
AWS open-source news and updates – A newsletter curated by my colleague Ricardo to bring you the latest open-source projects, posts, events, and more. Read the latest edition here.
Reduce log-storage costs by automating retention settings in Amazon CloudWatch – By default, CloudWatch Logs stores your log data indefinitely. This blog post shows how you can reduce log-storage costs by establishing a log-retention policy and applying it across all of your log groups.
Observability for AWS App Runner VPC networking – With X-Ray support in App runner, you can quickly deploy web applications and APIs at any scale and take advantage of adding tracing without having to manage sidecars or agents. Here’s an example of how you can instrument your applications with the AWS Distro for OpenTelemetry (ADOT).
Upcoming AWS Events
It’s AWS Summits season and here are some virtual and in-person events that might be close to you:
- May 10–11, AWS Summit Korea (virtual)
- May 11, AWS Summit Stockholm (in-person)
- May 11–12, AWS Summit Berlin (in-person)
- May 18, AWS Summit Tel Aviv (in-person)
- May 23–25, AWS Summit Washington, DC (in-person)
You can now register for re:MARS to get fresh ideas on topics such as machine learning, automation, robotics, and space. The conference will be in person in Las Vegas, June 21–24.
That’s all from me for this week. Come back next Monday for another Week in Review!
— Danilo
Apple Mail Now Blocks Email Trackers
Post Syndicated from Bruce Schneier original https://www.schneier.com/blog/archives/2022/05/apple-mail-now-blocks-email-trackers.html
Apple Mail now blocks email trackers by default.
Most email newsletters you get include an invisible “image,” typically a single white pixel, with a unique file name. The server keeps track of every time this “image” is opened and by which IP address. This quirk of internet history means that marketers can track exactly when you open an email and your IP address, which can be used to roughly work out your location.
So, how does Apple Mail stop this? By caching. Apple Mail downloads all images for all emails before you open them. Practically speaking, that means every message downloaded to Apple Mail is marked “read,” regardless of whether you open it. Apples also routes the download through two different proxies, meaning your precise location also can’t be tracked.
Crypto-Gram uses Mailchimp, which has these tracking pixels turned on by default. I turn them off. Normally, Mailchimp requires them to be left on for the first few mailings, presumably to prevent abuse. The company waived that requirement for me.
[Infographic] Cloud Misconfigurations: Don’t Become a Breach Statistic
Post Syndicated from Rapid7 original https://blog.rapid7.com/2022/05/09/infographic-cloud-misconfigurations-dont-become-a-breach-statistic/

No one wants their company to be named in the latest headline-grabbing data breach. Luckily, there are steps you can take to keep your organization from becoming another security incident statistic — chief among them, avoiding misconfigurations in the cloud.
Our 2022 Cloud Misconfigurations Report found some key commonalities across publicly reported data exposure incidents last year. Check out some of the highlights here, in our latest infographic.

Want to learn more about the cloud misconfigurations and breaches that happened last year? Check out the full 2022 Cloud Misconfigurations Report.
Additional reading:
- 2022 Cloud Misconfigurations Report: A Quick Look at the Latest Cloud Security Breaches and Attack Trends
- Cloud-Native Application Protection (CNAPP): What’s Behind the Hype?
- Is Your Kubernetes Cluster Ready for Version 1.24?
- Rapid7 Recognized as Top Ranked in Current Offering Category in Forrester Wave™ for Cloud Workload Security
Motion Sensor Comparison and Review 2022
Post Syndicated from digiblurDIY original https://www.youtube.com/watch?v=qWVbsZCj6CY
Throttling a tiered, multi-tenant REST API at scale using API Gateway: Part 2
Post Syndicated from Nick Choi original https://aws.amazon.com/blogs/architecture/throttling-a-tiered-multi-tenant-rest-api-at-scale-using-api-gateway-part-2/
In Part 1 of this blog series, we demonstrated why tiering and throttling become necessary at scale for multi-tenant REST APIs, and explored tiering strategy and throttling with Amazon API Gateway.
In this post, Part 2, we will examine tenant isolation strategies at scale with API Gateway and extend the sample code from Part 1.
Enhancing the sample code
To enable this functionality in the sample code (Figure 1), we will make manual changes. First, create one API key for the Free Tier and five API keys for the Basic Tier. Currently, these API keys are private keys for your Amazon Cognito login, but we will make a further change in the backend business logic that will promote them to pooled resources. Note that all of these modifications are specific to this sample code’s implementation; the implementation and deployment of a production code may be completely different (Figure 1).

Figure 1. Cloud architecture of the sample code
Next, in the business logic for thecreateKey(), find the AWS Lambda function in lambda/create_key.js. It appears like this:
function createKey(tableName, key, plansTable, jwt, rand, callback) {
  const pool = getPoolForPlanId( key.planId )
  if (!pool) {
    createSiloedKey(tableName, key, plansTable, jwt, rand, callback);
  } else {
    createPooledKey(pool, tableName, key, jwt, callback);
  }
}
The getPoolForPlanId() function does a search for a pool of keys associated with the usage plan. If there is a pool, we “create” a kind of reference to the pooled resource, rather than a completely new key that is created by the API Gateway service directly. The lambda/api_key_pools.js should be empty.
exports.apiKeyPools = [];
In effect, all usage plans were considered as siloed keys up to now. To change that, populate the data structure with values from the six API keys that were created manually. You will have to look up the IDs of the API keys and usage plans that were created in API Gateway (Figures 2 and 3). Using the AWS console to navigate to API Gateway is the most intuitive.

Figure 2. A view of the AWS console when inspecting the ID for the Basic usage plan

Figure 3. A view of the AWS Console when looking up the API key value (not the ID)
When done, your code in lambda/api_key_pools.js should be the following, but instead of ellipses (…), the IDs for the user plans and API keys specific to your environment will appear.
exports.apiKeyPools = [{
    planName: "FreePlan"
    planId: "...",
    apiKeys: [ "..." ]
  },
 {
    planName: "BasicPlan"
    planId: "...",
    apiKeys: [ "...", "...", "...", "...", "..." ]
  }];
After making the code changes, run cdk deploy from the command line to update the Lambda functions. This change will only affect key creation and deletion because of the system implementation. Updates affect only the user’s specific reference to the key, not the underlying resource managed by API Gateway.
When the web application is run now, it will look similar to before—tenants should not be aware what tiering strategy they have been assigned to. The only way to notice the difference would be to create two Free Tier keys, test them, and note that the value of the X-API-KEY header is unchanged between the two.
Now, you have a virtually unlimited number of users who can have API keys in the Free or Basic Tier. By keeping the Premium Tier siloed, you are subject to the 10,000-API-key maximum (less any keys allocated for the lower tiers). You may consider additional techniques to continue to scale, such as replicating your service in another AWS account.
Other production considerations
The sample code is minimal, and it illustrates just one aspect of scaling a Software-as-a-service (SaaS) application. There are many other aspects be considered in a production setting that we explore in this section.
The throttled endpoint, GET /api rely only on API key for authorization for demonstration purpose. For any production implementation consider authentication options for your REST APIs. You may explore and extend to require authentication with Cognito similar to /admin/* endpoints in the sample code.
One API key for Free Tier access and five API keys for Basic Tier access are illustrative in a sample code but not representative of production deployments. Number of API keys with service quota into consideration, business and technical decisions may be made to minimize noisy neighbor effect such as setting blast radius upper threshold of 0.1% of all users. To satisfy that requirement, each tier would need to spread users across at least 1,000 API keys. The number of keys allocated to Basic or Premium Tier would depend on market needs and pricing strategies. Additional allocations of keys could be held in reserve for troubleshooting, QA, tenant migrations, and key retirement.
In the planning phase of your solution, you will decide how many tiers to provide, how many usage plans are needed, and what throttle limits and quotas to apply. These decisions depend on your architecture and business.
To define API request limits, examine the system API Gateway is protecting and what load it can sustain. For example, if your service will scale up to 1,000 requests per second, it is possible to implement three tiers with a 10/50/40 split: the lowest tier shares one common API key with a 100 request per second limit; an intermediate tier has a pool of 25 API keys with a limit of 20 requests per second each; and the highest tier has a maximum of 10 API keys, each supporting 40 requests per second.
Metrics play a large role in continuously evolving your SaaS-tiering strategy (Figure 4). They provide rich insights into how tenants are using the system. Tenant-aware and SaaS-wide metrics on throttling and quota limits can be used to: assess tiering in-place, if tenants’ requirements are being met, and if currently used tenant usage profiles are valid (Figure 5).
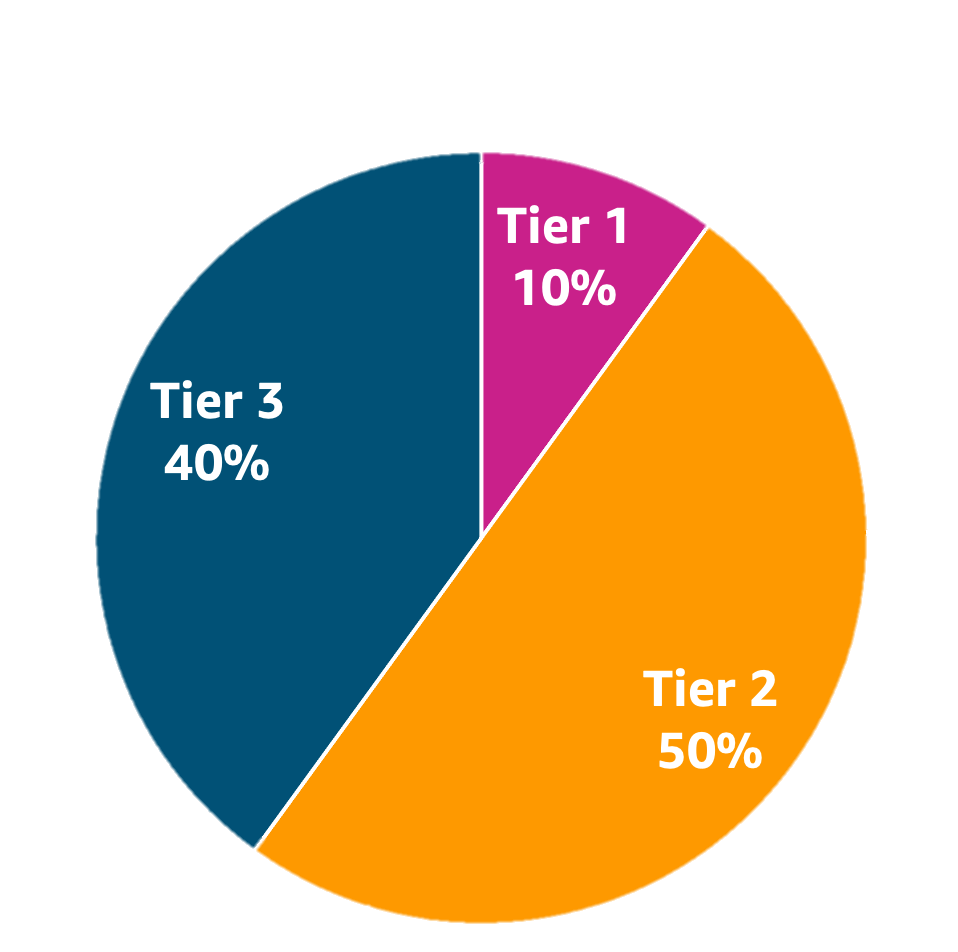
Figure 4. Tiering strategy example with 3 tiers and requests allocation per tier

Figure 5. An example SaaS metrics dashboard
API Gateway provides options for different levels of granularity required, including detailed metrics, and execution and access logging to enable observability of your SaaS solution. Granular usage metrics combined with underlying resource consumption leads to managing optimal experience for your tenants with throttling levels and policies per method and per client.
Cleanup
To avoid incurring future charges, delete the resources. This can be done on the command line by typing:
cd ${TOP}/cdk
cdk destroy

cd ${TOP}/react
amplify delete
${TOP} is the topmost directory of the sample code. For the most up-to-date information, see the README.md file.
Conclusion
In this two-part blog series, we have reviewed the best practices and challenges of effectively guarding a tiered multi-tenant REST API hosted in AWS API Gateway. We also explored how throttling policy and quota management can help you continuously evaluate the needs of your tenants and evolve your tiering strategy to protect your backend systems from being overwhelmed by inbound traffic.
Further reading:
[$] Ways to reclaim unused page-table pages
Post Syndicated from original https://lwn.net/Articles/893726/
One of the memory-management subsystem’s most important jobs is reclaiming
unused (or
little-used) memory so that it can be put to better use. When it comes to
one of the core memory-management data structures — page tables — though,
this subsystem often falls down on the job. At the 2022 Linux Storage,
Filesystem, Memory-management and BPF Summit (LSFMM), David Hildenbrand led a
session on the problems posed by the lack of page-table reclaim and
explored options for improving the situation.
Four new stable kernels
Post Syndicated from original https://lwn.net/Articles/894355/
Greg Kroah-Hartman has announced the release of the 5.17.6, 5.15.38, 5.10.114, and 5.4.192 stable kernels. As usual, these
contain important fixes throughout the tree; users of those series should upgrade.