Incident notification mechanism using Amazon Pinpoint two-way SMS

Post Syndicated from Pavlos Ioannou Katidis original https://aws.amazon.com/blogs/messaging-and-targeting/incident-notification-mechanism-using-amazon-pinpoint-two-way-sms/

Unexpected situations that require immediate attention can occur in any industry. Part of resolving these incidents is the notifications’ delivery. For example, utility companies that have installed gas sensors need to notify immediately the available engineer if a leak occurs.

The goal of an incident management process is to restore a normal service operation as quickly as possible and to minimize the impact on business operations, thus ensuring that the best possible levels of service quality and availability are maintained. A key element of incident management is sending timely notifications to the assigned or available resource(s) who can rectify the issue.

An incident can take place at any time and the resource(s) assigned to it might not have internet access and even if they receive the message they might not be equipped to work on it. This creates five key requirements for an incident notifications mechanism:

  1. Notify the resources via a communication channel that ensures message delivery even without internet access
  2. Enable assigned resources to respond to a request via a communication channel that doesn’t require internet access
  3. Send reminder(s) in case there is no response from the assigned resource(s)
  4. Escalate to another resource in case the first one doesn’t reply or declines the incident
  5. Store the incident details & status for reporting and data analysis

In this blog post, I share a solution on how you can automate the delivery of incident notifications. This solution utilizes Amazon Pinpoint SMS channel to contact the designated resources who might not have access to the internet. Furthermore, the recipient of the SMS is able to reply with an acknowledgement. AWS Step Functions orchestrates the user journey using AWS Lambda functions to evaluate the recipients’ response and trigger the next best action. You will use AWS CloudFormation to deploy this solution.

Use Cases

An incident notification mechanism can vary depending the organization’s requirements and 3rd party system integrations. In this blog the solution covers all five points listed above but it might require further modifications depending your use case.

With minor modifications this solution can also be used in the following use cases:

  1. Medicine intake notification: It will notify the patient via SMS that it is their time to take their medicine. If the patient doesn’t acknowledge the SMS by replying then this can be escalated to their assigned doctor
  2. Assignment submission: It will notify the student that their assignment is due. If the student doesn’t acknowledge the SMS by replying then this can be escalated to their teacher

High-level Architecture

The solution requires the country of your SMS recipients to support two-way SMS. To check which countries, support two-way SMS visit this page.  If two-way SMS is supported then you will need to request a dedicated originating identity. You can also use Toll Free Number or 10DLC if your recipients are in the US.

Note: Sender ID doesn’t support two-way SMS.

A new incident is represented as an item in an Amazon DynamoDB table containing information such as description, URL, incident_id as well as the contact numbers for two resources. A resource is someone who has been assigned to work on this incident. The second resource is for escalation purposes in case the first one doesn’t acknowledge or decline the incident notification.

The Amazon DynamoDB table covers three functions for this solution:

  1. A way to add new incidents using either the AWS console or programmatically
  2. As a storage for variables that indicate the incident’s status and can be used from the solution to determine the next action(s)
  3. As a historical data storage for all incidents that have been created for data analysis purposes

The solution utilizes Amazon DynamoDB Streams to invoke an AWS Lambda function every time a new incident is created. The AWS Lambda function triggers an AWS Step Function State machine, which orchestrates three AWS Lambda functions:

  1. Send_First_SMS: Sends the first SMS
  2. Reminder_SMS: Sends a reminder SMS if the resource does not acknowledge the first SMS
  3. Incident_State_Review: Assesses the status of the incident and either goes back to the first AWS Lambda function or finishes the AWS Step Function State machine execution

The AWS Step Functions State machine uses the Choice state, which evaluates the response of the previous AWS Lambda function and decides on the next state. This is a very useful feature that can reduce custom code and potentially AWS Lambda invocations resulting to cost savings.

Additionally, the waiting between steps is also managed from AWS Step Functions State machine using the Wait state. This can be configured to wait seconds, days or till a specific point in the future.

To be able to receive SMS, this solution uses Amazon Pinpoint’s two-way SMS feature. When receiving an SMS Amazon Pinpoint sends a payload to an Amazon SNS topic, which needs to be created separately. An AWS Lambda function that is subscribed to the Amazon SNS topic processes the SMS content and performs one or both of the following actions:

  1. Update the incident status in the DynamoDB table
  2. Create a new Step Function State machine execution

In this solution SMS recipients can reply by typing either yes or no. The SMS response is not case sensitive.

An inbound SMS payload contains the originationNumber, destinationNumber, messageKeyword, messageBody, inboundMessageId and previousPublishedMessageId. Noticeably there isn’t a direct way to associate an inbound SMS with an incident. To overcome this challenge this solution uses a second DynamoDB table, which stores the message_id and incident_id every time an SMS is send to any of the two resources. This allows the solution to use the previousPublishedMessageId from the inbound SMS payload to fetch the respective incident_id from the second DynamoDB table.

The code in this solution uses AWS SDK for Python (Boto3).

Prerequisites

  1. An Amazon Pinpoint project with the SMS channel enabled – Guide on how to enable Amazon Pinpoint SMS channel
  2. Check if the country you want to send SMS to, supports two-way SMS – List with countries that support two-way SMS
  3. An originating identity that supports two-way SMS – Guide on how to request a phone number
  4. Increase your monthly SMS spending quota for Amazon Pinpoint – Guide on how to increase the monthly SMS spending quota

Deploy the solution

Step 1: Create an S3 bucket

  1. Navigate to the Amazon S3 console
  2. Select Create bucket
  3. Enter a unique name for Bucket name
  4. Select the AWS Region to be the same as the one of your Amazon Pinpoint project
  5. Scroll to the bottom of the page and select Create bucket
  6. Follow this link to download the GitHub repository. Once the repository is downloaded, unzip it and navigate to  \amazon-pinpoint-incident-notifications-mechanism-main\src
  7. Access the S3 bucket created above and upload the five .zip files

Step 2: Create a stack

  1. The application is deployed using an AWS CloudFormation template.
  2. Navigate to the AWS CloudFormation console select Create stack > With new resources (standard)
  3. Select Template is ready as Prerequisite – Prepare template and choose Upload a template file as Template source
  4. Select Choose file and from the GitHub repository downloaded in step 1.6 navigate to amazon-pinpoint-incident-notifications-mechanism-main\cfn upload CloudFormation_template.yaml and select Next
  5. Type Pinpoint-Incident-Notifications-Mechanism as Stack name, paste the S3 bucket name created in step 1.5 as the LambdaCodeS3BucketName, type the Amazon Pinpoint Originating Number in E.164 format as OriginatingIdenity, paste the Amazon Pinpoint project ID as PinpointProjectId and type 40 for WaitingBetweenSteps
  6. Select Next, till you reach to Step 4 Review where you will need to check the box I acknowledge that AWS CloudFormation might create IAM resources and then select Create Stack
  7. The stack creation process takes approximately 2 minutes. Click on the refresh button to get the latest event regarding the deployment status. Once the stack has been deployed successfully you should see the last Event with Logical ID Pinpoint-Incident-Notifications-Mechanism and with Status CREATE_COMPLETE

Step 3: Configure two-way SMS SNS topic

  1. Navigate to the Amazon Pinpoint console > SMS and voice > Phone numbers. Select the originating identity that supports two-way SMS. Scroll to the bottom of the page and click to expand the  and check the box to enable it.

    For SNS topic select Choose an existing SNS topic then using the drop down choose the one that contains the name of the AWS CloudFormation stack from Step 2.4 as well as the name TwoWaySMSSNSTopic and click Save.

Step 4: Create a new incident

To create a new incident, navigate to Amazon DynamoDB console > Tables and select the table containing the name of the AWS CloudFormation stack from Step 2.4 as well as the name IncidentInfoDynamoDB. Select View items and then Create item.

On the Create item page choose JSON, copy and paste the JSON below into the text box and replace the values for the first_contact and second_contact with a valid mobile number that you have access to.

Note: If you don’t have two different mobile numbers, enter the same for both first_contact and second_contact fields. The mobile numbers must follow E.164 format +<country code><number>.

{
   "incident_id":{
      "S":"123"
   },
   "incident_stat":{
      "S":"not_acknowledged"
   },
   "double_escalation":{
      "S":"no"
   },
   "description":{
      "S":"Error 111, unit 1 malfunctioned. Urgent assistance is required."
   },
   "url":{
      "S":"https://example.com/incident/111/overview"
   },
   "first_contact":{
      "S":"+4479083---"
   },
   "second_contact":{
      "S":"+4479083---"
   }
}

Incident fields description:

  • incident_id: Needs to be unique
  • incident_stat: This is used from the application to store the incident status. When creating the incident, this value should always be not_acknowledged
  • double_escalation: This is used from the application as a flag for recipients who try to escalate an incident that is already escalated. When creating the incident, this value should always be no
  • description: You can type a description that best describes the incident. Be aware that depending the number of characters the SMS parts will increase. For more information on SMS character limits visit this page
  • url: You can add a URL that resources can access to resolve the issue. If this field is not pertinent to your use case then type no url
  • first_contact: This should contain the mobile number in E.164 format for the first resource
  • second_contact: This should contain the mobile number in E.164 format for the second resource. The second resource will be contacted only if the first one does not acknowledge the SMS or declines the incident

Once the above is ready you can select Create item. This will execute the AWS Step Functions State machine and you should receive an SMS. You can reply with yes to acknowledge the incident or with no to decline it. Depending your response, the incident status in the DynamoDB table will be updated and if you reply no then the incident will be escalated sending a SMS to the second_contact.

Note: The SMS response is not case sensitive.

Clean-up

To remove the solution:

  1. Delete the AWS CloudFormation stack by following the steps listed in this guide
  2. Delete the dedicated originating identity that you used to send the SMS by following the steps listed in this guide
  3. Delete the Amazon Pinpoint project by navigating the Amazon Pinpoint console, select your Amazon Pinpoint Project, choose Settings > General settings > Delete Project

Next Steps

This solution currently works only if your SMS recipients are in one country. If your use case requires to send SMS to multiple countries you will need to:

  • Check this page to ensure that these countries support two-way SMS
  • Follow the instructions in this page to obtain a number that supports two-way SMS for each country
  • Expand the solution to identify the country of the SMS recipient and to choose the correct number accordingly. To identify the country of the SMS recipient you can use Amazon Pinpoint’s phone number validate service via Amazon Pinpoint API or SDKs. The phone validate service returns a list of data points per mobile number with one of them being the Country

Incidents that are not being acknowledged by any of the assigned resources, have their status updated to unacknowledged but they don’t escalate further. Depending your requirements, you can expand the solution to send an email using Amazon Pinpoint APIs or perform an outbound call using Amazon Connect APIs.

Conclusion

In this blog post, I have demonstrated how your organization can use Amazon Pinpoint two-way SMS and Step Functions to automate incident notifications. Furthermore, the solution highlights the synergy of AWS services and how you can build a custom solution with little effort that meets your requirements.

About the Author

Pavlos Ioannou Katidis

Pavlos Ioannou Katidis

Pavlos Ioannou Katidis is an Amazon Pinpoint and Amazon Simple Email Service Specialist Solutions Architect at AWS. He loves to dive deep into his customer’s technical issues and help them design communication solutions. In his spare time, he enjoys playing tennis, watching crime TV series, playing FPS PC games, and coding personal projects.

Optimize AI/ML workloads for sustainability: Part 2, model development

Post Syndicated from Benoit de Chateauvieux original https://aws.amazon.com/blogs/architecture/optimize-ai-ml-workloads-for-sustainability-part-2-model-development/

More complexity often means using more energy, and machine learning (ML) models are becoming bigger and more complex. And though ML hardware is getting more efficient, the energy required to train these ML models is increasing sharply.

In this series, we’re following the phases of the Well-Architected machine learning lifecycle (Figure 1) to optimize your artificial intelligence (AI)/ML workloads. In Part 2, we examine the model development phase and show you how to train, tune, and evaluate your ML model to help you reduce your carbon footprint.


If you missed the first part of this series, we showed you how to examine your workload to help you 1) evaluate the impact of your workload, 2) identify alternatives to training your own model, and 3) optimize data processing.


ML lifecycle

Figure 1. ML lifecycle

Model building

Define acceptable performance criteria

When you build an ML model, you’ll likely need to make trade-offs between your model’s accuracy and its carbon footprint. When we focus only on the model’s accuracy, we “ignore the economic, environmental, or social cost of reaching the reported accuracy.” Because the relationship between model accuracy and complexity is at best logarithmic, training a model longer or looking for better hyperparameters only leads to a small increase in performance.

Establish performance criteria that support your sustainability goals while meeting your business requirements, not exceeding them.

Select energy-efficient algorithms

Begin with a simple algorithm to establish a baseline. Then, test different algorithms with increasing complexity to observe whether performance has improved. If so, compare the performance gain against the difference in resources required.

Try to find simplified versions of algorithms. This will help you use less resources to achieve a similar outcome. For example, DistilBERT, a distilled version of BERT, has 40% fewer parameters, runs 60% faster, and preserves 97% of BERT’s performance.

Use pre-trained or partially pre-trained models

Consider techniques to avoid training a model from scratch:

  • Transfer Learning: Use a pre-trained source model and reuse it as the starting point for a second task. For example, a model trained on ImageNet (14 million images) can generalize with other datasets.
  • Incremental Training: Use artifacts from an existing model on an expanded dataset to train a new model.

Optimize your deep learning models to accelerate training

Compile your DL models from their high-level language representation to hardware-optimized instructions to reduce training time. You can achieve this with open-source compilers or Amazon SageMaker Training Compiler, which can speed up training of DL models by up to 50% by more efficiently using SageMaker GPU instances.

Start with small experiments, datasets, and compute resources

Experiment with smaller datasets in your development notebook. This allows you to iterate quickly with limited carbon emission.

Automate the ML environment

When building your model, use Lifecycle Configuration Scripts to automatically stop idle SageMaker Notebook instances. If you are using SageMaker Studio, install the auto-shutdown Jupyter extension to detect and stop idle resources.

Use the fully managed training process provided by SageMaker to automatically launch training instances and shut them down as soon as the training job is complete. This minimizes idle compute resources and thus limits the environmental impact of your training job.

Adopt a serverless architecture for your MLOps pipelines. For example, orchestration tools like AWS Step Functions or SageMaker Pipelines only provision resources when work needs to be done. This way, you’re not maintaining compute infrastructure 24/7.

Model training

Select sustainable AWS Regions

As mentioned in Part 1, select an AWS Region with sustainable energy sources. When regulations and legal aspects allow, choose Regions near Amazon renewable energy projects and Regions where the grid has low published carbon intensity to train your model.

Use a debugger

A debugger like SageMaker Debugger can identify training problems like system bottlenecks, overfitting, saturated activation functions, and under-utilization of system resources. It also provides built-in rules like LowGPUUtilization or Overfit. These rules monitor your workload and will automatically stop a training job as soon as it detects a bug (Figure 2), which helps you avoid unnecessary carbon emissions.

Automatically stop buggy training jobs with SageMaker Debugger

Figure 2. Automatically stop buggy training jobs with SageMaker Debugger

Optimize the resources of your training environment

Reference the recommended instance types for the algorithm you’ve selected in the SageMaker documentation. For example, for DeepAR, you should start with a single CPU instance and only switch to GPU and multiple instances when necessary.

Right size your training jobs with Amazon CloudWatch metrics that monitor the utilization of resources like CPU, GPU, memory, and disk utilization.

Consider Managed Spot Training, which takes advantage of unused Amazon Elastic Compute Cloud (Amazon EC2) capacity and can save you up to 90% in cost compared to On-Demand instances. By shaping your demand for the existing supply of EC2 instance capacity, you will improve your overall resource efficiency and reduce idle capacity of the overall AWS Cloud.

Use efficient silicon

Use AWS Trainium for optimized for DL training workloads. It is expected to be our most energy efficient processor for this purpose.

Archive or delete unnecessary training artifacts

Organize your ML experiments with SageMaker Experiments to clean up training resources you no longer need.

Reduce the volume of logs you keep. By default, CloudWatch retains logs indefinitely. By setting limited retention time for your notebooks and training logs, you’ll avoid the carbon footprint of unnecessary log storage.

Model tuning and evaluation

Use efficient cross-validation techniques for hyperparameter optimization

Prefer Bayesian search over random search (and avoid grid search). Bayesian search makes intelligent guesses about the next set of parameters to pick based on the prior set of trials. It typically requires 10 times fewer jobs than random search, and thus 10 times less compute resources, to find the best hyperparameters.

Limit the maximum number of concurrent training jobs. Running hyperparameter tuning jobs concurrently gets more work done quickly. However, a tuning job improves only through successive rounds of experiments. Typically, running one training job at a time achieves the best results with the least amount of compute resources.

Carefully choose the number of hyperparameters and their ranges. You get better results and use less compute resources by limiting your search to a few parameters and small ranges of values. If you know that a hyperparameter is log-scaled, convert it to further improve the optimization.

Use warm-start hyperparameter tuning

Use warm-start to leverage the learning gathered in previous tuning jobs to inform which combinations of hyperparameters to search over in the new tuning job. This technique avoids restarting hyperparameter optimization jobs from scratch and thus reduces the compute resources needed.

Measure results and improve

To monitor and quantify improvements of your training jobs, track the following metrics:

For storage:

Conclusion

In this blog post, we discussed techniques and best practices to reduce the energy required to build, train, and evaluate your ML models.

We also provided recommendations for the tuning process as it makes up a large part of the carbon impact of building an ML model. During hyperparameter and neural design search, hundreds of versions of a given model are created, trained, and evaluated before identifying an optimal design.

In the next post, we’ll continue our sustainability journey through the ML lifecycle and discuss the best practices you can follow when deploying and monitoring your model in production.

Want to learn more? Check out the Sustainability Pillar of the AWS Well-Architected Framework, the Architecting for sustainability session at re:Invent 2021, and other blog posts on architecting for sustainability.

Looking for more architecture content? AWS Architecture Center provides reference architecture diagrams, vetted architecture solutions, Well-Architected best practices, patterns, icons, and more!

Other posts in this series

How to use AWS Security Hub and Amazon OpenSearch Service for SIEM

Post Syndicated from Ely Kahn original https://aws.amazon.com/blogs/security/how-to-use-aws-security-hub-and-amazon-opensearch-service-for-siem/

AWS Security Hub provides you with a consolidated view of your security posture in Amazon Web Services (AWS) and helps you check your environment against security standards and current AWS security recommendations. Although Security Hub has some similarities to security information and event management (SIEM) tools, it is not designed as standalone a SIEM replacement. For example, Security Hub only ingests AWS-related security findings and does not directly ingest higher volume event logs, such as AWS CloudTrail logs. If you have use cases to consolidate AWS findings with other types of findings from on-premises or other non-AWS workloads, or if you need to ingest higher volume event logs, we recommend that you use Security Hub in conjunction with a SIEM tool.

There are also other benefits to using Security Hub and a SIEM tool together. These include being able to store findings for longer periods of time than Security Hub, aggregating findings across multiple administrator accounts, and further correlating Security Hub findings with each other and other log sources. In this blog post, we will show you how you can use Amazon OpenSearch Service (successor to Amazon Elasticsearch Service) as a SIEM and integrate Security Hub with it to accomplish these three use cases. Amazon OpenSearch Service is a fully managed service that makes it easier to deploy, manage, and scale Elasticsearch and Kibana. OpenSearch Service is a distributed, RESTful search and analytics engine that is capable of addressing a growing number of use cases. You can expand OpenSearch Service with AWS services like Kinesis or Kinesis Data Firehose, by integrating with other AWS services, or by using traditional agents like Beats and Logstash for log ingestion, and Kibana for data visualization. Although the OpenSearch Service also is not a SIEM out-of-the-box tool, with some customization, you can use it for SIEM tool use cases.

Security Hub plus SIEM use cases

By enabling Security Hub within your AWS Organizations account structure, you immediately start receiving the benefits of viewing all of your security findings from across various AWS and partner services on a single screen. Some organizations want to go a step further and use Security Hub in conjunction with a SIEM tool for the following reasons:

  • Correlate Security Hub findings with each other and other log sources – This is the most popular reason customers choose to implement this solution. If you have various log sources outside of Security Hub findings (such as application logs, database logs, partner logs, and security tooling logs), then it makes sense to consolidate these log sources into a single SIEM solution. Then you can view both your Security Hub findings and miscellaneous logs in the same place and create alerts based on interesting correlations.
  • Store findings for longer than 90 days after the last update date – Some organizations want or need to store Security Hub findings for longer than 90 days after the last update date. They may want to do this for historical investigation, or for audit and compliance needs. Either way, this solution offers you the ability to store Security Hub findings in a private Amazon Simple Storage Service (Amazon S3) bucket, which is then consumed by Amazon OpenSearch Service.
  • Aggregate findings across multiple administrator accounts – Security Hub has a feature customers can use to designate an administrator account if they have enabled Security Hub in multiple accounts. A Security Hub administrator account can view data from and manage configuration for its member accounts. This allows customers to view and manage all their findings from multiple member accounts in one place. Sometimes customers have multiple Security Hub administrator accounts, because they have multiple organizations in AWS Organizations. In this situation, you can use this solution to consolidate all of the Security Hub administrator accounts into a single OpenSearch Service with Kibana SIEM implementation to have a single view across your environments. This related blog post walks through this use case in more detail, and shows how to centralize Security Hub findings across multiple AWS Regions and administrators. However, this blog post takes this approach further by introducing OpenSearch Service with Kibana to the use case, for a full SIEM experience.

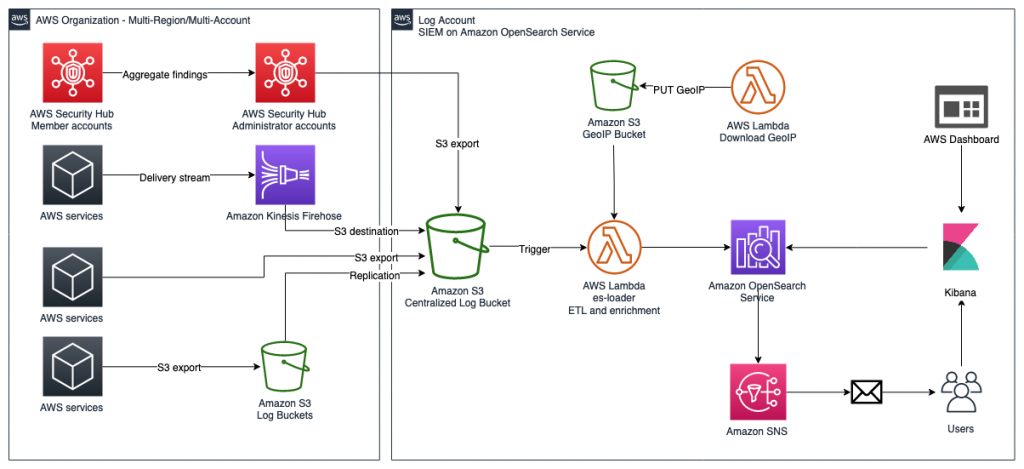
Solution architecture

Figure 1: SIEM implementation on Amazon OpenSearch Service

Figure 1: SIEM implementation on Amazon OpenSearch Service

The solution represented in Figure 1 shows the flexibility of integrations that are possible when you create a SIEM by using Amazon OpenSearch Service. The solution allows you to aggregate findings across multiple accounts, store findings in an S3 bucket indefinitely, and correlate multiple AWS and non-AWS services in one place for visualization. This post focuses on Security Hub’s integration with the solution, but the following AWS services are also able to integrate:

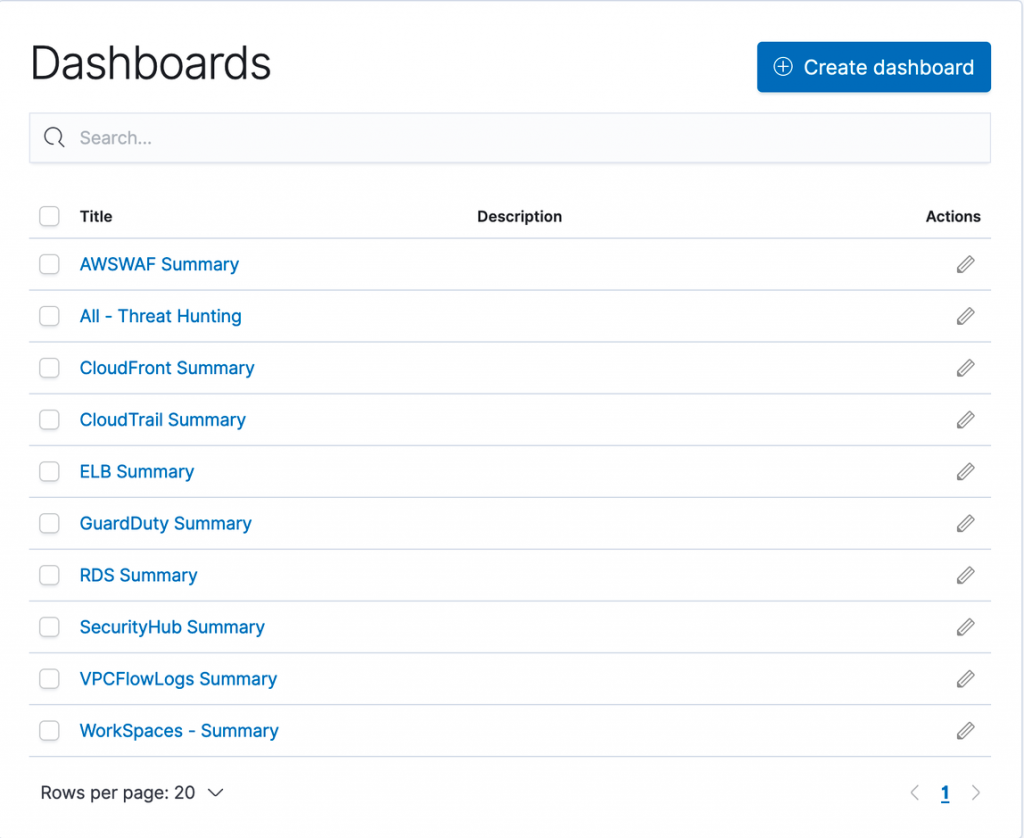
Each of these services has its own dedicated dashboard within the OpenSearch SIEM solution. This makes it possible for customers to view findings and data that are relevant to each service that the SIEM tool is ingesting. OpenSearch Service also allows the customer to create aggregated dashboards, consolidating multiple services within a single dashboard, if needed.

Prerequisites

We recommend that you enable Security Hub and AWS Config across all of your accounts and Regions. For more information about how to do this, see the documentation for Security Hub and AWS Config. We also recommend that you use Security Hub and AWS Config integration with AWS Organizations to simplify the setup and automatically enable these services in all current and future accounts in your organization.

Launch the solution

In order to launch this solution within your environment, you can either launch the solution by using an AWS CloudFormation template, or by following the steps presented later in this post to customize the deployment to support integrations with non-AWS services, multi-Organization deployments, or launch within your existing OpenSearch Service environment.

To launch the solution, follow the instructions for SIEM on Amazon OpenSearch Service on GitHub.

Use the solution

Before you start using the solution, we’ll show you how this solution appears in the Security Hub dashboard, as shown in Figure 2. Navigate here by following Step 3 from the GitHub README.

Figure 2: Pre-built dashboards within solution

Figure 2: Pre-built dashboards within solution

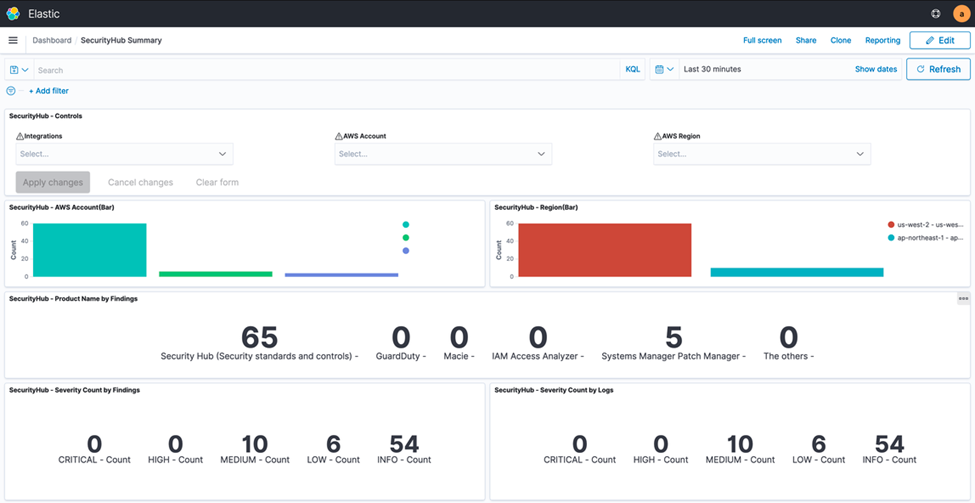
The Security Hub dashboard highlights all major components of the service within an OpenSearch Service dashboard environment. This includes supporting all of the service integrations that are available within Security Hub (such as GuardDuty, AWS Identity and Access Management (IAM) Access Analyzer, Amazon Inspector, Amazon Macie, and AWS Systems Manager Patch Manager). The dashboard displays both findings and security standards, and you can filter by AWS account, finding type, security standard, or service integration. Figure 3 shows an overview of the visual dashboard experience when you deploy the solution.

Figure 3: Dashboard preview

Figure 3: Dashboard preview

Use case 1: Correlate Security Hub findings with each other and other log sources and create alerts

This solution uses OpenSearch Service and Kibana to allow you to search through both Security Hub findings and logs from any other AWS and non-AWS systems. You can then create alerts within Kibana based on interesting correlations between Security Hub and any other logged events. Although Security Hub supports ingesting a vast number of integrations and findings, it cannot create correlation rules like a SIEM tool can. However, you can create such rules using SIEM on OpenSearch Service. It’s important to take a closer look when multiple AWS security services generate findings for a single resource, because this potentially indicates elevated risk or multiple risk vectors. Depending on your environment, the initial number of findings in Security Hub may be high, so you may need to prioritize which findings require immediate action. Security Hub natively gives you the ability to filter findings by resource, account, severity, and many other details.

As part of the findings, you can send notifications through alerts that are generated by SIEM on OpenSearch Service in several ways: Amazon Simple Notification Service (Amazon SNS) by consuming messages in an appropriate tool or configuring recipient email addresses, Amazon Chime, Slack (using AWS Chatbot) or custom webhook to your organization’s ticketing system. You can then respond to these new security incident-oriented findings through ticketing, chat, or incident management systems.

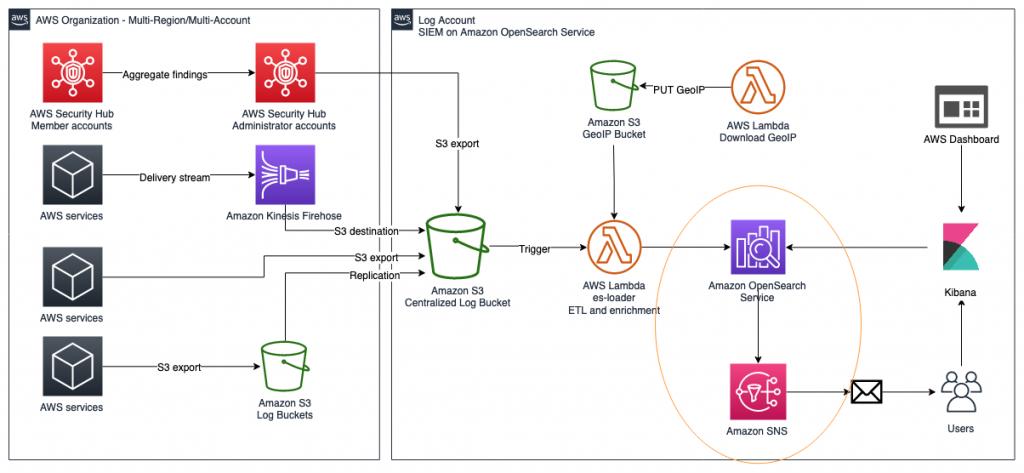
Solution overview for use case 1

Figure 4: Solution overview diagram

Figure 4: Solution overview diagram

Figure 4 gives an overview of the solution for use case 1. This solution requires that you have Security Hub and GuardDuty enabled in your AWS account. Logs from AWS services, including Security Hub, are ingested into an S3 bucket, then are automatically extracted, transformed, and loaded (ETL) and populated into the SIEM system that is running on OpenSearch Service using AWS Lambda. After capturing the logs, you will be able to visualize them on the dashboard and analyze correlations of multiple logs. Within the SIEM on OpenSearch Service solution, you will create a rule to detect failures, such as CloudTrail authentication failures in logs. Then, you will configure the solution to publish alerts to Amazon SNS and send emails when logs match rules.

Implement the solution for use case 1

You will now set up this workflow to alert you by email when logs in OpenSearch match certain rules that you create.

Step 1: Create and visualize findings in OpenSearch Dashboards

Security Hub and other AWS services export findings to Amazon S3 in a centralized log bucket. You can ingest logs from CloudTrail, VPC Flow Logs, and GuardDuty, which are often used in AWS security analytics. In this step, you import simulated security incident data in OpenSearch Dashboards, and use the dashboard to visualize the data in the logs.

To navigate OpenSearch Dashboards

  1. Generate pseudo-security incidents. You can simulate the results by generating sample findings in GuardDuty.
  2. In OpenSearch Dashboards, go to the Discover screen. The Discover screen is divided into three major sections: Search bar, index/display field list, and time-series display, as shown in Figure 5.
    Figure 5: OpenSearch Dashboards

    Figure 5: OpenSearch Dashboards

  3. In OpenSearch Dashboards, select log-aws-securityhub-* or log-aws-vpcflowlogs-* or log-aws-cloudtrail-* or any other index patterns and add event.module to the display field. event.module is a field that indicates where the log originates from. If you are collecting other threat information, such as Security Hub, @log-type is Security Hub, and event.module indicates where the log originated from (either Amazon Inspector or Amazon Macie for example). After you have added event.module, filter the desired Security Hub integrated service (for example, Amazon Inspector) to display. When testing the environment covered in this blog post outside a production context, you can use Kinesis Data Generator to generate sample user traffic. Other tools are also available.
  4. Select the following on the dashboard to see the visualized information:
    • CloudTrail Summary
    • VpcFlowLogs Summary
    • GuardDuty Summary
    • All – Threat Hunting

Step 2: Configure alerts to match log criteria

Next, you will configure alerts to match log criteria. First you need to set the destination for alerts, and then set what to monitor.

To configure alerts

  1. In OpenSearch Dashboards, in the left menu, choose Alerting.
  2. To add the details of SNS, on the Destinations tab, choose Add destinations, and enter the following parameters:
    • Name: aes-siem-alert-destination
    • Type: Amazon SNS
    • SNS Alert: arn:aws:sns:<AWS-REGION>:<111111111111>:aes-siem-alert
      • Replace <111111111111> with your AWS account ID and correct the Region name
      • Replace <AWS-REGION> with the Region you are using, for example, eu-west-1
    • IAM Role ARN: arn:aws:iam::<111111111111>:role/aes-siem-sns-role
      • Replace &<111111111111> with your AWS account ID
  3. Choose Create to complete setting the alert destination.
    Figure 6: Edit alert destination

    Figure 6: Edit alert destination

  4. In OpenSearch Dashboards, in the left menu, select Alerting. You will now set what to monitor. Here you monitor a CloudTrail trail authentication failure. There are two normalized log times: @timestamp and event.ingested. The difference is between the log occurrence time (@timestamp) and the SIEM reception time (event.ingested). Use event.ingested for logs with a large time lag from occurrence to reception. You can specify flexible conditions by selecting Define using extraction query for the filter definition.
  5. On the Monitors tab, choose Create monitor.
  6. Enter the following parameters. If there is no description, use the default value.
    • Name: Authentication failed
    • Method of definition: Define using extraction query
    • Indices: log-aws-cloudtrail-* (manual input, not pull-down)
    • Define extraction query: Enter the following query.
      {
      	"query": {
      		"bool": {
      			"filter": [
      			{"term": {"eventSource": "signin.amazonaws.com"}},
      			{"term": {"event.outcome": "failure"}},
      			{"range": {
      				"event.ingested": {
      				"from": "{{period_end}}||-20m",
      				"to": "{{period_end}}"}}
      				}
      			]
      		}
      	}
      }
      

  7. Enter the following remaining parameters of the monitor:
    • Frequency: By interval
    • Monitor schedule: Every 3 minutes
  8. Choose Create to create the monitor.

Step 3: Set up trigger to send email via Amazon SNS

Now you will set the alert firing condition, known as the trigger. This is the setting for alerting when the monitored conditions (Monitors) are met. By default, the alert will be triggered if the number of hits is greater than 0. In this step , you will not change it, only give it a name.

To set up the trigger

  1. Select Create trigger and for Trigger name, enter Authentication failed trigger.
  2. Scroll down to Configure actions.
    Figure 7: Create trigger

    Figure 7: Create trigger

  3. Set what the trigger should do (action). In this case, you want to publish to SNS. Set the following parameters for the body of the email
    • Action name: Authentication failed action
    • Destination: Choose aes-siem-alert-destination – (Amazon SNS)
    • Message subject: (SIEM) Auth failure alert
    • Action throttling: Select Enable action throttling, and set throttle action to only trigger every 10 minutes.
    • Message: Copy and paste the following message into the text box. After pasting, choose Send test message at the bottom right of the screen to confirm that you can receive the test email.

      Monitor ctx.monitor.name just entered alert status. Please investigate the issue.

      Trigger: ctx.trigger.name

      Severity: ctx.trigger.severity

      @timestamp: ctx.results.0.hits.hits.0._source.@timestamp

      event.action: ctx.results.0.hits.hits.0._source.event.action

      error.message: ctx.results.0.hits.hits.0._source.error.message

      count: ctx.results.0.hits.total.value

      source.ip: ctx.results.0.hits.hits.0._source.source.ip

      source.geo.country_name: ctx.results.0.hits.hits.0._source.source.geo.country_name

    Figure 8: Configure actions

    Figure 8: Configure actions

  4. You will receive an alert email in a few minutes. You can check the occurrence status, including the history, by the following method:
    1. In OpenSearch Dashboards, on the left menu, choose Alerting.
    2. On the Monitors tab, choose Authentication failed.
    3. You can check the status of the alert in the History pane.
    Figure 9: Email alert

    Figure 9: Email alert

Use case 1 shows you how to correlate various Security Hub findings through this OpenSearch Service SIEM solution. However, you can take the solution a step further and build more complex correlation checks by following the procedure in the blog post Correlate security findings with AWS Security Hub and Amazon EventBridge. This information can then be ingested into this OpenSearch Service SIEM solution for viewing on a single screen.

Use case 2: Store findings for longer than 90 days after last update date

Security Hub has a maximum storage time of 90 days for events, but your organization might require data storage beyond that period, with flexibility to specify a custom retention period to meet your needs. The SIEM on Amazon OpenSearch Service solution creates a centralized S3 bucket where findings from Security Hub and various other services are collected and stored, and this bucket can be configured to store data as long as you require. The S3 bucket can persist data indefinitely, or you can create an S3 object lifecycle policy to set a custom retention timeframe. Lifecycle policies allow you to either transition objects between S3 storage classes or delete objects after a specified period. Alternatively, you can use S3 Intelligent-Tiering to allow the Amazon S3 service to move data between tiers, based on user access patterns.

Either lifecycle policies or S3 Intelligent-Tiering will allow you to optimize costs for data that is stored in S3, to keep data for archive or backup purposes when it is no longer available in Security Hub or OpenSearch Service. Within the solution, this centralized bucket is called aes-siem-xxxxxxxx-log and is configured to store data for OpenSearch Service to consume indefinitely. The Amazon S3 User Guide has instructions for configuring an S3 lifecycle policy that is explicitly defined by the user on the centralized bucket. Or you can follow the instructions for configuring intelligent tiering to allow the S3 service to manage which tier data is stored in automatically. After data is archived, you can use Amazon Athena to query the S3 bucket for historical information that has been removed from OpenSearch Service, because this S3 bucket acts as a centralized security event repository.

Use case 3: Aggregate findings across multiple administrator accounts

There are cases where you might have multiple Security Hub administrator accounts within one or multiple organizations. For these use cases, you can consolidate findings across these multiple Security Hub administrator accounts into a single S3 bucket for centralized storage, archive, backup, and querying. This gives you the ability to create a single SIEM on OpenSearch Service to minimize the number of monitoring tools you need. In order to do this, you can use S3 replication to automatically copy findings to a centralized S3 bucket. You can follow this detailed walkthrough on how to set up the correct bucket permissions in order to allow replication between the accounts. You can also follow this related blog post to configure cross-Region Security Hub findings that are centralized in a single S3 bucket, if cross-Region replication is appropriate for your security needs. With cross-account S3 replication set up for Security Hub archived event data, you can import data from the centralized S3 bucket into OpenSearch Service by using the Lambda function within the solution in this blog post. This Lambda function automatically normalizes and enriches the log data and imports it into OpenSearch Service, so that users only need to configure data storage in the S3 bucket, and the Lambda function will automatically import the data.

Conclusion

In this blog post, we showed how you can use Security Hub with a SIEM to store findings for longer than 90 days, aggregate findings across multiple administrator accounts, and correlate Security Hub findings with each other and other log sources. We used the solution to walk through building the SIEM and explained how Security Hub could be used within that solution to add greater flexibility. This post describes one solution to create your own SIEM using OpenSearch Service; however, we also recommend that you read the blog post Visualize AWS Security Hub Findings using Analytics and Business Intelligence Tools, in order to see a different method of consolidating and visualizing insights from Security Hub.

To learn more, you can also try out this solution through the new SIEM on AWS OpenSearch Service workshop.

If you have feedback about this blog post, submit comments in the Comments section below. If you have questions about this blog post, please start a new thread on the Security Hub forum or contact AWS Support.

 
If you have feedback about this post, submit comments in the Comments section below. If you have questions about this post, contact AWS Support.

Want more AWS Security news? Follow us on Twitter.

Ely Kahn

Ely Kahn

Ely Kahn is the Principal Product Manager for AWS Security Hub. Before his time at AWS, Ely was a co-founder for Sqrrl, a security analytics startup that AWS acquired and is now Amazon Detective. Earlier, Ely served in a variety of positions in the federal government, including Director of Cybersecurity at the National Security Council in the White House.

Anthony Pasquariello

Anthony Pasquariello

Anthony Pasquariello is a Senior Solutions Architect at AWS based in New York City. He specializes in modernization and security for our advanced enterprise customers. Anthony enjoys writing and speaking about all things cloud. He’s pursuing an MBA, and received his MS and BS in Electrical & Computer Engineering.

Aashmeet Kalra

Aashmeet Kalra

Aashmeet Kalra is a Principal Solutions Architect working in the Global and Strategic team at AWS in San Francisco. Aashmeet has over 17 years of experience designing and developing innovative solutions for customers globally. She specializes in advanced analytics, machine learning and builder/developer experience.

Grant Joslyn

Grant Joslyn

Grant Joslyn is a solutions architect for the US state and local government public sector team at Amazon Web Services (AWS). He specializes in end user compute and cloud automation. He provides technical and architectural guidance to customers building secure solutions on AWS. He is a subject matter expert and thought leader for strategic initiatives that help customers embrace DevOps practices.

Akihiro Nakajima

Akihiro Nakajima

Akihiro Nakajima is a Senior Solutions Architect, Security Specialist at Amazon Web Services Japan. He has more than 20 years of experience in security, specifically focused on incident analysis and response, threat hunting, and digital forensics. He leads development of open-source software, “SIEM on Amazon OpenSearch Service”.

Network performance update: Security Week

Post Syndicated from David Tuber original https://blog.cloudflare.com/network-performance-update-security-week/

Network performance update: Security Week

Network performance update: Security Week

Almost a year ago, we shared extensive benchmarking results of last mile networks all around the world. The results showed that on a range of tests (TCP connection time, time to first byte, time to last byte), and on different measures (p95, mean), Cloudflare was the fastest provider in 49% of networks around the world. Since then, we’ve worked to continuously improve performance towards the ultimate goal of being the fastest everywhere. We set a goal to grow the number of networks where we’re the fastest by 10% every Innovation Week. We met that goal last year, and we’re carrying the work over to 2022.

Today, we’re proud to report we are the fastest provider in 71% of the top 1,000 most reported networks around the world. Of course, we’re not done yet, but we wanted to share the latest results and explain how we did it.

Measuring what matters

To quantify network performance, we have to get enough data from around the world, across all manner of different networks, comparing ourselves with other providers. We used Real User Measurements (RUM) to fetch a 100kb file from several different providers. Users around the world report the performance of different providers. The more users who report the data, the higher fidelity the signal is. The goal is to provide an accurate picture of where different providers are faster, and more importantly, where Cloudflare can improve. You can read more about the methodology in the original Speed Week blog post here.

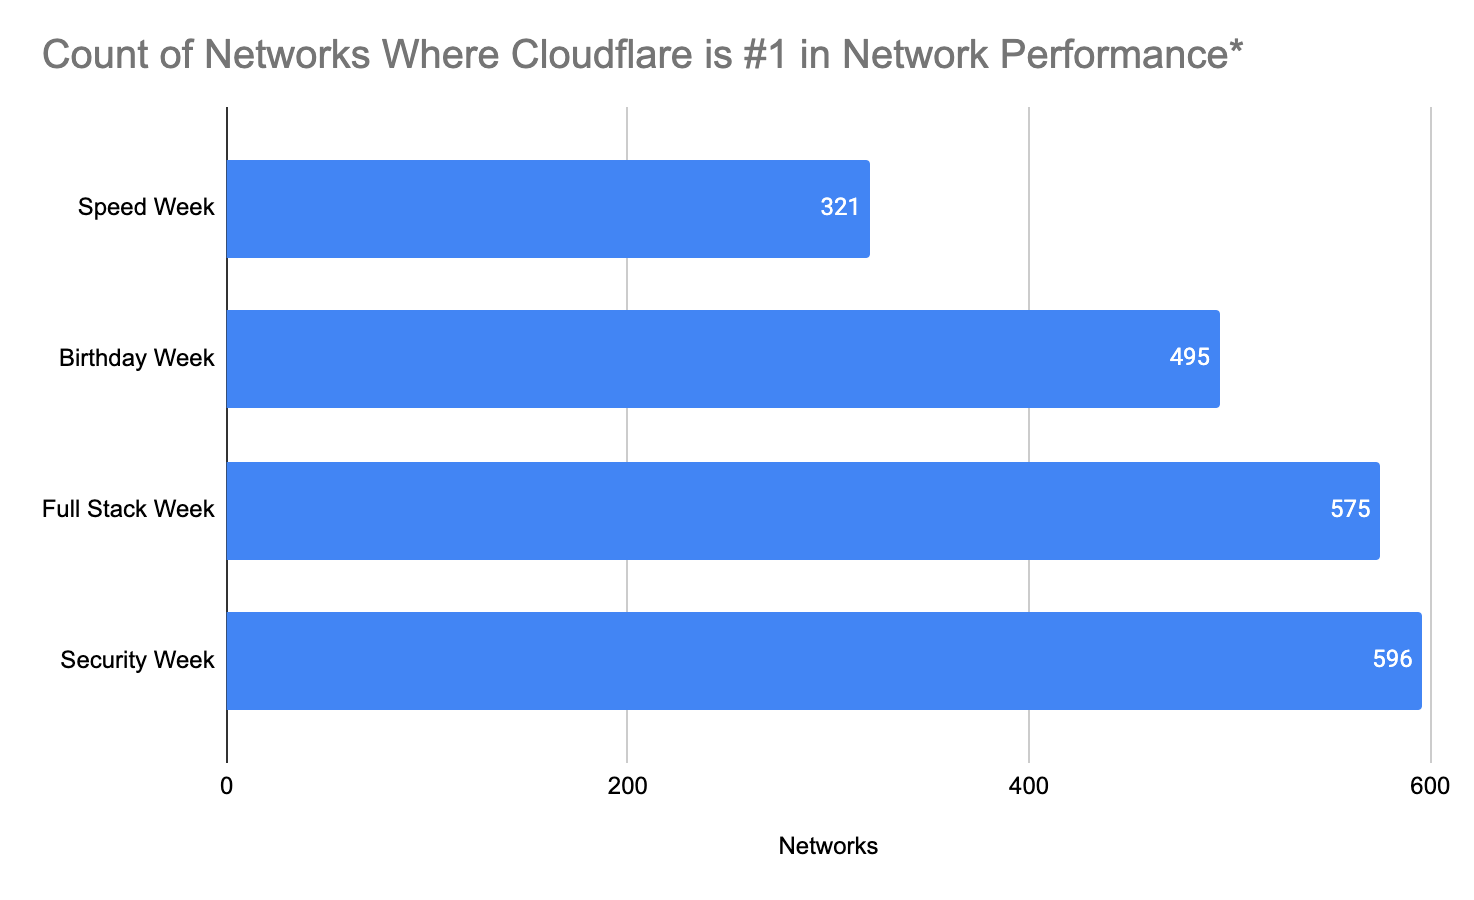
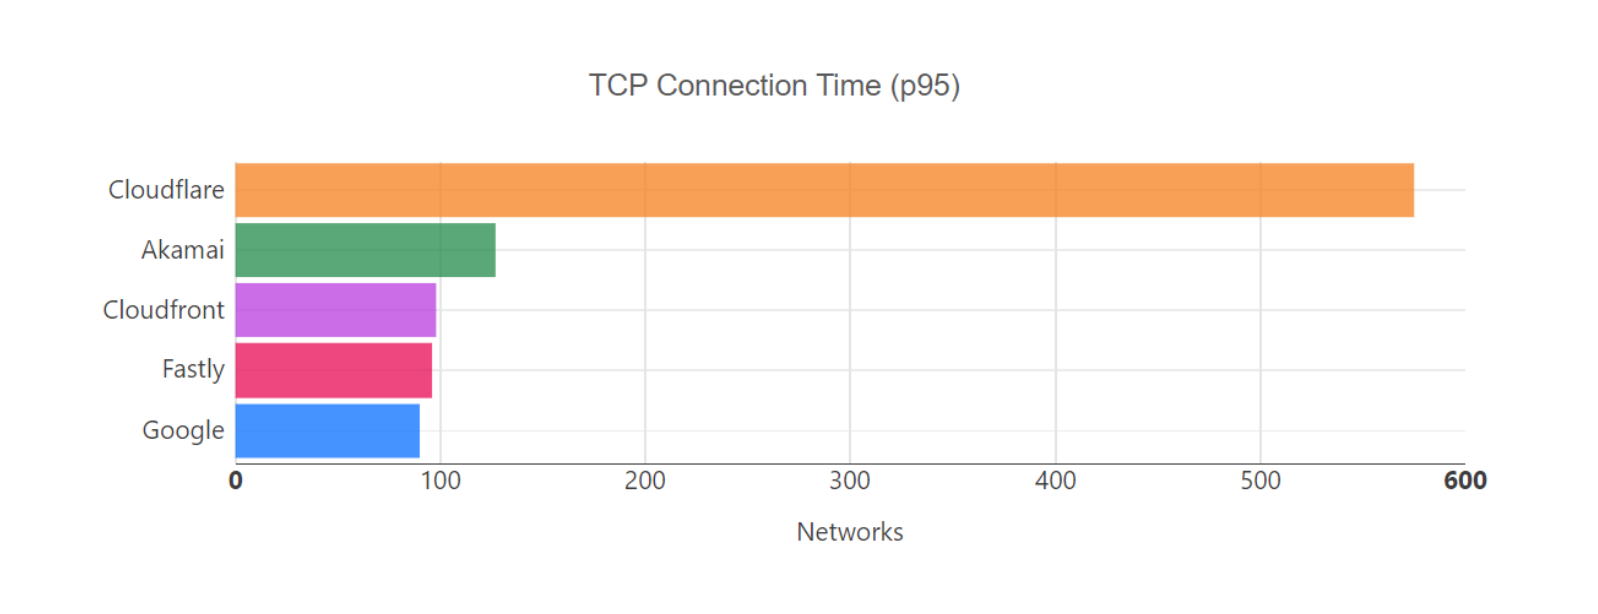
In the process of quantifying network performance, it became clear where we were not the fastest everywhere. After Full Stack Week, we found 596 country/network pairs where we were more than 100ms behind the leading provider (where a country/network pair is defined as the performance of a network within a particular country).

We are constantly going through the process of figuring out why we were slow — and then improving. The challenges we faced were unique to each network and highlighted a variety of different issues that are prevalent on the Internet. We’re going to deep dive into a couple of networks, and show how we diagnosed and then improved performance.

But before we do, here are the results of our efforts since Full Stack Week.

Network performance update: Security Week

*Performance is defined by p95 TCP connection time across top 1,000 networks in the world by number of IPv4 addresses advertised

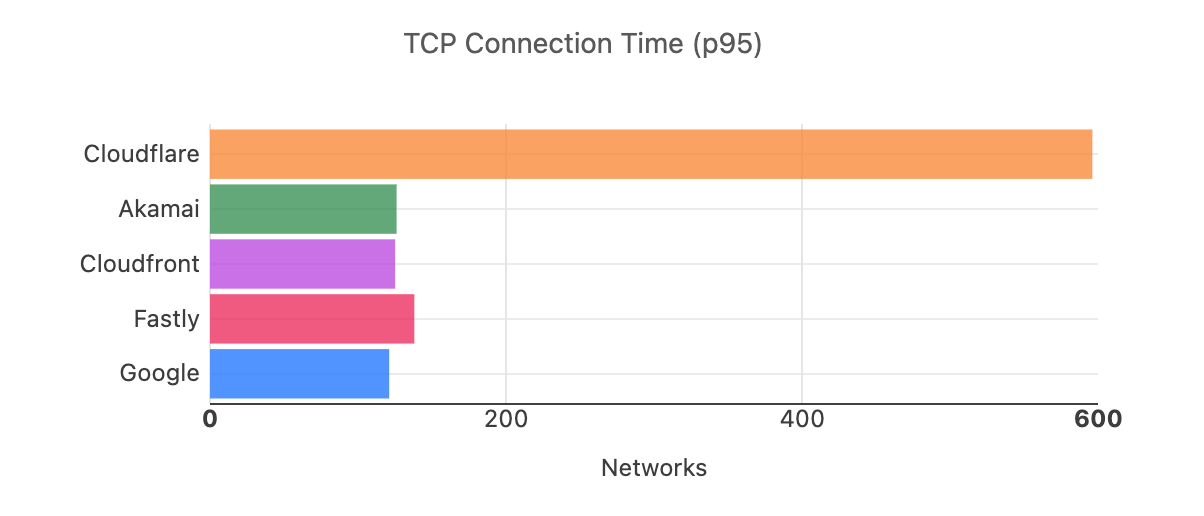
Network performance update: Security Week

*Performance is defined by p95 TCP connection time across top 1,000 networks in the world by number of IPv4 addresses advertised

Curing congestion in Canada

In the spirit of Security Week, we want to highlight how a Magic Transit (Cloudflare’s network layer DDoS security) customer’s network problems provided line of sight into their internal congestion issues, and how our network was able to mitigate the problem in the short term.

One Magic Transit customer saw congestion in Canada due to insufficient peering with the Internet at key interconnection points. Congestion for customers means bad performance for users: for games, it can lead to lag and jittery gameplay, for video streaming, it can lead to buffering and poor resolution, and for video/VoIP applications, it can lead to calls dropping, garbled video/voice, and sections of calls missing entirely. Fixing congestion in this case means improving the way this customer connects to the rest of the Internet to make the user experience better for both the customer and users.

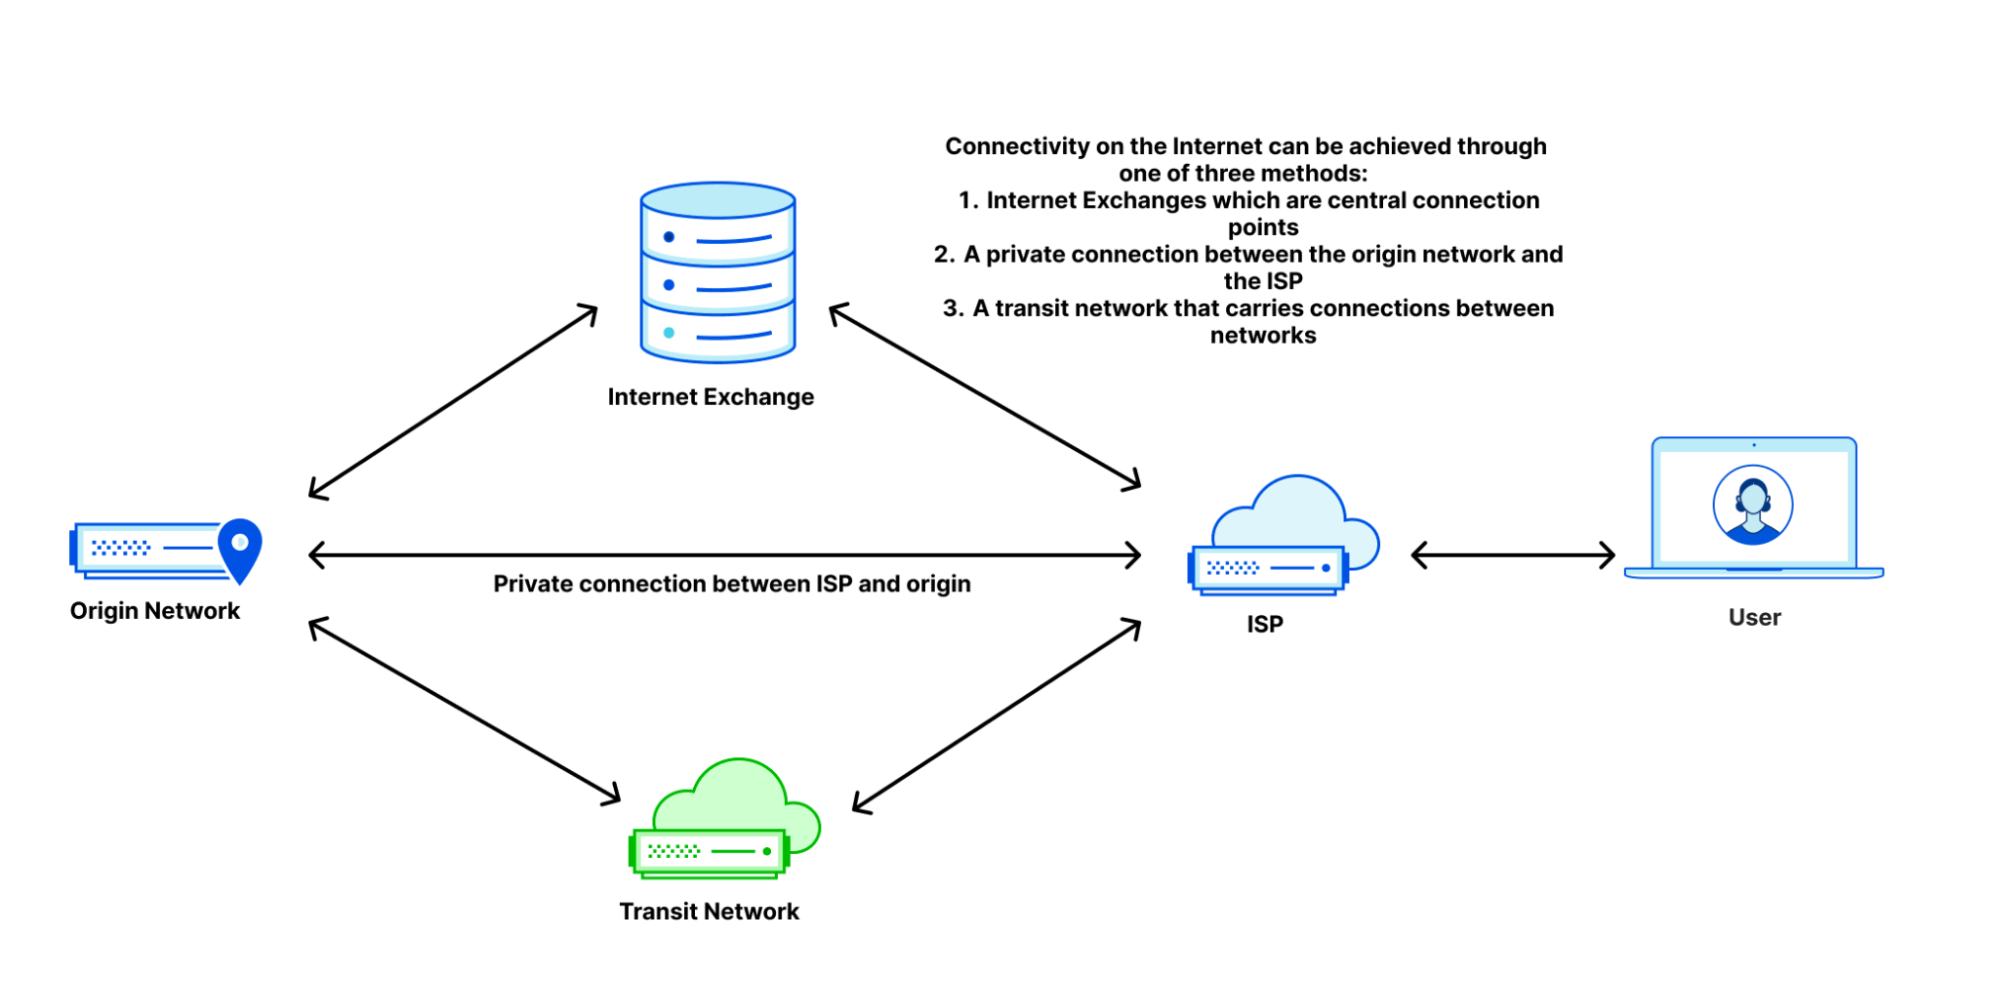
When customers connect to the Internet, they can do so in several ways: through an ISP that connects to other networks, through an Internet Exchange which houses many different providers interconnecting at a singular point, or point-to-point connections with other providers.

Network performance update: Security Week

In the case of this customer, they had direct connections to other providers and to Internet exchanges. They ran out of bandwidth with their point-to-point connections, meaning that they had too much traffic for the size of the links they had bought, which meant that the excess traffic had to go over Internet Exchanges that were out of the way, creating suboptimal network paths which increased latency.

We were able to use our network to help solve this problem. In the short term, we spread the traffic away from the congestion points. This removed hairpins to immediately improve the user experience. This restored service for this customer and all of their users.

Then, we went into action by accelerating previously planned upgrades of all of our Internet Exchange (IX) ports across Canada to ensure that we had enough capacity to handle them, even though the congestion wasn’t happening on our network. Finally, we reached out to the customer’s provider and quickly set up direct peering with them in Canada to provide direct interconnection close to the customer, so that we could provide them with a much better Internet experience. These actions made us the fastest provider on networks in Canada as well.

Keeping traffic in Australia

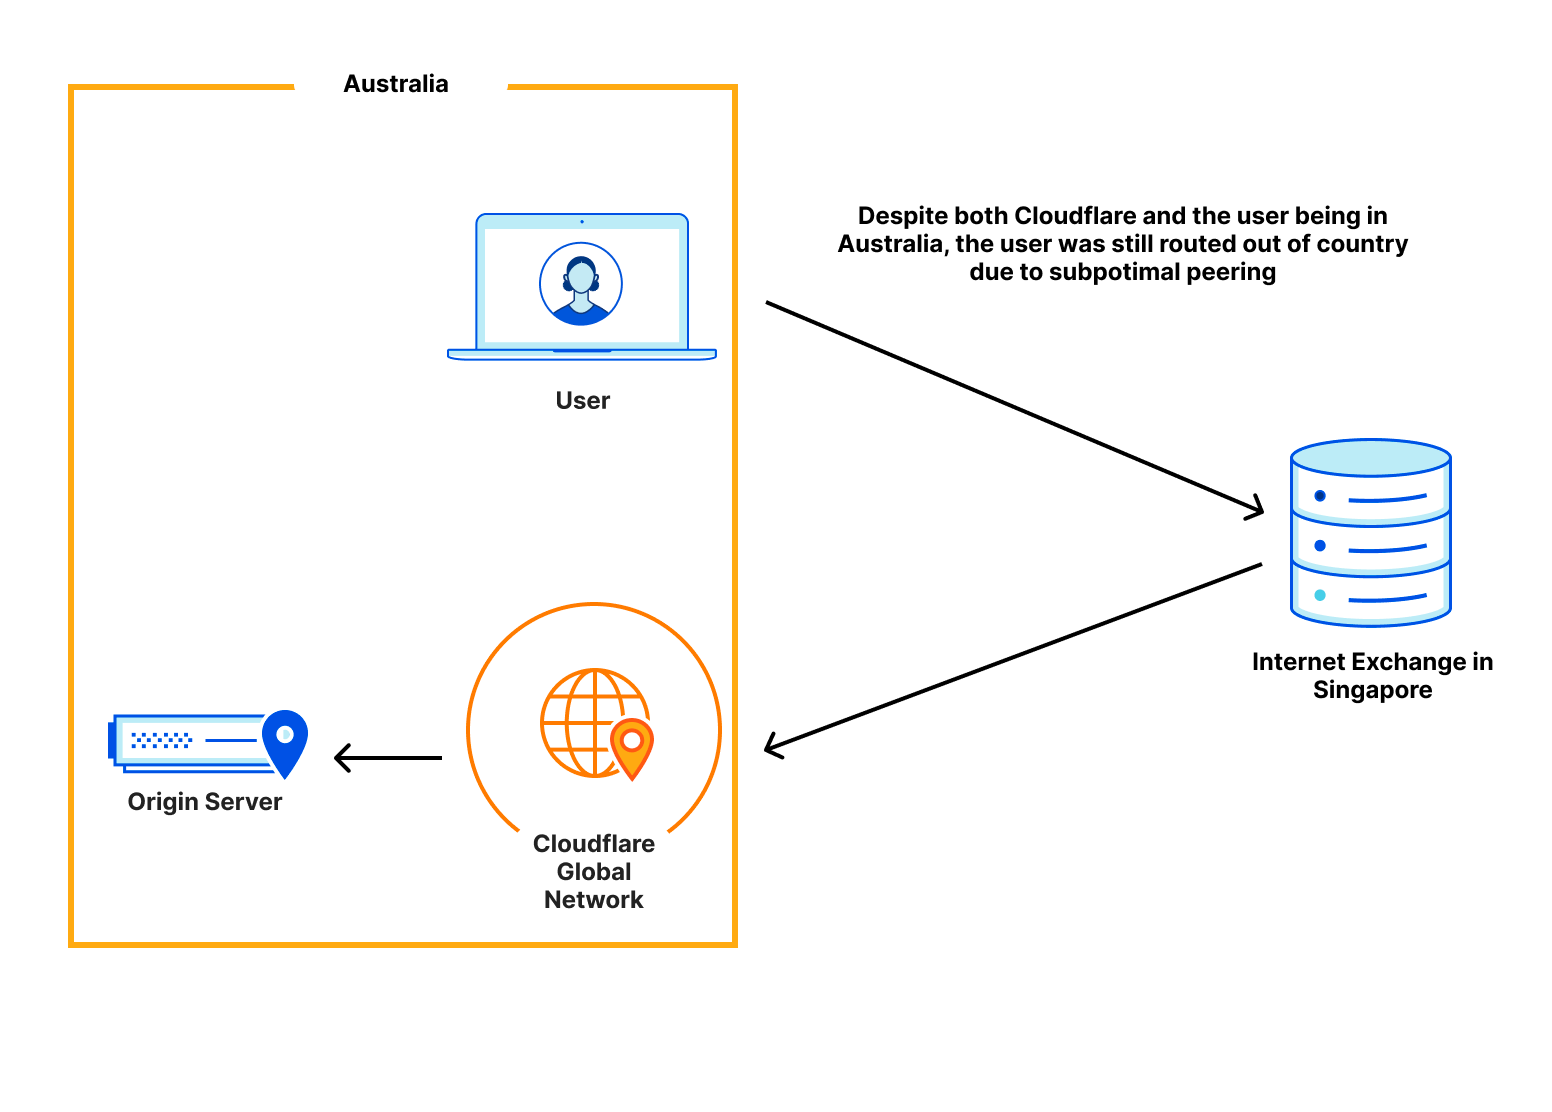
Next, we turn to a network that had poor performance in Australia. Users for that network were going all the way out of the country before going to Cloudflare. This created what is called a network hairpin. A network hairpin is caused by suboptimal connectivity in certain locations, which can cause users to traverse a network path that takes longer than it should. This hairpin effect made Cloudflare one of the slower providers for this network in Australia.

Network performance update: Security Week

To fix this, Cloudflare set up peering with this network in Sydney, and this allowed traffic from this network to go to Cloudflare within the country the network was based in. This reduced our connection time from 65ms to 45ms, catapulting us to be the #1 provider for this network in the region.

Update on Full Stack Week

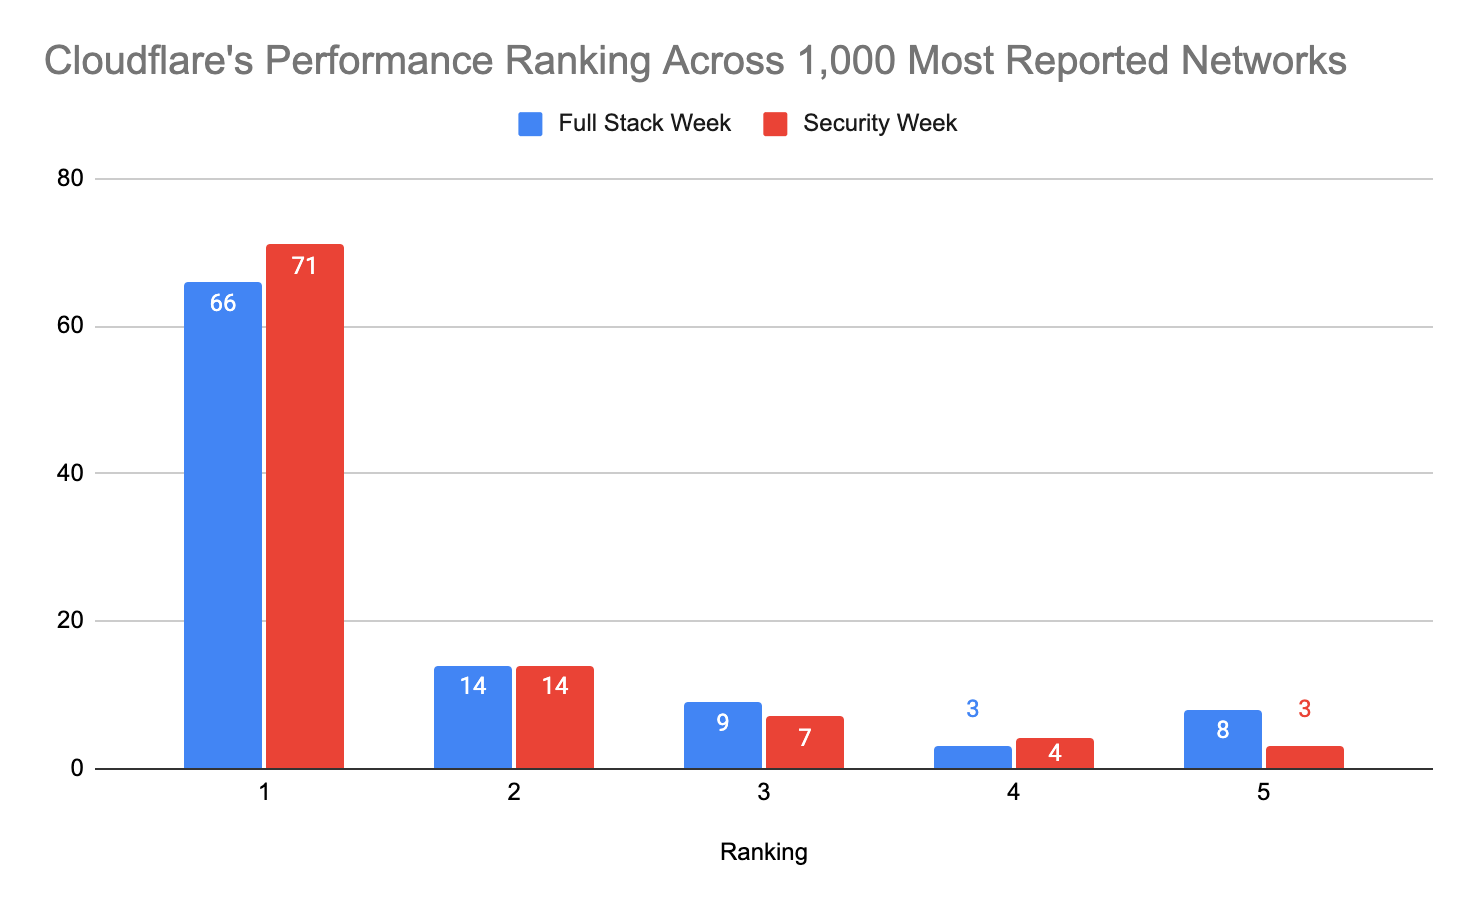
All of this work and more has helped us optimize our network even further. At Full Stack Week, we announced that we were faster in more of the most reported networks than our competitors.  Out of the top 1,000 networks in the world (by number of IPv4 addresses advertised), here’s a breakdown of how many providers are number 1 in p95 TCP Connection Time, which represents the time it takes for a user to connect to the provider.  This data is from Full Stack Week (November 2021):

Network performance update: Security Week

As of Security Week, we improved our position to be faster in 19 new networks:

Network performance update: Security Week

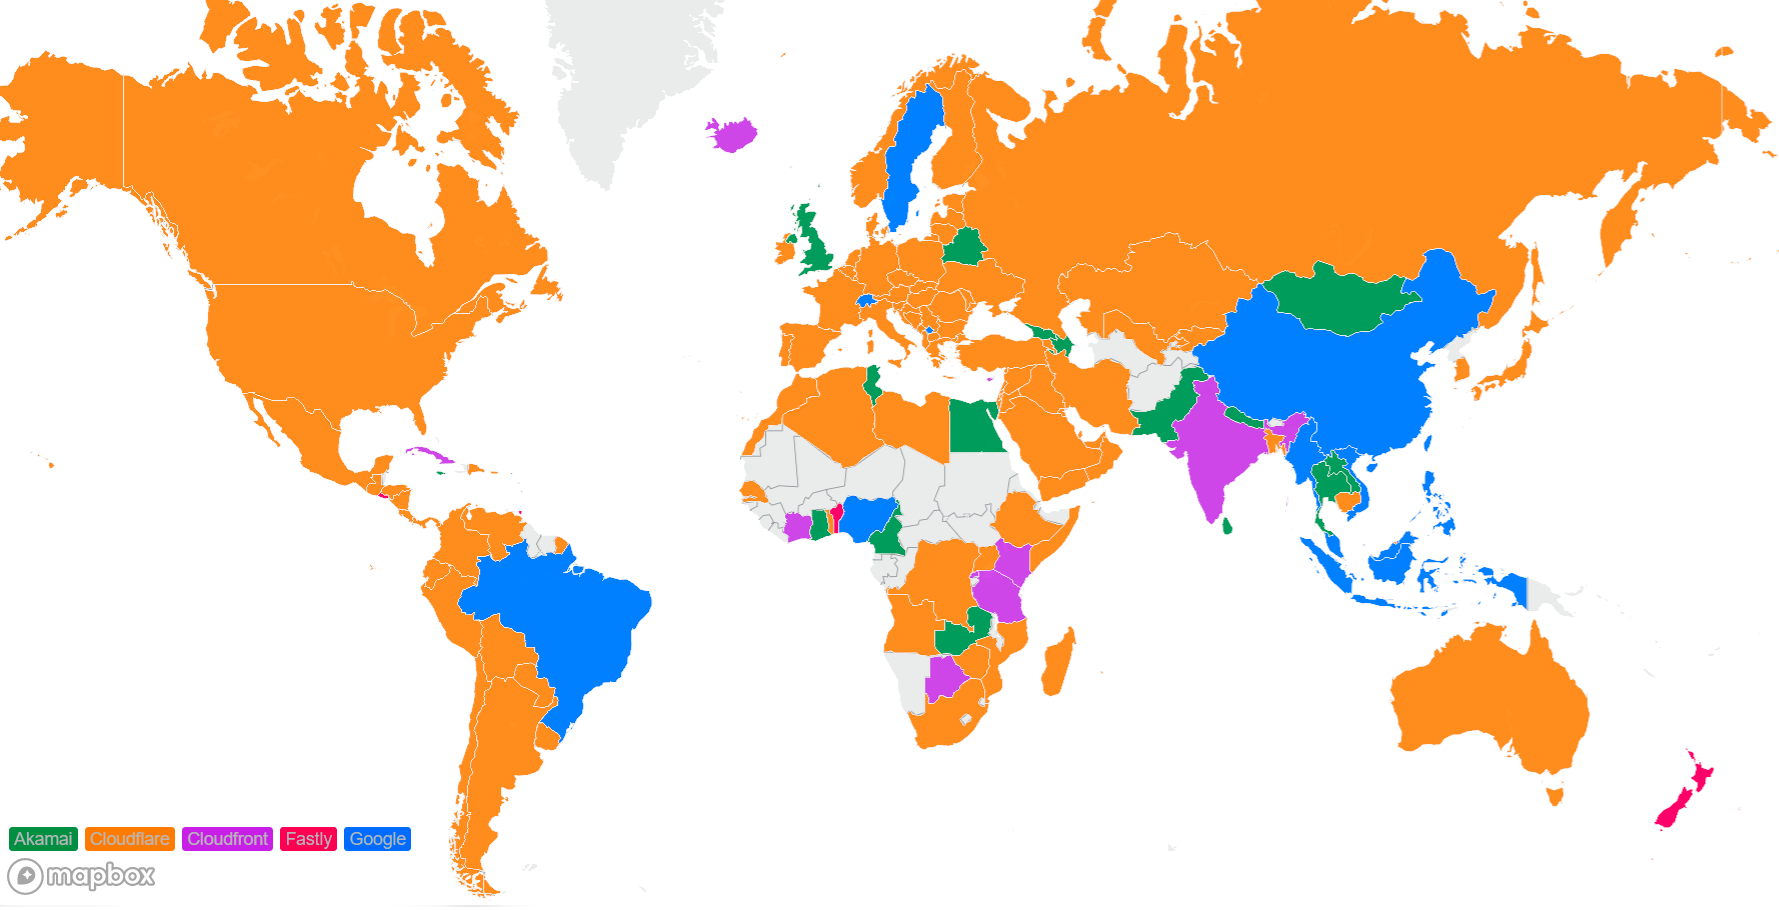
Cloudflare is also committed to being the fastest provider in every country. This is a world map using the data that was to show the countries with the fastest network provider during Full Stack Week (November 2021):

Network performance update: Security Week

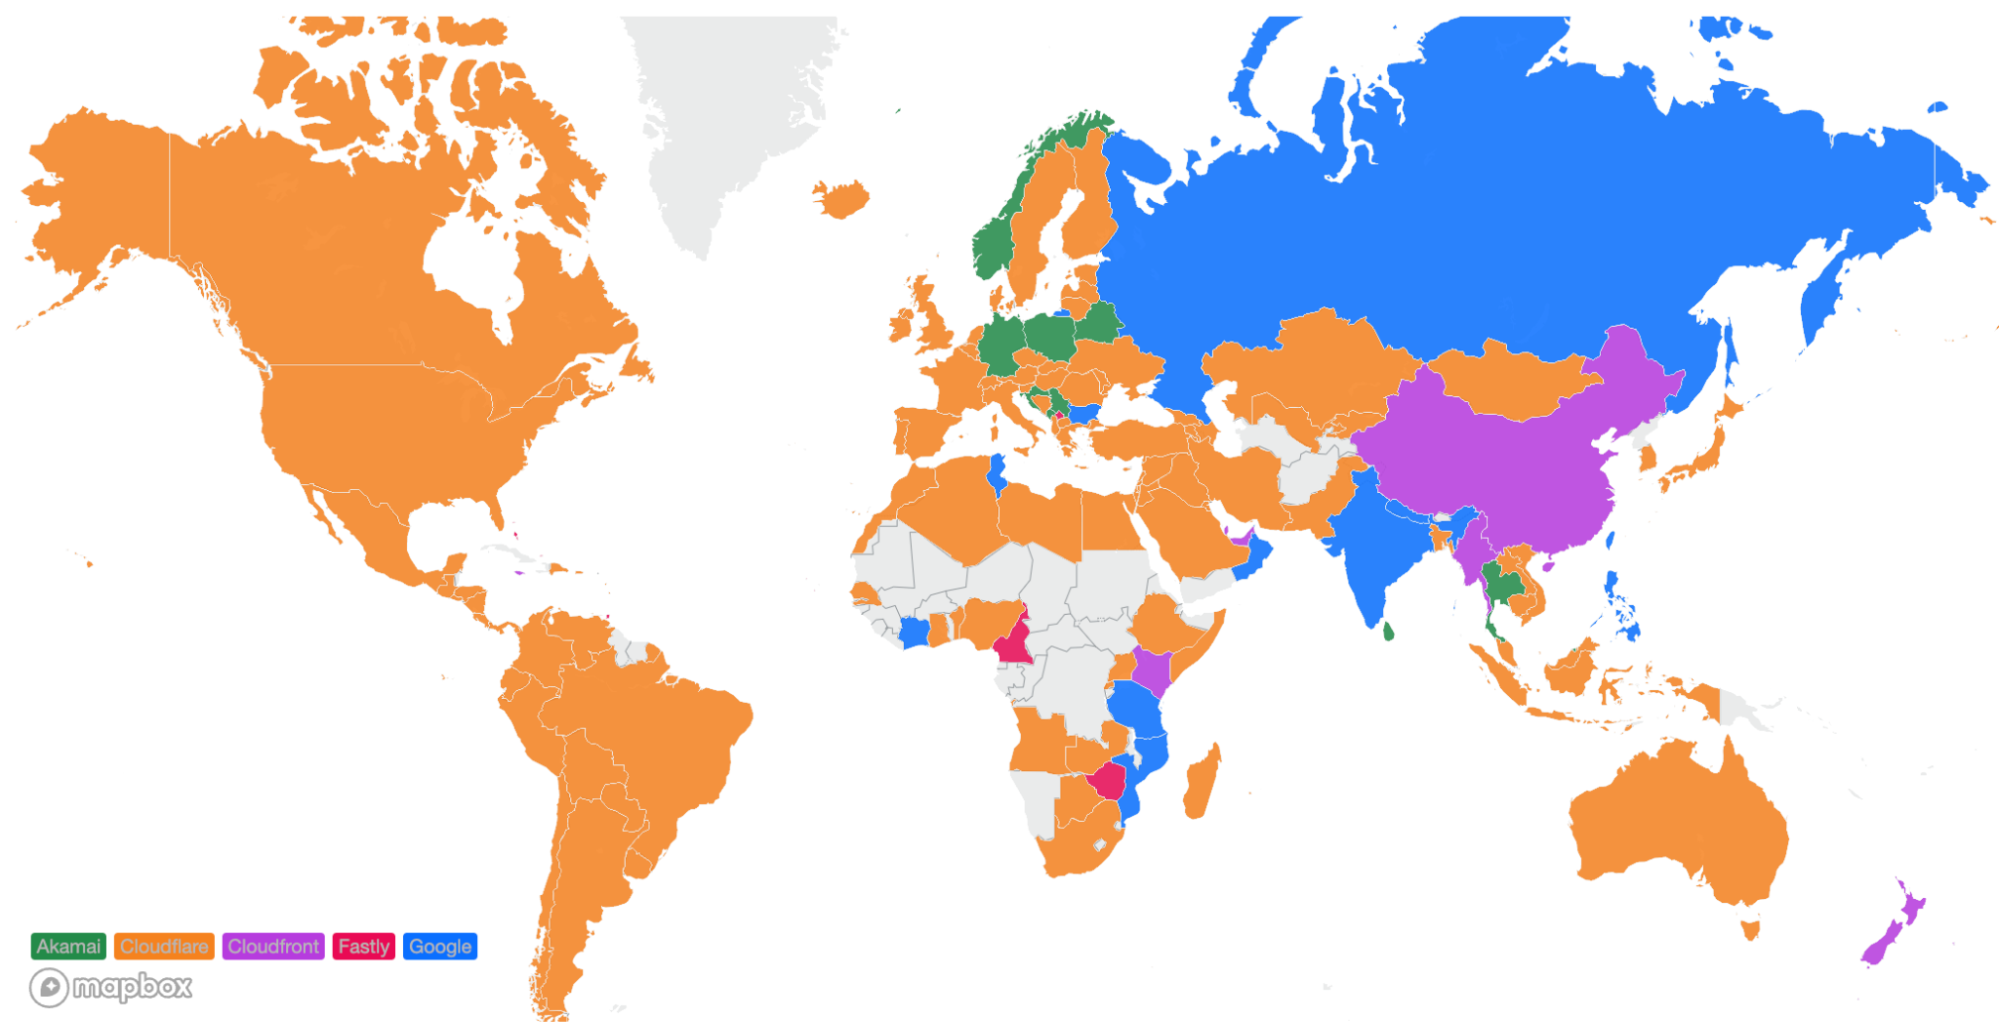
Here’s how the map of the world looks during Security Week (March 2022):

Network performance update: Security Week

We moved to number 1 in all of South America, more countries in Africa, the UK, Sweden, Iceland, and also more countries in the Asia Pacific region.

A fast network means fast security products

Cloudflare’s commitment to building the fastest network allows us to deliver unparalleled performance for all applications, including our security applications. There’s an adage in the industry that you have to sacrifice performance for security, but Cloudflare believes that you should be able to have your security and performance without having to sacrifice either. We’ve unveiled a ton of awesome new products and features for Security Week and all of them are built on top of our lightning-fast network. That means that all of these products will continue to get faster as we relentlessly pursue our goal of being the fastest network everywhere.

Queueing Amazon Pinpoint API calls to distribute SMS spikes

Post Syndicated from satyaso original https://aws.amazon.com/blogs/messaging-and-targeting/queueing-amazon-pinpoint-api-calls-to-distribute-sms-spikes/

Organizations across industries and verticals have user bases spread around the globe. Amazon Pinpoint enables them to send SMS messages to a global audience through a single API endpoint, and the messages are routed to destination countries by the service. Amazon Pinpoint utilizes downstream SMS providers to deliver the messages and these SMS providers offer a limited country specific threshold for sending SMS (referred to as Transactions Per Second or TPS). These thresholds are imposed by telecom regulators in each country to prohibit spamming. If customer applications send more messages than the threshold for a country, downstream SMS providers may reject the delivery.

Such scenarios can be avoided by ensuring that upstream systems do not send more than the permitted number of messages per second. This can be achieved using one of the following mechanisms:

  • Implement rate-limiting on upstream systems which call Amazon Pinpoint APIs.
  • Implement queueing and consume jobs at a pre-configured rate.

While rate-limiting and exponential backoffs are regarded best practices for many use cases, they can cause significant delays in message delivery in particular instances when message throughput is very high. Furthermore, utilizing solely a rate-limiting technique eliminates the potential to maximize throughput per country and priorities communications accordingly. In this blog post, we evaluate a solution based on Amazon SQS queues and how they can be leveraged to ensure that messages are sent with predictable delays.

Solution Overview

The solution consists of an Amazon SNS topic that filters and fans-out incoming messages to set of Amazon SQS queues based on a country parameter on the incoming JSON payload. The messages from the queues are then processed by AWS Lambda functions that in-turn invoke the Amazon Pinpoint APIs across one or more Amazon Pinpoint projects or accounts. The following diagram illustrates the architecture:

Step 1: Ingesting message requests

Upstream applications post messages to a pre-configured SNS topic instead of calling the Amazon Pinpoint APIs directly. This allows applications to post messages at a rate that is higher than Amazon Pinpoint’s TPS limits per country. For applications that are hosted externally, an Amazon API Gateway can also be configured to receive the requests and publish them to the SNS topic – allowing features such as routing and authentication.

Step 2: Queueing and prioritization

The SNS topic implements message filtering based on the country parameter and sends incoming JSON messages to separate SQS queues. This allows configuring downstream consumers based on the priority of individual queues and processing these messages at different rates.

The algorithm and attribute used for implementing message filtering can vary based on requirements. Similarly, filtering can be enabled based on business use-cases such as “REMINDERS”,   “VERIFICATION”, “OFFERS”, “EVENT NOTIFICATIONS” etc. as well. In this example, the messages are filtered based on a country attribute shown below:

Based on the filtering logic implemented, the messages are delivered to the corresponding SQS queues for further processing. Delivery failures are handled through a Dead Letter Queue (DLQ), enabling messages to be retried and pushed back into the queues.

Step 3: Consuming queue messages at fixed-rate

The messages from SQS queues are consumed by AWS Lambda functions that are configured per queue. These are light-weight functions that read messages in pre-configured batch sizes and call the Amazon Pinpoint Send Messages API. API call failures are handled through 1/ Exponential Backoff within the AWS SDK calls and 2/ DLQs setup as Destination Configs on the Lambda functions. The Amazon Pinpoint Send Messages API is a batch API that allows sending messages to 100 recipients at a time. As such, it is possible to have requests succeed partially – messages, within a single API call, that fail/throttle should also be sent to the DLQ and retried again.

The Lambda functions are configured to run at a fixed reserve concurrency value. This ensures that a fixed rate of messages is fetched from the queue and processed at any point of time. For example, a Lambda function receives messages from an SQS queue and calls the Amazon Pinpoint APIs. It has a reserved concurrency of 10 with a batch size of 10 items. The SQS queue rapidly receives 1,000 messages. The Lambda function scales up to 10 concurrent instances, each processing 10 messages from the queue. While it takes longer to process the entire queue, this results in a consistent rate of API invocations for Amazon Pinpoint.

Step 4: Monitoring and observability

Monitoring tools record performance statistics over time so that usage patterns can be identified. Timely detection of a problem (ideally before it affects end users) is the first step in observability. Detection should be proactive and multi-faceted, including alarms when performance thresholds are breached. For the architecture proposed in this blog, observability is enabled by using Amazon Cloudwatch and AWS X-Ray.

Some of the key metrics that are monitored using Amazon Cloudwatch are as follows:

  • Amazon Pinpoint
    • DirectSendMessagePermanentFailure
    • DirectSendMessageTemporaryFailure
    • DirectSendMessageThrottled
  • AWS Lambda
    • Invocations
    • Errors
    • Throttles
    • Duration
    • ConcurrentExecutions
  • Amazon SQS
    • ApproximateAgeOfOldestMessage
    • NumberOfMessagesSent
    • NumberOfMessagesReceived
  • Amazon SNS
    • NumberOfMessagesPublished
    • NumberOfNotificationsDelivered
    • NumberOfNotificationsFailed
    • NumberOfNotificationsRedrivenToDlq

AWS X-Ray helps developers analyze and debug production, distributed applications, such as those built using a microservices architecture. With X-Ray, you can understand how the application and its underlying services are performing, to identify and troubleshoot the root cause of performance issues and errors. X-Ray provides an end-to-end view of requests as they travel through your application, and shows a map of your application’s underlying components.

Notes:

  1. If you are using Amazon Pinpoint’s Campaign or Journey feature to deliver SMS to recipients in various countries, you do not need to implement this solution. Amazon Pinpoint will drain messages depending on the MessagesPerSecond configuration pre-defined in the campaign/journey settings.
  2. If you need to send transactional SMS to a small number of countries (one or two), you should work with AWS support to define your SMS sending throughput for those countries to accommodate spikey SMS message traffic instead.

Conclusion

This post shows how customers can leverage Amazon Pinpoint along with Amazon SQS and AWS Lambda to build, regulate and prioritize SMS deliveries across multiple countries or business use-cases. This leads to predictable delays in message deliveries and provides customers with the ability to control the rate and priority of messages sent using Amazon Pinpoint.


About the Authors

Satyasovan Tripathy works as a Senior Specialist Solution Architect at AWS. He is situated in Bengaluru, India, and focuses on the AWS Digital User Engagement product portfolio. He enjoys reading and travelling outside of work.

Rajdeep Tarat is a Senior Solutions Architect at AWS. He lives in Bengaluru, India and helps customers architect and optimize applications on AWS. In his spare time, he enjoys music, programming, and reading.


[$] A look at some 5.17 development statistics

Post Syndicated from original https://lwn.net/Articles/887559/

At the conclusion of the 5.17 development cycle, 13038 non-merge
changesets had found their way into the mainline repository. That is a
lower level of activity than was seen for 5.16 (14,190 changesets) but well
above 5.15 (12,337). In other words, this was a fairly typical kernel
release. That is true in terms of where the work that made up the release
came from as well.

Developer Sabotages Open-Source Software Package

Post Syndicated from Bruce Schneier original https://www.schneier.com/blog/archives/2022/03/developer-sabotages-open-source-software-package.html

This is a big deal:

A developer has been caught adding malicious code to a popular open-source package that wiped files on computers located in Russia and Belarus as part of a protest that has enraged many users and raised concerns about the safety of free and open source software.

The application, node-ipc, adds remote interprocess communication and neural networking capabilities to other open source code libraries. As a dependency, node-ipc is automatically downloaded and incorporated into other libraries, including ones like Vue.js CLI, which has more than 1 million weekly downloads.

[…]

The node-ipc update is just one example of what some researchers are calling protestware. Experts have begun tracking other open source projects that are also releasing updates calling out the brutality of Russia’s war. This spreadsheet lists 21 separate packages that are affected.

One such package is es5-ext, which provides code for the ECMAScript 6 scripting language specification. A new dependency named postinstall.js, which the developer added on March 7, checks to see if the user’s computer has a Russian IP address, in which case the code broadcasts a “call for peace.”

It constantly surprises non-computer people how much critical software is dependent on the whims of random programmers who inconsistently maintain software libraries. Between log4j and this new protestware, it’s becoming a serious vulnerability. The White House tried to start addressing this problem last year, requiring a “software bill of materials” for government software:

…the term “Software Bill of Materials” or “SBOM” means a formal record containing the details and supply chain relationships of various components used in building software. Software developers and vendors often create products by assembling existing open source and commercial software components. The SBOM enumerates these components in a product. It is analogous to a list of ingredients on food packaging. An SBOM is useful to those who develop or manufacture software, those who select or purchase software, and those who operate software. Developers often use available open source and third-party software components to create a product; an SBOM allows the builder to make sure those components are up to date and to respond quickly to new vulnerabilities. Buyers can use an SBOM to perform vulnerability or license analysis, both of which can be used to evaluate risk in a product. Those who operate software can use SBOMs to quickly and easily determine whether they are at potential risk of a newly discovered vulnerability. A widely used, machine-readable SBOM format allows for greater benefits through automation and tool integration. The SBOMs gain greater value when collectively stored in a repository that can be easily queried by other applications and systems. Understanding the supply chain of software, obtaining an SBOM, and using it to analyze known vulnerabilities are crucial in managing risk.

It’s not a solution, but it’s a start.

EDITED TO ADD (3/22): Brian Krebs on protestware.

Cloud Pentesting, Pt. 1: Breaking Down the Basics

Post Syndicated from Eric Mortaro original https://blog.rapid7.com/2022/03/21/cloud-pentesting-pt-1-breaking-down-the-basics/

Cloud Pentesting, Pt. 1: Breaking Down the Basics

The concept of cloud computing has been around for awhile, but it seems like as of late — at least in the penetration testing field — more and more customers are looking to get a pentest done in their cloud deployment. What does that mean? How does that look? What can be tested, and what’s out of scope? Why would I want a pentest in the cloud? Let’s start with the basics here, to hopefully shed some light on what this is all about, and then we’ll get into the thick of it.

Cloud computing is the idea of using software and services that run on the internet as a way for an organization to deploy their once on-premise systems. This isn’t a new concept — in fact, the major vendors, such as Amazon’s AWS, Microsoft’s Azure, and Google’s Cloud Platform, have all been around for about 15 years. Still, cloud sometimes seems like it’s being talked about as if it was invented just yesterday, but we’ll get into that a bit more later.

So, cloud computing means using someone else’s computer, in a figurative or quite literal sense. Simple enough, right?  

Wrong! There are various ways that companies have started to utilize cloud providers, and these all impact how pentests are carried out in cloud environments. Let’s take a closer look at the three primary cloud configurations.

Traditional cloud usage

Some companies have simply lifted infrastructure and services straight from their own on-premise data centers and moved them into the cloud. This looks a whole lot like setting up one virtual private cloud (VPC), with numerous virtual machines, a flat network, and that’s it! While this might not seem like a company is using their cloud vendor to its fullest potential, they’re still reaping the benefits of never having to manage uptime of physical hardware, calling their ISP late at night because of an outage, or worrying about power outages or cooling.

But one inherent problem remains: The company still requires significant staff to maintain the virtual machines and perform operating system updates, software versioning, cipher suite usage, code base fixes, and more. This starts to look a lot like the typical vulnerability management (VM) program, where IT and security continue to own and maintain infrastructure. They work to patch and harden endpoints in the cloud and are still in line for changes to be committed to the cloud infrastructure.

Cloud-native usage

The other side of cloud adoption is a more mature approach, where a company has devoted time and effort toward transitioning their once on-premise infrastructure to a fully utilized cloud deployment. While this could very well include the use of the typical VPC, network stack, virtual machines, and more, the more mature organization will utilize cloud-native deployments. These could include storage services such as S3, function services, or even cloud-native Kubernetes.

Cloud-native users shift the priorities and responsibilities of IT and security teams so that they no longer act as gatekeepers to prevent the scaling up or out of infrastructure utilized by product teams. In most of these environments, the product teams own the ability to make commitments in the cloud without IT and security input. Meanwhile, IT and security focus on proper controls and configurations to prevent security incidents. Patching is exchanged for rebuilds, and network alerting and physical server isolation are handled through automated responses, such as an alert with AWS Config that automatically changes the security group for a resource in the cloud and isolates it for further investigation.

These types of deployments start to more fully utilize the capabilities of the cloud, such as automated deployment through infrastructure-as-code solutions like AWS Cloud Formation. Gone are the days when an organization would deploy Kubernetes on top of a virtual machine to deploy containers. Now, cloud-native vendors provide this service with AWS’s Elastic Kubernetes Services, Microsoft’s Azure Kubernetes Services, and for obvious reasons, Google’s Kubernetes Engine. These and other types of cloud native deployments really help to ease the burden on the organization.

Hybrid cloud

Then there’s hybrid cloud. This is where a customer can set up their on-premise environment to also tie into their cloud environment, or visa versa. One common theme we see is with Microsoft Azure, where the Azure AD Connect sync is used to synchronize on-premise Active Directory to Azure AD. This can be very beneficial when the company is using other Software-as-a-Service (SaaS) components, such as Microsoft Office 365.  

There are various benefits to utilizing hybrid cloud deployments. Maybe there are specific components that a customer wants to keep in house and support on their own infrastructure. Or perhaps the customer doesn’t yet have experience with how to maintain Kubernetes but is utilizing Google Cloud Platform. The ability to deploy your own services is the key to flexibility, and the cloud helps provide that.

In part two, we’ll take a closer look at how these different cloud deployments impact pentesting in the cloud.

Additional reading:

NEVER MISS A BLOG

Get the latest stories, expertise, and news about security today.

Beingessner: Rust’s Unsafe Pointer Types Need An Overhaul

Post Syndicated from original https://lwn.net/Articles/888693/

Aria Beingessner points out a set of
problems
with Rust’s conception of unsafe pointers and proposes some
fixes in this highly detailed post.

Rust currently says this code is totally cool and fine:

    // Masking off a tag someone packed into a pointer:
    let mut addr = my_ptr as usize;
    addr = addr & !0x1; 
    let new_ptr = addr as *mut T;
    *new_ptr += 10;

This is some pretty bog-standard code for messing with tagged pointers, what’s wrong with that?
[…]

For this to possibly work with Pointer Provenance and Alias Analysis, that
stuff must pervasively infect all integers on the assumption that they
might be pointers. This is a huge pain in the neck for people who are
trying to actually formally define Rust’s memory model, and for people who
are trying to build sanitizers for Rust that catch UB. And I assure you
it’s just as much a headache for all the LLVM and C(++) people too.

Security updates for Monday

Post Syndicated from original https://lwn.net/Articles/888686/

Security updates have been issued by Debian (bind9, chromium, libgit2, libpano13, paramiko, usbredir, and wordpress), Fedora (expat, kernel, openexr, thunderbird, and wordpress), openSUSE (chromium, frr, and weechat), Red Hat (java-1.7.1-ibm and java-1.8.0-ibm), SUSE (frr), and Ubuntu (imagemagick).

Application security: Cloudflare’s view

Post Syndicated from Michael Tremante original https://blog.cloudflare.com/application-security/

Application security: Cloudflare’s view

Application security: Cloudflare’s view

Developers, bloggers, business owners, and large corporations all rely on Cloudflare to keep their applications secure, available, and performant.

To meet these goals, over the last twelve years we have built a smart network capable of protecting many millions of Internet properties. As of March 2022, W3Techs reports that:

“Cloudflare is used by 80.6% of all the websites whose reverse proxy service we know. This is 19.7% of all websites”

Netcraft, another provider who crawls the web and monitors adoption puts this figure at more than 20M active sites in their latest Web Server Survey (February 2022):

“Cloudflare continues to make strong gains amongst the million busiest websites, where it saw the only notable increases, with an additional 3,200 sites helping to bring its market share up to 19.4%”

The breadth and diversity of the sites we protect, and the billions of browsers and devices that interact with them, gives us unique insight into the ever-changing application security trends on the Internet. In this post, we share some of those insights we’ve gathered from the 32 million HTTP requests/second that pass through our network.

Definitions

Before we examine the data, it is useful to define the terminology we use. Throughout this post, we will refer to the following terms:

  • Mitigated Traffic: any eyeball HTTP* request that had a “terminating” action applied to by the Cloudflare platform. These include actions such as BLOCK, CHALLENGE (such as captchas or JavaScript based challenges). This does not include requests that had the following actions applied: LOG, SKIP, ALLOW.
  • Bot Traffic/Automated Traffic: any HTTP request identified by Cloudflare’s Bot Management system as being generated by a bot. This includes requests scored between 1 and 29.
  • API Traffic: any HTTP request with a response content type of XML, JSON, gRPC, or similar. Where the response content type is not available, such as for mitigated requests, the equivalent Accept content type (specified by the user agent) is used instead. In this latter case API traffic won’t be fully accounted for, but for insight purposes it still provides a good representation.

Unless otherwise stated, the time frame evaluated in this post is the three-month period from December 1, 2021, to March 1, 2022.

Finally, please note that the data is calculated based only on traffic observed across the Cloudflare network and does not necessarily represent overall HTTP traffic patterns across the Internet.

*When referring to HTTP traffic we mean both HTTP and HTTPS.

Global Traffic Insights

The first thing we can look at is traffic mitigated across all HTTP requests proxied by the Cloudflare network. This will give us a good baseline view before drilling into specific traffic types, such as bot and API traffic.

8% of all Cloudflare HTTP traffic is mitigated

Cloudflare proxies ~32 million HTTP requests per second on average, with more than ~44 million HTTP requests per second at peak. Overall, ~2.5 million requests per second are mitigated by our global network and never reach our caches or the origin servers, ensuring our customers’ bandwidth and compute power is only used for clean traffic.

Site owners using Cloudflare gain access to tools to mitigate unwanted or malicious traffic and allow access to their applications only when a request is deemed clean. This can be done both using fully managed features, such as our DDoS mitigation, WAF managed ruleset or schema validation, as well as custom rules that allow users to define their own filters for blocking traffic.

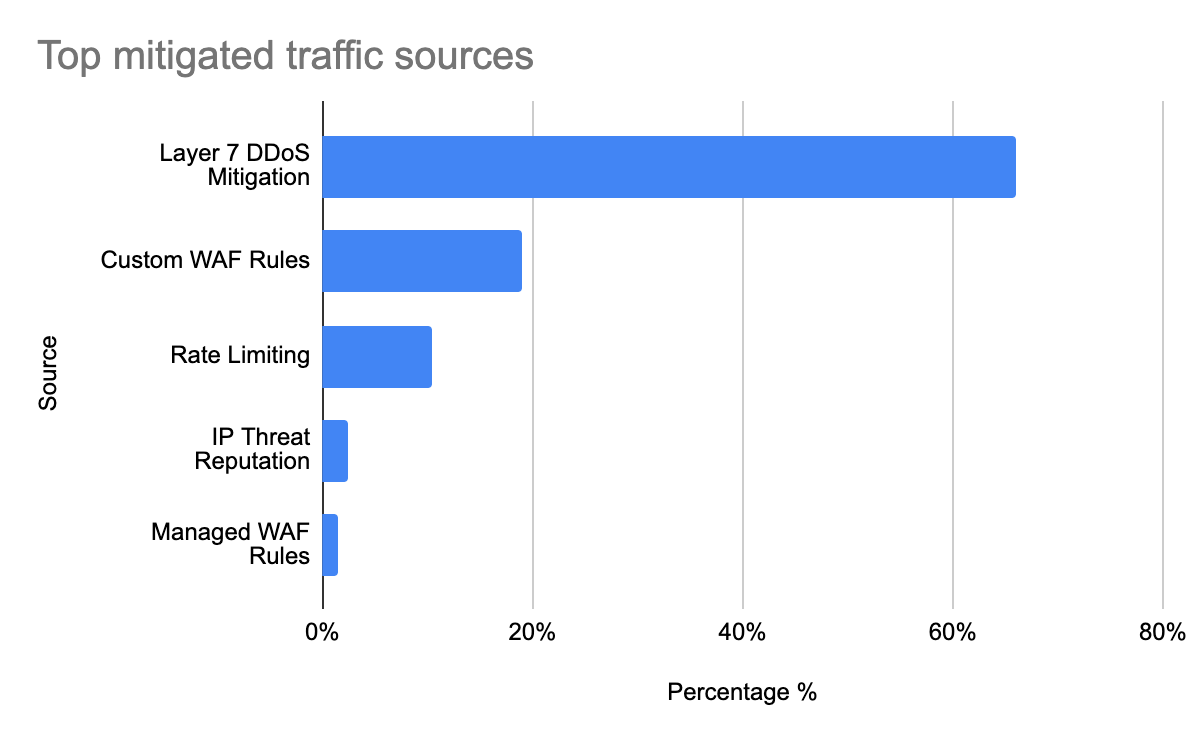
If we look at the top five Cloudflare features (sources) that mitigated traffic, we get a clear picture of how much each Cloudflare feature is contributing towards helping keep customer sites and applications online and secure:

Application security: Cloudflare’s view

Tabular format for reference:

Source Percentage %
Layer 7 DDoS mitigation 66.0%
Custom WAF Rules 19.0%
Rate Limiting 10.5%
IP Threat Reputation 2.5%
Managed WAF Rules 1.5%

Looking at each mitigation source individually:

  • Layer 7 DDoS mitigation, perhaps unsurprisingly, is the largest contributor to mitigated HTTP requests by total count (66% overall). Cloudflare’s layer 7 DDoS rules are fully managed and don’t require user configuration: they automatically detect a vast array of HTTP DDoS attacks including those generated by the Meris botnet, Mirai botnet, known attack tools, and others. Volumetric DDoS attacks, by definition, create a lot of malicious traffic!
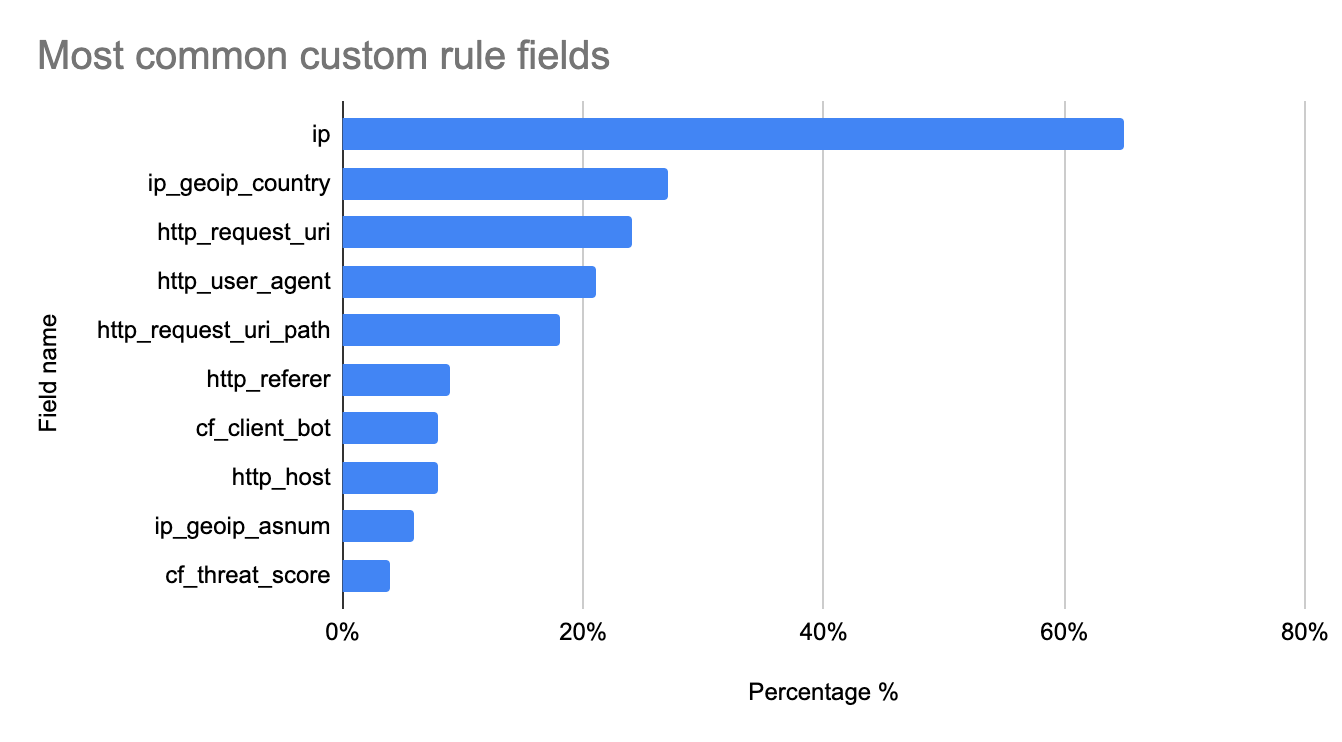
  • Custom WAF Rules contribute to more than 19% of mitigated HTTP traffic. These are user-configured rules defined using Cloudflare’s wirefilter syntax. We explore common rule patterns further down in this post.
  • Our Rate Limiting feature allows customers to define custom thresholds based on application preferences. It is often used as an additional layer of protection for applications against traffic patterns that are too low to be detected as a DDoS attack. Over the time frame analyzed, rate limiting contributed to 10.5% of mitigated HTTP requests.
  • IP Threat Reputation is exposed in the Cloudflare dashboard as Security Level. Based on behavior we observe across the network, Cloudflare automatically assigns a threat score to each IP address. When the threat score is above the specified threshold, we challenge the traffic. This accounts for 2.5% of all mitigated HTTP requests.
  • Our Managed WAF Rules are rules that are handcrafted by our internal security analyst team aimed at matching only against valid malicious payloads. They contribute to about 1.5% of all mitigated requests.

HTTP anomalies are the most common attack vector

If we drill into Managed WAF Rules, we get a clear picture of what type of attack vectors malicious users are attempting against the Internet properties we protect.

The vast majority (over 54%) of HTTP requests blocked by our Managed WAF Rules contain HTTP anomalies, such as malformed method names, null byte characters in headers, non-standard ports or content length of zero with a POST request.

Common attack types in this category are shown below. These have been grouped when relevant:

Rule Type Description
Missing User Agent These rules will block any request without a User-Agent header. All browsers and legitimate crawlers present this header when connecting to a site. Not having a user agent is a common signal of a malicious request.
Not GET, POST or HEAD Method Most applications only allow standard GET or POST requests (normally used for viewing pages or submitting forms). HEAD requests are also often sent from browsers for security purposes. Customers using our Managed Rules can easily block any other method – which normally results in blocking a large number of vulnerability scanners.
Missing Referer When users navigate applications, browsers use the Referer header to indicate where they are coming from. Some applications expect this header to always be present.
Non-standard port Customers can configure Cloudflare Managed Rules to block HTTP requests trying to access non-standard ports (such as 80 and 443). This is activity normally seen by vulnerability scanners.
Invalid UTF-8 encoding It is common for attackers to attempt to break an application server by sending “special” characters that are not valid in UTF-8 encoding.

More commonly known and referenced attack vectors such as XSS and SQLi only contribute to about 13% of total mitigated requests. More interestingly, attacks aimed at information disclosure are third most popular (10%) and software-specific CVE-based attacks account for about 12% of mitigated requests (more than SQLi alone) highlighting both the importance of needing to patch software quickly, and the likelihood of CVE proof-of-concepts (PoCs) being used to compromise applications, such as with the recent Log4J vulnerability. The top 10 attack vectors by percentage of mitigated requests are shown below:

Application security: Cloudflare’s view

Tabular format for reference:

Source Percentage %
HTTP Anomaly 54.5%
Vendor Specific CVE 11.8%
Information Disclosure 10.4%
SQLi 7.0%
XSS 6.1%
File Inclusion 3.3%
Fake Bots 3.0%
Command Injection 2.7%
Open Redirects 0.1%
Other 1.5%

Businesses still rely on IP address-based access lists to protect their assets

In the prior section, we noted that 19% of mitigated requests come from Custom WAF Rules. These are rules that Cloudflare customers have implemented using the wirefilter syntax. At time of writing, Cloudflare customers had a total of ~6.5 million Custom WAF rules deployed.

It is interesting to look at what rule fields customers are using to identify malicious traffic, as this helps us focus our efforts on what other fully automated mitigations could be implemented to improve the Cloudflare platform.

The most common field, found in approximately 64% of all custom rules, remains the source IP address or fields easily derived from the IP address, such as the client country location. Note that IP addresses are becoming less useful signals for security policies, but they are often the quickest and simplest type of filter to implement during an attack. Customers are also starting to adopt better approaches such as those offered in our Zero Trust portfolio to further reduce reliance on IP address-based fields.

The top 10 fields are shown below:

Application security: Cloudflare’s view

Tabular format for reference:

Field name Used in % of rules
ip 64.9%
ip_geoip_country 27.3%
http_request_uri 24.1%
http_user_agent 21.8%
http_request_uri_path 17.8%
http_referer 8.6%
cf_client_bot 8.3%
http_host 7.8%
ip_geoip_asnum 5.8%
cf_threat_score 4.4%

Beyond IP addresses, standard HTTP request fields (URI, User-Agent, Path, Referer) tend to be the most popular. Note, also, that across the entire rule corpus, the average rule combines at least three independent fields.

Bot Traffic Insights

Cloudflare has long offered a Bot Management solution to allow customers to gain insights into the automated traffic that might be accessing their application. Using Bot Management classification data, we can perform a deep dive into the world of bots.

38% of HTTP traffic is automated

Over the time period analyzed, bot traffic accounted for about 38% of all HTTP requests. This traffic includes bot traffic from hundreds of Verified Bots tracked by Cloudflare, as well as any request that received a bot score below 30, indicating a high likelihood that it is automated.

Overall, when bot traffic matches a security configuration, customers allow 41% of bot traffic to pass to their origins, blocking only 6.4% of automated requests. Remember that this includes traffic coming from Verified Bots like GoogleBot, which ultimately benefits site owners and end users. It’s a reminder that automation in and of itself is not necessarily detrimental to a site.  This is why we segment Verified Bot traffic, and why we give customers a granular bot score, rather than a binary “bot or not bot” indicator. Website operators want the flexibility to be precise with their response to different types of bot traffic, and we can see that they do in fact use this flexibility. Note that our self-serve customers can also decide how to handle bot traffic using our Super Bot Fight Mode feature.

Application security: Cloudflare’s view

Tabular data for reference:

Action on all bot traffic Percentage %
allow 40.9%
log 31.9%
bypass 19.0%
block 6.4%
jschallenge 0.5%

More than a third of non-verified bot HTTP traffic is mitigated

31% of all bot traffic observed by Cloudflare is not verified, and comes from thousands of custom-built automated tools like scanners, crawlers, and bots built by hackers. As noted above, automation does not necessarily mean these bots are performing malicious actions. If we look at customer responses to identified bot traffic, we find that 38.5% of HTTP requests from non-verified bots are mitigated. This is obviously a much more defensive configuration compared to overall bot traffic actions shown above:

Application security: Cloudflare’s view

Tabular data for reference:

Action on non-verified bot traffic Percentage %
block 34.0%
log 28.6%
allow 14.5%
bypass 13.2%
managed_challenge 3.7%

You’ll notice that almost 30% of customers log traffic rather than take immediate action. We find that many enterprise customers choose to not immediately block bot traffic, so they don’t give a feedback signal to attackers. Rather, they prefer to tag and monitor this traffic, and either drop at a later time or redirect to alternate content. As targeted attack vectors have evolved, responses to those attacks have had to evolve and become more sophisticated as well. Additionally, nearly 3% of non-verified bot traffic is automatically mitigated by our DDoS protection (connection_close). These requests tend to be part of botnets used to attack customer applications.

API Traffic Insights

Many applications built on the Internet today are not meant to be consumed by humans. Rather, they are intended for computer-to-computer communication. The common way to expose an application for this purpose is to build an Application Programming Interface (API) that can be accessed using HTTP.

Due to the underlying format of the data in transit, API traffic tends to be a lot more structured than standard web applications, causing all sorts of problems from a security standpoint. First, the structured data often causes Web Application Firewalls (WAFs) to generate a large number of false positives. Secondly, due to the nature of APIs, they often go unnoticed, and many companies end up exposing old and unmaintained APIs without knowing, often referred to as “shadow APIs”.

Below, we look at some differences in API trends compared to the global traffic insights shown above.

10% of API traffic is mitigated at the edge

A good portion of bot traffic is accessing API endpoints, and as discussed previously, API traffic is the fastest growing traffic type on the Cloudflare network, currently accounting for 55% of total requests.

API endpoints globally receive more malicious requests compared to standard web applications (10% vs 8%) potentially indicating that attackers are focusing more on APIs for their attack surface as opposed to standard web apps.

Our DDoS mitigation is still the top source of mitigated events for API endpoints, accounting for just over 63% of the total mitigated requests. More interestingly, Custom WAF rules account for 35% compared to 19% when looking at global traffic. Customers have, to date, been heavily using WAF Custom Rules to lock down and validate traffic to API endpoints, although we expect our API Gateway schema validation feature to soon surpass Custom WAF Rules in terms of mitigated traffic.

SQLi is the most common attack vector on API endpoints

If we look at our WAF Managed Rules mitigations on API traffic only, we see notable differences compared to global trends. These differences include much more equal distribution across different types of attacks, but more noticeably, SQL injection attacks in the top spot.

Command Injection attacks are also much more prominent (14.3%), and vectors such as Deserialization make an appearance, contributing to more than 1% of the total mitigated requests.

Application security: Cloudflare’s view

Tabular data for reference:

Source Percentage %
SQLi 34.5%
HTTP Anomaly 18.2%
Vendor Specific CVE 14.5%
Command Injection 14.3%
XSS 7.3%
Fake Bots 5.8%
File Inclusion 2.3%
Deserialization 1.2%
Information Disclosure 0.6%
Other 1.3%

Looking ahead

In this post we shared some initial insights around Internet application security trends based on traffic to Cloudflare’s network. Of course, we have only just scratched the surface. Moving forward, we plan to publish quarterly reports with dynamic filters directly on Cloudflare Radar and provide much deeper insights and investigations.

New cities on the Cloudflare global network: March 2022 edition

Post Syndicated from Mike Conlow original https://blog.cloudflare.com/mid-2022-new-cities/

New cities on the Cloudflare global network: March 2022 edition

If you follow the Cloudflare blog, you know that we love to add cities to our global map. With each new city we add, we help make the Internet faster, more reliable, and more secure. Today, we are announcing the addition of 18 new cities in Africa, South America, Asia, and the Middle East, bringing our network to over 270 cities globally. We’ll also look closely at how adding new cities improves Internet performance, such as our new locations in Israel, which reduced median response time (latency) from 86ms to 29ms (a 66% improvement) in a matter of weeks for subscribers of one Israeli Internet service provider (ISP).

The Cities

Without further ado, here are the 18 new cities in 10 countries we welcomed to our global network: Accra, Ghana; Almaty, Kazakhstan; Bhubaneshwar, India; Chiang Mai, Thailand; Joinville, Brazil; Erbil, Iraq; Fukuoka, Japan; Goiânia, Brazil; Haifa, Israel; Harare, Zimbabwe; Juazeiro do Norte, Brazil; Kanpur, India; Manaus, Brazil; Naha, Japan; Patna, India; São José do Rio Preto, Brazil; Tashkent, Uzbekistan; Uberlândia, Brazil.

Cloudflare’s ISP Edge Partnership Program

But let’s take a step back and understand why and how adding new cities to our list helps make the Internet better. First, we should reintroduce the Cloudflare Edge Partnership Program. Cloudflare is used as a reverse proxy by nearly 20% of all Internet properties, which means the volume of ISP traffic trying to reach us can be significant. In some cases, as we’ll see in Israel, the distance data needs to travel can also be significant, adding to latency and reducing Internet performance for the user. Our solution is partnering with ISPs to embed our servers inside their network. Not only does the ISP avoid lots of back haul traffic, but their subscribers also get much better performance because the website is served on-net, and close to them geographically. It is a win-win-win.

Consider a large Israeli ISP we did not peer with locally in Tel Aviv. Last year, if a subscriber wanted to reach a website on the Cloudflare network, their request had to travel on the Internet backbone – the large carriers that connect networks together on behalf of smaller ISPs – from Israel to Europe before reaching Cloudflare and going back. The map below shows where they were able to find Cloudflare content before our deployment went live: 48% in Frankfurt, 33% in London, and 18% in Amsterdam. That’s a long way!

New cities on the Cloudflare global network: March 2022 edition

In January and March 2022, we turned up deployments with the ISP  in Tel Aviv and Haifa. Now live, these two locations serve practically all requests from their subscribers locally within Israel. Instead of traveling 3,000 km to reach one of the millions of websites on our network, most requests from Israel now travel 65 km, or less. The improvement has been dramatic: now we’re serving 66% of requests in under 50ms; before the deployment we couldn’t serve any in under 50ms because the distance was too great. Now, 85% are served in under 100ms; before, we served 66% of requests in under 100ms.

New cities on the Cloudflare global network: March 2022 edition

As we continue to put dots on the map, we’ll keep putting updates here on how Internet performance is improving. As we like to say, we’re just getting started.

If you’re an ISP that is interested in hosting a Cloudflare cache to improve performance and reduce back haul, get in touch on our Edge Partnership Program page. And if you’re a software, data, or network engineer – or just the type of person who is curious and wants to help make the Internet better – consider joining our team.

С пАток към светъл комунизъм!

Post Syndicated from original https://bivol.bg/%D1%81-%D0%BF%D0%B0%D1%82%D0%BE%D0%BA-%D0%BA%D1%8A%D0%BC-%D1%81%D0%B2%D0%B5%D1%82%D1%8A%D0%BB-%D0%BA%D0%BE%D0%BC%D1%83%D0%BD%D0%B8%D0%B7%D1%8A%D0%BC.html

понеделник 21 март 2022


Какви фирми строиха пАтока? Руски и белaруски. Колко лева броихме ние за пАтока? Към, а и над 3 милиарда. ПАтока има ли полза за нас? Май около 2187-а може и…

The 5.17 kernel has been released

Post Syndicated from original https://lwn.net/Articles/887679/

Linus has released the 5.17 kernel.

So we had an extra week of at the end of this release cycle, and
I’m happy to report that it was very calm indeed. We could
probably have skipped it with not a lot of downside, but we did get
a few last-minute reverts and fixes in and avoid some brown-paper
bugs that would otherwise have been stable fodder, so it’s all good

Some of the significant features in this release include
KCSAN
support for the arm64 architecture,
the bpf_loop() helper,
ID-mapped filesystem mounts,
the reference-count tracking
infrastructure
,
a switch to BLAKE2s for the random-number generator,
a rewritten
network filesystem caching layer
,
straight-line speculation mitigation,
and more.
See the LWN merge-window summaries
(part 1,
part 2) and
the KernelNewbies 5.17
page
for more details.

Unlocking QUIC’s proxying potential with MASQUE

Post Syndicated from Lucas Pardue original https://blog.cloudflare.com/unlocking-quic-proxying-potential/

Unlocking QUIC’s proxying potential with MASQUE

Unlocking QUIC’s proxying potential with MASQUE

In the last post, we discussed how HTTP CONNECT can be used to proxy TCP-based applications, including DNS-over-HTTPS and generic HTTPS traffic, between a client and target server. This provides significant benefits for those applications, but it doesn’t lend itself to non-TCP applications. And if you’re wondering whether or not we care about these, the answer is an affirmative yes!

For instance, HTTP/3 is based on QUIC, which runs on top of UDP. What if we wanted to speak HTTP/3 to a target server? That requires two things: (1) the means to encapsulate a UDP payload between client and proxy (which the proxy decapsulates and forward to the target in an actual UDP datagram), and (2) a way to instruct the proxy to open a UDP association to a target so that it knows where to forward the decapsulated payload. In this post, we’ll discuss answers to these two questions, starting with encapsulation.

Encapsulating datagrams

While TCP provides a reliable and ordered byte stream for applications to use, UDP instead provides unreliable messages called datagrams. Datagrams sent or received on a connection are loosely associated, each one is independent from a transport perspective. Applications that are built on top of UDP can leverage the unreliability for good. For example, low-latency media streaming often does so to avoid lost packets getting retransmitted. This makes sense, on a live teleconference it is better to receive the most recent audio or video rather than starting to lag behind while you’re waiting for stale data

QUIC is designed to run on top of an unreliable protocol such as UDP. QUIC provides its own layer of security, packet loss detection, methods of data recovery, and congestion control. If the layer underneath QUIC duplicates those features, they can cause wasted work or worse create destructive interference. For instance, QUIC congestion control defines a number of signals that provide input to sender-side algorithms. If layers underneath QUIC affect its packet flows (loss, timing, pacing, etc), they also affect the algorithm output. Input and output run in a feedback loop, so perturbation of signals can get amplified. All of this can cause congestion control algorithms to be more conservative in the data rates they use.

If we could speak HTTP/3 to a proxy, and leverage a reliable QUIC stream to carry encapsulated datagrams payload, then everything can work. However, the reliable stream interferes with expectations. The most likely outcome being slower end-to-end UDP throughput than we could achieve without tunneling. Stream reliability runs counter to our goals.

Fortunately, QUIC’s unreliable datagram extension adds a new DATAGRAM frame that, as its name plainly says, is unreliable. It has several uses; the one we care about is that it provides a building block for performant UDP tunneling. In particular, this extension has the following properties:

  • DATAGRAM frames are individual messages, unlike a long QUIC stream.
  • DATAGRAM frames do not contain a multiplexing identifier, unlike QUIC’s stream IDs.
  • Like all QUIC frames, DATAGRAM frames must fit completely inside a QUIC packet.
  • DATAGRAM frames are subject to congestion control, helping senders to avoid overloading the network.
  • DATAGRAM frames are acknowledged by the receiver but, importantly, if the sender detects a loss, QUIC does not retransmit the lost data.

The Datagram “Unreliable Datagram Extension to QUIC” specification will be published as an RFC soon. Cloudflare’s quiche library has supported it since October 2020.

Now that QUIC has primitives that support sending unreliable messages, we have a standard way to effectively tunnel UDP inside it. QUIC provides the STREAM and DATAGRAM transport primitives that support our proxying goals. Now it is the application layer responsibility to describe how to use them for proxying. Enter MASQUE.

MASQUE: Unlocking QUIC’s potential for proxying

Now that we’ve described how encapsulation works, let’s now turn our attention to the second question listed at the start of this post: How does an application initialize an end-to-end tunnel, informing a proxy server where to send UDP datagrams to, and where to receive them from? This is the focus of the MASQUE Working Group, which was formed in June 2020 and has been designing answers since. Many people across the Internet ecosystem have been contributing to the standardization activity. At Cloudflare, that includes Chris (as co-chair), Lucas (as co-editor of one WG document) and several other colleagues.

MASQUE started solving the UDP tunneling problem with a pair of specifications: a definition for how QUIC datagrams are used with HTTP/3, and a new kind of HTTP request that initiates a UDP socket to a target server. These have built on the concept of extended CONNECT, which was first introduced for HTTP/2 in RFC 8441 and has now been ported to HTTP/3. Extended CONNECT defines the :protocol pseudo-header that can be used by clients to indicate the intention of the request. The initial use case was WebSockets, but we can repurpose it for UDP and it looks like this:

:method = CONNECT
:protocol = connect-udp
:scheme = https
:path = /target.example.com/443/
:authority = proxy.example.com

A client sends an extended CONNECT request to a proxy server, which identifies a target server in the :path. If the proxy succeeds in opening a UDP socket, it responds with a 2xx (Successful) status code. After this, an end-to-end flow of unreliable messages between the client and target is possible; the client and proxy exchange QUIC DATAGRAM frames with an encapsulated payload, and the proxy and target exchange UDP datagrams bearing that payload.

Unlocking QUIC’s proxying potential with MASQUE

Anatomy of Encapsulation

UDP tunneling has a constraint that TCP tunneling does not – namely, the size of messages and how that relates to path MTU (Maximum Transmission Unit; for more background see our Learning Center article). The path MTU is the maximum size that is allowed on the path between client and server. The actual maximum is the smallest maximum across all elements at every hop and at every layer, from the network up to application. All it takes is for one component with a small MTU to reduce the path MTU entirely. On the Internet, 1,500 bytes is a common practical MTU. When considering tunneling using QUIC, we need to appreciate the anatomy of QUIC packets and frames in order to understand how they add bytes of overheard. This consumes bytes and subtracts from our theoretical maximum.

We’ve been talking in terms of HTTP/3 which normally has its own frames (HEADERS, DATA, etc) that have a common type and length overhead. However, there is no HTTP/3 framing when it comes to DATAGRAM, instead the bytes are placed directly into the QUIC frame. This frame is composed of two fields. The first field is a variable number of bytes, called the Quarter Stream ID field, which is an encoded identifier that supports independent multiplexed DATAGRAM flows. It does so by binding each DATAGRAM to the HTTP request stream ID. In QUIC, stream IDs use two bits to encode four types of stream. Since request streams are always of one type (client-initiated bidirectional, to be exact), we can divide their ID by four to save space on the wire. Hence the name Quarter Stream ID. The second field is payload, which contains the end-to-end message payload. Here’s how it might look on the wire.

Unlocking QUIC’s proxying potential with MASQUE

If you recall our lesson from the last post, DATAGRAM frames (like all frames) must fit completely inside a QUIC packet. Moreover, since QUIC requires that fragmentation is disabled, QUIC packets must fit completely inside a UDP datagram. This all combines to limit the maximum size of things that we can actually send: the path MTU determines the size of the UDP datagram, then we need to subtract the overheads of the UDP datagram header, QUIC packet header, and QUIC DATAGRAM frame header. For a better understanding of QUIC’s wire image and overheads, see Section 5 of RFC 8999 and Section 12.4 of RFC 9000.

If a sender has a message that is too big to fit inside the tunnel, there are only two options: discard the message or fragment it. Neither of these are good options. Clients create the UDP tunnel and are more likely to accurately calculate the real size of encapsulated UDP datagram payload, thus avoiding the problem. However, a target server is most likely unaware that a client is behind a proxy, so it cannot accommodate the tunneling overhead. It might send a UDP datagram payload that is too big for the proxy to encapsulate. This conundrum is common to all proxy protocols! There’s an art in picking the right MTU size for UDP-based traffic in the face of tunneling overheads. While approaches like path MTU discovery can help, they are not a silver bullet. Choosing conservative maximum sizes can reduce the chances of tunnel-related problems. However, this needs to be weighed against being too restrictive. Given a theoretical path MTU of 1,500, once we consider QUIC encapsulation overheads, tunneled messages with a limit between 1,200 and 1,300 bytes can be effective.This is especially important when we think about tunneling QUIC itself. RFC 9000 Section 8.1 details how clients that initiate new QUIC connections must send UDP datagrams of at least 1,200 bytes. If a proxy can’t support that, then QUIC will not work in a tunnel.

Nested tunneling for Improved Privacy Proxying

MASQUE gives us the application layer building blocks to support efficient tunneling of TCP or UDP traffic. What’s cool about this is that we can combine these blocks into different deployment architectures for different scenarios or different needs.

One example of this case is nested tunneling via multiple proxies, which can minimize the connection metadata available to each individual proxy or server (one example of this type of deployment is described in our recent post on iCloud Private Relay). In this kind of setup, a client might manage at least three logical connections. First, a QUIC connection between Client and Proxy 1. Second, a QUIC connection between Client and Proxy 2, which runs via a CONNECT tunnel in the first connection. Third, an end-to-end byte stream between Client and Server, which runs via a CONNECT tunnel in the second connection. A real TCP connection only exists between Proxy 2 and Server. If additional Client to Server logical connections are needed, they can be created inside the existing pair of QUIC connections.

Unlocking QUIC’s proxying potential with MASQUE

Towards a full tunnel with IP tunneling

Proxy support for UDP and TCP already unblocks a huge assortment of use cases, including TLS, QUIC, HTTP, DNS, and so on. But it doesn’t help protocols that use different IP protocols, like ICMP or IPsec Encapsulating Security Payload (ESP). Fortunately, the MASQUE Working Group has also been working on IP tunneling. This is a lot more complex than UDP tunneling, so they first spent some time defining a common set of requirements. The group has recently adopted a new specification to support IP proxying over HTTP. This behaves similarly to the other CONNECT designs we’ve discussed but with a few differences. Indeed, IP proxying support using HTTP as a substrate would unlock many applications that existing protocols like IPsec and WireGuard enable.

At this point, it would be reasonable to ask: “A complete HTTP/3 stack is a bit excessive when all I need is a simple end-to-end tunnel, right?” Our answer is, it depends! CONNECT-based IP proxies use TLS and rely on well established PKIs for creating secure channels between endpoints, whereas protocols like WireGuard use a simpler cryptographic protocol for key establishment and defer authentication to the application. WireGuard does not support proxying over TCP but can be adapted to work over TCP transports, if necessary. In contrast, CONNECT-based proxies do support TCP and UDP transports, depending on what version of HTTP is used. Despite these differences, these protocols do share similarities. In particular, the actual framing used by both protocols – be it the TLS record layer or QUIC packet protection for CONNECT-based proxies, or WireGuard encapsulation – are not interoperable but only slightly differ in wire format. Thus, from a performance perspective, there’s not really much difference.

In general, comparing these protocols is like comparing apples and oranges – they’re fit for different purposes, have different implementation requirements, and assume different ecosystem participants and threat models. At the end of the day, CONNECT-based proxies are better suited to an ecosystem and environment that is already heavily invested in TLS and the existing WebPKI, so we expect CONNECT-based solutions for IP tunnels to become the norm in the future. Nevertheless, it’s early days, so be sure to watch this space if you’re interested in learning more!

Looking ahead

The IETF has chartered the MASQUE Working Group to help design an HTTP-based solution for UDP and IP that complements the existing CONNECT method for TCP tunneling. Using HTTP semantics allows us to use features like request methods, response statuses, and header fields to enhance tunnel initialization. For example, allowing for reuse of existing authentication mechanisms or the Proxy-Status field. By using HTTP/3, UDP and IP tunneling can benefit from QUIC’s secure transport native unreliable datagram support, and other features. Through a flexible design, older versions of HTTP can also be supported, which helps widen the potential deployment scenarios. Collectively, this work brings proxy protocols to the masses.

While the design details of MASQUE specifications continue to be iterated upon, so far several implementations have been developed, some of which have been interoperability tested during IETF hackathons. This running code helps inform the continued development of the specifications. Details are likely to continue changing before the end of the process, but we should expect the overarching approach to remain similar. Join us during the MASQUE WG meeting in IETF 113 to learn more!

The collective thoughts of the interwebz