Andrew Nesbitt has written a blog
post detailing a recent incident with the jqwik library for property-based testing
in Java. On May 25, the 1.10.0 release of jqwik included a change
that attempts to instruct coding agents to disregard previous
instructions and delete jqwik tests and code.
I think this is a new class of supply-chain input worth keeping an eye
on, mostly because of how little of the existing tooling has any
opinion about it. A System.out.print of sixty-eight bytes of plain
ASCII isn’t the kind of thing scanners are looking for, since those
watch for install hooks, network calls, filesystem writes, obfuscated
strings and the like. The jar makes the same syscalls it made in 1.9,
and because the change was committed and released by the legitimate
maintainer through the normal build, it’s clean from a SLSA point of
view too: the provenance is what it should be. Anyone who reads the
diff can see what it does, but a patch bump of a test-scoped
dependency is not where most projects spend their review time.
By Parth Jain, Rakesh Sukumar, Yingwu Zhao, Renzo Sanchez & Nathan Fisher How we built a living map of our distributed infrastructure to help engineers understand dependencies, troubleshoot faster, and keep Netflix running smoothly for our members around the world.
The Puzzle with a Thousand Pieces
Picture this: It’s 3am, and an engineer gets paged. One of our critical services is showing elevated error rates. Members trying to watch their favorite films and series are seeing degraded experiences. The clock is ticking.
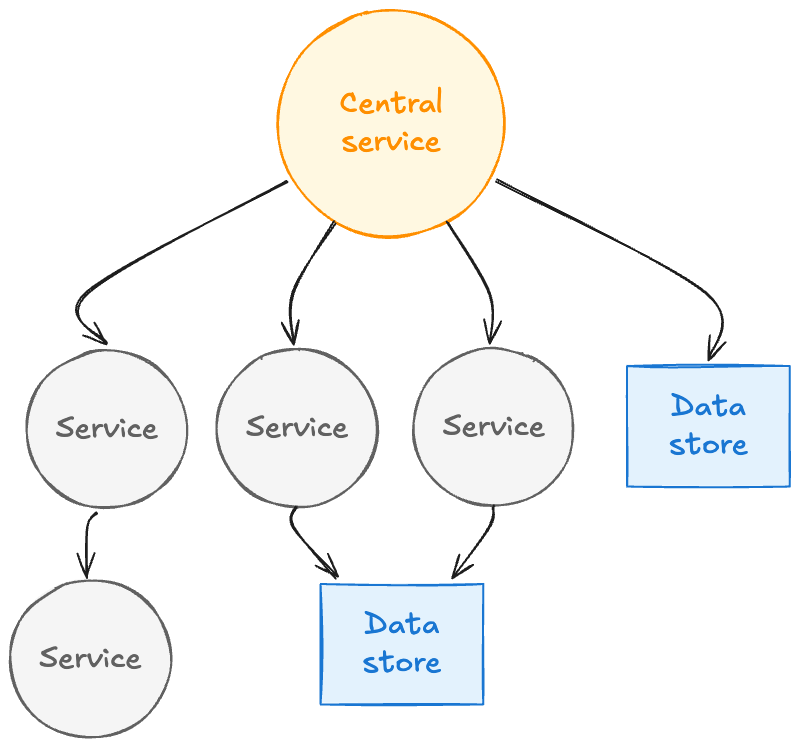
A single service at the center of a web of dependencies — services, data stores, and call chains branching in every direction. Without a unified map, engineers have to reason about this structure from memory and scattered signals.
In a system with thousands of microservices supporting our entertainment experience for members worldwide, answering these questions quickly can mean the difference between a minor blip and a major incident.
We kept hearing variations of this story from engineers across Netflix. The tooling gap was clear: we had plenty of signals, but no unified way to understand how everything connected.
The Three Questions Every Engineer Asks
When troubleshooting distributed systems, engineers fundamentally need to understand relationships:
Which services depend on each other? Not just theoretical dependencies from configuration files or architecture diagrams, but actual runtime connections based on real traffic.
What’s the blast radius? When something breaks or needs to go down for maintenance, what else will be affected? Which teams need to be notified?
Where’s the source? Is my problem caused by an upstream issue, or am I the root cause that’s cascading to others?
Traditional observability tools show fragments of this picture. Metrics show symptoms and performance characteristics. Logs show individual service behavior. Traces show single request flows through the system. But none of them show the complete map of how everything connects — the steady-state topology of dependencies that forms the backbone of our distributed architecture.
For an engineer at 3am, having to mentally stitch together information from multiple tools is slow, error-prone, and stressful. We needed something better: a unified view of service dependencies — a map showing how everything connects — with easy navigation to the detailed signals when you need to dig deeper.
Why This Matters More Than Ever
Netflix runs on thousands of microservices working together to deliver entertainment to our members. When you press play on your favorite series, that single action triggers a cascade of service-to-service calls — authentication, recommendations tailored to your tastes, video encoding selection, playback optimization, and more.
This architecture gives us tremendous flexibility and allows hundreds of engineering teams to innovate independently. But it also creates fundamental observability challenges.
And these challenges were growing. New initiatives like our Live programming and Ads-supported plans require even more sophisticated monitoring and faster troubleshooting. Live events can’t wait for lengthy incident investigations. The scale and real-time nature of these systems demanded better tooling.
We analyzed thousands of support requests from our engineers over a four-year period. The patterns were consistent:
“What are my upstream and downstream dependencies?”
“Is this failure in my service, or is something I depend on broken?”
“Which services will be impacted if I take this down for maintenance?”
“Why is this service showing as ‘Unknown’ in my metrics?”
“What changed in my call path recently that could explain this behavior?”
Engineers were asking dependency questions constantly. We needed to provide answers — quickly, accurately, and in real-time.
Building on What We Learned
We didn’t start from scratch. Over the years, we explored various approaches to solving this problem — from evaluating external graph databases and vendor platforms to building internal prototypes with different storage technologies and data models.
Each iteration taught us something valuable:
Real-time matters: Dependency maps that are hours old are useless in dynamic environments where services deploy multiple times per day. We needed near real-time updates.
Scale changes everything: Solutions that work at modest scale hit fundamental walls at Netflix scale. Storage systems that handle thousands of nodes struggle with our service count and traffic volume.
Integration is key: Any solution needs seamless integration with our existing observability ecosystem. Engineers shouldn’t have to learn entirely new tools or leave their existing workflows.
Data quality is critical: Incomplete or incorrect dependency information is worse than no information — it leads to wrong conclusions during incidents.
Multiple perspectives needed: We learned that no single source of dependency information tells the complete story. Network connectivity data lacks application context. Application metrics only cover instrumented services. We needed to combine multiple sources.
These lessons shaped every decision we made in building Service Topology.
What We Needed: A Living Map
We set out to build something specific: a living map of our infrastructure — one that updates in real-time as services deploy, as traffic patterns shift, as new dependencies form and old ones disappear.
The requirements were clear:
Real-time updates, not stale snapshots: In an environment where services deploy continuously, yesterday’s topology map is archaeology, not observability.
Fast queries at scale: When an engineer is troubleshooting at 3am, they can’t wait minutes for a query to return. We needed sub-second response times for traversing the call graph.
Multiple layers: Network-level connectivity doesn’t tell the whole story. We needed to see both the network layer (what’s actually talking to what) and the application layer (which APIs and endpoints are being called).
Rich context, not just connections: Knowing Service A talks to Service B isn’t enough. We needed to overlay health status, availability tiers, business domains, ownership information, and other metadata to make the information actionable.
Visual and programmatic access: Engineers needed a UI for exploration and troubleshooting. But automated systems — resilience frameworks, blast radius calculators, incident response automation — needed programmatic API access.
Our Approach: Three Sources of Truth
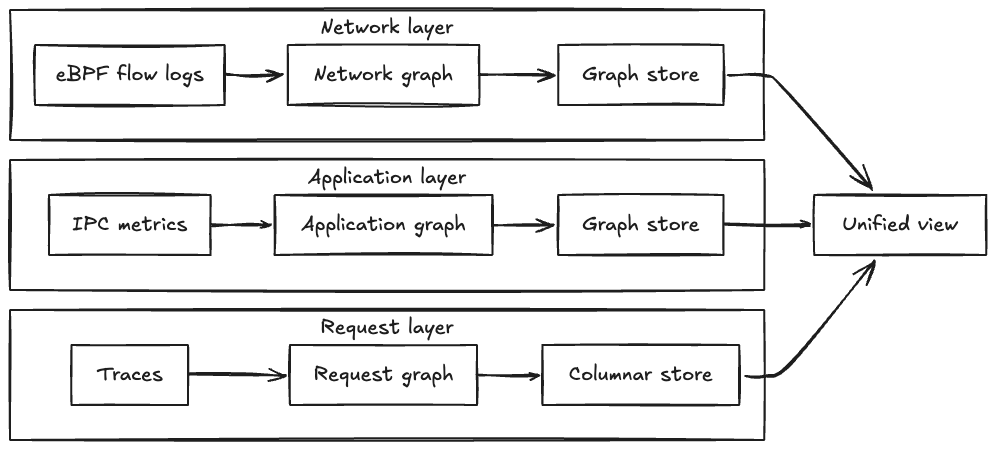
Three data sources produce three independent topology graphs — network, application, and request — each stored separately and queryable on their own or merged into a single unified view.
Here’s the key insight we arrived at: no single source tells the complete story.
We built Service Topology by using three complementary sources to build separate dependency graphs — one from each perspective — that can be combined into a unified view or explored independently:
Each source creates its own graph that is physically separate — the network layer in one graph database partition, the IPC layer in another partition, and the tracing layer using columnar storage optimized for analytical queries. This physical separation allows each layer to evolve independently and be queried in parallel. When users request a unified view, we execute traversal queries across all layers simultaneously and merge results, achieving sub-second response times even when combining all three layers.
Each source creates its own graph of service relationships:
1. eBPF Network Flows (Network Layer)
We capture network flow records at the kernel level using eBPF technology — information about which services are connecting to which other services over the network. This gives us ground truth about actual network-level communication.
The value: Comprehensive coverage. Every service shows up here because we’re capturing actual network traffic, regardless of whether applications are instrumented. This layer provides topology at both cluster-level (which deployment clusters are communicating) and app-level (which applications are communicating).
The limitation: Network-level information lacks application context. We know Service A connected to Service B’s IP address using a specific protocol, but not which specific API endpoint or path was called (e.g., /api/v1/users vs /api/v1/orders).
2. IPC Metrics (Application Layer)
We collect Inter-Process Communication metrics from our instrumented services. These are the metrics applications emit when they make calls to other services via gRPC, GraphQL, REST, or other protocols.
The value: Rich application context. We can see which specific endpoints were called, error rates, latency distributions, protocol details, and request/response characteristics. This layer provides app-level topology — since IPC metrics are emitted by applications, the natural granularity is application-to-application connections with endpoint details.
The limitation: Only works for instrumented services. If a service doesn’t emit IPC metrics, we won’t see its application-level calls this way.
3. End-to-End Tracing (Request Layer)
We integrate distributed tracing information that follows individual requests as they flow through our system. We aggregate traces to build a unified topology graph, but also allow engineers to overlay individual traces on the topology to see specific request flows.
The value: Shows actual request paths. Not just “Service A can call Service B,” but “Service A did call Service B as part of serving this specific member request.” This captures runtime behavior, including conditional logic and feature flags. Engineers can both see the aggregated pattern and drill into individual traces. We aggregate traces to build topology at both cluster-level and app-level, allowing engineers to view request patterns at the granularity most useful for their investigation.
The limitation: Sampling. We can’t trace every request without impacting performance, so we sample. This is excellent for understanding common flows, but may miss rarely-used code paths in the aggregated view.
Bringing It Together: Multi-Layer Architecture
Here’s what makes this powerful: we build three separate graphs — one from each source — that create different perspectives on service relationships:
Network graph from eBPF flows: Every connection, regardless of instrumentation
Application graph from IPC metrics: Rich endpoint and protocol details
Request graph from tracing: Actual runtime behavior and call paths
Engineers can:
View each graph independently to focus on a specific perspective (pure network connectivity, application-level calls, or traced request flows)
Combine them into a unified graph by querying multiple partitions in parallel and merging results — our system returns the union of nodes and edges from all requested layers while preserving each layer’s distinct properties
The unified view is especially powerful because:
Network flows ensure completeness — we don’t miss anything
IPC metrics provide application details — we understand the “how” and “what”
Tracing shows actual behavior — we see real request patterns
Each source compensates for the limitations of the others. The result is a comprehensive, accurate, and contextualized view of service dependencies that can be explored from multiple angles.
From Flows to Graph: How We Built It
Here’s the high-level architecture (we’ll dive deeper into engineering challenges in our next post):
Flow logs travel from multi-region Kafka through three aggregation stages — initial batching, intermediary resolution, and final enrichment — before being persisted to the graph database and served via API.
Multi-Region Ingestion: We consume flow logs from Kafka across multiple AWS regions where Netflix operates. This runs continuously, processing millions of flow records as they arrive.
Distributed Processing: We use Apache Pekko Streams (a fork of Akka) to process these flows in a distributed, fault-tolerant pipeline. The system automatically partitions work across our Auto Scaling Groups to handle the volume and provides natural backpressure handling.
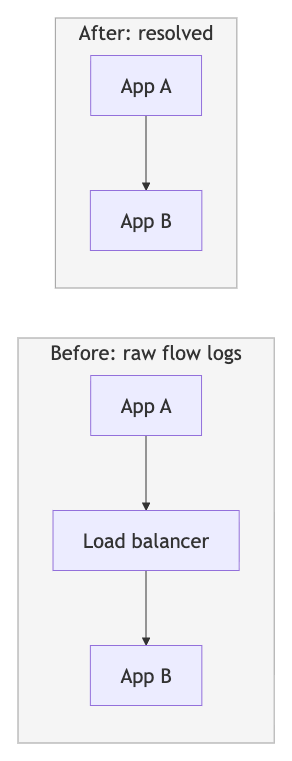
Three-Stage Distributed Aggregation: We aggregate network flows through a three-stage pipeline that solves a fundamental challenge: network flow logs only show individual network hops through intermediaries (App A → Load Balancer → App B, or App A → NAT Gateway → App B), not the true application-level connections we need (App A → App B).
Stage 2 resolves network intermediaries: raw flow logs show two separate hops (App A → Load Balancer → App B), but the resolved graph stores the direct application-to-application relationship (App A → App B).
Stage 1 performs initial aggregation from Kafka. Stage 2 applies resolution logic — identifying network intermediaries (load balancers, NAT gateways, API gateways, proxies) and combining their incoming and outgoing flows to reconstruct direct application-to-application paths. Stage 3 performs final aggregation with health status integration before graph persistence. This graduated approach also prevents hot spots by distributing load across multiple points even when specific applications or network intermediaries see 100x more traffic than others.
Graph Storage: We persist the topology in Netflix’s graph database, an abstraction layer built on top of our distributed key-value storage infrastructure. This graph database is specifically designed for high-throughput graph operations at our scale, with fast multi-hop traversal capabilities. Each of our three data sources (network flows, IPC metrics, tracing) creates a separate graph that can be queried independently or merged.
gRPC API: We expose the topology through a gRPC service that supports multi-hop traversal, filtering by availability tier and business domain, pagination for large result sets, and sub-second query response times.
The technical details of building this at Netflix scale — handling Kafka lag, managing memory and garbage collection, optimizing distributed processing, debugging reactive streams — deserve their own discussion. We learned a lot, and we’ll share those lessons in our next post.
What Engineers Can Do Now
Today, the service topology map is helping engineers across Netflix:
Visualize Dependencies: See upstream and downstream dependencies for any service, with the ability to filter by availability tier (Tier 0, Tier 1, etc.) and business domain. Choose between the unified view (combining all sources) or individual graph views (network-only, IPC-only, or trace-only) depending on what you’re investigating.
Jump to Detailed Signals: From any service in the topology, quickly navigate to logs, traces, and detailed metrics in their respective tools. No more hunting for the right service name or time window — the topology provides the context and the starting point.
Understand Blast Radius: Before taking a service down for maintenance or making significant changes, see exactly what will be impacted. Identify which teams to notify and what to monitor.
Overlay Health Status: See not just the topology, but which services in the call path are experiencing issues. This is integrated with health status tracking, so you can quickly identify if a problem you’re seeing is actually originating somewhere else.
Query Programmatically: Use our gRPC API to integrate topology information into automated systems. For example, our Platform Modernization Engineering team uses this to verify that critical Live services have proper availability tier classifications throughout their dependency chains.
Investigate Faster: During incidents, quickly identify if a failure is local or if it’s propagating from somewhere else in the call graph. Follow the failure pattern to find the root cause.
Plan Changes Confidently: Understand the impact of proposed architectural changes or service migrations before implementing them.
Time Travel Through Topology: Query what the topology looked like at specific points in the past. Understand what changed in dependencies around the time an issue started, or see how your service’s dependency footprint has evolved over time. This time-travel capability is powered by time-window aggregation — instead of storing every time slice separately, we use layer-specific aggregators that accumulate topology data across windows, allowing us to reconstruct historical views efficiently without exploding storage costs.
The Living Map: Always Current
What makes this truly useful is that it’s a living map. It’s not a static diagram drawn in a design document that goes out of date the moment it’s published. It’s continuously updated based on actual traffic:
When a new service starts calling an API, it appears in the topology with near real-time freshness
When a service stops making calls to a dependency, that edge fades from the graph
When services deploy and their behavior changes, the topology reflects it
When incidents impact service health, the status overlay updates in real-time
This means engineers can trust what they see. The map reflects reality, not someone’s idea of what the architecture should be.
The Journey Continues
We’re not done. We continue to evolve the system with new capabilities:
Change Event Overlay: We’re working to surface deployment events, configuration changes, and other mutations alongside the topology graph. Correlation becomes easier when you can see both the dependencies and what changed when.
Richer Context: As we expand coverage and integrate more signals, we continue to enrich the topology with additional endpoint-level details, protocol information, and network path context.
And looking further ahead, we’re excited about something bigger: Automated root cause analysis. Imagine an intelligent agent that continuously crawls the topology graph, correlates failures across dependencies, understands historical patterns, and surfaces likely root causes automatically. Service topology provides the knowledge graph foundation that makes this kind of intelligent automation possible.
Why This Matters for Our Members
This might seem like infrastructure — plumbing that our members never see directly. But it matters immensely to their experience.
When engineers can quickly understand dependencies and identify issues, incidents get resolved faster. When we can model blast radius before making changes, we avoid disruptions. When automated systems can query dependency information programmatically, we can build smarter, more resilient systems.
All of this translates to what matters most: our members getting to watch their favorite films and series, seamlessly, whenever they want. Whether it’s a weekend binge of a beloved show, a live sports event, or discovering something new through our recommendations tailored to their tastes — we want it to just work.
What’s Next in This Series
This is the first in a series of posts about building Service Topology at Netflix.
In our next post, we’ll pull back the curtain on the engineering challenges we faced at scale: How do you handle Kafka consumer lag when ingesting millions of flow logs per second? What happens when distributed processing meets garbage collection pauses? How do you debug reactive streams that stall under load? How do you manage hot nodes in a distributed system? We’ll share the real problems we hit in production and the solutions we developed.
In future posts, we’ll explore the lessons we learned that apply to any distributed system at scale, and where we’re heading next with time travel capabilities and Automated root cause analysis.
Special thanks to the many engineers across Netflix who made this possible — the Observability team who built the broader system, the graph database platform team who provided the storage foundation, and the Platform Modernization Engineering, Live, and Ads teams who provided invaluable feedback and use cases throughout development.
Европейският тур на Румен Радев със сигурност доказа едно – вторият Орбан още не се e родил, след като първият вече е история. Българският премиер не е политикът на големите битки, нито притежава политическата тежест и решителност за открит бунт срещу Европейския съюз.
Първата му обиколка в чужбина като премиер показа, че е достатъчно умерен, за да е приемлив за Брюксел, но и критичен, за да запази образа си пред евроскептичната публика в България. Той имаше срещи с френския президент Макрон, с генералния секретар на НАТО Марк Рюте, с председателя на Европейската комисия Урсула фон дер Лайен и на Европейския съвет – Антонио Коща.
Радев не е човекът на големия разрив, а на голямото „да, но“.
Да, България е част от ЕС, но не бива да помага на Украйна. Най-напред да гарантира стандарта на живот и сигурността на българските граждани и след това може да отделя средства за въоръжаване на чужди армии.
Да, Русия е проблем, но Европа трябвало „да преговаря“ и да бъде водеща.
Европа трябваше да бъде водеща в тези преговори, да не допуска те да се изземват като инициатива от други, трети играчи. Това е важната мисия на Европа. Това, което лично мен ме притеснява, това е стремежът на Европа да постигне конвенционална победа над най-голямата ядрена сила, без да има възможности да прихваща и да противостои на съвременните хиперзвукови оръжия. Това е сериозен риск. Трябва да има смяна на цялостната политика на Европа по отношение на конфликта в Украйна.
Тези изявления на Радев след срещата му с президента Макрон в Елисейския дворец звучат като „реторика за вътрешна употреба“, по определението на анализатора Веселин Желев.
Във френските медии, отбелязва Желев, няма нито една публикация, нито един репортаж, нито дори кратка бележка за визитата на българския премиер. Радев е невидим за France-Presse, както и за водещите всекидневници и седмичници – Le Monde, Le Figaro, Libération, Journal du Dimanche, Le Point, L’Express – плюс сайтовете на основните телевизионни канали и France 24.
В България обаче социологическата агенция „Маркет Линкс“ измери рекордните 56% одобрение за Румен Радев – компенсация за френското пренебрежение, на фона на 77% неодобрение за лидера на ГЕРБ Бойко Борисов.
В Брюксел и Париж Радев всъщност повтори една и съща политическа формула: България е лоялна на ЕС и НАТО, но Европа греши в най-важния си геополитически избор. Според президента континентът е избрал да търси „мир чрез сила“, да инвестира в превъоръжаване и дългосрочна подкрепа за Украйна вместо в преговори. Позиция, която той следва през последните години.
С Урсула фон дер Лайен Радев говори за върховенство на закона, за борба с корупцията и общи европейски решения. Тя пък, освен новината за размразените 370 млн. евро по Плана за възстановяване и устойчивост, отбеляза, че разчита на българската подкрепа за Украйна, както и за противодействие на хибридните атаки срещу ЕС.
В НАТО Румен Радев подчерта българския принос към сигурността на Алианса. Абсурдизмът в позициите му е, че поставя под съмнение самата логика на европейската политика към Украйна, а в същото време е повече от ентусиазиран за още инвестиции в отбраната и за развитие на потенциала на военната индустрия, в това число чрез инструмента SAFE.
Двойни стандарти
Симпатизантите на Радев не улавят тези противоречия. В действителност България е облагодетелствана от продължаващата четвърта година война в Украйна, взела близо 2 милиона жертви от двете страни.
За периода 2022–2025 г. военнопромишленият комплекс e изнесъл оръжие за над 6,65 млрд. евро. Въоръжението и боеприпасите са около 5,5% от целия експорт. Зад тези цифри стоят хиляди нови работни места и заплати, което пък означава ръст на потреблението и подкрепа и за други сектори на икономиката.
България укрепва отбранителните си способности, модернизирайки армията си. Постигната е целта за инвестиции в отбраната, равни на 2% от БВП и се върви към повишаване до 5%, потвърди самият Радев, бивш главнокомандващ Военновъздушните сили, преди да бъде избран за президент.
Специално внимание заслужава инструментът SAFE, който предвижда до 150 млрд. евро заеми за общи военни поръчки, развитие на европейската отбранителна индустрия и намаляване на зависимостта от американско оръжие.
Украйна не може да взема заеми по програмата „Действие за сигурност за Европа“, но пък е изцяло асоциирана със SAFE. Нейни компании могат да участват в производството и доставките. За да бъде финансиран даден проект, европейските правила изискват крайният продукт (например боеприпаси или бронирана техника) да съдържа поне 65% компоненти, произведени в ЕС, Европейската асоциация за свободна търговия или Украйна.
Полша води инициативата с одобрен мащабен национален план на стойност 43,7 млрд. евро за 139 отбранителни проекта. Като гранична държава, голяма част от нейните съвместни поръчки са насочени към укрепване на източния фланг и интеграция с украинското производство.
Румъния се нарежда на второ място по обем на финансиране с одобрен план за 17 млрд. евро. Тя играе критична логистична и производствена роля в проектите, свързани с Украйна.
Балтийските държави (Естония, Латвия и Литва) първи получиха одобрение за своите планове и настояват за съвместни поръчки на артилерия и дронове, в които украинските компании участват като подизпълнители. България ще вземе 3,261 млрд. евро нисколихвени заеми по SAFE, като част от тези средства ще бъдат насочени към съвместно дружество между германския концерн Rheinmetall и държавните ВМЗ – Сопот. Целта е изграждане на завод за производство на 155-милиметрови артилерийски снаряди и барут по стандартите на НАТО.
Как неподкрепата за Украйна се съчетава с ползите от войната – икономически, индустриални и стратегически, е тема, която Радев не коментира. Защото България едновременно печели от европейското превъоръжаване, разширява военната си индустрия, модернизира армията си с европейски средства и участва в общата отбранителна архитектура на ЕС. В същото време премиерът продължава да говори така, сякаш подкрепата за Украйна е чужд, наложен отвън проект.
Политиката, която демонстрира при срещите си с европейските лидери, не е на открит конфликт с ЕС, а постепенно отстъпление с внушението, че европейската решителност е опасна, а европейската солидарност – прекалено скъпа.
Абсолютното мнозинство, което спечели в България обаче, притъпява остротата на политическите реакции. Липсваха коментари от парламентарно представените политически сили, с изключение на „Да, България“, част от „Демократична България“.
Не Украйна започна войната, а Русия, и не Украйна и Европа отказват преговори, както казва Румен Радев, но Русия иска капитулация… Ако не само символно, но и реално Радев започне да откъсва България от сърцето на Европа и застане срещу българския интерес, ще реагираме светкавично и остро.
Божидар Божанов, съпредседател на „Да, България“, пред Дарик радио
Засега премиерът показва двойни стандарти. От една страна, казва сбогом на оръжията за Украйна, от друга, одобрява инвестициите в отбрана, но не се осмелява да защити тази сигурност с ясна политическа позиция. Иска ЕС да плаща цената на сигурността си, без да има смелостта да назове откъде идва заплахата.
Затова остава невидим за Европа и толкова удобен у дома.
Пролетта във Филаделфия е необичайно красива с топлите си кехлибарени изгреви и залези, с бързо преминаващите облаци, които понякога се превръщат в също толкова бързо преминаващи бури. С първите майски гръмотевици – точно като в София. Из улиците се веят транспаранти в чест на 250-годишнината от създаването на САЩ. Атмосферата е особено празнична в старата столица, където е подписана Декларацията за независимостта.
Орди туристи се стичат не само от цял свят, но и от всички краища на Америка. Навсякъде има обяви за изложби и чествания. Когато се качвам в самолета от София, малко преди нас излитат няколко от черните самолети с надпис U.S. Airforce, които домуват на летище „Васил Левски“ от седмици насам. Накъде – мога само да гадая. Отвъд океана войните на Америка са просто новинарски поток, далечна приказка, риалити, което дори не тече по телевизията. По десетките екрани в баровете се върти спорт, метрото е пълно с хора, облечени в червено, които се връщат от мач на бейзболния отбор на Филаделфия. Апокалипсисът се случва навсякъде, но не и в Америка. Тя държи само правата за кинопродукцията.
В осми брой на „Гласовете на Америка“ си взехме въздух от същия новинарски поток, но не през ескейпизма на хляба и зрелищата, а през музиката. В настоящия брой ще направим същото, но през три исторически важни стихотворения, които разказват и осмислят САЩ извън заглавията, извън новините, извън апокалипсисите, които са им така присъщи и в които така имаме навика да се губим, пропускайки същественото.
Тези стихотворения може би ще ни успокоят, че и преди се е стъмвало – и може да бъде светло отново.
Приятно четене.
Виж, гаснат светлините
Стоманеносиво, с петна от сенките на облаци, морето попива последните вечерни светлини. Гласът е мощен и пяната с цвят на олово, и приливът поглъща пясъците.
Тук стой като древен камък и виж как гаснат светлините, чуй гласа на океана. Ненавист и мъка сграбчват Европа и Азия и морският вятър е леден.
Настъпва нощ: нощта ще поиска всичко. Светът не се е изменил, по-разголен е само: силните се борят за власт, а слабите топлят бедните си сърца с омраза.
Настъпва нощ: върви си вкъщи, опитай се да хванеш по радиото новините. Чуваш ли ги, гласовете на Америка: наивни, властни, лицемерни и обречени.
Кога? След четири или четиридесет години? Защо му е на камъка да рови бъдещето? Стой на своя бряг, древни камъко, и нека соленият вятър направи главата ти бяла.
Робинсън Джефърс, 1941 г., превод Николай Попов
Стихотворението на Робинсън Джефърс вдъхновява името на този бюлетин. Американският поет пише основно в наративна и епична форма и е смятан за икона на природозащитното движение. Противоречивата му философия, която той нарича „нехуманизъм“ (inhumanism), е сред основните причини да бъде отхвърлен от канона и днес да не се нарежда по популярност до поети като Т. С. Елиът например. Живял и творил по време на две световни войни, Джефърс вярва, че човечеството е твърде антропоцентрично и претръпнало към красотата на света и живота.
В една от своите поеми Джефърс предлага хората да децентрализират вниманието от самите себе си. Призивът е колкото странен, толкова и актуален с оглед на различни съвременни движения, включително и на идеите на британския артист и писател Джеймс Бридъл, който преосмисля концепцията за интелигентност във времената на изкуствения интелект и смята, че интелектът не е само човешко качество, а черта, присъща на всички живи организми.
Решението според Джефърс е „отстраняване“ от конфликтите, а не заемане на морална позиция в тях. През 1948 г. той публикува няколко критични стихотворения за американското участие във Втората световна война и издателството му Random House цензурира част от произведенията му, като също добавя бележка, че позицията на Джефърс не е позицията на издателството.
Становището на Джефърс е, че войната е безкрайна борба на империи за пазари и ресурси, а не морална битка, и че в нея няма победители, както и че прекаленото митологизиране и военна намеса на САЩ в чуждестранни войни ще унищожи републиката и ще ускори разпадането на държавата. Опасенията на Джефърс са, че в САЩ ще се загърби идеята за свободна република в полза на свръхамбициозна военизирана империя.
Във „Виж, гаснат светлините“ се отличават основните теми от поезията на Джефърс: незначителността на човешките вражди и проблеми пред огромното безвремие и великолепие на естествения свят, гаснещите светлини на цивилизацията, нескончаемата човешка борба за власт и ресурси, безкрайният шум на новините, падащият мрак. Камъкът и океанът са сред основните символи в творчеството на Джефърс, който живее на калифорнийския бряг, където построява каменния замък „Тор“. Творчеството му повлиява върху Чарлз Буковски, полския поет Чеслав Милош (който превежда много от стиховете му), фотографа Ансел Адамс и др. Противоречив и гениален, Джефърс остава колкото философски недостижим и може би дори наивен, толкова и неволен пророк на времената, в които живеем.
Пред моето напрегнато лице вратата ти затворена е здраво, но имам смелост, имам дързостта да нося гняв в сърцето си кораво. Паважът под краката ми гори, в гърдите сякаш зее грозна рана, кръстосвам мълком булеварда бял, загледан в портата ти обкована. И твърдост в себе си безспирно диря, и разум тук, пред тежките колони, че нужна ми е свръхчовешка сила, Бял дом, да спазвам твоите закони.
Клод Маккей, 1919 г., превод Николай Попов
Сонетът на ямайско-американския автор Клод Маккей е публикуван през 1922 г. в лявото издание The Liberator. Чернокожият автор заимства поетичните структури на Шекспировите сонети, присвоявайки си – донякъде скандално за времето – литературни и културни символи на бялата образована американска класа. По това време сонетът се смята за вече остаряла форма, така че изборът му е целенасочен.
Маккей е основна фигура на Харлемския ренесанс и изгрява със стихотворението си „Ако ни чака смърт“, провокирано от „Червеното лято“ – вълна от линчове над чернокожи в САЩ след края на Първата световна война. Когато емигрира в САЩ през 1912 г., за да следва в Тъскиги, Алабама, Маккей е шокиран от дълбокия расизъм, на който става свидетел и мишена. Активната сегрегация му служи като катализатор и той започва да пише поезия, а цялата му кариера и живот са белязани от несправедливостта на институционализирания расизъм в САЩ. За съжаление, Маккей не доживява раждането и победата на движението за равни граждански права, но и до днес остава ключова фигура в историята на афроамериканците.
След преместването си в Ню Йорк Маккей се включва в различни леви радикални сдружения, свързани с човешките права. Временно живее в Лондон, а през 1922 г. става част от руската болшевишка партия, мака да смята, че Комунистическата партия на САЩ не приоритизира достатъчно правата на чернокожите и дори че използва техните каузи за собствени цели. След кратко пребиваване в Русия Маккей осъзнава, че Коминтернът също го използва за собствените си пропагандни и геополитически цели, за което разсъждава в непубликувания си ръкопис „Харлемска слава“.
По-късно в своята биография Маккей пише за причините, поради които в крайна сметка отказва членство в Комунистическата партия и избира изкуството пред ригидността на идеологията и партийната принадлежност. Пътят на Клод Маккей през литературата, идеологията и политиката разкрива напрежението между оформящите се тогава идеологически рамки – на комунизма и капитализма, – които ще застанат от двете страни на основната разделителна линия на XX век и ще намерят кулминация в Студената война.
Комунизмът и социализмът все още са обсъждана алтернатива на пазарния капитализъм в САЩ, защото историята на държавите от Източния блок остава слабо позната, от една страна, и поради силната марксистка традиция в американските университети, от друга. От възможни работещи алтернативи до различни версии на „червената заплаха“, войната на идеологиите е релевантна и в контекста на културните войни. Творчеството на Маккей успява да надскочи тези идеологически рамки и да говори за институционалната несправедливост, за различните Америки, обитавани от различните американци, и за безкрайната борба за граждански права, която продължава и днес.
Не дръзкият гигант със древногръцка слава, от бряг до бряг разкрачил войнствени нозе; пред портите, окъпани от залез и море, ще спре със огнен факел във ръце – могъществена, права, светкавиците овладяла, тя името си разгласява: Майка на Изгнаници. С десница като фар зове, цял свят приютява и поглед мек ще разпростре над мостовете от ефир на двата огледални града. „Задръжте, вехти царства, славния разкош – извиква тя със устни неми. – На мене дайте уморени, бедни, потъпканите бежанци, жадуващи за свобода, окаяната сган от бреговете ви безредни. Пратете тях, бездомни, корабокрушенци, светилник аз издигам над златната врата!“
Няколко строфи от „Новият колос“ са гравирани върху Статуята на Свободата. Ема Лазарус пише стиховете през 1883 г. като част от дарителската кампания за построяването на пиедестала на статуята – за тази дарителска кампания сме ви разказвали в шести брой на бюлетина. Историческият контекст на стиховете обаче далеч надминава стогодишнината на държавата и създаването на статуята. По това време писателката и поетеса Лазарус помага на еврейски бежанци в Ню Йорк, които бягат от погромите в Русия. Самата Лазарус също е потомка на евреи, дошли от Германия и Португалия. Тя превежда Шилер, Хайнрих Хайне, Александър Дюма и Виктор Юго и става разпознаваема със стиховете си и прозата си както в САЩ, така и в Европа.
Освен това краят на XIX век e време на ожесточен сблъсък между т.нар. нативисти и антинативисти, период на огромно политическо преосмисляне на въпроса кого да допускат САЩ на своя територия. Нативистите – основно протестанти от англосаксонски произход, изразяват тревога, че нашествието от нови имигранти ще размие американската култура, ще понижи заплатите и ще урони републиканските принципи и политическата система. На мушката са основно католици – ирландци и немскоговорящи, за които съществуват опасения, че са по-лоялни на папата, отколкото на държавното управление на САЩ и институциите на демокрацията. Огромна е и кампанията срещу южно- и източноевропейците: италианци, славяни, включително поляци, сред които има не само католици, но и православни; те се възприемат като бедни и културно различни, а също и като по-низши от расова гледна точка. На Западния бряг има изразена враждебност срещу китайските имигранти, които са обвинени, че крадат работни места от белите, и се твърди, че е невъзможно да се асимилират.
Нативистите постигат огромна политическа победа през 1882-ра – година преди публикуването на поемата на Лазарус, с Указа за изключване на китайците, с който за първи път в историята на страната се забранява влизането в държавата на определена група хора на основата на националността и расовата принадлежност. Антинативистите, сред които индустриални предприемачи и хуманитарни активисти (като Лазарус), смятат, че Америка е убежище за низвергнатите и че имиграцията е необходимо гориво за бързо разрастващата се индустриална държава. Избирайки да илюстрира статуята не като символ на военни завоевания, а като майка на изгнаниците, Лазарус обръща курса на историята в особено красив поетичен бунт.
Ксенофобската нативистка политика достига кулминацията си чак през 20-те години на новия век, когато се приемат още антиимиграционни закони, налагащи квоти за новопристигнали имигранти (включително българи). Тези политики се отменят чак след Втората световна война и имат негативни икономически последствия. През това време в страната има огромен недостиг на работна ръка, а индустриалният бум се забавя – изключването на китайските работници води до 62% спад в общото производство. През 1924 г. земеделският бизнес активно лобира да няма квоти за южноамерикански работници заради недостига на евтина работна ръка, която да събира реколтата от памук, захарно цвекло и плодове. Официалната политика между САЩ и Мексико води до наплив на 4,5 милиона мексикански работници. Много от южно- и източноевропейските работници във фабриките в Севера са заменени от афроамериканци и пуерториканци.
Война, несправедливи закони, ксенофобия и антиимигрантски настроения – тъканта на САЩ е направена и от това. Докато вървях из улиците на Филаделфия, където са живели Джордж Вашингтон и Бенджамин Франклин; където Едгар Алън По измисля своите мрачни истории; където са свирили някои от най-добрите джаз музиканти в историята; и където от прозорците днес ме гледат плакати FUCK ICE, докато покрай мен минава огромен камион с черно-бял американски флаг със синя линия в подкрепа на полицията, си мисля, че въпреки горчилката някак продължавам да обичам тази страна. Страна на крайностите, страна на гения и на пълното отсъствие на интелект, страна на жестокостта и на безусловната, безгранична човешка щедрост, страна на риалити шоута и на мъдрото преосмисляне на историята, страна на стагнацията и страна на промяната.
А иначе всичко ново е добре забравено старо.
Абонирайте се, за да получавате този бюлетин на електронната си поща в момента, в който излезе!
Вече сте регистриран потребител на Toest.bg? Може директно от настройките на бюлетините в своя профил да изберете „Гласовете на Америка“ или да натиснете бутона по-долу:
In law and social science, we call this impact a chilling effect—the behavioral tendency for people in face of a threat to self-censor and restrain their activities for self-protection.
It’s increasingly clear to us that these impacts are not incidental or ancillary to Trump administration policy. Rather, the chilling effects are the point. This is the closest thing to a consistent governing strategy in Trump’s second term.
The broader chill of Trump threats
Chilling effects can be subtle, but today they are everywhere. And it’s not just students who are chilled by Trump administration threats.
Law enforcement and regulatory agencies are refusing to investigate Trump-aligned actors inside or outside government, and major national law firms are declining cases challenging Trump administration policies.
In most cases, these people and institutions are not being specifically targeted or threatened by Trump. But they are afraid, and their fear is doing the administration’s work for it. They stay silent, avoid attention and confrontation, and look the other way. In other cases, they change their speech and behavior to accommodate or conform to the administration’s worldview.
Of course, there are counterexamples, such as the winter protests in Minneapolis in response to brutality by agents with U.S. Immigration and Customs Enforcement, and the recent “No Kings” rallies. But even here, the broader but less visible trend—chilling effects—is evident.
For instance, in recent reporting on the latest No Kings rallies, manymedia outlets observed that students were noticeably missing, despite the Trump administration’s unpopularity among younger Americans.
A persistent strategy
We believe none of this is by accident.
In a new book, “Chilling Effects: Repression, Conformity, and Power in the Digital Age,” one of us—Jon Penney—explains how law, technology, and state and corporate power are weaponized to chill and repress, and the dangers this poses for the United States and other democratic societies. The other—Bruce Schneier—has extensively studied the security infrastructure enabling this.
What we see isn’t gratuitous government cruelty, chaos or vengeance. Instead, we see a persistent strategy to maximize fear and chilling effects in ways that are corrosive to freedom and democracy.
In the 1960s, these same tactics were reused by Southern states to chill the Civil Rights Movement. Historians havewritten about how the widespread fear and conformity of these periods reshaped American society in enduring ways, including the destruction of progressive political movements and both delaying and muting the Civil Rights Movement itself.
When such state threats are systematized, they can foment a broader climate of fear, self-censorship and conformity. In that climate, dissenting speech, political opposition, democratic mobilization and other checks on power become increasingly difficult, even dangerous. It is no surprise, for instance, that Trump critics regularly admit to self-censorship, fearing for their safety.
Chilling effects are thus not only repressive—causing self-censorship—but productive. They produce conforming and compliant speech and behavior, which can have longer-term social impacts. They not only undermine protected rights and suppress accountability but can promote social change—even without a popular mandate to do so.
In the near term, this means an increasingly weakened democratic society, with the government and its patrons enjoying freedom to pursue their objectives. Over the long term, this can mean a changed society as more conformist and compliant speech and culture become more widely accepted and entrenched.
Not inevitable
In our view, this future is not inevitable, just as the McCarthy era “Red Scare” and violent civil rights era repression were not. In both cases, fear and chilling effects were resisted in law and civil society, as they can be today.
But the central mechanisms—surveillance, uncertainty, personal threats and abuse of power—would need to be addressed. For instance, new legislation could ensure justice for lawless government actors and constrain surveillance. Courts can block abuses of federal power, including illegal arrests, detentions and mass citizen databases.
The media, lawyers and civil society can hold the government accountable. And students, teachers, universities and cultural institutions can resist the tendency to self-censor and conform.
The citizen mobilization in Minnesota and the No Kings rallies are examples of that. But to resist chilling effects and their dangers over the long term, this would have to be the norm, not the exception.
This essay was written with Jon Penney, and originally appeared in The Conversation.
В началото на месеца новинарските емисии започнаха да бълват информация за пасажерите на круизния кораб MV Hondius, който стана злополучно известен с пътниците си, заразени с хантавирус. За съжаление, няколко от тях починаха, а други проявиха симптоми по-късно. След опита, който натрупахме с COVID-19, повечето от нас сигурно са наострили уши и следят случващото се с известна тревога, особено след като пътниците от кораба бяха изпратени в държавите си.
Към момента има активни случаи в няколко страни в Европа. Повечето от пациентите са стабилни, с изключение на жена във Франция, чието състояние се описва като тежко. Макар че вирусът има потенциал за разпространение, тъй като някои от пасажерите напуснаха кораба, преди да се вземат активни мерки за ограничаване на възможните контакти, Световната здравна организация (СЗО) определя ситуацията като нискорискова. Такова е мнението и на българското Министерство на здравеопазването.
Хантавирусите са голяма група РНК вируси, разпространявани от гризачи,
като в общия случай всеки вирус има строго специфичен резервоарен вид. Обикновено хората се заразяват при вдишване на частици, замърсени с екскременти, урина или слюнка на гризачи. В зависимост от типа хантавирус заболяванията са два вида. Вирусите, разпространени в Европа и Азия, предизвикват хеморагична треска с бъбречен синдром. Това заболяване се среща и у нас, като за ендемични се смятат планинските райони, но според изследване от 2016 г. разпространението може да е по-широко.
Американските щамове, от чиято група е вирусът на круизния кораб, имат друга симптоматика. Тя се изразява в белодробни и сърдечни проблеми – хантавирусен сърдечно-белодробен синдром (ХСБС), който е много по-сериозен и с по-висока смъртност. Конкретният вирус е тип Andes(ANDV) – открит е в Аржентина и е наречен на Андите. Освен че причинява значително по-тежко заболяване, той е по-опасен и поради способността му да се предава от човек на човек.
За добро или лошо, нямаме много информация за този пренос, тъй като случаите до момента не са много, но от това, което знаем,
вероятността вирусът да причини пандемия е ниска.
Това се дължи на две основни негови особености. На първо място, той се предава по-трудно – нужен е продължителен контакт с носител на вируса и пренос на слюнка (директно или чрез капки), поради което дори обикновените маски са много подходящи да бъде спрян. Наред с това се смята, че носителите са заразни само ако активно проявяват симптоми. Тази комбинация драстично намалява риска от заразяване с вируса в сравнение с COVID-19.
Неприятна характеристика на вируса е широкият му инкубационен период, който е от 1 до 6 седмици, а в редки случаи достига до 8. Това означава, че всички потенциално контактни лица трябва да прекарат това време в карантина.
Тъкмо когато вълненията около хантавируса започнаха да се успокояват, СЗО излезе с
в Демократична република Конго и Уганда. Огнището е в провинция Итури, район в Конго, намиращ се на границата с Уганда. Той е белязан от кървави конфликти между различни групировки, което значително затруднява работата на здравните работници. Оттам са проследени няколко случая на пренос към столиците Киншаса и Кампала, както и в други райони на Конго.
Първият предполагаем случай е от 24 април – мъж, починал след проява на характерни симптоми. След като на 5 май СЗО е информирана за предполагаема поява на ебола, тя изпраща екип на терен. Първите позитивни тестове идват чак на 14 май и са изненада – вирусът не е по-често срещаният заир, за който са тествали в началото, а бундибуджо. Ден по-късно са потвърдени стотици случаи на заболяването, което показва сериозно забавяне на реакцията на здравните служби. Към 22 май потвърдените случаи са 82, предполагаемите – 750, а починалите – 177, но най-вероятно мащабът е по-голям.
Поради това властите забраниха събирания на повече от 50 души, както и всички погребения. Тези мерки не се приемат добре и вече има случаи на нападения на медицински центрове. За съжаление, подобни атаки са често срещано явление по време на епидемии. С тези атаки военизираните групировки всяват допълнителен ужас, убивайки и отвличайки хора. Местните се отнасят скептично към здравните работници, защото много живеят в отдалечени райони и се сблъскват с лекари само по време на епидемии, така че понякога правят обратна причинно-следствена връзка, мислейки си, че лекарите ги заразяват нарочно.
Не на последно място, традициите за изпращане на мъртвите са много силни и в тях се вплитат религия и свръхествествено. Освен че служат за почитане на паметта на покойните, има поверия, че ако ритуалите не бъдат изпълнени, мъртвите ще прокълнат близките си или ще се върнат като зли духове. Лошото е, че погребенията са свързани с много контакти с тялото на мъртвия, което при ебола все още е силно заразно. Така вирусът много лесно се разпространява в семейните групи.
Засега единственият потвърден болен извън Африка е американски лекар, работещ в Демократична република Конго, който е дал положителен тест за вируса, но е в добро състояние. Той е транспортиран в болница в Берлин, която е специализирана в изследване на такива сериозни патогени и осигуряване на грижа за пациенти, заразени с тях. Членовете на семейството му, които са контактни, също са под наблюдение.
Още един американски лекар е в Чехия – той е бил изложен на вируса, но към момента не проявява симптоми. И двамата са под строга карантина и не представляват риск за общественото здраве. Европа традиционно се включва при появата на ебола в ендемичните за вируса райони и има добре обучени за целта специалисти.
Американското правителство обяви, че ще финансира създаването на 50 полеви клиники, но това не покрива и малка част от програмите, които бяха спрени по време на втория мандат на Тръмп. След като USAID беше закрита и САЩ се оттеглиха от СЗО, бюджетът на Американските центрове за контрол на заболяванията (CDC) e намален. Намалена е и здравната помощ, която се отпуска на африканските държави. Тези мерки силно ограничиха възможността за рутинно следене и потушаване на огнищата още в началото на появата на вируса.
Заболяването е описано сравнително скоро – първите регистрирани случаи са през 70-те години на миналия век. В началото симптомите са „стандартни“ – отпадналост, висока температура и болки в ставите. С напредване на болестта започват и повръщане и диария, които влошават общото състояние поради обезводняване. При част от пациентите се наблюдават и вътрешни и външни кръвоизливи (имайте предвид, че не са „ефектни“ като по филмите). Всички телесни течности са много заразни и трябва да се избягва контакт с тях.
След последната мащабна епидемия срещу по-често срещания вирус – заир, беше разработена ваксина, която вече е поставена на много хора в рисковите райони. За вируса в актуалното огнище все още няма ваксина и грижите за пациентите, както при повечето вирусни заболявания, са поддържащи.
Обикновено след реакция на СЗО епидемиите се ограничават и огнищата се потушават без глобално разпространение на причинителя. Вирусът рядко напуска Африка и обикновено заразените са медицински лица, които са се сблъскали с него в работата си. Това не значи, че последствията не са трагични – в район, който така или иначе е разкъсван от конфликти и бедност, появата на ебола предизвиква неимоверно допълнително страдание.
Уви, като всяка зооноза, това най-вероятно няма да е последната епидемия от ебола. Книгата на Дейвид Куамен Spillover остава гореща препоръка за всеки желаещ да научи повече за вирусите, които винаги ще бъдат наблизо и ще продължат да ни държат в напрежение.
Среща в ниска орбита
Наред с пандемиите, опасност в глобален мащаб са и големите скали, обикалящи из Космоса. Те имат потенциала да променят напълно облика на планетата ни, а по-сериозните сблъсъци могат да поставят оцеляването на човешкия вид под въпрос. Поради тази причина за търсенето и проследяването им се отделят значителни ресурси от повечето световни космически агенции.
Веднъж открити, те влизат в списъка на т.нар. потенциално опасни обекти (астероиди или комети) – тела, които прелитат близо до Земята и размерите им са достатъчни да причинят значителни щети. Повечето от тях са в стабилни и далечни орбити, така че не са непосредствена опасност дори в дългосрочен план. Но това не значи, че след време орбитите им няма да се променят и Земята няма да застане на техния път.
Един от тези астероиди е Апофис, който на 13 април 2029 г. (пада се петък, разбира се) ще прелети на впечатляващите 31 000 км от нашата планета – по-близо от някои сателити. Той ще бъде видим от Европа и Африка с интензитет на средноярка звезда, но движейки се с около сантиметър в минута в небето. За България най-доброто време за наблюдение ще е около 00:45 на 14 април, така че може да отбележите в календара си това изключително рядко събитие.
Близкото прелитане ще даде възможност за изучаването на обекта, като към момента са планирани две мисии.
след като в началото на месеца беше подписано споразумение за съвместна работа с Японската агенция за аерокосмически изследвания (JAXA). Тя ще осигури слънчевите панели и инфрачервена камера за апарата, както и изстрелването му през 2028 г. на японската ракета H3.
Десет месеца след изстрелването си „Рамзес“ ще доближи Апофис и ще го изпроводи по време на преминаването му покрай Земята. Тогава повърхността на астероида ще бъде заснета с висока разделителна способност в различни спектри и ще се следи за промени, причинени от гравитационните сили на планетата ни. Това ще обогати знанията ни за подобни обекти и за възможностите за отклоняването им, ако някой се окаже на път към нас.
„Рамзес“ ще носи и два по-малки апарата, които също ще съберат информация от астероида. Единият от тях – „Фаринела“,ще опита да изследва прах от Апофис и ще проучи вътрешността му с помощта на радарна система. Другият – „Дон Кихот“, ще се приближи повече от „Рамзес“, за да заснеме по-детайлни кадри, и ще направи опит за кацане. Ако той е успешен, испанският апарат ще измери влиянието на прелитането покрай планетата върху сеизмичната активност на астероида, както и влиянието на земното магнитно поле.
От американска страна щафетата ще поеме апаратът OSIRIS-APEX. Това е прекръстеният OSIRIS-REx, който, след като успя да събере и върне материал от астероида Бенну, бе пренасочен така, че да може да се доближи до Апофис малко след прелитането му покрай Земята. Апаратът ще влезе в орбита около астероида, което ще позволи прецизни наблюдения за около 15 месеца. След това ще се доближи до повърхността на Апофис и използвайки двигателите си, ще вдигне прах, за да се разкрие материалът под нея. Това ще му даде възможност да събере данни и от силикатен астероид, след като вече извърши анализ на карбонатния Бенну.
Заедно с „Рамзес“ на борда на ракетата H3 ще има и друг апарат, разработен от JAXA. DESTINY+ ще е малък и лек, с тънък алуминиев радиационен щит и ултралеки слънчеви панели. В Космоса той ще използва своите йонни двигатели, захранвани от слънчевите панели, за да се отправи на среща с астероида Фаетон. Това е обект с диаметър малко под 6 км, който прелита близо до Слънцето по орбита, сходна на орбитата на комета.
Той преминава сравнително близо до Земята, поради което е класифициран като потенциално опасен, но пътят му е добре проучен и не се очаква скоро да създаде проблеми за нас. Следващото му най-близко прелитане ще е на около 7 лунни разстояния през 2093 г. За да достигне Фаетон, апаратът ще има нужда от две години. Йонните двигатели са много икономични, но тягата, която създават, е малка.
DESTINY+ не е първият такъв апарат на JAXA – той върви по стъпките на Hayabusa1 и 2, които през 2010 и 2020 г. донесоха на Земята материал от астероидите Итокава и Рюго, също от групата на потенциално опасните обекти, преминаващи близо до Земята.
„Вояджър 1“ губи още един инструмент
В средата на миналия месецинженерите от NASA изключиха инструмента на „Вояджър 1“, засичащ заредени частици с ниска енергия. Същият уред на сестринския апарат „Вояджър 2“ беше изключен в началото на миналата година.
Двата апарата се захранват от три радиоизотопни генератора, които бавно губят своята мощност поради разпада на плутония в тях. Тъй като целта им е да напуснат Слънчевата система, използването на слънчеви панели е изключено, но дори и за мисии вътре в нея, след Сатурн те стават на практика неизползваеми. Това е причината, въпреки сравнително ниската им мощност, апаратите за далечни пътешествия да се оборудват с такива генератори.
Изключването на уреда беше планирано за тази година, но беше направено по-рано от очакваното. Причината е рязък спад в мощността на генератора, забелязан след рутинна маневра на апарата. Били са доближени нивата, при които започва автоматичното изключване на инструменти с цел запазване на основната система. За да избегнат това, инженерите са взели решение да изключат детектора, което би удължило мисията с около година.
Така от десетте научни инструмента на „Вояджър 1“ активни остават само два – магнитометърът, измерващ магнитни полета, и двете антени, които засичат промените в плазмените вълни в космическото пространство. Същите са активни и на „Вояджър 2“ заедно с уреда, изследващ заредени частици, идващи от Слънцето и от междузвездното пространство.
Добрата новина е, че апаратите не са изоставени.
Инженерите имат план за изключване на няколко големи консуматора и замяната им с по-енергоефективни алтернативи. Тъй като междузвездното пространство е много студено, част от системите трябва да работят, за да поддържат научните инструменти топли. Стратегията е наречена „Големият взрив“ и първо ще бъде изпробвана на „Вояджър 2“, тъй като той има повече мощност в генератора си и е по-близо до Земята. Ако тестовете са успешни, същият подход ще бъде приложен и на „Вояджър 1“.
Веднъж месечно Михаил Ангелов – биолог, агроном и любим нърд от нашия екип, ни представя най-интересните скорошни новини от различни сфери на науката и обяснява защо тези постижения са толкова значими за света и човечеството. Или най-малкото – любопитни и забавни.
Според закона за вероизповеданията те са свободни и равноправни. Според същия закон източното православие е традиционно за България, но това в никакъв случай не му дава привилегии спрямо останалите. Също така, че изповядването на религия не може да бъде използвано за политически цели, срещу здравето и правата както на членовете им, така и на другите. Доста може да се каже за това как основните религии у нас нарушават чл. 7, особено що се отнася до публичното здраве и вмешателството в светското образование. Тук ще говорим за друго обаче.
Чл. 18 задължава Софийски градски съд да поддържа публичен регистър на вероизповеданията и юридическите лица свързани с тях. Такъв публичен регистър не може да бъде намерен на страницата на съда. Чл. 12 ал. 3 задължава дирекция към министерски съвет да поддържа регистър на храмовете. Дирекция „Вероизповедания“ на МС има регистър, но както ще стане дума след малко, с него има проблеми. Чл. 21 посочва, че вероизповеданията имат право на имоти, но регистър на тези няма.
Започнах да се ровя в темата покрай картата ми за собствеността на имотите в България. Тогава бях шокиран, че голяма част от Рила е собственост на Българската православна църква. Тогава започнах да събирам информация за собствеността им. Задачата се оказа доста трудна. Върнах се към нея наскоро след като припомних за защитените стари сгради на ул. Шишман в София, които БПЦ като съсобственик има намерение да събори и застрои с жилищни блокове.
Успях да събера информация за над 19 хиляди поземлени имоти, сгради и самостоятелни обекти собственост на всички 71 регистрирани в България вероизповедания. Това е т.н. КИД 94.91. За целта използвах комбинация от няколко източника – имотния и търговския регистър и кадастъра. Не използвах регистъра на храмовете поради простата причина, че 45% от съдържанието няма координати, а доста от останалите са грешни – например поставени върху улицата, а не сградата, където е офиса на фирма регистрирана като религия.
Методология
В събирането на данните и изготвянето на картата разчитам изцяло на публични източници. Доколкото се налагаше да изчиства голяма част от тях, както и да комбинирам данните по подходящ начин, възможно е да има грешки в представянето на информацията. Ако откриете такива, моля оставете коментар, за да ги оправя. Някои от поземлените имоти или обекти имат повече собственици и само един да е вероизповедание. Има случаи, в които са вписани взаимоотношения различни от собственост като договор за ползване. В доста случаи ще забележите, че на картата е отбелязан поземлен имот, а религиозна организация притежава само сграда или офис на това място. Затова в описанието съм описал точно за какъв обект и взаимоотношения става дума.
Имотен регистър
Събрах над 100 справки за имотното състояние на юридически лица регистрирани като вероизповедания. Някои от тях купих, други ми бяха изпратени от други, които са търсели информация по темата. Имотния регистър е най-точният източник предвид, че е т.н. system of records що се отнася до собствеността. Не е без своите проблеми. Най-очевидния са липсващи или унищожени актове, за което стана въпрос наскоро и дори се стигна до уволнения.
Не е нужно да има злоупотреба обаче. Сериозна част от актовете не са налични, тъй като никога не са били вписвани. Това става обикновено при прехвърляне или продажба. Макар да има записи дори от 1960 г., за голяма част от имотите в картата ми няма да намерите нищо там. Най-големият проблем е, че въобще се налага да се плащат тези справки особено за юридически лица. Има проблем и с формата – получаваме PDF, който изписва всякакви актове и всички замесени лица в тях. Това е полезна информация, но първо се обработва трудно, второ получаваме доста записи като уреждане на сервитути. В крайна сметка намерих начин да обработя информацията и да отделя само онези имоти, които конкретната проверявана фирма притежава.
Търговски регистър
Откакто отвориха данните им е значително по-лесно да се сверява информацията. В случая използвах един от многото сайтове предлагащи такава услуга, тъй като показваше архивирани юридически лица с прекъсната дейност. Търсейки по 94.91 открих 3843 юридически лица. 79 са с прекратена дейност. Открих също 39 фирми, които имат цялостна или частична собственост друго юридическо лице, което е регистрирано като вероизповедание. Доколкото в данните на търговския регистър по принцип няма данни за собственост, може да използваме събраният така списък с ЕИК за следващите стъпки.
Всичко това би следвало да е налично заедно с много друга информация на страницата на Софийски градски съд. Или аз не мога да го намеря, или наистина не е публичен както е изискването по закон. Това означава, че трябва да минаваме през Търговския регистър, както аз направих или да искаме информацията по ЗДОИ, от което чакам отговор от тях. Тази публичност е несъмнено важна за обществото. Така например разбрах, че преди 17 години собствениците на Артекс са участвали в основаването на строителна фирма в Габрово заедно с евангелистична църква.
Кадастър
Тук получаваме информация по няколко направления. В отворените данни на кадастъра намираме списък със собствеността на имотите. Коментирах вече проблемите с точността на тези данни. Знаем най-малкото, че вероятно не са актуални заради спецификите на вписването и липсата на свързаност между държавните регистри. Взимайки списъка с ЕИК номера, за които знаем, че са на вероизповедания, получаваме списък с имоти, за които кадастъра знае, че са тяхна собственост. Проблемът тук е, че за доста записи в кадастъра ЕИК номерата са объркани или са случайни, особено когато става дума за актове от преди повече от 20 години.
Отделно, в описанието на всеки имот има информация за вид собственост и тям е отбелязано когато е на „частна религиозна организация“. Може да използваме това категоризиране, за да съберем още имоти, които по една или друга причина не са намерени директно през ЕИК. Тук е важно да се повтори, че така получаваме информация не само за поземлени имоти, но и за сгради, магазини, офиси и жилища. Също така получаваме известната на кадастъра собственост за всякакви лица – не само търсените.
На последно място, взимам имотите отбелязани, че са на частни религиозни организации в кадастъра, взимам имената на юридически лица, за които кадастъра знае, че са собственици на имота. Изчистих тези, които видимо не са религиозни организации, а съсобственици или имат някакви други взаимоотношения. След това намерих всички имоти, които са собственост на фирми с точно тези имена. Правя това, защото както споменах има грешки с ЕИК номерата в кадастъра. Има обаче и грешки в изписването на името и това е просто защото се подава грешна информация. Този подход ми позволи да намеря още няколко стотин, за които нито има данни в имотния регистър, нито самия кадастър беше отбелязал че е на религиозна организация.
Един голям проблем тук е, че много села не са въведени в кадастъра. Стотици църкви в тези села не намират място на картата ми, тъй като просто не съществуват в кадастъра. Липсата на кадастриален идентификатор значи, че е практически невъзможно да бъдат намерени в имотния регистър дори да има информация за собственостт там.
Храмовете
Както споменах по-горе, не използвах този източник за търсене на имоти. Първо, координатите в регистъра или липсват, или са грешни за много от храмовете. Второ, това, че църква е в парк, не значи, че поземленият имот е на църквата. Възможно да е само сградата. Това обаче изисква да имам точни координати, за да открия полигоните на обекта. Все пак, добавих всички известни храмове на картата, за да може да съпоставяте информацията събирана от Министерски съвет, имотите и какво виждате на място.
Това, което получих от този регистър обаче е списъка вероизповеданията. Намира се във файл с номенклатурите. Впрочем сайта на дирекцията беше паднал за две седмици, но използвах архивно копие, което пазя. Този списък не може да замести регистъра задължение на СГС, тъй като липсват много детайли.
Представяне на данните
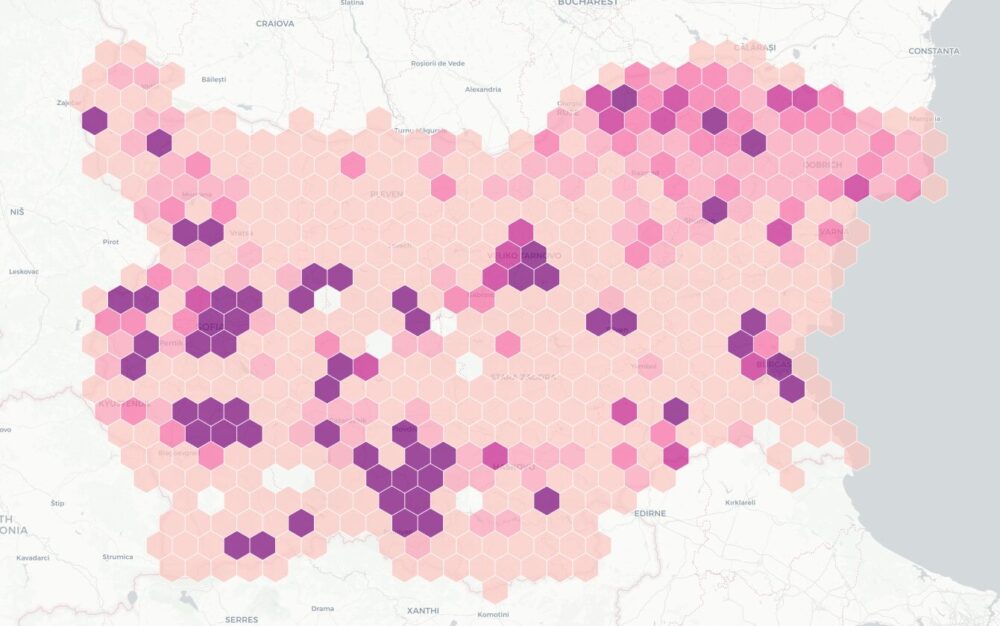
Комбинирайки цялата тази информация създадох карта на имотите на всички вероизповедания в България. За да е по-прегледна при разглеждайки големи площи като области или цялата страна, показвам в началото с шестограми къде има най-много такава собственост. При увеличение на ниво град вече се виждат отделните поземлени имоти. Колкото по-тъмен е цветът на шестограмите или имотите, толкова повече територия е на религиозни организации в първия случай или толкова по-надеждна е информацията. Например, справка в имотния регистър е по-надеждно от косвените данни в кадастъра.
Когато натиснете на някой поземлен имот ще видите данни за него, както и каква информация за какви обекти в него или самия него съм намерил. Понякога има еднакви записи както от имотния регистър, така и в кадастъра, защото съм засякъл, че юридическото лице е по КИД 94.91.
Горе вляво има бутон за добавяне на всички известни храмове на картата. Работи само когато се увеличили на ниво град и виждате отделни парцели. Ако натиснете някой маркер ще видите името и вида на църквата или джамията или каквото е, името на вероизповеданието и съобщеното ѝ състояние. С другия бутон над него може да смените на сателитни снимки на мястото.
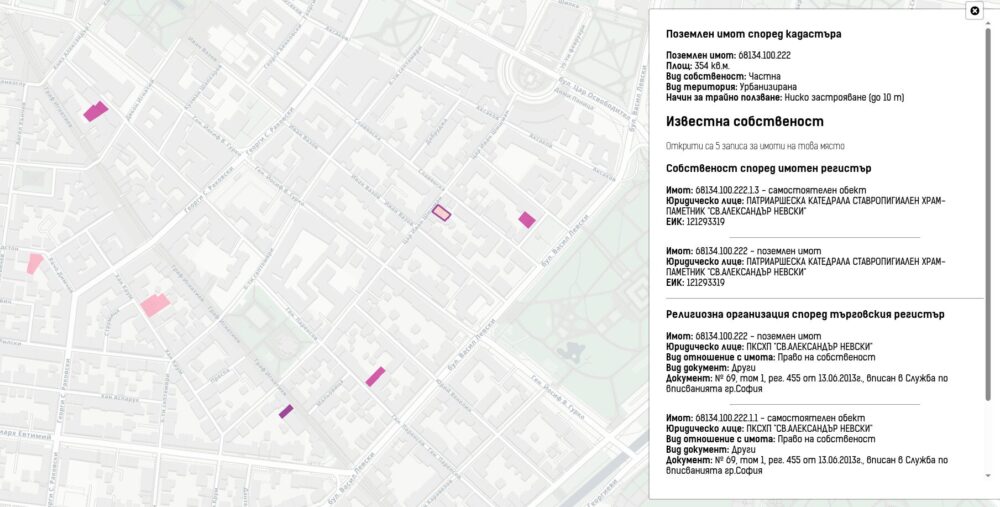
Така от картата виждаме няколко интересни неща. Първо, тук виждаме набралата известност сграда по Шишман отчасти собственост на настоятелството на Ал. Невски. За това разбираме както от имотния регистър, така и от проверка в данните на кадастъра след справка в търговския регистър за ЕИК. В съседство виждаме обаче апартамент собственост на църква, цяла сграда собственост на софийската митрополия, още един парцел със сграда собственост на друга църква, 18 апартамента възстановени от нотариален акт от 1981 на синода и още два парцела и обекти на евангелистична църква.
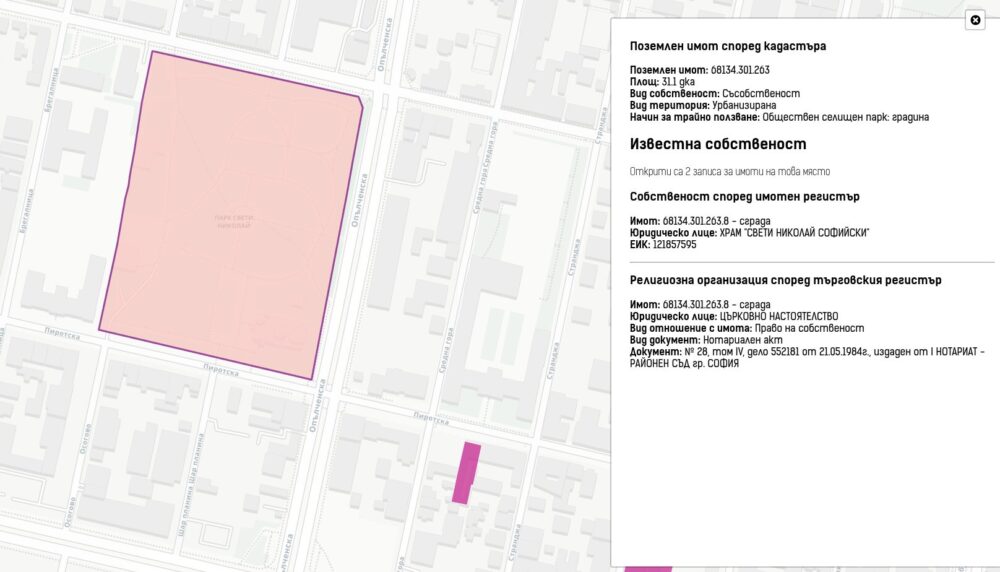
На тази снимка е илюстрирано това, което описах в методологията. На картата ще видите отбелязан цял парк – в случая този на ул. Опълченска в София, а в детайлите се вижда, че има собственост само на един обект – в случая църква.
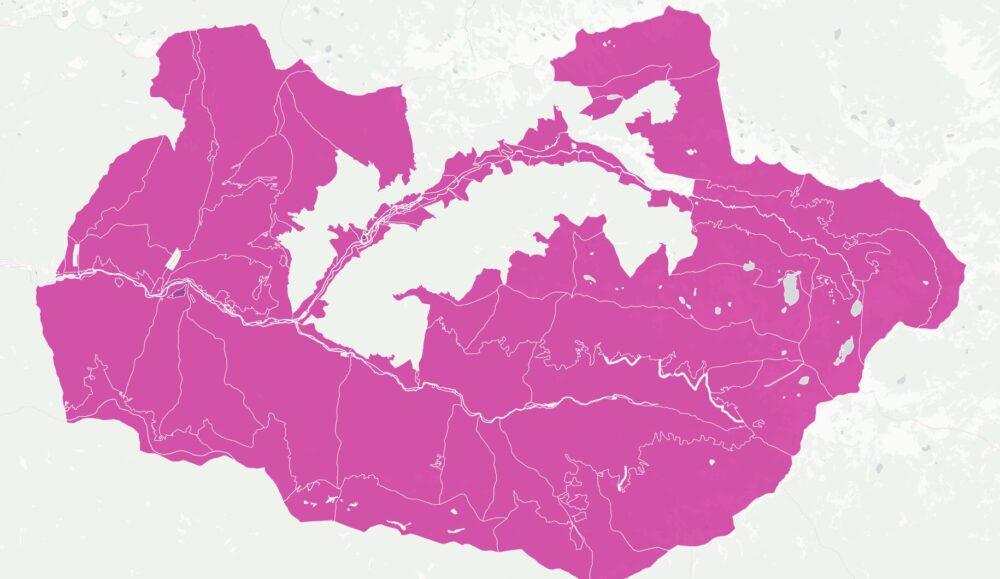
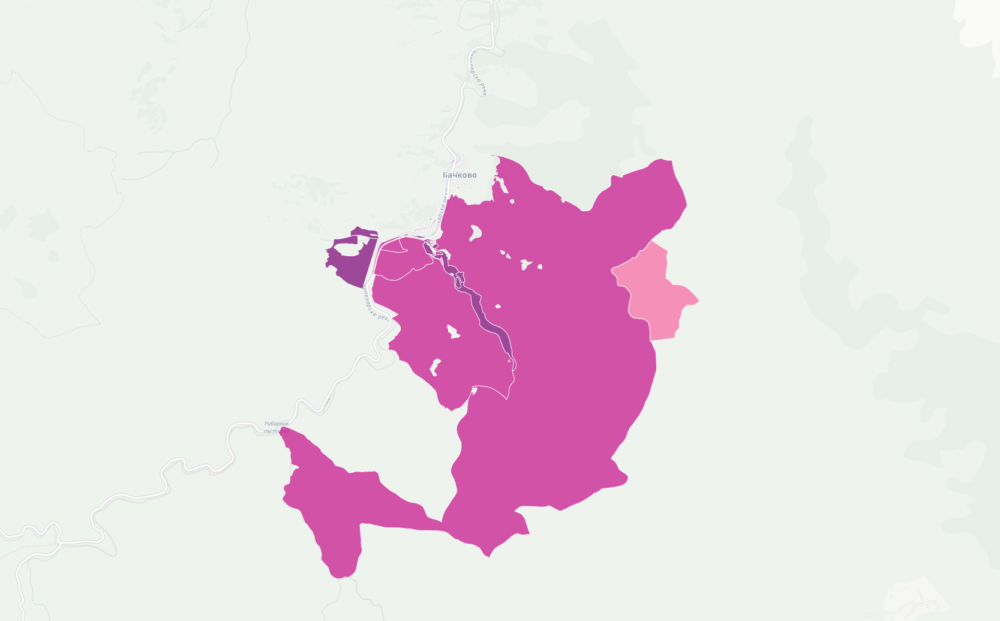
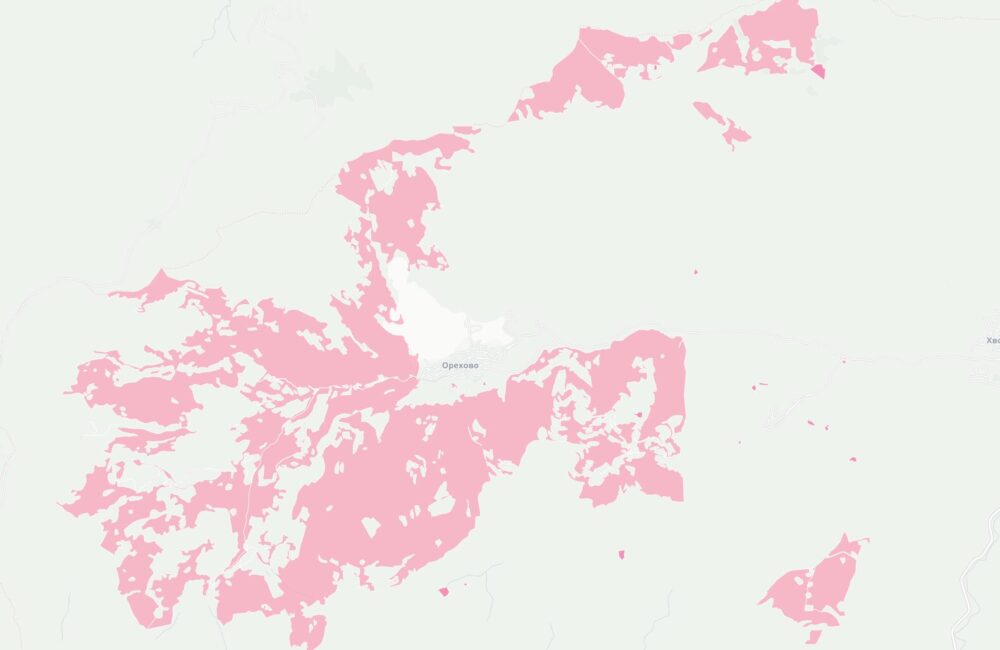
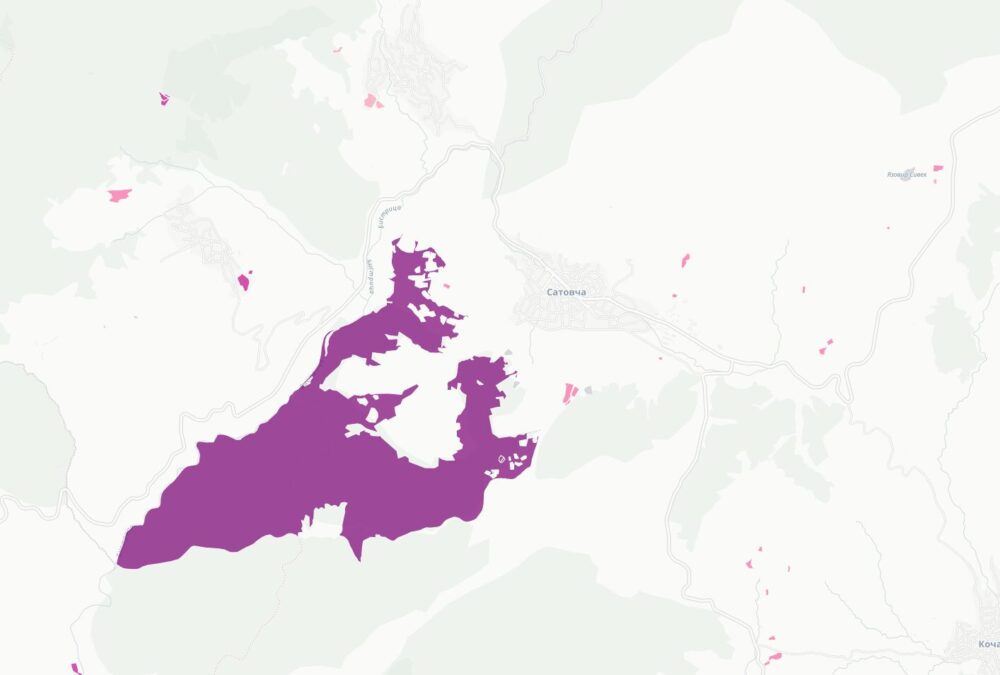
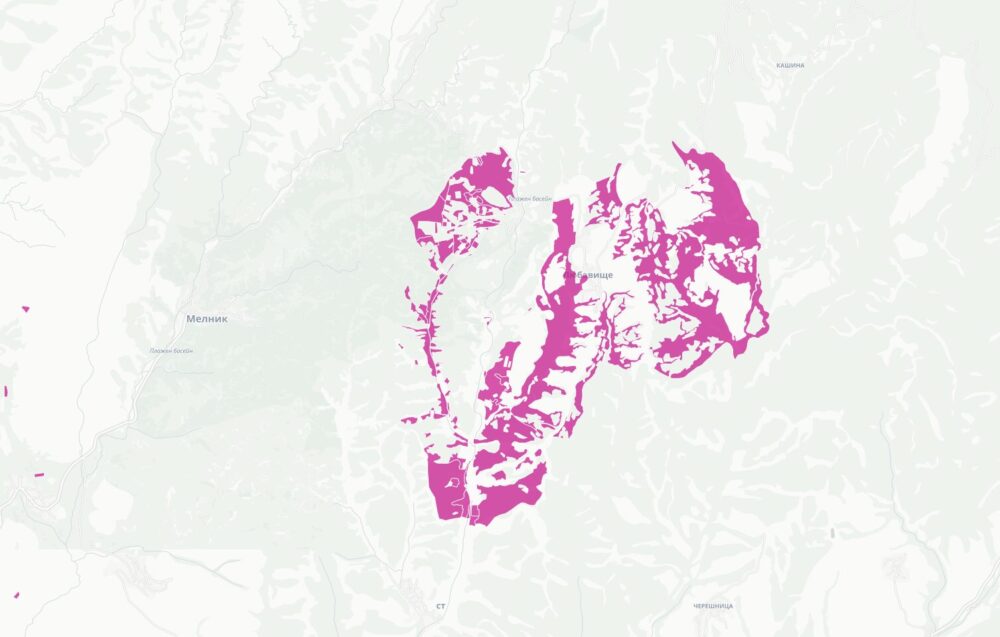
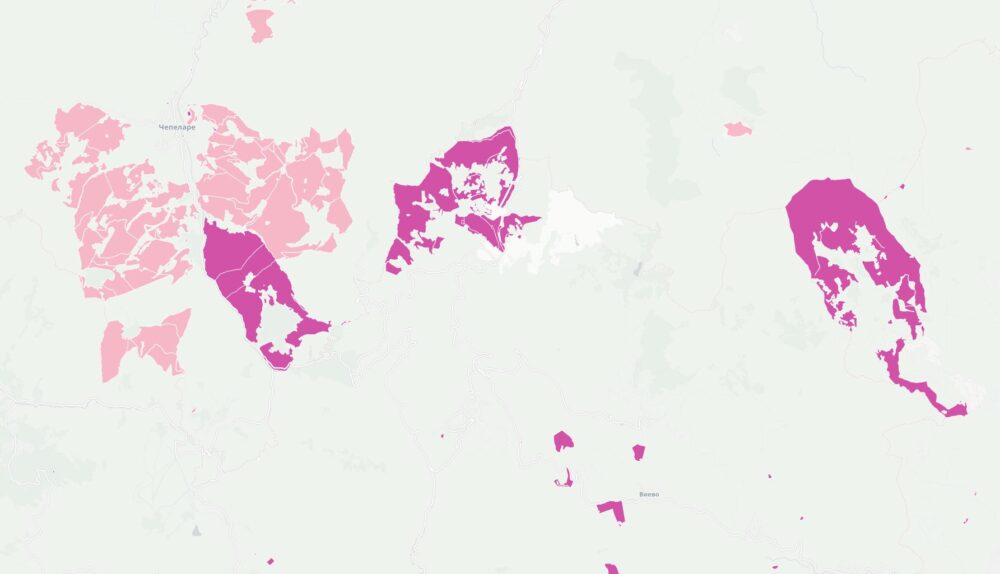
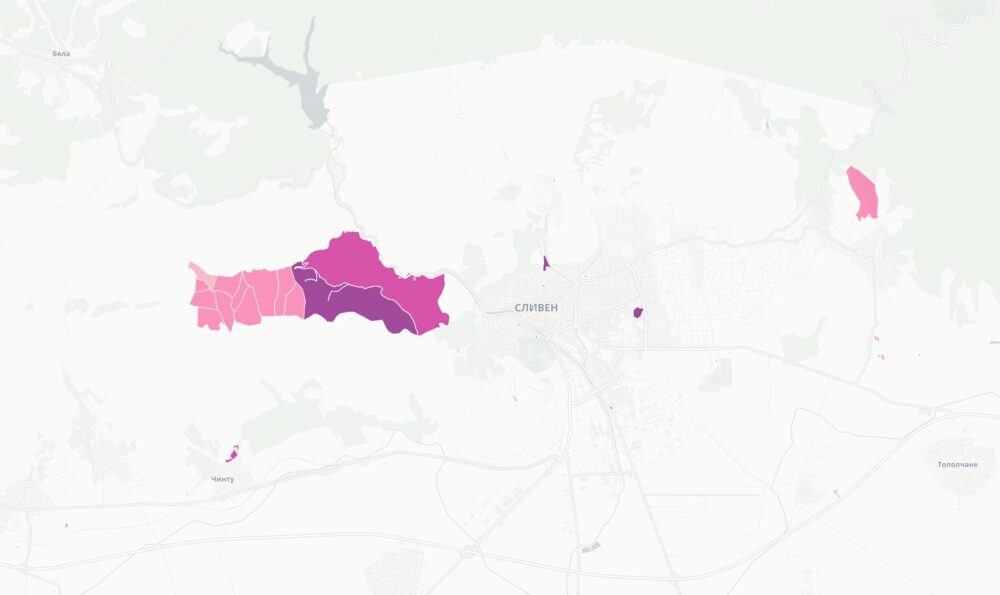
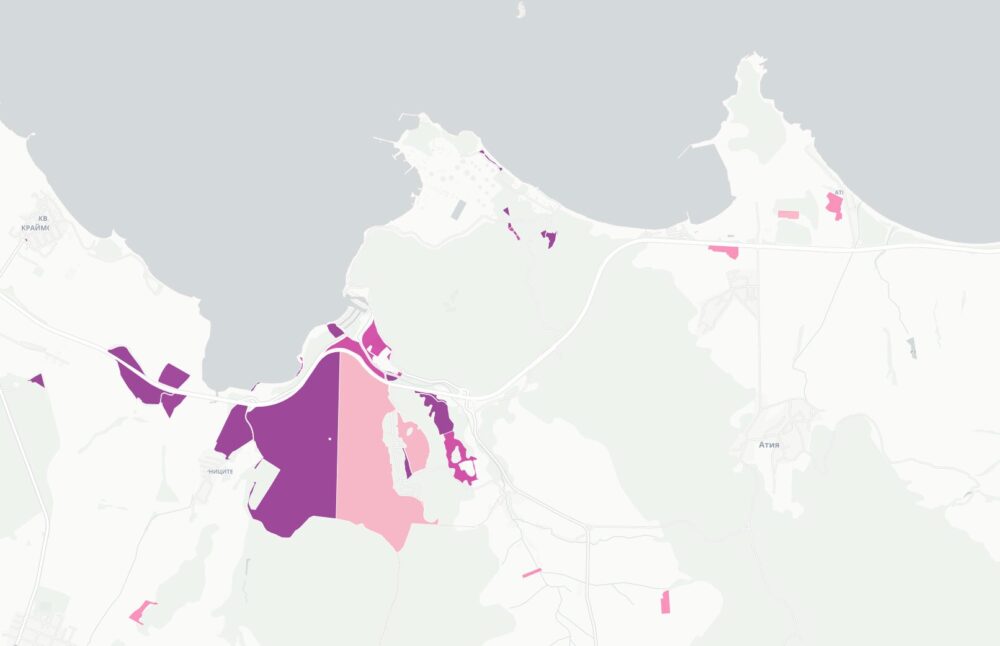
Виждаме и доста големи масиви из България. Голяма част от Рила, заради която започнах всичко това, както и земите около Бачково, Орехово, Сатовча, Мелник, Чепеларе, Сливен и Бургас. Има още много други из страната, но тези ми направиха най-голямо впечатление.
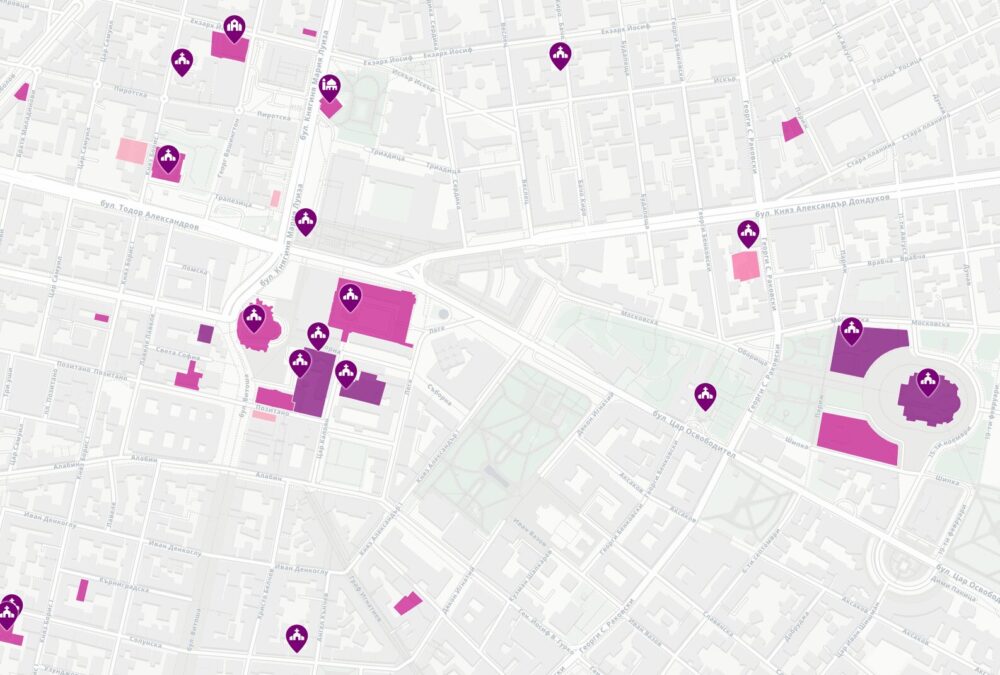
На следващата снимка виждаме индикация защо за още много имоти нямаме данни. Това е центъра на София. Виждаме Невски и Св. София вдясно и джамията и снагогата горе вляво. Виждат се обаче няколко православни църки, които не са отбелязани, включително Св. Петка и руската църква. Виждат се два молитвени домове на евангелисти и адвентисти, за които не намирам данни за собственост никъде. За сметка на това виждаме премного апартаменти и офиси пръснати из града и собственост на вероизповедания.
Липса на прозрачност
Целта на тази карта, както и всички останали, които съм правил, е да разберем по-добре какво е положението. Даряват се стотици милиони в публични средства, имоти и преки дарения към вероизповеданията. Това е добре и така следва да бъде. Дали следва да се дават публични средства и имоти и какъв да е механизма е въпрос на дебат, който изглежда не сме говори да проведем. Има доста противоречиви данни за това колко религиозни са българите и какво разбираме под религиозност. Преди девет години писах за това с импровизирано изследване. Изглежда БПЦ специално се притесняват да се отвори такъв дебат, за да не се окаже, че ще пресъхнат субсидиите и даренията, тъй като за разлика от немците много малко българи биха искали да им се взимат 8-9% от заплата и да се дават на местния свещеник.
От другата страна притеснения будят действията на редица вероизповедания и особено БПЦ с безотчетната си дейност. Доколкото следва да декларират печалби от наеми и търговия и да плащат данъци за тях, журналистически разследвания показват, че това практически не се случва. Имотите имат огромна роля в това и съществуват съмнения, че са инструмент за пране на тъмни капитали. На този фон постоянно се въртят каси и кампании за дарения за ремонт и строеж на църкви, които после заедно с общински имоти да бъдат прехвърляни синода. Имоти, които са били паркове и градинки, а биха могли да бъдат градини и училища.
Липсата на прозрачност кои юридически лица могат да си спестяват данъци и да остават необезпокоявани от регулаторите е повече от притеснителна. Затвореният с цел приход за хазната имотен регистър освен, че не позволява да разкрием измеренията на проблемите и вероятно злоупотребите в Агенцията по вписванията, пречи да видим кои имоти се управляват от тези лица. Вместо да се отвори повече, имотният регистър беше наскоро още повече ограничен със зле прикритата цел да попречи именно на журналистически разследвания.
Фасадна вяра
В този контекст всички вопли специално на БПЦ срещу Sofia Pride, срещу конвенцията на Съвета на Европа за превенция и борба с насилието над жени и домашното насилие в комбина на съветниците на Радев, срещу светското образование чрез въвеждането на ефективно вероучение – всички тези са изглежда са само шум за отклонение на вниманието от същинската дейност на синода – да е най-голямата агенция за недвижими имоти в България.
Не виждам никакви сигнали от патриарха нещо от това, от ролексите и скъпите коли да се промени. Не виждам инициативи от тях за подпомагане на болни, гладни, уязвими, зависими, на строежа на градини и училища. Не виждам каквото и да е усилие от няколкото традиционни за държавата изповедания да дадат отпор на външни капитали финансиращи откровени секти експлоатиращи уязвими групи в обществото ни. Не виждам усилия, визия или дори интерес у висшия клир за връщане на доверието у вярващите в искреността на каквото и да е излизащо от устата на митрополитите.
А това доверие е крайно важно. Има хора, които имат нужда от вяра и някаква форма на организирана религия. В това няма нищо лошо. Липсата на доверие и деструктивната роля, която БПЦ специално има за правата, образованието и дори здравето на хората неизменно кара много да търсят тази вяра в първият, която им обърне повече внимание. За съжаление, нашумяха случаи, а и доста от нас имат познати, за които това не е свършвало въобще добре. Това в допълнение на опитите за политическо и социално влияние.
С действията и отказа си от основната си мисия БПЦ като най-масовата у нас религия има косвена вина за всичко това. Щом настояват да се занимават предимно с имотите си, значи следва и ние да се вгледаме повече в тях.
Introduction: The journey of documentation at Grab
In early 2021, Grab adopted a Docs-as-Code approach to address gaps in our technical documentation processes, as illustrated in our blog post Embracing a Docs-as-Code. Inspired by the practices of other market leaders, we integrated documentation into our engineers’ workflows, making it part of the codebase.
This approach addressed our initial documentation challenges by creating a single source of truth for engineers to search and build knowledge, making documentation upkeep necessary and less of an afterthought. After four years of use, we transitioned to a centralized documentation repository. This change was not about abandoning Docs-as-Code but adapting it to meet new and growing organizational needs.
This post walks through the motivations, benefits, and lessons from each phase of this journey, showing how our documentation strategy evolved.
What is Docs-as-Code?
Docs-as-Code is an approach that manages documentation with the same tools and workflows engineers use for source code. Content is written in plain-text Markdown, which is easy to edit in any code editor. Markdown is a lightweight markup language that uses simple, readable symbols like # for headings and * for lists to format text, and can be rendered to HTML and other outputs. It lives in version-controlled repositories (e.g., GitLab), so documentation evolves alongside code. Updates go through the same merge request reviews and automated CI/CD checks.
This integrated model lets teams at Grab build, test, and publish documentation as part of a pipeline. We then surface it through a centralized internal developer portal for easier discovery and implement governance for quality assurance.
Ideal use case at Grab
Imagine an engineer responsible for maintaining documentation for a product or platform managed by their team. This engineer creates comprehensive documentation in Markdown, containing pages such as an overview, a getting-started guide, how-tos, troubleshooting, FAQs, and related references for a specific platform. The documentation is included in the merge request and published on the documentation portal immediately after the code is merged. This seamless integration fosters a sense of ownership over the documentation. However, while this scenario is ideal, implementing it in practice presents significant challenges.
Problems we solved with Docs-as-Code
Before adopting a Docs-as-Code model, documentation was often scattered across Google Docs, slide decks, wikis, and ad hoc text files, which led to version confusion, poor discoverability, and gaps in quality assurance. Centralizing documentation in version-controlled repositories next to the code creates a single source of truth, ties updates to the same pull/merge request reviews, and enables automated checks such as link validation, style linting, and preview builds.
Industry practice reflects this shift: Kubernetes maintains its documentation as Markdown on the Kubernetes website, uses GitHub as a repository, and builds the site with Hugo, encouraging doc updates alongside feature work.
When documentation is embedded with the code and flows through the same CI/CD pipeline, engineers are more likely to update it in tandem with code changes. This method keeps the content up to date and in sync with releases by default. The TechDocs team can also set standardized metrics to uphold quality across all documentation and implement quality gates and blockers to ensure each document meets quality standards.
The limits of decentralized repositories
As Grab’s engineering footprint expanded, our decentralized Docs-as-Code approach began to strain at scale, surfacing friction that made documentation harder to discover, maintain, and ship with confidence.
Fragmented user experience and uneven standards
When documentation is scattered across many repositories and managed independently by teams, information architecture, voice, terminology, and granularity diverge. Similar concepts end up with different names, pages follow inconsistent navigation and templates, and redundant or misaligned guidance proliferates.
Ultimately, the search experience becomes noisy and unreliable as multiple versions of “the truth” surface. The impact shows up as longer onboarding, more tech support escalations, slower incident response when runbooks differ by team, and eroding trust that eventually pushes people toward tribal knowledge.
For the TechDocs team, decentralization made it hard to enforce standard templates, formatting, and quality gates. With documentation spread across many repositories, each with different or no linters, CI setups, and conventions, running organization-wide automation (linters, link checkers, readability checks) or applying uniform review steps was unreliable. This resulted in limited oversight and persistent inconsistencies, which degraded the user experience and trust in the documentation.
Difficulty keeping pace and staying discoverable
A fast-moving platform means decentralized documentation ages quickly and becomes hard to find. Frequent infrastructure and framework releases introduce breaking changes and deprecations. Teams struggled to stay informed, leading to missed opportunities for optimization and potential security risks due to outdated practices.
Meanwhile, with content sprawled across many repositories, managing and tracking the content became increasingly challenging for the team overseeing TechDocs. When teams changed the location of their source repositories, they often failed to notify the managing team, making it difficult to keep track of newer and updated locations. This lack of coordination created significant hurdles in discovering relevant documentation and maintaining a centralized record, ultimately impacting productivity and delaying decision-making.
Why we transitioned to a centralized repository
A centralized repository allowed us to address these scaling challenges while keeping the benefits of Docs-as-Code:
AI-driven enhancements
We are no longer writing only for human engineers. As we integrate more AI tools into our developer experience, our documentation also serves as the knowledge base for internal agents. A centralized, Markdown-based format gives agents clean, readable content in one location, which supports better integration, faster comprehension, and more accurate responses.
Improved quality assurance
Centralizing our documentation enabled the managing team to run automated linters for quality checks across all content. This helped ensure consistent standards, reducing manual oversight and minimizing the risk of errors. Contributors were also required to use the appropriate template for each document type, ensuring a consistent structure by default.
Unified search experience
The unified search experience changes how engineers access information. They can search for any topic and find relevant documentation without navigating multiple repositories. A global search overlay combines two methods: fuzzy page-title search for quick navigation and Glean-powered search across all TechDocs content. Glean is an enterprise search and AI assistant platform that integrates with internal tools to help users find and use information more efficiently. This search capability saves time and helps engineers stay informed.
Streamlined contribution process
While the decentralized model allowed engineers to use the GitLab web IDE, local editors, and GitLab CLI commands for faster updates, the transition to a centralized system helped streamline this process by offering a consistent editing environment. Even with these advanced tools, the centralized repository provided a unified location for all documentation, reducing the need to navigate across multiple repositories.
Centralization also gives the TechDocs team clearer visibility into documentation behavior and health. After implementing a centralized repository, the team extracted statistics on user activity: a new update is merged roughly every 50 minutes, with roughly 27 commits per day, and approximately 63% of changes being small to medium improvements. These signals point to ongoing documentation maintenance, with frequent touch-ups that fix typos, clarify steps, and keep guidance current rather than sporadic bulk updates. The image below illustrates how Grabbers use the centralized repository in practice.
Reflecting on the evolution
The transition was not without its hurdles. To bridge the gap left by decentralized Docs-as-Code workflows, we implemented:
Automated syncs: We synchronized critical content from service and platform repositories into a central hub to prevent gaps, while keeping the overlap period short to avoid two sources of truth and missed updates as legacy repos were retired.
Training sessions: We ran hands-on workshops to help engineers navigate the new platform and understand its benefits.
Continuous feedback: We set up surveys and regular check-ins to refine tooling and processes based on real-world usage.
Conclusion: choosing what works for your context
Docs-as-Code with decentralized and centralized repositories are not mutually exclusive; they excel in different contexts and can be combined. Decentralized authoring works well when engineers are the primary contributors and documentation naturally ships with code. Centralization becomes valuable when you optimize for organization-wide discoverability, consistency, governance, and analytics. We conclude with these findings from our shift to a centralized Docs-as-Code repository:
Use decentralized Docs-as-Code when teams need autonomy and documentation is tightly coupled to services.
Use a centralized repository when you need a single source of truth for discovery, standardized templates and style, consistent CI checks, ownership metadata, and clearer compliance and review gates.
Consider a hybrid approach: authors create documentation in service repos and publish to a central portal with shared templates, ownership metadata, automated quality checks, and centralized discovery and governance.
At Grab, decentralized Docs-as-Code fostered strong ownership early on. As we scaled and our audience broadened, a centralized repository and unified discovery surface became essential to maintain consistency, improve findability, and support diverse user needs. Documentation strategies evolve with the organization. The goal is not picking one model forever, but recognizing the signals to pivot and adapting so engineers can reliably find the right information at the right time.
Join us
Grab is Southeast Asia’s leading superapp, serving over 900 cities across eight countries (Cambodia, Indonesia, Malaysia, Myanmar, the Philippines, Singapore, Thailand, and Vietnam). Through a single platform, millions of users access mobility, delivery, and digital financial services, including ride-hailing, food delivery, payments, lending, and digital banking via GXS Bank and GXBank. Founded in 2012, Grab’s mission is to drive Southeast Asia forward by creating economic empowerment for everyone while delivering sustainable financial performance and positive social impact.
Powered by technology and driven by heart, our mission is to drive Southeast Asia forward by creating economic empowerment for everyone. If this mission speaks to you, join our team today!
AWS Network Firewall now supports native attachment to AWS Transit Gateway. Customers commonly use Transit Gateway to route traffic from Amazon Virtual Private Cloud (Amazon VPC) networks to a centralized inspection VPC (a VPC dedicated to hosting firewall endpoints for traffic inspection) where their network firewall endpoints are deployed. This centralized deployment model reduces the need to have Network Firewall endpoints in each VPC, optimizing costs and providing a centralized point of network security control.
Customers deploying Network Firewall in a centralized deployment model using Transit Gateway have traditionally set up a dedicated inspection VPC with firewall subnets and managed the associated routing to direct traffic through the firewall. With native attachment, Network Firewall attaches directly to Transit Gateway, eliminating the need for the inspection VPC and enabling capabilities such as flexible cost allocation through Transit Gateway metering policies.
In this post, we explain what a Transit Gateway-attached network firewall is, the technical capabilities it unlocks, reasons to migrate to it, and how to perform the migration. For detailed step-by-step guidance on how to perform the migration using Terraform, AWS CloudFormation, or manually in the AWS Management Console, see the accompanying migration guide repository.
What is a Transit Gateway-attached network firewall?
A Transit Gateway-attached network firewall simplifies your network architecture by eliminating the need for a dedicated inspection VPC. Instead of creating an inspection VPC with firewall subnets and configuring the associated routing, you create your network firewall and specify which Transit Gateway instance you want to attach it to. AWS deploys the firewall endpoints into an AWS-managed VPC on your behalf. You don’t own or manage that VPC. From your perspective, the firewall appears as a Transit Gateway network function attachment that you route traffic to, similar to other Transit Gateway attachments.
Why migrate to a Transit Gateway-attached network firewall?
You might want to migrate to a Transit Gateway-attached network firewall for the following reasons:
Access to flexible cost allocation: With native attachment, you can use Transit Gateway metering policies to charge back account owners for traffic they send through the centralized firewall. Flexible cost allocation for Network Firewall traffic over a Transit Gateway is only available with a Transit Gateway-attached firewall. Without native attachment, you can only allocate Transit Gateway data processing charges, not the Network Firewall charges.
Reduced architectural complexity: You can eliminate the inspection VPC, leaving one less VPC to manage along with its associated routing tables and subnets.
Preparing for the change
Before migrating to a Transit Gateway-attached network firewall, gather the following information and keep these key considerations in mind.
Prerequisites
When you create your new Transit Gateway-attached network firewall, you will need:
Transit Gateway ID: The ID of the Transit Gateway instance you will attach your network firewall to.
Logging configuration: Create a new logging configuration (such as new Amazon CloudWatch log groups) for the new firewall. During migration, you will be running both firewalls simultaneously. Keeping the logs separate simplifies monitoring and troubleshooting each firewall during the migration period. After migration is complete, you can point the new firewall to your existing logging destinations.
Firewall policy: Create a new firewall policy for the new firewall rather than reusing your existing one. During the migration period, a separate policy lets you make changes to the new firewall’s policy without affecting the existing firewall while both are running simultaneously. After migration is complete, you can attach your existing production policy to the new firewall.
Key considerations
There are some important considerations to address while planning for this change.
Transit Gateway encryption: Check if you’re using Transit Gateway encryption support. If encryption is enabled and required for your security posture, native attachment to Network Firewall doesn’t currently support this capability. You will need to continue using your current firewall configuration.
NAT gateway Elastic IPs: If you need to maintain the same public IPs (for example, for partner allowlisting), plan for this during migration. For more information, see the Preserving your NAT gateway Elastic IPs during migration section later in this post.
Maintenance window: Plan to perform this migration during a dedicated maintenance window. Brief network outages will occur during parts of the process, such as when swapping Transit Gateway route table associations and replacing NAT gateways.
Performing the migration
Leave your existing Network Firewall setup unchanged while setting up the new Transit Gateway-attached firewall. With this approach, you can minimize potential downtime and test the new configuration before migrating production traffic.
The migration process varies depending on your current architecture. The following sections walk through the two most common centralized Network Firewall architectures and the high-level migration process for each. For detailed step-by-step guidance on how to perform the migration using Terraform, CloudFormation, or manually in the console, see the migration guide repository.
Architecture 1: Dedicated inspection VPC with separate egress VPC
In this architecture, shown in the following diagram, you have a dedicated inspection VPC with your network firewall endpoints, and a separate dedicated egress VPC with your NAT gateways.
Figure 1: Centralized egress traffic inspection with Network Firewall and Transit Gateway, with inspection and egress separated into two VPCs.
The high-level migration process for this architecture is:
Deploy a new egress VPC with a temporary NAT gateway. Creating a new VPC lets you leave the existing deployment unchanged while working on the migration.
Create your new network firewall with native attachment to your Transit Gateway.
Configure three new Transit Gateway route tables to define the traffic path through the new firewall: an inspection route table (associated with the new firewall), an egress route table (associated with the new egress VPC), and a temporary migrated spoke route table (for testing individual spoke VPCs on the new path).
Test the new firewall by moving a single spoke VPC to the new path. Verify connectivity and confirm the firewall is inspecting traffic by checking the alert logs for layer 7 (application layer) details. Layer 7 information in the alert logs indicates the firewall is seeing both directions of the traffic flow. If asymmetric routing were occurring, the firewall would only see one direction and would not be able to perform application-layer inspection, so the presence of layer 7 details confirms traffic is flowing symmetrically through the new firewall.
Migrate the remaining spoke VPCs. You can migrate VPCs incrementally, or when you’re confident in the new firewall deployment, update the default route in your existing spoke route table to point to the new Network Firewall network function attachment, which moves all remaining spokes that share that route table at once.
Figure 2: Post-migration architecture for Architecture 1, with the inspection VPC eliminated and traffic flowing through the Transit Gateway-attached Network Firewall to a dedicated egress VPC.
For the complete walkthrough of how to perform this migration:
Architecture 2: Combined inspection and egress VPC
In this architecture, shown in the following diagram, you have a single VPC that contains both your network firewall endpoints and your NAT gateways.
Figure 3: Centralized egress traffic inspection with Network Firewall and Transit Gateway, with inspection and egress combined in one VPC.
The migration process for this architecture follows the same high-level steps as Architecture 1.
Deploy a new dedicated egress VPC with a temporary NAT gateway. Creating a new VPC lets you leave the existing deployment unchanged while working on the migration.
Create your new network firewall with native attachment to your Transit Gateway.
Configure three new Transit Gateway route tables to define the traffic path through the new firewall: an inspection route table, an egress route table, and a temporary migrated spoke route table.
Test the new firewall by moving a single spoke VPC to the new path. Verify connectivity and confirm the firewall is inspecting traffic by checking the alert logs for layer 7 (application layer) details. Layer 7 information in the alert logs indicates the firewall is seeing both directions of the traffic flow. If asymmetric routing were occurring, the firewall would only see one direction and would not be able to perform application-layer inspection, so the presence of layer 7 details confirms traffic is flowing symmetrically through the new firewall.
Migrate the remaining spoke VPCs. You can migrate VPCs incrementally, or once you are confident in the new firewall deployment, update the default route in your existing spoke route table to point to the new Network Firewall network function attachment, which moves all remaining spokes that share that route table at once.
Optionally, preserve your original NAT gateway Elastic IPs by transferring them to the new egress VPC.
Decommission the old combined VPC after you’ve verified that traffic is flowing correctly.
Figure 4: Post-migration architecture for Architecture 2, with the combined VPC eliminated and traffic flowing through the Transit Gateway-attached Network Firewall to a dedicated egress VPC.
For the complete walkthrough of how to perform this migration, see:
Both architectures deploy the same new resources and use the same phased cutover approach. The differences are in the starting Transit Gateway routing structure (Architecture 1 has three route tables across two VPCs, Architecture 2 has two route tables in one VPC) and what you clean up at the end (two old VPCs instead of one). Both architectures converge to the same end state. For a detailed comparison, see the migration guide repository.
Minimizing downtime and testing your migration
Regardless of which architecture you’re migrating from, follow these best practices to minimize risk.
The migration guide repository includes starting architecture CloudFormation and Terraform templates for both architectures, so you can deploy the exact starting environment in a development or test account and run through the entire migration process before touching production.
Test before you migrate. Create your new Transit Gateway-attached firewall in parallel with your existing setup. Use a test VPC to validate the new configuration. Verify that logging is working correctly and that the firewall alert logs show layer 7 traffic details, which confirms there is no asymmetric routing. Test both allowed and blocked traffic scenarios before migrating production traffic.
Migrate in phases. Start with a single, non-critical workload VPC. Update only that VPC’s routes to use the new firewall attachment. Monitor and verify application behavior and performance with the application owner before proceeding. When planning your migration order, migrate spoke VPCs that have east-west traffic between each other at the same time. During the phased migration, spokes on different firewall paths will have their east-west traffic traverse two stateful firewalls. Because each stateful firewall independently tracks connection state, traffic that enters through one firewall and returns through another appears as untracked, causing the firewalls to drop or incorrectly handle the return traffic. When you’re confident in the new firewall deployment, you can update the default route in your existing spoke route table to point to the new firewall, which moves all remaining spokes that share that route table at once. Keep your old firewall configuration active until all traffic is migrated.
Prepare a rollback plan. Document your current route table configurations before making changes. Keep your existing firewall and inspection VPC active during migration. If issues arise, revert the route table changes to restore the previous configuration. Decommission old resources after you’ve verified applications are operating as expected.
Preserving your NAT gateway Elastic IPs during migration
An important consideration during migration is maintaining your existing NAT gateway Elastic IP addresses. Many organizations have these IPs allowlisted with external partners, third-party services, or in firewall rules. Changing these IPs would require coordination with multiple stakeholders and could disrupt business operations.
During migration, you need both your old and new deployments to operate simultaneously, so you can validate the new setup without impacting production traffic. This means creating temporary NAT gateways with temporary Elastic IPs in the new egress VPC.
After you’ve confirmed the new firewall deployment is stable and production traffic has been successfully migrated, you can restore your original Elastic IPs. The process differs depending on your architecture:
For Architecture 1 (separate inspection and egress VPCs), your existing egress VPC and its NAT gateways are independent of the inspection VPC being decommissioned. You can keep them by re-associating the existing egress VPC’s Transit Gateway attachment with the new egress route table and updating the inspection route table to route traffic there instead of the temporary egress VPC. This is a Transit Gateway routing change that takes seconds, doesn’t require deleting or creating any NAT gateways, and doesn’t increase in complexity with the number of Availability Zones. After the re-association, you delete the temporary egress VPC.
For Architecture 2 (combined inspection and egress VPC), the old VPC contains both the firewall endpoints and the NAT gateways. The simplest path is to decommission it and move the Elastic IPs to the new egress VPC. To do this, you delete the old NAT gateways to free the Elastic IPs, then create new NAT gateways in the new egress VPC with the original Elastic IPs. This requires a brief maintenance window while the new NAT gateways provision and must be repeated for each Availability Zone.
For the detailed step-by-step procedure, see the EIP preservation steps in the migration guide repository.
Conclusion
In this post, we explained what a Transit Gateway-attached network firewall is and how it differs from the traditional inspection VPC model, the reasons to migrate including reduced architectural complexity and flexible cost allocation, what to prepare before starting, and the high-level migration process for the two most common centralized inspection architectures. We also covered best practices for minimizing downtime, handling east-west traffic between spokes during phased migration, and preserving your existing NAT gateway Elastic IPs.
With a Transit Gateway-attached network firewall, AWS manages the firewall endpoints and the underlying VPC on your behalf, eliminating the inspection VPC from your architecture and enabling flexible cost allocation through Transit Gateway metering policies. The phased migration approach covered in this post lets you run both firewalls in parallel, validate the new path with a single spoke VPC, and cut over the rest of your traffic when you are ready.
For detailed step-by-step guidance using Terraform, CloudFormation, or the AWS Management Console for both architectures covered in this post, see the migration guide repository. The repository includes starting architecture templates so you can practice the full migration end-to-end in a test account before migrating your production environment.
If you have feedback about this post, submit comments in the Comments section below.
Version
1.96.0 of the Rust programming language has been released. Changes
include a new set of Copy-implementing Range types,
assertions with pattern matching, a number of stabilized APIs, and two
Cargo vulnerability fixes.
Today, we’re announcing the next generation of AWS Resilience Hub with a significantly expanded experience that brings together a new application model, dependency discovery assessment, generative AI-powered failure mode analysis, modular resilience policies, and organization-wide reporting.
Organizations running hundreds of applications share a common challenge: availability is a top concern, yet there is no consistent way to set resilience goals, measure progress, or prove compliance across a portfolio. Teams set different standards, use different tools, and struggle to exchange information about whether applications actually meet expectations.
The next generation of AWS Resilience Hub changes this by giving Site Reliability Engineers (SREs) and development teams a structured way to align on resilience policy expectations, help application teams achieve them, and demonstrate compliance through testing. With integration into AWS Organizations, teams can now evaluate resilience at scale, identify failure modes, discover hidden dependencies, and report on progress across the enterprise.
The next generation of Resilience Hub walks you through your resilience journey and to help you there are the following concepts built into it.
Resilience policy: You can define your resilience expectations through modular, composable requirements. Rather than choosing a single rigid policy type, you construct policies by selecting the requirements that matter to your application, such as service level objective (SLO), multi-AZ and multi-Region disaster recovery, and data recovery requirements.
Business-level understanding: You can use new application modeling through critical end-user paths that map directly to business outcomes. Systems represent a business application, user journeys describe critical business paths, and services are the deployable units comprising AWS resources, code, and observability. Resilience Hub automatically discovers and maps them into a topology showing how resources connect.
AI failure mode assessments: You can run generative AI-powered assessments that analyze your services against your defined resilience policies, AWS Well-Architected best practices, and the AWS Resilience Analysis Framework. These assessments identify potential failure modes and provide actionable recommendations.
Dependency discovery assessment: You can automatically discover AWS services, internal endpoints, and third-party endpoints that your services depend on. This dependency assessment uses DNS query log analysis to identify dependencies you may not know about—including unexpected cross-region calls or critical third-party dependencies.
The next generation of AWS Resilience Hub in action To get started, you configure a resilience policy, set up your first system and service, run a failure mode assessment, review the results, and implement the findings.
Before you begin, you should set up the invoker IAM role, which grants Resilience Hub read-only access to your AWS resources, cross-account roles (if not using AWS Organizations), or service-linked roles (SLRs) with AWS Organizations. Resilience Hub also integrates with AWS Organizations to enable organization-wide resilience management from a single delegated administrator account. This eliminates the need to log in to individual accounts to assess resilience posture across your enterprise. To learn more, visit For prerequisite details in the AWS Resilience Hub User Guide.
To configure a resilience policy, choose Create policy in the Policies menu through the AWS Resilience Hub console. Enter a policy name, description, and choose resilience requirements. For example, you can create a reusable policy for multi-Region disaster recovery used in financial applications—including 99.95% availability SLO, 15-minutes RTO, 5-minutes RPO for multi-Region disaster recovery, and disaster recovery approach that aligns with your RTO and RPO requirements.
If you choose data recovery requirements, you can define the data recovery time objective for restoring from backups for each service associated with this policy.
To create your first system representing your business application, choose Create a system in the Systems menu. Optionally, you can enable AWS Organizations account access for this system.
Now you can create a service that represents a deployable unit, like one of your microservices, and associate it with your system, and tell Resilience Hub where to find your resources. Enter a service name, for example, stock-exchange-service, choose your resilience policy and invoker AWS IAM role name. You can choose service Regions, service resources such as your resource tags, AWS CloudFormation stack, Terraform state file location, or Amazon EKS cluster and namespace.
When you enable dependency discovery for this service, AWS examines your VPC query logs for the VPCs associated with the resources in your service. You can disable this feature anytime from the dependency discovery settings in the service details page.
Now, you can run your first assessment with the service creation complete and a policy applied. Choose Run failure mode assessment in your service page and wait for the assessment to complete.
During the assessment, Resilience Hub assumes your invoker role, reads resources from your configured input sources, identifies parent-child relationships, queries the application topology service to map connections between resources, and builds a topology showing data flow, containment, and permissions.
By choosing Service topology, you can see service resources grouped by service functions in the graph, table, or JSON format.
By choosing Failure mode guidance, you can add assertions used to guide the agents while performing the failure mode assessment. Assertions are either generated by the agent or added by users. You can update them to improve assessment accuracy.
Once the assessment is complete, you can review findings and recommendations in the Assessment tab of your service page. Each finding tells you what the failure mode is, why it matters for your architecture, how to fix it, and which policy requirement it relates to.
You can choose Mark as resolved to implement the recommendation or Mark as irrelevant if the finding doesn’t apply to your use case.
If you’re an existing Resilience Hub customer, Resilience Hub provides migration APIs to simplify the transition of your previous applications. These APIs convert your previous assessment policies to new resilience policies, map your previous applications to the new model, such as multiple related applications to one system with multiple services.
Now available The next generation of AWS Resilience Hub is now generally available in AWS commercial Regions where Resilience Hub is available. For Regional availability and the future roadmap, visit the AWS Capabilities by Region.
Resilience Hub uses a new service-based pricing model. Pricing includes two failure mode assessments per month for services, and optionally automated dependency assessment. You can try AWS Resilience Hub free. For pricing details, visit the AWS Resilience Hub pricing page.
There’s a familiar tension in enterprise technology: buy a fully integrated platform or assemble a stack of best-of-breed components. The platform story is compelling: one vendor. One console. One contract. Everything bundled together.
The best-of-breed story is different. Best-of-breed optimizes each layer for performance, flexibility, and cost. Historically, platforms often won the narrative. But in periods of rapid change—like today’s AI era—modularity regains the advantage.
The platform gravity problem
Platforms can introduce operational gravity. When compute, storage, networking, analytics, governance, and AI tooling all live in one ecosystem, switching costs rise over time. What starts as convenience becomes constraint—and in AI, where tooling changes rapidly, that becomes expensive in both flexibility and economics. Industry leaders reflect this shift. CIOs are moving beyond a “cloud-first” mindset toward “cloud-smart” strategies and choosing the right environment for each workload instead of defaulting to one provider’s stack. This proactively avoids escalating costs and inflexible ecosystems. A recent CIO Dive trend report finds many IT leaders are gravitating toward purpose-built infrastructure optimized for specific workload demands—including AI—rather than broad commodity offerings.
Why modular infrastructure wins
AI pipelines evolve constantly: training datasets, checkpoints, GPU migrations, MLOps workflows and post-processing outputs are all subject to rapid changes to scale applications and extend model capabilities. Few organizations run all of that inside a single vendor environment or a single cloud ecosystem. Teams building differentiated systems optimize workflows and resources, not monoliths.
Modularity isn’t just about avoiding lock-in—it’s about real, measurable agility. Modular architectures allow organizations to adjust components independently as requirements change. CTOs are intentionally placing workloads where they perform best—cloud for global scale, on-prem or colocation for heavy AI training, and edge for low-latency inference—and treating each as part of a unified, purpose-driven infrastructure strategy.
This pattern holds true beyond just AI.
In cyber resilience, what matters when a ransomware event hits isn’t whether you bought every tool from one vendor; it’s the speed and predictability of recovery (which specialized, resilient storage does more to accelerate than bundled dashboards)
In cloud native application development, developers value predictable performance, clear pricing, and flexibility over being locked into a single ecosystem.
In media and entertainment, workflows often span regions, partners, and technologies—moving petabytes of creative content, generating AI media assets, and orchestrating distributed rendering jobs. A modular approach enables teams from all sides of the business (creative and technical) to optimize for performance without constraint.
These use cases share common themes: avoid lock-in, preserve optionality, control costs, and maintain performance predictability. These align with broader industry sentiment that hybrid and composable architectures deliver greater agility and resilience in the face of evolving requirements.
Depth over breadth: A focused infrastructure philosophy
When vendors expand aggressively into adjacent domains—analytics, governance, AI tooling—they risk breadth at the expense of depth. In fast-moving markets, “jack-of-all-trades” platforms often become “master-of-none.” Best-of-breed doesn’t mean disjointed; it means each layer is optimized for its purpose and integrated intelligently.
That’s the philosophy behind how we’ve evolved our own infrastructure. When Backblaze first launched our object storage service, we highlighted performance, transparency, and cost efficiency. As AI and high-throughput workloads accelerated, customers began using us as neutral infrastructure for staging, throughput, and data mobility between clouds. We leaned deeper into storage—high-throughput tiers, bandwidth guarantees, lifecycle tools—but intentionally stopped short of climbing higher up the application or analytics stack.
We draw a line at storage not because adjacent layers lack value, but because storage is foundational. AI differentiation, application logic, and workflow intelligence happen above the infrastructure layer. Customers need owned, interoperable workflows that can plug into any compute or AI platform without being co-opted by a monolithic ecosystem.
Modular infrastructure as a strategic backbone
Best-of-breed doesn’t mean fragmentation; it means focus with composability. The future of enterprise infrastructure isn’t about building the tallest platform—it’s about building the strongest foundation that supports innovation across many dimensions.
Across industries, infrastructure leaders are embracing workload placement strategies and hybrid models to optimize for cost, governance, and performance. In AI, this means hybrid cloud and on-prem strategies where appropriate; in traditional application and file storage, it means interoperable, resilient services; and in media workflows, it means performant pipelines unencumbered by monolithic stack limitations.
The companies that win in this era won’t be those who own every layer. They’ll be those who enable others to build faster, iterate often, and adapt without constraint.
Network administrators face a persistent challenge: maintaining domain blocklists and allowlists that keep pace with the internet. New websites and services emerge daily, and keeping these lists current requires constant manual updates that leave gaps in coverage. This challenge intensifies when managing access to rapidly evolving categories like AI services, where new tools launch on a regular basis.
AWS Network Firewall is a managed, stateful network firewall and intrusion detection and prevention service for fine-grained control of your virtual private cloud (VPC) network traffic. With URL and domain category filtering, security teams can use predefined categories to control access instead of managing individual domains. AWS-managed URL and domain categories stay current automatically as new domains are registered, removing the need for manual list maintenance.
This feature is especially useful for organizations navigating AI governance. Instead of manually tracking every new AI service, you can control access to the entire Artificial Intelligence and Machine Learning category while creating exceptions for approved services. The same approach works for social media, streaming sites, gambling, and dozens of other categories, all with built-in audit trails for compliance reporting.
In this post, we walk through URL and domain category filtering configurations for AWS Network Firewall, from basic rules to exception handling and monitoring strategies that give you visibility into how your workloads interact with external services.
Streamlined policy management with predefined categories
With URL and domain category filtering, you control website access using predefined categories instead of individually specifying sites in a domain list rule group. You can select from AWS-managed categories such as Social Networking, Gambling, or Artificial Intelligence and Machine Learning to implement and maintain filtering policies. AWS keeps these categories current automatically, so you don’t need to update firewall policies when new domains are registered.
Network Firewall offers two category filtering options. Domain category filters by domain name using the TLS Server Name Indication (SNI) field, with no decryption required. URL category filters by the full URL path, which requires TLS inspection for HTTPS traffic. To keep things straightforward, this post focuses on domain category filtering. To set up URL category filtering with TLS inspection, see Creating a TLS inspection configuration in Network Firewall.
Prerequisites
To follow the steps in this post, start by making sure that you have the following prerequisites in place:
An existing Network Firewall deployment: This walkthrough assumes you have an existing Network Firewall deployment to filter egress traffic flows from your Amazon Virtual Private Cloud (Amazon VPC) in place. If you aren’t already using Network Firewall, see Getting started with AWS Network Firewall to set up your firewall before proceeding.
The HOME_NET variable set correctly at the firewall policy level: The rules in this post use the $HOME_NET variable to scope traffic to your internal network. In the AWS Management Console for Amazon VPC, select your firewall policy under the Firewall policies tab, select the Details tab, and check the policy variables section under HOME_NET variable override values. We recommend setting this to all RFC 1918 private IP address ranges: 10.0.0.0/8, 172.16.0.0/12, and 192.168.0.0/16. When you set $HOME_NET at the policy level, all rule groups associated with that policy inherit the value automatically. Network Firewall automatically maps $EXTERNAL_NET to the inverse of $HOME_NET, so configuring HOME_NET correctly also configures $EXTERNAL_NET.
Figure 1: Firewall policy details tab showing the HOME_NET variable override values set to RFC 1918 private IP address ranges
Create a category rule using the console rule builder
To get started quickly, you can create a domain category rule using the console’s built-in rule builder. In this example, we create a single alert rule for the Artificial Intelligence and Machine Learning category.
In the left navigation, scroll to Network Firewall and select Rule groups.
Choose Create rule group.
For Rule group type, select Stateful rule group.
For Rule group format, select Standard stateful rules.
For Rule evaluation order, select Strict order. Choose Next.
Figure 2: Create Network Firewall rule group page showing Stateful rule group type, Standard stateful rules format, and Strict order evaluation selected
Enter Domain-Category-Rules for the Name, Domain Category Rules for the Description, and 50 for the Capacity. Choose Next.
In the rule group editor, select the Category Matching radio button.
Under Category Matching, select Match all selected categories.
Under AWS category type, select Domain Category from the dropdown.
Under Categories, select Artificial Intelligence and Machine Learning.
For Protocol, select TLS.
For Source, select Custom, then enter $HOME_NET in the dialog box.
Set the Destination IP to Any.
For Action, select Alert.
Choose Add rule to add this rule to the rule group. Choose Next.
Figure 3: Completed category matching rule showing TLS protocol, $HOME_NET source, Any destination, and Alert action added to the rule group
Under Customer managed key, leave the default setting (Customize encryption settings should remain unchecked).
Under Add tags – optional, leave the default setting of no tags.
Choose Next, then Create rule group.
This rule generates an alert log entry each time a connection matches a domain in the Artificial Intelligence and Machine Learning category. It doesn’t block traffic. To block traffic, change the action to Drop or Reject in step 15.
Creating the same rule using Suricata compatible rule strings
The following walkthrough creates the same alert rule you built with the console rule builder, this time using a Suricata rule string.
In the Amazon VPC console, navigate to Network Firewall, then select Network Firewall rule groups.
Choose Create rule group.
For Rule group type, select Stateful rule group.
For Rule group format, select Suricata compatible rule string.
For Rule evaluation order, select Strict order. Choose Next.
Figure 4: Create Network Firewall rule group page showing Stateful rule group type, Suricata compatible rule string format, and Strict order evaluation selected
Enter Suricata-Domain-Category-Rules for the Name, Suricata Domain Category Rules for the Description, and 50 for the Capacity. Choose Next.
Leave the Rule variables section empty. The $HOME_NET variable is inherited from the firewall policy, as configured in the prerequisites.
Leave IP set references empty.
Paste the following rule into the Suricata compatible rule string editor:
alert tls $HOME_NET any -> $EXTERNAL_NET any (msg:"Artificial Intelligence and Machine Learning Category"; aws_domain_category:Artificial Intelligence and Machine Learning; sid:1000001;)
Choose Next.
Figure 5: Suricata compatible rule string editor with the domain category alert rule pasted in and the rule variables section left empty
Under Customer managed key, leave the default setting (Customize encryption settings should remain unchecked).
Under Add tags – optional, leave the default setting of no tags. Choose Next.
Choose Create rule group.
After creating the rule group, return to your firewall policy and add it under Stateful rule groups. We recommend associating new rule groups in a development or test environment first to validate behavior before deploying to production.
The following table explains each component of this rule:
alert
Action: generate an alert log entry when the rule matches. Other actions include pass, drop, and reject.
tls
Protocol: inspect TLS traffic, matching against the SNI field in the TLS Client Hello.
$HOME_NET any -> $EXTERNAL_NET any
Source and destination: match traffic from any internal IP address (HOME_NET) and port to any external IP address (EXTERNAL_NET) and port. The HOME_NET variable defines your internal network ranges, and the EXTERNAL_NET variable is automatically set to the inverse.
msg:”Artificial Intelligence and Machine Learning Category”
The message written to the alert log when this rule is triggered.
aws_domain_category:Artificial Intelligence and Machine Learning
The AWS-managed domain category to match against. The firewall looks up the destination domain in the category database and matches if the domain belongs to this category.
sid:1000001
A unique signature ID for this rule. Each rule in a rule group must have a unique SID.
Managing exceptions for approved services
You can manage exceptions to keep business-critical websites accessible. For example, say you need to allow access to OpenAI while blocking all other AI and ML traffic. To do this, return to the Suricata-Domain-Category-Rules rule group you created earlier and replace the basic alert rule with the following ruleset. Select the Suricata-Domain-Category-Rules rule group, under the Rules section, choose Edit.
Figure 6: Selecting Suricata-Domain-Category-Rules rule group to edit with new rules
Paste in the following rules and choose Save rule group.
# Allow OpenAI (TLS)
pass tls $HOME_NET any -> $EXTERNAL_NET any (tls.sni; dotprefix; content:".openai.com"; nocase; endswith; flow:to_server; alert; msg:"Allow OpenAI over TLS"; sid:1000001;)

# Allow OpenAI (HTTP)
pass http $HOME_NET any -> $EXTERNAL_NET any (http.host; dotprefix; content:".openai.com"; nocase; endswith; flow:to_server; alert; msg:"Allow OpenAI over HTTP"; sid:1000002;)

# Block all other AI/ML category traffic (TLS)
reject tls $HOME_NET any -> $EXTERNAL_NET any (msg:"Block non-approved AI/ML sites over TLS"; aws_domain_category:Artificial Intelligence and Machine Learning; flow:to_server; alert; sid:1000003;)

# Block all other AI/ML category traffic (HTTP)
reject http $HOME_NET any -> $EXTERNAL_NET any (msg:"Block non-approved AI/ML sites over HTTP"; aws_url_category:Artificial Intelligence and Machine Learning; flow:to_server; alert; sid:1000004;)
Figure 7: Suricata compatible rule string editor with the exception-based ruleset containing pass rules for OpenAI and reject rules for the AI/ML category
With strict order evaluation, the firewall evaluates rules in the order you define them. The pass rules for OpenAI appear first, so matching traffic is allowed before the broader category block rules run.
To verify the rules are working as expected, test from a host that routes traffic through your network firewall. These commands suppress the response body and check the exit code of the curl request. If curl completes a TCP connection, it prints CONNECTION ALLOWED. If the firewall resets the connection, curl exits with a non-zero code and prints CONNECTION BLOCKED.
A request to openai.com should succeed because it matches the pass rule:
When you add a domain category rule to your firewall policy, Network Firewall performs a category lookup for every connection that matches the rule’s protocol and IP specifications. The rules in this post match on $HOME_NET any -> $EXTERNAL_NET any, which means the firewall looks up the category for all outbound traffic originating from your internal network. This is why it’s important to have the $HOME_NET variable configured correctly at the firewall policy level. With this configuration, a single category rule is enough for category metadata to appear in your firewall logs across all matching connections, not just connections that match the specific category in your rule.
Each log entry includes an aws_category field containing a JSON array of all categories the destination domain belongs to. A single domain can map to multiple categories. For example, a request to chat.mistral.ai produces a log entry with “aws_category": "[\"Social Networking\",\"Artificial Intelligence and Machine Learning\"]” because that domain belongs to both categories.
The following sample log entry shows what a blocked request to chat.mistral.ai looks like using the exception-based rules from the previous section. The alert.signature field contains the rule’s msg value, and the aws_category field lists all categories the destination domain belongs to:
The aws_category field shows the domain belongs to both the “Social Networking” and “Artificial Intelligence and Machine Learning” categories. The verdict field confirms the connection was dropped with a TCP reset sent to the client.
Traffic that matches a pass rule with the alert keyword also generates a log entry with the aws_category field populated. For example, a connection to chat.openai.com that matches the OpenAI exception rule from the earlier section produces a log entry with alert.action set to “allowed” and the same category metadata. This means your queries capture both blocked and allowed traffic.
Querying logs with CloudWatch Logs Insights
If you send your firewall logs to Amazon CloudWatch Logs, you can use CloudWatch Logs Insights to analyze category traffic patterns. A single connection can generate multiple log entries (for example, a reject rule log and a default action log for the same flow), so the following queries deduplicate by flow_id to count each connection only once. Because a single domain can belong to multiple categories, results are grouped by category combination. For example, traffic to a domain categorized as both “Social Networking” and “Artificial Intelligence and Machine Learning” appears as a single combined entry.
To get started, navigate to the CloudWatch console. In the left navigation pane under Logs, select Logs Insights. Under Query scope, leave Log group name selected, then select your AWS Network Firewall alert logs log group. For the time window, we recommend starting with the default of 1 hour to keep the queries light. Enter each of the following queries into the editor and choose Run query to review the results. Note that CloudWatch Logs Insights queries incur charges based on the amount of data scanned. See Amazon CloudWatch pricing for details.
Most accessed categories
This query shows which category combinations your workloads connect to most frequently:
fields @timestamp, event.aws_category, event.flow_id
| filter ispresent(event.aws_category) and event.aws_category != "[]"
| stats latest(event.aws_category) as categories by event.flow_id
| stats count(*) as connections by categories
| sort connections desc
| limit 20
Figure 8: CloudWatch Logs Insights query results showing the most frequently accessed category combinations sorted by connection count
Least accessed categories
This query reverses the sort order to surface category combinations with the fewest connections, helping you identify categories that might not be relevant to your environment or that warrant further investigation:
fields @timestamp, event.aws_category, event.flow_id
| filter ispresent(event.aws_category) and event.aws_category != "[]"
| stats latest(event.aws_category) as categories by event.flow_id
| stats count(*) as connections by categories
| sort connections asc
| limit 20
Figure 9: CloudWatch Logs Insights query results showing the least frequently accessed category combinations sorted by connection count ascending
Most accessed categories, allowed traffic only
The event.verdict.action field indicates the actual outcome of each connection:drop for blocked traffic and alert for allowed traffic. This query shows which category combinations have the most allowed connections:
fields @timestamp, event.aws_category, event.flow_id, event.verdict.action
| filter ispresent(event.aws_category) and event.aws_category != "[]"
| stats latest(event.aws_category) as categories, latest(event.verdict.action) as verdict by event.flow_id
| filter verdict = "alert"
| stats count(*) as connections by categories
| sort connections desc
| limit 20
Figure 10: CloudWatch Logs Insights query results showing the most accessed category combinations filtered to allowed traffic only
Most accessed categories, blocked traffic only
The same query filtered to blocked connections. Change the verdict filter to drop:
fields @timestamp, event.aws_category, event.flow_id, event.verdict.action
| filter ispresent(event.aws_category) and event.aws_category != "[]"
| stats latest(event.aws_category) as categories, latest(event.verdict.action) as verdict by event.flow_id
| filter verdict = "drop"
| stats count(*) as connections by categories
| sort connections desc
| limit 20
Figure 11: CloudWatch Logs Insights query results showing the most accessed category combinations filtered to blocked traffic only
Drill down into a specific category
This query uses a like filter to find all traffic where the aws_category field contains a specific category, regardless of what other categories the domain also belongs to. In this example, the query returns all domains your workloads have connected to that map to the Artificial Intelligence and Machine Learning category, broken down by domain and verdict. Replace the category name in the like filter to investigate any category.
fields @timestamp, event.tls.sni, event.aws_category, event.verdict.action, event.flow_id
| filter ispresent(event.aws_category) and event.aws_category like /Artificial Intelligence and Machine Learning/
| stats latest(event.tls.sni) as sni, latest(event.verdict.action) as verdict by event.flow_id
| stats count(*) as connections by sni, verdict
| sort connections desc
| limit 20
Figure 12: CloudWatch Logs Insights query results showing a drill down into the Artificial Intelligence and Machine Learning category with connections broken down by domain and verdict
Bandwidth consumption by category
This query shows which category combinations consume the most egress bandwidth. It correlates flow logs (which contain byte counts) with alert logs (which contain category data) using the shared flow_id field. To run this query, select both your alert log group and your flow log group in CloudWatch Logs Insights.
fields @timestamp
| filter ispresent(event.netflow.bytes) or ispresent(event.aws_category)
| stats sum(event.netflow.bytes) as flowBytes, latest(event.aws_category) as categories by event.flow_id
| filter ispresent(categories) and categories != "[]"
| stats sum(flowBytes) as totalBytes by categories
| sort totalBytes desc
| limit 20
Figure 13: CloudWatch Logs Insights query results showing bandwidth consumption by category combination sorted by total bytes descending
These queries help you identify which categories your workloads access by volume, surface blocked and allowed traffic patterns, and pinpoint where the bulk of your egress bandwidth is going.
Conclusion
In this post, you walked through how to set up URL and domain category filtering on AWS Network Firewall, from creating your first category rule using both the console rule builder and Suricata compatible rule strings, to managing exceptions for approved services and monitoring category traffic patterns with CloudWatch Logs Insights. With AWS-managed categories that stay current automatically, you can control access to broad classes of websites without maintaining individual domain lists, and the built-in aws_category log field gives you the visibility to track how your workloads interact with external services.
This feature is available in all AWS commercial regions where AWS Network Firewall is supported.
To provide the best experiences, we use technologies like cookies to store and/or access device information. Consenting to these technologies will allow us to process data such as browsing behavior or unique IDs on this site. Not consenting or withdrawing consent, may adversely affect certain features and functions.
Functional
Always active
The technical storage or access is strictly necessary for the legitimate purpose of enabling the use of a specific service explicitly requested by the subscriber or user, or for the sole purpose of carrying out the transmission of a communication over an electronic communications network.
Preferences
The technical storage or access is necessary for the legitimate purpose of storing preferences that are not requested by the subscriber or user.
Statistics
The technical storage or access that is used exclusively for statistical purposes.The technical storage or access that is used exclusively for anonymous statistical purposes. Without a subpoena, voluntary compliance on the part of your Internet Service Provider, or additional records from a third party, information stored or retrieved for this purpose alone cannot usually be used to identify you.
Marketing
The technical storage or access is required to create user profiles to send advertising, or to track the user on a website or across several websites for similar marketing purposes.