At Let’s Encrypt we know that building a secure Internet isn’t just a technical challenge—it’s a long-term commitment. Over the past decade we’ve made enormous strides: from issuing billions of TLS certificates to continually innovating to keep the web safer and more accessible. But none of this would be possible without recurring donations from individuals and organizations around the world.
Recurring donations are more than just financial support; they allow us to plan, innovate, and keep improving with confidence, knowing that month after month, year after year, our supporters are there. This consistent backing empowers us to maintain a secure, privacy-respecting Internet for all.
Our tenth anniversary tagline, Encryption for Everybody, highlights this vision. It’s both a technical goal and a fundamental belief that secure communication should be available to everyone, everywhere.
When we asked our recurring donors why they give, their responses affirmed how essential this commitment is. One longtime supporter shared:
Supporting Let’s Encrypt aligns with my belief in a privacy-conscious world, where encrypted communication is the default.
For some, it’s about paying it forward, helping future users benefit as they once did:
For my 18th birthday, I got my last name as a domain. As a young tech enthusiast with little money, Let’s Encrypt made it possible for me to get a TLS certificate and learn about technology. Back then, I was a student using it for free. Now that I have a stable income, donating is my way of giving back and helping others have the same opportunities I did.
The next decade of Let’s Encrypt will likely be about maintaining that commitment to encryption for everybody. It’s about ensuring that our work remains reliable, accessible, and—most importantly—supported by people who believe in what we do. To everyone who’s been part of this journey, thank you. We couldn’t do it without you.
During Let’s Encrypt’s 10th Anniversary Year, we’re celebrating our community and reflecting on our journey. We’d be thrilled to hear from you. Connect with us on LinkedIn, our community forum, or email us at [email protected]. Let’s keep building a secure Internet together!
Let’s Encrypt is a project of the nonprofit Internet Security Research Group, a 501(c)(3) nonprofit. To support our work, visit letsencrypt.org/donate.
Ihor Solodrai has been working on the BPF subsystem’s continuous-integration
(CI) testing for the last six months. At the 2025 Linux Storage, Filesystem,
Memory-Management, and BPF Summit, he remotely shared
an update on his work, and solicited feedback on how the tests could be further
improved. Much of the work he’s done has been specific to the BPF subsystem, but
some is more generic and could potentially be of use to other subsystems. He
also shared some general lessons learned from working on the BPF CI tests.
Despite careful planning and months of warning, Debian developer Mo
Zhou has acknowledged that the project needs more time to grapple with
the questions around AI models and the Debian Free Software Guidelines
(DFSG). For now, he has withdrawn his proposed General Resolution (GR)
that would have required the original training data for AI models to
be released in order to be considered DFSG-compliant—though the
debates on the topic continue.
Today, we’re introducing the AWS Product Lifecycle page, a centralized resource that provides comprehensive information about service availability changes across AWS.
The new AWS Product Lifecycle page consolidates all service availability information in one convenient location. This dedicated resource offers detailed visibility into three key categories of changes: 1) services closing access to new customers, 2) services that have announced end of support, and 3) services that have reached their end of support date. For each service listed, you can access specific end-of-support dates, recommended migration paths, and links to relevant documentation, enabling more efficient planning for service transitions.
The AWS Product Lifecycle page helps you stay informed about changes that may affect your workloads and enables more efficient planning for service transitions. The centralized nature of this resource reduces the time and effort needed to track service lifecycle information, allowing you to focus more on your core business objectives and less on administrative overhead.
Today on the new Product Lifecycle page, you will see updates about the following changes to services and capabilities:
AWS service availability updates in 2025 After careful consideration, we’re announcing availability changes for a select group of AWS services and features. We understand that the decision to end support for a service or feature significantly impacts your operations. We approach such decisions only after thorough evaluation, and when end of support is necessary, we provide detailed guidance on available alternatives and comprehensive support for migration.
Services closing access to new customers We’re closing access to new customers after June 20, 2025, for the following services or capabilities listed. Existing customers will be able to continue to use the service.
Services that have announced end of support The following services will no longer be supported. To find out more about service specific end-of-support dates, as well as detailed migration information, please visit individual service documentation pages.
Services that have reached their end of support The following services have reached their end of support date and can no longer be accessed:
AWS Private 5G
AWS DataSync Discovery
The AWS Product Lifecycle page is available and all the changes described in this post are listed on the new page now. We recommend that you bookmark this page and check out What’s New with AWS? for upcoming AWS service availability updates. For more information about using this new resource, contact us or your usual AWS Support contacts for specific guidance on transitioning affected workloads.
Triaging and quickly responding to security events is important to minimize impact within an AWS environment. Acting in a standardized manner is equally important when it comes to capturing forensic evidence and quarantining resources. By implementing automated solutions, you can respond to security events quickly and in a repeatable manner. Before implementing automated security solutions, it’s important for your security team to have a defined process and understanding of which actions to take for specific AWS resources.
In a previous two-part post, we discussed using Amazon GuardDuty and Amazon Detective to detect security issues for an Amazon Elastic Kubernetes Service (Amazon EKS) cluster. In this post, we walk through the differences of Amazon Elastic Cloud Compute (Amazon EC2) and EKS clusters on EC2 when responding to security events. By understanding the differences between the two AWS resource types, you can enhance your existing EC2 incident response (IR) automation to include EKS. Then, we walk you through the deployment and use of a sample solution based on the Automated Forensics Orchestrator for Amazon EC2 solution to automate the end-to-end incident response process for EKS, which includes acquisition, isolation, investigation and reporting.
If you’re familiar with the differences between responding and investigating Amazon EC2 and Amazon EKS resources and want to skip to the solution, skip to the Solution prerequisites.
Note: Amazon EKS on AWS Fargate, which is an AWS managed serverless computing engine, isn’t covered in this post.
Amazon EC2 compared to Amazon EKS resources for incident response
Although Amazon EKS clusters are running on EC2 instances, it’s important to understand the differences between the two and how to handle incident response automation for each resource type. EC2 is a virtual machine where you can install customized applications and packages to complete a task. Amazon EKS is an AWS managed service that you can use to run Kubernetes on EC2 instances without needing to install, operate, and maintain your own Kubernetes control plane or nodes. You can use existing plugins and tooling from the Kubernetes community. EKS clusters can have managed node groups, which create and manage the underlying EC2 instances. Because of Kubernetes cluster architecture, multiple EC2 instances within a node group can be tied to a single EKS cluster. There can also be multiple pods—each running different processes—running on an EC2 instance. GuardDuty can monitor and detect security events for EKS resources and provide information to help identify which resources are impacted, such as EKS cluster name, Kubernetes workload details, tags, and AWS Identity and Access Management (IAM) principals.
For incident response automation purposes, security teams need to understand the relationship between Amazon EKS and Amazon EC2 to determine the appropriate response to a possible security event. For example, if GuardDuty identifies Execution:Kubernetes/AnomalousBehavior.ExecInPod, you might want to investigate the command invoked on the identified pod along with other pods within the EKS cluster. To expand the investigation, you would need to capture and investigate evidence on the entire EKS cluster, which can include multiple EC2 instances.
Accessing Amazon EKS clusters using kubectl
To collect relevant forensic evidence, such as volatile memory, there might be instances where you need to run commands on Amazon EKS clusters. Kubectl is a command line tool that you can use to manage and run commands on EKS clusters using the Kubernetes API. Access with kubectl is limited to the container environment and doesn’t provide full shell access to the host. Although AWS Systems Manager (AWS SSM) can be used to interact with an EKS cluster’s EC2 instances, kubectl allows administrators to manage pods, scale applications, and view cluster logs. We dive into specific actions where kubectl is used in the later sections of this post.
When automating the workflow of response actions to an Amazon EKS cluster, you can incorporate the kubectl commands within Amazon Lambda functions. To invoke commands using kubectl, you need to get credentials for the EKS cluster to:
Authenticate to an IAM principal authorized to work with Amazon EKS
Obtain the EKS cluster endpoint
Verify the certificate authority data for the EKS endpoint
Volatile memory (RAM) in a memory dump is important because it contains the EC2 instance’s in-progress operations. Volatile memory is extremely important in determining the root cause of a security event. Although the commands for capturing volatile memory between EC2 instances and Amazon EKS clusters are similar, there is one important difference to keep in mind. For Linux operating systems, you can use the insmod command with the appropriate LiME kernel module (.ko file) to capture volatile memory:
For Amazon EKS cluster EC2 instances, there can be multiple pods on a single EC2 instance. Knowing which process ID (PID) is associated to a pod is important to map the actions that could have resulted in a security event or compromise.
Figure 1: EKS cluster node list
To get a list of PIDs on the EC2 instance, as shown in Figure 1, the following crictl command needs to be invoked:
After the crictl command is invoked, you will see the output of existing PIDs for the EC2 instance to use in the nsenter command, as shown in the following figure.
Figure 2: EKS node process ID list
To create a mapping between a pod and the PID from a memory dump, the following nsenter command needs to be invoked on the target EC2 instance:
nsenter -t $PID -u hostname
After the nsenter command is invoked, you will see the output of pod and PID information for the EC2 instance, as shown in the following figure.
Figure 3: EKS node process ID to pod mapping commands
After you have the pod-to-PID mapping, you can export that information for later investigation. If you skip this step, the memory dump output will still have the PID information, but you won’t be able to map it back to previously running pods. It’s important to work with your security teams during forensic investigations to determine if this information is used during an investigation and update the automated workflow accordingly.
Network segmentation on EKS
After relevant forensic artifacts, such as volatile memory, disk volumes, and application logs, are collected from an Amazon EKS cluster, you might want to isolate compromised resources from the rest of your application resources. During resource isolation, EC2 instances can be isolated using security groups and network access control lists (NACLs). For EKS clusters, you can cordon the worker node, which makes the node tainted and unschedulable. When a node is cordoned, the Kubernetes scheduler is also blocked from placing new pods on the node. Another mechanism for isolating the EKS cluster is applying a Network Policy to deny ingress or egress traffic to the pod. Network policies, like NACLs, are stateless and control network traffic at the IP address or port level in an EKS cluster.
Depending on the scope of isolation, you can take the following approaches to isolating a pod on an EKS cluster in your automation.
Apply a network policy – You can add a network policy rule to limit ingress or egress from your pod. This will not impact other pods in the cluster unless there are additional rules applied. You would use this option if you’re sure that the compromise hasn’t gained access to the underlying EC2 instance.
Cordon the node – Removing the node won’t impact other nodes on the cluster but will block the scheduling of pods on the node. It doesn’t affect other nodes within the cluster.
Apply a security group – Applying a security group can impact the entire EC2 instance and limit traffic between Amazon EKS cluster nodes, the Kubernetes control plane, the cluster’s worker nodes, and external destinations. This is an option if you believe the underlying EC2 instance has been compromised.
Add a NACL rule – Like the security group option, this will impact the entire EC2 instance. Depending on the rule, it can also affect non-EKS workloads within the subnet.
Identity and access management for EKS
In addition to the IAM role associated to an EC2 instance profile, Amazon EKS uses service-linked IAM roles and Kubernetes role-based authorization control (RBAC) configuration. The IAM principal that creates the EKS cluster has system:masters permissions within the RBAC configuration on the EKS cluster. RBAC provides Kubernetes identities access for cluster-specific components and workflows. In addition to default identities created on EKS clusters, application-specific roles can be used within an EKS cluster. For example, IAM roles for service accounts (IRSA) can be used to associate an IAM role with a Kubernetes service account and assigned to containers within an EKS Pod. IRSA can help implement least privilege by restricting the Pod’s container to retrieve credentials for the IAM role associated with the Kubernetes service account. For a deeper dive into EKS IAM and how IAM roles are used within EKS, see Identity and access management for Amazon EKS.
Deciding how to revoke Amazon EKS permissions using automation can be challenging because revoking the AWS Security Token Service (AWS STS) credentials or changing the instance profile on the EC2 instance will impact all pods on the EC2 instance. Updating or changing the RBAC configurations on an EKS cluster requires application-specific knowledge to determine which identities are authorized to have specific permissions. It’s important to discuss with your application and security teams how permissions should be handled in the event of a compromised EKS cluster.
Moving to automated EKS incident response
Now that you understand the nuances of Amazon EKS on Amazon EC2 as it relates to incident response, you can decide how to incorporate functionality to respond to EKS in an existing solution your team might be using. It’s also important to understand where a human-in-the-loop needs to be incorporated to follow internal processes and procedures. Before incorporating automation into IR capabilities, you should walk through each step and verify the action the automation takes to make sure that the security and application teams are aligned. In this post, we incorporated Amazon EKS IR capabilities across acquisition, isolation, and investigation into the Automated Forensics Orchestrator for Amazon EC2 solution.
Solution prerequisites
For this walkthrough, you need to have the following elements in place:
AWS Security Hub must be enabled to create a Security Hub custom action.
Forensic investigation Amazon Machine Image (AMI) with tools, such as Cast or other third-party software, used to investigate the forensic artifacts generated.
Figure 4: Automated Forensics Orchestrator for Amazon EKS architecture
The workflow, as shown in Figure 4, is:
In the AWS application account, GuardDuty monitors for malicious activities that are specific to Amazon EKS resources. For example, a pod within an EKS cluster is invoking API commands using an unauthenticated system:anonymous user. GuardDuty findings are sent to Security Hub in the security account using native integration.
Security Hub custom actions send finding information to Amazon EventBridge to invoke automated downstream workflows.
For a specified event, EventBridge provides the EKS resource information for the forensics process to target and initiates an AWS Step Functions workflow.
Step Functions triages the request as follows:
Gets the EKS information, including which EC2 instances the pod is hosted on.
Determines if isolation is required based on the Security Hub custom action.
Determines if acquisition is required based on tags associated with the EC2 instance. The current tag that is evaluated is the following:
Tag name: IsTriageRequired
Tag key: true or false
Initiates the acquisition flow based on triaging output
The following two acquisition flows are initiated in parallel:
Memory forensics flow – The Step Functions workflow captures the memory data and stores it in Amazon Simple Storage Service (Amazon S3). Post memory acquisition completion, the node is isolated by cordoning the node, creating a network policy, and applying a restricted security group to the cluster. To help maintain the chain of custody, a new security group is attached to the targeted instance and removes access for users, admins, or developers.
Note: The isolation action is initiated based on the selected Security Hub custom action.
After the disk or memory acquisition process is complete, and the evidence has been captured successfully, a notification is sent to an investigation Step Functions state machine to begin the automated investigation of the captured data.
The investigation Step Functions starts a forensic instance from a forensic AMI loaded with customer forensic tools:
Loads the memory data from Amazon S3 for memory investigation.
Creates an Amazon EBS volume from the snapshot and attaches it for disk analysis.
Systems Manager documents (SSM documents) are used to run a forensic investigation.
DynamoDB stores the state of the forensic tasks and their result when the jobs are complete. Investigation job details are stored in DynamoDB.
Deploy the automation that collects, stores, and investigates forensic artifacts in the forensic AWS account:
To build the app when navigating to the project’s root folder, use the following commands.
npm ci
npm run-build-lambda
Run the following commands in your terminal while authenticated in your forensic solution AWS account. Be sure to replace <INSERT_AWS_ACCOUNT> with your account number and replace <INSERT_REGION> with the AWS Region that you want the solution deployed to.
Deploy the Security Hub custom action and EventBridge in the Security Hub Region of the delegated administrator account where security findings are consolidated:
To build the app when navigating to the project’s root folder, use the following commands.
npm ci
npm run build-lambda
Run the following commands in your terminal while authenticated in your Security Hub aggregator AWS account. Be sure to replace <INSERT_AWS_ACCOUNT> with your account number and replace <INSERT_REGION> with the AWS Region that you want the solution deployed to.
After you have an EKS security finding, you can go through either one of the IR workflows:
Forensic triage – This workflow evaluates in-scope EKS resources, collects volatile and non-volatile memory, conducts an investigation, and exports investigation artifacts to a forensic S3 bucket.
Forensic isolation – In addition to components of the previous workflow, the in-scope EKS resources are quarantined at the network and IAM layers.
In this example, you’ll use the forensic isolation workflow because that covers the end-to-end capabilities of the solution.
Choose Findings in the navigation pane and then select a security finding for Amazon EKS.
Select the custom action for Forensic Isolation. This will start the workflow in the Security Hub aggregator account and invoke the Step Functions in the forensic account.
In the navigation pane, choose State Machines and then select the Forensic-Triage-Function to view the workflow graph status. In the following figure, the Step Functions workflow has successfully completed.
Figure 5: EKS triage Step Functions graph view
In the Get Resource InfoCase step, the pod name from the GuardDuty finding is extracted to identify the EKS cluster it’s part of and the related EC2 resources.
Note: Per the solution, a guardrail is added to block action on an EC2 instance that is part of an EKS cluster with the IsTriageRequired tag with a value set to false. If automation is invoked against a protected EC2 instance resource, acquisitionFlow is skipped and a notification will be sent to the SNS topic.
Because the EKS cluster isn’t excluded through the IsTriageRequired tag, a parallel invocation of Step Functions is invoked to capture forensic evidence.
Select the Disk-Forensics-Acquisition-Function. The workflow here is similar to a normal EC2 incident response flow to capture snapshots and EBS volumes with the caveat that the EKS cluster can have multiple EC2 instances. In the following figure, the Step Functions workflow has successfully completed.
Figure 6: Disk forensics acquisition Step Functions graph view
Select the Memory-Forensics-Acquisition-Function; In the following figure, the Step Function workflow has successfully completed.
As previously mentioned, you will need to determine if you want to map pods to process ID (PID) as part of this workflow. The automation captures the volatile memory where you will be able see the PIDs on the EC2 instance but does not map the PID to node for deeper investigation.
Note: One reason you might not want to automatically map pods to PIDs is to minimize interaction with the possibly compromised cluster and quickly move towards isolation.
After the Is Memory Acquisition Complete step is complete and if the Security Hub custom action for Forensic Isolation was selected, the isolation workflow of the EKS cluster begins. The isolation workflow will go through EKS-specific steps to:
Label the affected pods on the EKS cluster.
Apply a network policy to the affected pods.
Revoke IAM role sessions.
Cordon the node.
Note: Depending on your desired workflow, you can edit these steps or add additional isolation steps to change instance profiles, security groups, or NACL rules.
To expedite the investigation process, the Forensic-Investigation-Function is invoked when the Memory-Forensics-Acquisition-Function is completed and separately by the Disk-Forensics-Acquisition-Function. This is because of the disk and memory forensic evidence collection completing at different times. A forensic EC2 instance will be launched and begin conducting the investigation on the forensic artifacts. The completed investigation artifacts will be sent to Amazon S3 as they’re completed.
You can use the console to view EKS artifacts within the dedicated S3 bucket in the forensic AWS account.
Figure 8: Completed memory investigation artifacts for EKS
The forensic investigation results from the automated workflow are also saved to the dedicated S3 bucket in the forensic AWS account.
Figure 9: Completed disk investigation artifacts for EKS
As part of the automation, the forensic investigation EC2 instance in the forensic account is terminated after investigation is completed. The automation can be updated to retain the EC2 instance to so that your security teams can continue their investigation and review investigation artifacts to expedite root cause analysis.
As previously mentioned, the workflow you just went through encompasses both investigation and isolation of Amazon EKS resources. If your security teams want to conduct a more thorough investigation prior to isolating EKS resources, select the Forensic Triage custom action in Security Hub. Additionally, if you want to update the solution to be invoked from your security incident and event management (SIEM) tool, you can directly invoke the Forensic-Triage-Function Step Functions from your SIEM.
Clean up
For the cross-account IAM role in the application account, you can:
Go to the AWS CloudFormation console for the application account and Region where you deployed the cross-account IAM role, select the cross-account-role stack.
Choose the option to Delete the stack.
To clean up the CDK stacks, run the following command in the source folder in the Security Hub aggregator account and forensic account.
cdk destroy --all
Conclusion
In this post, we showed you the differences between Amazon EKS and Amazon EC2 resources and how to handle EKS automation for incident response. Even though EKS clusters are on EC2 instances, it’s important to understand the differences before implementing an automated solution that will affect EKS resources. We also walked through the deployment of an EKS-customized Automated Forensics Orchestrator for Amazon EC2 solution and showed you the end-to-end IR lifecycle to respond to a possible EKS compromise. The same approach to customize existing EC2 IR automated solutions can be used to expand support for EKS resources within your AWS environment to increase your security posture.
If you have feedback about this post, submit comments in the comments section that follows. If you have questions about this post, start a thread on re:Post.
Traditionally, financial data analysis could require deep SQL expertise and database knowledge. Now with Amazon Bedrock Knowledge Bases integration with structured data, you can use simple, natural language prompts to query complex financial datasets. By combining the AI capabilities of Amazon Bedrock with an Amazon Redshift data warehouse, individuals with varied levels of technical expertise can quickly generate valuable insights, making sure that data-driven decision-making is no longer limited to those with specialized programming skills.
With the support for structured data retrieval using Amazon Bedrock Knowledge Bases, you can now use natural language querying to retrieve structured data from your data sources, such as Amazon Redshift. This enables applications to seamlessly integrate natural language processing capabilities on structured data through simple API calls. Developers can rapidly implement sophisticated data querying features without complex coding—just connect to the API endpoints and let users explore financial data using plain English. From customer portals to internal dashboards and mobile apps, this API-driven approach makes enterprise-grade data analysis accessible to everyone in your organization. Using structured data from a Redshift data warehouse, you can efficiently and quickly build generative AI applications for tasks such as text generation, sentiment analysis, or data translation.
In this post, we showcase how financial planners, advisors, or bankers can now ask questions in natural language, such as, “Give me the name of the customer with the highest number of accounts?” or “Give me details of all accounts for a specific customer.” These prompts will receive precise data from the customer databases for accounts, investments, loans, and transactions. Amazon Bedrock Knowledge Bases automatically translates these natural language queries into optimized SQL statements, thereby accelerating time to insight, enabling faster discoveries and efficient decision-making.
Solution overview
To illustrate the new Amazon Bedrock Knowledge Bases integration with structured data in Amazon Redshift, we will build a conversational AI-powered assistant for financial assistance that is designed to help answer financial inquiries, like “Who has the most accounts?” or “Give details of the customer with the highest loan amount.”
We will build a solution using sample financial datasets and set up Amazon Redshift as the knowledge base. Users and applications will be able to access this information using natural language prompts.
The following diagram provides an overview of the solution.
For building and running this solution, the steps include:
Load sample financial datasets.
Enable Amazon Bedrock large language model (LLM) access for Amazon Nova Pro.
Create an Amazon Bedrock knowledge base referencing structured data in Amazon Redshift.
Ask queries and get responses in natural language.
To implement the solution, we use a sample financial dataset that is for demonstration purposes only. The same implementation approach can be adapted to your specific datasets and use cases.
Download the SQL script to run the implementation steps in Amazon Redshift Query Editor V2. If you’re using another SQL editor, you can copy and paste the SQL queries either from this post or from the downloaded notebook.
Upload the downloaded files into your newly created S3 bucket.
Using the following COPY command statements, load the datasets from Amazon S3 into the new tables you created in Amazon Redshift. Replace <<your_s3_bucket>> with the name of your S3 bucket and <<your_region>> with your AWS Region.
-- Load sample data
COPY accounts FROM 's3://<<your_s3_bucket>>/accounts.csv' IAM_ROLE DEFAULT FORMAT AS CSV DELIMITER ',' QUOTE '"' IGNOREHEADER 1 REGION AS '<<your_region>>';

COPY customer FROM 's3://<<your_s3_bucket>>/customer.csv' IAM_ROLE DEFAULT FORMAT AS CSV DELIMITER ',' QUOTE '"' IGNOREHEADER 1 REGION AS '<<your_region>>';
COPY investments FROM 's3://<<your_s3_bucket>>/investments.csv' IAM_ROLE DEFAULT FORMAT AS CSV DELIMITER ',' QUOTE '"' IGNOREHEADER 1 REGION AS '<<your_region>>';
COPY loans FROM 's3://<<your_s3_bucket>>/loans.csv' IAM_ROLE DEFAULT FORMAT AS CSV DELIMITER ',' QUOTE '"' IGNOREHEADER 1 REGION AS '<<your_region>>';
COPY orders FROM 's3://<<your_s3_bucket>>/orders.csv' IAM_ROLE DEFAULT FORMAT AS CSV DELIMITER ',' QUOTE '"' IGNOREHEADER 1 REGION AS '<<your_region>>';
COPY transactions FROM 's3://<<your_s3_bucket>>/transactions.csv' IAM_ROLE DEFAULT FORMAT AS CSV DELIMITER ',' QUOTE '"' IGNOREHEADER 1 REGION AS '<<your_region>>';
Enable LLM access
With Amazon Bedrock, you can access state-of-the-art AI models from providers like Anthropic, AI21 Labs, Stability AI, and Amazon’s own foundation models (FMs). These include Anthropic’s Claude 2, which excels at complex reasoning and content generation; Jurassic-2 from AI21 Labs, known for its multilingual capabilities; Stable Diffusion from Stability AI for image generation; and Amazon Titan models for various text and embedding tasks. For this demo, we use Amazon Bedrock to access the Amazon Nova FMs. Specifically, we use the Amazon Nova Pro model, which is a highly capable multimodal model designed for a wide range of tasks like video summarization, Q&A, mathematical reasoning, software development, and AI agents, including high speed and accuracy for text summarization tasks.
Make sure you have the required IAM permissions to enable access to available Amazon Bedrock Nova FMs. Then complete the following steps to enable model access in Amazon Bedrock:
On the Amazon Bedrock console, in the navigation pane, choose Model access.
Choose Enable specific models.
Search for Amazon Nova models, select Nova Pro, and choose Next.
Review the selection and choose Submit.
Create an Amazon Bedrock knowledge base referencing structured data in Amazon Redshift
Amazon Bedrock Knowledge Bases uses Amazon Redshift as the query engine to query your data. It reads metadata from your structured data store to generate SQL queries. There are different supported authentication methods to create the Amazon Bedrock knowledge base using Amazon Redshift. For more information, refer to the Set up query engine for your structured data store in Amazon Bedrock Knowledge Bases.
For this post, we create an Amazon Bedrock knowledge base for the Redshift database and sync the data using IAM authentication.
If you’re creating an Amazon Bedrock knowledge base through the AWS Management Console, you can skip the service role setup mentioned in the previous section. It automatically creates one with the necessary permissions for Amazon Bedrock Knowledge Bases to retrieve data from your new knowledge base and generate SQL queries for structured data stores.
Complete the following steps to create an Amazon Bedrock knowledge base using structured data:
On the Amazon Bedrock console, choose Knowledge Bases in the navigation pane.
Choose Create and choose Knowledge Base with structure data store from the dropdown menu.
Provide the following details for your knowledge base:
Enter a name and optional description.
Select Amazon Redshift as the query engine.
Select Create and use a new service role for resource management.
Make note of this newly created IAM role.
Choose Next to proceed to the next part of the setup process.
Configure the query engine:
Select Redshift Serverless (Amazon Redshift provisioned is also supported).
Choose your Redshift workgroup.
Use the IAM role created earlier.
Under Default storage metadata, select Amazon Redshift databases and for Database, choose dev.
You can customize settings by adding specific contexts to enhance the accuracy of the results.
Choose Next.
Complete creating your knowledge base.
Record the generated service role details.
Next, grant appropriate access to the service role for Amazon Bedrock Knowledge Bases through the Amazon Redshift Query Editor V2. Update <your Service Role name> in the following statements with your service role, and update the value for <your schema>.
CREATE USER "IAMR:<your Service Role name>" WITH PASSWORD DISABLE;
SELECT * FROM PG_USER; -- To verify that the user is created.
GRANT SELECT ON ALL TABLES IN SCHEMA <your schema> TO "IAMR:<your Service Role name>";
--You can also Restricting access to certain tables for finer-grained control on the tables that can be accessed as shown below
GRANT SELECT ON TABLE customer to "IAMR:<your Service Role name>";
GRANT SELECT ON TABLE loan to "IAMR:<your Service Role name>";
Now you can update the knowledge base with the Redshift database.
On the Amazon Bedrock console, choose Knowledge Bases in the navigation pane.
Open the knowledge base you created.
Select the dev Redshift database and choose Sync.
It may take a few minutes for the status to display as COMPLETE.
Ask queries and get responses in natural language
You can set up your application to query the knowledge base or attach the knowledge base to an agent by deploying your knowledge base for your AI application. For this demo, we use a native testing interface on the Amazon Bedrock Knowledge Bases console.
To ask questions in natural language on the knowledge base for Redshift data, complete the following steps:
On the Amazon Bedrock console, open the details page for your knowledge base.
Choose Test.
Choose your category (Amazon), model (Nova Pro), and inference settings (On demand), and choose Apply.
In the right pane of the console, test the knowledge base setup with Amazon Redshift by asking a few simple questions in natural language, such as “How many tables do I have in the database?” or “Give me list of all tables in the database.”
The following screenshot shows our results.
To view the generated query from your Amazon Redshift based knowledge base, choose Show details next to the response.
Next, ask questions related to the financial datasets loaded in Amazon Redshift using natural language prompts, such as, “Give me the name of the customer with the highest number of accounts” or “Give the details of all accounts for customer Deanna McCoy.”
The following screenshot shows the responses in natural language.
Using natural language queries in Amazon Bedrock, you were able to retrieve responses from the structured financial data stored in Amazon Redshift.
Considerations
In this section, we discuss some important considerations when using this solution.
Security and compliance
When integrating Amazon Bedrock with Amazon Redshift, implementing robust security measures is crucial. To protect your systems and data, implement essential safeguards including restricted database roles, read-only database instances, and proper input validation. These measures help prevent unauthorized access and potential system vulnerabilities. For more information, see Allow your Amazon Bedrock Knowledge Bases service role to access your data store.
Cost
You incur a cost for converting natural language to text based on SQL. To learn more, refer to Amazon Bedrock pricing.
Use custom contexts
To improve query accuracy, you can enhance SQL generation by providing custom context in two key ways. First, specify which tables to include or exclude, focusing the model on relevant data structures. Second, supply curated queries as examples, demonstrating the types of SQL queries you expect. These curated queries serve as valuable reference points, guiding the model to generate more accurate and relevant SQL outputs tailored to your specific needs. For more information, refer to Create a knowledge base by connecting to a structured data store.
For different workgroups, you can create separate knowledge bases for each group, with access only to their specific tables. Control data access by setting up role-based permissions in Amazon Redshift, verifying each role can only view and query authorized tables.
Clean up
To avoid incurring future charges, delete the Redshift Serverless instance or provisioned data warehouse created as part of the prerequisite steps.
Conclusion
Generative AI applications provide significant advantages in structured data management and analysis. The key benefits include:
Using natural language processing – This makes data warehouses more accessible and user-friendly
Enhancing customer experience – By providing more intuitive data interactions, it boosts overall customer satisfaction and engagement
Simplifying data warehouse navigation – Users can understand and explore data warehouse content through natural language interactions, improving ease of use
Improving operational efficiency – By automating routine tasks, it allows human resources to focus on more complex and strategic activities
In this post, we showed how the natural language querying capabilities of Amazon Bedrock Knowledge Bases when integrated with Amazon Redshift enables rapid solution development. This is particularly valuable for the finance industry, where financial planners, advisors, or bankers face challenges in accessing and analyzing large volumes of financial data in a secured and performant manner.
By enabling natural language interactions, you can bypass the traditional barriers of understanding database structures and SQL queries, and quickly access insights and provide real-time support. This streamlined approach accelerates decision-making and drives innovation by making complex data analysis accessible to non-technical users.
Nita Shah is an Analytics Specialist Solutions Architect at AWS based out of New York. She has been building data warehouse solutions for over 20 years and specializes in Amazon Redshift. She is focused on helping customers design and build enterprise-scale well-architected analytics and decision support platforms.
Sushmita Barthakur is a Senior Data Solutions Architect at Amazon Web Services (AWS), supporting Strategic customers architect their data workloads on AWS. With a background in data analytics, she has extensive experience helping customers architect and build enterprise data lakes, ETL workloads, data warehouses and data analytics solutions, both on-premises and the cloud. Sushmita is based in Florida and enjoys traveling, reading and playing tennis.
Jonathan Katz is a Principal Product Manager – Technical on the Amazon Redshift team and is based in New York. He is a Core Team member of the open source PostgreSQL project and an active open source contributor, including PostgreSQL and the pgvector project.
It’s been a few weeks since my last post about the Amazon Q Developer Command Line Interface (CLI), and I’m excited to share all the great new features and improvements the team has been working on. The CLI has been evolving rapidly with a focus on enhancing user experience, improving context management, and adding powerful new capabilities. In this post, I’ll walk you through the most significant changes that make the Amazon Q Developer CLI even more powerful and user-friendly.
Conversation Persistence
One of the most requested features has been the ability to persist conversations, and I’m thrilled to share that this is now available. With the new q chat --resume command, your conversations are now automatically saved by a working directory. This means you can pick up right where you left off when you return to a project, without having to rebuild context or repeat information.
Q Developer has also added two new commands to give you more control over your conversation state:
/save allows you to explicitly save the current conversation state
/load lets you restore a previously saved conversation
These commands make it easier to manage multiple conversation threads related to different aspects of your project. You can save a conversation about one feature, switch to working on something else, and then load the previous conversation when you’re ready to continue.
First, Q Developer has implemented background MCP server loading, which significantly improves startup time for q chat. Instead of waiting for all MCP servers to initialize before you can start interacting with Q Developer, the CLI now loads servers in the background while you begin your conversation. This means you can start working immediately, with tools becoming available as their servers finish loading.
The team has also added a new subcommand, q mcp, which provides a dedicated interface for updating and managing your MCP server configuration. This makes it easier to add, remove, or modify the MCP servers that extend your CLI’s capabilities.
For more granular control over which tools can be used, Q Developer has added the /tools command in q chat. This allows you to manage permissions for individual tools, giving you more control over what Q Developer can do in your environment. You can also reset permissions for a specific tool if you change your mind.
Improved Context Control
Context is crucial for getting the most out of Q Developer, and the team has made several improvements to how you can manage and view context:
The file selection in q chat‘s fuzzy finder is now git-aware, making it easier to include relevant files from your repository. This is particularly useful when working with large codebases, as it helps you focus on the files that matter for your current task.
Q Developer has added fuzzy search for slash commands with Ctrl + s, allowing you to quickly find and execute commands without remembering their exact syntax. This makes the CLI more accessible, especially for new users or those who don’t use certain commands frequently.
The /context show --expand command has been improved to provide more detailed information about the current context, helping you understand what Q Developer knows about your environment. The team has also enhanced the context file display in q chat to make it more informative and easier to read.
One of the most exciting additions is the new capability for dynamically adding context to messages with context hooks. This allows the CLI to automatically include relevant context based on your conversation, improving the quality of responses without requiring manual context management.
Image Support
I’m particularly excited to announce that q chat now supports images! This opens up a whole new dimension of interaction, allowing you to share screenshots, diagrams, or other visual information with Q Developer. This can be incredibly useful for debugging UI issues, discussing design concepts, or explaining complex ideas that are difficult to convey through text alone.
Editor for Long Prompts
For complex queries or detailed instructions, you may want multiple paragraphs. Q Developer supports Ctrl + j, allowing you to add a newline character to the prompt. In addition, the team has added the /editor command, which opens your configured text editor for composing prompts. This makes it much easier to craft detailed, multi-paragraph prompts or to edit and refine your questions before sending them to Q Developer.
Expanded Region Support
I’m happy to announce that Q Developer has expanded its regional availability. Professional tier users can now access Q Developer in the Frankfurt region (eu-central-1). This expansion is part of Q Developer’s ongoing effort to provide lower latency and better service to customers across the globe. By adding support for the Frankfurt region, Amazon Q Developer is more accessible to European customers, allowing them to benefit from reduced latency and improved performance.
The /issue command in q chat allows you to create new GitHub issues
The report_issue tool provides a programmatic way for Q Developer to help you create detailed issue reports
These features streamline the feedback process, making it easier for you to report bugs or request features, and for the team to improve the CLI based on your input.
Keeping Up with Future Changes
To help you stay informed about new features and improvements, Q Developer has added a --changelog flag to the q version command. This displays the change log directly from the CLI, making it easy to see what’s new without having to visit the GitHub repository or read blog posts like this one.
Conclusion
The Amazon Q Developer CLI continues to evolve rapidly, with new features and improvements that make it an even more powerful tool for developers. From conversation persistence to image support, these updates reflect Q Developer’s commitment to building a CLI that helps you be more productive and effective in your daily work. I encourage you to try out these new features by installing the Amazon Q Developer CLI. Thank you for your continued support and feedback, which helps make Amazon Q Developer better every day.
Red Hat has announced
the release of Red Hat Enterprise Linux (RHEL) 10. A blog post
accompanying the release provides details on some of the more notable
features, such as encrypted DNS, a developer preview of RHEL 10
for RISC-V,
and image
mode for RHEL using bootc.
Image mode for RHEL lets you deploy your OS as a bootc image to your
hardware, virtual machine or cloud, and then layer your app on top of
it. That’s a far less complex operation than traditional packaged
deployments, and it gives developers and image maintainers a common
experience and total control over their environment.
RHEL 10 includes the 6.12.0 kernel, GCC 14.2, GNU
Binutils 2.41, GNU C Library (glibc) 2.39, Python 3.12,
Perl 5.40, and more. See the release
notes for a full list of changes. LWN covered
CentOS Stream 10 in December, which provided an early look
at what would be in the RHEL 10 release.
Experience CS is our new free curriculum that helps elementary and middle school educators (working with students aged 8 to 14) teach computer science with confidence through creative, cross-curricular lessons and projects. Designed for teachers, by teachers, Experience CS is built to be easy to use in classrooms, with everything you need integrated into one safe, school-friendly platform.
In this blog post, we will share more about the safety features of Experience CS, and the steps we’ve taken to make the platform a great fit for your school.
A safe, teacher-managed environment
Experience CS supports young people to develop their understanding of computer science through engaging, interactive projects using the programming language Scratch. Scratch is a popular block-based language that helps young people get started with coding, and Experience CS includes a version of Scratch that we have built especially for schools. With our version, which is fully integrated into the Experience CS platform, students can explore coding in a teacher-managed, closed environment that aligns with schools’ safeguarding policies and gives you full control over what your students see and do.
Scratch coding within Experience CS. If you’ve used our Code Editor, you’ll recognise this interface.
Student safety and privacy are at the forefront in Experience CS, which means:
A private, closed environment. Projects are kept within the classroom and cannot be published to a public gallery.
Teacher-controlled access. Students don’t need to create or manage their own accounts. Teachers manage their students’ access, with no student email addresses required.
No social features. Students don’t create public profiles or follow other users, and there are no chat or comment features for young people.
Curated content. Students can only access the projects and materials you share with them, not content from other users.
Tailor-made for schools
We have designed every part of the Experience CS platform with school environments in mind, making it easier for teachers to manage and for students to use.
Here’s how:
Fully integrated platform. Everything students need is built into the Experience CS platform, including Scratch, lesson resources, student materials, and project templates. There is no need to visit other websites.
Simple access. Teachers generate class codes so learners can jump straight into activities, with no student email address required.
Automatic progress saving. Students’ projects are saved in the platform and linked to their class. Teachers can see students’ progress at a glance.
Teacher control. Teachers have full visibility of students’ activity, and what students see and do stays within the classroom environment.
Experience CS gives you the tools and peace of mind to deliver creative, engaging computer science lessons and activities in a way that works for your school. You will be able to effortlessly manage students’ work, with everything you and your students need provided within a simple, intuitive interface.
Be the first to try Experience CS
Experience CS is launching soon, and we can’t wait to see what you and your students create with it.
If you would like early access, want to stay up to date, or are interested in trying Experience CS out in your classroom, sign up for updates and we’ll keep you in the loop.
We’re also planning ahead: in the coming months, we’ll make our version of Scratch available to all schools and clubs via our Code Editor. That means whether or not you use the Experience CS curriculum, you’ll be able to run safe, creative coding sessions using Scratch in a school-friendly environment.
⚠️ WARNING ⚠️ This blog post contains graphic depictions of probability. Reader discretion is advised.
Measuring performance is tricky. You have to think about accuracy and precision. Are your sampling rates high enough? Could they be too high?? How much metadata does each recording need??? Even after all that, all you have is raw data. Eventually for all this raw performance information to be useful, it has to be aggregated and communicated. Whether it’s in the form of a dashboard, customer report, or a paged alert, performance measurements are only useful if someone can see and understand them.
This post is a collection of things I’ve learned working on customer performance escalations within Cloudflare and analyzing existing tools (both internal and commercial) that we use when evaluating our own performance. A lot of this information also comes from Gil Tene’s talk, How NOT to Measure Latency. You should definitely watch that too (but maybe after reading this, so you don’t spoil the ending). I was surprised by my own blind spots and which assumptions turned out to be wrong, even though they seemed “obviously true” at the start. I expect I am not alone in these regards. For that reason this journey starts by establishing fundamental definitions and ends with some new tools and techniques that we will be sharing as well as the surprising results that those tools uncovered.
Check your verbiage
So … what is performance? Alright, let’s start with something easy: definitions. “Performance” is not a very precise term because it gets used in too many contexts. Most of us as nerds and engineers have a gut understanding of what it means, without a real definition. We can’t really measure it because how “good” something is depends on what makes that thing good. “Latency” is better … but not as much as you might think. Latency does at least have an implicit time unit, so we can measure it. But … what is latency? There are lots of good, specific examples of measurements of latency, but we are going to use a general definition. Someone starts something, and then it finishes — the elapsed time between is the latency.
This seems a bit reductive, but it’s a surprisingly useful definition because it gives us a key insight. This fundamental definition of latency is based around the client’s perspective. Indeed, when we look at our internal measurements of latency for health checks and monitoring, they all have this one-sided caller/callee relationship. There is the latency of the caching layer from the point of view of the ingress proxy. There’s the latency of the origin from the cache’s point of view. Each component can measure the latency of its upstream counterparts, but not the other way around.
This one-sided nature of latency observation is a real problem for us because Cloudflare only exists on the server side. This makes all of our internal measurements of latency purely estimations. Even if we did have full visibility into a client’s request timing, the start-to-finish latency of a request to Cloudflare isn’t a great measure of Cloudflare’s latency. The process of making an HTTP request has lots of steps, only a subset of which are affected by us. Time spent on things like DNS lookup, local computation for TLS, or resource contention do affect the client’s experience of latency, but only serve as sources of noise when we are considering our own performance.
There is a very useful and common metric that is used to measure web requests, and I’m sure lots of you have been screaming it in your brains from the second you read the title of this post. ✨Time to first byte✨. Clearly this is the answer, right?! But … what is “Time to first byte”?
TTFB mine
Time to first byte (TTFB) on its face is simple. The name implies that it’s the time it takes (on the client’s side) to receive the first byte of the response from the server, but unfortunately, that only describes when the timer should end. It doesn’t say when the timer should start. This ambiguity is just one factor that leads to inconsistencies when trying to compare TTFB across different measurement platforms … or even across a single platform because there is no one definition of TTFB. Similar to “performance”, it is used in too many places to have a single definition. That being said, TTFB is a very useful concept, so in order to measure it and report it in an unambiguous way, we need to pick a definition that’s already in use.
We have mentioned TTFB in other blog posts, but this one sums up the problem best with “Time to first byte isn’t what it used to be.” You should read that article too, but the gist is that one popular TTFB definition used by browsers was changed in a confusing way with the introduction of early hints in June 2022. That post and others make the point that while TTFB is useful, it isn’t the best direct measurement for web performance. Later on in this post we will derive why that’s the case.
One common place we see TTFB used is our customers’ analysis comparing Cloudflare’s performance to our competitors through Catchpoint. Customers, as you might imagine, have a vested interest in measuring our latency, as it affects theirs. Catchpoint provides several tools built on their global Internet probe network for measuring HTTP request latency (among other things) and visualizing it in their web interface. In an effort to align better with our customers, we decided to adopt Catchpoint’s terminology for talking about latency, both internally and externally.
Catchpoint catch-up
While Catchpoint makes things like TTFB easy to plot over time, the visualization tool doesn’t give a definition of what TTFB is, but after going through all of their technical blog posts and combing through thousands of lines of raw data, we were able to get functional definitions for TTFB and other composite metrics. This was an important step because these metrics are how our customers are viewing our performance, so we all need to be able to understand exactly what they signify! The final report for this is internal (and long and dry), so in this post, I’ll give you the highlights in the form of colorful diagrams, starting with this one.
This diagram shows our customers’ most commonly viewed client metrics on Catchpoint and how they fit together into the processing of a request from the server side. Notice that some are directly measured, and some are calculated based on the direct measurements. Right in the middle is TTFB, which Catchpoint calculates as the sum of the DNS, Connect, TLS, and Wait times. It’s worth noting again that this is not the definition of TTFB, this is just Catchpoint’s definition, and now ours.
This breakdown of HTTPS phases is not the only one commonly used. Browsers themselves have a standard for measuring the stages of a request. The diagram below shows how most browsers are reporting request metrics. Luckily (and maybe unsurprisingly) these phases match Catchpoint’s very closely.
There are some differences beyond the inclusion of things like AppCache and Redirects (which are not directly impacted by Cloudflare’s latency). Browser timing metrics are based on timestamps instead of durations. The diagram subtly calls this out with gaps between the different phases indicating that there is the potential for the computer running the browser to do things that are not part of any phase. We can line up these timestamps with Catchpoint’s metrics like so:
Now that we, our customers, and our browsers (with data coming from RUM) have a common and well-defined language to talk about the phases of a request, we can start to measure, visualize, and compare the components that make up the network latency of a request.
Visual basics
Now that we have defined what our key values for latency are, we can record numbers and put them in a chart and watch them roll by … except not directly. In most cases, the systems we use to record the data actively prevent us from seeing the recorded data in its raw form. Tools like Prometheus are designed to collect pre-aggregated data, not individual samples, and for a good reason. Storing every recorded metric (even compacted) would be an enormous amount of data. Even worse, the data loses its value exponentially over time, since the most recent data is the most actionable.
The unavoidable conclusion is that some aggregation has to be done before performance data can be visualized. In most cases, the aggregation means looking at a series of windowed percentiles over time. The most common are 50th percentile (median), 75th, 90th, and 99th if you’re really lucky. Here is an example of a latency visualization from one of our own internal dashboards.
It clearly shows a spike in latency around 14:40 UTC. Was it an incident? The p99 jumped by 1300% (500ms to 6500
ms) for multiple minutes while the p50 jumped by more than 13600% (4.4ms to 600ms). It is a clear signal, so something must have happened, but what was it? Let me keep you in suspense for a second while we talk about statistics and probability.
Uncooked math
Let me start with a quote from my dear, close, personal friend @ThePrimeagen:
It’s a good reminder that while statistics is a great tool for providing a simplified and generalized representation of a complex system, it can also obscure important subtleties of that system. A good way to think of statistical modeling is like lossy compression. In the latency visualization above (which is a plot of TTFB over time), we are compressing the entire spectrum of latency metrics into 4 percentile bands, and because we are only considering up to the 99th percentile, there’s an entire 1% of samples left over that we are ignoring!
“What?” I hear you asking. “P99 is already well into perfection territory. We’re not trying to be perfectionists. Maybe we should get our p50s down first”. Let’s put things in perspective. This zone (www.cloudflare.com) is getting about 30,000 req/s and the 99th percentile latency is 500 ms. (Here we are defining latency as “Edge TTFB”, a server-side approximation of our now official definition.) So there are 300 req/s that are taking longer than half a second to complete, and that’s just the portion of the request that we can see. How much worse than 500 ms are those requests in the top 1%? If we look at the 100th percentile (the max), we get a much different vibe from our Edge TTFB plot.
Viewed like this, the spike in latency no longer looks so remarkable. Without seeing more of the picture, we could easily believe something was wrong when in reality, even if something is wrong, it is not localized to that moment. In this case, it’s like we are using our own statistics to lie to ourselves.
The top 1% of requests have 99% of the latency
Maybe you’re still not convinced. It feels more intuitive to focus on the median because the latency experienced by 50 out of 100 people seems more important to focus on than that of 1 in 100. I would argue that is a totally true statement, but notice I said “people”and not “requests.” A person visiting a website is not likely to be doing it one request at a time.
Taking www.cloudflare.com as an example again, when a user opens that page, their browser makes more than 70 requests. It sounds big, but in the world of user-facing websites, it’s not that bad. In contrast, www.amazon.com issues more than 400 requests! It’s worth noting that not all those requests need to complete before a web page or application becomes usable. That’s why more advanced and browser-focused metrics exist, but I will leave a discussion of those for later blog posts. I am more interested in how making that many requests changes the probability calculations for expected latency on a per-user basis.
Here’s a brief primer on combining probabilities that covers everything you need to know to understand this section.
The probability of two things happening is the probability of the first happening multiplied by the probability of the second thing happening. $$P(X\cap Y )=P(X) \times P (Y)$$
The probability of something in the $X^{th}$ percentile happening is $X\%$. $$P(pX) = X\%$$
Let’s define $P( pX_{N} )$ as the probability that someone on a website with $N$ requests experiences no latencies >= the $X^{th}$ percentile. For example, $P(p50_{2})$ would be the probability of getting no latencies greater than the median on a page with 2 requests. This is equivalent to the probability of one request having a latency less than the $p50$ and the other request having a latency less than the $p50$. We can use the first identities above.
This vanishingly small number should make you question why we would value the $p50$ latency so highly at all when effectively no one experiences it as their worst case latency.
So now the question is, what request latency percentile should we be looking at? Let’s go back to the statement at the beginning of this section. What does the median person experience on www.cloudflare.com? We can use a little algebra to solve for that.
This seems a little too perfect, but I am not making this up. For www.cloudflare.com, if you want to capture a value that’s representative of what the median user can expect, you need to look at $p99$ request latency. Extending this even further, if you want a value that’s representative of what 99% of users will experience, you need to look at the 99.99thpercentile!
Spherical latency in a vacuum
Okay, this is where we bring everything together, so stay with me. So far, we have only talked about measuring the performance of a single system. This gives us absolute numbers to look at internally for monitoring, but if you’ll recall, the goal of this post was to be able to clearly communicate about performance outside the company. Often this communication takes the form of comparing Cloudflare’s performance against other providers. How are these comparisons done? By plotting a percentile request “latency” over time and eyeballing the difference.
With everything we have discussed in this post, it seems like we can devise a better method for doing this comparison. We saw how exposing more of the percentile spectrum can provide a new perspective on existing data, and how impactful higher percentile statistics can be when looking at a more complete user experience. Let me close this post with an example of how putting those two concepts together yields some intriguing results.
One last thing
Below is a comparison of the latency (defined here as the sum of the TLS, Connect, and Wait times or the equivalent of TTFB – DNS lookup time) for the customer when viewed through Cloudflare and a competing provider. This is the same data represented in the chart immediately above (containing 90,000 samples for each provider), just in a different form called a CDF plot, which is one of a few ways we are making it easier to visualize the entire percentile range. The chart shows the percentiles on the y-axis and latency measurements on the x-axis, so to see the latency value for a given percentile, you go up to the percentile you want and then over to the curve. Interpreting these charts is as easy as finding which curve is farther to the left for any given percentile. That curve will have the lower latency.
It’s pretty clear that for nearly the entire percentile range, the other provider has the lower latency by as much as 30ms. That is, until you get to the very top of the chart. There’s a little bit of blue that’s above (and therefore to the left) of the green. In order to see what’s going on there more clearly, we can use a different kind of visualization. This one is called a QQ-Plot, or quantile-quantile plot. This shows the same information as the CDF plot, but now each point on the represents a specific quantile, and the 2 axes are the latency values of the two providers at that percentile.
This chart looks complicated, but interpreting it is similar to the CDF plot. The blue is a dividing marker that shows where the latency of both providers is equal. Points below the line indicate percentiles where the other provider has a lower latency than Cloudflare, and points above the line indicate percentiles where Cloudflare is faster. We see again that for most of the percentile range, the other provider is faster, but for percentiles above 99, Cloudflare is significantly faster.
This is not so compelling by itself, but what if we take into account the number of requests this page issues … which is over 180. Using the same math from above, and only considering half the requests to be required for the page to be considered loaded, yields this new effective QQ plot.
Taking multiple requests into account, we see that the median latency is close to even for both Cloudflare and the other provider, but the stories above and below that point are very different. A user has about an even chance of an experience where Cloudflare is significantly faster and one where Cloudflare is slightly slower than the other provider. We can show the impact of this shift in perspective more directly by calculating the expected value for request and experienced latency.
Latency Kind
Cloudflare (ms)
Other CDN (ms)
Difference (ms)
Expected Request Latency
141.9
129.9
+12.0
Expected Experienced Latency
Based on 90 Requests
207.9
281.8
-71.9
Shifting the focus from individual request latency to user latency we see that Cloudflare is 70 ms faster than the other provider. This is where our obsession with reliability and tail latency becomes a win for our customers, but without a large volume of raw data, knowledge, and tools, this win would be totally hidden. That is why in the near future we are going to be making this tool and others available to our customers so that we can all get a more accurate and clear picture of our users’ experiences with latency. Keep an eye out for more announcements to come later in 2025.
A DoorDash driver stole over $2.5 million over several months:
The driver, Sayee Chaitainya Reddy Devagiri, placed expensive orders from a fraudulent customer account in the DoorDash app. Then, using DoorDash employee credentials, he manually assigned the orders to driver accounts he and the others involved had created. Devagiri would then mark the undelivered orders as complete and prompt DoorDash’s system to pay the driver accounts. Then he’d switch those same orders back to “in process” and do it all over again. Doing this “took less than five minutes, and was repeated hundreds of times for many of the orders,” writes the US Attorney’s Office.
Interesting flaw in the software design. He probably would have gotten away with it if he’d kept the numbers small. It’s only when the amount missing is too big to ignore that the investigations start.
Security updates have been issued by Debian (firefox-esr, openjdk-11, openjdk-17, and wireless-regdb), Fedora (iputils, open-vm-tools, sfnt2woff-zopfli, and woff), Red Hat (postgresql:12), SUSE (apache2-mod_auth_openidc, brltty, helm, python-maturin, and rubygem-rack), and Ubuntu (linux-azure-fips).
И с невъоръжено око се вижда, че звателните форми в българския език залязват. Това може да се окаже единственото твърдение в цялата статия, с което всички четящи ще се съгласят, независимо кои обръщения предпочитат – традиционните Иване, Елице или по-новите Иван, Елица.
За и против звателните форми
Днес отношението към звателните форми е доста противоречиво по мои наблюдения. За да се убедя още веднъж в това, а и за да придобиете вие по-детайлна и достоверна представа, реших да поискам мнението на българите в социалната мрежа Х, като им поставих следния въпрос: „Ако сте мъж и трябва да се обръщат към вас с Иване, Емиле и т.н. или сте жена и обръщението следва да е Елице, Радке (да завършва на -е), как лично приемате тези форми, дразнят ли ви и защо? (За Галино, Павлино и под. е ясно, че са груби.)“
Отговорите варираха от „Аз полудявам, когато чуя името си с е накрая“ до „Поправям винаги, ако някой не го спазва при общуването си с мен“. Имаше и по-умерени реакции, разбира се, но откликнаха неочаквано много хора (като за българския Х), някои водиха спорове помежду си и всичко това показва, че темата ни вълнува.
Защо всъщност се впечатляваме толкова от начина, по който се обръщат към нас? Първо, защото личното име индивидуализира всеки човек и става неизменна част от него още от първите му дни на този свят. Това име си е наше и макар че другите го използват по-често, притежаваме го ние, и то за цял живот. Второ, изборът на обръщение често издава отношението и чувствата на околните към нас. Едно е да ти кажат Гергана или Василе, друго е да се обърнат с Гери или с Васко, Васе.
Все повече хора свързват книжовните звателни форми на мъжките имена с отрицателно отношение към тях самите като личности. Отговорите в импровизираната ми анкета го потвърждават:
Жена ми, като ми е сърдита, ми вика Орлине. Непознати хора ги усещам как не им харесва да ми викат Орлине, и ми казват Жечев.
Имам сигурно 20 различни умалителни имена. Наско, Стасе, Анастаско и т.н., но Анастасе е само за ядосани.
Кажат ли ми Александре, значи се е включила BG-ALERT за предстоящо бедствие.
Румене ме дразни, не знам защо, но аз го използвам към себе си, като направя глупост.
На мен също ми се е случвало да се ругая наум, започвайки с Павлино, а веднъж една моя приятелка, недоволна от себе си, каза на глас: „Станиславо, голяма патица си!“ Женските звателни форми на -о са особено подходящи в тези случаи, защото се възприемат като груби и неучтиви и поради тази причина от около половин век не се употребяват в книжовния език¹.
Неотдавна в разговор с гимназисти един от тях сподели, че предпочита да му казват Иван, защото Иване му звучи грубо и обидно – всъщност точно както Павлино и Станиславо. Тогава това ми се стори странно, но сега, имайки пред себе си и отговорите в анкетата, мисля, че при мъжките имена в момента е в ход процесът, който вече е завършил при женските звателни форми на -о. Интересно би било да се направи социологическо изследване на езиковите нагласи, за да разберем колко е напреднал този процес, защото много са и гласовете в подкрепа на звателните форми:
Ако няма -е, ми звучи префърцунено, чуждестранно едно такова.
Изключително ми е неприятно, когато някой не познава българския език и не използва звателния падеж.
Аз намирам за грубо точно обратното – без звателна форма имената звучат дистанцирано, сухо и безлично, като на предмети, а не на хора.
Здравейте, Мартин! е безумно и ми звучи, сякаш говоря с неграмотен човек.
Общата картина на отговорите за и против е доста пъстра, а някои от коментарите бяха неочаквано образни и емоционални. У едни хора звателните форми задействат защитните механизми (асоциацията с BG-ALERT) и спомени от детството („Като израстващ индивид, Емиле се използваше почти изцяло когато трябва да ми се повиши тон за нещо“), за други обръщенията без окончание -е са сякаш „към робот или куче“.
Да диференцираме имената
След това емоционално начало е редно да подходим по-детайлно и по-хладнокръвно към проблема, като го разчленим, доколкото е възможно. Вече стана ясно, че не всички звателни форми са приемливи в книжовния ни език, а също така по-рядко се срещат и в по-непретенциозното ни общуване – ярък пример са женските звателни форми на -о (Павлино, Марийо, Божано).
Част от мъжките имена, които българите носят от векове, изобщо нямат звателна форма заради своя завършек, например Георги, Христо, Никола, Петко, Илия, Радой. Ако изключим Радой, останалите са често срещани², съответно често се употребяват обръщения, които не са звателни форми.
Все повече новородени деца получават чужди имена. За онези, които веднага ще лепнат на родителите етикета „родоотстъпници“, ще отбележа, че имена като Стефан, Михаил, Елена, смятани за традиционни, също са с чужд произход, само че са навлезли у нас преди повече от хилядолетие. И така, сравнително новите за нашата именна система Адел, Никол, Матео, Макс, Дейвид, Стивън си нямат звателни форми. Разбира се, може да се насилим и да кажем Дейвиде, Стивъне (Максе ми изглежда само теоретично възможно), но дисонансът поне в моето съзнание е толкова силен, че отеква в черепната ми кутия.
Подобно категорично чувство за неуместност изпитах преди две-три години, когато трябваше да напиша имейл на един Петър. С този човек се познаваме от деца, но не сме поддържали никакви отношения през годините и не бих могла да започна със Здравей, Пепи или Пешо, ето защо написах Здравей, Петре. Изведнъж това начало ми се стори грубо, макар че редовно използвам звателните форми при мъжките имена: Здравей,Момчиле, Радославе и т.н. Известно време се чудих, тъй като и Здравей, Петър не беше приемливо за мен, накрая изтрих обръщението, оставих само Здравей и продължих да пиша на нов ред по същество. Грубо ми звучат също Димитре, Александре – вероятно заради звукосъчетанията тр, др, но към един Александър се обръщам със звателната форма, защото съм го питала и той ми е отговорил, че предпочита да му казвам точно така.
Впрочем този подход ми се струва уместен и бих го препоръчала, особено ако вече сте на ти с някого и се очертават бъдещи контакти помежду ви: попитайте го как предпочита да се обръщате. Така ще спестите на себе си чуденето, а на събеседника – неприятни емоции, в случай че избраният от вас вариант го дразни.
Към по-близки хора често се обръщаме със съкратени варианти на имената, които същевременно звучат и по-мило. За приятели и роднини Борислав, Борислава и Боряна са Боби; Стефан е Стеф; Елица и Елена са Ели; Лиляна и Лилия са Лили; Мартин и Мартина са Марти; Антон, Антоанета и Антония са Тони. Вероятно съкратените форми се предпочитат, защото, първо, са по-кратки и второ, отразяват близостта в отношенията. Така или иначе, по този начин избягваме употребата на звателните форми.
Такова избягване се наблюдава при женските имена, които завършват на -ка, и според книжовната норма трябва да казваме Иванке, Йорданке, Здравке, Калинке. Вместо тях се предпочитат умалително-гальовните Ванче, Данче, Здравче, Калинче, които формално завършват на -е, но това е част от наставката -че, с която се образуват умалителни съществителни³, тоест формите са квазизвателни.
В действителност вече нямаме компактна подгрупа лични имена, в която звателните форми да се употребяват последователно. По-интересно от гледна точка на езиковата логика и развитие е не че тези форми отпадат, а поради какви причини толкова дълго са се задържали след разпадането на падежната система в нашия език.
Историята на езика е важна
Отпадането на звателните форми не е започнало вчера и дори не в началото на ХХ век, както смятат немалко езиковеди. Първите примери за употреба на форми за именителен падеж вместо звателен се срещат още в писмени паметници от края на Х и ХI век – Мариинското евангелие и Супрасълския сборник⁴. В по-късни ръкописи се откриват повече такива примери. Това развитие изглежда в съзвучие с общия развой от синтетизъм към аналитизъм в българския език, чиято най-ярка проява е разпадането на падежната система.
Оказва се обаче, че към звателния падеж трябва да подхождаме по-внимателно, защото той си е малко особен.
Че звателните форми не са падежни форми, се вижда и от факта, че те са отпаднали в някои от славянските езици, напр. руски, макар че в тях е налице запазена падежна система, както и обратното – те се пазят частично в езици като български например, в които падежните форми са изчезнали,
пише Руселина Ницолова⁵. Нейното мнение се споделя и от Петър Пашов6, а особеното естество на звателния в сравнение с останалите падежи се изтъква също от Александър Теодоров – Балан, Любомир Андрейчин и др. От друга страна, „звателният падеж има много общо с именителния“, както отбелязва Светомир Иванчев7, и тук е мястото да кажем, че в старобългарската именна система при много от имената звателните и именителните форми съвпадат, например при съществителните от среден род и в множествено число.
Илияна Гаравалова разглежда звателните форми в светлината на апелативната функция на езика (оказване на влияние върху събеседника, подтикване към действие и др.), като функциониращи в съвсем различна категория – вокатив. Употребата на съкратени (Марги, Краси) и умалителни варианти (Анче, Венче) като споменатите по-горе според нея са начин имената „да бъдат включени в българската звателна парадигма“. Това е интересно гледище и заслужава внимание, но лично аз съм скептична по отношение на „жизнеността и функционалността на т.нар. звателни форми“ и най-вече на перспективността им като цяло.
Според мен „класическите“ обръщения с окончание -е (Иване, Елице) са обречени на отмиране. Този процес може да продължи и десетилетия, и векове. Влиянието на чуждите езици (в миналото – на западноевропейските и руския, а днес – основно на английския), в които липсват аналогични форми, също не е за подценяване, но е важно да се знае, че отпадането на звателните форми е вътрешноезиков процес. Посоката му е ясна и необратима, колкото и да не се харесва на мнозина.
1 Граматика на съвременния български книжовен език. Т. 2. Морфология. София: Издателство на БАН, 1983, с. 114.
3 Граматика на съвременния български книжовен език…, с. 114.
4 Харалампиев, И. Историческа граматика на българския език. В. Търново: Фабер, 2001, с. 93, 97.
5 Ницолова, Р. Българска граматика. Морфология. София: Университетско издателство „Св. Климент Охридски“, 2008, с. 74.
6 Пашов, П. Практическа българска граматика. София: ДИ „Народна просвета“, 1989, с. 70.
7 Цит. по Харалампиев, И. Бъдещето на българския език от историческо гледище. В. Търново: Фабер, 2006, с. 155.
Езикът може да е вкусен и извън блюдото – онзи, българският език, на който говорим от малки и на който около 24 май се кълнем в обич. А той в същността си е средство за общуване и за да ни служи добре, непрекъснато се променя. Да го погледнем в неговата динамика и да се опитаме да разберем какво става и защо, кои са движещите механизми и как те са свързани с обществените процеси. И тъй като задачата не е лека, ще го правим постепенно – на порции.
To provide the best experiences, we use technologies like cookies to store and/or access device information. Consenting to these technologies will allow us to process data such as browsing behavior or unique IDs on this site. Not consenting or withdrawing consent, may adversely affect certain features and functions.
Functional
Always active
The technical storage or access is strictly necessary for the legitimate purpose of enabling the use of a specific service explicitly requested by the subscriber or user, or for the sole purpose of carrying out the transmission of a communication over an electronic communications network.
Preferences
The technical storage or access is necessary for the legitimate purpose of storing preferences that are not requested by the subscriber or user.
Statistics
The technical storage or access that is used exclusively for statistical purposes.The technical storage or access that is used exclusively for anonymous statistical purposes. Without a subpoena, voluntary compliance on the part of your Internet Service Provider, or additional records from a third party, information stored or retrieved for this purpose alone cannot usually be used to identify you.
Marketing
The technical storage or access is required to create user profiles to send advertising, or to track the user on a website or across several websites for similar marketing purposes.


 Nita Shah is an Analytics Specialist Solutions Architect at AWS based out of New York. She has been building data warehouse solutions for over 20 years and specializes in Amazon Redshift. She is focused on helping customers design and build enterprise-scale well-architected analytics and decision support platforms.
 Sushmita Barthakur is a Senior Data Solutions Architect at Amazon Web Services (AWS), supporting Strategic customers architect their data workloads on AWS. With a background in data analytics, she has extensive experience helping customers architect and build enterprise data lakes, ETL workloads, data warehouses and data analytics solutions, both on-premises and the cloud. Sushmita is based in Florida and enjoys traveling, reading and playing tennis.
 Jonathan Katz is a Principal Product Manager – Technical on the Amazon Redshift team and is based in New York. He is a Core Team member of the open source PostgreSQL project and an active open source contributor, including PostgreSQL and the pgvector project.


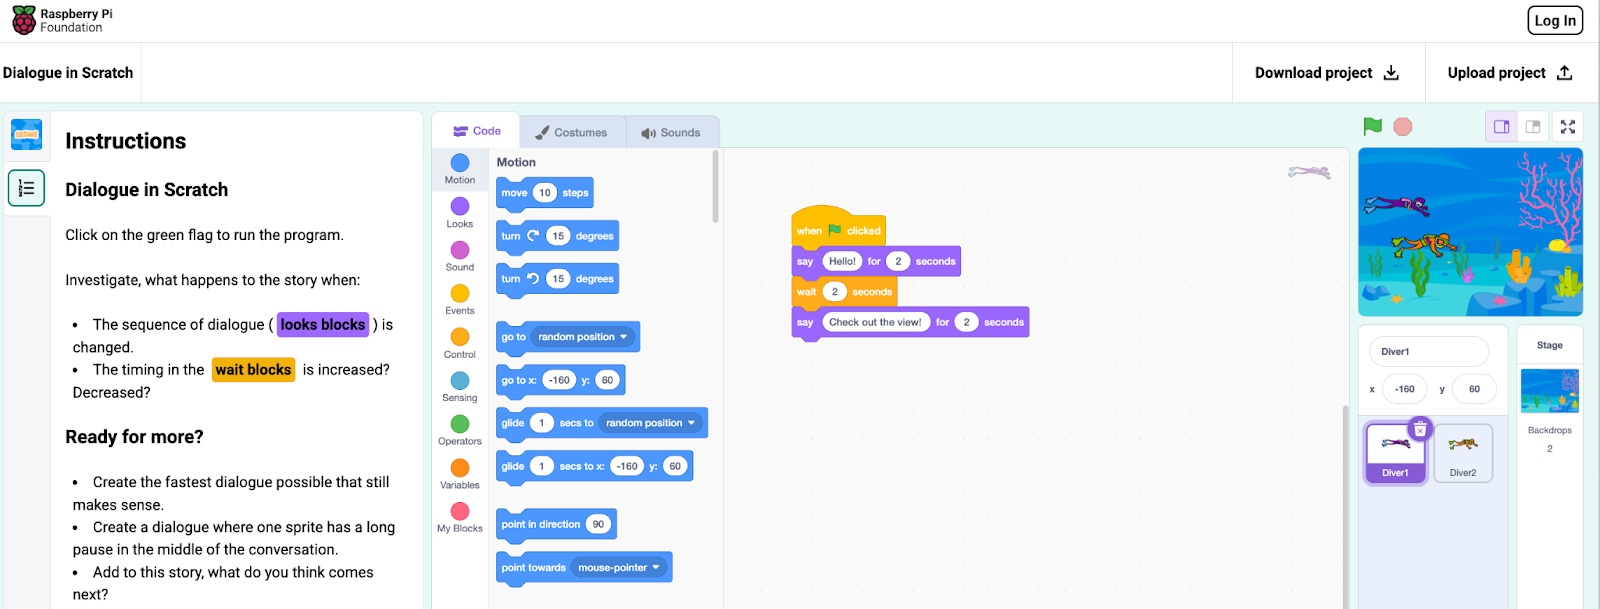


