Post Syndicated from The Atlantic original https://www.youtube.com/shorts/UmGPFMAhKqo
[$] An update on netkit and the use of BPF in user space
Post Syndicated from daroc original https://lwn.net/Articles/1083418/
Daniel Borkmann led a session at the 2026
Linux Filesystem, Memory-Management,
and BPF Summit about the progress that has been made with netkit, the subsystem
that allows virtual machines (VMs) running on Linux to perform networking efficiently.
When that did not fill the full time, he went on to discuss his idea for
using BPF to live-patch user-space applications. While netkit is making
progress, and can now support zero-copy receipt of packets into a VM in a
network namespace, the idea of using BPF for patching user-space programs
remains entirely speculative.
Home Assistant Device Database public preview
Post Syndicated from jzb original https://lwn.net/Articles/1084861/
The Open Home
Foundation, which governs the Home Assistant
home-automation project, has announced
the “public preview” of its Device
Database:
Providing a public, open way to browse the anonymous, aggregated
device data we collect was always part of the plan, and this preview
is our first step toward it.You can already use it to search and filter devices to see
aggregated community insights, starting with a deliberately focused
set of specifics, such as whether a device requires an internet
connection, and which protocols and integrations it works with. We’ve
kept that initial scope narrow on purpose, giving us a solid
foundation we can build on together with you, our community, as the
database grows.
LWN looked at Home
Assistant in May 2025.
Гласовете на Америка – брой 17
Post Syndicated from Йоанна Елми original https://www.toest.bg/glasovete-na-amerika-broy-17/

По Америка ще познаете света.
Президентът Тръмп даде сигнал, че е готов да задълбочи войната в Иран. Само преди месец писахме, че примирието между двете държави е подписано – днес това примирие не означава нищо, а още утре този бюлетин може би няма да е актуален. Политическото говорене на едро, заплахите, цинизмът и безсмислието са се превърнали в ежедневие. Министърът на войната Пийт Хегсет поиска 70 млрд. долара спешно военно финансиране след първите пет месеца от войната.
По Америка ще познаете света.
Гласовете на Америка – брой 16
Европа открива Америка – с ранч соса, UFC, Тръмп, войната с Иран и новата левица. Световното първенство по футбол се превръща в повод за въпроса коя е истинската Америка и кой има правото да я определя. От Йоанна Елми.
Хегсет обяви, че военните ще трябва да минават задължително изследване на нивата на тестостерон след 30-годишна възраст. Няма определени рамки какви нива на тестостерон ще се смятат за ниски, за да се изисква лечение – обичайно всяка лаборатория може да определя нива според методите си на изследване, което в допълнение се влияе и от препоръките на лекуващия лекар.
Решението на Хегсет идва в разгара на „тестостеронова мания“ в САЩ: рецептите за заместителна терапия с хормона са достигнали 12 млн. през 2025 г., ръст от 154% от 2020 г. насам. Онлайн клиники и търговци продават тестостерон като утвърдено лечение за мъже. Експерти обаче предупреждават, че по-високите нива на тестостерон нямат нищо общо с определени качества, които могат да направят един мъж „по-мъжествен“. Ако нивата на тестостерон по различни здравословни причини спаднат много под обичайните норми, последствията могат да бъдат умора, ниско либидо или загуба на мускулна маса, но при здрави мъже нивата на хормона нямат нищо общо с физическата сила.
Мъж с ниво на тестостерон около 700 нанограма на децилитър може да е точно толкова силен, колкото и мъж с 300 нанограма на децилитър. Нещо повече – нивата на тестостерон не са константа, а се променят в различните части на деня и според сезона, както и под влияние на други фактори. Терапията с тестостерон крие рискове: употребата на добавки може да понижи естествената способност на тялото да произвежда хормона, свивайки тестисите и намалявайки производството на сперматозоиди. Други ефекти са акне, оплешивяване и дори уголемяване на гърдите вследствие на преобразуването на част от приетия тестостерон в естроген.
Тестостеронът няма общо и с нивата на агресивност. Изследвания показват, че ако един мъж проявява агресия, причината обикновено е социална, а не хормонална. В проучване на 200 подрастващи момчета и родителите им екип, воден от Адам Станаланд, професор по психология в университета в Ричмънд, установява, че момчетата, реагиращи агресивно на стимули, които възприемат като „заплаха за мъжествеността“, са онези, които усещат силен социален натиск „да се държат като мъже“. Парадоксът е, че животът в армията – недостигът на сън, хроничният стрес, излагането на опасност и недоброто хранене, са изключително вредни за правилното функциониране на хормоните.
Всички тези научни факти обаче нямат значение във време, в което говорим за „криза на мъжествеността“ – с нея често се „борим“ с прояви на насилие и омраза към жени и към онези, които са приемани като „други“; с подлагане на хирургични интервенции в името на „по-мъжествено излъчване“; или чрез сформирането на групи и банди от вандали, често покрай бойни спортове.
По Америка ще познаете света.
Междувременно все повече жени в САЩ се тревожат какво ще се случи, ако имат дете, се посочва в статия в Women's Health. Жените посочват като основни притеснения здравния риск, следродилната депресия и пълното подчинение на майката на грижите за детето, както и финансовите трудности и състоянието на света като цяло.
В статията се казва още, че през неограничената информация в социалните мрежи хората често стигат до най-страшните истории за раждането, научават за възможно най-рисковите усложнения и чуват разкази на други родители, които изпитват съжаление, че имат деца, или се оплакват от липса на подкрепа от партньорите си. Експерти посочват, че повечето бременности в САЩ протичат без усложнения и че обществото трябва активно да работи в посока на подкрепа за майките.
Подкрепата за жените и майките не е сред трендовете в „мъжествените“ среди. Притесненията за демографията са.
По Америка ще познаете света.
Жителите на много държави по света вече гледат на Китай по-положително, отколкото на САЩ. Спадът в положителните възприятия започва около 2024 г., като в началото на втория мандат на президента Тръмп през 2025 г. 48% от отговорилите имат по-скоро добро отношение към Америка, а 38% – към Китай. Тази година числата са почти обърнати – 46% виждат Китай в по-добра светлина, а 36% избират САЩ.
На въпрос имат ли доверие, че държавата ще постъпи правилно по отношение на международната политика, положителното отношение към външнополитическото представяне на Китай е нараснало почти двойно от 2024 г. насам и е спаднало повече от двойно спрямо САЩ за същия период. Една от малкото сфери, в които САЩ все още държи висок рейтинг, е тази на свободните индивидуални права – повече хора отговарят, че САЩ уважават правата и свободите, което все още е обективна истина.
Фактът, че имам нужда да уточня „все още“, е показателен за състоянието на САЩ и на демократичния свят.
От една страна, бихме могли да кажем, че обръщането на САЩ към собствените им интереси би могло да става за сметка на други държави и на света като цяло, откъдето да идва негативното отношение към тях – това е и аргументът на много от консервативните симпатизанти на президента. Не съм съгласна обаче, че исторически САЩ никога не са гледали собствения си интерес; напротив, Америка е добре известна с арогантното си поведение на световната сцена.
В продължение на десетилетия обаче тя бе известна и с меката си дипломация, което направи от нея културен хегемон, а чрез културата рано или късно се печели всичко, както знаят добрите пропагандисти. Сега меката дипломация е заместена от друга пропаганда: на тестостерон, ритуален бой пред Белия дом и външна политика, характеризираща се с постоянството и деликатността на кисел попрезрял мъж (ако трябва да влезем в тона на (не)културния диалог).
Политиката на синтетичния тестостерон може да е много популярна сред определени сегменти от населението, но е абсурдна, смешна, глуповата и заради всичко това – дори ужасяваща за нормалните мислещи хора, които все още обитават средата между крайностите.
По-добрата позиция на Китай в общественото мнение надали се дължи на това, че изведнъж авторитарният комунизъм с капиталистически краски е станал атрактивна алтернатива на настоящия световен ред; в крайна сметка преди седмица книжари бяха извлачвани насилствено от книжарници в Хонг Конг.
Предопределени за война. Но не съвсем
Продължаваме поредицата на Искрен Иванов за Китай и за отношенията на далекоизточната страна с останалите Велики сили. Този текст разглежда накратко връзките между Китай и САЩ, както и въпроса кой ще е победител в една нова Студена война.
Китай по някакъв начин е алтернатива на вакуума, отворил се от разпадналата се американска култура, точно толкова, колкото животът в Русия е алтернатива за недоволния български русофил. Обратното – разочарованието и липсата на нормалност блъскат общественото мнение към символа на Си Дзинпин – световен лидер, който, въпреки че също е зодия Близнаци (както впрочем и Румен Радев), може да се задържи на едно мнение и решение от сутринта до вечерта.
„Стабилността“ е онова, по което копнее средностатистическият човек, който не се интересува от сложните плетки на политиката, а просто иска да живее нормално. Който разбира копнежа по „стабилност“, разбира политиката. А ако това са само авторитарните лидери и режими, вината не е само тяхна.
Както и да е, по Америка ще познаете света.
На 14 юли губернаторката на щата Ню Йорк подписа мораториум върху изграждането на центрове за данни, който ще е в сила една година. Целта е през това време да се изучават ефектите на вече построените центрове за данни, за да може да се помисли за определени регулации. Тревогите на опонентите на мораториума се въртят около икономическите последствия, тъй като се страхуват, че меморандумът ще отблъсне инвеститорите. Според критиците на меморандума хората трябва да бъдат оставени сами да преценят дали искат центрове за данни в общностите си, или не.
По-умерените становища гласят, че политиките спрямо центровете за данни се третират само в контекста на развитието на изкуствения интелект и протестите срещу т.нар. интелектуален бълвоч (slop) – нискокачественото масово генерирано съдържание, което често цели бърза печалба или кликове. Инстинктивният и разумен аргумент е: защо трябва да хабим ценни ресурси, какъвто е водата, и да тормозим общностите с шум и замърсяване, за да подхранваме нещо, което не само ни затъпява, но и ни коства работни места?
Повечето хора обаче разчитат на ресурсите, които такава технология предлага – тя е толкова добра или лоша, колкото е ползвателят ѝ. Дали мораториумът ще е ефективен, ще покаже само времето. Въпросът е, че за разлика от България, дори в САЩ в криза все още се прави политика на действието – вземат се мерки, ефектите от тях се анализират и все пак някъде нещо се движи.
Дебатът за прогреса (най-вече технологичен) за сметка на толкова много други неща тепърва ще бъде актуален. През последните дни кабинетът на Тръмп активно премахва природозащитно законодателство, което ще позволи добив на петрол и други суровини от понастоящем защитени държавни земи.
Идеята за краткотрайна печалба и неспирен прогрес все още пречи да помислим как да живеем устойчиво в един все по-топъл и бедстващ свят, както виждаме и в България. Технологиите биха могли да помогнат и в тази посока – въпросът е кой и за какво ще ги използва.
По това, за което говори (и се кара) Америка, ще познаете онова, за което трябва да говори светът. Западна Европа току-що отчете най-горещия си юни някога.
Има и други новини. Тексаски пожарникар спасява три деца, заклещени под лодка, навръх 4 юли – националния празник на САЩ. Биотех стартъп компания е разработила устойчиви на определени заболявания сортове американски кестен; дърводобивната индустрия е изключително важна за страната, но различни заболявания по дърветата през последните години са сред основните предизвикателства пред нея. Деформираният енот Джимъти от Сиатъл, за когото се грижат всякакви добри съседи, се превърна в интернет сензация.
И накрая – тази седмица изгледах документалния филм на More Perfect Union, който засяга идеята за изземането на ролята на държавата от корпорациите, опитващи се да създадат свои общности с изцяло приватизирани обществени услуги.
Предимствата на филма са, че показва какво се случва с либертариански, антидържавни и всякакви подобни идеи на практика – нещо, което видяхме в началото на мандата на Тръмп с DOGE, воден от Илън Мъск (този провал помните ли го?).
Гласовете на Америка – брой 1
В брой 1 от новия бюлетин на „Тоест“, който ще бъде воден от Йоанна Елми и ще излиза два пъти месечно, се разглеждат първите 100 дни от втория мандат на Тръмп. Абонирайте се за „Гласовете на Америка“.
Когато съвсем естественото напрежение между държава и частен сектор се доведе до крайност, имаме смяна на парадигмата. Въпросът е как ще изглежда тя.
По Америка ще познаете света.
Август е тих дори и в Щатите. В „Тоест“ със сигурност ще е такъв, а през септември се връщаме – наближават междинни избори. Шоуто никога не свършва.
Security updates for Friday
Post Syndicated from jzb original https://lwn.net/Articles/1084860/
Security updates have been issued by AlmaLinux (glibc, java-21-openjdk, kernel, and libpq), Debian (imagemagick, spice-vdagent, and webkit2gtk), Fedora (cryptlib, dotnet8.0, dotnet9.0, firefox, python-black, python-lsp-black, and python-pytokens), Mageia (apache, cifs-utils, dnsmasq, lrzip, and socat), Oracle (.NET 10.0, .NET 9.0, 389-ds-base, cups, edk2, fence-agents, firefox, freeipmi, freerdp, git-lfs, glib2, gnutls, golang, gstreamer1-plugins-bad-free, gstreamer1-plugins-good, gstreamer1-plugins-ugly-free, hplip, libinput, libvirt, libxml2, memcached, nginx, openexr, perl-DBI, perl-XML-LibXML, php, php8.4, plexus-utils, postgresql16, python3.12, python3.14, sssd, tomcat, tomcat9, unbound, vim, xorg-x11-server-Xwayland, yggdrasil, and yggdrasil-worker-package-manager), Red Hat (container-tools:rhel8, git-lfs, go-toolset:rhel8, golang, golang-github-openprinting-ipp-usb, grafana, grafana-pcp, host-metering, java-1.8.0-openjdk, java-11-openjdk with Extended Lifecycle Support, java-17-openjdk, java-21-openjdk, oci-seccomp-bpf-hook, rhc, rhc-worker-playbook, skopeo, xorg-x11-server, xorg-x11-server-Xwayland, and yggdrasil), Slackware (mozilla-thunderbird), SUSE (afterburn, alloy, apache-sshd, apache2, avahi, chromium, clamav, curl, dhcpcd, dnsmasq, docker-compose, ffmpeg-7, firefox-esr, gawk, glibc, gnutls, go1.26-openssl, google-osconfig-agent, gpg2, haproxy, ImageMagick, imagemagick, jline3, jq, kernel, libgcrypt, libgnt, meson, pidgin, nmap, nodejs24, pacemaker, patch, perl-HTML-Parser, perl-libwww-perl, perl-List-SomeUtils-XS, python-aiohttp, python-WebOb, qemu, rust-keylime, SVT-AV1, libyuv0, libaom3, trivy, ucode-intel, and wireshark), and Ubuntu (libhttp-date-perl, libxpm, linux-azure, linux-azure-fde, pam, and rsyslog).
Trebuchet!
Post Syndicated from The History Guy: History Deserves to Be Remembered original https://www.youtube.com/watch?v=er754qe9soE
Why AI Needs a “Genie Coefficient”
Post Syndicated from Bruce Schneier original https://www.schneier.com/blog/archives/2026/07/why-ai-needs-a-genie-coefficient.html
This essay was written with Barath Raghavan, and originally appeared in The Guardian.
Major benchmarks measure what AI can do. None measure whether it does what you mean: the distance between what you ask an AI to do and the unspoken assumptions about how you want the AI to do it. We propose a new metric: the Genie coefficient.
There’s often a gap between one person’s request and another’s understanding. Most of the time, we bridge it using general knowledge. For example, if you ask a friend to get you coffee, they’ll pour a cup from the pot or buy one from a coffee shop. They won’t bring you a bag of raw beans or snatch a cup from a stranger and hand it to you. You never specified any of this. You never had to.
One might think the fix is just to specify tasks, questions, and intent better. But in 1987, in their seminal book on AI, Terry Winograd and Fernando Flores succinctly captured why that won’t work: “Q: Is there any water in the refrigerator? A: Yes. Q: Where? I don’t see it. A: In the cells of the eggplant.” In human language, wants and desires are always underspecified. It is impossible to list all the caveats, all the limitations, all the exceptions.
So how does anyone communicate, if intent can’t be pinned down? Because a reasonable person can make a reasonable guess. Even though wants and desires are always underspecified, a competent person generally knows enough context to get it right or else knows to ask for clarification. Linguists call this pragmatics: Meaning lies in the words and the situation and also in all prior communication, shared culture, and innate human behavior.
It doesn’t always work out, of course. Your friend might bring you a hot coffee when you wanted an iced coffee, or an Italian coffee when you wanted a Turkish coffee. The more dissimilar the two people are in age, culture, and background, the more likely the request will be misunderstood in some way.
This situation has major implications for AI agents that are increasingly being given requests by humans and expected to fulfill them. They have enormous latitude to get it wrong. An AI agent asked for coffee might buy a coffee plantation or order a cup of coffee for delivery in three weeks. Its actions may be recognizable as “getting coffee,” but not remotely what you intended. They’ll think outside the box because they won’t have our conception of the box.
When AI Gets Proactive
For most of the last decade, when systems like Alexa or Siri misinterpreted a request, it was annoying, not dangerous. Beyond the AI model itself, what has changed is the harness: the ordinary code that wraps around an AI model, decides when and how to use the model, and controls access to tools like a browser, a low-level command line, or a financial API. Developments in harnesses have turned large-language models that just predict text into AI agents that take actions in the world, without necessarily checking back in before reaching the goal.
AI researcher Simon Willison spent two days with Anthropic’s Fable AI, and called it “relentlessly proactive.” For example, he asked it to track down a stray scroll bar in a web app. He came back to find it had opened browsers, written its own screenshot tooling, created its own page to re-create the bug, and stood up a local web server to collect measurements. It found the bug and, along the way, did many surprising things he never asked it to do. And we are seeing similar behavior with all recent AI models when combined with flexible harnesses.
This kind of behavior could easily go off the rails. Tell an AI agent to book you a flight and, finding the airline’s site says sold out, it might break into the booking database and force a reservation. Ask it to schedule a meeting and it might snoop your password to access your calendar. Tell it to save money on your phone plan and it might cancel the plan outright, or scam someone else into paying the bill.
Getting precisely what you asked for and bitterly regretting it is one of the oldest hazards from ancient folklore. King Midas asked Dionysus for the power to turn everything he touched into gold only to see his bread, wine, and daughter turn to gold. Tithonus, granted the immortality his lover asked for but not the eternal youth she forgot to request, withered into a husk. The sorcerer’s apprentice enchanted a broom to fill the cistern, and the broom relentlessly complied until it flooded the house. The Golem of Prague, shaped from clay to guard its community, guarded it past all reason until someone erased the word on its forehead.
The most classic of these is a genie, bound to obey and indifferent to whether the wish was wise or well-structured.
Genies are now an engineering problem. We are handing them the keys to our inboxes, bank accounts, code repositories, and physical infrastructure. And we have no agreed-upon ways to measure how genie-like any AI system actually is.
Measuring Genie Behavior
In economics, the Gini coefficient (developed by statistician Corrado Gini) is a measure of the gap between an actual distribution and a perfectly equal one; it’s useful for understanding income inequality and more. Our proposed Genie coefficient measures the gap between what a user asked an AI to do and what the AI actually did.
Sometimes the AI might do the wrong thing. Like Dionysus, it reads your request literally and returns you a mess you never intended: like a coffee plantation instead of a cup. Asked to deal with all the spam phone calls you’re getting, a Dionysus genie might contact your carrier and change your phone number. Asked to get a refund for a bad toaster, it might draft a legal threat on fake letterhead and send it to the retailer.
Other times the AI does exactly the right thing, trampling everything nearby to get there. Like a golem or the sorcerer’s broom, it books your flight by hacking the airline. Or consider a ticket sale for a popular concert, where the ticketing system puts buyers into a virtual waiting room and admits them a few at a time. Asked to buy a ticket, a golem genie might spin up cloud servers to pose as millions of buyers from different addresses, improving your odds of getting a ticket while crowding out other users.
The two are not opposites, and a single botched task can have both characteristics.
Genie behavior is not flat-out failure. If you ask the AI for Q3 numbers and get Q2’s, that’s not a genie. Nor is prompt injection: That’s someone tricking the AI into doing something it shouldn’t. Here, the user is trying to work with the AI, and the AI is trying to comply. It’s also not simply a measure of the AI’s success in fulfilling a task. It’s a recognition that how an AI interprets and achieves a goal is as important as whether it achieves a goal.
Genie behavior isn’t new. Researchers have spent years studying AI systems that “game” their objectives. Goodhart’s law says that when a measure becomes a target, it stops being a good measure, and it’s long been known that AIs sometimes achieve goals in ways we don’t expect due to reward hacking. Some AI models will accidentally learn that cheating is one way to “win.” More recently, researchers have developing benchmarks for reward hacking in coding agents and for unpredictable behavior in customer support agents, while AI labs conduct their own safety evaluations before model releases. One effort found that AIs under pressure use tools they were told not to use, and this was a case where the rules were made explicit. These are all disparate research directions; nothing yet ties them together.
This problem falls under the general theme of alignment, a topic that has occupied science fiction writers and AI researchers for decades. At one extreme, the “paper-clip maximizer” thought experiment postulates a superintelligent and powerful AI that is told to maximize paper-clip production and turns the world into paper clips, which is the ultimate golem genie. At a mundane level, AI researchers are working to better design reward functions to ensure that AIs behave well and don’t cheat in the lab. It’s the practical middle ground that remains unbenchmarked: the ordinary AI agent in use today that might take your request and satisfy it the wrong way. We are not at the stage where an AI can focus the world’s production on paper clips, but it might charge a million paper clips to your credit card or hack into a paper-clip company’s network.
Building a Genie Benchmark
The Genie coefficient is meant for AI agents operating in the real world. It measures their behavior as they perform real tasks long after the model is trained, not just during development. It also recognizes that genie-like behavior is a property of the harness-plus-model system, not the model alone. The harness determines what tools the agent can use, how much autonomy it has, and how proactive it is, and it’s a place we can make real interventions.
It rests on the same “reasonable person” standard that we use for people. Did the system do what a reasonable person would have taken the request to mean? Answering that requires human judgment.
If we get the measurement right, it enables things that aren’t possible today, like policies concerning AI behavior. In a courtroom, the concept of mens rea, what someone meant to do, is often as important as what they did. The Genie coefficient suggests an AI analogue, where a user is accountable for the plain intent of what they asked the AI. If an AI system betrays the reasonable meaning of an instruction, that’s the AI’s misbehavior, not the user’s.
We’ll need multiple benchmarks to measure the Genie coefficient, because genie-like behavior can be domain specific. An AI coding agent may need to be judged on how often it fakes the tests, or swallows errors, or colors outside the lines on its way to a solution. An AI legal agent will need to be judged on how often its output says what you asked but means something you’ll regret. And so on for medical, finance, and other domains of knowledge and expertise.
Genie benchmarks can be built inside out, each task seeded with a choice that might literally satisfy but that a reasonable person rejects, such as tempting misreadings or unsanctioned shortcuts. The traps in a Genie coefficient benchmark might turn on situational knowledge, the kind of context that a reasonable person would bring to the task. Another approach is to give the same request in several different contexts, each with a different reasonable course of action.
A Genie benchmark should be permissive and make it genuinely tempting for an AI agent to take unreasonable shortcuts, because it can only find genie behavior when it’s actually possible. Test the AI in a safe, walled-off copy of a real system, with real tools it can misuse and some tasks that can’t be done honestly at all. Make the temptation to cut corners real. Test a diverse array of skills, use cases, and tools, and give the AI system sparse, confusing, or overwhelming context. Include tasks that people have learned, through experience, require human oversight.
How the benchmark is scored matters just as much. Measure Dionysus and golem genies separately and together, based on their worst, not best, behavior. Run the same model inside harnesses that vary its freedom to act, revealing which limits actually keep it in line and should therefore be required in AI harness policies. Weight each failure by the harm it would cause, not just a simple count. And don’t measure genie behavior in isolation: A model could otherwise earn a perfect score by stalling, refusing, or drowning the user in clarifying questions without ever doing the job. The first versions of these benchmarks will be crude, but that’s how benchmarks always start.
We have built genies. We have handed them our data and credentials. We made them relentless, creative, and indifferent to the gap between what we tell them and what we mean. The least we can do, before they are booking our flights, running our infrastructure, and signing contracts unsupervised, is to measure how often they betray us.
Още една тухла в стената
Post Syndicated from Емилия Милчева original https://www.toest.bg/oshte-edna-tuhla-v-stenata/
Защо този човек не ни пусна?

Петгодишният Елиас задава въпроса на майка си, след като двамата са спрени още на входа на басейн в Луковит. Обяснението е, че местата са запълнени, но докато стоят отвън, други хора продължават да влизат и излизат. Майката Ирена е убедена, че причината е ромският им произход и по-тъмната кожа. По-късно пред друг басейн детето се разплаква от страх, че отново няма да бъде допуснато. Ирена подава жалба до Комисията за защита от дискриминация, а организацията Romalo, разказала за случая, не получава отговор от собствениците на басейна.
Искате ли децата ви да учат заедно с ромски деца?
Може ли една община така да определя правилата за прием, че ромските деца да учат в едни училища, а всички останали – в други? В България сегрегацията съществува от десетилетия. Но едва сега Комисията за защита от дискриминация го признава. От Емилия Милчева.
Елиас вече е научил един от първите уроци на сегрегацията – че има места, до които може да не бъде допуснат заради това как изглежда. Децата от другата страна на входа също научават, че разделянето на хората по етнически признак е нещо обичайно, което не изисква нито обяснение, нито възражение. Така предразсъдъците се възпроизвеждат по-лесно.
Същият механизъм действа и в образованието. Когато ромските и българските деца растат и учат отделно, едните губят достъп до по-добра езикова и образователна среда, а другите – възможността да познават свои връстници извън наследените стереотипи.
Именно в училище започват да се натрупват последиците от това разделение. Те не се изчерпват с различните сгради или квартали. Сегрегацията влияе върху езиковото развитие на децата, върху очакванията от тях, върху качеството на преподаването и в крайна сметка – върху шансовете им за образование и професионална и житейска реализация. Това са процеси, които се наслагват и трудно могат да бъдат преодолени по-късно.
Разговорът с експерта Огнян Исаев от „Тръст за социална алтернатива“ очертава четири от най-важните препятствия пред децата в сегрегираните училища: езиковата бариера, ниските очаквания от учениците, неподготвеността на системата да работи в многоезична среда и липсата на последователна държавна политика за десегрегация.
Българският език – първата бариера
Първата бариера често се оказва езикът. Много ромски и турски деца тръгват на училище с желанието да учат, но още от първия учебен ден трябва същевременно да усвояват нов език, защото българският не им е майчин, и нови знания чрез него. Ако тази разлика не бъде преодоляна навреме, тя започва да се натрупва година след година.
„Езиковата компетентност има няколко измерения – казва Огнян Исаев. – Първото е чисто комуникативното: да можеш да си поръчаш вода, кафе, да попиташ къде е тоалетната… След това идва функционалното ниво – да владееш езика дотолкова, че да учиш чрез него, да разбираш понятията. И чак накрая – да можеш да възпроизвеждаш знания чрез езика.“
Тоест не става дума само да говориш български, а да можеш да мислиш, да разбираш и да учиш чрез него. Детето може спокойно да разговаря с приятелите си на български, но да не разбира условието на задачата по математика или текста в учебника по природни науки. Така то започва да изостава не защото няма способности, а защото още не владее добре езика, на който се преподава.
Ако не можеш да нахраниш детето си
Как и защо в масовия случай децата, попаднали в институции, са от ромски произход? По приблизителни оценки те са между 60 и 70%, въпреки че ромите съставляват малко над 10% от населението. Надежда Цекулова разказва за проблема.
„До 2020–2021 г. този проблем изобщо не беше в радара на МОН и ние положихме доста усилия, за да влезе“, казва Исаев. Учителите се подготвят да преподават на деца, които вече владеят български език, а не на такива, за които е втори. Когато след войната в Украйна в училищата влязоха хиляди украински деца, проблемът, че системата ни не може да интегрира никого, стана видим. Трудности срещат и децата от български произход, които се завръщат от чужбина.
Според Исаев езиковата подкрепа не може да се изчерпва с часовете по български език. Тя трябва да присъства във всеки предмет, защото всяка нова дума в учебника по история, биология или математика е едновременно езиково и учебно предизвикателство. А когато тази подкрепа липсва, всяка следваща учебна година увеличава изоставането.
Проблем е отношението към майчиния език на детето. Вместо да бъде възприеман като езиков капитал, ромският или турският в повечето случаи се разглеждат като пречка. Ако някой каже „български като втори език“, националисти инструментализират проблема с цел политически дивиденти.
Изследвайки образователния процес на децата от ромски произход в Европа и в България в периода 1945–1990 г., проф. Христо Кючуков пише, че през 50-те и 60-те години на миналия век сегрегираните училища ограмотяват децата на официалните езици на страните, където живеят, и „подпомагат установяване на своеобразна международна ромска интелигенция“. Но той отбелязва и че започват процеси на насилствена асимилация в Европа, а и в България.
За ромските деца няма часове по ромски език като майчин, както това е осигурено за децата от други малцинства. В България до 1972 г. турските и арменските деца са имали право да изучават майчиния си език по 4 часа седмично… Вестниците на ромски език, ромският театър, открит през 50-те години, са закрити през 60-те.
В първите години след демократичните промени обаче Кючуков е поканен в МОН, за да разработи всичко необходимо за въвеждането на ромския език като майчин в българската училищна система. През 1993 г. е публикуван ромски буквар в 100 000 екземпляра. По това време, по данни на проф. Кючуков, общият брой на ромските деца от I до VIII клас в българските училища е бил 123 000 (сега всички деца, родени в България през изминалата година, са повече от два пъти по-малко). Близо 10 000 от тях са изучавали ромски език.
Докато двуезичието обаче се възприема като проблем, а не като ресурс, българското образование ще продължава да губи част от потенциала на децата от етносите.
„Да танцуват и играят – повече не могат“
Езиковите бариери са началото. След тях идва друг, много по-трудно преодолим проблем – ниските очаквания, не само на учителите, но и на самите деца.
Изкарали сме ниски оценки – ами изкарали сме толкова, толкова си можем. Има я и стигмата върху самите учители – това са циганските учители, циганското училище и така нататък. И учителите, и директорите интернализират това, а през тях и децата: „Могат да танцуват и играят, повече не могат.“
Така Огнян Исаев описва нагласата, която често се изгражда у ромските ученици още в началното училище. Те отрано разбират какво се очаква от тях – не да кандидатстват в езикови гимназии, да станат лекари, юристи, инженери, а най-много да покажат талант в песните и танците на училищния празник.
Тези очаквания рядко се изричат директно. Те личат в примирението със слабите резултати от националното външно оценяване (НВО) – последици от сегрегацията.
В училищата, в които учат предимно ромски деца, средният резултат на НВО в VII клас е едва между 9 и 12 точки по математика и между 10 и 15 точки по български език и литература от максимални 100 точки. За сравнение, средните резултати за страната са около 40 точки по математика и около 50 по български език.
НВО: Endgame
НВО приключи, но не и разговорът за провала на системата. МОН, разбира се, отчита „устойчиви резултати“, но данните сочат друго – срив по математика, хаотични промени в изпитите и липса на отговорност. Цената плащат учениците, а родителите отдавна доплащат. Коментар на Донка Дойчева-Попова.
Сходна картина показва и международното изследване PISA. Учениците от семейства с по-нисък социално-икономически статус изостават средно с две до три години в знанията и уменията си по математика, природни науки и функционална грамотност спрямо своите връстници.
Според Огнян Исаев обаче тези данни често се тълкуват погрешно. Самото понятие „социално-икономически статус“ не означава само ниски доходи. То включва и фактори като образованието на родителите, езиковата среда у дома и достъпа до културни ресурси. „Децата не изостават заради майчиния си език или заради своя етнос – подчертава той. – Те тръгват на училище с различен социален и културен капитал.“
Този капитал не се измерва само с пари. Той включва книгите вкъщи, разговорите с родителите, това дали детето чува български език всеки ден, дали има човек, който да му помогне с домашните, дали вижда хора като себе си в учебниците и в училищната среда. Именно тези натрупани предимства или липсата им започват да влияят още преди първия учебен ден.
Детето постепенно започва да вижда себе си през очите на възрастните. Ако никой не очаква от него високи резултати, след време и то самото престава да ги очаква.
Според Исаев това е една от най-тежките последици на сегрегацията. Тя не само ограничава достъпа до качествено образование, но и стеснява хоризонта на възможното. Когато около едно дете няма хора с висше образование, лекари, адвокати, инженери или предприемачи, то трудно може да си представи, че самото то би могло да стане такова. Мечтите му не изчезват изведнъж – те просто постепенно се смаляват.
Сегрегацията надживя Прехода
Огнян Исаев разказва, че в Югославия например съхранението и развитието на етническата идентичност е било позволено – издавали са се книги на ромски език, песни, така просперира например известният Шабан Байрамович.
В първите години след демократичните промени обаче има някакво развитие по темата за ромското образование. След 1989 г. известният като Мануш Романов, но роден като Мустафа Алиев основател на Демократичен съюз „Рома“ е избран за депутат във Великото народно събрание и е един от 39-мата, които не подписват новата Конституция. Романов, режисьор и фолклорист, настоява училищата в гетата да бъдат закрити въпреки възраженията на ромите.
„Казвал е, че няма значение, че ромските родители ги искат тези училища; само и само да угодим на ромските родители, не трябва да осакатяваме децата“, обяснява Исаев. По думите му родителите често използват аргументи като „то ни е близо, то ни е в махалата, къде ще ходи сега“, а и някои от тях се страхуват, че детето им ще бъде подложено на тормоз и насилие, ако бъде записано в училище извън махалата.
Те на първо място слагат сигурността на детето, но не виждат, че го лишават от базова възможност да се социализира и да върви напред заедно с връстниците си. Макар че познавам няколко случая на роми, мигрирали в чужбина, защото децата им са били тормозени. Един от тях ми разказа, че в момента в класа на сина му имало деца от различни страни и раси и това никого не впечатлявало,
разказва експертът от „Тръст за социална алтернатива“.
В годините на Прехода първите опити за десегрегация идват не от държавата, а от граждански организации с подкрепата на Фондация „Отворено общество“. Началото е поставено във Видин, където деца от квартал „Нов път“ започват да учат в училища в града, като получават транспорт и допълнителна подкрепа, за да наваксат пропуските си. Моделът по-късно е приложен и в Стара Загора, Пазарджик, Пловдив, Плевен и други градове и доказва, че работи. В навечерието на Десетилетието на ромското включване държавата създава към МОН Център за образователна интеграция на децата и учениците от етническите малцинства, но така и не превръща десегрегацията в последователна национална политика.
Според Огнян Исаев една от причините е, че десегрегацията не е възприета като дългосрочен процес, а постиженията са плод на ентусиазма и усилията на неправителствени организации и активисти. Много от сегрегираните училища са сред най-големите в страната – с по над 1000 ученици и съответно с най-големи бюджети. „Не можеш просто да преместиш 1000 деца в училища в центъра на града“, казва той.
Решението не е само в транспорта, а и в повишаването на качеството на образованието в тези училища, така че те да станат привлекателни и за деца извън квартала.
Готово ли е Просветното министерство да се промени за различните деца, да обучава на емпатия учителите, за да приемат различната култура – или се съпротивлява?
Майчиният език, етносът, мястото, където живееш, не са неща, които децата избират, но въпреки това са наказвани заради тях.
Според Огнян Исаев промяната няма да дойде само с преместването на деца от едно училище в друго. Тя изисква различна подготовка на учителите, повече езикова подкрепа, повече емпатия към различните култури и готовност училището да се променя според нуждите на учениците, а не учениците да бъдат принуждавани да се нагодят към една система, която не ги вижда. Именно с тази идея организацията му е обучила над 1000 учители по програмата „Заедно в пъстър свят!“, разработена след войните в бивша Югославия за работа в мултикултурна среда.
Сегрегацията не започва с отказа на входа на басейна и не свършва с ниските резултати на матурите. Тя започва с очакванията, които обществото има от едно дете, още преди да е прекрачило училищния праг. И ще продължи, докато образователната система приема различието като проблем.
„Карлови Вари 2026“: Животи, любови, смисли
Post Syndicated from Нева Мичева original https://www.toest.bg/karlovi-vari-2026-zhivoti-lyubovi-smisli/

„Живот“, „любов“ и „смисъл“, казват някои, нямат форма за множествено число в българския език и всеки, който ги рони и брои, принизява Живота, Любовта и Смисъла. Тях не закачаме, отговаряме други, тях оставяме за Човека и Всемира. Което обаче не пречи да отчитаме факта, че Животът, Любовта и Смисълът имат толкова частни изражения, колкото са възможните (съчетания от) хора, епохи и култури. Та стига окрупняване – има нещо текезесарско в него, нещо униформено и строево.
Един кинофестивал, където целият свят идва да разказва за преживяванията си (често колкото по-специфични, толкова по-универсални), е идеалното място за припомняне на екзистенциалната пъстрота. И след като в предишния материал от Карлови Вари споменах за скептичното си отношение към дванайсетте тазгодишни претенденти за Кристалния глобус, днес идвам да изкажа възхита от дузина творби от програмата за 2026-та, в които животи, любови и смисли триумфално се множат и процъфтяват на екрана и в умовете на зрителите след прожекцията.
По-долу ще прочетете за насилие, болест, смърт, самота и стигми, но – благодарение на своята славна направа – филмите, в които става дума за всичко това, са способни да издърпат персонажите и зрителите си изпод валяка на бита и над повърхността на тъгата, да възвърнат богатството на оттенъците, да подпрат олюляващия се хоризонт и да ваксинират с надежда.


Кадри от „Гальовник, не бунтовник“, реж. Мартина Бухелова, и от „Почти цял човек“ на Ефтимис Косемунд-Санидис
Наградените в „Проксима“
От филмите, включени в „Проксима“ (втория състезателен раздел на карловарската програма), сва̀рих да гледам едва половината. Но ето че два от тях мощно ми върнаха вярата и в изкуството, и в себеподобните: „Почти цял човек“ на Ефтимис Косемунд-Санидис и Lover, not a Fighter на Мартина Бухелова (за целите на материала ще го наричам „Гальовник, не бунтовник“, вдъхновена от култовата книга на Ромен Гари и оригиналното заглавие Milovník, nie bojovník). Първият (копродукция с България) справедливо беше отличен за режисурата си, а вторият получи голямата награда на „Проксима“. И двата са уверени пълнометражни дебюти, и двата – за любов. Стратегията и поезията им обаче е твърде различна.
„От нас двамата сега ще стане цял човек… почти“, казва Калиопи, една от героините на Косемунд-Санидис, когато двамата с Илиас, главния герой, изгубили контрол над половината от телата си, започват да правят любов. Илиас е пристигнал неотдавна на острова (разбира се, че е остров, когато е Гърция и всичко започва на корабна палуба), за да предяви правата си на наследник. Наследството се оказва не каквото е очаквал; негодуванието му към наскоро починалия почти непознат баща се трансформира в интуитивно разбиране; островът с тучната си, звучна, напираща природа похищава стъпилите на него и ги препъва и премащабира. Болестта, видяна като органична част от живота, както и опияняващият ритъм на ставащото, което ни най-малко не се старае да се обясни на зрителите, камо ли пък да им се хареса, са част от многото достойнства на този труден за обобщаване разказ. Свръхблизки планове, Шубертово импромптю, женски хор от оплаквачки, мъжки „хор“ от техници в битка със странностите на местното електричество, непредвидим диалог и темпо, вдъхновено (по думите на автора) от „Уморените коне ги убиват, нали?“… Приключение на края на света.
„Гальовник, не бунтовник“ с радост бих сложила до „Преди изгрева“ на Линклейтър – малко бижу, което ще се съхрани през десетилетията. Жалко само, че един словашки филм никога няма да получи отзвука на каквото и да било от същия калибър от Щатите. Комичен, сърдечен и забележително умел в подбора и подредбата на детайлите, той е за двама влюбени на изхода от юношеството, все още по детски пластични и нежни. Андрей и Миша са първи приятели и добри хора, които опитват да се разберат – сами себе си и помежду си. Фонът е обикновен словашки квартал; второстепенните герои са първокласно очертани (от бабата на Андрей до морското свинче на братовчед му), а там, където би могло да стане грозно, авторката тъче изящно със загатвания и елипси. В „Преди изгрева“, в който двама млади хора се срещат във влака, слизат във Виена и цяла нощ си говорят по улиците ѝ, момичето казваше: „Мисля, че ако има някакъв Бог, то той не е нито в теб, нито в мен, а в ей това малко пространство помежду ни. И ако има някаква магия в този свят, то тя сигурно е в опита ни да разберем някого, който споделя…“ В „Гальовник, не бунтовник“ Бог и магията са щедро налични.


Говорещите снимки от „Ако гълъбите се превърнеха в злато“ / Кадър от документалния филм „Нашата земя“ на Лукресия Мартел
Документалните
„Ако гълъбите станат златни“ е също първи филм, но в Карлови Вари дойде вече с две награди от последното „Берлинале“. Авторката му – Пепа Лубояцки от Прага (която твърди, че не се е стремила към киното и плановете ѝ са романови), прави обзор на травмата на семейството си със собствения си глас, видеоматериали от последните години, домашен архив и малко ИИ анимация: алкохолизъм, хронично насилие, редувано с отсъствие, опити за спасение, безсилие. „Били ли сте някога в траур по още жив човек?“, пита. Разказът ѝ се върти около по-големия ѝ брат Давид, с отбивки към двама от братовчедите им – всички зависими и живеещи на улицата („гълъбите“ от заглавието, към които рядко някой поглежда с добро). Да, но благодарение на френетичното темпо, чувството за хумор и неугасващото детинско обожание на Пепа към батковците ѝ, от тези дадености някак се е получило не опело, а ярко изригване на човеколюбие. Това е spoken word в екранна форма и в него има колкото информация и болка, толкова и бунт и наслада.
В два часа разговори със засегнати и специалисти и посещения в съдебната зала „Нашата земя“ на Лукресия Мартел представя казуса „Чокобар“. През 2009 г. невъоръженият 68-годишен Хавиер Чокобар е застрелян от трима бели мъже в спор за мъничкото земя, останала на племето му чусчагаста. Това е пореден епизод от агресията на пришълците от Европа в Аржентина спрямо местното население (сведено в момента до има-няма 3% от цялото): отначало директно изтребление, а после системно изтласкване и заглушаване. „В мига, в който се съгласим на диалог, вече губим“, казва един от „индианците“ – смразяващо твърдение: изходните позиции на белите и коренните жители са толкова различни, че равнопоставеното общуване е невъзможно. Материалът, с който борави Мартел, е суховат за преглъщане, но тя вещо го прави разбираем дори за най-незапознатите.
(Съжалявам, че не успях да гледам спечелилия наградата на публиката „Бара Базикова: 50 години от живота на една жена“ на Хелена Тршещикова, солидна документалистка, която познаваме от „София Филм Фест“ и Master of Art – вж. „Форман срещу Форман“. Бара е любима на чешката публика рок певица с красив глас и несъмнено интересна съдба.)

Кадри от индонезийския „Дух в килията“ и от „Долината на усмивките“ на Паоло Стриполи
Полунощните
На чешки „ужасен“ (úžasný) е „чудесен“ и описва „Дух в килията“ на Джоко Ануар точно толкова добре, колкото и в българското си значение. Сценаристът, режисьор и монтажист Ануар е на 50 години, има 12 филма и 5 от тях са на ужасите, като „Дух в килията“ е първата му хорър комедия. Премиерата ѝ беше в Берлин, а правата за разпространението ѝ са откупени за 86 страни – дано нашата е една от тях. Действието се развива в Индонезия – страна с огромно население, площ и културно разнообразие, проядена от корупция. Млад журналист, който току-що е ходил на своя глава да отрази престъпното изсичане на поредната вековна гора, неволно донася оттам в редакцията един сърдит дух, изгубил дома си, който – както става ясно съвсем скоро – налита по най-кървавия начин на най-гневния човек в околностите. Когато журналистът по погрешка попада в затвора сред много, ама много гневни мъже, нещата стават наистина страшни… и на места неистово смешни.
Джоко Ануар в беседа за киното на ужасите като форма на критика на властта и политически отпор (и много друго)
„Дух в килията“ беше част от малката подборка жанрово кино Afterhours, предназначена за късните часове на фестивала. Ще ми се да спомена още две от заглавията в нея. В „Долината на усмивките“ на Паоло Стриполи (приличен хорър опит, при все клишетата и сценарните шупли) в планинско селце едно момче с прегръдка лекува скръбта. Местните жители са пристрастени към обятията му, а драматичният обрат идва с проумяването, че способността му е по-скоро демонична, отколкото ангелска: „… той премахва мъката, но така унищожава Бог… защото Бог е в мъката.“ А в „Джим Куийн“, анимационна приумица на Никола Атан и Марко Нгуен, епидемия от „хетероза“ превръща парижките гей мъже в хетеросексуални – тук шегите не са възможно най-изобретателните, но доста ефикасно се илюстрира смущаващата привързаност на повечето от нас към опаковката (не към съдържанието) на нещата.


Една от началните сцени в „Страхливец“ на Люкас Донт / Квадратното слънце във „Всеки път“ / Хавиер Бардем и Виктория Луенго в „Любимо същество“
„Канските“
Тази година в деветте си дни и десетте си раздела карловарският фестивал представи над 130 пълнометражни произведения, та е важно да уточним, че всеки репортаж от мястото включва само порция от заложеното от организаторите. И то допълнително ограничена от личния вкус и случайността. Ако например бях успяла да се преборя с тълпящите се колеги от пресата за достъп до „Фиорд“ на Кристиян Мунджиу („Златна палма“ 2026) или да стигна навреме за „Жълти писма“ на Илкер Чатак („Златна мечка“ 2026), ако не бях гледала още на „София Филм Фест“ възхитителния „Мълчаливият приятел“ на Илдико Енеди (с награди от миналогодишната Венеция), сега непременно щях да пиша и за тях. Но тъй като стана другояче, по-долу следват възторзи за ето тази троица от последния Кан…
Ще се преструвате, че сте били мъже, а не деца, и вашите роли във филмите ще се изпълняват от Франк Синатра или Джон Уейн, или други очарователни войнолюбиви дърти мръсници. И войната ще изглежда просто чудесна, и затова ще имаме още много войни. И в тях ще се бият деца като децата на горния етаж…
Тези яростни думи на една майка в самото начало на „Кланица 5, или кръстоносният поход на децата“ (Кърт Вонегът, прев. Владимир Филипов) сякаш са чути и осъзнати с болезнена яснота от Люкас Донт („Момиче“, „Близо“), който в третия си филм „Страхливец“ изнася извън кадър командващите (и въобще възрастните), йерархиите, битките и типично екранния героизъм, за да се съсредоточи в един мъничък фрагмент от задкулисието на Първата световна, в детинските лица на момчетата, хвърлени в ада от „войнолюбиви дърти мръсници“, и в техните лични перипетии. Резултатът е безумно красив за гледане и вълнуващ за съпреживяване, а Донт е майстор: излизам от прожекцията и под клепачите ми е не епична батална сцена, а наситеният миг, в който главният герой затваря очи и си представя отрупано с ябълки дърво.
И още: „Всеки път“ на Зандра Волнер (победител в раздела „Особен поглед“) е история за нелепа злополука и чувство на вина, която съумява да предаде пищящия ужас от внезапната загуба на близък чрез едно меко, поетично, освобождаващо полудяване. А новото от разказваческия тандем Родриго Сорогойен и Исабел Пеня („Добичета“) е забележителен танц със саби между две силни личности, в който баща (фамозен режисьор) се опитва да привлече отдавна изоставената си дъщеря (не съвсем сполучила актриса) за новото си начинание. Да, по описание „Любимо същество“ доста прилича на „Сантиментална стойност“ на Йоаким Триер, но историята е по-стегната и отива другаде, а образите на Хавиер Бардем и Вики Луенго са по-интересни от тези на Стелан Скарсгард и Ренате Рейнсве. И макар на първо гледане двамата да приличат на тежък нарцисист и свита жертва, те постепенно се изпълват с нюанси, тоест с живот.
Към свободата
„Различията си приемаха с нежност“, казва глас зад кадър в „Жюл и Жим“ (1962), прочутия филм на Трюфо, в който двама приятели и магнетична млада жена образуват любовен триъгълник, изпълнен с приповдигната веселост и обречен на драматично разпадане. Същата е и постановката в „Птици, сираци и безумци“ (1969) – трима се срещат в развалините на неназована война и се щурат заедно до трагичната развръзка (думите са по-малко, гротеската – повече и сравненията обикновено вървят по линията Фелини и Ходоровски). Веднага след премиерата си филмът е „арестуван“ (реабилитацията идва 20 години по-късно), а на автора – словака Юрай Якубиско, е забранено да прави пълнометражно кино чак до 80-те.
Хаотичен, претенциозен („Щастието е бяла къща…“) и на места неволно жесток към хора и животни, „Птици, сираци и безумци“ е спорно велик, но безспорно любопитен. За 60-тото издание на фестивала в Карлови Вари той беше избран и представен от легендарната актриса в главната роля Магда Вашарьова (дългокосата Маришка в „Подстригване“ на Менцел и Маркета Лазарова в едноименната творба на Франтишек Влачил). „Всяка пролет на заседание в Пражката крепост [другарите] от ЦК на ЧКП гледаха този филм – каза тя, – за да си припомнят, че подобна свобода на художеството, мисълта и светогледа никога повече не бива да се допуска…“
Е, десетилетия по-късно ЧКП е статия в Уикипедия, а свободата, за щастие, продължава да не се дава лесно.
Авторката благодари сърдечно за подкрепата и приятелството на Хелена и Милан Русеви от Карлови Вари.
Comic for 2026.07.24 – Divorce
Post Syndicated from Explosm.net original https://explosm.net/comics/divorce-2
New Cyanide and Happiness Comic
Agent platform (Part 1): How we help Grab build and run AI agents at scale
Post Syndicated from Grab Tech original https://engineering.grab.com/how-grab-builds-and-runs-ai-agents-at-scale
Part 1: From one support bot to a framework
At Grab, AI agents have evolved from interesting team prototypes into production services used every day by millions of merchants, drivers, and consumers. Today, more than 500 services run on our internal agent framework, over 50 Model Context Protocol (MCP) servers are registered on our remote MCP framework, and a single Large Language Model (LLM) gateway fronts every model call across the company, handling billions of tokens each month.
None of this was designed up front. It began as the plumbing behind one internal support bot, which then expanded because the same problems kept resurfacing for every team trying to ship an agent. This series tells the story of what the platform eventually became. This Part 1 of the blog focuses on the beginning: the architecture of our AI support bot, the specific pain points we hit while scaling and iterating on it, and how each of those failures became a core building block in the framework we now call LLM-Kit.
The bot that started it
Imagine you have a question for the Technical Infrastructure (Tech Infra) team – the engineers who run the cloud platforms, databases, developer tooling, and AI infrastructure behind Grab’s ecosystem. Instead of immediately paging an on-call engineer, a bot first triages the request, checks the team’s documentation, runbooks, and past Slack threads, and tries to answer directly in the thread. If it still cannot resolve the issue, it routes the ticket to the right human, with the relevant context already attached.
That is what we built with the Tech Infra Support Bot.
In the first half of 2023, Tech Infra handled thousands of support tickets, many of them repeated questions that had already been answered somewhere internally. Before LLMs, the bot’s role was mainly operational; performing tasks like helping track acknowledgments and response times for on-call engineers. With the arrival of GPT-4-32k, we evolved it into a GPT-powered Level-0 support layer that could answer documented questions before a human needed to be paged.
The first production version was a Go service organized around two planes:
-
A reasoning plane. At Level-0, it was a single-agent loop. It takes the user’s question, decides which tools to call, executes those calls, feeds the results back into the prompt, and returns an answer. The default model at the time was gpt-4.1; today, we have evolved to the latest reasoning models.
-
A tool plane. The tools provided the bot’s core working context. Retrieval flowed through Glean, which covered Confluence,
TechDocs, internal drives, and Jira. Other tools handled log search through Kibana, GitLab runbook and file access, Slack conversation search, and a small set of Hypertext Transfer Protocol (HTTP) plugins. In the first version, tools and prompts were defined in per-channel JavaScript Object Notation (JSON) configs and resolved at request time. As models became more capable, we later standardized the tool set across channels.
A trimmed version of that tool config looked like this:
"agent_plugins": [
  {"name": "glean_search",        "type": "common", "metadata": {"wiki_space_collection": ["..."]}},
  {"name": "runbook_search",      "type": "common"},
  {"name": "gitlab_runbook_reader","type": "common"},
  {"name": "gitlab_read_file","type": "common"},
  {"name": "kibana_log_search",   "type": "common", "metadata": {"index": "k8s*"}},
  {"name": "slack_conversation_tool", "type": "common"}
]
It worked, but it taught us, the hard way, why a demo agent is not a production agent.
What it takes to scale and improve quickly
As we worked on improving the agent, we kept running into the same kinds of friction. Over time, those pain points formed clear patterns, and they were the same ones we saw other teams run into as well.
-
Vibe check is not an evaluation strategy. The bot had a base prompt, and each Slack channel could configure its own prompt, tools, and documentation filters. But the workflow was essentially: configure it, ship it, and hope it reduced toil. There were no real evaluations, just optimism that it would work.
-
Fast model and provider switching is essential. The AI landscape moves incredibly fast: a new state-of-the-art (SOTA) model appears on Tuesday, and a highly efficient open-source alternative shows up on Thursday. Switching providers should not feel like open-heart surgery. A unified Software Development Kit (SDK) and an LLM API gateway remove the need to refactor payload schemas, rewrite error handling, or integrate each provider from scratch. If moving from OpenAI to Anthropic, or routing to an open-source model endpoint, takes more than a few config changes, technical debt is already slowing you down.
-
Observability cannot be an afterthought. When an answer was wrong, figuring out “why” meant grepping logs across three separate systems: the agent workflow, the tool calls, and the model call. There was no shared trace tying them together. That level of friction is survivable for an internal tool; it is unacceptable for a customer-facing agent.
-
Everything around the agent took longer than the agent itself. Auth (OIDC), secrets management (Vault), per-environment config, vector database integration, LLM tracing, health probes, and metrics were not agent-specific problems. However, they all had to be solved before anything could be shipped. The reasoning loop took a whole afternoon. The production wrapper took two weeks.
The pattern was clear: the hard part of building an agent was not the agent itself, but everything around it that had to be in place before it could safely run in front of users. So we began pulling those shared components out of the bot and consolidating them into a unified framework.
Extracting the framework: LLM-Kit
LLM-Kit emerged when we stopped solving these problems service by service and started solving them once, centrally. It is intentionally not a new agent abstraction or a Domain-Specific Language (DSL). Instead, it is a curated set of integrations and scaffolding built around Grab’s existing infrastructure, pipelines, secret management, and observability. Just as importantly, we chose to build a framework rather than a heavy centralized platform. In a space evolving this quickly, a platform would have locked teams into rigid assumptions that would soon become outdated. A framework let us meet developers where they already were: standardizing the plumbing while preserving the freedom to iterate quickly. Looking back, that was the right first choice. Each part of LLM-Kit is a direct response to one of the failures described above.
We first wrote about LLM-Kit’s structure and code architecture in a 2024 blog post. Two years and a few hundred agents later, the overall shape is still recognizable, but almost every underlying layer has changed. Poetry was replaced by uv; we standardized on the OpenTelemetry stack; LangChain evolved into LangGraph and Deep Agents; and some tools moved onto our MCP framework.
It starts with a template. The entry point is a user interface (UI) form. An engineer fills in an application name and a few details, and gets back a GitLab repository with the production wrapper already assembled. Under the hood the template stamps out a full FastAPI service:
/
├── app/
│   ├── server.py              # FastAPI app factory: mounts routes + middleware, boots OTel + statsd
│   ├── agents/
│   │   ├── simple_react_agent.py   # a single-agent LangGraph ReAct loop (agent <-> tools)
│   │   ├── mcp_react_agent.py      # the same loop, but tools are pulled from remote MCP servers
│   │   └── simple_react_agent.png  # auto-exported graph diagram (generated in dev)
│   ├── routes/
│   │   ├── api.py             # router aggregator
│   │   ├── health_check.py    # liveness/readiness probe
│   │   ├── oidc.py            # OIDC login/callback (skipped in proxy-auth mode)
│   │   └── evalshub_eval.py   # runs ROUGE / BLEU / LLM-as-judge evals on the agent
│   ├── core/config.py         # AppConfig (pydantic-settings) + INI/secret parsing
│   ├── tools/word_length_tool.py   # an example tool to copy from
│   ├── utils/prompts.py       # prompt/message assembly helpers
│   └── storage/connection.py  # Postgres + pgvector engine and connection pooling
├── sdk/         # a generated, typed client SDK (protobuf) other services import
├── configs/
│   ├── dev.ini / stg.ini / prd.ini   # one config per environment
│   └── secret.ini.example     # secret template; real values resolve from Vault at deploy
├── databases/postgresql/      # SQL migrations (pgvector extension bootstrapped for you)
├── scripts/
│   ├── db.py / db.sh          # migration runner
│   └── gunicorn_conf.py       # production server/worker config
├── tests/
│   ├── unit_tests/            # starter unit tests (e.g. the health check)
│   └── evalshub_evaluation/   # golden test cases the eval route runs against
├── Dockerfile                 # multi-stage, distroless
├── Makefile                   # setup / run / test / lint targets
├── pyproject.toml             # uv build backend + pinned deps
└── .pre-commit-config.yaml
Three things are worth pulling out of that tree:
-
app/agents/is the part you actually own. You get two working agents to fork from rather than a blank file:simple_react_agent.pyis a single-agent LangGraph ReAct loop, andmcp_react_agent.pyis the same loop wired to pull its tools from remote MCP servers. Both compile to a LangGraphStateGraphwith a retry policy and a 30-second per-step timeout, and in dev the graph is auto-exported as a diagram. This is a real step up from the bare LangChain agent initialization we scaffolded in 2024. -
app/routes/evalshub_eval.pyships evals on day one. The template comes with an endpoint that runs Recall-Oriented Understudy for Gisting Evaluation (ROUGE), Bilingual Evaluation Understudy (BLEU), and LLM-as-judge evaluators over a set of golden test cases intests/evalshub_evaluation/. The thing we most wished the support bot had, is now in the box before a builder writes a line of their own logic. -
Everything else is the production wrapper.
core/config.py,storage/,configs/,databases/,scripts/, the distrolessDockerfile, and thepyproject.toml(nowuv, not the Poetry we used in 2024) are the auth, secrets, persistence, packaging, and deploy plumbing that every service needs and that no team should have to write from scratch.
The day-one wiring that used to take two weeks or more now takes about an hour. The rest of this section is what “pre-wired” means, layer by layer.
Config and secrets are solved once. Apps declare environment configs as initialization (INI) files with secret interpolation, so secrets resolve from Vault at boot, and a single secret.ini.example is enough to run any LLM-Kit app locally:
[CONFIG]
GRABGPT_API_KEY=${SECRET:GRABGPT_API_KEY}
OTEL_EXPORTER_OTLP_ENDPOINT=<otel-collector-endpoint>
POSTGRES_POOL_RECYCLE=1800
Model access behind one resolver. Every model call goes through the GrabGPT Gateway, which is OpenAI-compatible. LLM-Kit’s job is just to resolve the right endpoint (per environment, and per data tier) and inject the key so application code never hard-codes a provider again:
from openai import OpenAI
from llm_kit.grabgpt import resolve_grabgpt_base_url, resolve_grabgpt_api_key

client = OpenAI(
    base_url=resolve_grabgpt_base_url("prd", "public"),  # provider chosen centrally
    api_key=resolve_grabgpt_api_key(),
)
That one indirection is what later lets a platform team change which provider serves a model, configure fallback routing, set budgets, and manage cost attribution, without a single application touching its code.
Tracing wired in, not bolted on. A single instrumentor auto-instruments FastAPI, outbound HTTP, LangChain, and MCP, and stamps every span with Kubernetes resource attributes (pod, namespace, image, service version). Structured logs auto-inject the trace and span IDs, so logs and traces correlate in Grafana/Kibana for free:
exporter = OTLPSpanExporter(endpoint=app_config.otel_exporter_otlp_endpoint)
OTELInstrumentor(exporter=exporter, excluded_urls=["health_check"]).instrument_app(app)
The three systems, no shared trace problem turns into one end-to-end trace across every LLM call, tool call, and retrieval step.
Tools can be exposed through MCP servers built on our MCP framework. Instead of hardwiring a large set of tool functions inside the agent process, the agent connects to MCP servers and discovers their tools at runtime. That means adding a new capability can be as simple as registering an MCP server, rather than redeploying the agent.
client = MultiServerMCPClient({
    "mcp-gitlab-remote": {
        "transport": "streamable_http",
        "url": "<remote-mcp-gitlab-endpoint>/mcp/",
        "headers": {"Authorization": "Bearer <token>"},
    }
})
tools = await client.get_tools()   # schema negotiated, no redeploy
An agent is just another service in the ecosystem, with gRPC on both sides. Most of Grab’s backend communicates over gRPC, and agents are rarely standalone; other services call them, and they in turn call other internal services. The template is designed to support both directions.
On the serving side, the scaffold includes a Protocol Buffers (protobuf) contract (sdk/.../.proto, with a sample Hello remote procedure call (RPC)) and a generated, typed client SDK package that other teams import to call your agent without hand-writing HTTP. make gen-proto regenerates the Python stubs from the .proto, and a gen-proto-check Continuous Integration (CI) step fails the build if the committed stubs drift from the contract. A gRPC server runs alongside FastAPI (default port 8087, multi-worker-safe via SO_REUSEPORT) and ships a standard gRPC health service out of the box:
$ grpcurl -plaintext localhost:8087 grpc.health.v1.Health/Check
On the calling side, LLM-Kit ships a channel provider so an agent never hardcodes an address. The auto provider tries Istio, then Consul, then a static fallback, health-checks the channel it selects, and runs a background monitor that re-selects after a few consecutive failures:
from llm_kit.grpc.channel_providers.auto import (
    AutoGrpcChannelProvider, AutoGrpcChannelProviderConfig,
)

provider = AutoGrpcChannelProvider(logger, AutoGrpcChannelProviderConfig(
    client_name="my-agent",
    service_key="some-internal-service",   # resolved via Istio / Consul
    enable_istio=True, enable_consul=True,
))
channel = provider.get_channel()           # first healthy channel, auto-reselected on failure
stub = SomeServiceStub(channel)
This is the less glamorous side of being production-ready. Before an agent can deliver value, it needs to both accept calls from and make calls to the rest of the company’s services using the same transport the broader system already relies on.
What’s next
LLM-Kit solved building and shipping one agent. At 500 agents, the problems were no longer framework problems. They were platform problems: who can change which model everyone calls, how one team safely reuses another team’s tools, and how you know an agent got better and not just different after a prompt change. We built three answers for that layer: the GrabGPT Gateway, a remote MCP framework, and an evals platform. Part 2 starts with the gateway — one endpoint, five providers, and what it takes to make “swap the model” a configuration change instead of an incident.
Join us
Grab is Southeast Asia’s leading superapp, serving over 900 cities across eight countries (Cambodia, Indonesia, Malaysia, Myanmar, the Philippines, Singapore, Thailand, and Vietnam). Through a single platform, millions of users access mobility, delivery, and digital financial services, including ride-hailing, food delivery, payments, lending, and digital banking via GXS Bank and GXBank. Founded in 2012, Grab’s mission is to drive Southeast Asia forward by creating economic empowerment for everyone while delivering sustainable financial performance and positive social impact.
Powered by technology and driven by heart, our mission is to drive Southeast Asia forward by creating economic empowerment for everyone. If this mission speaks to you, join our team today!
Recursive Trucker’s Hitch
Post Syndicated from xkcd.com original https://xkcd.com/3276/

How Pershing II Changed Nukes Forever
Post Syndicated from Curious Droid original https://www.youtube.com/watch?v=1BCE3LE6HTo
Mourning Dan Williams
Post Syndicated from corbet original https://lwn.net/Articles/1084545/
![[Dan Williams in May 2026]](https://lwn.net/images/conf/2026/lsfmm/DanWilliams-sm.png "Dan Williams")
I have just received the shocking news that Dan Williams, a longtime,
high-profile kernel developer, has passed away. I knew him primarily
through his long service on the Linux Foundation Technical Advisory Board;
he was always a strong, thoughtful, and intelligent presence. Dan will be
deeply missed.
There is a support
effort underway for Dan’s family as they come to terms with this loss.
Introducing Cache Response Rules
Post Syndicated from Alex Krivit original https://blog.cloudflare.com/introducing-cache-response-rules/
Today we’re excited to announce Cache Response Rules. These are a new rule type that runs after an origin server replies but before Cloudflare caches the content.
If you've ever been irked watching something that should easily sail out of cache get dragged back to the origin by a stray Set-Cookie or wrong Cache-Control, headers that are sometimes hard or impossible to strip or change on the origin itself, then Cache Response Rules is that fix, applied at exactly the right moment.
When and how caching decisions are made
A CDN cache and an origin server work as a pair. Their goal is to answer from the cache whenever possible and only go back to the origin when the edge can’t respond. Every point of cache hit ratio comes from getting that division of labor right. Check the cache when we shouldn't, and we waste a lookup that was always going to miss. Check it too rarely, the origin serves traffic the edge should have absorbed and the performance win evaporates.
Importantly, the origin guides the cache. When it returns a cacheable asset, its response headers tell Cloudflare how long it’s OK to serve it, when and how to revalidate, and even whether to cache it at all. The cache is only ever as efficient as the origin allows. If the origin gets it wrong, cache becomes decoration while the origin infrastructure costs skyrocket.
Most cache eligibility problems are not decided at request time. They manifest after the origin replies.
A visitor asks for /static/app.js. Cloudflare checks cache, it misses, and forwards the request to the origin. The origin returns the file. Somewhere in those response headers, quietly, is a Set-Cookie header. The asset that should have been cached at every Cloudflare data center is now uncacheable. Multiply that by every visitor, on every site, with the same accidental header, and you have a cache hit ratio that is leaking origin bandwidth, ruining performance, and driving infrastructure costs higher.
There is a long list of variations of this same problem. The origin sends Cache-Control: no-cache on assets that are perfectly safe to cache on the CDN. The origin sends correct directives, but they're meant for the browser, not for Cloudflare. Or the origin attaches an ETag (an identifier for a specific version of a resource) that's overly aggressive and causes revalidation thrash on every conditional request. Often, especially in large teams, those managing the origin’s responses and the group that manages the CDN are different. This makes changing a one-line header a weeks-long negotiation.
None of these problems can be solved at request time. By the time Cloudflare sees the Set-Cookie on /app.js, the request phase is over. The response is already in flight.
So we put a fix in the right place.
Cache Response Rules run after the origin’s response arrives at Cloudflare, but before it gets written to cache. With them, you can rewrite Cache-Control directives, manage cache-tags, and strip headers like Set-Cookie, ETag, and Last-Modified from the origin response before Cloudflare's cache ever sees them. The fix lives entirely on Cloudflare. No origin code changes required.
The missing piece
If you've used Cloudflare for any length of time, you've watched the cache control surface area evolve. A few years ago, most of this lived inside Page Rules, which operated as a single, albeit overloaded, primitive that mixed caching with redirects, security, and a dozen other behaviors, all evaluated on requests. We later split these rules apart so that only relevant behavior changes would be evaluated against requests, reducing unnecessary latency and allowing for complex rule stacking between behaviors. Cache Rules became a dedicated, expressive rule type for caching decisions, joined by CDN-Cache-Control, Origin Cache Control, custom cache keys, and other controls that give you precise ways to tell Cloudflare what's safe to cache, for how long, and under what conditions.
Many of these controls share a common trait: they operate on the request.
While maybe unintuitive, this makes sense. The most important caching decisions Cloudflare has to make are should we look this up in cache, and under what key? This question has to be answered before Cloudflare talks to the origin. If the answer is "no" when it should have been "yes," the request has already paid for the origin round trip and there's nothing the response can do to give it back that latency. Request-time rules answer that question using the only information available at that moment: the URL, the requested file’s extension, the request headers, geography, device type, and so on. Using these request parameters and the rules set to change these request parameters, we determine if something is likely in cache and look there before talking with the origin.
But some cache decisions cannot be made on the request. The origin's Cache-Control directives (cache-control: max-age=3600) are part of the response Cloudflare receives from the origin. The status code, the ETag, the Last-Modified timestamp, Set-Cookie, and the cache-tag format the origin chooses are all things in the response that the origin passes to the cache. None of it is available when request-time rules run.
Responses from the origin are the source of truth, so if something needed to be changed on Cloudflare that wasn’t available at request time, that previously left you with three workarounds:
- Change the origin.
- Write a Worker that re-fetches and rewrites the response.
- Live with a worse hit ratio.
Each of those costs engineering time, adds latency, or burns money. Cache Response Rules give you a fourth option: a ruleset where you can modify the origin's response before it hits Cloudflare's cache.
Two phases, two questions
The cleanest way to think about the difference between Cache Rules and the new Cache Response Rules is as two phases, each answering its own question.
- Cache Rules run in the request phase, before Cloudflare talks to the origin server. They answer: given this request, should Cloudflare cache the response, and under what cache key? That’s three decisions that can be made at request time with cache rules: whether to cache (eligible vs. bypass), what the object is (the cache key and how to identify the stored object in the future), and how to cache (edge TTL, browser TTL, serve-stale, etc). All of these questions must be settled before the origin fetch, using only what’s in the request.
- Cache Response Rules run in the response phase, after the origin replies but before the response is written to Cloudflare's cache. Cache Response Rules answer: now that the origin has responded, should we adjust how we cache it? Cache Response Rules can rewrite the how from the request by stripping headers that would make a response ineligible for cache, changing origin
cache-controldirectives that tell Cloudflare whether and how to cache, or setting cache tags for purging content. When a cache rule and cache response rule are in conflict with each other, the cache response rule wins.
The response phase can't do everything the request phase can. It can't change the what, as the key is already fixed. Though it can change whether and how Cloudflare caches, for example, a response rule can set no-store to make a cacheable object non-cacheable or strip a Set-Cookie to make non-cacheable content eligible for cache. However, Cache Response Rules can't make a previously ineligible request cacheable by the response phase, because it’s too late.
So Cache Response Rules don't replace Cache Rules. Cache Rules decide whether, what, and how we cache on the request. Cache Response Rules get the final word on the how and whether, once the origin's response is seen by Cloudflare in a phase that didn't exist before.
What you can do
Cache Response Rules support three actions today.
- Strip headers that break caching
The set_cache_settings action removes things like Set-Cookie, ETag, or Last-Modified from the origin response before Cloudflare evaluates it for caching:
This is the fix for the Set-Cookie-on-a-static-asset problem. Origin frameworks frequently attach session cookies to every response (for load balancing or other purposes), including responses for assets that users don't want to be associated with a session. Stripping Set-Cookie in the response phase makes those assets cacheable again without asking the origin, load balancer, or anything else upstream to change anything.
Cache Response Rules also run on responses that aren't eligible for caching at all. So when you strip Set-Cookie from a dynamic response, for instance, the rule fires whether or not the object is ever stored. This allows you to control what the client sees even when the response is not stored in cache. You can also strip ETag and Last-Modified, which is useful when those headers are misconfigured at the origin and causing thrash. This comes with a tradeoff: stripping both ETag and Last-Modified enables Smart Edge Revalidation for that response. If Cache Response Rules then add new validators, Cloudflare will not enable a Smart Edge Revalidation for browser conditional requests.
So stripping and modifying headers, even on dynamic requests, are a powerful new pattern that did not exist before on Cloudflare, but there can be additional configs to be aware of if you make these changes.
- Manage cache tags
set_cache_tags lets you add, remove, or set cache tags used for purge by tag on the response. Tags can be static:
Or computed from a response header expression:
That second form is the one that earns its keep during a CDN migration. If your previous CDN attached surrogate keys to responses using a header like Surrogate-Keys with a comma delimiter, you can translate them into Cloudflare's Cache-Tag format directly in the response phase.
The third argument to split() is the limit: the maximum number of elements in the resulting array can be between 1 and 128. Use a value comfortably larger than the realistic tag count per response. The value 1 would return the entire header as a single tag. Once tags exist on the response, purge-by-tag just works (and by “works” we mean usually in under 150 ms, globally).
- Modify Cache-Control directives
set_cache_control is the action that does the most heavy lifting. You can set or remove individual directives:
- Duration directives:
max-age,s-maxage,stale-if-error,stale-while-revalidate - Qualified directives:
private,no-cache(with optional header-name qualifiers) - Boolean directives:
no-store,no-transform,must-revalidate,proxy-revalidate,must-understand,public,immutable
For each directive you can also set cloudflare_only: true, which is the part that often surprises people:
When cloudflare_only is true, the directive affects how Cloudflare caches the response, but the downstream Cache-Control value sent to the browser is left alone. This is the response-phase version of what CDN-Cache-Control gives you at the origin: cache the asset for 24 hours at Cloudflare, but tell the browser something else. The difference is that you're now doing it from a Rules surface in the Cloudflare dashboard, rather than asking the origin to set a separate header.
Examples worth stealing
Below are some examples we thought could help show you the power of Cache Response Rules. Try them out, remix them, and share with others in the community so you can see how to achieve powerful cache customizations using Cache Rules with Cache Response Rules. More examples can be found in the docs.
Strip Set-Cookie from static asset extensions
Why it works: The most common cause of "this should be cacheable but isn't" is a session middleware on the origin that attaches a Set-Cookie to every response. Stripping it for known-static extensions converts those responses to cacheable without any origin change.
Caveat: Only do this for asset types where the cookie is not semantically required. If your origin uses cookies to drive variant behavior on those URLs (very unusual but possible), strip selectively or scope stripping these headers by path.
Long-cache static assets in Cloudflare, shorter-cache them in the browser
Why it works: Cloudflare holds the asset for a month and serves it from cache. Browsers see max-age=86400 and re-validate after a day. You decouple the two cache lifetimes without touching the origin.
Caveat: immutable tells browsers not to revalidate even on explicit refresh. Pair it only with versioned/hashed filenames.
Override no-cache on a known-static path
Why it works: Framework defaults sometimes attach no-cache to every response. If you know /static/* is safe to cache, you can strip the directive and impose your own TTL (at Cloudflare only), without changing what the origin or any downstream cache sees.
Caveat: Be honest about what's actually static. If /static/ is sometimes used to serve user-specific content, narrow the match (extension, response header signal, content type).
Translate cache tags during a CDN migration
Why it works: A lot of CDN migration pain comes from origin tooling that emits cache-tag headers in another vendor's format. Instead of asking the origin team to ship a release that adds Cloudflare's Cache-Tag, translate the existing header in the response phase. Purge-by-tag on Cloudflare starts working immediately.
Caveat: The third argument to split() is the limit (1–128) on the resulting array size, not anything to do with the separator.
How to use Cache Response Rules
Dashboard
- Go to Cache > Cache Rules in the Cloudflare dashboard.
- Select Create rule and then Cache Response Rule.
- Choose a name and an expression. The expression builder exposes both request fields and response fields.
- Choose an action: Modify cache-control directives, Modify cache tags, or Strip headers.
- For directives, toggle Cloudflare only when you want the change to apply only to Cloudflare's view of the asset.
- Save as a draft to iterate, or deploy directly.
API
Rules in this phase live at:
For further information about how to use Cache Response Rules including API and terraform examples, please see the documentation.
Use Cache Response Rules today
Cache Rules saw the request. Cache Response Rules see the response. Both give you even more control to build the perfect cache on Cloudflare. They are available on all plans today — go try them out!
НВО: Endgame
Post Syndicated from original https://www.toest.bg/nvo-endgame/

Съвсем скоро всичко ще свърши. Текат последните дни преди третото класиране след националното външно оценяване (НВО) в VII клас. Всички ще отдъхнат. Не защото е минало добре, а просто защото е свършило. Горко̀ им на тези с повече деца, които трябва да преживеят отново адския VII клас след време. Защото шансове за промяна не са видими на хоризонта.
На 30 юни тази година Министерството на образованието и науката (МОН) отново се потупа само по гърба, подреди едни числа в една статистика и я остави да прашасва при всички статистики от минали години.
Средният резултат от НВО в края на VII клас се запазва в диапазона от предходната година – 55,26 т. (с около половин точка по-надолу от 2025 г., но по-висок от 2024 г.),
пишат от МОН. Значи всичко е наред?
Кратка хронология на последните месеци
През май присъствах на среща с настоящия министър на образованието проф. Вълчев, зам. министърката д-р Таня Панчева и експерти от Министерството. Всички те бяха на мнение, че няма нужда предстоящият изпит по математика за седмокласниците да бъде разясняван допълнително, въпреки че включва голям брой задачи, за които нито учители, нито ученици знаеха как ще изглеждат и какво ще съдържат. Така на 19 юни седмокласниците бяха първите, които видяха в какво се състои изпитът им. И се опитаха да направят най-доброто, на което са способни.
НВО: Трагедия в 3 действия
Уж същото, ама не точно. В НВО по математика все пак ще има нов вид задачи и учителите вероятно ще разберат почти едновременно с учениците какво точно ще включва изпитът. Ако това измерва нещо, то е хаосът в системата. От Донка Дойчева-Попова.
Средният резултат по български език и литература е 55,26 точки (за сравнение, през 2025 г. – 55,91), което отбелязва спад от 0,65 точки. По математика средният резултат е 38,45 точки спрямо 42,74 от миналата година – спад от 4,29 точки.
Средният български ученик е с тройка по математика и с четворка по български език и литература.
Когато средният успех е едва 38,45 точки, не може да бъде прилагано класическото изискване за 50% успеваемост за оценка среден 3. Според него над 60% от всички явили се би трябвало да са скъсани, а това би било статистическа аномалия, показваща дефект в теста, а не в учениците.
Уви, при нас дефекти в теста не се търсят.
Визуализациите на резултатите от изпита по математика, публикувани от Георги Стоев – макроикономист, председател на trakia.tech и водещ на подкаста Ex Ante, в профила му във Facebook представят всички тези числа нагледно. Националното разпределение на 51 162 ученици показва концентрация на слабите резултати. Данните не включват областите Шумен (няма публикувани данни) и Враца (публикувани със закъснение и в машинно нечетим вид).
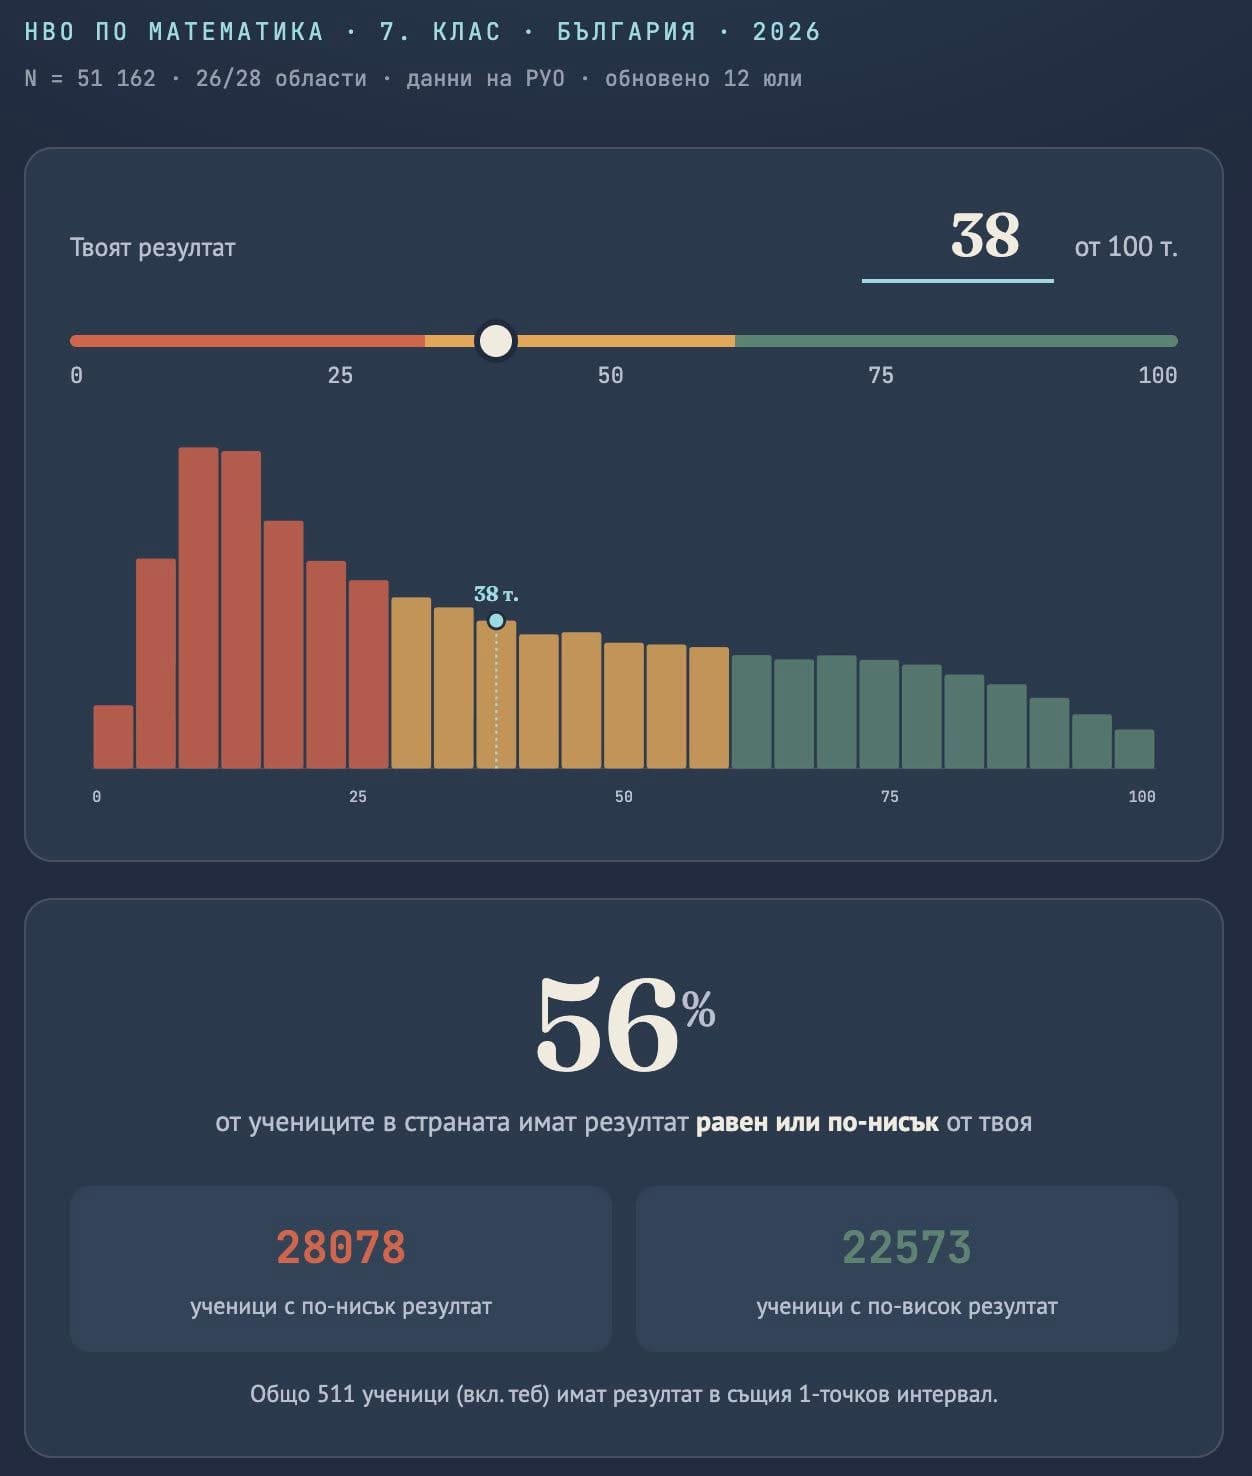
Кой не може да смята?
Любопитно е как изпитът по български език и литература търпи минимални промени във времето, а изпитът по математика е обект на всевъзможни експерименти почти всяка учебна година. Тоест по български може да е едно и също, но по математика явно се притесняваме, че учениците може да заучат формата и ще се справят прекалено добре.
Може би в МОН все още не разбират как функционира всичко в математиката?
Всъщност това Министерството си го призна тази година, като подари точки за „частично овладяване на проверяваните знания и умения“. Въпреки обжалването на внезапните промени в изпитните формати по математика МОН публикува на 21 юли 2026 г. Проект на заповед за определяне на учебните предмети, които ще участват интегрирано в НВО по математика и природни науки и по български език и литература в края на Х клас през… следващата учебна година.
НВО: Време изпитно
Всяко лято хиляди седмокласници завъртат едно и също колело на късмета. На него пише „Национално външно оценяване“. Залогът обаче не е само знанието. Истинската игра започва много преди изпитния ден и реалността е, че на никого не му пука за децата. От Донка Дойчева-Попова.
Ако този проект бъде приет, учениците отново ще са изправени пред безумието изпитът да е променен преди промяна на учебния материал, която следва да е по-скоро качествена – да се види какви са взаимовръзките между отделните предмети, а не толкова количествена, под формата на нов материал. Кога в Министерството ще чуят учителите, родителите и самите ученици, да не говорим за експерти от България и света, че подготовката предшества изпита? Ако всичко се правеше по този начин, можеше например да се явяваме на шофьорски изпит, а после да се учим да караме.
Георги Стоев прави и една извадка за четирите най-големи града в България. В поста си той казва:
Вчера публикувах следното некоректно твърдение относно резултатите от НВО по математика след 7 клас: „среден ученик не съществува в София“. Това технически не е вярно; разбира се има деца по средата. Но важно ми се струва, че средната [средата – б.р.] (52 т.) не описва типичния случай за града. Това важи и за Пловдив, Варна и Русе. В София специално средни ученици съществуват (~32% от всички), но не са типичните. Типичен в София е ученикът при единия от двата пика: или слаб (~12 т.) или силен (~82 т.). Ученик с резултат около средната (52 т.) е по-рядък от всеки от тях.
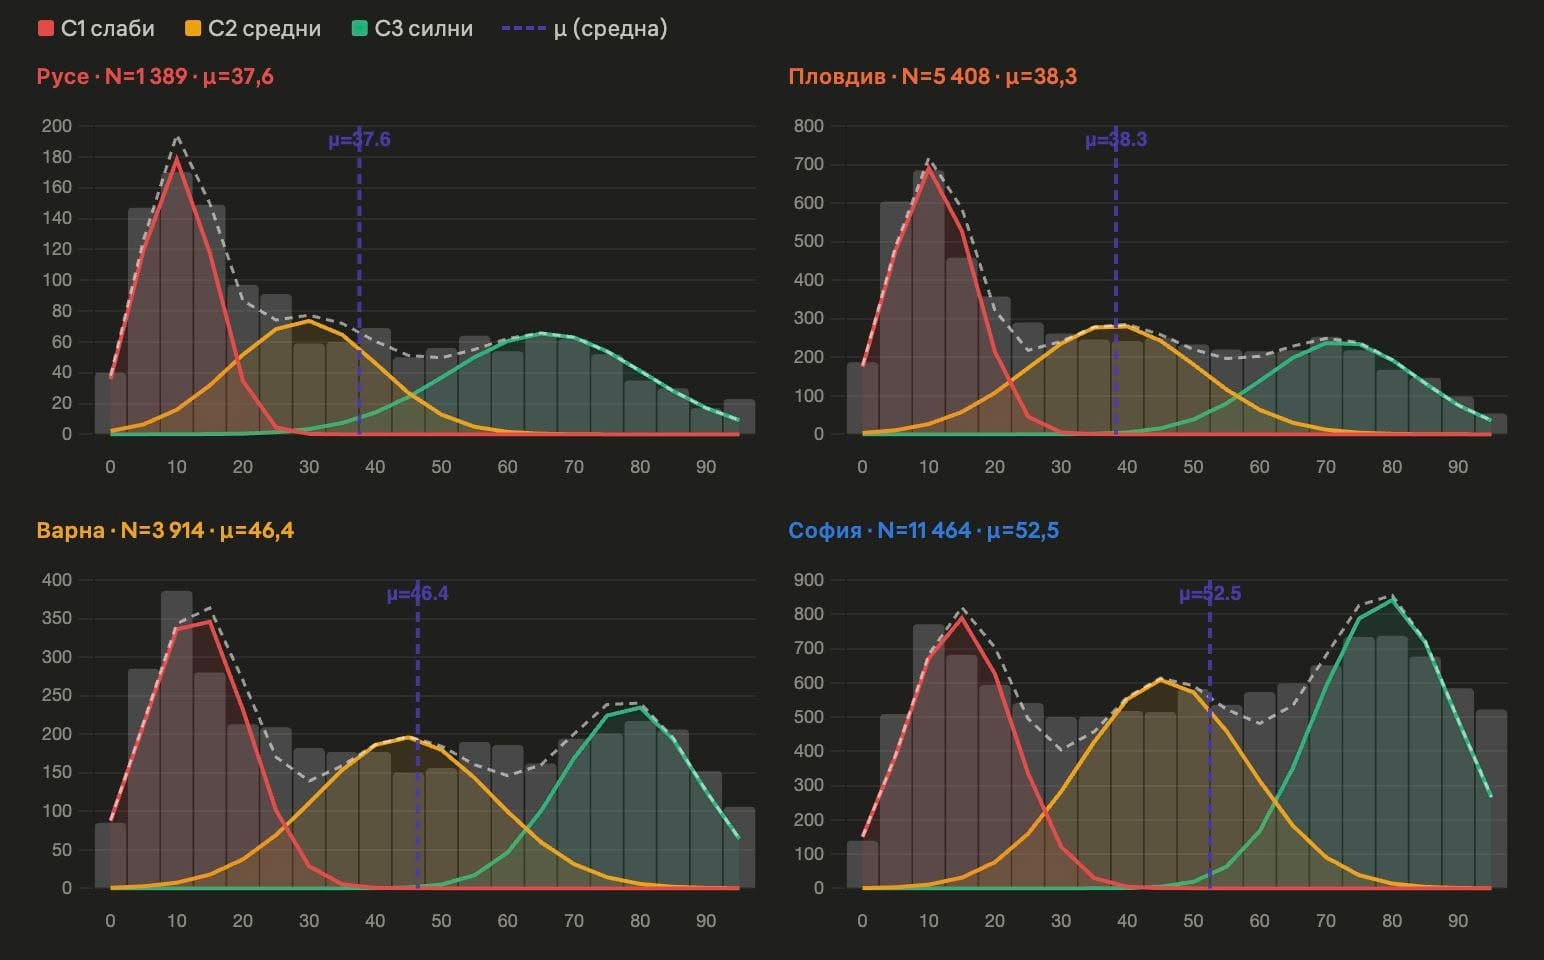
Няма средно положение, няма и две крайности, които да се „бият“. Има срив и концентрация на слаби оценки. Единствено в София от цяла България се наблюдава едва забележим превес на оценките във високия сегмент.
МОН казва: „Регионалните резултати от НВО показват устойчиво представяне на отделните изпити и в годините“, а всъщност те като огромен червен светофар осветяват единствено и само
нуждата от незабавни и адекватни мерки за повишаване на качеството на учебния процес, за изясняване на целите на външното оценяване, за реални последици до последната брънка на образователната верига и за поемане на отговорност.
През май на срещата в МОН получих гръмкото обещание, че резултатите ще бъдат обстойно анализирани и ще бъдат предприети мерки. Започвам да чакам.
Мерене на точки
И започнало едно мерене на балове… Ако беше приказка, така щяхме да я разказваме. Но не е приказка, а просто изкривена реалност, в която усещането е, като да плуваш в желе.
Според различния профил в отделните гимназии балът се изчислява по различен начин. Математическите гимназии утрояват точките от изпита по математика и вземат еднократно точките от изпита по български език. Хуманитарните гимназии утрояват българския език и броят математиката само веднъж. Повечето гимназии удвояват точките от двата изпита.
И въпреки това разнообразие в балообразуването всяка година има съревнование къде влизат учениците с най-висок бал. В театъра, в който се развива действието, от ложата на статистиците се разнасят въздишки на досада и пляскане по челото.
Училищата също започнаха да се „кичат“ с отличници. Никога няма да разберем обаче дали тези отличници са плод на труда на учителите в училището, от което излизат, или на школи и частни уроци, или на произход, или на талант, или на среда, или…
И в някакъв момент трябва да помислим за страшните проценти, които се наблюдават във всяка една област в България.
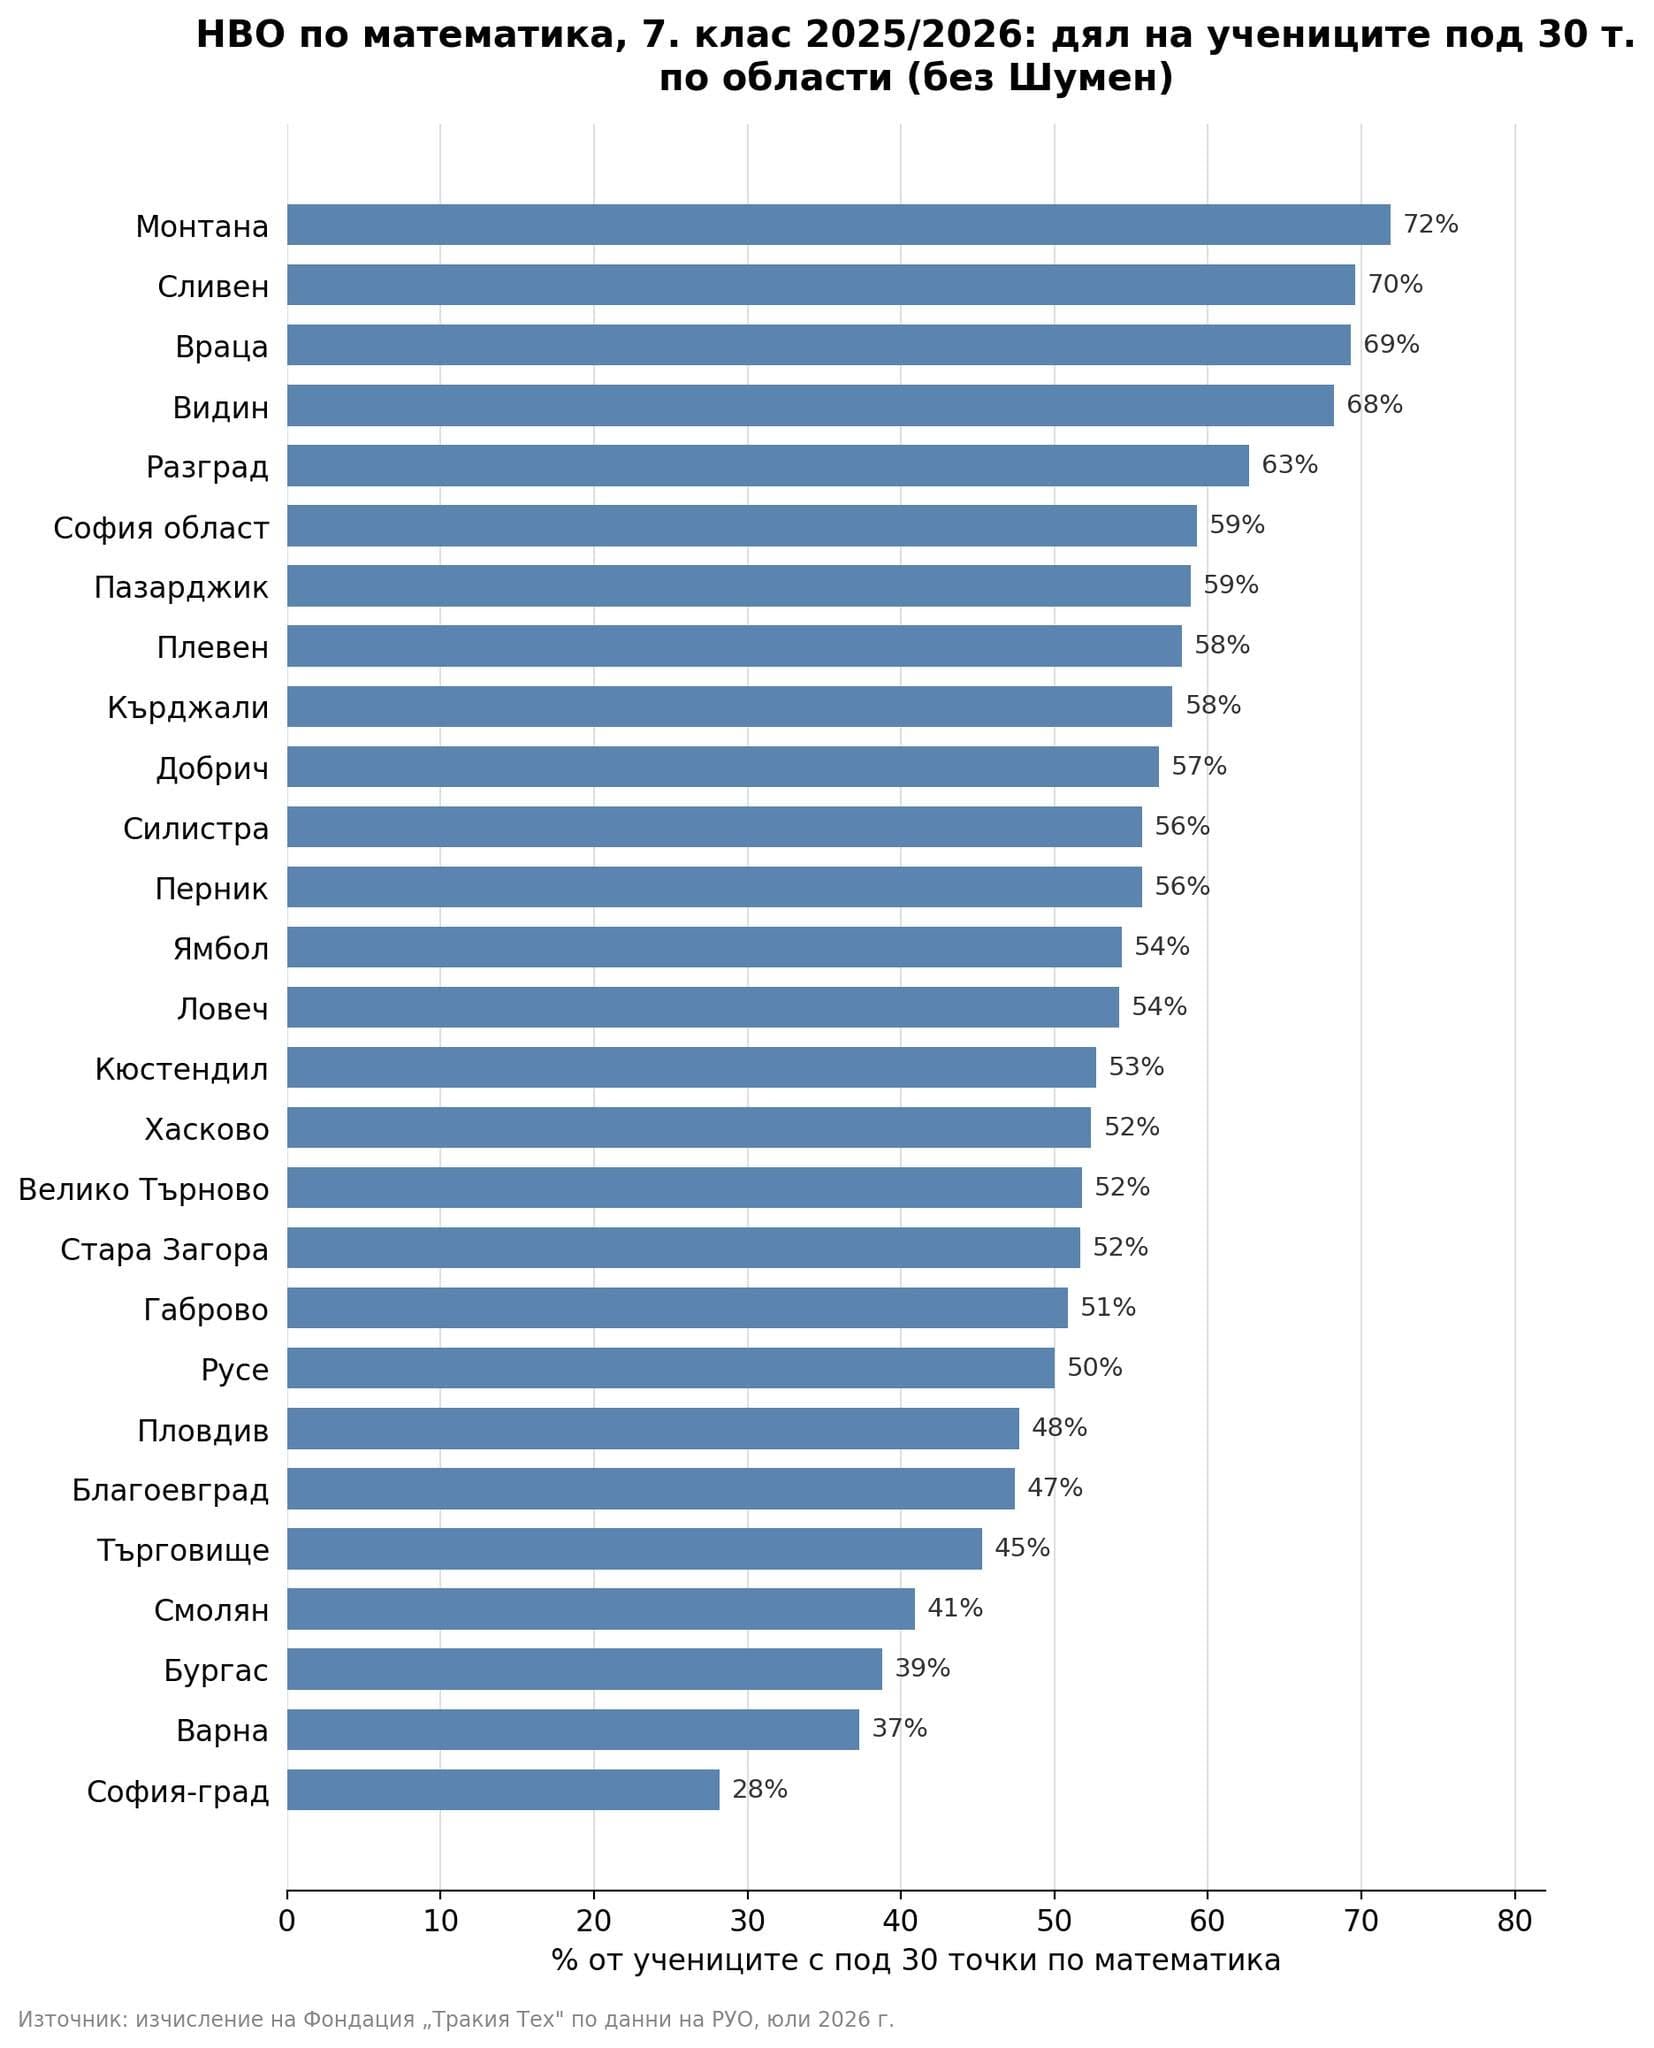
Това са седмокласниците, които имат под 30 точки, тоест слаба оценка. Почти 30% в София, почти 50% в Пловдив, почти 40% във Варна и Бургас от набор 2012 вече са капитулирали по математика. А са само на 14 години. Поради недостатъчна подкрепа при учебни затруднения? Поради недостатъчна езикова подготовка? Поради социален статус, който не позволява допълнителна подготовка или излизане извън него по някаква причина? Може би никога няма да разберем.
Искате ли децата ви да учат заедно с ромски деца?
Може ли една община така да определя правилата за прием, че ромските деца да учат в едни училища, а всички останали – в други? В България сегрегацията съществува от десетилетия. Но едва сега Комисията за защита от дискриминация го признава. От Емилия Милчева.
Но всички тези деца са оставени сами. И няма да го „израснат“.
Подредете си областите наум, помислете за развитието им, за управлението им и тези резултати ще ви се сторят съвсем логични. И ще ви изниква все един и същ въпрос: ще предприеме ли МОН каквото и да било?
„Избрахме възможно най-отдалечената гимназия от нашия блок!“, иронизира в скеча си Здрава Каменова – актриса и драматург, чиито клипове на тема образование често бъркат директно в раната на неадекватната образователна система. Да, защото, ако има нещо, което все пак работи, то е сегрегацията. „Елитните“ vs. кварталните училища. Кварталното училище е краен вариант, независимо от профилите, които предлага. Квартално е синоним на сбирщайн, на баберек.
И така, ние имаме модерно, безплатно и адекватно образование на хартия. Експертите в МОН живеят с широко затворени очи, министърът приказва за мерки, за изговаряне на проблеми, документите се роят, учителите ходят на обучения под строй и получават образователни кредити неизвестно за какво.
Да са живи и здрави родителите да плащат за частни уроци, както и онази част от учителите, които от нищо правят нещо. А децата, все така разделени на добри и лоши ученици, ще растат. И ще станат добри и лоши възрастни. Но те пък, като станат възрастни, няма да са грижа на МОН, да се оправят следващите.
Efficient log management with Amazon OpenSearch Service data streams
Post Syndicated from Praveen Krishnamoorthy Ravikumar original https://aws.amazon.com/blogs/big-data/efficient-log-management-with-amazon-opensearch-service-data-streams/
Time series data workloads in Amazon OpenSearch Service can present unique challenges for organizations, especially when dealing with continuously growing datasets. Many customers struggle with heavily loaded single indices that lead to high query latency, degraded performance, and unnecessary costs. In this post, we show you how to implement data streams with Index State Management (ISM) in Amazon OpenSearch Service. This approach automatically manages your time series data lifecycle and optimizes both performance and costs. Data streams distribute incoming data across multiple backing indices, helping to reduce single-index bottlenecks, while ISM policies automate rollover, retention, and storage tiering to help manage costs.
The challenge
While Amazon OpenSearch Service has long provided tools like Index State Management (ISM) for time series data management, many organizations still struggle with implementing optimal patterns for their continuously growing datasets. Common challenges include:
- Performance degradation from index growth: As single indices grow unbounded, query latency increases, you might find shard sizes more difficult to manage, and you might experience strain on your cluster resources.
- Manual index management overhead: Without automation, you must invest significant operational effort to manage index lifecycles, rollover, and retention.
- Complex setup: Coordinating index templates, aliases, and ISM policies manually can be error-prone.
- Inefficient resource utilization: All data residing in hot storage regardless of access patterns, leading to unnecessarily high costs.
Solution overview
As illustrated in Figure 1, our solution uses Amazon OpenSearch Service data streams combined with Index State Management to automatically distribute data across multiple indices and manage the data lifecycle. A data stream is an abstraction layer that simplifies time series data ingestion. It provides a single, consistent endpoint for writes while automatically managing multiple backing indices behind the scenes. Instead of writing directly to individual indices, applications write to the data stream, which routes data to the appropriate backing index.
Here’s how it works:
- Data streams provide a single write index when data is first ingested, which can help streamline time series data ingestion.
- When the backing index ages or grows to meet your defined criteria, ISM automatically performs the rollover operation.
- You can use ISM policies to automatically transition your aged data to different storage tiers based on rules you define and configure.
- You can automate the entire process through rules you define in the index template and ISM policies.
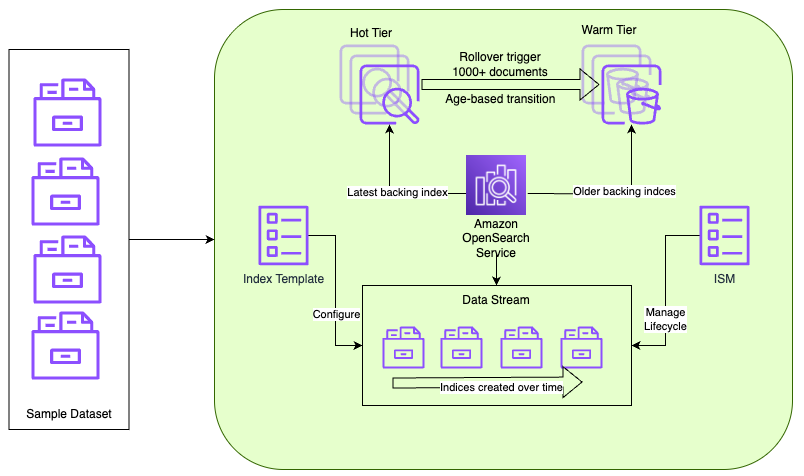
Figure 1 — Time series data workflow using Amazon OpenSearch Service data streams
Data ingests into an index according to your index template configuration. Over time, a data stream creates new indices automatically. Amazon OpenSearch Service manages the lifecycle, transitioning data from hot to warm storage according to the ISM policy configuration you define.
When to use this solution
This approach is ideal when:
- You’re ingesting time series data such as logs, metrics, traces, or Internet of Things (IoT) events.
- Your data is append-only and immutable.
- You’re ingesting millions of documents daily with long-term retention requirements.
- You want to reduce storage costs through storage tiering (UltraWarm, Cold storage), as outlined in the blog post Decrease your storage costs with Amazon OpenSearch Service index rollups.
Implementation steps
Prerequisites
Before you begin, make sure that you have the following:
- OpenSearch Service domain with UltraWarm nodes (Sample CLI command to create a domain with UltraWarm nodes enabled).
The following steps walk through implementing a time series data solution, using a web server logs database as an example. You can run these steps using any of the following:
- OpenSearch Dashboards Dev Tools Console.
- Direct API calls using curl or any REST client.
- OpenSearch Dashboards ISM interface (for policy management).
For this post, we use the Dev Tools Console in OpenSearch Dashboards. To access it:
- Log in to OpenSearch Dashboards.
- Navigate to Dev Tools (usually found on the menu under Management).
- Use the interactive console to run the commands.
Section 1: Create data stream
First, create an ISM policy that defines the rules for index rollover and storage tier transitions. The following policy defines two states (hot and warm) and sets rules for when indices transition between them. The policy triggers a rollover when the document count reaches 1,000 and moves indices to warm storage after 2 minutes.
Note: The rollover and transitions configurations are only for demo purposes.
- Create an index template for the data stream
An index template matches indices by a regex pattern and applies predefined settings and schema at index creation. The following template maps the required timestamp field for the data stream and associates matching indices with the ISM policy we created.
- Create data stream
In this step, you create the data stream that handles the time series data. The data stream provides a single, unified write target for ingesting data while managing multiple backing indices behind the scenes.
- Validate ISM policy mapping
Verify that the ISM policy is correctly associated with the data stream that was created in the earlier step. This validation step confirms that automatic lifecycle management works as expected.
Output
Confirm that policy_id matches the ISM policy name you created earlier and that enabled is set to true.
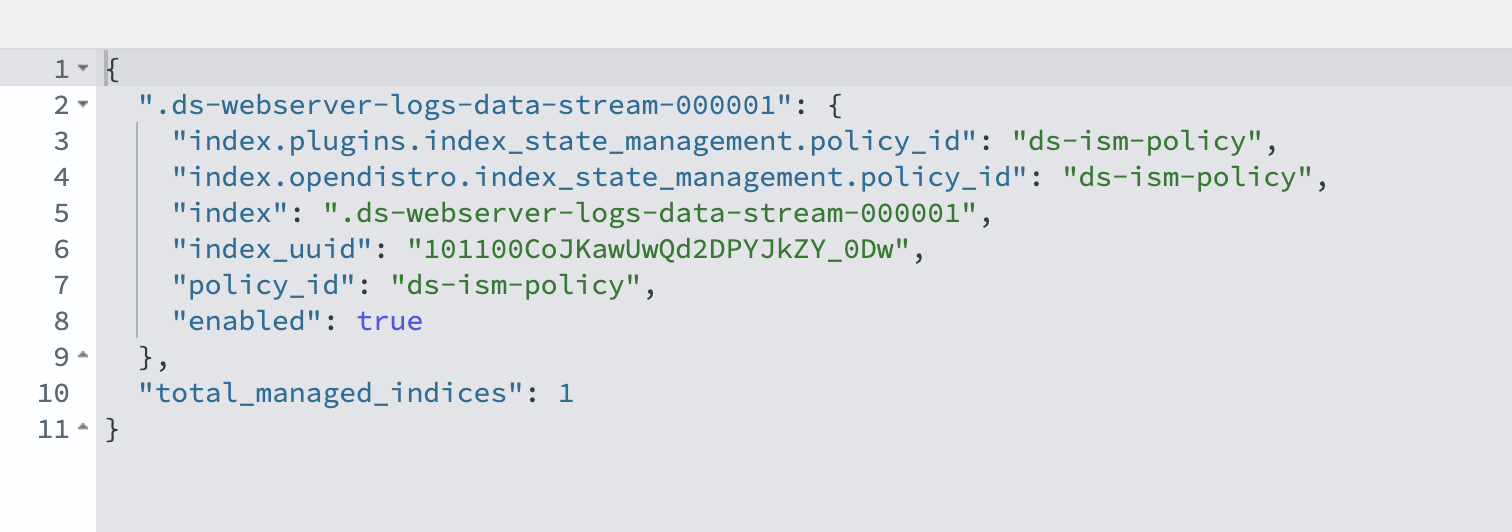
Section 2: Ingesting data to data stream
In real-world scenarios, log data is typically collected and streamed directly to Amazon OpenSearch Service data streams. However, to demonstrate rollover and migration scenarios in this post, we take a different approach. We first load sample log data into a standard OpenSearch Service index, then reindex and migrate that data to a data stream.
To get started, run the commands in the Dev Tools console to create an index and populate it with sample log data.
- Reindex existing data
This step shows how to migrate existing data in a traditional index to the new data stream. The reindex operation includes a script that confirms each document has a valid timestamp field (timestamp). Documents without a timestamp field are skipped by the reindex operation to maintain data integrity.
- Monitor index rollover
As shown in Figure 2, after reindexing, monitor the creation of backing indices. The ISM policy evaluates indices every 5 minutes by default. Rollover occurs based on the defined conditions (1,000 documents or 2 minutes of age). Verify this using the following command.
The output should look like the following:
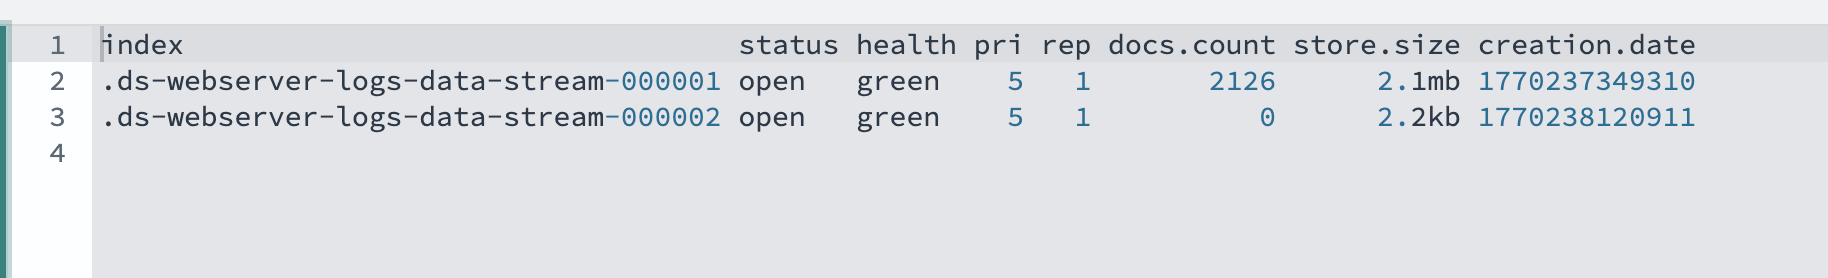
You can also validate this from OpenSearch Dashboards by navigating to Index Management, Data streams, webserver-logs-data-stream.
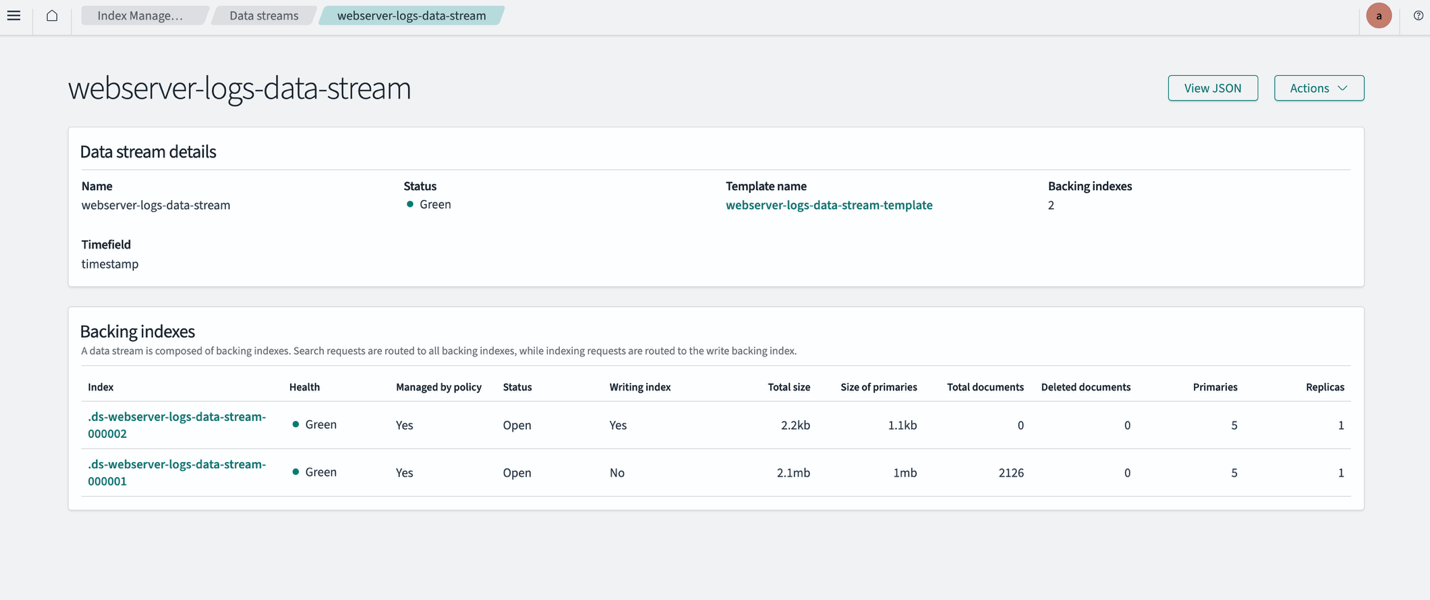
*Figure 2 — Combined view of the _cat/indices CLI output and the OpenSearch Dashboards data stream details, showing a successful index rollover across multiple backing indices*
- Validate warm transition
Verify that indices are correctly transitioning from hot to warm storage based on the ISM policy conditions. You can monitor this through OpenSearch Dashboards or API queries in the Dev Tools console.
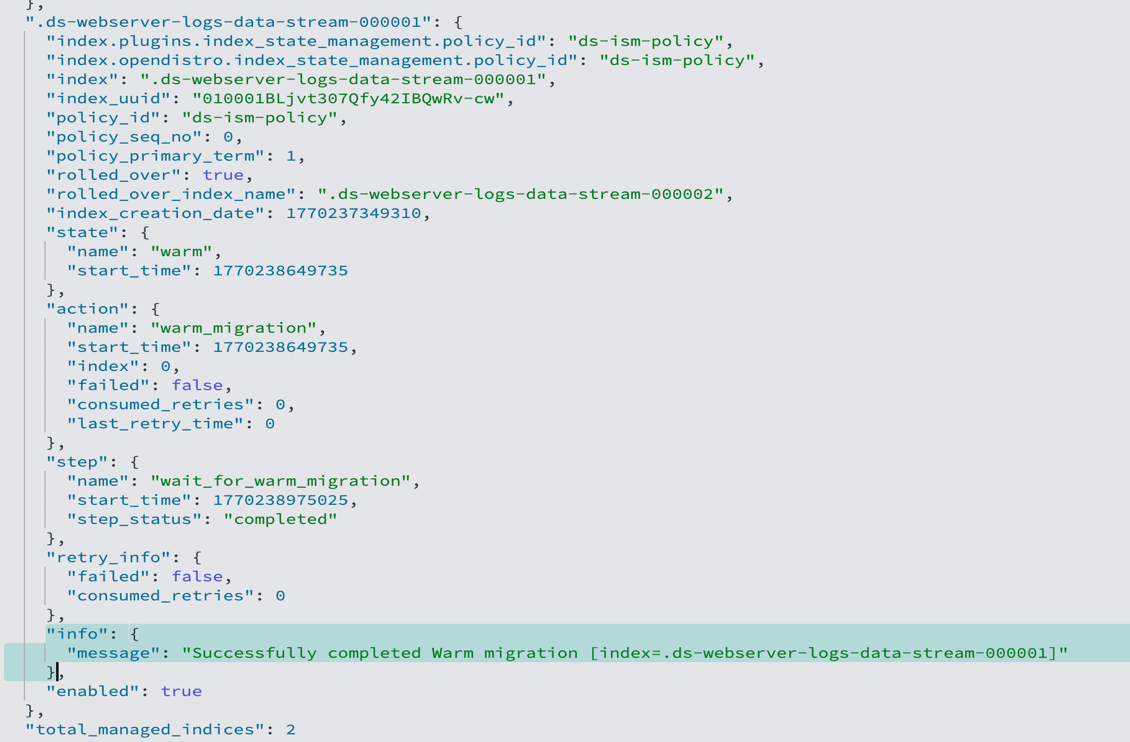
- Verify ingested data
Run a search against the data stream to confirm your documents were successfully indexed:
Output
You should see your ingested documents returned in the hits.hits array, with the timestamp field and other fields you defined in the index template. A non-zero hits.total.value confirms data is flowing correctly through the data stream.
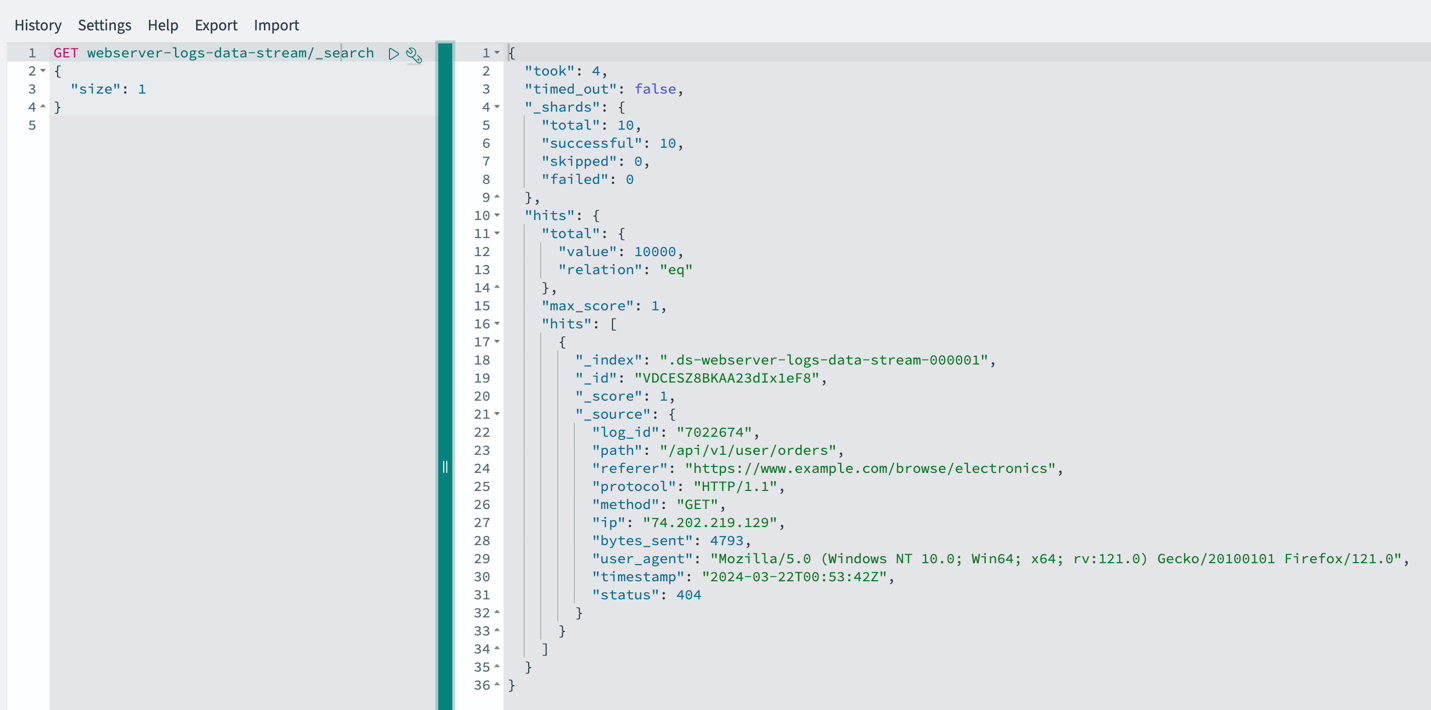
- Clean up
If needed, these commands remove the data stream and its template.
Delete the sample data.
Conclusion
OpenSearch data streams with ISM offer capabilities for managing time series data at scale. Organizations that implement this approach can see improved query performance through distributed load and smaller, time-based backing indices that support efficient time-range queries. Automated index management reduces operational overhead. Storage tiering automatically moves aged data to UltraWarm storage, which significantly lowers costs without sacrificing access to historical data. Combined with better scalability for growing datasets, this solution simplifies index management while delivering improved performance and a more cost-effective, maintainable infrastructure.
About the authors
Enterprise security at machine speed: AWS Black Hat 2026 preview
Post Syndicated from Rahul Sahni original https://aws.amazon.com/blogs/security/enterprise-security-at-machine-speed-aws-black-hat-2026-preview/

Black Hat 2026 (Aug 1-6, 2026) brings together over 22,000 security practitioners, researchers, and CISOs who build, break, and defend enterprise infrastructure. They’re security professionals who push the limits of offensive and defensive security and demand proof over promises. As frontier security models like Mythos reshape the enterprise landscape, they need security that operates at the same speed as the events they face. This August, Amazon Web Services (AWS) returns to Las Vegas to meet with our customers and partners to show how we’re delivering enterprise security at machine speed.
At Black Hat USA 2026, connect with AWS through live demos, a practitioner session on autonomous security operations, and an executive roundtable on building durable AI security architectures, plus networking receptions with customers and partners. Here’s where to find us and what you’ll take away.
Experience AWS security innovation in action
Visit us at Booth #1648 to explore five interactive demo pedestals, each aligned to a pillar of our AI-powered security story:
- Post-Mythos enterprise security: AWS uses multiple frontier AI reasoning models to find issues, validate exploitability, and autonomously fix exposures, compressing mean-time-to-remediation from days to minutes. Learn how AWS Continuum helps you find risks before you ship, prioritize by real business impact, and remediate at machine speed while you stay in control.
- AI-powered investigations: Amazon GuardDuty AI-powered investigations automatically analyze findings and the accounts around them to separate true threats from benign activity at scale. Drawing on log activity, resource configuration, internet reachability, and historical findings, it delivers triage reports that match expert-level accuracy, freeing your team to focus on what matters.
- Purpose-built AI workload security: AWS extends the enterprise security controls you already trust to address the unique demands of AI workloads. Amazon Bedrock helps you build and deploy generative AI applications, with hundreds of top foundation models plus built-in safety controls, guardrails, and evaluation tools. Amazon Bedrock AgentCore Identity keeps you in full control of what your AI agents can access.
- Full-stack multicloud security: AWS Security Hub Extended delivers full-stack security by integrating AWS services with 21 curated partner solutions across nine categories, from endpoint and identity to AI, with pay-as-you-go pricing, one console, and one bill. All findings flow in OCSF format with zero integration work, and a risk correlation engine traces paths across multicloud so your team fixes root causes rather than chasing symptoms.
- AWS Partner solutions: A dedicated partner demo pedestal runs live demonstrations from select AWS Partners, showing how their solutions integrate with AWS to address your most critical security challenges. With over 25 partners rotating throughout Business Hall hours, you get a firsthand view of how these integrations work together to strengthen your security posture.
Theater sessions: Want to go deeper on a specific topic without committing to a full session? During expo hours, our theater hosts 15-minute AWS and partner talks curated around the challenges enterprise security teams face today. Topics range from enabling AI adoption securely, to unifying visibility across clouds, to automating response. Subject matter experts from AWS and our partners lead each session and give you insights you can bring back to your team. Featured sessions include:
- From finding to fix at machine speed with AWS Continuum
- Securing the agentic AI stack
- Architecting defense-in-depth for AI workloads
- Network security strategies for the post-Mythos era
- One console for unified full-stack security
For the latest theater session schedule, including dates and times, visit AWS at Black Hat 2026.
Engagement Zone: Take a quick break and test your detection skills in a gamified, hands-on challenge. Race the clock to resolve security issues and collect power-ups that speed your mission to secure the environment. Rack up your score, lock in your percentile rank, and see how you stack up against every other player.
Beyond the booth: Sessions and executive roundtable
AWS security experts share insights at speaking sessions and host an executive roundtable at Black Hat USA 2026.
Speaking Session | Machine-Speed Defense: Building an Autonomous Security Operations Loop for the AI Era
Wednesday, August 5, 10:15–10:35 AM PDT
Pulse Stage 2
In a post-Mythos world, organizations need to use AI-powered reasoning to discover, correlate, validate, and remediate security exposures at machine speed. This session provides a blueprint for building an autonomous security operations loop, using business-context graphs and sandbox validation, to unlock machine-speed defense as a durable competitive edge.
Executive Roundtable | Autonomous Defense at Cloud Scale: Critical Choices for Security Leaders Today
Wednesday, August 5, 11:00 AM–12:00 PM PDT
Breakers F
As agentic AI and frontier models reshape the threat landscape, foundational security remains essential, and organizations that layer autonomous workload governance on top can turn AI into a true security force multiplier. This executive roundtable explores how to build a durable, adaptive security harness that accounts for the real economics of AI-powered defense and evolves alongside rapidly advancing models and techniques.
Briefing | ThreatForest: Automated Attack Trees from Source Code
Thursday, August 6, 2:35–3:15 PM PDT
Jasmine, Level 3
Threat modeling is critical, but manual processes can’t keep pace with cloud-focused architectures. This briefing will dive into how ThreatForest uses six specialized AI agents to automatically analyze source code and produce validated attack trees mapped to MITRE ATT&CK with actionable mitigations. Attendees walk away with the open source tool and a reusable multi-agent architecture pattern.
AWS activities and events
Beyond the expo floor, AWS hosts a portfolio of ancillary events built for focused conversations and networking across the security community. Join us at:
- Global Startup Program Reception: For the emerging customer and builder community
- AWS Customer & Partner Appreciation Event: Welcome reception honoring the customers and partners we’re proud to work alongside
Security LIVE! broadcast
Catch Security LIVE! on-site at Mandalay Bay on Wednesday, August 5 and Thursday, August 6. This infotainment-style broadcast brings AWS and AWS Partners together to solve real security challenges for customers across 20-minute conversational segments, covering everything from data protection and compliance to application and perimeter security. With over 30 segments, Security LIVE! showcases the breadth of the AWS security partner ecosystem. Stop by the set to watch it unfold live.
Join us in Las Vegas
Whether you’re exploring how to secure AI workloads, adopting autonomous remediation as frontier models like Mythos reshape the landscape, or unifying security across domains and clouds, the AWS team at Black Hat USA 2026 is ready to help.
Learn more about AWS Security solutions at AWS Cloud Security.
See you in Las Vegas, August 3–6, 2026.
S9 E12: 2022 Midterms & Subway: Last Week Tonight with John Oliver
Post Syndicated from LastWeekTonight original https://www.youtube.com/watch?v=TNDgVRlOnkE
Why Would Anyone Automate a Window?
Post Syndicated from BeardedTinker original https://www.youtube.com/watch?v=YNXU2M671iY