How Open Universities Australia modernized their data platform and significantly reduced their ETL costs with AWS Cloud Development Kit and AWS Step Functions

Post Syndicated from Michael Davies original https://aws.amazon.com/blogs/big-data/how-open-universities-australia-modernized-their-data-platform-and-significantly-reduced-their-etl-costs-with-aws-cloud-development-kit-and-aws-step-functions/

This is a guest post co-authored by Michael Davies from Open Universities Australia.

At Open Universities Australia (OUA), we empower students to explore a vast array of degrees from renowned Australian universities, all delivered through online learning. We offer students alternative pathways to achieve their educational aspirations, providing them with the flexibility and accessibility to reach their academic goals. Since our founding in 1993, we have supported over 500,000 students to achieve their goals by providing pathways to over 2,600 subjects at 25 universities across Australia.

As a not-for-profit organization, cost is a crucial consideration for OUA. While reviewing our contract for the third-party tool we had been using for our extract, transform, and load (ETL) pipelines, we realized that we could replicate much of the same functionality using Amazon Web Services (AWS) services such as AWS Glue, Amazon AppFlow, and AWS Step Functions. We also recognized that we could consolidate our source code (much of which was stored in the ETL tool itself) into a code repository that could be deployed using the AWS Cloud Development Kit (AWS CDK). By doing so, we had an opportunity to not only reduce costs but also to enhance the visibility and maintainability of our data pipelines.

In this post, we show you how we used AWS services to replace our existing third-party ETL tool, improving the team’s productivity and producing a significant reduction in our ETL operational costs.

Our approach

The migration initiative consisted of two main parts: building the new architecture and migrating data pipelines from the existing tool to the new architecture. Often, we would work on both in parallel, testing one component of the architecture while developing another at the same time.

From early in our migration journey, we began to define a few guiding principles that we would apply throughout the development process. These were:

  • Simple and modular – Use simple, reusable design patterns with as few moving parts as possible. Structure the code base to prioritize ease of use for developers.
  • Cost-effective – Use resources in an efficient, cost-effective way. Aim to minimize situations where resources are running idly while waiting for other processes to be completed.
  • Business continuity – As much as possible, make use of existing code rather than reinventing the wheel. Roll out updates in stages to minimize potential disruption to existing business processes.

Architecture overview

The following Diagram 1 is the high-level architecture for the solution.

Diagram 1: Overall architecture of the solution, using AWS Step Functions, Amazon Redshift and Amazon S3

The following AWS services were used to shape our new ETL architecture:

  • Amazon Redshift – A fully managed, petabyte-scale data warehouse service in the cloud. Amazon Redshift served as our central data repository, where we would store data, apply transformations, and make data available for use in analytics and business intelligence (BI). Note: The provisioned cluster itself was deployed separately from the ETL architecture and remained unchanged throughout the migration process.
  • AWS Cloud Development Kit (AWS CDK) – The AWS Cloud Development Kit (AWS CDK) is an open-source software development framework for defining cloud infrastructure in code and provisioning it through AWS CloudFormation. Our infrastructure was defined as code using the AWS CDK. As a result, we simplified the way we defined the resources we wanted to deploy while using our preferred coding language for development.
  • AWS Step Functions – With AWS Step Functions, you can create workflows, also called State machines, to build distributed applications, automate processes, orchestrate microservices, and create data and machine learning pipelines. AWS Step Functions can call over 200 AWS services including AWS Glue, AWS Lambda, and Amazon Redshift. We used the AWS Step Function state machines to define, orchestrate, and execute our data pipelines.
  • Amazon EventBridge – We used Amazon EventBridge, the serverless event bus service, to define the event-based rules and schedules that would trigger our AWS Step Functions state machines.
  • AWS Glue – A data integration service, AWS Glue consolidates major data integration capabilities into a single service. These include data discovery, modern ETL, cleansing, transforming, and centralized cataloging. It’s also serverless, which means there’s no infrastructure to manage. includes the ability to run Python scripts. We used it for executing long-running scripts, such as for ingesting data from an external API.
  • AWS Lambda – AWS Lambda is a highly scalable, serverless compute service. We used it for executing simple scripts, such as for parsing a single text file.
  • Amazon AppFlow – Amazon AppFlow enables simple integration with software as a service (SaaS) applications. We used it to define flows that would periodically load data from selected operational systems into our data warehouse.
  • Amazon Simple Storage Service (Amazon S3) – An object storage service offering industry-leading scalability, data availability, security, and performance. Amazon S3 served as our staging area, where we would store raw data prior to loading it into other services such as Amazon Redshift. We also used it as a repository for storing code that could be retrieved and used by other services.

Where practical, we made use of the file structure of our code base for defining resources. We set up our AWS CDK to refer to the contents of a specific directory and define a resource (for example, an AWS Step Functions state machine or an AWS Glue job) for each file it found in that directory. We also made use of configuration files so we could customize the attributes of specific resources as required.

Details on specific patterns

In the above architecture Diagram 1, we showed multiple flows by which data could be ingested or unloaded from our Amazon Redshift data warehouse. In this section, we highlight four specific patterns in more detail which were utilized in the final solution.

Pattern 1: Data transformation, load, and unload

Several of our data pipelines included significant data transformation steps, which were primarily performed through SQL statements executed by Amazon Redshift. Others required ingestion or unloading of data from the data warehouse, which could be performed efficiently using COPY or UNLOAD statements executed by Amazon Redshift.

In keeping with our aim of using resources efficiently, we sought to avoid running these statements from within the context of an AWS Glue job or AWS Lambda function because these processes would remain idle while waiting for the SQL statement to be completed. Instead, we opted for an approach where SQL execution tasks would be orchestrated by an AWS Step Functions state machine, which would send the statements to Amazon Redshift and periodically check their progress before marking them as either successful or failed. The following Diagram 2 shows this workflow.

Data transformation, load, and unload

Diagram 2: Data transformation, load, and unload pattern using Amazon Lambda and Amazon Redshift within an AWS Step Function

Pattern 2: Data replication using AWS Glue

In cases where we needed to replicate data from a third-party source, we used AWS Glue to run a script that would query the relevant API, parse the response, and store the relevant data in Amazon S3. From here, we used Amazon Redshift to ingest the data using a COPY statement. The following Diagram 3 shows this workflow.

Image 3: Copying from external API to Redshift with AWS Glue

Diagram 3: Copying from external API to Redshift with AWS Glue

Note: Another option for this step would be to use Amazon Redshift auto-copy, but this wasn’t available at time of development.

Pattern 3: Data replication using Amazon AppFlow

For certain applications, we were able to use Amazon AppFlow flows in place of AWS Glue jobs. As a result, we could abstract some of the complexity of querying external APIs directly. We configured our Amazon AppFlow flows to store the output data in Amazon S3, then used an EventBridge rule based on an End Flow Run Report event (which is an event which is published when a flow run is complete) to trigger a load into Amazon Redshift using a COPY statement. The following Diagram 4 shows this workflow.

By using Amazon S3 as an intermediate data store, we gave ourselves greater control over how the data was processed when it was loaded into Amazon Redshift, when compared with loading the data directly to the data warehouse using Amazon AppFlow.

Image 4: Using Amazon AppFlow to integrate external data

Diagram 4: Using Amazon AppFlow to integrate external data to Amazon S3 and copy to Amazon Redshift

Pattern 4: Reverse ETL

Although most of our workflows involve data being brought into the data warehouse from external sources, in some cases we needed the data to be exported to external systems instead. This way, we could run SQL queries with complex logic drawing on multiple data sources and use this logic to support operational requirements, such as identifying which groups of students should receive specific communications.

In this flow, shown in the following Diagram 5, we start by running an UNLOAD statement in Amazon Redshift to unload the relevant data to files in Amazon S3. From here, each file is processed by an AWS Lambda function, which performs any necessary transformations and sends the data to the external application through one or more API calls.

Image 5: Reverse ETL workflow, sending data back out to external data sources

Diagram 5: Reverse ETL workflow, sending data back out to external data sources

Outcomes

The re-architecture and migration process took 5 months to complete, from the initial concept to the successful decommissioning of the previous third-party tool. Most of the architectural effort was completed by a single full-time employee, with others on the team primarily assisting with the migration of pipelines to the new architecture.

We achieved significant cost reductions, with final expenses on AWS native services representing only a small percentage of projected costs compared to continuing with the third-party ETL tool. Moving to a code-based approach also gave us greater visibility of our pipelines and made the process of maintaining them quicker and easier. Overall, the transition was seamless for our end users, who were able to view the same data and dashboards both during and after the migration, with minimal disruption along the way.

Conclusion

By using the scalability and cost-effectiveness of AWS services, we were able to optimize our data pipelines, reduce our operational costs, and improve our agility.

Pete Allen, an analytics engineer from Open Universities Australia, says, “Modernizing our data architecture with AWS has been transformative. Transitioning from an external platform to an in-house, code-based analytics stack has vastly improved our scalability, flexibility, and performance. With AWS, we can now process and analyze data with much faster turnaround, lower costs, and higher availability, enabling rapid development and deployment of data solutions, leading to deeper insights and better business decisions.”

Additional resources


About the Authors

Michael Davies is a Data Engineer at OUA. He has extensive experience within the education industry, with a particular focus on building robust and efficient data architecture and pipelines.

Emma Arrigo is a Solutions Architect at AWS, focusing on education customers across Australia. She specializes in leveraging cloud technology and machine learning to address complex business challenges in the education sector. Emma’s passion for data extends beyond her professional life, as evidenced by her dog named Data.

Fake Reddit and WeTransfer Sites are Pushing Malware

Post Syndicated from Bruce Schneier original https://www.schneier.com/blog/archives/2025/01/fake-reddit-and-wetransfer-sites-are-pushing-malware.html

There are thousands of fake Reddit and WeTransfer webpages that are pushing malware. They exploit people who are using search engines to search sites like Reddit.

Unsuspecting victims clicking on the link are taken to a fake WeTransfer site that mimicks the interface of the popular file-sharing service. The ‘Download’ button leads to the Lumma Stealer payload hosted on “weighcobbweo[.]top.”

Boingboing post.

Migration to Zabbix 7.0

Post Syndicated from Rogerio Batista original https://blog.zabbix.com/migration-to-zabbix-7-0/29594/

Based in northern Brazil, TO HOST Data Centers provides regional cloud services with a focus on cloud computing, colocation, and infrastructure management. With 35 suppliers and partners and over 5,000 monitored assets, their mission is to provide innovative IT infrastructure products and services with a high level of proficiency, in order to meet the high standards required by their clients and partners. To do this, they need to monitor internal applications, data center assets, devices, and customer environments, ensuring high availability and optimal performance.

The challenge:

TO HOST’s monitoring environment included a standalone server (Zabbix, FrontEnd, Database) with the following:

  • Hosts: ~600
  • Itens/Metrics: ~90.000
  • Average period for history table: 45~60 days
  • Average period for trends table: 365 days
  • Average period for events table: 365 days
  • 3 Internal Proxies
  • 8 Client Proxies
  • ~30 External Active Agents

TO HOST needed a clean installation of Zabbix Server and Zabbix Proxy version 7.0.x on separate virtual machines with an updated operating system (Oracle 9), plus a migration of the current monitoring environment database to the new version, while preserving history and data integrity.

Their production servers were outdated, featuring a CentOS 7 version that was originally installed with Zabbix version 5.2.x and updated to version 6.0.x in 2022. The migration needed to retain historical data and ensure compatibility with Zabbix 7.0.x, while keeping service interruptions to a minimum.

A number of risks were anticipated and planned for – during the data migration process, it was understood that there may be failures in migrating the database due to version incompatibility and that there was a distinct possibility of collection failures that would require corrections after migration, if any data sources were not properly mapped.

All graphs needed to be reviewed and optimized to take advantage of the new widget models and improvements in Zabbix 7.0. Due to the changes in data sources (and because of the migration to a new operating system and a new version of the Zabbix Server) there was potential version incompatibility.

Directories containing custom scripts and images were mapped and files were copied in order to ensure integrity, and the TO HOST team was prepared for possible service interruptions during the upgrade process, standing ready to notify users about the planned maintenance and creating procedures to minimize the impact.

The solution:

Step one was to make sure that the change to Zabbix 7.0 was appropriately planned. A change schedule was created, and all relevant stakeholders were notified of the operation. A virtualized environment was then set up on Oracle 9, in order to guarantee a clean installation.

Once that was done, Zabbix 7.0 was installed, keeping in mind that the imported database could not exist on the new server. Next up was a full backup and the cloning of the database for integrity validation pre-migration. At this point, the To Host team stopped the data collection service, started the backup, and started restore.

From that point, it became a simple matter of carrying out automated database versioning and data source mapping corrections. The data mapping during the Zabbix 7.0 migration involved updating the database structure to meet the new version’s requirements, such as changes to MySQL instances, fields, and storage formats.

Data mapping in the Zabbix migration process involved the following:

  • Database Version: During migration, the database structure changed to align with the requirements of Zabbix 7.0. This included different versioning of MySQL instances, as well as modifications to fields, tables, and storage formats within the database.
  • Import and Update Process: The legacy database (version 6) was exported and then imported into the new Zabbix 7.0 installation. During the process, Zabbix ran automatic update scripts to convert the old database into the new format.
  • Data Sources: Each item monitored in Zabbix was associated with a unique key (item key) that defined how data was collected and processed. No changes were identified in this process.
  • Tools and Validations: Mapping validation was performed during the import/restore process, where error logs indicated inconsistencies. During testing, inconsistencies were found in the validation, requiring a command to update the keys replicated on the migration.

Data collection services were then restarted, and all stakeholders were notified of the completion of the change.

The results:

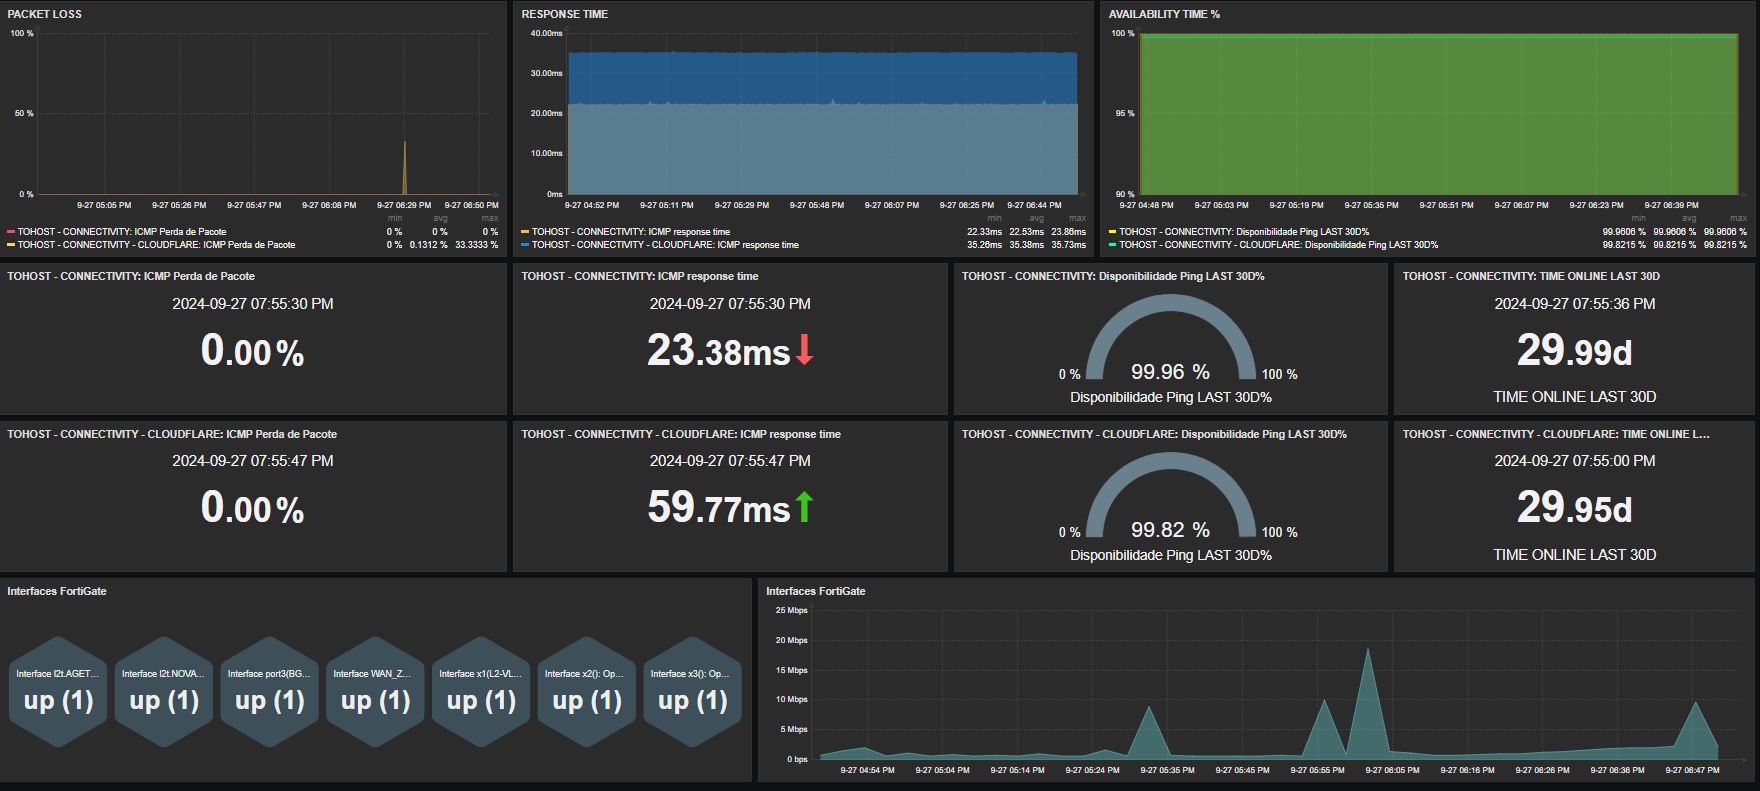
Zabbix 7.0’s new dashboards and improved visual configuration have increased the satisfaction of internal customers, while having a tangible impact on operational efficiency and customer satisfaction.

The implementation and management of Zabbix 7.0 has enhanced the continuous visibility and integrity of TO HOST’s IT systems, enabling real-time monitoring and alerting, facilitating proactive issue resolution, and guaranteeing optimal infrastructure performance.

Many users have noted that the asynchronous polling method used in Zabbix 7.0 significantly reduces the time taken for metric collection. This allows for faster incident detection and resolution in TO HOST’s critical environment, while the addition of multi-factor authentication and improved access controls has helped to enhance security in monitoring environments and keep cyber threats at bay.

TO HOST’s future plans include exploring advanced Zabbix 7.0 features and continuous performance monitoring. A roadmap is already in place to leverage the additional automation and security enhancements that Zabbix 7.0 can provide.

The post Migration to Zabbix 7.0 appeared first on Zabbix Blog.

За 20-те% истина в говоренето за строежит

Post Syndicated from Боян Юруков original https://yurukov.net/blog/2025/istinata-za-stroejite/

Темата за градоустройството и разрешителните за стоеж в София отново се завъртя в ефира. Хвърлят се твърдения, протести, документи. Истината е, че имаме пълното право да сме недоволни, още повече като ни кажат, че мачът е свирен за много от наболелите теми.

Също толкова обаче е вярно, че над 80% от твърденията, които четем в медиите за градоустройството и конкретни строежи не са верни. Защо твърдя това? Не съм архитект, не работя в общината или строителна компания. Това, което правя обаче е от години е да следя документите, процесите, да изследвам, аргументирам, да обсъждам както с архитекти отчаяни от гилдията си, така и от чиновници в местната администрация и служители в инвеститори в строителството, на които също им е писнало вече.

Първото общо между тях е, че ги е страх да излязат с имената си. Страх ги е от самите инвеститори и финансовите интереси. Страх ги е също от Камарата на архитектите и политически машинации, което обаче пак идва от въпросните инвеститори. Другото общо обаче е, че покрай описанията им за аспекти от проблемите, нарочен саботаж и укриване от служители в администрацията, кадруване и конфликт на интереси в общината и ДНСК, лобизъм и корупция както в местната власт, така и в НС, говорят, че никой не разбира цялата картина. Толкова е обширна темата, че никой няма поглед над дори половината от заровените скелети по устройствени планове, решения и параметри заложени години назад. Същото съм забелязал и аз в разговорите и когато съм се заемал да оборвам с документи твърдения на строители, районни кметове и общински съветници.

Та ако някой ви каже, че знае точно какъв е проблемът, то знайте, че лъже. Тези, които знаят най-много, обикновено публично говорят друго и умишлено отклоняват вниманието атакувайки опитите да се разплете тази каша бидейки в голяма степен сред „архитектите“ на сегашния хаос.

Това също позволява на много да подвеждат и откровено да лъжат с определени обекти, как се е стигнало до строеж или събаряне. Че не са знаели, че са нямали полезни ходове преди и прочие. Всъщност, всеки документ, който виждате публикуван, включително от мен, е предшестван от множество комисии, уведомления към районни кметове, експерти и прочие. Дали е обърнато внимание и дали са имали капацитет да обърнат внимание е важна тема, която трябва да се засегне, но не го правим.

Та призивът ми е да не забравяме, че всяко нещо, което някой пуска като сензация, пряко или прикрито обвинение и протест, показва не повече от 20% от истината. Останалото е или измислено, или подвеждащо, или премълчано. И да, в това число включвам както Балкантон, така и няколкото нашумели обекти в Изгрев, високи сгради по Черни връх и Симеоново и прочие. Включително аз пускам съобщения за нови строежи и ги придружавам с документите. Като правило в заповедите и разрешенията за строеж пише коя комисия го е предложила и аргументирала, кой е протестирал и как, какви дела са били загубени от общината и прочие.

Четете, ако ви е грижа. Шаренията по картата ми може да покаже само къде да насочите вниманието си, но се иска следващи стъпки.

The post За 20-те% истина в говоренето за строежит first appeared on Блогът на Юруков.

Scaling Our Rate Limits to Prepare for a Billion Active Certificates

Post Syndicated from Let's Encrypt original https://letsencrypt.org/2025/01/30/scaling-rate-limits.html

Let’s Encrypt protects a vast portion of the Web by providing TLS certificates to over 550 million websites—a figure that has grown by 42% in the last year alone. We currently issue over 340,000 certificates per hour. To manage this immense traffic and maintain responsiveness under high demand, our infrastructure relies on rate limiting. In 2015, we introduced our first rate limiting system, built on MariaDB. It evolved alongside our rapidly growing service but eventually revealed its limits: straining database servers, forcing long reset times on subscribers, and slowing down every request.

We needed a solution built for the future—one that could scale with demand, reduce the load on MariaDB, and adapt to real-world subscriber request patterns. The result was a new rate limiting system powered by Redis and a proven virtual scheduling algorithm from the mid-90s. Efficient and scalable, and capable of handling over a billion active certificates.

Rate Limiting a Free Service is Hard

In 2015, Let’s Encrypt was in early preview, and we faced a unique challenge. We were poised to become incredibly popular, offering certificates freely and without requiring contact information or email verification. Ensuring fair usage and preventing abuse without traditional safeguards demanded an atypical approach to rate limiting.

We decided to limit the number of certificates issued—per week—for each registered domain. Registered domains are a limited resource with real costs, making them a natural and effective basis for rate limiting—one that mirrors the structure of the Web itself. Specifically, this approach targets the effective Top-Level Domain (eTLD), as defined by the Public Suffix List (PSL), plus one additional label to the left. For example, in new.blog.example.co.uk, the eTLD is .co.uk, making example.co.uk the eTLD+1.

Counting Events Was Easy

For each successfully issued certificate, we logged an entry in a table that recorded the registered domain, the issuance date, and other relevant details. To enforce rate limits, the system scanned this table, counted the rows matching a given registered domain within a specific time window, and compared the total to a configured threshold. This simple design formed the basis for all future rate limits.

Counting a Lot of Events Got Expensive

By 2019, we had added six new rate limits to protect our infrastructure as demand for certificates surged. Enforcing these limits required frequent scans of database tables to count recent matching events. These operations, especially on our heavily-used authorizations table, caused significant overhead, with reads outpacing all other tables—often by an order of magnitude.

Rate limit calculations were performed early in request processing and often. Counting rows in MariaDB, particularly for accounts with rate limit overrides, was inherently expensive and quickly became a scaling bottleneck.

Adding new limits required careful trade-offs. Decisions about whether to reuse existing schema, optimize indexes, or design purpose-built tables helped balance performance, complexity, and long-term maintainability.

Buying Runway — Offloading Reads

In late 2021, we updated our control plane and Boulder—our in-house CA software—to route most API reads, including rate limit checks, to database replicas. This reduced the load on the primary database and improved its overall health. At the same time, however, latency of rate limit checks during peak hours continued to rise, highlighting the limitations of scaling reads alone.

Sliding Windows Got Frustrating

Subscribers were frequently hitting rate limits unexpectedly, leaving them unable to request certificates for days. This issue stemmed from our use of relatively large rate limiting windows—most spanning a week. Subscribers could deplete their entire limit in just a few moments by repeating the same request, and find themselves locked out for the remainder of the week. This approach was inflexible and disruptive, causing unnecessary frustration and delays.

In early 2022, we patched the Duplicate Certificate limit to address this rigidity. Using a naive token-bucket approach, we allowed users to “earn back” requests incrementally, cutting the wait time—once rate limited—to about 1.4 days. The patch worked by fetching recent issuance timestamps and calculating the time between them to grant requests based on the time waited. This change also allowed us to include a Retry-After timestamp in rate limited responses. While this improved the user experience for this one limit, we understood it to be a temporary fix for a system in need of a larger overhaul.

When a Problem Grows Large Enough, It Finds the Time for You

Setting aside time for a complete overhaul of our rate-limiting system wasn’t easy. Our development team, composed of just three permanent engineers, typically juggles several competing priorities. Yet by 2023, our flagging rate limits code had begun to endanger the reliability of our MariaDB databases.

Our authorizations table was now regularly read an order of magnitude more than any other. Individually identifying and deleting unnecessary rows—or specific values—had proved unworkable due to poor MariaDB delete performance. Storage engines like InnoDB must maintain indexes, foreign key constraints, and transaction logs for every deletion, which significantly increases overhead for concurrent transactions and leads to gruelingly slow deletes.

Our SRE team automated the cleanup of old rows for many tables using the PARTITION command, which worked well for bookkeeping and compliance data. Unfortunately, we couldn’t apply it to most of our purpose-built rate limit tables. These tables depend on ON DUPLICATE KEY UPDATE, a mechanism that requires the targeted column to be a unique index or primary key, while partitioning demands that the primary key be included in the partitioning key.

Indexes on these tables—such as those tracking requested hostnames—often grew larger than the tables themselves and, in some cases, exceeded the memory of our smaller staging environment databases, eventually forcing us to periodically wipe them entirely.

By late 2023, this cascading confluence of complexities required a reckoning. We set out to design a rate limiting system built for the future.

The Solution: Redis + GCRA

We designed a system from the ground up that combines Redis for storage and the Generic Cell Rate Algorithm (GCRA) for managing request flow.

Why Redis?

Our engineers were already familiar with Redis, having recently deployed it to cache and serve OCSP responses. Its high throughput and low latency made it a candidate for tracking rate limit state as well.

By moving this data from MariaDB to Redis, we could eliminate the need for ever-expanding, purpose-built tables and indexes, significantly reducing read and write pressure. Redis’s feature set made it a perfect fit for the task. Most rate limit data is ephemeral—after a few days, or sometimes just minutes, it becomes irrelevant unless the subscriber calls us again. Redis’s per-key Time-To-Live would allow us to expire this data the moment it was no longer needed.

Redis also supports atomic integer operations, enabling fast, reliable counter updates, even when increments occur concurrently. Its “set if not exist” functionality ensures efficient initialization of keys, while pipeline support allows us to get and set multiple keys in bulk. This combination of familiarity, speed, simplicity, and flexibility made Redis the natural choice.

Why GCRA?

The Generic Cell Rate Algorithm (GCRA) is a virtual scheduling algorithm originally designed for telecommunication networks to regulate traffic and prevent congestion. Unlike traditional sliding window approaches that work in fixed time blocks, GCRA enforces rate limits continuously, making it well-suited to our goals.

A rate limit in GCRA is defined by two parameters: the emission interval and the burst tolerance. The emission interval specifies the minimum time that must pass between consecutive requests to maintain a steady rate. For example, an emission interval of one second allows one request per second on average. The burst tolerance determines how much unused capacity can be drawn on to allow short bursts of requests beyond the steady rate.

When a request is received, GCRA compares the current time to the Theoretical Arrival Time (TAT), which indicates when the next request is allowed under the steady rate. If the current time is greater than or equal to the TAT, the request is permitted, and the TAT is updated by adding the emission interval. If the current time plus the burst tolerance is greater than or equal to the TAT, the request is also permitted. In this case, the TAT is updated by adding the emission interval, reducing the remaining burst capacity.

However, if the current time plus the burst tolerance is less than the TAT, the request exceeds the rate limit and is denied. Conveniently, the difference between the TAT and the current time can then be returned to the subscriber in a Retry-After header, informing their client exactly how long to wait before trying again.

To illustrate, consider a rate limit of one request per second (emission interval = 1s) with a burst tolerance of three requests. Up to three requests can arrive back-to-back, but subsequent requests will be delayed until “now” catches up to the TAT, ensuring that the average rate over time remains one request per second.

What sets GCRA apart is its ability to automatically refill capacity gradually and continuously. Unlike sliding windows, where users must wait for an entire time block to reset, GCRA allows users to retry as soon as enough time has passed to maintain the steady rate. This dynamic pacing reduces frustration and provides a smoother, more predictable experience for subscribers.

GCRA is also storage and computationally efficient. It requires tracking only the TAT—stored as a single Unix timestamp—and performing simple arithmetic to enforce limits. This lightweight design allows it to scale to handle billions of requests, with minimal computational and memory overhead.

The Results: Faster, Smoother, and More Scalable

The transition to Redis and GCRA brought immediate, measurable improvements. We cut database load, improved response times, and delivered consistent performance even during periods of peak traffic. Subscribers now experience smoother, more predictable behavior, while the system’s increased permissiveness allows for certificates that the previous approach would have delayed—all achieved without sacrificing scalability or fairness.

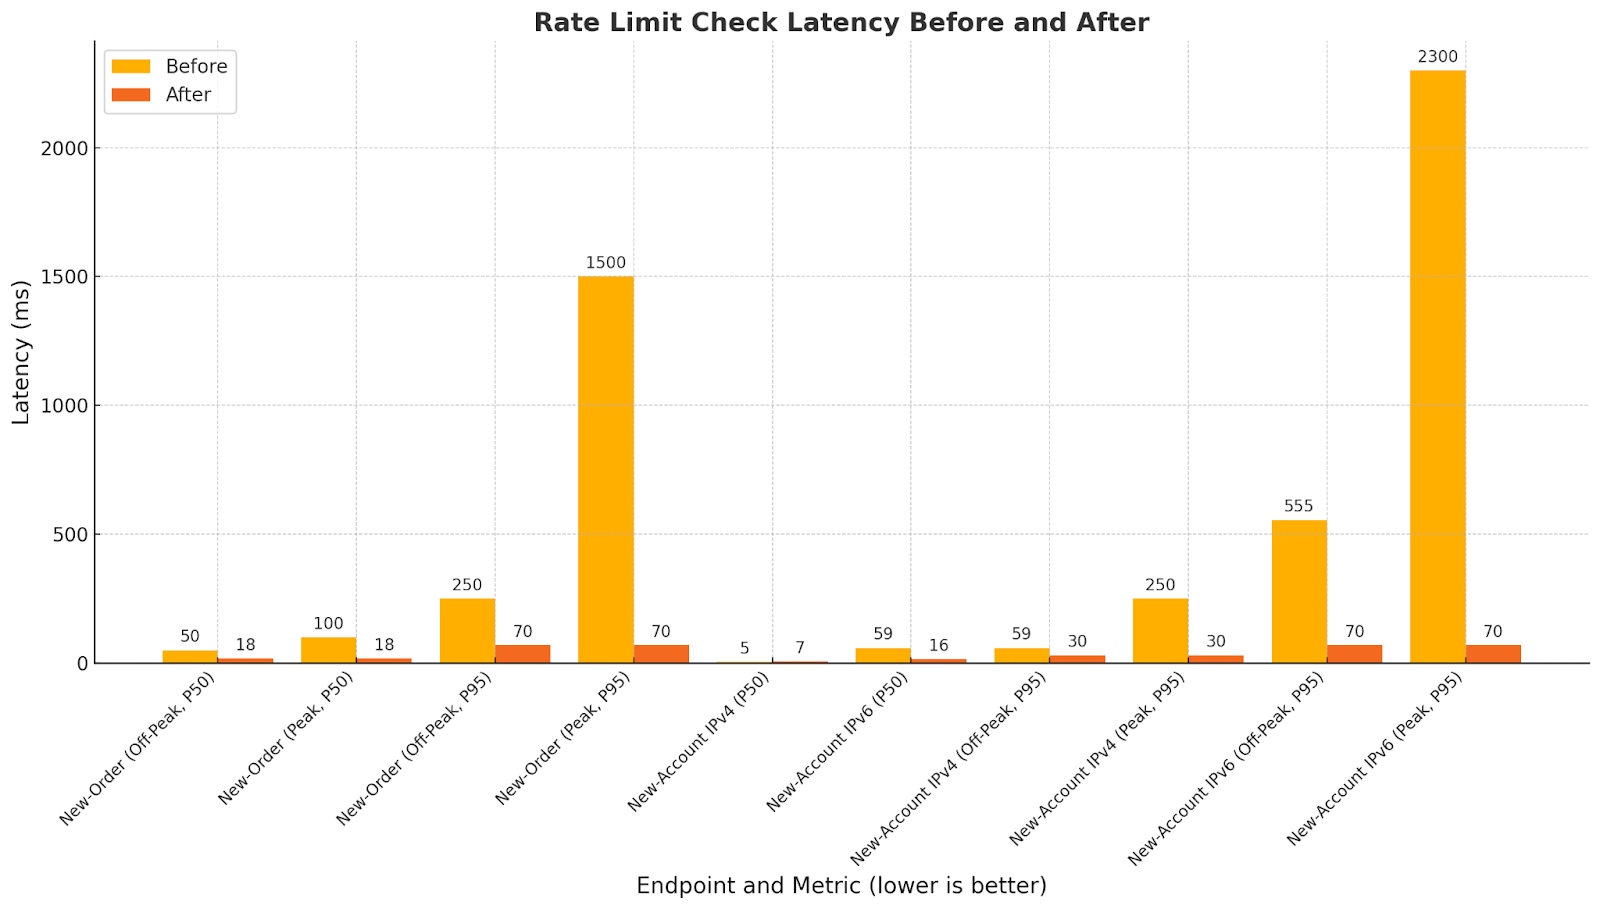
Rate Limit Check Latency

Check latency is the extra time added to each request while verifying rate limit compliance. Under the old MariaDB-based system, these checks slowed noticeably during peak traffic, when database contention caused significant delays. Our new Redis-based system dramatically reduced this overhead. The high-traffic “new-order” endpoint saw the greatest improvement, while the “new-account” endpoint—though considerably lighter in traffic—also benefited, especially callers with IPv6 addresses. These results show that our subscribers now experience consistent response times, even under peak load.

Rate Limit Check Latency Before and After chart

Database Health

Our once strained database servers are now operating with ample headroom. In total, MariaDB operations have dropped by 80%, improving responsiveness, reducing contention, and freeing up resources for mission-critical issuance workflows.

Chart showing reduction in InnoDB Row Operations

Buffer pool requests have decreased by more than 50%, improving caching efficiency and reducing overall memory pressure.

Chart showing reduction in InnoDB Buffer Pool Requests

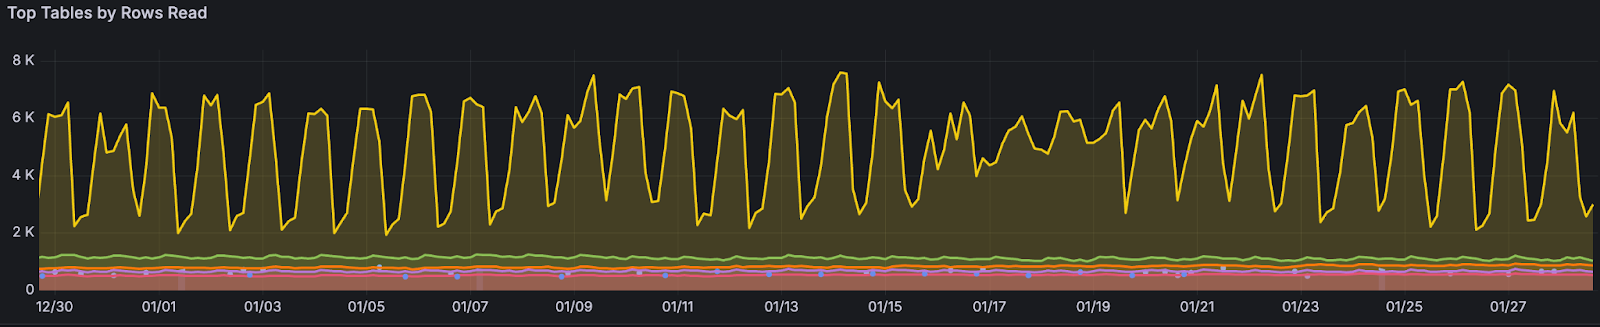
Reads of the authorizations table—a notorious bottleneck—have dropped by over 99%. Previously, this table outpaced all others by more than two orders of magnitude; now it ranks second (the green line below), just narrowly surpassing our third most-read table.

Chart showing Top Tables by Rows Read

Tracking Zombie Clients

In late 2024, we turned our new rate limiting system toward a longstanding challenge: “zombie clients.” These requesters repeatedly attempt to issue certificates but fail, often because of expired domains or misconfigured DNS records. Together, they generate nearly half of all order attempts yet almost never succeed. We were able to build on this new infrastructure to record consecutive ACME challenge failures by account/domain pair and automatically “pause” this problematic issuance. The result has been a considerable reduction in resource consumption, freeing database and network capacity without disrupting legitimate traffic.

Scalability on Redis

Before deploying the limits to track zombie clients, we maintained just over 12.6 million unique TATs across several Redis databases. Within 24 hours, that number more than doubled to 26 million, and by the end of the week, it peaked at over 30 million. Yet, even with this sharp increase, there was no noticeable impact on rate limit responsiveness. That’s all we’ll share for now about zombie clients—there’s plenty more to unpack, but we’ll save those insights and figures for a future blog post.

What’s Next?

Scaling our rate limits to keep pace with the growth of the Web is a huge achievement, but there’s still more to do. In the near term, many of our other ACME endpoints rely on load balancers to enforce per-IP limits, which works but gives us little control over the feedback provided to subscribers. We’re looking to deploy this new infrastructure across those endpoints as well. Looking further ahead, we’re exploring how we might redefine our rate limits now that we’re no longer constrained by a system that simply counts events between two points in time.

By adopting Redis and GCRA, we’ve built a flexible, efficient rate limit system that promotes fair usage and enables our infrastructure to handle ever-growing demand. We’ll keep adapting to the ever-evolving Web while honoring our primary goal: giving people the certificates they need, for free, in the most user-friendly way we can.

Scaling Our Rate Limits to Prepare for a Billion Active Certificates

Post Syndicated from Let's Encrypt original https://letsencrypt.org/2025/01/30/scaling-rate-limits/

Let’s Encrypt protects a vast portion of the Web by providing TLS certificates to over 550 million websites—a figure that has grown by 42% in the last year alone. We currently issue over 64,000 certificates per hour. To manage this immense traffic and maintain responsiveness under high demand, our infrastructure relies on rate limiting. In 2015, we introduced our first rate limiting system, built on MariaDB. It evolved alongside our rapidly growing service but eventually revealed its limits: straining database servers, forcing long reset times on subscribers, and slowing down every request.

We needed a solution built for the future—one that could scale with demand, reduce the load on MariaDB, and adapt to real-world subscriber request patterns. The result was a new rate limiting system powered by Redis and a proven virtual scheduling algorithm from the mid-90s. Efficient and scalable, and capable of handling over a billion active certificates.

Rate Limiting a Free Service is Hard

In 2015, Let’s Encrypt was in early preview, and we faced a unique challenge. We were poised to become incredibly popular, offering certificates freely and without requiring contact information or email verification. Ensuring fair usage and preventing abuse without traditional safeguards demanded an atypical approach to rate limiting.

We decided to limit the number of certificates issued—per week—for each registered domain. Registered domains are a limited resource with real costs, making them a natural and effective basis for rate limiting—one that mirrors the structure of the Web itself. Specifically, this approach targets the effective Top-Level Domain (eTLD), as defined by the Public Suffix List (PSL), plus one additional label to the left. For example, in new.blog.example.co.uk, the eTLD is .co.uk, making example.co.uk the eTLD+1.

Counting Events Was Easy

For each successfully issued certificate, we logged an entry in a table that recorded the registered domain, the issuance date, and other relevant details. To enforce rate limits, the system scanned this table, counted the rows matching a given registered domain within a specific time window, and compared the total to a configured threshold. This simple design formed the basis for all future rate limits.

Counting a Lot of Events Got Expensive

By 2019, we had added six new rate limits to protect our infrastructure as demand for certificates surged. Enforcing these limits required frequent scans of database tables to count recent matching events. These operations, especially on our heavily-used authorizations table, caused significant overhead, with reads outpacing all other tables—often by an order of magnitude.

Rate limit calculations were performed early in request processing and often. Counting rows in MariaDB, particularly for accounts with rate limit overrides, was inherently expensive and quickly became a scaling bottleneck.

Adding new limits required careful trade-offs. Decisions about whether to reuse existing schema, optimize indexes, or design purpose-built tables helped balance performance, complexity, and long-term maintainability.

Buying Runway — Offloading Reads

In late 2021, we updated our control plane and Boulder—our in-house CA software—to route most API reads, including rate limit checks, to database replicas. This reduced the load on the primary database and improved its overall health. At the same time, however, latency of rate limit checks during peak hours continued to rise, highlighting the limitations of scaling reads alone.

Sliding Windows Got Frustrating

Subscribers were frequently hitting rate limits unexpectedly, leaving them unable to request certificates for days. This issue stemmed from our use of relatively large rate limiting windows—most spanning a week. Subscribers could deplete their entire limit in just a few moments by repeating the same request, and find themselves locked out for the remainder of the week. This approach was inflexible and disruptive, causing unnecessary frustration and delays.

In early 2022, we patched the Duplicate Certificate limit to address this rigidity. Using a naive token-bucket approach, we allowed users to “earn back” requests incrementally, cutting the wait time—once rate limited—to about 1.4 days. The patch worked by fetching recent issuance timestamps and calculating the time between them to grant requests based on the time waited. This change also allowed us to include a Retry-After timestamp in rate limited responses. While this improved the user experience for this one limit, we understood it to be a temporary fix for a system in need of a larger overhaul.

When a Problem Grows Large Enough, It Finds the Time for You

Setting aside time for a complete overhaul of our rate-limiting system wasn’t easy. Our development team, composed of just three permanent engineers, typically juggles several competing priorities. Yet by 2023, our flagging rate limits code had begun to endanger the reliability of our MariaDB databases.

Our authorizations table was now regularly read an order of magnitude more than any other. Individually identifying and deleting unnecessary rows—or specific values—had proved unworkable due to poor MariaDB delete performance. Storage engines like InnoDB must maintain indexes, foreign key constraints, and transaction logs for every deletion, which significantly increases overhead for concurrent transactions and leads to gruelingly slow deletes.

Our SRE team automated the cleanup of old rows for many tables using the PARTITION command, which worked well for bookkeeping and compliance data. Unfortunately, we couldn’t apply it to most of our purpose-built rate limit tables. These tables depend on ON DUPLICATE KEY UPDATE, a mechanism that requires the targeted column to be a unique index or primary key, while partitioning demands that the primary key be included in the partitioning key.

Indexes on these tables—such as those tracking requested hostnames—often grew larger than the tables themselves and, in some cases, exceeded the memory of our smaller staging environment databases, eventually forcing us to periodically wipe them entirely.

By late 2023, this cascading confluence of complexities required a reckoning. We set out to design a rate limiting system built for the future.

The Solution: Redis + GCRA

We designed a system from the ground up that combines Redis for storage and the Generic Cell Rate Algorithm (GCRA) for managing request flow.

Why Redis?

Our engineers were already familiar with Redis, having recently deployed it to cache and serve OCSP responses. Its high throughput and low latency made it a candidate for tracking rate limit state as well.

By moving this data from MariaDB to Redis, we could eliminate the need for ever-expanding, purpose-built tables and indexes, significantly reducing read and write pressure. Redis’s feature set made it a perfect fit for the task. Most rate limit data is ephemeral—after a few days, or sometimes just minutes, it becomes irrelevant unless the subscriber calls us again. Redis’s per-key Time-To-Live would allow us to expire this data the moment it was no longer needed.

Redis also supports atomic integer operations, enabling fast, reliable counter updates, even when increments occur concurrently. Its “set if not exist” functionality ensures efficient initialization of keys, while pipeline support allows us to get and set multiple keys in bulk. This combination of familiarity, speed, simplicity, and flexibility made Redis the natural choice.

Why GCRA?

The Generic Cell Rate Algorithm (GCRA) is a virtual scheduling algorithm originally designed for telecommunication networks to regulate traffic and prevent congestion. Unlike traditional sliding window approaches that work in fixed time blocks, GCRA enforces rate limits continuously, making it well-suited to our goals.

A rate limit in GCRA is defined by two parameters: the emission interval and the burst tolerance. The emission interval specifies the minimum time that must pass between consecutive requests to maintain a steady rate. For example, an emission interval of one second allows one request per second on average. The burst tolerance determines how much unused capacity can be drawn on to allow short bursts of requests beyond the steady rate.

When a request is received, GCRA compares the current time to the Theoretical Arrival Time (TAT), which indicates when the next request is allowed under the steady rate. If the current time is greater than or equal to the TAT, the request is permitted, and the TAT is updated by adding the emission interval. If the current time plus the burst tolerance is greater than or equal to the TAT, the request is also permitted. In this case, the TAT is updated by adding the emission interval, reducing the remaining burst capacity.

However, if the current time plus the burst tolerance is less than the TAT, the request exceeds the rate limit and is denied. Conveniently, the difference between the TAT and the current time can then be returned to the subscriber in a Retry-After header, informing their client exactly how long to wait before trying again.

To illustrate, consider a rate limit of one request per second (emission interval = 1s) with a burst tolerance of three requests. Up to three requests can arrive back-to-back, but subsequent requests will be delayed until “now” catches up to the TAT, ensuring that the average rate over time remains one request per second.

What sets GCRA apart is its ability to automatically refill capacity gradually and continuously. Unlike sliding windows, where users must wait for an entire time block to reset, GCRA allows users to retry as soon as enough time has passed to maintain the steady rate. This dynamic pacing reduces frustration and provides a smoother, more predictable experience for subscribers.

GCRA is also storage and computationally efficient. It requires tracking only the TAT—stored as a single Unix timestamp—and performing simple arithmetic to enforce limits. This lightweight design allows it to scale to handle billions of requests, with minimal computational and memory overhead.

The Results: Faster, Smoother, and More Scalable

The transition to Redis and GCRA brought immediate, measurable improvements. We cut database load, improved response times, and delivered consistent performance even during periods of peak traffic. Subscribers now experience smoother, more predictable behavior, while the system’s increased permissiveness allows for certificates that the previous approach would have delayed—all achieved without sacrificing scalability or fairness.

Rate Limit Check Latency

Check latency is the extra time added to each request while verifying rate limit compliance. Under the old MariaDB-based system, these checks slowed noticeably during peak traffic, when database contention caused significant delays. Our new Redis-based system dramatically reduced this overhead. The high-traffic “new-order” endpoint saw the greatest improvement, while the “new-account” endpoint—though considerably lighter in traffic—also benefited, especially callers with IPv6 addresses. These results show that our subscribers now experience consistent response times, even under peak load.

Rate Limit Check Latency Before and After chart

Database Health

Our once strained database servers are now operating with ample headroom. In total, MariaDB operations have dropped by 80%, improving responsiveness, reducing contention, and freeing up resources for mission-critical issuance workflows.

Chart showing reduction in InnoDB Row Operations

Buffer pool requests have decreased by more than 50%, improving caching efficiency and reducing overall memory pressure.

Chart showing reduction in InnoDB Buffer Pool Requests

Reads of the authorizations table—a notorious bottleneck—have dropped by over 99%. Previously, this table outpaced all others by more than two orders of magnitude; now it ranks second (the green line below), just narrowly surpassing our third most-read table.

Chart showing Top Tables by Rows Read

Tracking Zombie Clients

In late 2024, we turned our new rate limiting system toward a longstanding challenge: “zombie clients.” These requesters repeatedly attempt to issue certificates but fail, often because of expired domains or misconfigured DNS records. Together, they generate nearly half of all order attempts yet almost never succeed. We were able to build on this new infrastructure to record consecutive ACME challenge failures by account/domain pair and automatically “pause” this problematic issuance. The result has been a considerable reduction in resource consumption, freeing database and network capacity without disrupting legitimate traffic.

Scalability on Redis

Before deploying the limits to track zombie clients, we maintained just over 12.6 million unique TATs across several Redis databases. Within 24 hours, that number more than doubled to 26 million, and by the end of the week, it peaked at over 30 million. Yet, even with this sharp increase, there was no noticeable impact on rate limit responsiveness. That’s all we’ll share for now about zombie clients—there’s plenty more to unpack, but we’ll save those insights and figures for a future blog post.

What’s Next?

Scaling our rate limits to keep pace with the growth of the Web is a huge achievement, but there’s still more to do. In the near term, many of our other ACME endpoints rely on load balancers to enforce per-IP limits, which works but gives us little control over the feedback provided to subscribers. We’re looking to deploy this new infrastructure across those endpoints as well. Looking further ahead, we’re exploring how we might redefine our rate limits now that we’re no longer constrained by a system that simply counts events between two points in time.

By adopting Redis and GCRA, we’ve built a flexible, efficient rate limit system that promotes fair usage and enables our infrastructure to handle ever-growing demand. We’ll keep adapting to the ever-evolving Web while honoring our primary goal: giving people the certificates they need, for free, in the most user-friendly way we can.

Cyber Security Cloud, Inc. accelerates sales with CloudSmart Insights and Amazon SES

Post Syndicated from Anne Grahn original https://aws.amazon.com/blogs/messaging-and-targeting/cyber-security-cloud-inc-accelerates-sales-with-cloudsmart-insights-and-amazon-ses/

In today’s rapidly evolving digital landscape, effective content curation is essential for businesses to stand out and connect with their target audience.

Optimizing customer outreach can be a difficult task. Sales intelligence can help you use data to understand customer behavior, attract prospects with relevant messaging, and focus sales and marketing efforts where they’ll make the most impact.

Web security service provider Cyber Security Cloud Inc. (CSC) is using CloudSmart Insights and Amazon Simple Email Service (SES) to curate and deliver targeted content, and to drive sales of its web application firewall (WAF) automation service, WafCharm.

What is CloudSmart Insights?
CloudSmart Insights is a go-to-market (GTM) and co-sell intelligence solution for Amazon Web Services (AWS) Marketplace sellers. CloudSmart Insights helps remove guesswork, and the need for manual authoring and analyzing of reports from AWS Marketplace seller operations. With CloudSmart Insights, AWS Marketplace sellers can easily visualize sales and forecasts without the need for custom coding, business intelligence (BI) authoring, or data science skills.

CloudSmart Insights’ private offer feature on the AWS Marketplace empowers other Marketplace sellers to deliver personalized customer experiences tailored to individual needs. By curating targeted messages, CloudSmart Insights can provide their customers with valuable resources, guidance, and access to relevant features, helping to maximize investments from the outset. The feature allows CloudSmart Insights’ customers to create customized rules for cost, quantity, and duration, streamlining both single private offers and large-scale sales plays.

What is Amazon SES?
Amazon Simple Email Service (Amazon SES) is a cloud-based email service provider that can integrate into any application for high-volume email automation. Amazon SES supports a variety of deployments including dedicated, shared, or owned IP addresses. Reports on sender statistics and email deliverability tools can help you make every email count. Whether you use an email software to send transactional emails, marketing emails, or promotional emails, you pay only for what you use.

Who is Cyber Security Cloud, Inc.?
CSC provides web application security services powered by advanced artificial intelligence (AI) and global threat intelligence. CSC’s WafCharm is a managed cloud-based web application firewall (WAF) service that seamlessly integrates with AWS WAF to enhance the security of web applications deployed on AWS. WafCharm simplifies the process of configuring, managing, and updating AWS WAF rules, making it easier for your organization to protect web applications from threats.

The opportunity
CSC wanted to increase customer engagement and provide detailed guidance to facilitate the acceptance of private offers from AWS Marketplace. Delivering curated content was a central objective to increase the efficacy of communications. CSC turned to CloudSmart Insights to support customized messaging built on Amazon SES.

The solution
CSC chose CloudSmart Insights’ private offer curation feature to engage with existing and prospective customers using AWS Marketplace. Customers who  discover, purchase, and deploy CSC WafCharm now receive personalized communications directly from CloudSmart Insights through Amazon SES.

CSC uses the CloudSmart insight offer report to preview upcoming renewals, and creates curated messages via the CloudSmart private offer messaging feature. The integration with Amazon SES allows transactional messages to be curated to the customer’s needs, providing additional instructions, resources, and details of the offer. With this flexibility, CSC can manage renewals efficiently and deploy targeted promotional offers that increase engagement with buyers. Amazon SES also allows CSC to confirm that messages are sent from a trusted source.

CloudSmart Insights uses an Amazon QuickSight serverless architecture to allow automatic scaling and meet user requirements, without manual server management. This architecture helps keep dashboards responsive during peak usage periods.

By embedding Amazon QuickSight into CloudSmart Insights, CSC uses the systems they have already found to be effective and decreases the amount of individual configuration needed to examine data. AWS Marketplace provides CSC with APIs for creating and managing catalog products, offers, and agreements. The APIs also provide read-and-write actions to create, list, and manage private offers.

The steps for creating a custom private offer with CloudSmart Insights are fully detailed in this blog post.

The outcome

Integrating CloudSmart Insights with Amazon SES allowed CSC to target specific customer segments based on their interests, purchasing behavior, or demographics, reducing the time taken to send private offers from one hour to 5 minutes per offer extended.

“With CloudSmart Insights, CSC was able to incorporate Amazon SES features such as verified identities into their sales cycle for WafCharm. This helped to improve email deliverability by establishing the authenticity of sellers’ emails, and enhance security by protecting accounts from unauthorized use.” – Takashi Yoshimi, U.S. COO, Cyber Security Cloud Inc.

By tailoring email messages to provide acceptance instructions for individual recipients, CSC increased their closure rate by 5%. Automated email workflows allowed them to nurture leads and drive sales, making it easier for customers to understand the capabilities of WafCharm.

Errors and repetitive work within the CSC marketplace deal desk were reduced, allowing CSC’s customer satisfaction, marketing, and sales teams to gather and analyze areas of customer improvement more efficiently.

Reach the right targets
CloudSmart Insights is available through AWS Marketplace to help your organization create curated private offers, and enhance your AWS Marketplace journey. Visit AWS Marketplace for more information.

To learn more about optimizing email sending, visit Amazon SES. To learn more about CSC WafCharm, please visit the WafCharm website or contact Anri Nakayama, Vice President, Partner Relations at CSC.

Announcing the AWS CDK Glue L2 Construct

Post Syndicated from Janardhan Molumuri original https://aws.amazon.com/blogs/devops/announcing-the-aws-cdk-glue-l2-construct/

Today, we’re announcing the release of the new AWS Cloud Development Kit (CDK) L2 construct for AWS Glue. This construct simplifies the correct configuration of Glue jobs, workflows, and triggers. Reviewing Glue documentation and examples of the valid parameters for each job type and language takes time, and having to rely on synth, deploy, and run-time error handling to verify configuration choices can be a frustrating developer experience. With this new construct, developers can leverage constructors that are specific to job type. The new constructors default to opinionated best-practice configuration and leverage convenience functions that reduce the time to build repeatable ETL solutions. The new Glue CDK L2 construct is available in alpha stage and will be rolled into the core CDK library after stabilization.

Background

The AWS CDK is an open-source software development framework to define cloud infrastructure in code using modern programming languages and provision it through AWS CloudFormation. It uses layering through Constructs to provide different levels of abstraction for using cloud components. Layering ensures that you never have to write too much code or have too little access to resource properties when you deploy your infrastructure as code (IaC) stacks. Layer 1 (L1) constructs map directly to CloudFormation primitives, while Layer 2 (L2) constructs provide helper functions and best practice defaults that improve the developer experience and make it easier to do the right thing.

Defining Glue resources at scale presents several challenges that this L2 construct resolves. First, developers must reference documentation to determine the valid combinations of job type, Glue version, worker type, language versions, and other parameters that are only valid in finite combinations. Additionally, developers must already know or look up the networking constraints for data source connections, and there is ambiguity with how to securely store secrets for JDBC connections. Finally, developers want prescriptive guidance via best practice defaults for throughput parameters like number of workers and batching.

The new Glue L2 construct has convenience methods and constructors that work backwards from common use cases and sets required parameters to defaults that align with recommended best practices for each job type. It also provides customers with a balance between flexibility via optional parameter overrides, and opinionated interfaces that discourages anti-patterns, resulting in reduced time to develop and deploy new resources.

Using the L2

The L2 construct only exposes the parameters that apply to each job and workflow type through their respective constructors. For instance, Python and Ray jobs don’t need to configure the Scala job parameters of extra jar files or a main class from which to start execution. Using the construct, the language and job specific configuration elements are in their own interface definitions for properties, keeping the configuration elements that are common across all jobs like job name, job description, and CloudWatch metrics in the parent job class. It also aligns to the same best practice defaults that the Glue Studio console experience provides, which provides a consistent experience when using console and CDK.

Diagram showing the hierarchy of Glue job type and language support showing valid configuration options. Three columns represent languages: Python, Java, and Ray. Three types of jobs are supported across both Python and Java: ETL, Flex ETL, and Streaming ETL. Python Shell jobs and Ray jobs are standalone types within their respective languages.

Figure 1 – Hierarchy of Glue job type and language support showing the configuration options

The new construct automatically sets the Glue job type that maps to the constructor the developer used to create the job, and sets the Glue version and language version to the latest supported version for the service. In addition, it sets defaults for parameters that the developer would otherwise have to experiment with such as timeout, number of workers, and max retries.

These interfaces, inheritance, and default values allow to us to create constructors that only require a few parameters to create a complete job, as opposed to the nearly 2 dozen options and even more numerous permutations of the valid and invalid combinations that could be made experimenting with the L1 construct. Enforcing values via interfaces means that the developer gets fail-fast feedback on the correct allowed configuration before synth or deploy time via autocomplete and Q Developer code recommendations as well.

While the construct is in the alpha stage, you’ll need to follow the process for using experimental construct libraries. After stabilization, the library will be rolled into the core CDK library and you can use it just like any other L1 or L2 construct.

Creating a new Python Spark ETL Glue Job in Typescript

The following example shows how to create a new Python Spark ETL Glue Job in Typescript.

glue_job = new glue.PySparkEtlJob(stack, 'PySparkETLJob', {
  glueIamRole,
  glue.Code.fromAsset('glue-jobs/helloworld.py'),
  jobName: 'PySparkETLJob',
});

If a developer were to override all of the optional values, the most verbose provisioning option would look like this:

glue_job = new glue.PySparkEtlJob(stack, 'PySparkETLJob', {
  jobName: 'PySparkETLJobCustomName',
  description: 'This is PySpark ETL Job',
  glueIamRole,
  glue.Code.fromAsset('glue-jobs/helloworld.py'),
  glueVersion: glue.GlueVersion.V3_0,
  continuousLogging: { enabled: false },
  workerType: glue.WorkerType.G_2X,
  maxConcurrentRuns: 100,
  timeout: cdk.Duration.hours(2),
  connections: [glue.Connection.fromConnectionName(stack, 'Connection', 'connectionName')],
  securityConfiguration: glue.SecurityConfiguration.fromSecurityConfigurationName(stack, 'SecurityConfig', 'securityConfigName'),
  tags: {
    FirstTagKey: 'FirstTagValue',
    SecondTagKey: 'SecondTagValue',
    XTagKey: 'XTagValue',
  },
  numberOfWorkers: 2,
  maxRetries: 2,
});


Creating On-Demand Workflow Triggers

The new construct also simplifies the way workflows and triggers are provisioned, leveraging the existing Schedule class to define the correct frequency of execution. It also provides helper functions to add different types of triggers.

The following example shows how to create a On-Demand Workflow Trigger.

myWorkflow = new glue.Workflow(this, "GlueWorkflow", {
    name: "MyOnDemandWorkflow";
    description: "New On Demand Workflow";
});

myWorkflow.addOnDemandTrigger(this, 'TriggerJobOnDemand', {
    actions: [{ glue_job }]
});

For more examples of how to create other job types and trigger configurations, review the Glue L2 construct documentation.

Considerations when moving to the new construct

The new construct maintained its existing functionality for Connections and Databases, Tables, and Job Run Queueing, since they’re consistent for all job types. It also enables CloudWatch logging and (if applicable) SparkUI logging by default, so using this construct will leverage those best-practice observability features unless you explicitly turn them off.

If you’re currently using an older version of Glue or of the language your Glue job supports, we recommend that you consider using this construct launch as part of an upgrade plan to take advantage of the performance, functionality, and language security enhancements for newer versions. If you prefer to stay on older versions of the service or language, we recommend you migrate to the L1 construct which isn’t opinionated about enforcing the latest versions by default.

Conclusion

The AWS CDK Glue L2 construct will migrate from its current alpha state to the AWS CDK core library after it completes the stabilization phase, which usually takes 3 months. For more details on the new Glue L2 construct and examples of its use, see the Glue CDK documentation. As always, if you have any feedback on the new construct or the CDK in general, you may create a GitHub issue on AWS CDK GitHub repository.

If you’re new to AWS CDK and want to get started, we highly recommend checking out the CDK documentation and the CDK workshop.

Natalie White

Natalie White is a Principal Solutions Architect at Amazon Web Services. She helps Healthcare and Life Sciences customers deploy solutions to AWS, and uses her software development background to accelerate infrastructure as code automation using the AWS Cloud Development Kit (CDK). She also consults engineering leaders on DevOps cultural transformations.

Janardhan Molumuri

Janardhan Molumuri is a Principal Technical Account Manager at AWS. He has over two decades of Engineering leadership experience advising customers on Cloud Adoption strategies and emerging technologies including generative AI. He has passion for speaking, writing, and enjoys exploring technology trends to solve problems at scale.

Hybrid big data analytics with Amazon EMR on AWS Outposts

Post Syndicated from Shoukat Ghouse original https://aws.amazon.com/blogs/big-data/hybrid-big-data-analytics-with-amazon-emr-on-aws-outposts/

Businesses require powerful and flexible tools to manage and analyze vast amounts of information. Amazon EMR has long been the leading solution for processing big data in the cloud. Amazon EMR is the industry-leading big data solution for petabyte-scale data processing, interactive analytics, and machine learning using over 20 open source frameworks such as Apache Hadoop, Hive, and Apache Spark. However, data residency requirements, latency issues, and hybrid architecture needs often challenge purely cloud-based solutions.

Enter Amazon EMR on AWS Outposts—a groundbreaking extension that brings the power of Amazon EMR directly to your on-premises environments. This innovative service merges the scalability, performance (the Amazon EMR runtime for Apache Spark is 4.5 times more performant than Apache Spark 3.5.1), and ease of Amazon EMR with the control and proximity of your data center, empowering enterprises to meet stringent regulatory and operational requirements while unlocking new data processing possibilities.

In this post, we dive into the transformative features of EMR on Outposts, showcasing its flexibility as a native hybrid data analytics service that allows seamless data access and processing both on premises and in the cloud. We also explore how it integrates smoothly with your existing IT infrastructure, providing the flexibility to keep your data where it best fits your needs while performing computations entirely on premises. We examine a hybrid setup where sensitive data remains locally in Amazon S3 on Outposts and public data in an AWS Regional Amazon Simple Storage Service bucket. This configuration allows you to augment your sensitive on-premises data with cloud data while making sure all data processing and compute runs on-premises in AWS Outposts Racks.

Solution overview

Consider a fictional company named Oktank Finance. Oktank aims to build a centralized data lake to store vast amounts of structured and unstructured data, enabling unified access and supporting advanced analytics and big data processing for data-driven insights and innovation. Additionally, Oktank must comply with data residency requirements, making sure that confidential data is stored and processed strictly on premises. Oktank also needs to enrich their datasets with non-confidential and public market data stored in the cloud on Amazon S3, which means they should be able to join datasets across their on-premises and cloud data stores.

Traditionally, Oktank’s big data platforms tightly coupled compute and storage resources, creating an inflexible system where decommissioning compute nodes could lead to data loss. To avoid this situation, Oktank aims to decouple compute from storage, allowing them to scale down compute nodes and repurpose them for other workloads without compromising data integrity and accessibility.

To meet these requirements, Oktank decides to adopt Amazon EMR on Outposts as their big data analytics platform and Amazon S3 on Outposts as their on-premises data store for their data lake. With EMR on Outposts, Oktank can make sure that all compute occurs on premises within their Outposts rack while still being able to query and join the public data stored in Amazon S3 with their confidential data stored in S3 on Outposts, using the same unified data APIs. For data processing, Oktank can choose from a wide variety of applications available on Amazon EMR. In this post, we use Spark as the data processing framework.

This approach makes sure that all data processing and analytics are performed locally within their on-premises environment, allowing Oktank to maintain compliance with data privacy and regulatory requirements. Simultaneously, by avoiding the need to replicate public data to their on-premises data centers, Oktank reduces storage costs and simplifies their end-to-end data pipelines by eliminating additional data movement jobs.

The following diagram illustrates the high-level solution architecture.

As explained earlier, the S3 on Outposts bucket in the architecture holds Oktank’s sensitive data, which stays on the Outpost in Oktank’s data center while the Regional S3 bucket holds the non-sensitive data.

In this post, to achieve high network performance from the Outpost to the Regional S3 bucket and vice-versa, we also use AWS Direct Connect with a virtual private gateway. This is especially beneficial when you need higher query throughput to the Regional S3 bucket by making sure the traffic is routed through your own dedicated network channel to AWS.

The solution involves deploying an EMR cluster on an Outposts rack. A service link connects AWS Outposts to a Region. The service link is a necessary connection between your Outposts and the Region (or home Region). It allows for the management of the Outposts and the exchange of traffic to and from the Region.

You can also access Regional S3 buckets using this service link. However, in this post, we employ an alternate option to enable the EMR cluster to privately access the Regional S3 bucket through the local gateway. This helps optimize data access from the Regional S3 bucket as traffic is routed through Direct Connect.

To enable the EMR cluster to access Amazon S3 privately over Direct Connect, a route is configured in the Outposts subnet (marked as 2 in the architecture diagram) to direct Amazon S3 traffic through the local gateway. Upon reaching the local gateway, the traffic is routed over Direct Connect (private virtual interface) to a virtual private gateway in the Region. The second VPC (5 in diagram), which includes the S3 interface endpoint, is connected to this virtual private gateway. A route is then added to make sure that traffic can return to the EMR cluster. This setup provides more efficient, higher-bandwidth communication between the EMR cluster and Regional S3 buckets.

For big data processing, we use Amazon EMR. Amazon EMR supports access to local S3 on Outposts with the Apache Hadoop S3A connector from Amazon EMR version 7.0.0 onwards. EMR File System (EMRFS) with S3 on Outposts is not supported. We use EMR Studio notebooks for running interactive queries on the data. We also submit Spark jobs as a step on the EMR cluster. We also use the AWS Glue Data Catalog as the external Hive compatible metastore, which serves as the central technical metadata catalog. The Data Catalog is a centralized metadata repository for all your data assets across various data sources. It provides a unified interface to store and query information about data formats, schemas, and sources. Additionally, we use AWS Lake Formation for access controls on the AWS Glue table. You still need to control the raw files access on the S3 on Outposts bucket with AWS Identity and Access Management (IAM) permissions in this architecture. At the time of writing, Lake Formation can’t directly manage access to data on the S3 on Outposts bucket. Access to the actual data files stored in the S3 on Outposts bucket is managed with IAM permissions.

In the following sections, you will implement this architecture for Oktank. We focus on a specific use case for Oktank Finance, where they maintain sensitive customer stockholding data in a local S3 on Outposts bucket. Additionally, they have publicly available stock details stored in a Regional S3 bucket. Their goal is to explore both the datasets within their on-premises Outpost setup. Additionally, they need to enrich the customer stock holdings data by combining it with the publicly available stock details data.

First, we explore how to access both datasets using an EMR cluster. Then, we demonstrate the process of performing joins between the local and public data. We also demonstrate how to use Lake Formation to effectively manage permissions for these tables. We explore two primary scenarios throughout this walkthrough. In the interactive use case, we demonstrate how users can connect to the EMR cluster and run queries interactively using EMR Studio notebooks. This approach allows for real-time data exploration and analysis. Additionally, we show you how to submit batch jobs to Amazon EMR using EMR steps for automated, scheduled data processing. This method is ideal for recurring tasks or large-scale data transformations.

Prerequisites

Complete the following prerequisite steps:

  1. Have an AWS account and a role with administrator access. If you don’t have an account, you can create one.
  2. Have an Outposts rack installed and running.
  3. Create an EC2 key pair. This allows you to connect to the EMR cluster nodes even if Regional connectivity is lost.
  4. Set up Direct Connect. This is required only if you want to deploy the second AWS CloudFormation template as explained in the following section.

Deploy the CloudFormation stacks

In this post, we’ve divided the setup into four CloudFormation templates, each responsible for provisioning a specific component of the architecture. The templates come with default parameters, which you may need to adjust based on your specific configuration requirements.

Stack1 provisions the network infrastructure on Outposts. It also creates the S3 on Outposts bucket and Regional S3 bucket. It copies the sample data to the buckets to simulate the data setup for Oktank. Confidential data for customer stock holdings is copied to the S3 on Outposts bucket, and non-confidential data for stock details is copied to the Regional S3 bucket.

Stack2 provisions the infrastructure to connect to the Regional S3 bucket privately using Direct Connect. It establishes a VPC with private connectivity to both the regional S3 bucket and the Outposts subnet. It also creates an Amazon S3 VPC interface endpoint to allow private access to Amazon S3. It establishes a virtual private gateway for connectivity between the VPC and Outposts subnet. Lastly, it configures a private Amazon Route 53 hosted zone for Amazon S3, enabling private DNS resolution for S3 endpoints within the VPC. You can skip deploying this stack if you don’t need to route traffic using Direct Connect.

Stack3 provisions the EMR cluster infrastructure, AWS Glue database, and AWS Glue tables. The stack creates an AWS Glue database named oktank_outpostblog_temp and three tables under it: stock_details, stockholdings_info, and stockholdings_info_detailed. The table stock_details contains public information for the stocks, and the data location of this table points to the Regional S3 bucket. The tables stockholdings_info and stockholdings_info_detailed contain confidential information, and their data location is in the S3 on Outposts bucket. It also creates a runtime role named outpostblog-runtimeRole1. A runtime role is an IAM role that you associate with an EMR step, and jobs use this role to access AWS resources. With runtime roles for EMR steps, you can specify different IAM roles for the Spark and the Hive jobs, thereby scoping down access at a job level. This allows you to simplify access controls on a single EMR cluster that is shared between multiple tenants, wherein each tenant can be isolated using IAM roles. This stack also grants the required permissions on the runtime role to grant access on the Regional S3 bucket and the S3 on Outposts bucket. The EMR cluster uses a bootstrap action that runs a script to copy sample data to the S3 on Outposts bucket and the Regional S3 bucket for the two tables.

Stack4 provisions the EMR Studio. We will connect to EMR Studio notebook and interact with the data stored across S3 on Outposts and the Regional S3 bucket. This stack outputs the EMR Studio URL, which you can use to connect to EMR Studio.

Run the preceding CloudFormation stacks in sequence with an admin role to create the solution resources.

Access the data and join tables

To verify the solution, complete the following steps:

  1. On the AWS CloudFormation console, navigate to the Outputs tab of Stack4, which deployed the EMR Studio, and choose the EMR Studio URL.

This will open EMR Studio in a new window.

  1. Create a workspace and use the default options.

The workspace will launch in a new tab.

  1. Connect to the EMR cluster using the runtime role (outpostblog-runtimeRole1).

You are now connected to the EMR cluster.

  1. Choose the File Browser tab and open the notebook while choosing the kernel as PySpark.
    File browser tab
  2. Run the following query in the notebook to read from the stock details table. This table points to public data stored in the Regional S3 bucket.
    spark.sql("select * from oktank_outpostblog_temp.stock_details").show(5)

    Public data stored

  3. Run the following query to read from the confidential data stored in the local S3 on Outposts bucket:
    spark.sql("select * from oktank_outpostblog_temp.stockholdings_info").show(5)

    Confidential data

As highlighted earlier, one of the requirements for Oktank is to enrich the preceding data with data from the Regional S3 bucket.

  1. Run the following query to join the preceding two tables:
    spark.sql("select customerid,sharesheld,purchasedate, a.stockid, b.stockname,b.category,b.currentprice from oktank_outpostblog_temp.stockholdings_info a inner join oktank_outpostblog_temp.stock_details b on a.stockid=b.stockid order by customerid").show(10)

    S3 on Outposts

Control access to tables using Lake Formation

In this post, we also showcase how you can control access to the tables using Lake Formation. To demonstrate, let’s block access to RuntimeRole1 on the stockholdings_info table.

  1. On the Lake Formation console, choose Tables in the navigation pane.
  2. Select the table stockholdings_info and on the Actions menu, choose View to view the current access permissions on this table.
    AWS Lake Formation
  3. Select IAMAllowedPrincipals from the list of principals and choose Revoke to revoke the permission.
    Revoke permissions
  4. Go back to the EMR Studio notebook and rerun the earlier query.
    Data access query fails

Oktank’s data access query fails because Lake Formation has denied permission to the runtime role; you will need to adjust the permissions.

  1. To resolve this issue, return to the Lake Formation console, select the stockholdings_info table, and on the Actions menu, choose Grant.
  2. Assign the necessary permissions to the runtime role to make sure it can access the table.
    Grant permission
  3. Select IAM users and roles and choose the runtime role (outpostblog-runtimeRole1).
    Grant data lake permissions
  4. Choose the table stockholdings_info from the list of tables and for Table permissions, select Select.
    Table permissions
  5. Select All data access and choose Grant.
    Data permissions
  6. Go back to the notebook and rerun the query.
    Rerun the query

The query now succeeds because we granted access to the runtime role connected to the EMR cluster through the EMR Studio notebook. This demonstrates how Lake Formation allows you to manage permissions on your Data Catalog tables.

The previous steps only restrict access to the table in the catalog, not to the actual data files stored in the S3 on Outposts bucket. To control access to these data files, you need to use IAM permissions. As mentioned earlier, Stack3 in this post handles the IAM permissions for the data. For access control on the Regional S3 bucket with Lake Formation, you don’t need to specifically provide IAM permissions on the specific S3 bucket to the roles. Lake Formation manages the Regional S3 bucket access controls for runtime roles. Refer to Introducing runtime roles for Amazon EMR steps: Use IAM roles and AWS Lake Formation for access control with Amazon EMR for detailed guidance on managing access to a Regional S3 bucket with Lake Formation and EMR runtime roles.

Submit a batch job

Next, let’s submit a batch job as an EMR step on the EMR cluster. Before we do that, let’s confirm there is currently no data in the table stockholdings_info_detailed. Run the following query in the notebook:

spark.sql("select * from oktank_outpostblog_temp.stockholdings_info_detailed").show(10)

Submit a batch job
You will not see any data in this table. You can now detach the notebook from the cluster.
You will now insert data in this table using a batch job submitted as an EMR step.

  1. On the EMR console, navigate to the cluster EMROutpostBlog and submit a step.
  2. Choose Spark Application for Type.
  3. Select the py script from the scripts folder in your S3 bucket created by the CloudFormation template.
  4. For Permissions, choose the runtime role (outpostblog-RuntimeRole1).
  5. Choose Add step to submit the job.

Wait for the job to complete. The job inserted data into the stockholdings_info_detailed table. You can rerun the earlier query in the notebook to verify the data:

spark.sql("select * from oktank_outpostblog_temp.stockholdings_info_detailed").show(10)

Verify the data

Clean up

To avoid incurring further charges, delete the CloudFormation stacks.

  1. Before deleting Stack4, run the following shell command (with the %%sh magic command) in the EMR Studio notebook to delete the objects from the S3 on Outposts bucket:
    aws s3api delete-objects --bucket <replace with value of key S3OutpostBucketAccessPointAlias1 from stack 3 output> --delete "$(aws s3api list-object-versions --bucket <replace with value of key S3OutpostBucketAccessPointAlias1 from stack 3 output> --output=json | jq '{Objects: [.Versions[]|{Key:.Key,VersionId:.VersionId}], Quiet: true}')"

    Delete the objects from the S3 on Outposts bucket

  2. Next, manually delete the EMR workspace from the EMR Studio.
  3. You can now delete the stacks, starting with Stack4, Stack3, Stack2, and finally Stack1.

Conclusion

In this post, we demonstrated how to use Amazon EMR on Outposts as a managed big data processing service in your on-premises setup. We explored how you can set up the cluster to access data stored in an S3 on Outposts bucket on premises and also efficiently access data in the Regional S3 bucket with private networking. We also explored Glue Data Catalog as a serverless external Hive metastore and managed access control to the catalog tables using Lake Formation. We accessed the data interactively using EMR Studio notebooks and processed it as a batch job using EMR steps.

To learn more, visit Amazon EMR on AWS Outposts.

For further reading, refer to the following resources:


About the Authors

Shoukat Ghouse is a Senior Big Data Specialist Solutions Architect at AWS. He helps customers around the world build robust, efficient and scalable data platforms on AWS leveraging AWS analytics services like AWS Glue, AWS Lake Formation, Amazon Athena and Amazon EMR.

Fernando Galves is an Outpost Solutions Architect at AWS, specializing in networking, security, and hybrid cloud architectures. He helps customers design and implement secure hybrid environments using AWS Outposts, focusing on complex networking solutions and seamless integration between on-premises and cloud infrastructure.

LWN in EPUB format

Post Syndicated from corbet original https://lwn.net/Articles/1006562/

For years we have had occasional requests to be able to receive LWN in
a format for ebook readers. It took a while, but we are now happy to
announce that all of LWN’s feature content is available, to subscribers at
the “professional hacker” level and above, in the EPUB format. To obtain
the weekly edition as an EPUB file, just click the “Download EPUB” link in
the left column. There is a separate RSS feed
for the EPUB format as well. Any other feature content can be turned into
an ebook by appending /epub to its URL.

We will also be creating special EPUB books at times. As an example of
what is possible, our complete coverage from Kangrejos 2024 and the 2024 Linux Storage, Filesystem,
Memory Management, and BPF Summit
are available to all readers.

There are surely places where our EPUB books can be improved; please feel
free to drop us a note (at [email protected]) with suggestions.

Credential-leaking vulnerability in some Git credential managers

Post Syndicated from daroc original https://lwn.net/Articles/1006691/

Security researcher RyotaK

has shared
a series of vulnerabilities that all have to do with how Git
interfaces with external
credential managers. In short, while Git guards against newline characters
(\n) being injected into a repository’s URL, some programming languages
also treat carriage return characters (\r) as being newlines. Adding a
carriage return to a repository’s URL can cause Git and the credential manager
to disagree on how the URL should be parsed, ultimately resulting in Git
credentials being sent to the wrong host. Malicious repositories could include
Git submodules with malformed URLs, triggering the bug. Only password-based authentication
with an external credential manager is
vulnerable to this attack; SSH-based authentication remains secure. The Git project
has chosen to consider this a vulnerability in Git, given the large amount of
external software affected. The project has fixed the bug on its end by

releasing updates
for all supported versions that ban
carriage returns in URLs entirely.

Affected software includes GitHub Desktop, Git LFS, and possibly other Git utilities:

Since Git itself doesn’t use .lfsconfig file, specifying the URL that contains
the newline character in .lfsconfig causes Git LFS to insert the newline character
into the message, while bypassing […] Git’s validation.

The collective thoughts of the interwebz