On February 29, the musl project announced release
1.2.5, including support for loongarch64 and riscv32. This
release also contains support for the statx(), preadv2(),
and pwritev2() system calls.
For many network security operators, protecting application uptime can be a time-consuming challenge of baselining network traffic, investigating suspicious senders, and determining how best to mitigate risks. Simplifying this process and understanding network security posture at all times is the goal of most IT organizations that are trying to scale their applications without also needing to scale their security operations center staff. To help you with this challenge, AWS WAF introduced traffic overview dashboards so that you can make informed decisions about your security posture when your application is protected by AWS WAF.
In this post, we introduce the new dashboards and delve into a few use cases to help you gain better visibility into the overall security of your applications using AWS WAF and make informed decisions based on insights from the dashboards.
Introduction to traffic overview dashboards
The traffic overview dashboard in AWS WAF displays an overview of security-focused metrics so that you can identify and take action on security risks in a few clicks, such as adding rate-based rules during distributed denial of service (DDoS) events. The dashboards include near real-time summaries of the Amazon CloudWatch metrics that AWS WAF collects when it evaluates your application web traffic.
These dashboards are available by default and require no additional setup. They show metrics—total requests, blocked requests, allowed requests, bot compared to non-bot requests, bot categories, CAPTCHA solve rate, top 10 matched rules, and more—for each web access control list (web ACL) that you monitor with AWS WAF.
You can access default metrics such as the total number of requests, blocked requests, and common attacks blocked, or you can customize your dashboard with the metrics and visualizations that are most important to you.
These dashboards provide enhanced visibility and help you answer questions such as these:
What percent of the traffic that AWS WAF inspected is getting blocked?
What are the top originating countries for the traffic that’s getting blocked?
What are common attacks that AWS WAF detects and protects me from?
How do my traffic patterns from this week compare with last week?
The dashboard has native and out-of-the-box integration with CloudWatch. Using this integration, you can navigate back and forth between the dashboard and CloudWatch; for example, you can get a more granular metric overview by viewing the dashboard in CloudWatch. You can also add existing CloudWatch widgets and metrics to the traffic overview dashboard, bringing your tried-and-tested visibility structure into the dashboard.
With the introduction of the traffic overview dashboard, one AWS WAF tool—Sampled requests—is now a standalone tab inside a web ACL. In this tab, you can view a graph of the rule matches for web requests that AWS WAF has inspected. Additionally, if you have enabled request sampling, you can see a table view of a sample of the web requests that AWS WAF has inspected.
The sample of requests contains up to 100 requests that matched the criteria for a rule in the web ACL and another 100 requests for requests that didn’t match rules and thus had the default action for the web ACL applied. The requests in the sample come from the protected resources that have received requests for your content in the previous three hours.
The following figure shows a typical layout for the traffic overview dashboard. It categorizes inspected requests with a breakdown of each of the categories that display actionable insights, such as attack types, client device types, and countries. Using this information and comparing it with your expected traffic profile, you can decide whether to investigate further or block the traffic right away. For the example in Figure 1, you might want to block France-originating requests from mobile devices if your web application isn’t supposed to receive traffic from France and is a desktop-only application.
Figure 1: Dashboard with sections showing multiple categories serves as a single pane of glass
Use case 1: Analyze traffic patterns with the dashboard
In addition to visibility into your web traffic, you can use the new dashboard to analyze patterns that could indicate potential threats or issues. By reviewing the dashboard’s graphs and metrics, you can spot unusual spikes or drops in traffic that deserve further investigation.
The top-level overview shows the high-level traffic volume and patterns. From there, you can drill down into the web ACL metrics to see traffic trends and metrics for specific rules and rule groups. The dashboard displays metrics such as allowed requests, blocked requests, and more.
Notifications or alerts about a deviation from expected traffic patterns provide you a signal to explore the event. During your exploration, you can use the dashboard to understand the broader context and not just the event in isolation. This makes it simpler to detect a trend in anomalies that could signify a security event or misconfigured rules. For example, if you normally get 2,000 requests per minute from a particular country, but suddenly see 10,000 requests per minute from it, you should investigate. Using the dashboard, you can look at the traffic across various dimensions. The spike in requests alone might not be a clear indication of a threat, but if you see an additional indicator, such as an unexpected device type, this could be a strong reason for you to take follow-up action.
The following figure shows the actions taken by rules in a web ACL and which rule matched the most.
Figure 2: Multidimensional overview of the web requests
The dashboard also shows the top blocked and allowed requests over time. Check whether unusual spikes in blocked requests correspond to spikes in traffic from a particular IP address, country, or user agent. That could indicate attempted malicious activity or bot traffic.
The following figure shows a disproportionately larger number of matches to a rule indicating that a particular vector is used against a protected web application.
Figure 3: The top terminating rule could indicate a particular vector of an attack
Likewise, review the top allowed requests. If you see a spike in traffic to a specific URL, you should investigate whether your application is working properly.
Next steps after you analyze traffic
After you’ve analyzed the traffic patterns, here are some next steps to consider:
Tune your AWS WAF rules to better match legitimate or malicious traffic based on your findings. You might be able to fine-tune rules to reduce false positives or false negatives. Tune rules that are blocking legitimate traffic by adjusting regular expressions or conditions.
Configure AWS WAF logging, and if you have a dedicated security information and event management (SIEM) solution, integrate the logging to enable automated alerting for anomalies.
Set up AWS WAF to automatically block known malicious IPs. You can maintain an IP block list based on identified threat actors. Additionally, you can use the Amazon IP reputation list managed rule group, which the Amazon Threat Research Team regularly updates.
If you see spikes in traffic to specific pages, check that your web applications are functioning properly to rule out application issues driving unusual patterns.
Add new rules to block new attack patterns that you spot in the traffic flows. Then review the metrics to help confirm the impact of the new rules.
Monitor source IPs for DDoS events and other malicious spikes. Use AWS WAF rate-based rules to help mitigate these spikes.
If you experience traffic floods, implement additional layers of protection by using CloudFront with DDoS protection.
The new dashboard gives you valuable insight into the traffic that reaches your applications and takes the guesswork out of traffic analysis. Using the insights that it provides, you can fine-tune your AWS WAF protections and block threats before they affect availability or data. Analyze the data regularly to help detect potential threats and make informed decisions about optimizing.
As an example, if you see an unexpected spike of traffic, which looks conspicuous in the dashboard compared to historical traffic patterns, from a country where you don’t anticipate traffic originating from, you can create a geographic match rule statement in your web ACL to block this traffic and prevent it from reaching your web application.
The dashboard is a great tool to gain insights and to understand how AWS WAF managed rules help protect your traffic.
Use case 2: Understand bot traffic during onboarding and fine-tune your bot control rule group
With AWS WAF Bot Control, you can monitor, block, or rate limit bots such as scrapers, scanners, crawlers, status monitors, and search engines. If you use the targeted inspection level of the rule group, you can also challenge bots that don’t self-identify, making it harder and more expensive for malicious bots to operate against your website.
On the traffic overview dashboard, under the Bot Control overview tab, you can see how much of your current traffic is coming from bots, based on request sampling (if you don’t have Bot Control enabled) and real-time CloudWatch metrics (if you do have Bot Control enabled).
During your onboarding phase, use this dashboard to monitor your traffic and understand how much of it comes from various types of bots. You can use this as a starting point to customize your bot management. For example, you can enable common bot control rule groups in count mode and see if desired traffic is being mislabeled. Then you can add rule exceptions, as described in AWS WAF Bot Control example: Allow a specific blocked bot.
The following figure shows a collection of widgets that visualize various dimensions of requests detected as generated by bots. By understanding categories and volumes, you can make an informed decision to either investigate by further delving into logs or block a specific category if it’s clear that it’s unwanted traffic.
Figure 4: Collection of bot-related metrics on the dashboard
After you get started, you can use the same dashboard to monitor your bot traffic and evaluate adding targeted detection for sophisticated bots that don’t self-identify. Targeted protections use detection techniques such as browser interrogation, fingerprinting, and behavior heuristics to identify bad bot traffic. AWS WAF tokens are an integral part of these enhanced protections.
AWS WAF creates, updates, and encrypts tokens for clients that successfully respond to silent challenges and CAPTCHA puzzles. When a client with a token sends a web request, it includes the encrypted token, and AWS WAF decrypts the token and verifies its contents.
In the Bot Control dashboard, the token status pane shows counts for the various token status labels, paired with the rule action that was applied to the request. The IP token absent thresholds pane shows data for requests from IPs that sent too many requests without a token. You can use this information to fine-tune your AWS WAF configuration.
For example, within a Bot Control rule group, it’s possible for a request without a valid token to exit the rule group evaluation and continue to be evaluated by the web ACL. To block requests that are missing their token or for which the token is rejected, you can add a rule to run immediately after the managed rule group to capture and block requests that the rule group doesn’t handle for you. Using the Token status pane, illustrated in Figure 5, you can also monitor the volume of requests that acquire tokens and decide if you want to rate limit or block such requests.
Figure 5: Token status enables monitoring of the volume of requests that acquire tokens
Comparison with CloudFront security dashboard
The AWS WAF traffic overview dashboard provides enhanced overall visibility into web traffic reaching resources that are protected with AWS WAF. In contrast, the CloudFront security dashboard brings AWS WAF visibility and controls directly to your CloudFront distribution. If you want the detailed visibility and analysis of patterns that could indicate potential threats or issues, then the AWS WAF traffic overview dashboard is the best fit. However, if your goal is to manage application delivery and security in one place without navigating between service consoles and to gain visibility into your application’s top security trends, allowed and blocked traffic, and bot activity, then the CloudFront security dashboard could be a better option.
Availability and pricing
The new dashboards are available in the AWS WAF console, and you can use them to better monitor your traffic. These dashboards are available by default, at no cost, and require no additional setup. CloudWatch logging has a separate pricing model and if you have full logging enabled you will incur CloudWatch charges. See here for more information about CloudWatch charges. You can customize the dashboards if you want to tailor the displayed data to the needs of your environment.
Conclusion
With the AWS WAF traffic overview dashboard, you can get actionable insights on your web security posture and traffic patterns that might need your attention to improve your perimeter protection.
In this post, you learned how to use the dashboard to help secure your web application. You walked through traffic patterns analysis and possible next steps. Additionally, you learned how to observe traffic from bots and follow up with actions related to them according to the needs of your application.
The AWS WAF traffic overview dashboard is designed to meet most use cases and be a go-to default option for security visibility over web traffic. However, if you’d prefer to create a custom solution, see the guidance in the blog post Deploy a dashboard for AWS WAF with minimal effort.
If you have feedback about this post, submit comments in the Comments section below. If you have questions about this post, contact AWS Support.
Greg Kroah-Hartman has announced the release of seven new stable kernels: 6.7.7, 6.6.19, 6.1.80, 5.15.150, 5.10.211, 5.4.270, and 4.19.308.
As usual, they contain many important fixes throughout the kernel tree.
Security updates have been issued by CentOS (firefox and thunderbird), Debian (gsoap, python-django, and wireshark), Fedora (dotnet7.0 and gifsicle), Mageia (sympa), Oracle (postgresql:10, postgresql:12, thunderbird, and unbound), Red Hat (kpatch-patch, python-pillow, and squid:4), SUSE (nodejs12, nodejs14, nodejs16, nodejs18, and openvswitch3), and Ubuntu (linux-azure, linux-lowlatency, linux-starfive-6.5, php-guzzlehttp-psr7, and php-nyholm-psr7).
NIST has released version 2.0 of the Cybersecurity Framework:
The CSF 2.0, which supports implementation of the National Cybersecurity Strategy, has an expanded scope that goes beyond protecting critical infrastructure, such as hospitals and power plants, to all organizations in any sector. It also has a new focus on governance, which encompasses how organizations make and carry out informed decisions on cybersecurity strategy. The CSF’s governance component emphasizes that cybersecurity is a major source of enterprise risk that senior leaders should consider alongside others such as finance and reputation.
[…]
The framework’s core is now organized around six key functions: Identify, Protect, Detect, Respond and Recover, along with CSF 2.0’s newly added Govern function. When considered together, these functions provide a comprehensive view of the life cycle for managing cybersecurity risk.
The updated framework anticipates that organizations will come to the CSF with varying needs and degrees of experience implementing cybersecurity tools. New adopters can learn from other users’ successes and select their topic of interest from a new set of implementation examples and quick-start guides designed for specific types of users, such as small businesses, enterprise risk managers, and organizations seeking to secure their supply chains.
This is a big deal. The CSF is widely used, and has been in need of an update. And NIST is exactly the sort of respected organization to do this correctly.
Вредно за държавата е, ако на всеки 9 месеца политиката започва да клокочи за ново споразумяване между управляващите партии заради разпределение на властови позиции. В края на първия 9-месечен период едната от коалициите – ПП–ДБ, предложи да се надгради съюза, известен по занаятчийски като „сглобка“, до меморандум. Партньорът ѝ ГЕРБ-СДС предлага да се надгради до коалиционно споразумение.
Несъмнено ще си стиснат ръцете накрая, тъй като и двете страни разглеждат съвместната си работа в хоризонта на пълен мандат, декларират, че не искат предсрочни избори, а няма да търсят и други коалиционни партньори. Наличните като БСП и „Възраждане“ са неприемливи за заявилите се евроатлантици. Въпросите са кога и как ще бъде скрепен документално съюзът – ще бъдат ли заложени реформи на основни системи, или ще се ограничат до механизма за назначения, изобщо ще се стигне ли до кооперативно равновесие, от което (и) обществото да има известни ползи.
Двете политически сили формират обикновено мнозинство от 132 депутати – ГЕРБ–СДС с 69, а ПП–ДБ – 63. С 36-те на Движението за права и свободи надхвърлят прага от 160 гласа за избор на членове на регулаторите, който записаха в Конституцията. Със същото това квалифицирано мнозинство приеха промените в основния закон.
Между два есемеса
В настоящата ситуация политиката се люшка между есемеси и телефонни разговори на политици, пресичани от арогантни изблици на други политици, чиято политическа сила е в конкубинат с управляващите две. Съпредседателят на ПП Кирил Петков писал есемес на лидера на ГЕРБ Бойко Борисов, Борисов звънял на съпредседателя на ДБ Христо Иванов и така нататък…
Единственото сигурно е, че на 6 март премиерът Николай Денков ще подаде оставка. Но както се разбра от изявление на Борисов, не е ясно кога точката ще влезе в дневния ред на Народното събрание. Председател на 49-тия парламент все още е Росен Желязков (ГЕРБ), тъй като смяната му със съпредседателя на „Демократична България“ Атанас Атанасов е част от ротацията.
Понеже те (ПП–ДБ, б.а.) са много голямо ръководство, нашият документ ще се мъчим да е съвършен и точен, но тогава ще го предоставим на колегите за обсъждане. Никой не ни е забил датата 6 март. Денков си дава оставката, но както каза Христо Иванов, до април имаме време. След това обсъждаме с ПП. Крайният срок за разбирателство е два месеца преди евроизборите.
За България като най-вероятна дата за евроизборите се очертава 9 юни – тоест 9 април е последната възможна дата за разбирателство. На 5 март ГЕРБ ще представи проекта на партията за коалиционно споразумение, на 6-ти ще го представи на коалиционните партньори, следва конгрес на Европейската народна партия. На 8-ми Денков и Габриел ще са привършили оценките на министрите и ако сме се разбрали, вървим напред, ако ли не – гласуваме оставката на Денков и кабинета и отиваме на избори, каза Бойко Борисов.
ПП–ДБ пък не са готови да подпишат коалиционно споразумение, преди да са изминали 9-те месеца управление с премиер Мария Габриел, за да видят какво ще се случи, и едва тогава да продължат напред. Съпредседателят на ПП Кирил Петков не иска да коментира „никакви математики“, но иска да види възможно най-бързо предложението на ГЕРБ и да започнат разговори.
Да видим какво предлагат в съдебната реформа, за регулаторите, за Пепи Еврото и Нотариуса. Ако тази държава се управляваше само от министри, щеше да е процъфтяла. Тази държава се управлява от нереформирани специални служби и регулатори. Управлява се от нереформиран ВСС, който, като му натиснеш enter, гласува с един глас. Нека не отвличаме темата с разпределянето на министрите.
И въпреки че управляват заедно от 9 месеца и са във „фактическо съжителство“, от ПП–ДБ още не искат да произнесат думата „коалиция“. Ако се стигне до коалиционно споразумение обаче, ГЕРБ–СДС ще настояват за разпределение съобразно електоралната тежест, както обясни Борисов.
Първо почваме с министрите – договаряме се с тях пропорционално според електоралната тежест, изразена през депутатите в парламента. Защото сега се оказа, че ДБ имат три министерства – правосъдие, здравеопазване и туризъм. Аз ще предложа на Кирил Петков, докато готвим всичко това, още сега да започнем с КЗК, защото това му вади очите, и регулаторите, които са със 121 гласа, и след това тези, които са със 160 гласа.
По-рано Кирил Петков обяви, че 50 на 50 назначения в регулаторите гарантират взаимен контрол с ГЕРБ (меморандумът предвижда, че номинациите на двете политически сили се обсъждат и одобряват заедно без плаващи мнозинства). Но неговата политическа сила не допуска преговори за позиции в изпълнителната власт, преди да започне и да приключи процесът по избор на членове на регулаторите, на ВСС, на службите и на антикорупционната комисия. От ГЕРБ и ДПС обаче не смятат, че службите трябва да се пипат – работели добре, ловели шпиони. Е, не като във Великобритания, но преди изобщо не се и случваше.
Кога и какво се подписва
Кога ще се подпише „брачното свидетелство“ е съществен за участниците в преговорите въпрос. ПП–ДБ настояват да се случи след най-важните избори – на ръководство на антикорупционната комисия, Висшия прокурорски съвет, ключови регулатори начело с Комисията за защита на конкуренцията (КЗК). Докато ГЕРБ–СДС отрано искат да е бетонирано съгласието до края на мандата и бавят, както могат. Офертата им за коалиционно споразумение е твърде амбициозна – или е отрано написано, или е принципно съгласие за приоритети и назначения, без каквито и да било сериозни реформи. Според Борисов обаче в него ще бъде описано всичко – за регулаторите, за съдебната система и за министрите.
Целият този шум по технологиите на политическата смяна върви паралелно с разкритията за мръсните поръчки в българското правосъдие и изпълнението им от кръговете на Петьо Петров – Еврото, който е в неизвестност, и на Мартин Божанов – Нотариуса, който беше убит. Бившата районна прокурорка на София Невена Зартова не спира да говори, четиримата ѝ заместници – и те. Отново разказаха за рекета Ивайла Бакалова и мъжът ѝ Веселин Денков – този път не пред Антикорупционния фонд, а пред временната парламентарна комисия. Освен репресии като следене, подслушване, проверки на бизнеса им от страна на НАП, която се отчита на спецпрокуратурата какви ревизии прави, Бакалова каза онова, което трудно се изрича.
Прокуратурата е изключително обвързана политически и това го видяхме и при „Барселонагейт“. Всичко това вие го знаете много добре и аз не ви казвам нещо ново. Ако очаквате от мен да си мълча и да ви казвам, че Мартин Нотариуса е най-голямото зло в съдебната система и вече го няма, не мога да ви го кажа. Мартин Божанов беше един изпълнител, който хора от по-високите етажи ползваха за поръчки, и той си изкарваше парите покрай тези неща.
Разкритията за участия на висши прокурори, адвокати и някои съдии в порочни схеми зачестиха и гражданите едва ли ще запомнят имената и аферите. Затова пък затвърждават възприятието си, че съдебната система е нещо много, много мръсно, а мръсотията е потулвана благодарение на чадър от политици и институции, пълни с посочени от ГЕРБ и ДПС кадри.
Но и настоящите усилия не стигат, за да се свали чадърът над Нотариуса. Депутатката от ПП–ДБ Антоанета Цонева поиска разсекретяване на информацията бил ли е Божанов секретен сътрудник на МВР, тъй като от МВР отказват да отговорят – била класифицирана. Но според колегата ѝ Ивайло Мирчев вече навсякъде се знае, че Божанов е бил сътрудник на Трето РПУ в София.
„Ако не положите усилия, ще има още мартинбожановци в тази система“, каза Ивайла Бакалова при изслушването си от временната парламентарна комисия. Кого ще изслушват депутатите на следващото заседание, така и не стана ясно. Може да накарат МВР да се размърда или да поканят политици от собствените си редици, ако не са заети да пишат коалиционно споразумение.
За странните, чупливите, самотните – изобщо, за хората не по мярка – у нас се пише, макар и не толкова често, а още по-рядко през фантастичното и почти абсурдното. В „Академия за китове“ Виолета Златарева прави още една крачка напред, пишейки за хората с нестандартна психика (ако можем така да се изразим), уловени „в мигове, в които не са съвсем себе си“.
В тринайсетте разказа авторката облича симптоматиката на едно или друго психично разстройство в истории,
които звучат като разгърнати метафори, почти алегорично. И без да е категорична в „диагнозите“, тя се е постарала да „визуализира“ фобии, шизоидни епизоди, депресии, маниакалност, биполярност, дисоциативно разстройство, психопатия, зависимости. По думите ѝ, сборникът е пряко свързан с истинските истории на близки за нея хора, които са преминали или преминават през трудностите и изпитанията на психичните заболявания.
Да, за редовия читател тези проявления едва ли ще бъдат разпознаваеми така, както за професионалиста, ала идеята на книгата все пак не е да следва диагнози по списък. Онова, което обединява повечето герои, е човешката им различност. Няма как да не направи впечатление натрапливото усещане за тяхната капсулираност – всеки протагонист, дори тези, които влизат в някакви взаимоотношения, е като пеперуда, затворена в пашкул, отделен, сам за себе си. Точно както се случва и в живота.
И макар книгата да не дава такава заявка, тя индиректно е жест към важността на психичното здраве и грижа. Едно изречение на героинята в разказа „Жаба“ като че ли обобщава пределно точно отношението към тези хора, подценяването на състоянието им или погрешното му интерпретиране:
Тя му разказа, че има семейство, което гледа на нея като на прокажена, защото е странна и само психоложката ѝ идва на посещения и проявява някакъв вид загриженост.
В „Дух“ също ни се дава лаконично шаблонът, по който се гледа на психично различните:
Саня беше малко смахната от самото си раждане. До 5-годишна възраст говореше на свой собствен език.
В нашето общество все още е тема табу да говорим за проблеми от такова естество на висок глас и посредством разказите исках да загатна съвсем деликатно и магичното, и страшното при тези състояния. Шизоидните епизоди, освен уплах, носят със себе си и срам, а срамът на свой ред – самота,
казва за „Тоест“ Виолета Златарева. В общото усещане за емпатия и близост с героите, които авторката предизвиква у читателя, е разковничето на правилното отношение към тях. На доверието, ако щете.
А то несъмнено е подложено на изпитание. Защото някои от разказите ще се окажат видения, халюцинации, проекции на съзнанието – или каквото друго ги наречем. На този фон нищо от написаното като че ли не притежава устои, не може да бъде надеждно, достоверно. Виолета Златарева подлага читателя именно на това затруднение – той да не може да се довери на нищо докрай. Сюжетът се превръща в ронлива скала под нозете му. Психическата аберация заживява в литературното като хлъзгав конструкт на творческото въображение.
Може би не е случайно, че чувствителните самотници намират допир и разбиране с друго човешко същество именно у себеподобен. Например в „Жаба“ и в „Шепа пръст“ те се събират именно благодарение на чудатостите, халюцинациите, фобиите си. И всъщност намират щастието. По думите на Виолета, в „Жаба“ самото заболяване се изражда в утешител, като носи образите на несъществуващи личности, любови, време, а „това крие в себе си и парадокс, и красота, и въпросът кое е илюзия – гласът в слушалката или това, което той отрича“. В „Дух“ обикновената мечтателност и наивност ще отворят път към събирането на двамата младежи чрез спойката на думите – и те ще са буквално като сродни души извън този живот, съединени от силата на отвъдното.
Впрочем искам да отбележа, че един от често появяващите се символи в разказите е тъкмо този на жабата. Неслучайно сред многото му значения в различните култури е и това, че лекува отчаянието и помага при общуването, особено на хора, на които то трудно им се отдава. Пак в „Жаба“ момичето „с изключително старание подреди новия дом“ на откритото от нея животно (реално или въображаемо), който прави поносима собствената ѝ крепост.
Именно домът е другият основен топос и мотив в разказите. В „Убийци“ например семейство Иванови получава своя дом мечта на осъдима и подсъдна цена. Наистина ли е такава обаче, след като на всяка една цена може да се противопостави друга стойност? Защото макар и пътят към този съвършен дом да е морално недопустим, на практика той води до умножаване на доброто и на добрите хора, както и осигурява среда, в която детето на Иванови да расте щастливо. Убийството, види се, може да е милост, благодеяние, благотворителност. Моралът, изглежда, не е черно-бял, „особено когато е замесена любовта“.
В „Преди да седна под върбата“ героинята също ще извърви своята дълга и объркана инициация извън дома, възприеман като консерва („Всеки от нас беше тръгнал от своята консерва според своите си причини“). Тя обаче ще я доведе обратно именно до него, а знакът за правилността на това решение ще се усети в лекотата на раменете, отърсили се от багажа, от тежестта на понесеното („прокъсаната ми раница така или иначе вече не ми беше нужна и приех загубата ѝ като метафора“). Можем да мислим за завръщането и като за освобождаване.
А „пътуването – както пише Виолета Златарева – невинаги се мери в крачки“.
Разказът „Осем“ пък събира осем незавършени истории, които може да се четат и именно като прекъснати в момента на завършването им. Зависи от гледната точка. От една страна, нито една история не може да бъде приключена докрай, освен от смъртта. От друга, тя може да бъде пренасочена или прекъсната в момента на пресичането си с други истории, обстоятелства, сюжети. Осемте герои са все маргинали, хванати в момента на такава една промяна – в мига, в който с тях се случва (или по-скоро ще се случи – според нашата гледна точка) нещо преломно, решително, смело, различно…
Този път незнайно защо ги сви в юмруци и реши, че ще промени нещата,
казва си един от тях, художник. Сред останалите има самоубийца; възрастен мъж, чийто живот до този миг е бил безупречен и безпрепятствен; клептоман, изправен пред нещо, което наистина го привлича само по себе си, а не само по силата на болестния му импулс, и така нататък. Въпросното „прекосяване на съдбата“ се внася и чисто граматично – посредством съюзите, с които повествованието бива прекъсвано: докато… когато… тогава… миг преди да… но… и тъкмо да… (Тук ми се иска да направя препратка към внушителния граматичен експеримент, който предлага в последната си стихосбирка „Портокал“ и поетът Нинко Кирилов.)
Тази идея за промяната също е особено важна. Ето какво казва за нея един от героите, фотограф:
Когато заемем равновесно положение, ставаме скучни. Заставаме пред обектива и запечатваме анатомията си. Но преходът от радост към тъга, от нежност към жестокост – в него се крие магията. Кратката промяна в пулса е вълнение, продължителната – аритмия. Жалко, че е само миг. Добре, че е само миг.
Три от разказите са писани всъщност не по патологии, а по сънища, от които Виолета споделя, че „се е будила посред нощ“. Също като в съновидение разказът във „Вън“ например следва поредица от отварящи се пред нас нови врати и пространства, привидно несвързани, следващи без преход и логика. И онова усещане, че си изпуснал важното, което е било целта ти през цялото време, заради лутането из лабиринтите, в които си се оказал толкова лесно засмукан!
В „Баба“, който също е по сън, героинята среща мъртвата си роднина, която ще ѝ покаже най-човешките състояния и чувства като лица на възрастни жени, надничащи от далечните прозорци. Единствено смъртта е тази, с която човек лично трябва да се срещне, която трябва да „поздрави“.
Място е оставено и на изоставяните – нима това често само по себе си не е гранично състояние в психологически смисъл?
И както често става, самотата идва лоша,
пише в „Юни“. Във „Вътре“ пък – със съвсем малко художествена измислица, по думите на авторката – е представен ужасът от дисоциативното разстройство, отключен при отхвърлянето и измяната на партньора. Тя казва още:
Все по-често се нормализират разделите, разводите. Приемат се като формално разписване на документи, апатично разочарование и логистично затруднение. А всъщност, за чувствителния индивид, такъв акт води до вътрешни разкъсвания и пропадания, до рухване на представите за самия себе си и света изобщо.
В крайна сметка „решението“ – ако изобщо това е думата – може би е в писането, както при Дани от „Юни“, където то е и вид възмездие, почти отмъщение. А може решението да е и просто в съществуването, в това „Дишай“ от едноименния разказ. Там, в края на земята, няма нищо повече от огромен трамплин, който може би е забравеният лост на Архимед. Към какво е този трамплин – кой знае? Важното е, че точно тук за героя е „мой дом от незапомнени времена“. Той е следван от лудостта – това е и единственият път, когато тази оголена дума се споменава директно:
Не знам дали аз крепя Земята, или тя – мен, но единствено лудостта ме следва по петите и каквото и да правя, не си тръгва, а настоятелно хрипти до ухото ми.
Героят обаче няма да има търпение да дочака някой да сподели самотата му, да сподели дните му „на ръба на вълшебството“, и ще скочи с все сила в края на лоста. Колкото да открие, че Земята няма нужда от тежест, за да бъде повдигната, че тя – напротив – се спихва. Защото истинската тежест е вътре в нас и от нас.
В заключение, ще ви оставя с думите на самата Виолета Златарева, която може би най-добре резюмира посланието на първата си книга, последвана тази година и от стихосбирката „Регистър злополуки“, пак в същото издание:
Общото между всички разкази е, че персонажите в тях са острови. Независимо дали има някой до тях, или не, те са затворници в собствените си глави и само тези, които имат шанс за любов, имат и шанс за оцеляване. В противен случай остават изолирани, докато изчезнат съвсем. Точно по това си приличаме всички – и ние, и те. Иска ми се хората да разберат, че зависимостите, емоционалните дисфункции и т.н. не са проблемът, а симптом на дълбоко нараняване, на липсата на приемане и подкрепа в ключов момент или моменти.
Активните дарители на „Тоест“ получават постоянна отстъпка в размер на 20% от коричната цена на всички заглавия от каталога на издателство Scribens, както и на няколко други български издателства в рамките на партньорската програма Читателски клуб „Тоест“. За повече информация прочетете на toest.bg/club.
Никой от нас не чете единствено най-новите книги. Тогава защо само за тях се пише? „На второ четене“ е рубрика, в която отваряме списъците с книги, публикувани преди поне година, четем ги и препоръчваме любимите си от тях. Рубриката е част от партньорската програма Читателски клуб „Тоест“. Изборът на заглавия обаче е единствено на авторите – Стефан Иванов и Антония Апостолова, които биха ви препоръчали тези книги и ако имаше как веднъж на две седмици да се разходите с тях в книжарницата.
Малайзия е малко над eкватора – южно от Тайланд и северно от Сингапур. Западният ѝ бряг очертава прочутия пролив Малака – преди няколко века оттук минава Пътят на подправките. Сезоните са сух и дъждовен, но жегата в съчетание с високата влажност е постоянна величина. Бивша британска колония е, а преди това страната се е казвала Малая. Шофира се отляво, а покрай пътищата растат помело, манго, драконов плод, ананас. Ислямът е официалната религия, но са разрешени всички други и това не е само на хартия. Повечето местни ястия започват с думата нàси – ориз.
Рибарско селище / Чаена плантация / Джунгла
Коренните жители са 19 различни племена с общото название орàнг àсли – за тях роден дом е джунглата.
Тук се намира Таман Негара – най-старата дъждовна гора в света. По табелите на междуселските пътища ще видите крокодили, тапири и водни биволи, а по дърветата – тукани. Близо девет милиона души живеят в изумителната с размерите си столица Куала Лумпур, а малайското село звучно се нарича кампỳнг.
Земя на шамани и султани, Малайзия е без съмнение най-мултикултурната страна, в която съм се озовавала.
Съседите на Мохи
Селамàт пагù*! Само ви подавам ключа и изчезвам, че бързам. Ви-на-ги да заключвате вратите и прозорците, не просто да ги затваряте! Такива са ми съседите – влизат и не гледат много какво грабят. Чак после гризват телефона и се сещат, че не става за ядене. И айдеее, мятат го в храсталака.
Мохи (съкратено от Мохаммад) е от малко селце в югозападна Малайзия. Понякога му се налага да вземе телефона на жена си и да иде край близкия гъсталак да звъни на собствения си номер. За късмет, често от храстите долита познатата мелодия. Съседите на Мохи са маймуни, по-точно макаци – изкусни крадци и акробати.
Белоръкият гибон говори / Семейство макаци – най-честата гледка покрай пътищата / Варан – може да се види дори по улиците в големи градове
За един месец, в който обикаляхме страната, се научих отдалеч да познавам къде са – първо чувате звука от мощно пукане на клони и раздрусване на листа, после виждате как някое дърво силно се привежда, а накрая, ето го и него – едър сив макак, който се държи като парашутист за края на клонака и прелита от едно дърво на друго. Белоръкият гибон е още по-живописна гледка – той просто виси като прани гащи и издава особено силен звук, подобен на протяжен лай – така общува с жена си (двойките са моногамни) и скрепява връзката си. Заради този леко комичен лай наричат белоръкия гибон „шоумена на джунглата“.
Време е за копи
Ако се отбиете в някое кафене покрай селския път, малайците ще ви поднесат чаша кòпи. Това е тяхната дума за кафе и повечето хора го пият с лед. Всяка молба за гореща напитка ги обърква и по-вероятно е накрая отново да ви донесат с лед. (Другото упорито разминаване беше лютият сос. Тъй като пътувахме с тригодишната ни дъщеря, а тя не може да яде люто, непрекъснато питахме кое ястие не е. В повечето случаи ни отвръщаха: Ама ето! Това изобщо не е люто. И след секунди то се оказваше огън. Впрочем малайците по традиция си хапват лют ориз даже на закуска, а ако искате да си намажете филия – трудна работа, хлябът не е често срещан.)
Самите кафенета са на открито, под навес – няколко паянтови маси с пластмасови столчета, захабени от ползване. Мястото е почти винаги обгърнато от бухлата тропическа растителност, сред която стърчи малка мивка – за миене на ръце.
Да попаднеш в пълно малайско кафене е като да разгърнеш енциклопедия на народите. Китайци по тениски – на една маса. На втора – мюсюлманки с почти изцяло покрити лица. На трета – индийка с пъстър саронг и бинди, онази тъмночервена точка на челото. Има още араби, потомци на европейски преселници, тамили (от Южна Индия), перанаканци. И разбира се, оранг асли – коренните жители на Малайзия – 19 различни племена със свои езици и идентичност.
Високопланинският храм Chin Swee, построен от малайско-китайски милиарде / Хиндуисткият храм в чест на бог Муруган при пещерите Бату / Прочутата Розова джамия в Путраджая / Будисткият храм Kek Lok Si на остров Пенанг
Всъщност да пътуваш из Малайзия е като да бъдеш в няколко страни едновременно.
Някои от щатовете в 33-милионната държава – като Келантан и Теренгану – са подчертано мюсюлмански: има религиозна полиция, алкохолът е строго забранен, а от време на време се виждат табели с предупреждение, че ако пропуснеш няколко петъчни молитви в джамията, те чака сурово наказание. Навсякъде другаде в страната мирно съжителстват разнообразни вярвания. Точно както ще видите на Улицата на хармонията в Малака – през няколко метра са: джамията „Кампунг Клинг“, построена през 1748 г.; китайският Храм на зелените облаци, който е на 400 години и е едновременно будистки, даоистки и конфуциански; и индуисткият храм в чест на Ганеша – бога слон, който понякога поставя, а друг път премахва пречките пред вас.
Мизан, принцесата и кокошето àко
Почти всеки втори град в Малайзия започва с Куала. Куала означава „естуар“, или „срещата на две реки“. Столицата Куала Лумпур например значи „калният естуар“. Ние бяхме също и в Куала Ромпин, Куала Теренгану, Куала Селангор…
Гледки от три Куала града: Куала Кубу, Куала Лумпур и Куала Ромпин
Срещам Мизан в едно кафене в Куала Кубу. Баща му е местен, а майка му – от Индонезия. Обожава традиционните кифлички с кàя – кокосов мармалад. Мизан е запален читател и като повдигам темата за маларията и комарите, ми разказва една от известните им фолклорни приказки. Султанът се влюбил в красивата принцеса на Малака. За да провери любовта му, девойката го затрупала със седем задачи. Повечето не ги запомних, но на едната прихнах: султанът трябвало да ѝ донесе седем сърца от… комари!
На сбогуване с Мизан, който има чудесно чувство за самоирония, се заговаряме за това кои са недостатъците ни: аз споделям, че съм бъзла и лесно се отчайвам, той пък си се дразни, защото – както казвали малайците – ентусиазмът му бил като кокоше àко: изстивал много бързо. С каквото и да се захванел, бързо му доскучавало.
Съкровищата на баба-ньоня
На Мелиса Чан от Малака обаче не ѝ доскучава това, с което се е захванала. Нарича себе си събирач на бенда хари – неща от ежедневието. Мелиса е от една от най-колоритните общности в Малайзия – перанаканците, или баба-ньоня (мъжете са баба, жените – ньоня).
Те са потомци на китайски търговци, пристигнали в малайските пристанищни градове през ХIV век. Китайците уж нямали намерение да остават, но после създали семейства с малайки. Така се ражда културата на баба-ньоня, изобилна на традиционни занаяти и удивителни вярвания. Като това за Кухненския бог например. Той живее в кухнята, но често се качва да докладва на Великия небесен бог какви ги върши семейството. За да не издава лоши работи, ньоня му приготвят куи бакул – десерт от оризово брашно и захар, който е доста лепкав! Щом го налапа, устата му залепва и Кухненският бог само ломоти – нищо не му се разбира.
Известната улица Jonker в Малака, където са много от къщите и магазинчетата на баба-ньоня / Един от най-възрастните перанакански занаятчии в Джорджтаун, Пенанг
Мелиса Чан съхранява тъкмо такива мъниста от миналото и настоящето на баба-ньоня, но и не само на тази общност – тя прави документални филми за отмиращите рибарски техники на португалските преселници, както и за най-старата лаборатория за зъбни протези, известна като Музея на фалшивите зъби.
В Джорджтаун (остров Пенанг) и в Малака може все още да видите антикварното ателие на майстор на ръчно правени фенери, а също и как се създават прочутите перанакански обувки с цветни мъниста. Тези занаятчии, обучени от бащите и дядовците си, днес нямат чираци – никой не иска да наследи занаятите им, защото изискват твърде много търпение и усилия.
Тъкмо това е мисията на Мелиса Чан, според която
е огромна ценност да познаваме миналото си, а не да се държим за него като удавник за сламка. Да го развием и да се поучим от него, а не просто да е някаква сантиментална носталгия.
От Мелиса научавам и малайската фраза saling mempengaruhi – означава оплитане или взаимно влияние. Това е начинът, по който съжителстват различните култури и идентичности по тия земи.
Никога не ядем сами
За жалост, съжителството има и своите сенчести страни. Нашир и надлъж в Малайзия ще видите твърде симетричните редици маслодайни палми. Тези огромни плантации са основен бизнес на държавата и заемат мястото на изсечени джунгли – домът на много животински видове и на местните племена, днес все по-яростно изтласквани в цивилизацията. Едно от тях са семелай, според които
да нарушаваш природните закони не те прави лош човек – прави те не много умен.
Портрет на местна жена в музея на oранг aсли в Гомбак / Деца от племето мах-мери, които секат кокос с мачете / Носовата флейта на оранг асли
Житейската философия на племето се нарича пунèн, в превод от техния език: „не ям сам“. Върнат ли се от лов и събирачество, семелай поделят всичко намерено с останалите. Идеята да акумулираш богатство и да задържиш нещо изцяло за себе си не е присъща на това общество.
С избутването им по границите на джунглата и града обаче те са принудени да навлязат в модерния начин на живот. Една част са изкушени да купуват храна от магазина, да имат телевизор и малък мотор. Тъкмо тук идва челният сблъсък. В новия свят тяхното социално ДНК за здравословно споделяне започва да изглежда неразумно. А това, на което от поколения са научени – намереното да се яде на момента, както повелява природният закон – ги води до бедност, защото видят ли се с някакви пари, ги пропиляват. Онова, което преди е било логично и мъдро, сега им носи беди и бедност.
Много от тези племена все още имат своите шамани, чиято основна работа е да тъкат нишки. Защото светът на оранг асли се крепи на невидими нишки, които свързват земята, небето и подземния свят. Шаманите имат симпатичен израз за човек, който не познава природата наоколо и е сляп за нишките между всичко. Този – казват – е като жаба под кокосова черупка.
(Следва продължение)
* „Добро утро“на малайски.
Всички снимки в статията са собственост на авторката.
Grab is Southeast Asia’s leading superapp, providing a suite of services that brings essential needs to users throughout the region. Its offerings include ride-hailing, food delivery, parcel delivery, mobile payments, and more. With safety, efficiency, and user-centered design at heart, Grab remains dedicated to solving everyday issues and improving the lives of millions.
As the app continues to expand with more features, Grab identified the need for a consistent, high-quality experience for new users who may have limited storage space or restricted internet bandwidth. Read to find out more about Project Bonsai and how it reduced app download size and app disk size.
Introduction
In 2020, Google conducted research that highlighted the negative impact of app sizes on conversion rates, revealing a 1% decrease for every 6MB expansion of the app APK size. This finding prompted Grab to ensure new and existing users had a consistently excellent Grab superapp experience, given the prevalence of low-end devices and disparate internet infrastructure in Southeast Asian regions. As a result, Grab initiated Project Bonsai in Q3 2021, with the goal of reducing and optimising the app size while enhancing user experience, reducing installation barriers, and boosting user acquisition.
Understanding the problem
The Grab superapp, with over 4 million lines of code and integration with hundreds of third-party libraries, had a significant app size. Given the prevalence of low-end devices and disparate internet infrastructure in our target region, it is crucial for us to proactively and constantly ensure we are delivering excellence in app-based user experience.
Objectives of the Bonsai project
The Bonsai project focused on these two key metrics:
App Download Size: This represents the total size of the compressed APK file that users need to download from Google Play when performing a fresh installation.
App Disk Size: This encompasses the total storage space occupied by the app on user devices, including both the binary and data generated by the app.
In this article, we will share the strategy and solutions that resulted in a successful 26% reduction in App Download Size, while also reducing the App Disk Size.
Status quo
Prior to the Bonsai project, the Grab app project had implemented various measures to achieve optimal app size. Here are some notable highlights:
Leveraging App Bundle: Since 2019, Grab has been using the app bundle approach to optimise app delivery. This approach generates smaller APKs tailored to specific device configurations, ensuring users receive optimised APKs. This helps reduce the overall app size and improve installation efficiency.
Monitoring: With a team of over 100 Android engineers and multiple collaborative teams, the Grab app undergoes a weekly release process involving hundreds of commits for each release. Closely monitoring app size changes with every commit is essential for our team. The team established debug build (APK file size) monitoring for every commit merged to the master branch. Regular weekly reviews are conducted to stay updated on the app size and identify commits that might lead to changes in app size. However, occasional mismatches may occur due to discrepancies between the debug and release builds.
Monitoring the changes in APK size
R8 Integration: R8/Proguard, known as the code shrinker, obfuscator, and optimiser, has been enabled since the beginning. This powerful tool helps reduce the app’s bytecode and resources, leading to further size optimisation and improved app performance.
Resource Optimisation: The team diligently pursued resource optimisation strategies, including:
Images: Engineers were encouraged to use vector images whenever possible, as they usually have smaller file sizes than raster images. In exceptional cases where raster images were necessary, Grab adopted the webp format instead of png, utilising better image compression to minimise app size.
Language ResourceConfig: Grab enabled resourceConfig to support only the languages actively used by the Grab app, reducing unnecessary resource overhead and enhancing app efficiency.
Third-Party Libraries Review: The team established a review process for third-party libraries, assessing their size impact on the app. This practice ensured that only essential libraries were included, preventing unnecessary bloating of the app size.
Despite the application of these measures and solutions aimed at managing the app size, there was still the potential of significant expansion in magnitude.
Strategy
The Bonsai project revolves around strategic pillars, namely Measurement, Reduction, and Containment.
Project Bonsai’s three strategic pillars for continuous app size reduction
In the Measurement phase, the focus is on providing accurate information on the app’s binary composition and how individual features, modules, libraries impact the overall app size. This allows teams to make informed decisions and gain insights into their components’ influence on the app’s size.
The insights from the Measure phase provided us with a list of actionable items for our backlog. In the Reduction phase, we employ strategic action to tackle this backlog to constantly achieve optimal app size.
Optimising the app size is not a one-time endeavour, especially as more features are added over time, potentially increasing the project’s size. While there may be limited solutions to manage app size, it’s important to find a balance between size and functionality. Else, the effort and trade-offs required may become overwhelming. Therefore, in the Containment phase, we intend to introduce effective long-term strategies and solutions designed to manage the app’s size.
In the remainder of this blog post, we explore the strategic pillars and actions taken to contain the download size.
Measure
The Grab Passenger App Core team actively engages in optimisation projects and recognised the importance of measurement as the foundation for improvement. For example, enhancing the app startup time, pipeline time, build time, and more.
In every optimisation endeavour, we adhere to a crucial principle: “MEASURE” – the first and most critical step for any improvement project. As the famous quote goes, “If you can’t measure it, you can’t improve it.” This emphasises the significance of accurate and comprehensive measurement as the foundation for driving successful optimisation efforts.
In the third quarter of 2021, our team initiated an investigation into existing tools provided by both Google and the broader community. The intention was to employ tools such as APK Analyzer or Android Studio to conduct a thorough analysis of the app binary. However, it soon became evident that these tools were not well-suited to accommodate the extensive scope of our project.
In order to accommodate our discovery, we developed a custom analytics tool called App Sizer. This tool is specifically designed to analyse app binaries from bundle files. Our primary goal was to construct a solution that adheres effectively to our unique needs.
The tool was seamlessly integrated into Grab’s CI system and sends data to a Grafana instance. As a result, the tool collates and transmits daily analytics data from the release candidate branch. It offers the following key functionalities and monitors important aspects such as:
Device-specific App Download Size: Precise information about the app download size for specific devices, focusing on optimising the App Download Size.
Trends for app download size by device type
Comprehensive Size Breakdown: A breakdown of the app’s size, including the proportion attributed to the codebase Kotlin/Java, Kotlin/Java-based libraries, native libraries, resources, and other relevant factors.
Comprehensive breakdown of app download size by component
Size Contribution by Teams: Insights into the size contributed by each individual team within the project’s scope.
Breakdown of Grab’s codebase by TF
Module-wise Size Contribution: Insights into the size impacted by each module, categorised by team.
Breakdown of the codebase by TF modules
Size Contribution by Third-Party Libraries: Information about the size attributed to each third-party library incorporated within the app.
App download size contribution by external libraries and SDK breakdown
List of Large Files: A categorised list of large files (file size exceeding X value), organised by each respective team.
Large file categories broken down by TF
It’s important to note that all the size values presented within these dashboards specifically pertain to the download size, representing the contribution of each item to the overall app download size.
As part of our commitment to the developer community, we plan to open-source this tool in the near future, allowing others to benefit from its capabilities as well.
Reduce
To optimise the app based on the analysis data obtained from the measuring step, we focused on applying common solutions from Google and the suggestions from the community. There were no fancy solutions that we invented. Our concentration centered on optimising the dex file size, refining resources, and eliminating duplication and redundancy.
dex file optimisation (Java/Kotlin)
In our initial findings, it became evident that Java/Kotlin code was the major contributor of app size. Recognising this, we made it our top priority for optimisation.
R classes
During our investigation, we discovered that a proportion of the overall app size was attributable to R classes. Further research unveiled two primary reasons behind this phenomenon:
Transitive R classes: R classes contained ID references not only to their own resources but also to resources from their transitive dependencies. This meant that if Module A depended on Module B, and Module B in turn, depended on Module C (Module A -> Module B -> Module C), then Module A’s R class included IDs references to resources from Modules B and C, even if Module A didn’t directly utilise these resources. This explained why R classes in a modularised project could accumulate millions of lines of code.
A spread of Modules and Third-Party Libraries: Our Grab project comprised over 1,500 modules and integrates hundreds of third-party libraries, leading to the generation of significantly large R classes within the project. Furthermore, this discovery also explained instances where our app size monitor exhibited spikes during certain commits despite no significant additions of resources, libraries, or code within those commits. These fluctuations were linked to changes in the dependency graph, further emphasising the impact of Transitive R classes.
It is worth noting that the team had long been cognisant of the challenges posed by Transitive R classes, especially in terms of optimising build times. Consequently, we had already undertaken various initiatives to address this specific challenge related to build times.
However, it wasn’t long before we started wondering why R8 wasn’t removing unused fields from the R classes, which would have resulted in a size reduction for these classes. It turned out that back in mid-2021, we were using Android Gradle Plugin 4.0 along with the default R8 rules. One of these rules was preserving all fields in the R classes:
-keepclassmembers class **.R$* {

   public static <fields>;

}
This rule was the root cause of why unused fields in the R classes were persisting. Google removed this rule in AGP 4.1, and the solution was straightforward: updating AGP to version 4.1.1 (or newer) helped us resolve the issue.
However, due to the project’s unusual size, there was a risk of inadvertently removing non-used R class fields if there were any instances of code accessing R classes through reflection within the codebase or third-party libraries. Since our automation testing did not yet support R8, conducting a full test of the entire project was possible, but would have demanded significant effort from the team. To avoid this substantial effort, we developed a script to search the entire codebase and identify instances where reflections were used, allowing us to assess their usage. For third-party libraries, we decompiled the libraries and applied the same script to the decompiled code.
Fix & Optimise R8 Rules
Subsequently, we conducted a revision of the R8 configuration rules. This involved assessing the compiled R8 configuration file and paying specific attention to any ‘keep’ rules that contained package wildcards. It is crucial to decipher the purpose behind each rule and its reason for existence. Any rules identified as redundant were recommended for removal. Post the thorough scrutiny of the R8 rules, we initiated request tickets urging the respective teams to work on the elimination and optimisation of these rules.
Enable more aggressive optimisations
In 2019, Google began recommending the utilisation of the proguard-android-optimise.txt configuration with code optimisation enabled. However, our project’s origins predate the introduction of Google’s R8, a time when Proguard was the primary tool for code obfuscation and size reduction. Prior to the release of Android Gradle Plugin 3.4.0, there were no explicit recommendations for enabling code optimisations during the minification process. As a result, our project has persisted in using the proguard-android.txt configuration without activating the code optimisation feature.
Our team has considered adopting a more aggressive approach towards optimisation. This approach spans from exploring the optimisation mode to incorporating the R8 full mode. This includes substantial effort required for testing and addressing issues arising from the introduction of these new modes. We encountered a particular challenge wherein the R8 optimisation exhibits instability, an issue that has been reported to Google. A definitive solution remains a work-in-progress.
At present, we have decided to postpone the implementation of a more aggressive R8 mode. However, this remains a high-priority item on our agenda, and we intend to address it in the near future.
Resources optimisation
In addition to optimising the dex file, we also address resource optimisation.
Handling large resources
During the Measure phase, we use the List Of Large Files dashboard to identify large files categorised by teams. For each team, we create request tickets with straightforward guidance. These guidelines encourage the following actions:
Explore the possibility of removing unnecessary resources.
Consider offloading the resource to the Internet (server) when feasible. Within Grab, we have the Asset Delivery Kit, which facilitates hosting and downloading resources on the client side.
Optimise files by converting them to alternative formats or reducing their size. For instance, for images, we recommend utilising vector images and the Webp format, among other optimisations.
Convert PNG to Webp
The Grab app project has a long history, and while the team has recently established guidelines and implemented CI processes to promote the use of vector and Webp images, there are still existing images that have not been optimised. The team has undertaken an initiative to address these images and has converted all PNG images to Webp format wherever a reduction in file size is achievable.
Fonts
Fonts are another group of files that have a notable impact on the project’s size. We collaborate with the teams to:
Remove fonts that are rarely used in the project.
Eliminate duplicate fonts.
While the project still contains numerous fonts, we have a project to unify all features and transition to using a single font. Our recommendation is to explore the use of one primary font style, with the flexibility to incorporate different typeface variations in your programming to achieve various typefaces using the same font.
Remove stale features and replace large library
Based on the data, it was discovered that a specific library, which was contributing approximately 8% to the overall app size, had an adverse impact. This library has since been removed from the project. Moreover, through analysing the Size Contribution by Third-Party Libraries dashboard, we identified duplicates in functions and have made efforts to eliminate these redundancies.
Moreover, in Grab, we are using the feature toggle to enable or disable a feature. The feature flags are controlled remotely. It’s very useful for running an experiment or turning off if a feature causes us any problems. So, many features in the project are controlled under a feature flag. In certain cases, even when some features are deactivated, the corresponding code remains included in the binary. We identify these cases and collaborate with teams to remove the redundant code.
After six months of working on the above initiatives, the Bonsai team managed to reduce the Grab app download size by 26%. This is particularly noteworthy, considering that prior to the commencement of the Bonsai Project, the average app size exhibited a monthly increase of approximately 1%.
Containment
After dedicating over a semester to the Reduce phase, we started the transition to the Containment phase. The first step for this phase involved setting up an App Growth Rate dashboard that presents the growth rate of app download size per release. Our goal is to keep this rate as low as possible.
The team has been discovering a few solutions, such as introducing the common UI design components to prevent duplication, and experimenting with Dynamic Delivery Feature. This phase of exploration is still ongoing and we are optimistic that it will help maintain a manageable app download size, or perhaps even contribute to further optimization.
Considering alternative initiatives, the team is contemplating recognising app size as a confined resource of our application. We believe it should be the responsibility of every team to maintain an optimal app size. Based on the measurements we have, which provide an insight into each team’s impact on the total app download size, it could be advantageous to allocate an ‘app size budget’ to each team. This would entail each team taking responsibility for managing and maintaining the size influenced by their work.
Conclusion
Grab’s Project Bonsai demonstrated the company’s commitment to optimising the app experience for users in Southeast Asia. By prioritising code optimisation, resource management, modularisation, and asset bundling, we achieved substantial optimisations in app size while enhancing user experience. These efforts not only addressed the challenges we outlined, but also contributed to increased user acquisition and improved user retention rates.
Join us
Grab is the leading superapp platform in Southeast Asia, providing everyday services that matter to consumers. More than just a ride-hailing and food delivery app, Grab offers a wide range of on-demand services in the region, including mobility, food, package and grocery delivery services, mobile payments, and financial services across 428 cities in eight countries.
Powered by technology and driven by heart, our mission is to drive Southeast Asia forward by creating economic empowerment for everyone. If this mission speaks to you, join our team today!
This whitepaper summarizes OSFI’s expectations with respect to Technology and Cyber Risk Management (OSFI Guideline B-13). It also gives OSFI-regulated institutions information that they can use to commence their due diligence and assess how to implement the appropriate programs for their use of AWS Cloud services. In subsequent versions of the whitepaper, we will provide considerations for other OSFI guidelines as applicable.
In addition to this whitepaper, AWS provides updates on the evolving Canadian regulatory landscape on the AWS Security Blog and the AWS Compliance page. Customers looking for more information on cloud-related regulatory compliance in different countries around the world can refer to the AWS Compliance Center. For additional resources or support, reach out to your AWS account manager or contact us here.
If you have feedback about this post, submit comments in the Comments section below. If you have questions about this post, contact AWS Support.
Over on the Collabora blog, Faith Ekstrand has announced that the NVK Vulkan driver for NVIDIA devices will be part of Mesa 24.1 and is ready for real-world use. It should be appearing in Linux distributions later this year.
Back in october, I announced that NVK had reached Vulkan 1.0 conformance on Turing hardware. As of today NVK is now a conformant Vulkan 1.3 implementation on Turing (RTX 2000 and GTX 1600 series), Ampere (RTX 3000 series), and Ada (RTX 4000 series) GPUs. Not only have we jumped forward three Vulkan versions, but the new test runs were done with the GSP firmware enabled and includes Ampere and Ada GPUs. Also, unlike the initial 1.0 run, there are no hacks this time. Every test we passed in those conformance test runs also passes on upstream Mesa.
Polyfill.io is a popular JavaScript library that nullifies differences across old browser versions. These differences often take up substantial development time.
It does this by adding support for modern functions (via polyfilling), ultimately letting developers work against a uniform environment simplifying development. The tool is historically loaded by linking to the endpoint provided under the domain polyfill.io.
In the interest of providing developers with additional options to use polyfill, today we are launching an alternative endpoint under cdnjs. You can replace links to polyfill.io “as is” with our new endpoint. You will then rely on the same service and reputation that cdnjs has built over the years for your polyfill needs.
Our interest in creating an alternative endpoint was also sparked by some concerns raised by the community, and main contributors, following the transition of the domain polyfill.io to a new provider (Funnull).
The concerns are that any website embedding a link to the original polyfill.io domain, will now be relying on Funnull to maintain and secure the underlying project to avoid the risk of a supply chain attack. Such an attack would occur if the underlying third party is compromised or alters the code being served to end users in nefarious ways, causing, by consequence, all websites using the tool to be compromised.
Supply chain attacks, in the context of web applications, are a growing concern for security teams, and also led us to build a client side security product to detect and mitigate these attack vectors: Page Shield.
Irrespective of the scenario described above, this is a timely reminder of the complexities and risks tied to modern web applications. As maintainers and contributors of cdnjs, currently used by more than 12% of all sites, this reinforces our commitment to help keep the Internet safe.
polyfill.io on cdnjs
The full polyfill.io implementation has been deployed at the following URL:
Usage and deployment is intended to be identical to the original polyfill.io site. As a developer, you should be able to simply “replace” the old link with the new cdnjs-hosted link without observing any side effects, besides a possible improvement in performance and reliability.
If you don’t have access to the underlying website code, but your website is behind Cloudflare, replacing the links is even easier, as you can deploy a Cloudflare Worker to update the links for you:
You can also test the Worker on your website without deploying the worker. You can find instructions on how to do this in another blog post we wrote in the past.
The polyfill.io service was hosted on Fastly and used their Rust library. We forked the project to add the compatibility for Cloudflare Workers, and plan to make the fork publicly accessible in the near future.
Worker
The https://cdnjs.cloudflare.com/polyfill/[...].js endpoints are also implemented in a Cloudflare Worker that wraps our Polyfill.io fork. The wrapper uses Cloudflare’s Rust API and looks like the following:
#[event(fetch)]
async fn main(req: Request, env: Env, ctx: Context) -> Result<Response> {
    let metrics = {...};

    let polyfill_store = get_d1(&req, &env)?;
    let polyfill_env = Arc::new(service::Env { polyfill_store, metrics });

    // Run the polyfill.io entrypoint
    let res = service::handle_request(req2, polyfill_env).await;

    let status_code = if let Ok(res) = &res {
        res.status_code()
    } else {
        500
    };
    metrics
        .requests
        .with_label_values(&[&status_code.to_string()])
        .inc();

    ctx.wait_until(async move {
        if let Err(err) = metrics.report_metrics().await {
            console_error!("failed to report metrics: {err}");
        }
    });

    res
}
The wrapper only sets up our internal metrics and logging tools, so we can monitor uptime and performance of the underlying logic while calling the Polyfill.io entrypoint.
Storage for the Polyfill files
All the polyfill files are stored in a key-value store powered by Cloudflare D1. This allows us to fetch as many polyfill files as we need with a single SQL query, as opposed to the original implementation doing one KV get() per file.
For performance, we have one Cloudflare D1 instance per region and the SQL queries are routed to the nearest database.
cdnjs for your JavaScript libraries
cdnjs is hosting over 6k JavaScript libraries as of today. We are looking for ways to improve the service and provide new content. We listen to community feedback and welcome suggestions on our community forum, or cdnjs on GitHub.
Page Shield is also available to all paid plans. Log in to turn it on with a single click to increase visibility and security for your third party assets.
UEFI threats have historically been limited in number and mostly implemented by nation state actors as stealthy persistence. However, the recent proliferation of Black Lotus on the dark web, Trickbot enumeration module (late 2022), and Glupteba (November 2023) indicates that this historical trend may be changing.
With this context, it is becoming important for security practitioners to understand visibility and collection capabilities for UEFI threats. This post covers some of these areas and presents several recent Velociraptor artifacts that can be used in the field. Rapid7 has also released a white paper providing detailed information about how UEFI malware works and some of the most common types.
Background
Unified Extensible Firmware Interface, or UEFI, is the interface between a system’s hardware and its operating system (OS). The technology can be viewed as an updated BIOS capability to improve and add security to the boot process.
The two main types of UEFI persistence are:
Serial Peripheral Interface (SPI) based
Firmware payload implant that is resilient to even a hard disk format.
Difficult to implement — there are risks associated with implementing and potentially bricking a machine if there are mistakes with the firmware.
Difficult to detect at scale — defenders need to extract firmware which typically requires a signed driver, then running tools for analysis.
Typically an analyst would dump firmware, then extract variables and other interesting files like PEs for deep dive analysis.
2. EFI System Partition (ESP) based
A special FAT partition that stores bootloaders and sits late in the EFI boot process.
Much easier to implement, only requiring root privileges and to bypass Secure Boot.
Does not survive a machine format.
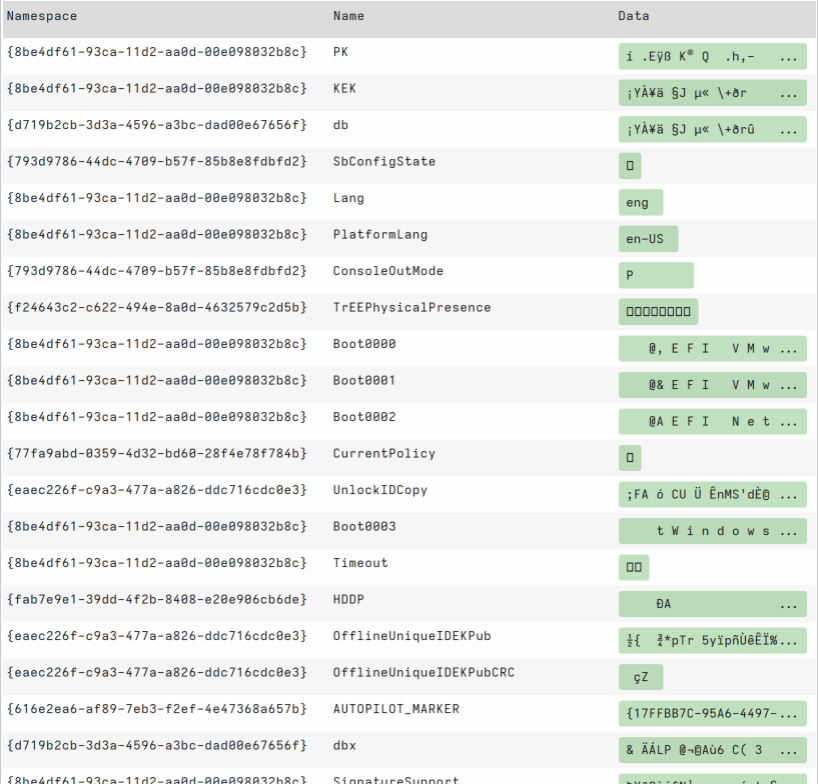
EFI Secure Variables API visibility
EFI Secure Variables (or otherwise known as NVRAM) is how the system distributes components from the firmware during boot. From an analysis point of view, whilst dumping the firmware is difficult needing manual workflow, all operating systems provide some visibility from user space. This blog will discuss the Windows API; however, for reference Linux and macOS provides similar data.
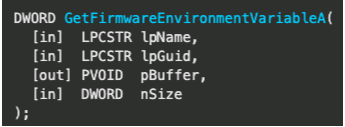
GetFirmwareEnvironmentVariable (Windows) can collect the name, namespace guid and value of EFI secure variables. This collection can be used to check current state including key/signature database and revocation.
Some of the data points it enables extracting are:
Platform Key (PK) — top level key.
Key Exchange Key (KEK) — used to sign Signatures Database and Forbidden Signatures Database updates.
It’s worth noting that this technique is relying on the Windows API and could be subverted with capable malware, but the visibility can provide leads for an analyst around boot configuration or signatures. There are also “boot only” NVRAM variables that can not be accessed outside boot, so a manual chip dump would need to be collected.
Example of extracting EFI secure variables
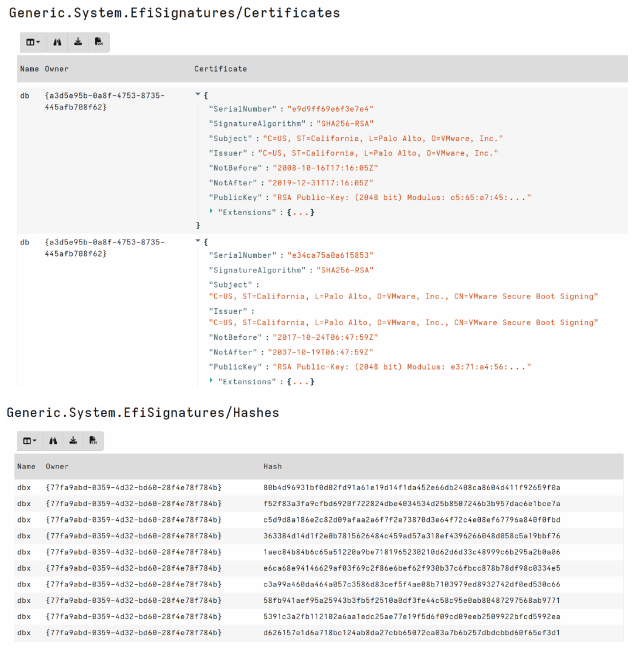
Velociraptor has a community contributed capability: Generic.System.EfiSignatures. This artifact collects EFI Signature information from the client to check for unknown certificates and revoked hashes. This is a great artifact for data stacking across machines and is built by parsing data values from the efivariables() plugin.
EFI System Partition (ESP) visibility
The ESP is a FAT partitioned file system that contains boot loaders and other critical files used during the boot process which do not change regularly. As such, it can be a relatively simple task to find abnormalities using forensics.
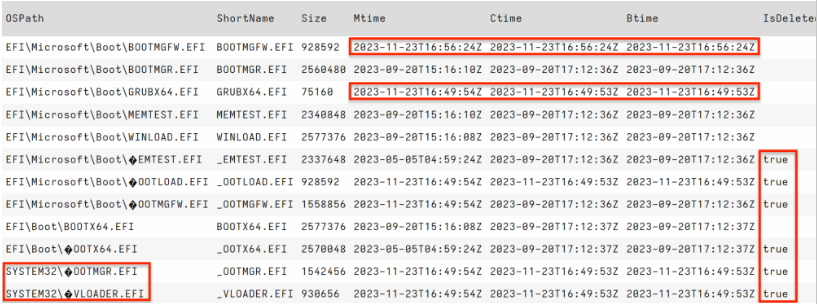
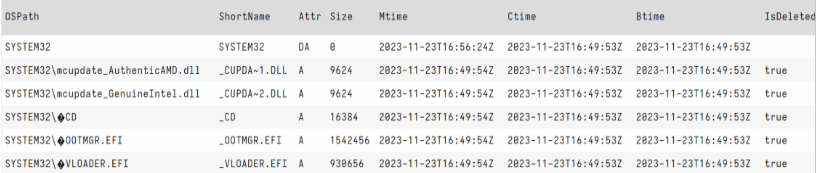
For example, parsing the File Allocation Table we can review metadata around path, timestamps, and deleted status that may provide leads for analysis.
Viewing FAT metadata on *.EFI files
In the screenshot above we observe several EFI bootloader files with timestamps out of alignment. We would typically expect these files to have the same timestamps around operating system install. We can also observe deleted files and the existence of a System32 folder in the temporal range of these entries.
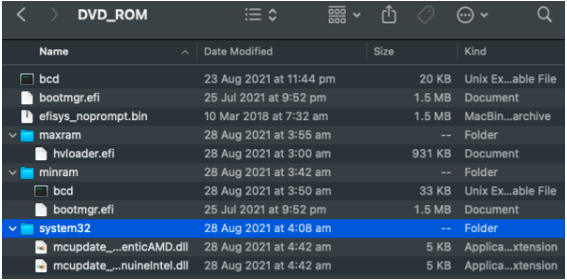
The EFI/ folder should be the only folder in the ESP root so querying for any paths that do not begin with EFI/ is a great hunt that detects our lead above. You can see in my screenshot below, the BlackLotus staging being bubbled to the top adding filtering for this use case.
BlackLotus staging: Non ESP/ files
Interestingly, BlackLotus was known to use the Baton Drop exploit so we can compare to the publicly available Baton Drop and observe similarities to deleted files on the ESP.
Publicly available Baton Drop iso contents on Github
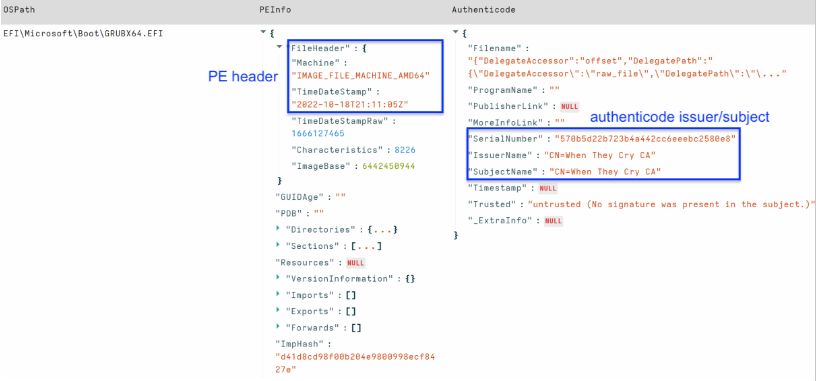
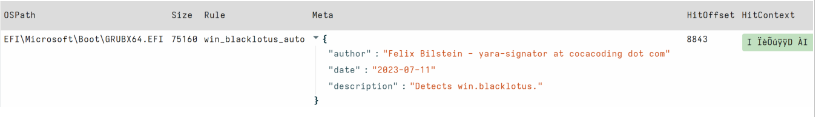
The final component of ESP-based visibility is checking the bytes of file contents. We can run YARA to look for known malware traits, or obtain additional file type metadata that can provide leads for analysis. The screenshot below highlights the well known Black Lotus certificate information and PE header timestamp.
BlackLotus PE header, suspicious AuthenticodeBlackLotus YARA hit in ESP
Available Velociraptor artifacts for this visibility of the ESP are:
Windows.Forensics.UEFI — This artifact enables disk analysis over an EFI System Partition (ESP). The artifact queries the specified physical disk, parses the partition table to target the ESP File Allocation Table (FAT). The artifact returns file information, and PE enrichment as typical EFI files are in the PE format.
Windows.Detection.Yara.UEFI—This artifact expands on basic enumeration of the ESP and enables running yara over the EFI system partition.
Measured Boot log visibility
Bootkit security has always been a “race to the bottom.” If the malware could load prior to security tools, a defender would need to assume they may be defeated. Since Windows 8, Measured Boot is a feature implemented to help protect machines from early boot malware. Measured Boot checks each startup component — from firmware to boot drivers — and stores this information in the Trusted Platform Module (TPM). A binary log is then made available to verify the boot state of the machine.The default Measured Boot log location is C:\Windows\Logs\MeasuredBoot\*.log and a new file is recorded for each boot.
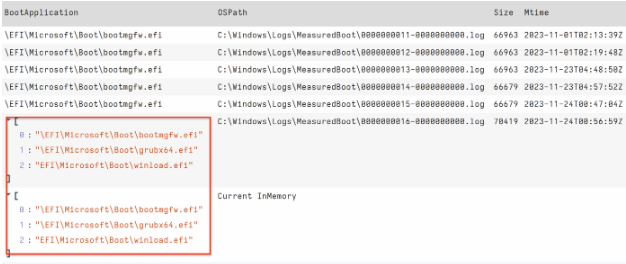
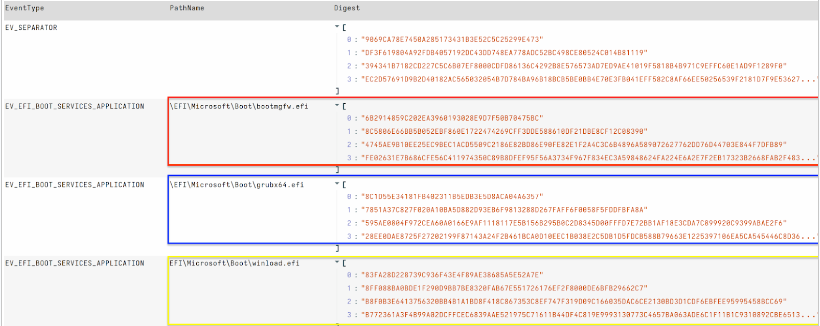
Windows.Forensics.UEFI.BootApplication parses Windows MeasuredBoot TCGLogs to extract PathName of events, which can assist detection of potential ESP based persistence (EV_EFI_Boot_Services_Application). The artifact leverages Velociraptor tools to deploy and execute Matt Graeber’s excellent powershell module TCGLogTools to parse TCGLogs on disk and memory.
We can see when running on an infected machine that the BOOT application path has clearly changed from the default: \EFI\Microsoft\Boot\bootmgfw.efi. Therefore, Boot Application is a field that is stackable across the network.
We can also output extended values, including digest hashes for verification.
Other forensic artifacts
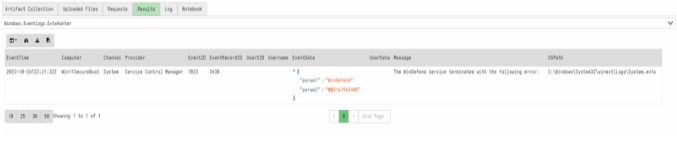
There are many other generic forensic artifacts analysts could focus on for assisting detection of a UEFI threat. From malware network activity to unexpected errors in the event log associated with Antivirus/Security tools on the machine.
For example: BlackLotus made an effort to evade detection by changing Windows Defender access tokens to SE_PRIVILEGE_REMOVED. This technique keeps the Defender service running but effectively disables it. While Velociraptor may not have protected process privileges to check tokens directly, we can check for other indicators such as errors associated with use.
Similarly, Memory integrity (HVCI) is a feature of virtualization-based security (VBS) in Windows. It provides a stronger virtualization environment via isolation and kernel memory allocations.The feature is related to Secure Boot and can be disabled for malware that needs a lower integrity environment to run. It requires setting the configuration registry key value to 0.
1 – enabled Windows.Registry.HVCI available on the artifact exchange can be used to query for this key value.
Conclusion
Despite UEFI threats possessing intimidating capabilities, security practitioners can deploy some visibility with current tools for remote investigation. Forensically parsing disk and not relying on the Windows API, or reviewing other systemic indicators that may signal compromise, is a practical way to detect components of these threats. Knowing collection capabilities, the gaps, and how to mitigate these is just as important as knowing the threat.
In this post we have covered some of Velociraptor’s visibility for UEFI threats and we have only scratched the surface for those who know their environment and can query it effectively. Rapid7 supports Velociraptor open source, providing the community with Velociraptor and open source features unavailable even in some paid tools.
To provide the best experiences, we use technologies like cookies to store and/or access device information. Consenting to these technologies will allow us to process data such as browsing behavior or unique IDs on this site. Not consenting or withdrawing consent, may adversely affect certain features and functions.
Functional
Always active
The technical storage or access is strictly necessary for the legitimate purpose of enabling the use of a specific service explicitly requested by the subscriber or user, or for the sole purpose of carrying out the transmission of a communication over an electronic communications network.
Preferences
The technical storage or access is necessary for the legitimate purpose of storing preferences that are not requested by the subscriber or user.
Statistics
The technical storage or access that is used exclusively for statistical purposes.The technical storage or access that is used exclusively for anonymous statistical purposes. Without a subpoena, voluntary compliance on the part of your Internet Service Provider, or additional records from a third party, information stored or retrieved for this purpose alone cannot usually be used to identify you.
Marketing
The technical storage or access is required to create user profiles to send advertising, or to track the user on a website or across several websites for similar marketing purposes.
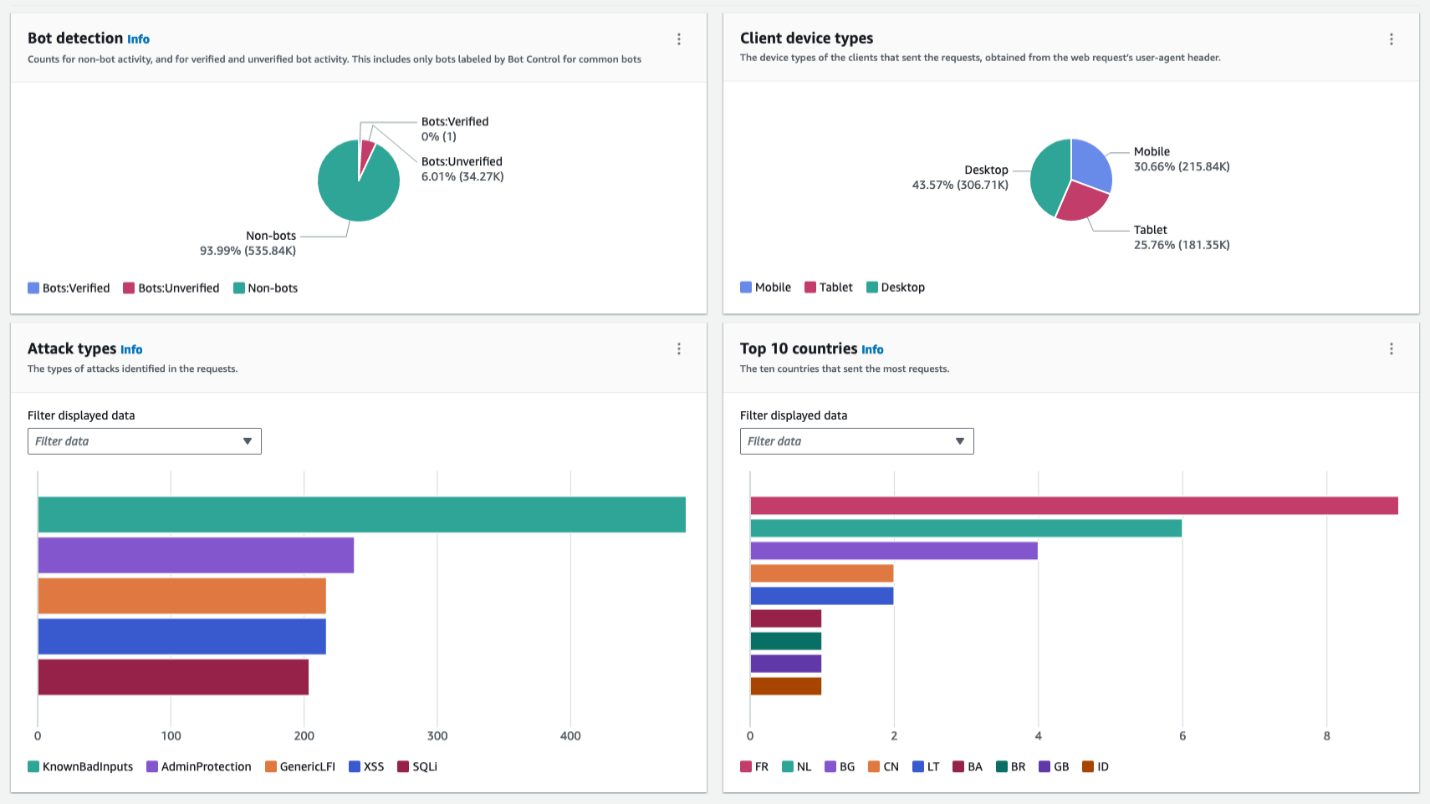
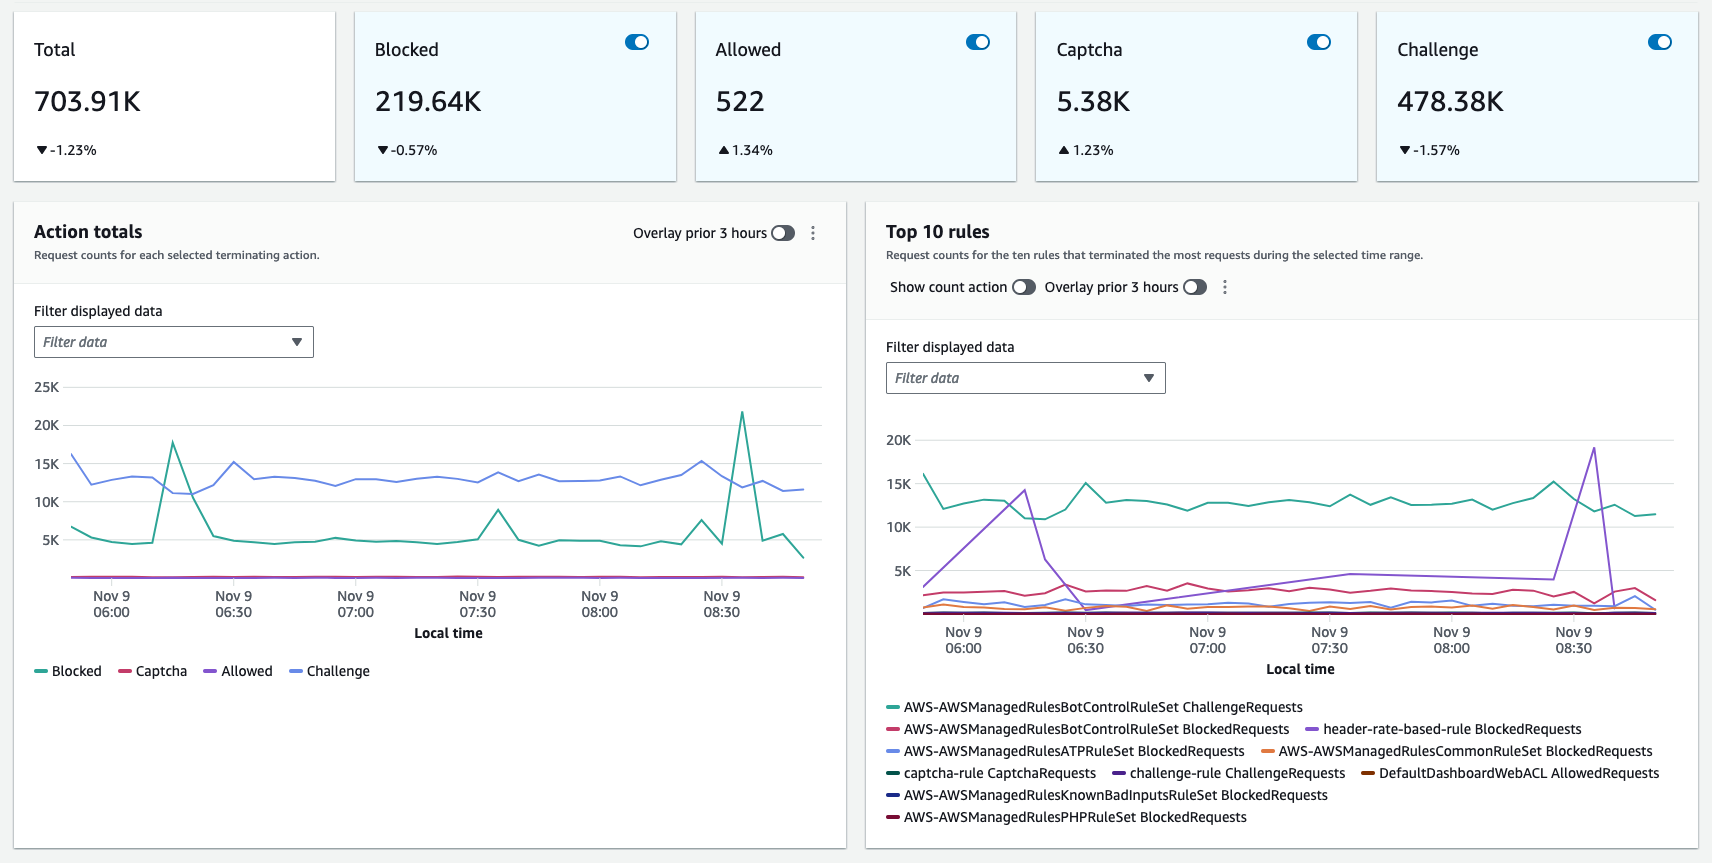
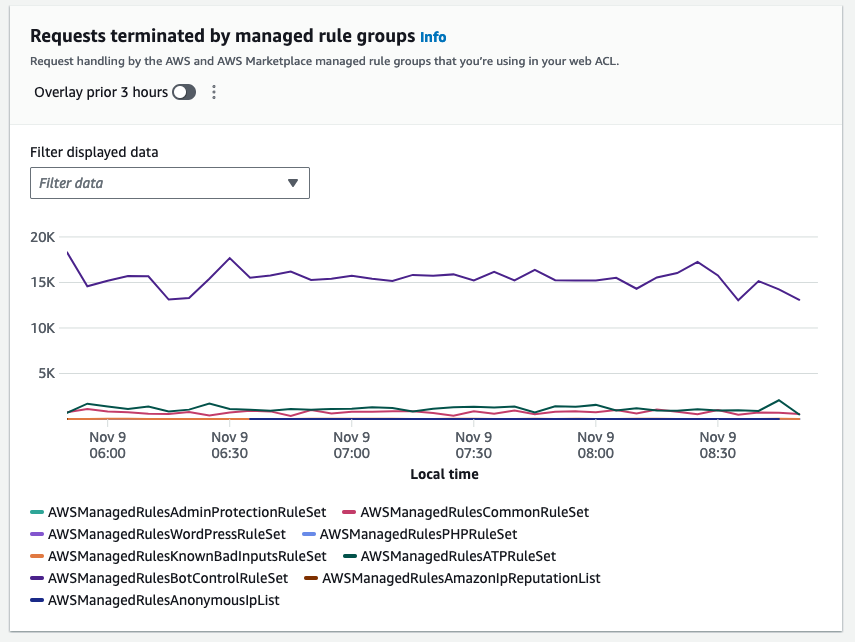
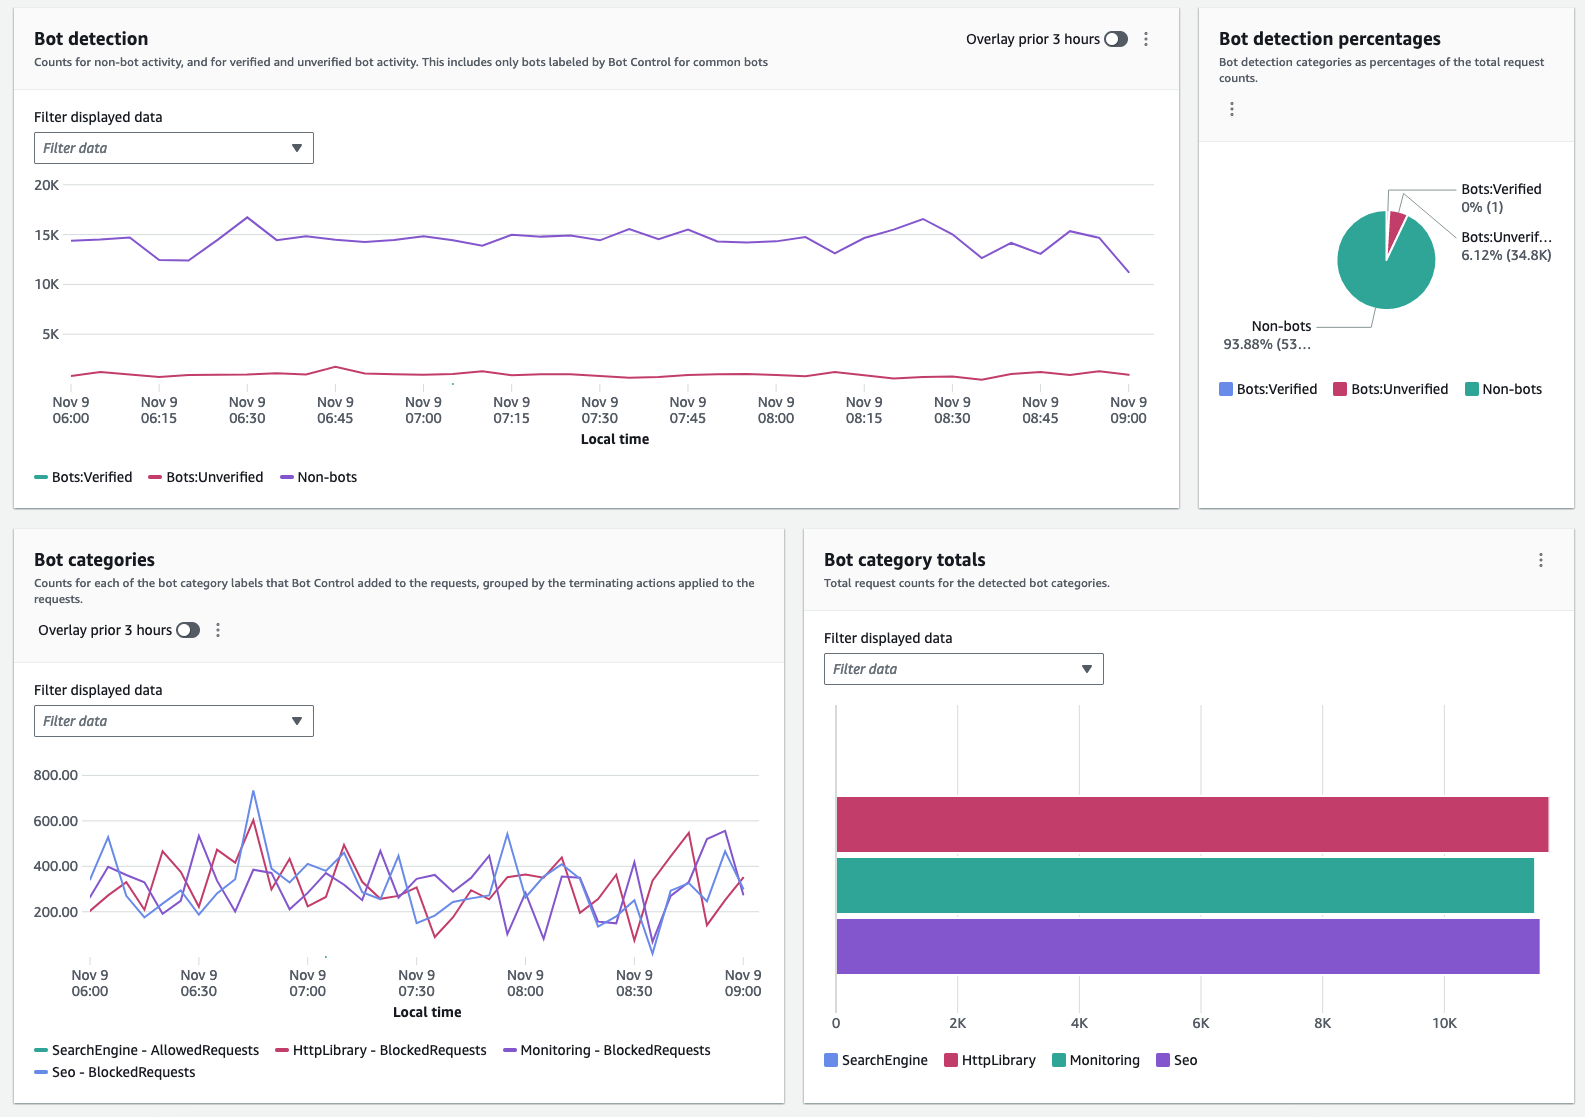
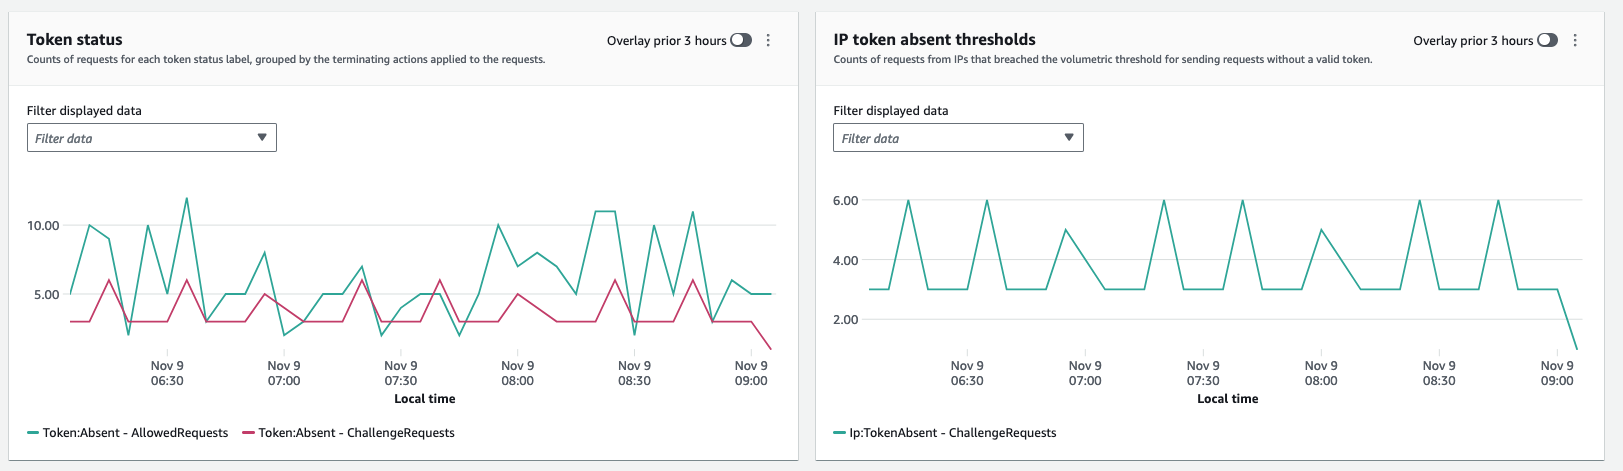


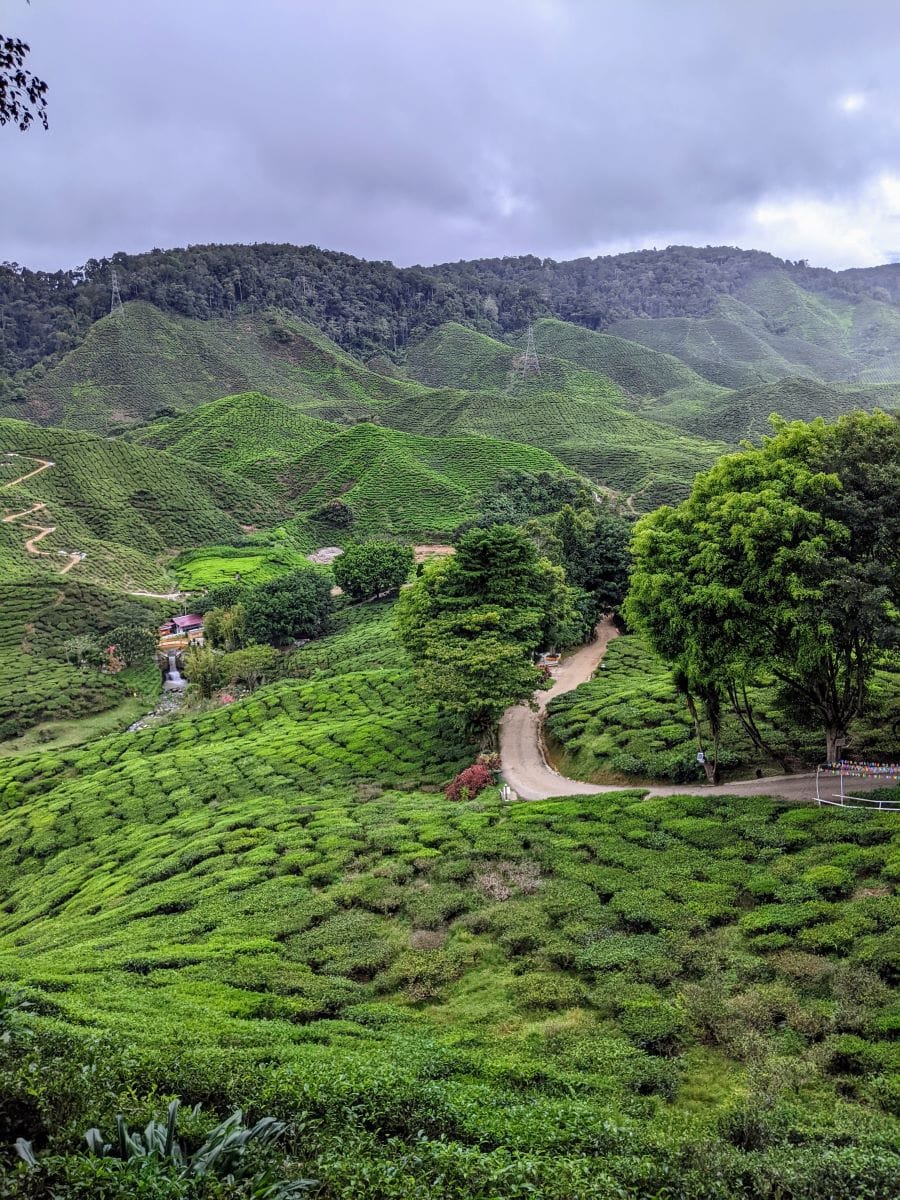
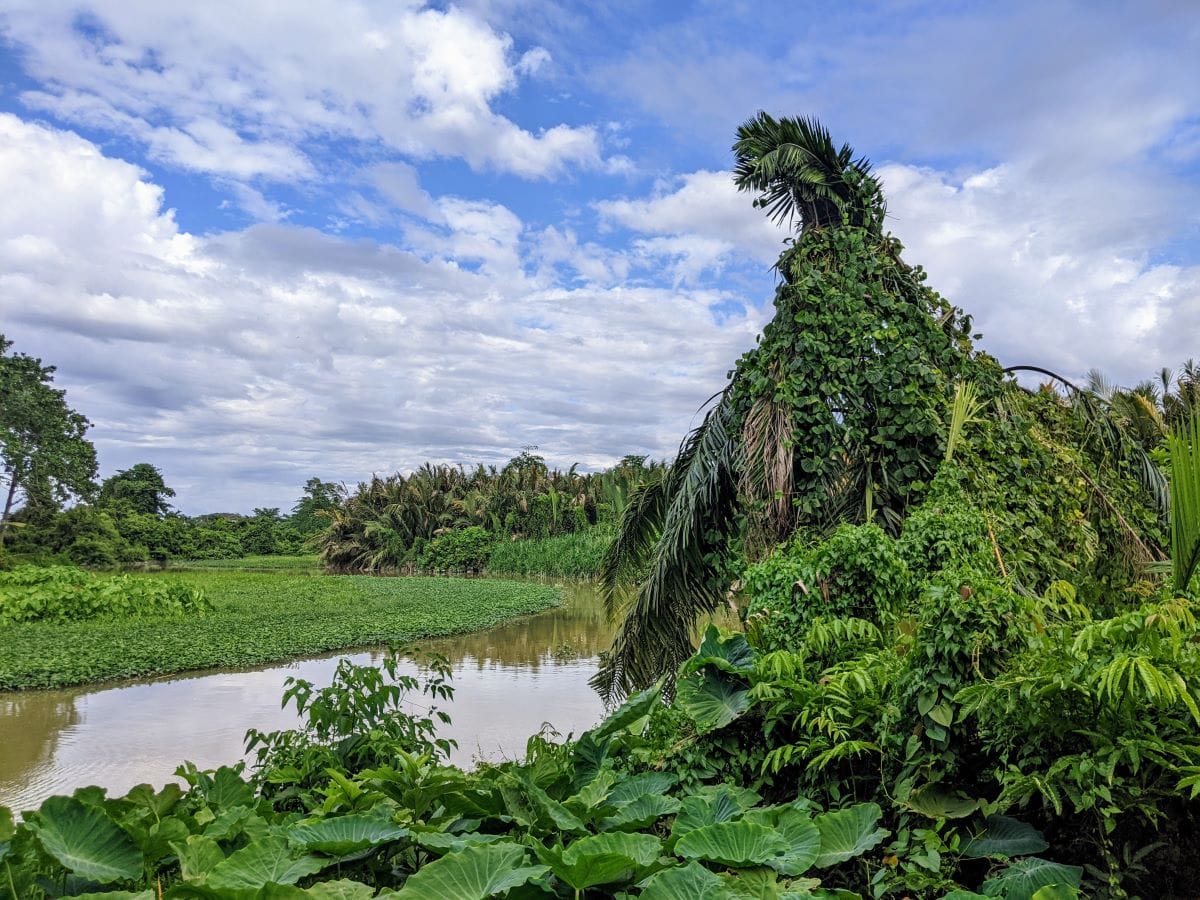
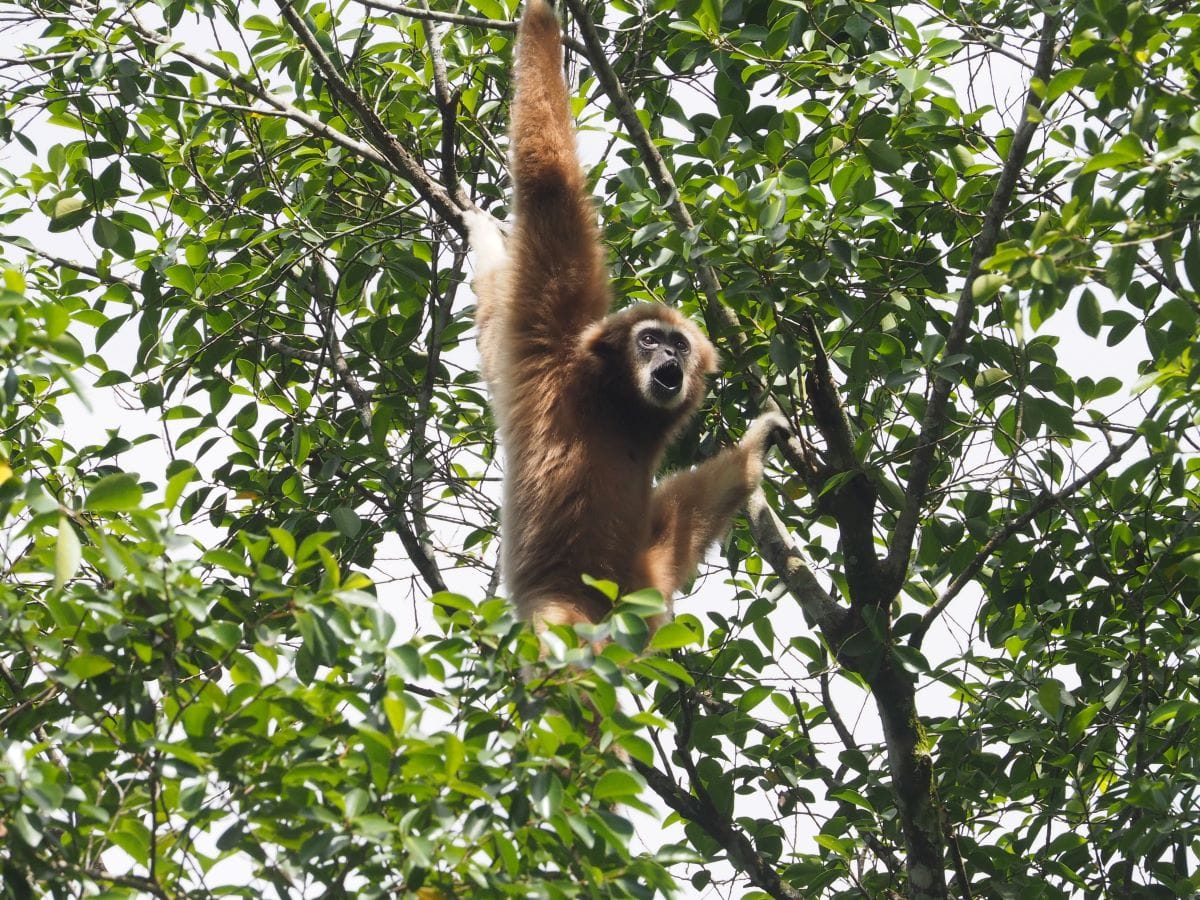


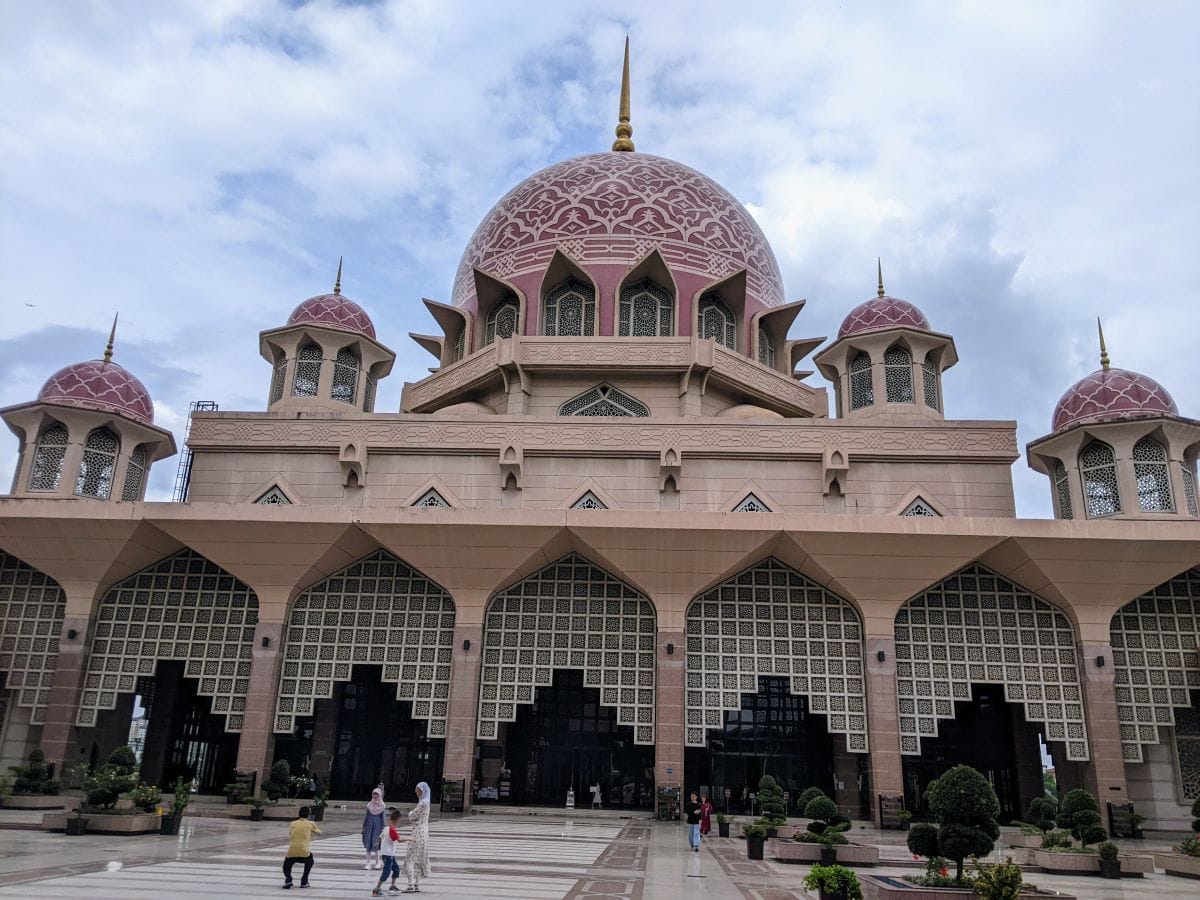

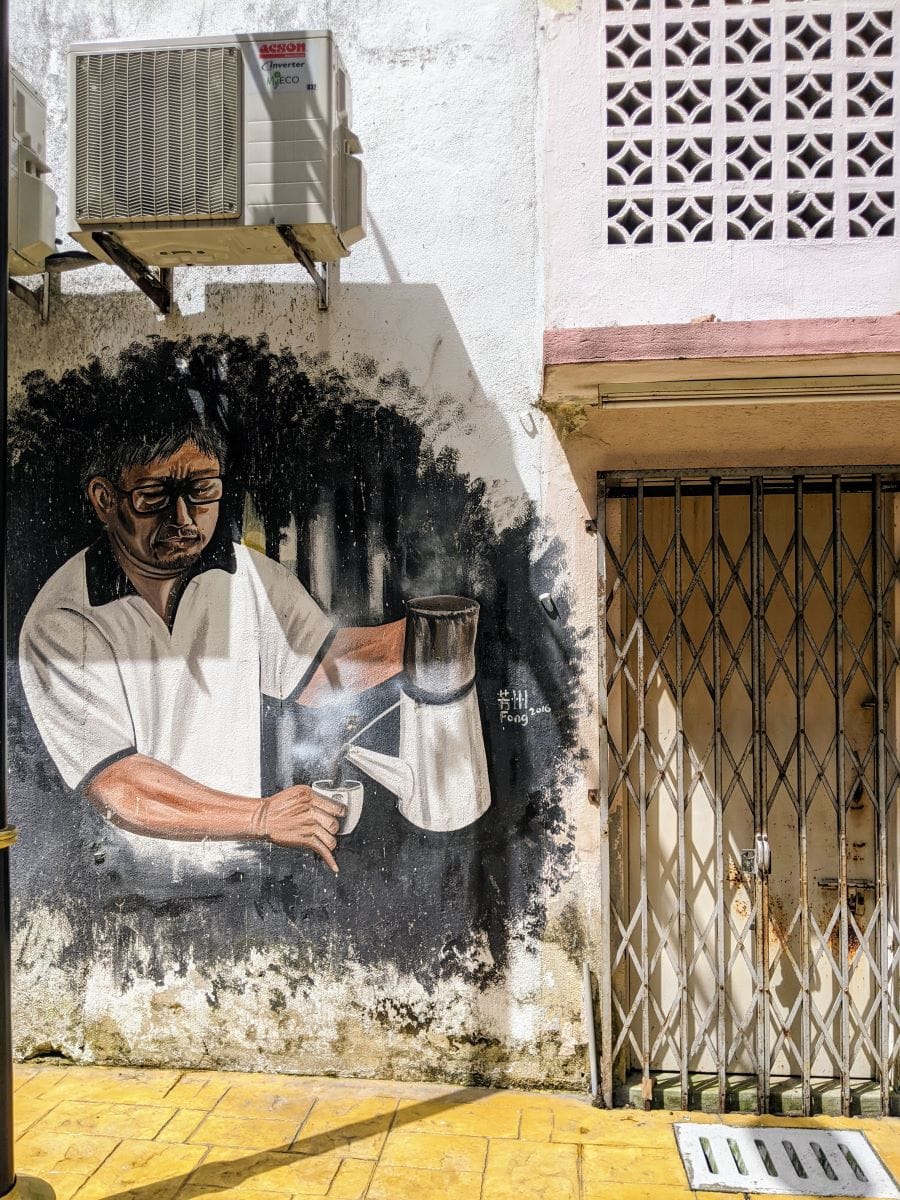
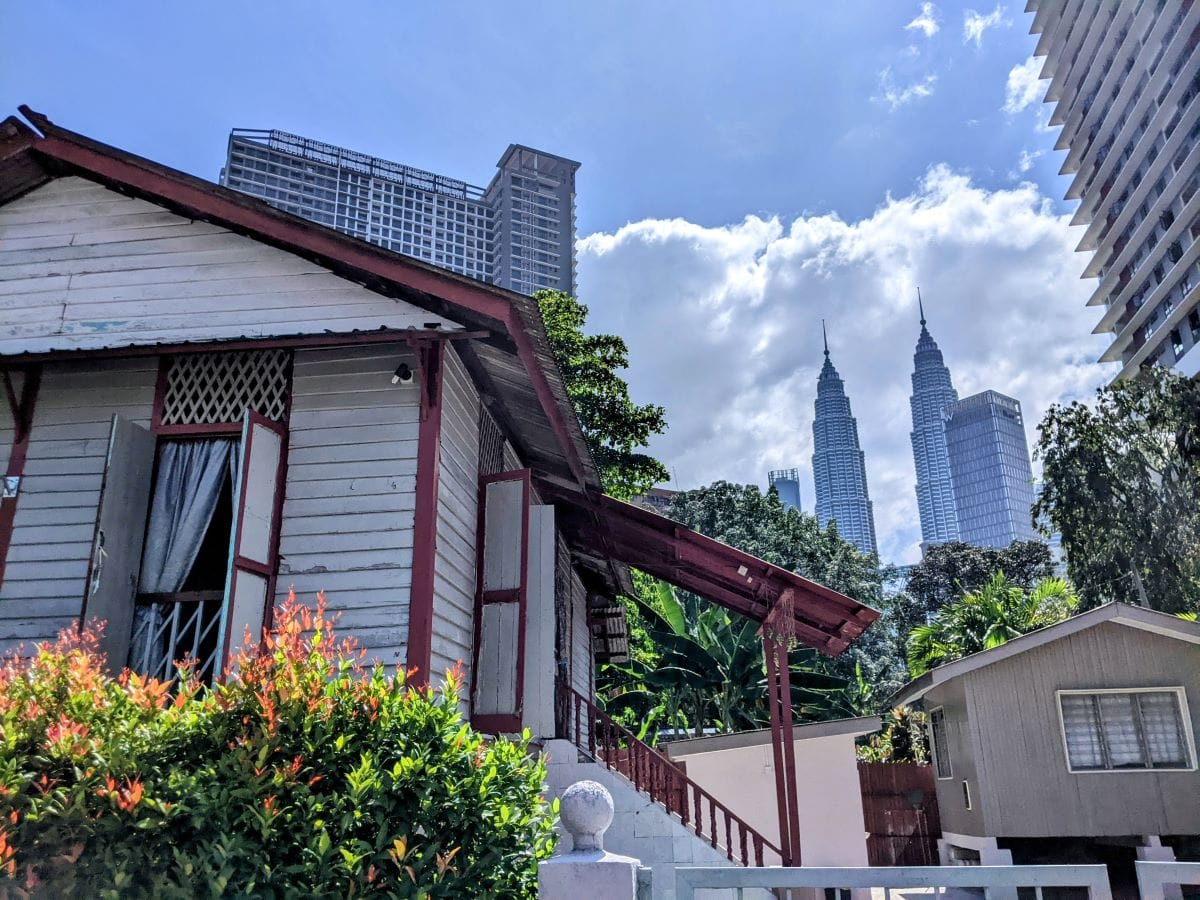
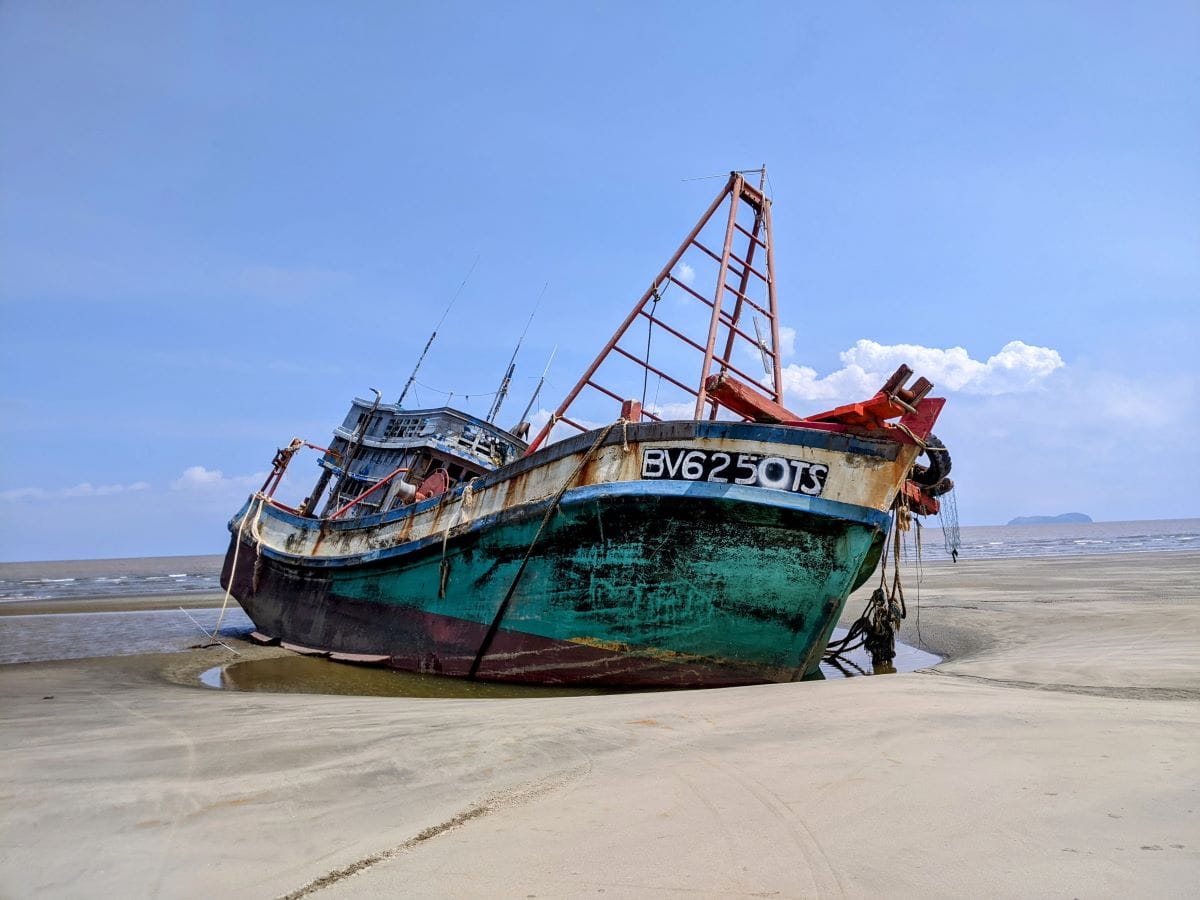


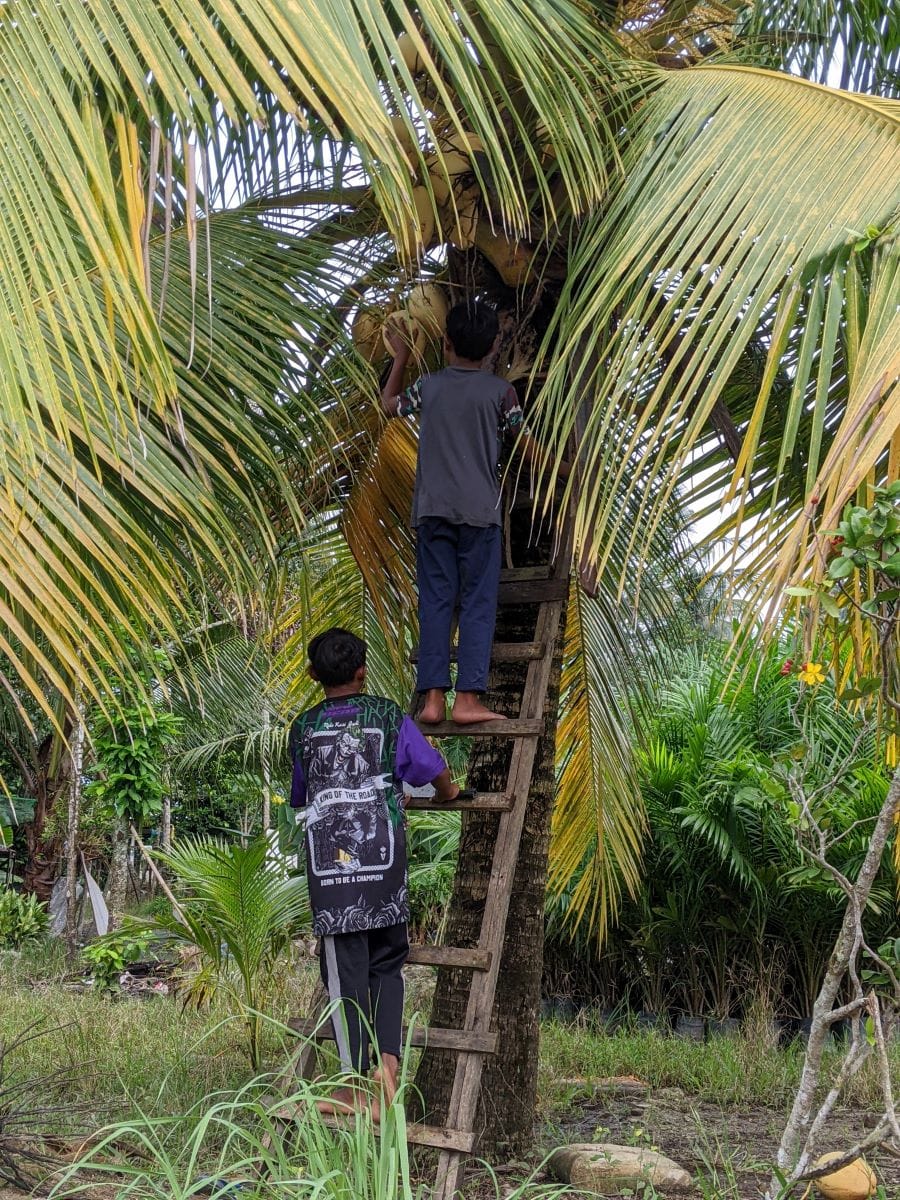
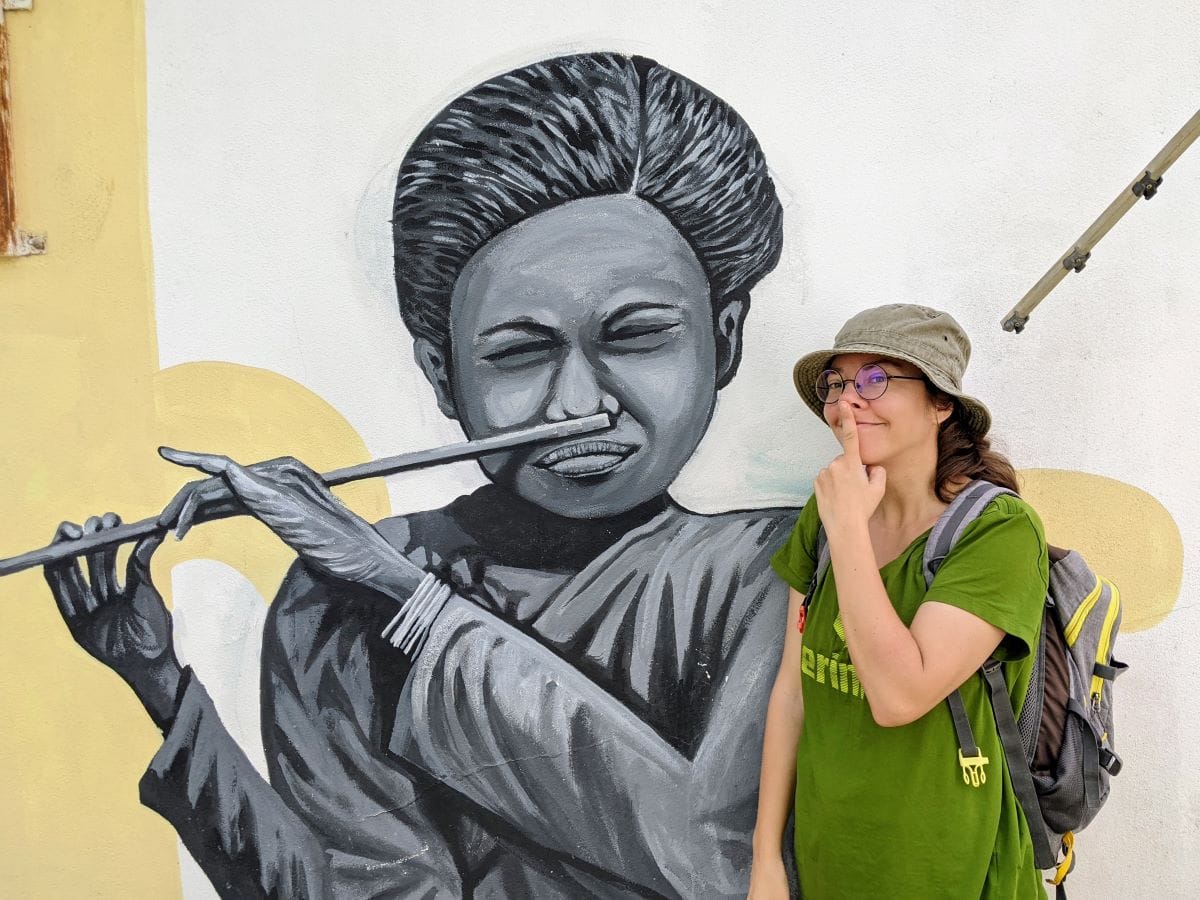
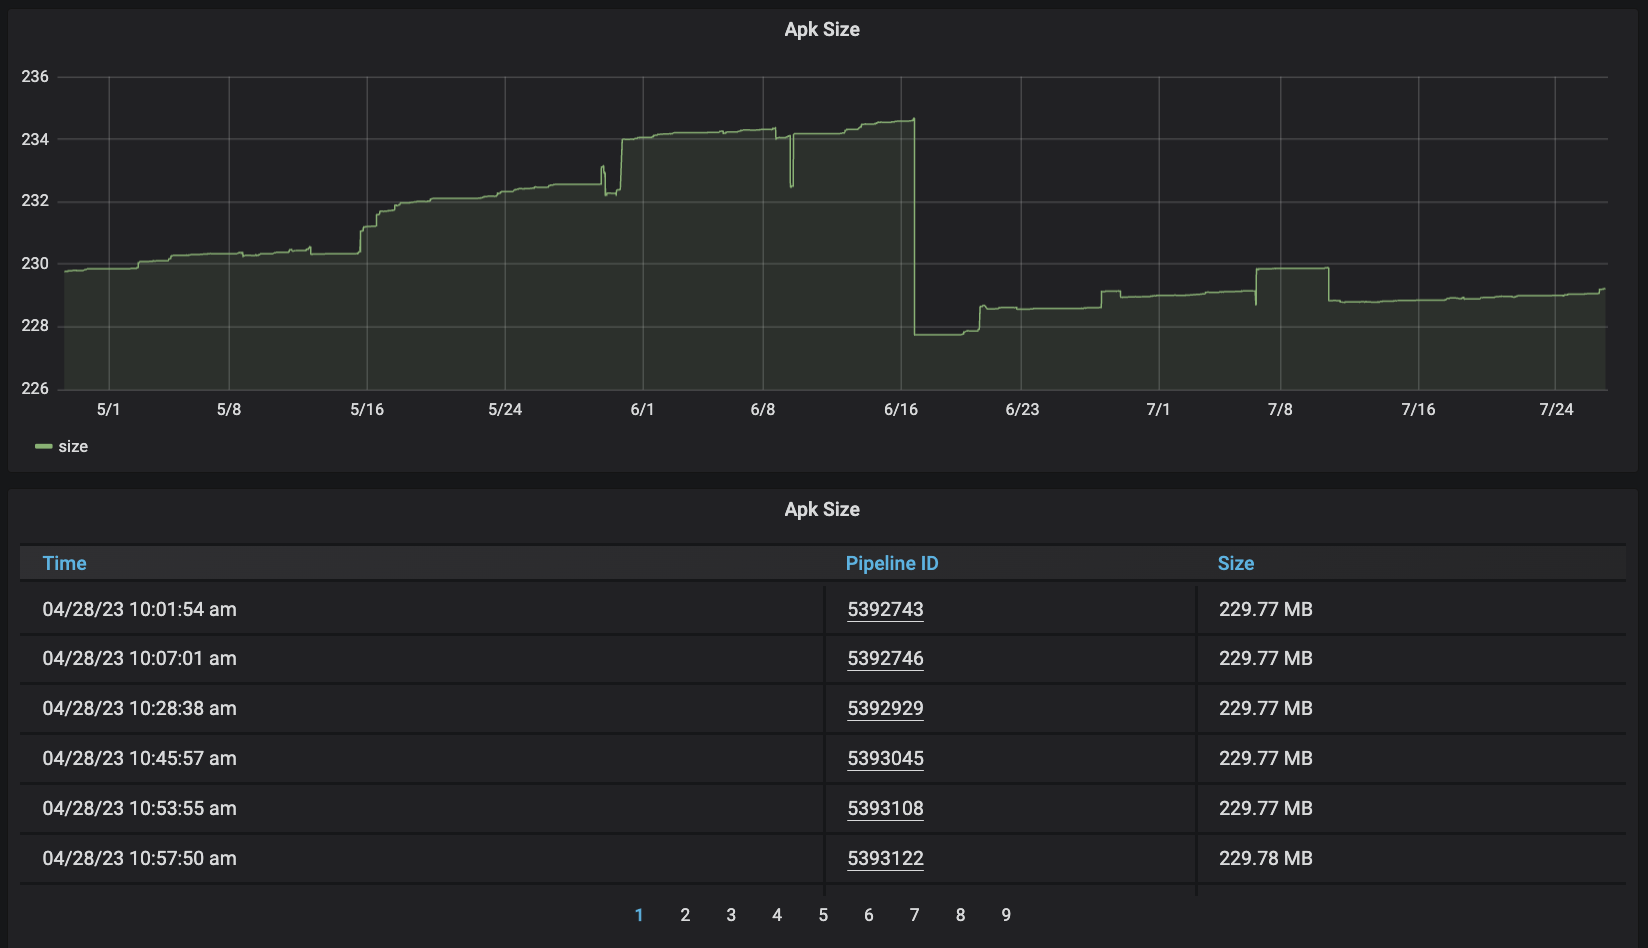
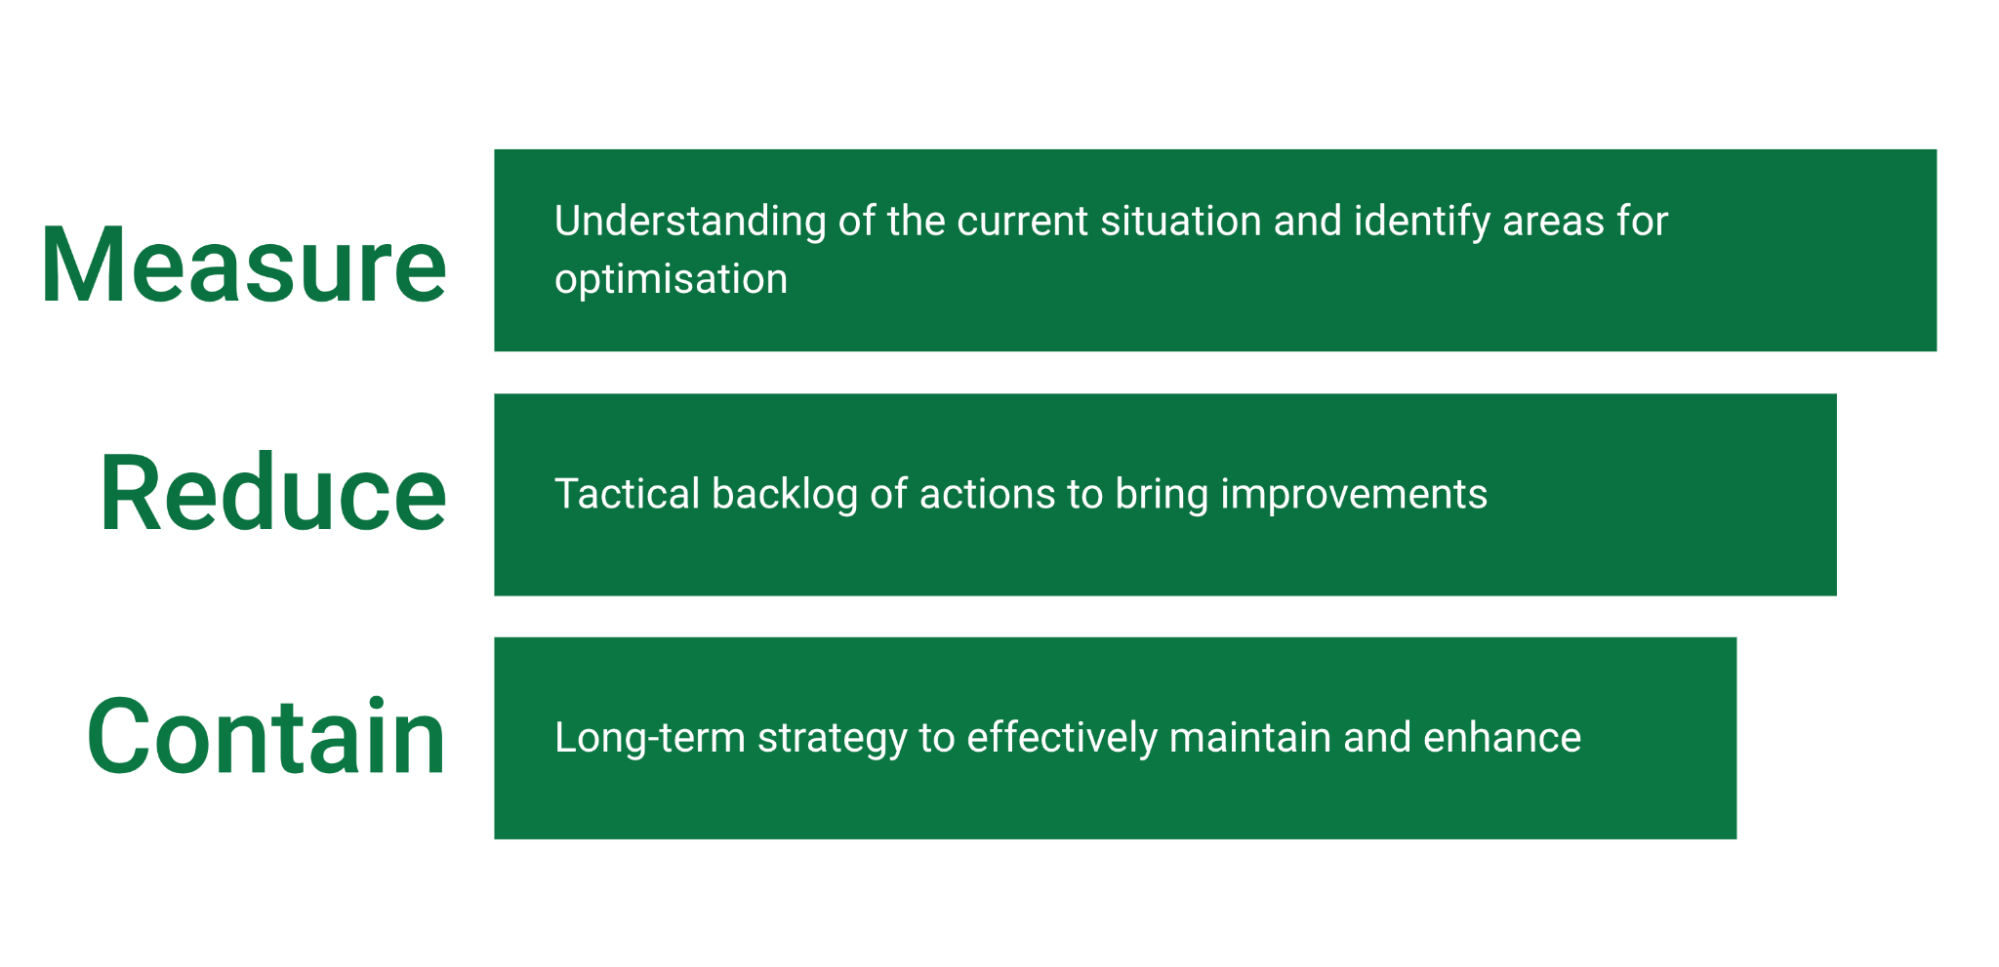
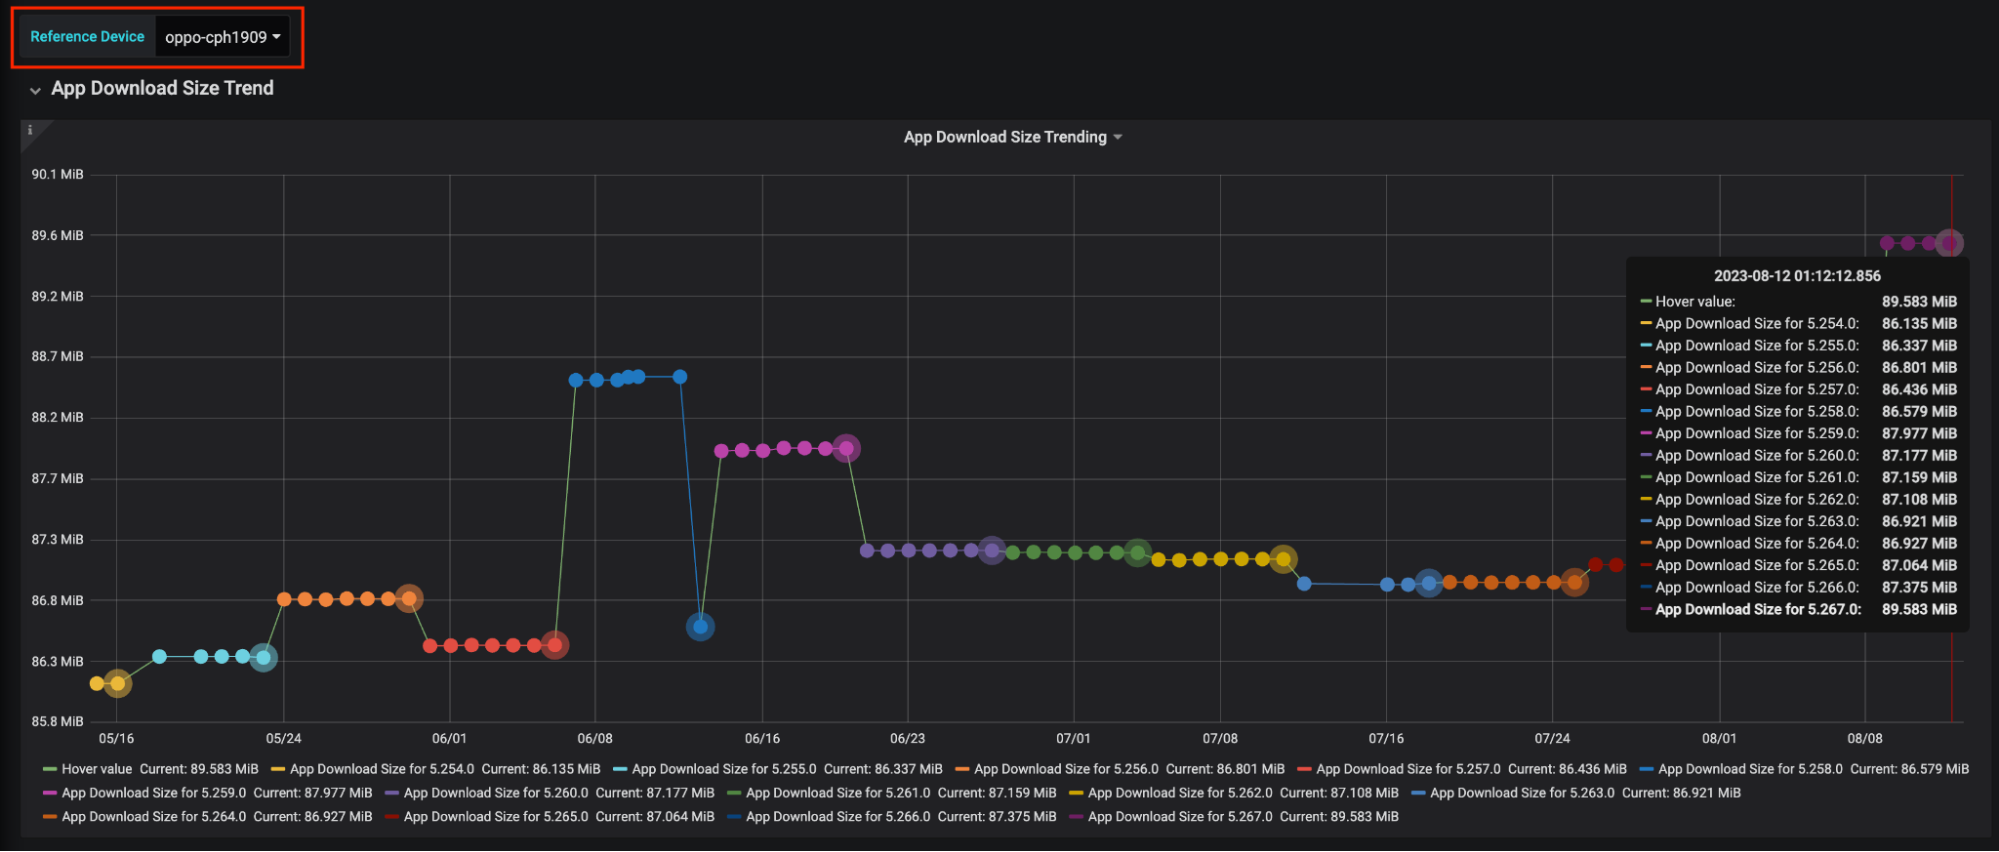
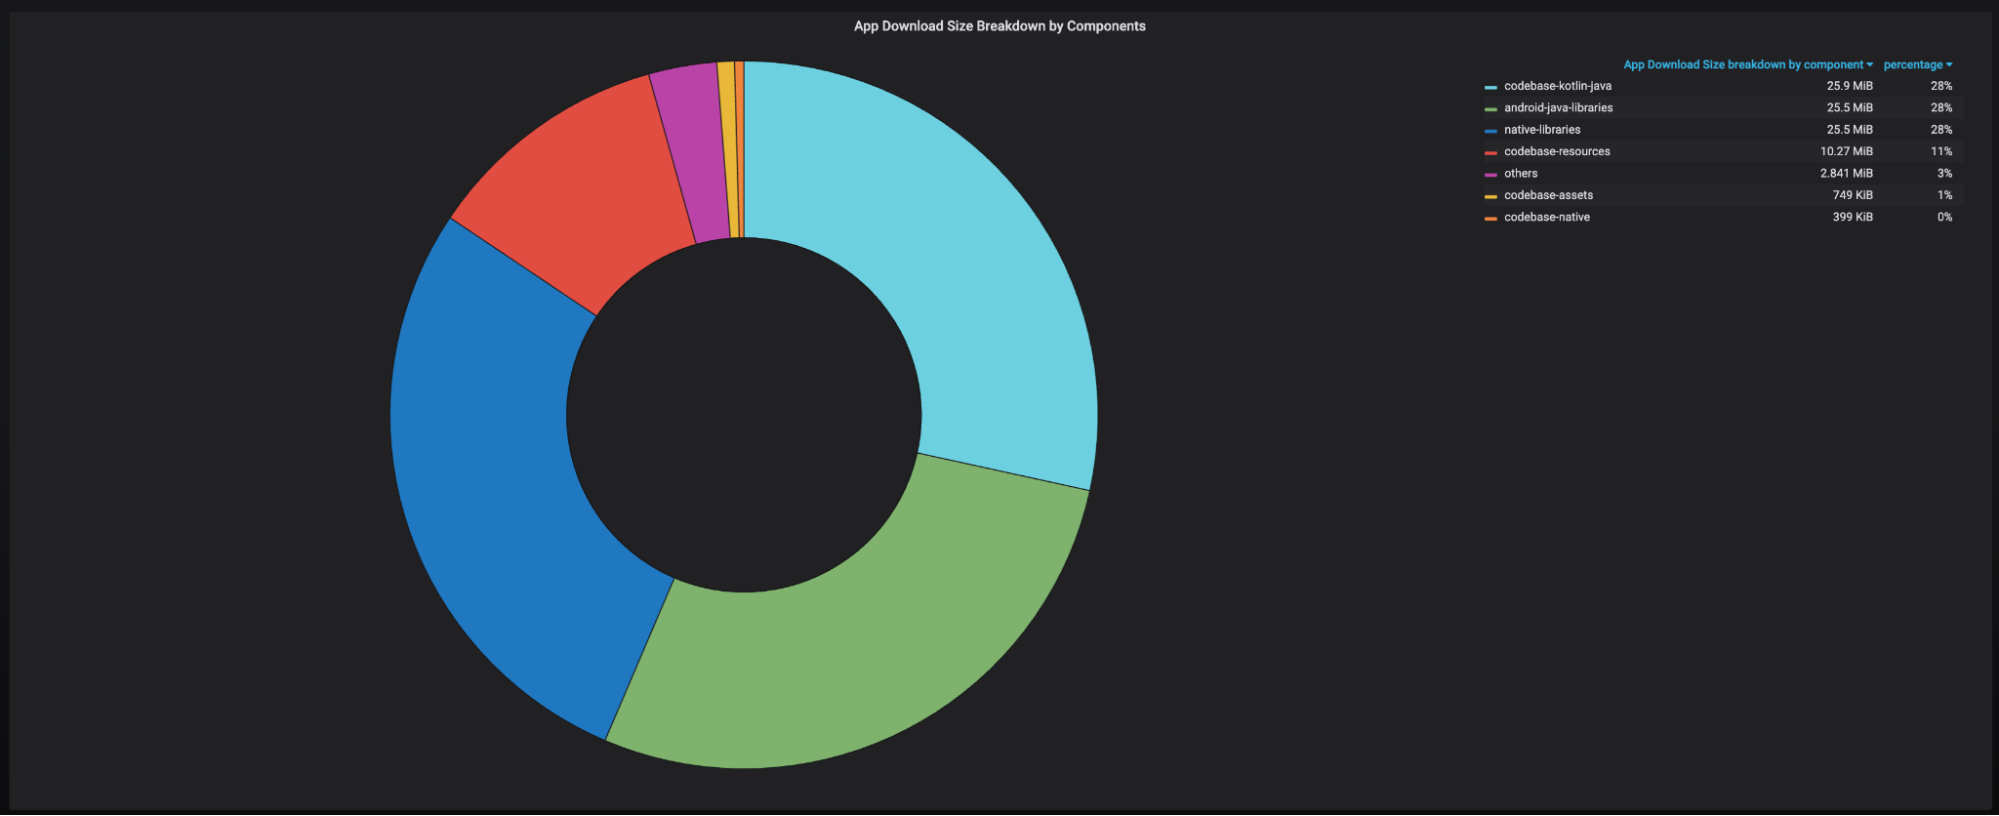
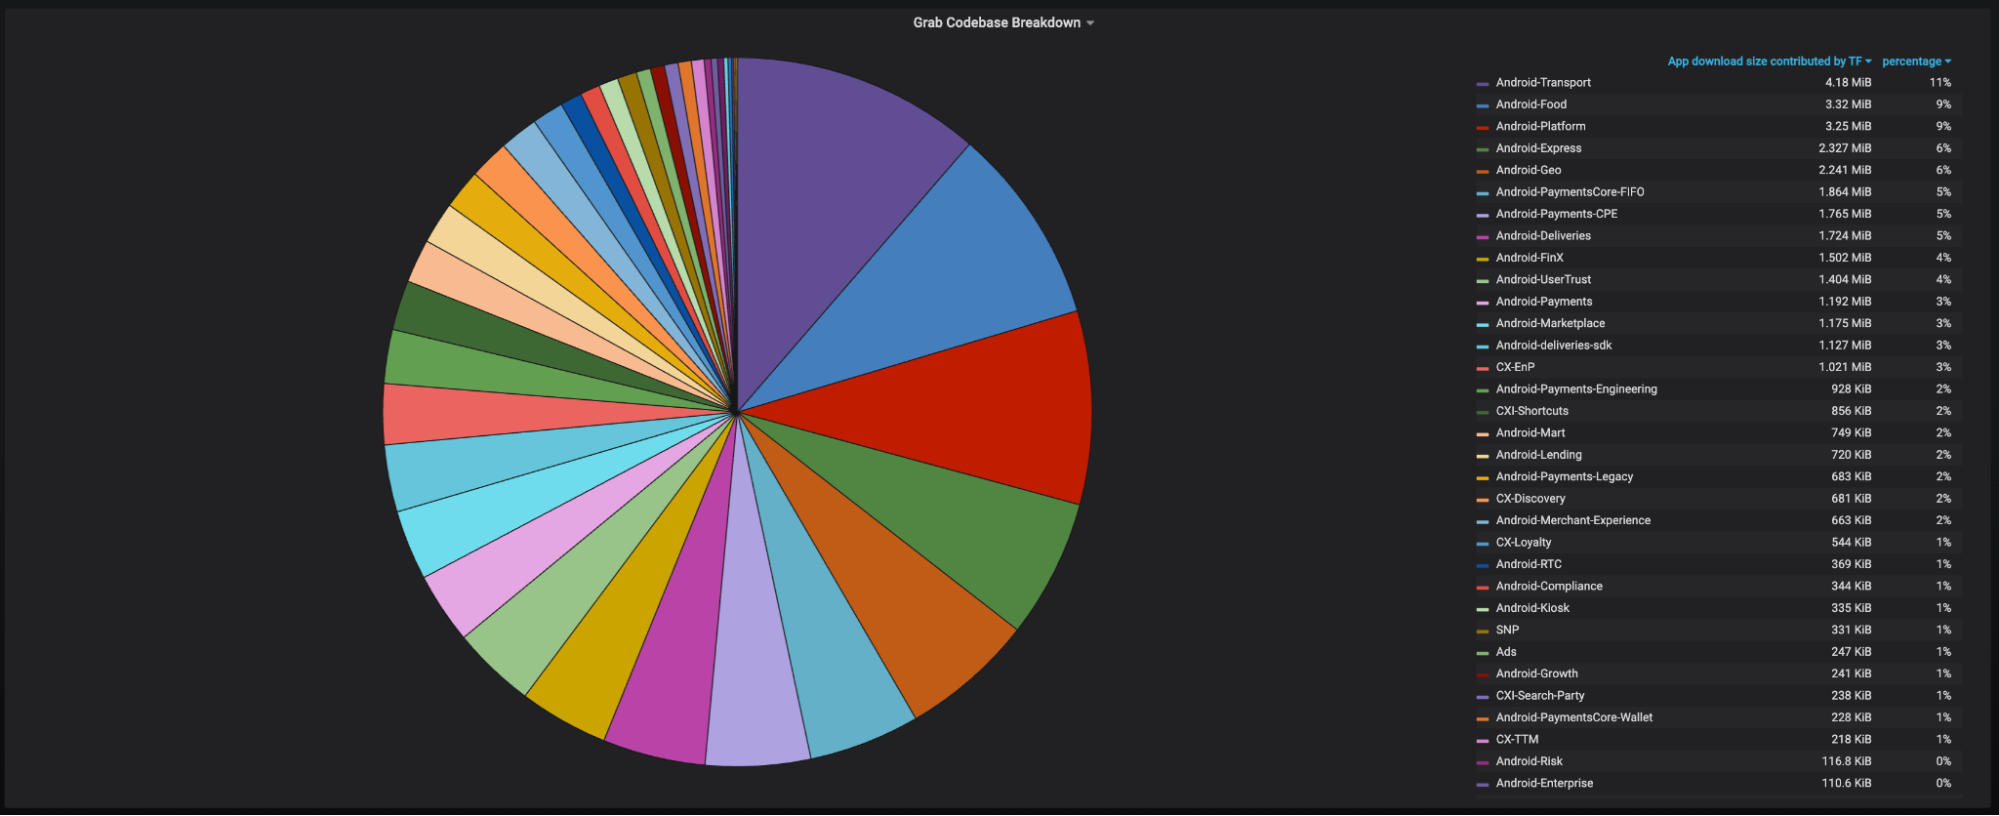
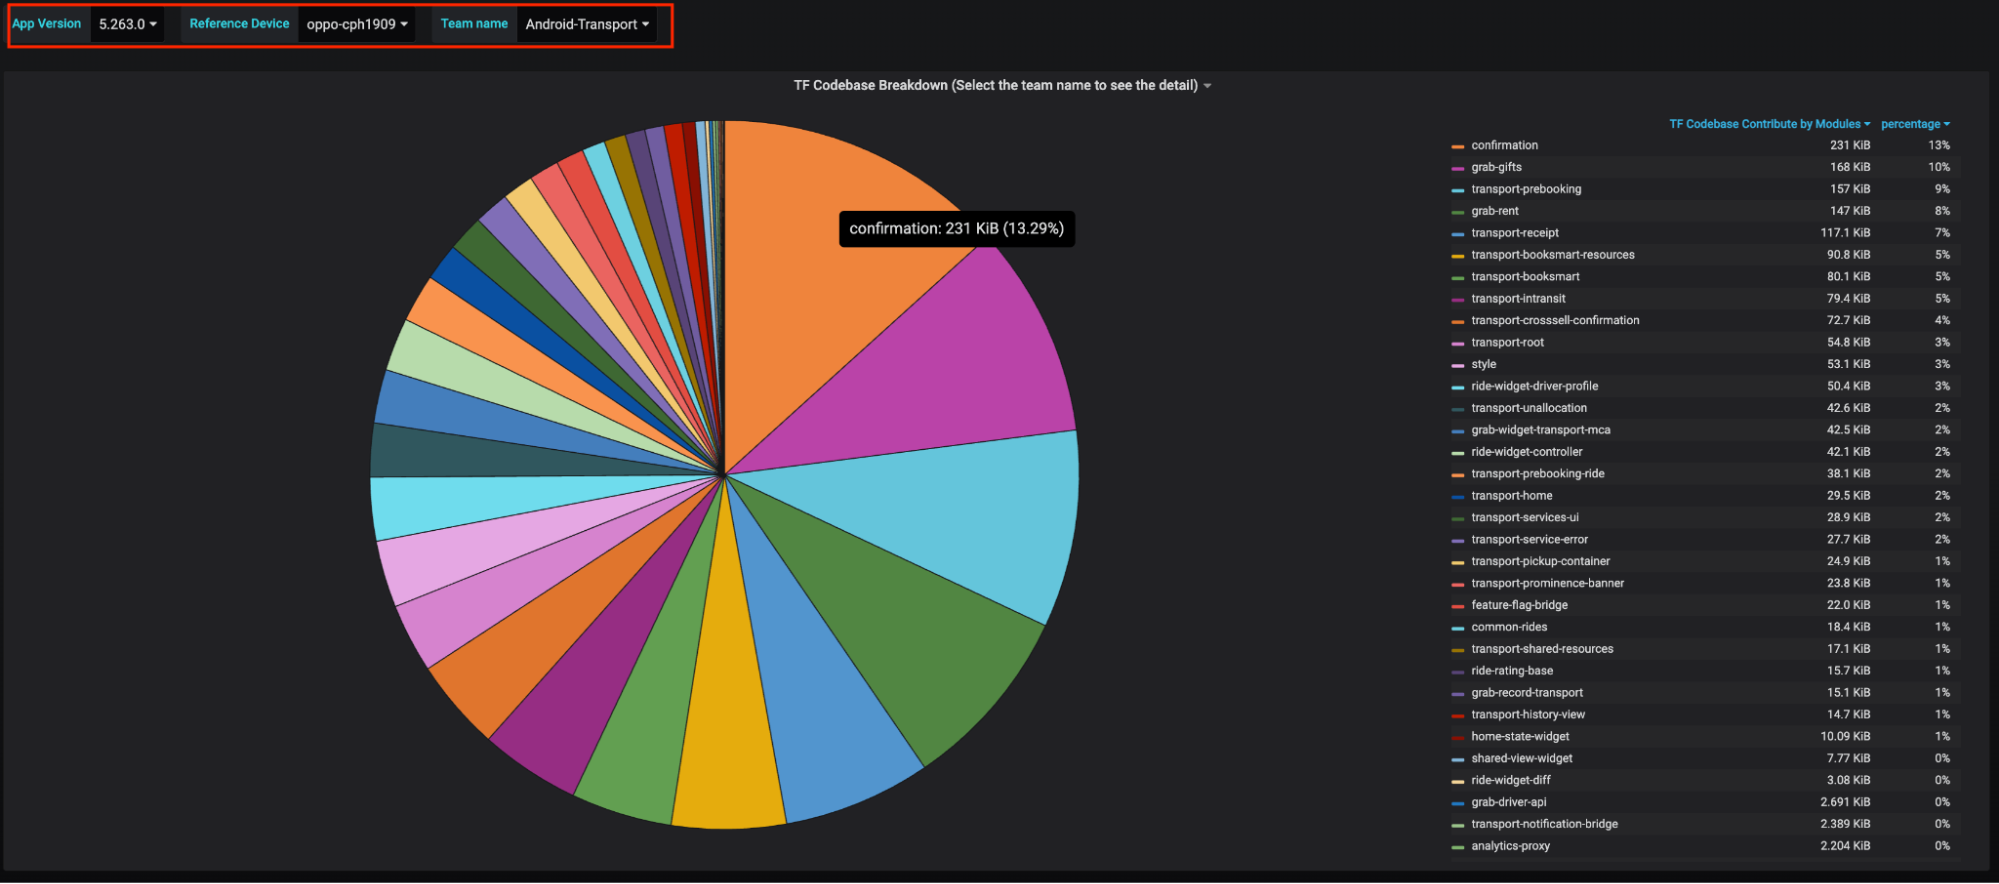
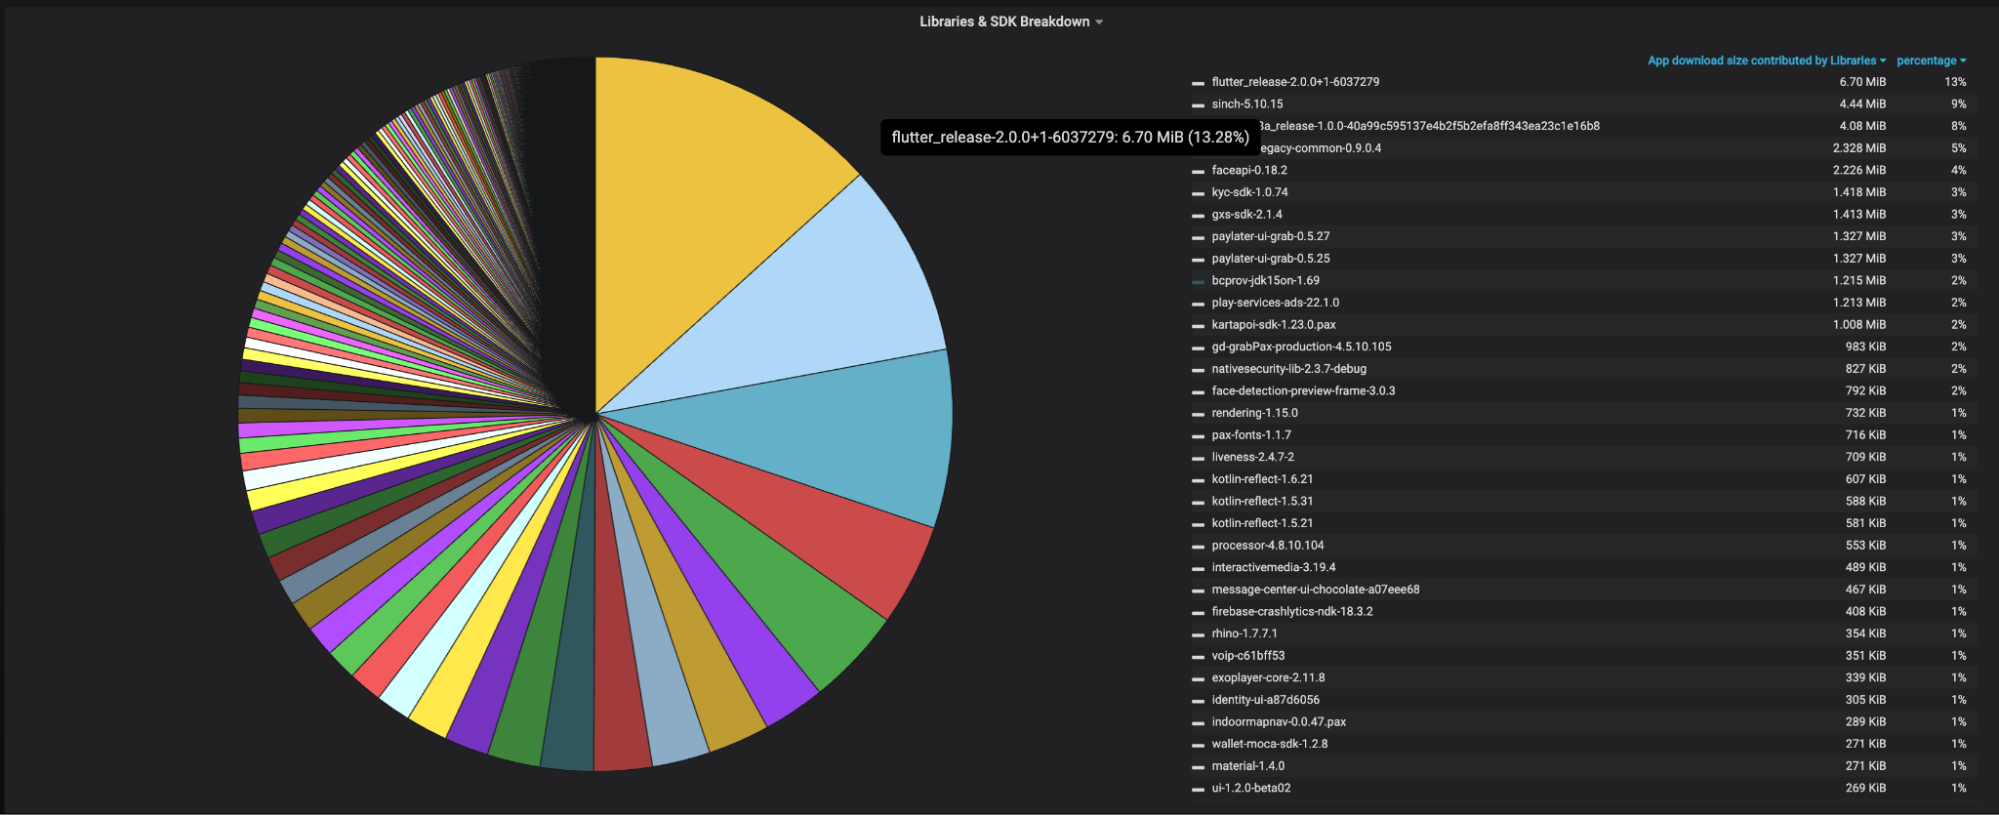
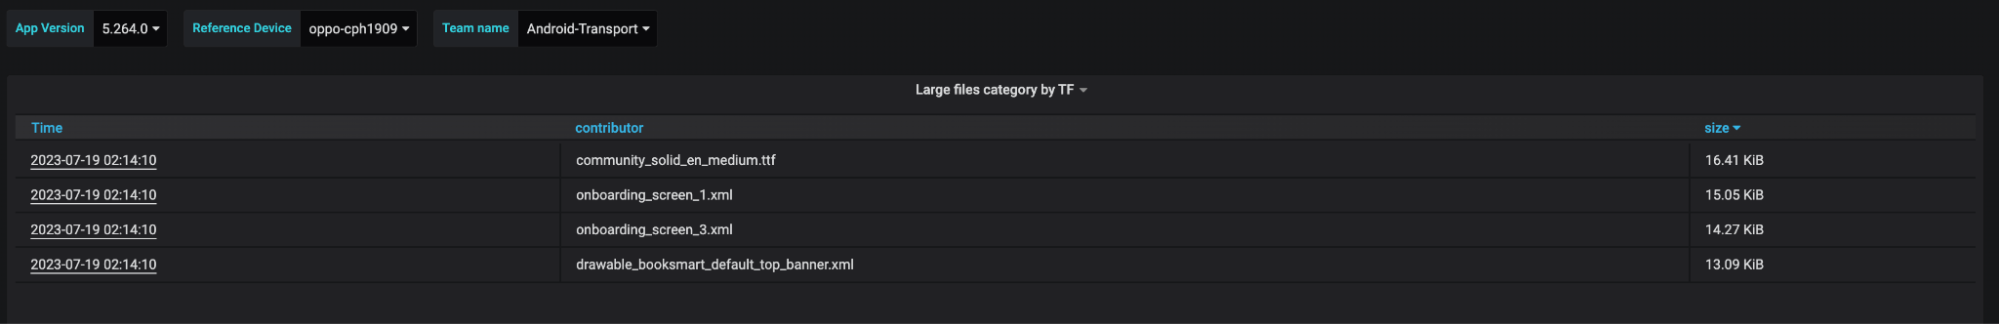
!['Thank you for the loveliest evening I've ever had...' [normal] '...east of the Mississippi.' [instant intrigue!]](https://imgs.xkcd.com/comics/geographic_qualifiers.png "'Thank you for the loveliest evening I've ever had...' [normal] '...east of the Mississippi.' [instant intrigue!]")