Post Syndicated from xkcd.com original https://xkcd.com/2862/

Post Syndicated from xkcd.com original https://xkcd.com/2862/
Post Syndicated from Curious Droid original https://www.youtube.com/watch?v=SqjGK1VYfwM
Post Syndicated from Maneesh Sharma original https://aws.amazon.com/blogs/big-data/integrate-okta-with-amazon-redshift-query-editor-v2-using-aws-iam-identity-center-for-seamless-single-sign-on/
AWS IAM Identity Center (IdC) allows you to manage single sign-on (SSO) access to all your AWS accounts and applications from a single location. We are pleased to announce that Amazon Redshift now integrates with AWS IAM Identity Center, and supports trusted identity propagation, allowing you to use third-party Identity Providers (IdP) such as Microsoft Entra ID (Azure AD), Okta, Ping, and OneLogin. This integration simplifies the authentication and authorization process for Amazon Redshift users using Query Editor V2 or Amazon Quicksight, making it easier for them to securely access your data warehouse. Additionally, this integration positions Amazon Redshift as an IdC-managed application, enabling you to use database role-based access control on your data warehouse for enhanced security.
AWS IAM Identity Center offers automatic user and group provisioning from Okta to itself by utilizing the System for Cross-domain Identity Management (SCIM) 2.0 protocol. This integration allows for seamless synchronization of information between two services, ensuring accurate and up-to-date information in AWS IAM Identity Center.
In this post, we’ll outline a comprehensive guide for setting up SSO to Amazon Redshift using integration with IdC and Okta as the Identity Provider. This guide shows how you can SSO onto Amazon Redshift for Amazon Redshift Query Editor V2 (QEV2).
Using IAM IdC with Amazon Redshift can benefit your organization in the following ways:

Enable group and user provisioning from Okta with AWS IdC by following this documentation here.
If you see issues while syncing users and groups, then refer to this section these considerations for using automatic provisioning.
Amazon Redshift cluster administrator or Amazon Redshift Serverless administrator must perform steps to configure Redshift as an IdC-enabled application. This enables Amazon Redshift to discover and connect to the IdC automatically to receive sign-in and user directory services.
After this, when the Amazon Redshift administrator creates a cluster or workgroup, they can enable the new data warehouse to use IdC and its identity-management capabilities. The point of enabling Amazon Redshift as an IdC-managed application is so you can control user and group permissions from within the IdC, or from a source third-party identity provider that’s integrated with it.
When your database users sign in to an Amazon Redshift database, for example an analyst or a data scientist, it checks their groups in IdC and these are mapped to roles in Amazon Redshift. In this manner, a group can map to an Amazon Redshift database role that allows read access to a set of tables.
The following steps show how to make Amazon Redshift an AWS-managed application with IdC:


The following screenshot is from the IAM role:


After the Amazon Redshift administrator finishes the steps and saves the configuration, the IdC properties appear in the Redshift Console. Completing these tasks makes Redshift an IdC-enabled application.

After you select the managed application name, the properties in the console includes the integration status. It says Success when it’s completed. This status indicates if IdC configuration is completed.

In this step, Users or groups synced to your IdC directory are available to assign to your application where the Amazon Redshift administrator can decide which users or groups from IDC need to be included as part of Amazon Redshift application.
For example, if you have total 20 groups from your IdC and you don’t want all the groups to include as part of Amazon Redshift application, then you have options to choose which IdC groups to include as part of Amazon Redshift-enabled IdC application. Later, you can create two Redshift database roles as part of IDC integration in Amazon Redshift.
The following steps assign groups to Amazon Redshift-enabled IdC application:

After completing steps under section (Setting up IAM Identity Center integration with Amazon Redshift) — Amazon Redshift database administrator needs to configure new Redshift resources to work in alignment with IdC to make sign-in and data access easier. This is performed as part of the steps to create a provisioned cluster or a Serverless workgroup. Anyone with permissions to create Amazon Redshift resources can perform these IdC integration tasks. When you create a provisioned cluster, you start by choosing Create Cluster in the Amazon Redshift Console.
Note that when a new data warehouse is created, the IAM role specified for IdC integration is automatically attached to the provisioned cluster or Serverless Namespace. After you finish entering the required cluster metadata and create the resource, you can check the status for IdC integration in the properties.

If you have an existing provisioned cluster or serverless workgroup that you would like to enable for IdC integration, then you can do that by running a SQL command. You run the following command to enable integration. It’s required that a database administrator run the query.
Example:
To alter the IdP, use the following command (this new set of parameter values completely replaces the current values):
Few of the examples are:
Note: If you update the idc-namespace value, then all the new cluster created afterwards will be using the updated namespace.
For existing clusters or serverless workgroups, you need to update the namespace manually on each Amazon Redshift cluster using the previous command. Also, all the database roles associated with identity provider will be updated with new namespace value.
You can disable or enable the identity provider using the following command:
Example:
You can drop an existing identity provider. The following example shows how CASCADE deletes users and roles attached to the identity provider.
In this step, we pre-create the database roles in Amazon Redshift based on the groups that you synced in IdC. Make sure the role name matches with the IdC Group name.
Amazon Redshift roles simplify managing privileges required for your end-users. In this post, we create two database roles, sales and finance, and grant them access to query tables with sales and finance data, respectively. You can download this sample SQL Notebook and import into Redshift Query Editor v2 to run all cells in the notebook used in this example. Alternatively, you can copy and enter the SQL into your SQL client.
Below is the syntax to create role in Amazon Redshift:
For example:
Create the sales and finance database schema:
Creating the tables:
Below is the syntax to grant permission to the Amazon Redshift Serverless role:
Grant relevant permission to the role as per your requirement. In following example, we grant full permission to role sales on sales_schema and only select permission on finance_schema to role finance.
For example:
A permission set is a template that you create and maintain that defines a collection of one or more IAM policies. Permission sets simplify the assignment of AWS account access for users and groups in your organization. We’ll create a permission set to allow federated user to access Query Editor V
The following steps to create permission set:

https://<region>.console.aws.amazon.com/sqlworkbench/home.https://us-east-1.console.aws.amazon.com/sqlworkbench/home.


Now you’re ready to connect to Amazon Redshift Query Editor V2 and federated login using IdC authentication:
The following demonstration shows a federated user (Ethan) used the AWS access portal URL to access Amazon Redshift using IdC authentication. User Ethan accesses the sales_schema tables. If User Ethan tries to access the tables in finance_schema, then the user gets a permission denied error.

This means that you are trying to create a role with a wrong namespace. Please check current namespace using the command select * from identity_providers;
This means that an IAM role doesn’t have sufficient privileges to access to the IdC. Your IAM role should contain a policy with following permissions:
Please make sure that the user and group are added to the Amazon Redshift IdC application.
Complete the following steps to clean up your resources:
In this post, we showed you a detailed walkthrough of how you can integrate Okta with the IdC and Amazon Redshift Query Editor version 2 to simplify your SSO setup. This integration allows you to use role-based access control with Amazon Redshift. We encourage you to try out this integration.
To learn more about IdC with Amazon Redshift, visit the documentation.
 Debu Panda is a Senior Manager, Product Management at AWS. He is an industry leader in analytics, application platform, and database technologies, and has more than 25 years of experience in the IT world.
 Maneesh Sharma is a Senior Database Engineer at AWS with more than a decade of experience designing and implementing large-scale data warehouse and analytics solutions. He collaborates with various Amazon Redshift Partners and customers to drive better integration.
 Harshida Patel is a Principal Solutions Architect, Analytics with AWS.
 Praveen Kumar Ramakrishnan is a Senior Software Engineer at AWS. He has nearly 20 years of experience spanning various domains including filesystems, storage virtualization and network security. At AWS, he focuses on enhancing the Redshift data security.
 Karthik Ramanathan is a Sr. Software Engineer with AWS Redshift and is based in San Francisco. He brings close to two decades of development experience across the networking, data storage and IoT verticals prior to Redshift. When not at work, he is also a writer and loves to be in the water.
Post Syndicated from Peter Grainger original https://aws.amazon.com/blogs/security/use-codewhisperer-to-identify-issues-and-use-suggestions-to-improve-code-security-in-your-ide/
I’ve always loved building things, but when I first began as a software developer, my least favorite part of the job was thinking about security. The security of those first lines of code just didn’t seem too important. Only after struggling through security reviews at the end of a project, did I realize that a security focus at the start can save time and money, and prevent a lot of frustration.
This focus on security at the earliest phases of development is known in the DevOps community as DevSecOps. By adopting this approach, you can identify and improve security issues early, avoiding costly rework and reducing vulnerabilities in live systems. By using the security scanning capabilities of Amazon CodeWhisperer, you can identify potential security issues in your integrated development environment (IDE) as you code. After you identify these potential issues, CodeWhisperer can offer suggestions on how you can refactor to improve the security of your code early enough to help avoid the frustration of a last-minute change to your code.
In this post, I will show you how to get started with the code scanning feature of CodeWhisperer by using the AWS Toolkit for JetBrains extension in PyCharm to identify a potentially weak hashing algorithm in your IDE, and then use CodeWhisperer suggestions to quickly cycle through possible ways to improve the security of your code.
CodeWhisperer understands comments written in natural language (in English) and can generate multiple code suggestions in real time to help improve developer productivity. The code suggestions are based on a large language model (LLM) trained on Amazon and publicly available code with identified security vulnerabilities removed during the training process. For more details, see Amazon CodeWhisperer FAQs.
Security scans are available in VS Code and JetBrains for Java, Python, JavaScript, C#, TypeScript, CloudFormation, Terraform, and AWS Cloud Development Kit (AWS CDK) with both Python and TypeScript. AWS CodeGuru Security uses a detection engine and a machine leaning model that uses a combination of logistic regression and neural networks, finding relationships and understanding paths through code. CodeGuru Security can detect common security issues, log injection, secrets, and insecure use of AWS APIs and SDKs. The detection engine uses a Detector Library that has descriptions, examples, and additional information to help you understand why CodeWhisperer highlighted your code and whether you need to take action. You can start a scan manually through either the AWS Toolkit for Visual Studio Code or AWS Toolkit for JetBrains. To learn more, see How Amazon CodeGuru Security helps you effectively balance security and velocity.
To illustrate how PyCharm, Amazon CodeWhisperer, and Amazon CodeGuru interact, Figure 1 shows a high-level view of the interactions between PyCharm and services within AWS. For more information about this interaction, see the Amazon CodeWhisperer documentation.
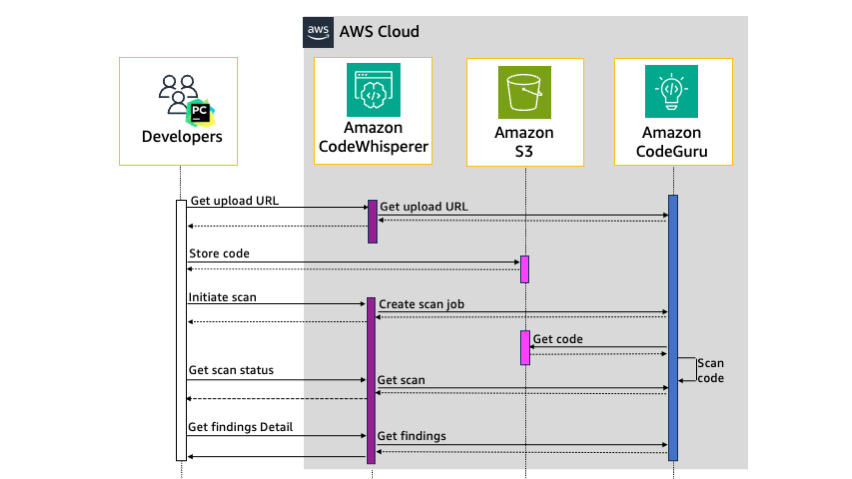
Figure 1: Sequence diagram of the security scan workflow
Communication from PyCharm to CodeWhisperer is HTTPS authenticated by using a bearer token in the authorization header of each request. As shown in Figure 1, when you manually start a security scan from PyCharm, the sequence is as follows:
For this walkthrough, you will start by configuring PyCharm to use AWS Toolkit for JetBrains. Then you will create an AWS Builder ID to authenticate the extension with AWS. Next, you will scan Python code that CodeWhisperer will identify as a potentially weak hashing algorithm, and learn how to find more details. Finally, you will learn how to use CodeWhisperer to improve the security of your code by using suggestions.
To follow along with this walkthrough, make sure that you have the following prerequisites in place:
This section provides step-by-step instructions on how to install and authenticate your JetBrains IDE. If you’ve already configured JetBrains or you’re using a different IDE, skip to the section Identify a potentially weak hashing algorithm by using CodeWhisperer security scans.
In this step, you will install the latest version of AWS Toolkit for JetBrains, create a new PyCharm project, sign up for an AWS Builder ID, and then use this ID to authenticate the toolkit with AWS. To authenticate with AWS, you need either an AWS Builder ID, AWS IAM Identity Center user details, or AWS IAM credentials. Creating an AWS Builder ID is the fastest way to get started and doesn’t require an AWS account, so that’s the approach I’ll walk you through here.
Figure 2 shows the plugins search dialog and search results for the AWS Toolkit extension.
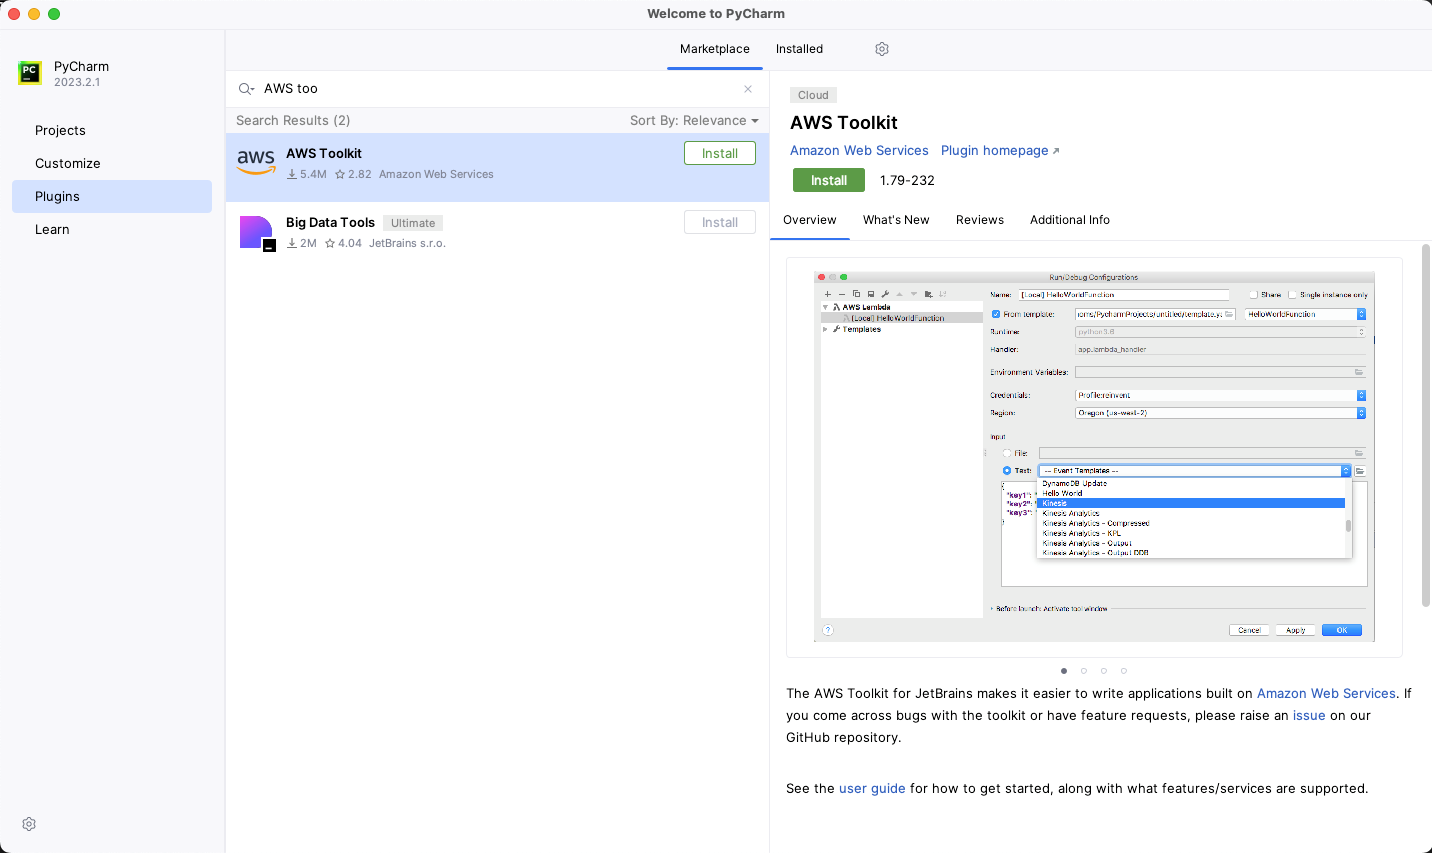
Figure 2: PyCharm plugins browser

Figure 3: Start CodeWhisperer

Figure 4: AWS Toolkit Add Connection

Figure 5: Authorize request page

Figure 6: Create your AWS Builder ID

Figure 7: Email verification

Figure 8: Allow AWS Toolkit for JetBrains to access your data
The next step is to create a file that uses the hashing algorithm, SHA-224. CodeWhisperer considers this algorithm to be potentially weak and references Common Weakness Enumeration (CWE)-328. In this step, you use this weak hashing algorithm instead of the recommend algorithm SHA-256 so that you can see how CodeWhisperer flags this potential issue.

Figure 9: AWS Toolkit window with security scan in progress
You can now interpret the results of the security scan.

Figure 10: Code highlighted with issue CWE-327,328 – Insecure hashing
CodeWhisperer has highlighted SHA-224 as a potential issue. However, to understand whether or not you need to make changes to improve the security of your code, you must do further investigation. A good starting point for your investigation is the CodeGuru Detector Library, which powers the scanning capabilities of CodeWhisperer. The entry in the Detector Library for insecure hashing provides example code and links to additional information.
This additional information reveals that the SHA-224 output is truncated and is 32 bits shorter than SHA-256. Because the output is truncated, SHA-224 is more susceptible to collision attacks than SHA-256. SHA-224 has 112-bit security compared to the 128-bit security of SHA-256. A collision attack is a way to find another input that yields an identical hash created by the original input. The CodeWhisperer issue description for insecure hashing in Figure 10 describes this as a potential issue and is the reason that CodeWhisperer flagged the code. However, if the size of the hash result is important for your use case, SHA-224 might be the correct solution, and if so, you can ignore this warning. But if you don’t have a specific reason to use SHA-224 over other algorithms, you should consider the alternative suggestions that CodeWhisperer offers, which I describe in the next section.
CodeWhisperer automatically generates suggestions in real time as you type based on your existing code and comments. Suggestions range from completing a single line of code to generating complete functions. However, because CodeWhisperer uses an LLM that is trained on vast amounts of data, you might receive multiple different suggestions. These suggestions might change over time, even when you give CodeWhisperer the same context. Therefore, you must use your judgement to decide if a suggestion is the correct solution.

Figure 11: CodeWhisperer auto-suggestions
Although the training data used for the CodeWhisperer machine learning model has identified that security vulnerabilities were removed, it’s still possible that some suggestions will contain security vulnerabilities. Therefore, make sure that you fully understand the CodeWhisperer suggestions before you accept them and use them in your code. You are responsible for the code that you produce. In our example, other algorithms to consider are those from the SHA-3 family, such as SHA3-256. This family of algorithms are built using the sponge function rather than the Merkle-Damgård structure that SHA-1 and SHA-2 families are built with. This means that the SHA-3 family offers greater resistance to certain security events but can be slower to compute in certain configurations and hardware. In this case, you have multiple options to improve the security of SHA-224. Before you decide which algorithm to use, test the performance on your target hardware. Whether you use the solution that CodeWhisperer proposes or an alternative, you should validate changes in the code by running the security scans again.

Figure 12: Final security scan results
In this blog post, you learned how to set up PyCharm with CodeWhisperer, how to scan code for potential vulnerabilities with security scans, and how to view the details of these potential issues and understand the implications. To improve the security of your code, you reviewed and accepted CodeWhisperer suggestions, and ran the security scan again, validating the suggestion that CodeWhisperer made. Although many potential security vulnerabilities are removed during training of the CodeWhisperer machine learning model, you should validate these suggestions. CodeWhisperer is a great tool to help you speed up software development, but you are responsible for accepting or rejecting suggestions.
The example in this post showed how to identify a potentially insecure hash and improve the security of the algorithm. But CodeWhisperer security scans can detect much more, such as the Open Web Application Security Project (OWASP) top ten web application security risks, CWE top 25 most dangerous software weaknesses, log injection, secrets, and insecure use of AWS APIs and SDKs. The detector engine behind these scans uses the searchable Detector Library with descriptions, examples, and references for additional information.
In addition to using CodeWhisperer suggestions, you can also integrate security scanning into your CI/CD pipeline. By combining CodeWhisperer and automated release pipeline checks, you can detect potential vulnerabilities early with validation throughout the delivery process. Catching potential issues earlier can help you resolve them quickly and reduce the chance of frustrating delays late in the delivery process.
Prioritizing security throughout the development lifecycle can help you build robust and secure applications. By using tools such as CodeWhisperer and adopting DevSecOps practices, you can foster a security-conscious culture on your development team and help deliver safer software to your users.
If you want to explore code scanning on your own, CodeWhisperer is now generally available, and the individual tier is free for individual use. With CodeWhisperer, you can enhance the security of your code and minimize potential vulnerabilities before they become significant problems.
If you have feedback about this post, submit comments in the Comments section below. If you have questions about this post, start a new thread on the Amazon CodeWhisperer re:Post or contact AWS Support.
Want more AWS Security news? Follow us on Twitter.
Post Syndicated from Jeff Barr original https://aws.amazon.com/blogs/aws/use-aws-fault-injection-service-to-demonstrate-multi-region-and-multi-az-application-resilience/
AWS Fault Injection Service (FIS) helps you to put chaos engineering into practice at scale. Today we are launching new scenarios that will let you demonstrate that your applications perform as intended if an AWS Availability Zone experiences a full power interruption or connectivity from one AWS region to another is lost.
You can use the scenarios to conduct experiments that will build confidence that your application (whether single-region or multi-region) works as expected when something goes wrong, help you to gain a better understanding of direct and indirect dependencies, and test recovery time. After you have put your application through its paces and know that it works as expected, you can use the results of the experiment for compliance purposes. When used in conjunction with other parts of AWS Resilience Hub, FIS can help you to fully understand the overall resilience posture of your applications.
Intro to Scenarios
We launched FIS in 2021 to help you perform controlled experiments on your AWS applications. In the post that I wrote to announce that launch, I showed you how to create experiment templates and to use them to conduct experiments. The experiments are built using powerful, low-level actions that affect specified groups of AWS resources of a particular type. For example, the following actions operate on EC2 instances and Auto Scaling Groups:
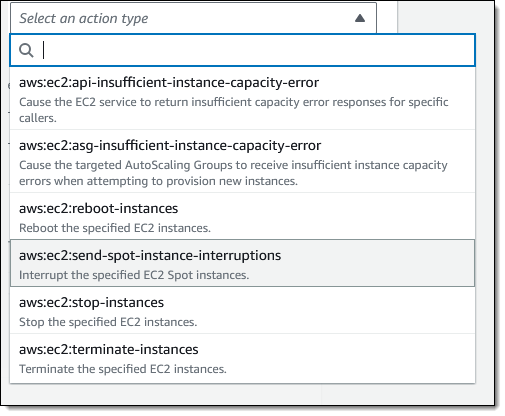
With these actions as building blocks, we recently launched the AWS FIS Scenario Library. Each scenario in the library defines events or conditions that you can use to test the resilience of your applications:

Each scenario is used to create an experiment template. You can use the scenarios as-is, or you can take any template as a starting point and customize or enhance it as desired.
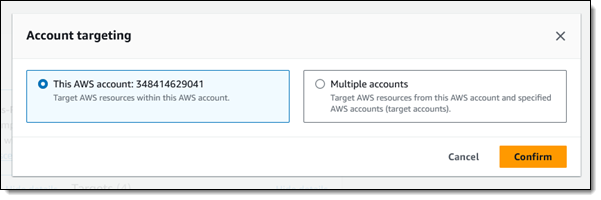
The scenarios can target resources in the same AWS account or in other AWS accounts:
New Scenarios
With all of that as background, let’s take a look at the new scenarios.
AZ Availability: Power Interruption – This scenario temporarily “pulls the plug” on a targeted set of your resources in a single Availability Zone including EC2 instances (including those in EKS and ECS clusters), EBS volumes, Auto Scaling Groups, VPC subnets, Amazon ElastiCache for Redis clusters, and Amazon Relational Database Service (RDS) clusters. In most cases you will run it on an application that has resources in more than one Availability Zone, but you can run it on a single-AZ app with an outage as the expected outcome. It targets a single AZ, and also allows you to disallow a specified set of IAM roles or Auto Scaling Groups from being able to launch fresh instances or start stopped instances during the experiment.
The New actions and targets experience makes it easy to see everything at a glance — the actions in the scenario and the types of AWS resources that they affect:
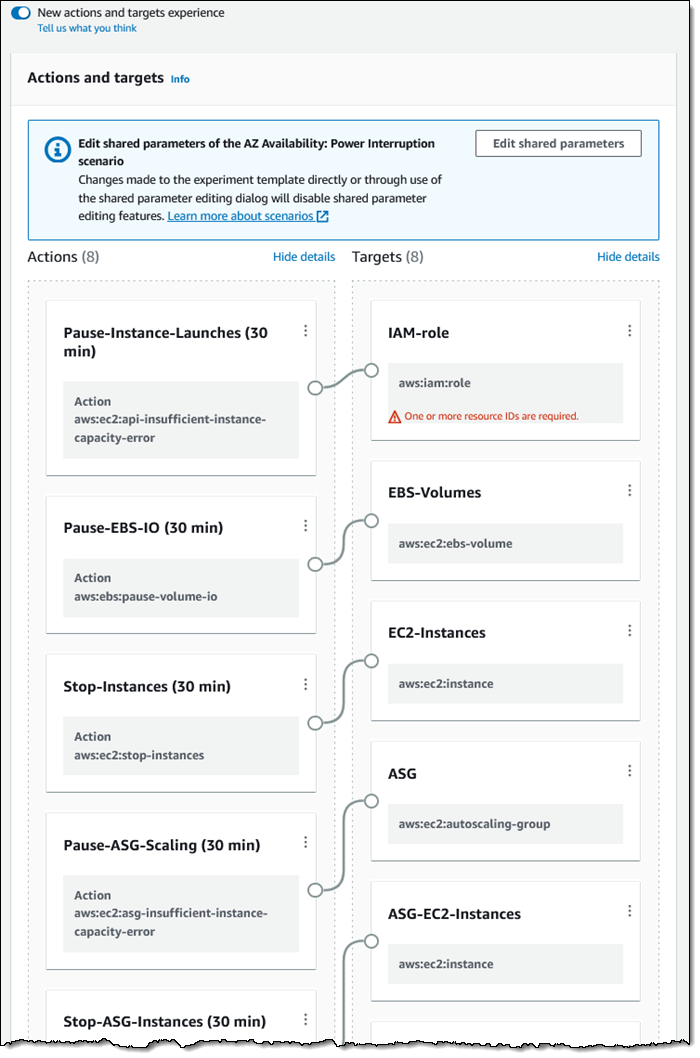
The scenarios include parameters that are used to customize the experiment template:

The Advanced parameters – targeting tags lets you control the tag keys and values that will be used to locate the resources targeted by experiments:

Cross-Region: Connectivity – This scenario prevents your application in a test region from being able to access resources in a target region. This includes traffic from EC2 instances, ECS tasks, EKS pods, and Lambda functions attached to a VPC. It also includes traffic flowing across Transit Gateways and VPC peering connections, as well as cross-region S3 and DynamoDB replication. The scenario looks like this out of the box:

This scenario runs for 3 hours (unless you change the disruptionDuration parameter), and isolates the test region from the target region in the specified ways, with advanced parameters to control the tags that are used to select the affected AWS resources in the isolated region:

You might also find that the Disrupt and Pause actions used in this scenario useful on their own:

For example, the aws:s3:bucket-pause-replication action can be used to pause replication within a region.
Things to Know
Here are a couple of things to know about the new scenarios:
Regions – The new scenarios are available in all commercial AWS Regions where FIS is available, at no additional cost.
Pricing – You pay for the action-minutes consumed by the experiments that you run; see the AWS Fault Injection Service Pricing Page for more info.
Naming – This service was formerly called AWS Fault Injection Simulator.
— Jeff;
Post Syndicated from Sébastien Stormacq original https://aws.amazon.com/blogs/aws/zonal-autoshift-automatically-shift-your-traffic-away-from-availability-zones-when-we-detect-potential-issues/
Today we’re launching zonal autoshift, a new capability of Amazon Route 53 Application Recovery Controller that you can enable to automatically and safely shift your workload’s traffic away from an Availability Zone when AWS identifies a potential failure affecting that Availability Zone and shift it back once the failure is resolved.
When deploying resilient applications, you typically deploy your resources across multiple Availability Zones in a Region. Availability Zones are distinct groups of physical data centers at a meaningful distance apart (typically miles) to make sure that they have diverse power, connectivity, network devices, and flood plains.
To help you protect against an application’s errors, like a failed deployment, an error of configuration, or an operator error, we introduced last year the ability to manually or programmatically trigger a zonal shift. This enables you to shift the traffic away from one Availability Zone when you observe degraded metrics in that zone. It does so by configuring your load balancer to direct all new connections to infrastructure in healthy Availability Zones only. This allows you to preserve your application’s availability for your customers while you investigate the root cause of the failure. Once fixed, you stop the zonal shift to ensure the traffic is distributed across all zones again.
Zonal shift works at the Application Load Balancer (ALB) or Network Load Balancer (NLB) level only when cross-zone load balancing is turned off, which is the default for NLB. In a nutshell, load balancers offer two levels of load balancing. The first level is configured in the DNS. Load balancers expose one or more IP addresses for each Availability Zone, offering a client-side load balancing between zones. Once the traffic hits an Availability Zone, the load balancer sends traffic to registered healthy targets, typically an Amazon Elastic Compute Cloud (Amazon EC2) instance. By default, ALBs send traffic to targets across all Availability Zones. For zonal shift to properly work, you must configure your load balancers to disable cross-zone load balancing.
When zonal shift starts, the DNS sends all traffic away from one Availability Zone, as illustrated by the following diagram.

Manual zonal shift helps to protect your workload against errors originating from your side. But when there is a potential failure in an Availability Zone, it is sometimes difficult for you to identify or detect the failure. Detecting an issue in an Availability Zone using application metrics is difficult because, most of the time, you don’t track metrics per Availability Zone. Moreover, your services often call dependencies across Availability Zone boundaries, resulting in errors seen in all Availability Zones. With modern microservice architectures, these detection and recovery steps must often be performed across tens or hundreds of discrete microservices, leading to recovery times of multiple hours.
Customers asked us if we could take the burden off their shoulders to detect a potential failure in an Availability Zone. After all, we might know about potential issues through our internal monitoring tools before you do.
With this launch, you can now configure zonal autoshift to protect your workloads against potential failure in an Availability Zone. We use our own AWS internal monitoring tools and metrics to decide when to trigger a network traffic shift. The shift starts automatically; there is no API to call. When we detect that a zone has a potential failure, such as a power or network disruption, we automatically trigger an autoshift of your infrastructure’s NLB or ALB traffic, and we shift the traffic back when the failure is resolved.
Obviously, shifting traffic away from an Availability Zone is a delicate operation that must be carefully prepared. We built a series of safeguards to ensure we don’t degrade your application availability by accident.
First, we have internal controls to ensure we shift traffic away from no more than one Availability Zone at a time. Second, we practice the shift on your infrastructure for 30 minutes every week. You can define blocks of time when you don’t want the practice to happen, for example, 08:00–18:00, Monday through Friday. Third, you can define two Amazon CloudWatch alarms to act as a circuit breaker during the practice run: one alarm to prevent starting the practice run at all and one alarm to monitor your application health during a practice run. When either alarm triggers during the practice run, we stop it and restore traffic to all Availability Zones. The state of application health alarm at the end of the practice run indicates its outcome: success or failure.
According to the principle of shared responsibility, you have two responsibilities as well.
First you must ensure there is enough capacity deployed in all Availability Zones to sustain the increase of traffic in remaining Availability Zones after traffic has shifted. We strongly recommend having enough capacity in remaining Availability Zones at all times and not relying on scaling mechanisms that could delay your application recovery or impact its availability. When zonal autoshift triggers, AWS Auto Scaling might take more time than usual to scale your resources. Pre-scaling your resource ensures a predictable recovery time for your most demanding applications.
Let’s imagine that to absorb regular user traffic, your application needs six EC2 instances across three Availability Zones (2×3 instances). Before configuring zonal autoshift, you should ensure you have enough capacity in the remaining Availability Zones to absorb the traffic when one Availability Zone is not available. In this example, it means three instances per Availability Zone (3×3 = 9 instances with three Availability Zones in order to keep 2×3 = 6 instances to handle the load when traffic is shifted to two Availability Zones).
In practice, when operating a service that requires high reliability, it’s normal to operate with some redundant capacity online for eventualities such as customer-driven load spikes, occasional host failures, etc. Topping up your existing redundancy in this way both ensures you can recover rapidly during an Availability Zone issue but can also give you greater robustness to other events.
Second, you must explicitly enable zonal autoshift for the resources you choose. AWS applies zonal autoshift only on the resources you chose. Applying a zonal autoshift will affect the total capacity allocated to your application. As I just described, your application must be prepared for that by having enough capacity deployed in the remaining Availability Zones.
Of course, deploying this extra capacity in all Availability Zones has a cost. When we talk about resilience, there is a business tradeoff to decide between your application availability and its cost. This is another reason why we apply zonal autoshift only on the resources you select.
Let’s see how to configure zonal autoshift
To show you how to configure zonal autoshift, I deploy my now-famous TicTacToe web application using a CDK script. I open the Route 53 Application Recovery Controller page of the AWS Management Console. On the left pane, I select Zonal autoshift. Then, on the welcome page, I select Configure zonal autoshift for a resource.

I select the load balancer of my demo application. Remember that currently, only load balancers with cross-zone load balancing turned off are eligible for zonal autoshift. As the warning on the console reminds me, I also make sure my application has enough capacity to continue to operate with the loss of one Availability Zone.

I scroll down the page and configure the times and days I don’t want AWS to run the 30-minute practice. At first, and until I’m comfortable with autoshift, I block the practice 08:00–18:00, Monday through Friday. Pay attention that hours are expressed in UTC, and they don’t vary with daylight saving time. You may use a UTC time converter application for help. While it is safe for you to exclude business hours at the start, we recommend configuring the practice run also during your business hours to ensure capturing issues that might not be visible when there is low or no traffic on your application. You probably most need zonal autoshift to work without impact at your peak time, but if you have never tested it, how confident are you? Ideally, you don’t want to block any time at all, but we recognize that’s not always practical.

Further down on the same page, I enter the two circuit breaker alarms. The first one prevents the practice from starting. You use this alarm to tell us this is not a good time to start a practice run. For example, when there is an issue ongoing with your application or when you’re deploying a new version of your application to production. The second CloudWatch alarm gives the outcome of the practice run. It enables zonal autoshift to judge how your application is responding to the practice run. If the alarm stays green, we know all went well.
If either of these two alarms triggers during the practice run, zonal autoshift stops the practice and restores the traffic to all Availability Zones.
Finally, I acknowledge that a 30-minute practice run will run weekly and that it might reduce the availability of my application.
Then, I select Create.
 And that’s it.
After a few days, I see the history of the practice runs on the Zonal shift history for resource tab of the console. I monitor the history of my two circuit breaker alarms to stay confident everything is correctly monitored and configured.

It’s not possible to test an autoshift itself. It triggers automatically when we detect a potential issue in an Availability Zone. I asked the service team if we could shut down an Availability Zone to test the instructions I shared in this post; they politely declined my request :-).
To test your configuration, you can trigger a manual shift, which behaves identically to an autoshift.
A few more things to know
Zonal autoshift is now available at no additional cost in all AWS Regions, except for China and GovCloud.
We recommend applying the crawl, walk, run methodology. First, you get started with manual zonal shifts to acquire confidence in your application. Then, you turn on zonal autoshift configured with practice runs outside of your business hours. Finally, you modify the schedule to include practice zonal shifts during your business hours. You want to test your application response to an event when you least want it to occur.
We also recommend that you think holistically about how all parts of your application will recover when we move traffic away from one Availability Zone and then back. The list that comes to mind (although certainly not complete) is the following.
First, plan for extra capacity as I discussed already. Second, think about possible single points of failure in each Availability Zone, such as a self-managed database running on a single EC2 instance or a microservice that leaves in a single Availability Zone, and so on. I strongly recommend using managed databases, such as Amazon DynamoDB or Amazon Aurora for applications requiring zonal shifts. These have built-in replication and fail-over mechanisms in place. Third, plan the switch back when the Availability Zone will be available again. How much time do you need to scale your resources? Do you need to rehydrate caches?
You can learn more about resilient architectures and methodologies with this great series of articles from my colleague Adrian.
Finally, remember that only load balancers with cross-zone load balancing turned off are currently eligible for zonal autoshift. To turn off cross-zone load balancing from a CDK script, you need to remove stickinessCookieDuration and add load_balancing.cross_zone.enabled=false on the target group. Here is an example with CDK and Typescript:
    // Add the auto scaling group as a load balancing
    // target to the listener.
    const targetGroup = listener.addTargets('MyApplicationFleet', {
      port: 8080,
      // for zonal shift, stickiness & cross-zones load balancing must be disabled
      // stickinessCookieDuration: Duration.hours(1),
      targets: [asg]
    });
    // disable cross zone load balancing
    targetGroup.setAttribute("load_balancing.cross_zone.enabled", "false");
Now it’s time for you to select your applications that would benefit from zonal autoshift. Start by reviewing your infrastructure capacity in each Availability Zone and then define the circuit breaker alarms. Once you are confident your monitoring is correctly configured, go and enable zonal autoshift.
Post Syndicated from Donnie Prakoso original https://aws.amazon.com/blogs/aws/ide-extension-for-aws-application-composer-enhances-visual-modern-applications-development-with-ai-generated-iac/
Today, I’m happy to share the integrated development environment (IDE) extension for AWS Application Composer. Now you can use AWS Application Composer directly in your IDE to visually build modern applications and iteratively develop your infrastructure as code templates with Amazon CodeWhisperer.
Announced as preview at AWS re:Invent 2022 and generally available in March 2023, Application Composer is a visual builder that makes it easier for developers to visualize, design, and iterate on an application architecture by dragging, grouping, and connecting AWS services on a visual canvas. Application Composer simplifies building modern applications by providing an easy-to-use visual drag-and-drop interface and generates IaC templates in real time.
AWS Application Composer also lets you work with AWS CloudFormation resources. In September, AWS Application Composer announced support for 1000+ AWS CloudFormation resources. This provides you the flexibility to define configuration for your AWS resources at a granular level.
Building modern applications with modern tools
The IDE extension for AWS Application Composer provides you with the same visual drag-and-drop experience and functionality as what it offers you in the console. Utilizing the visual canvas in your IDE means you can quickly prototype your ideas and focus on your application code.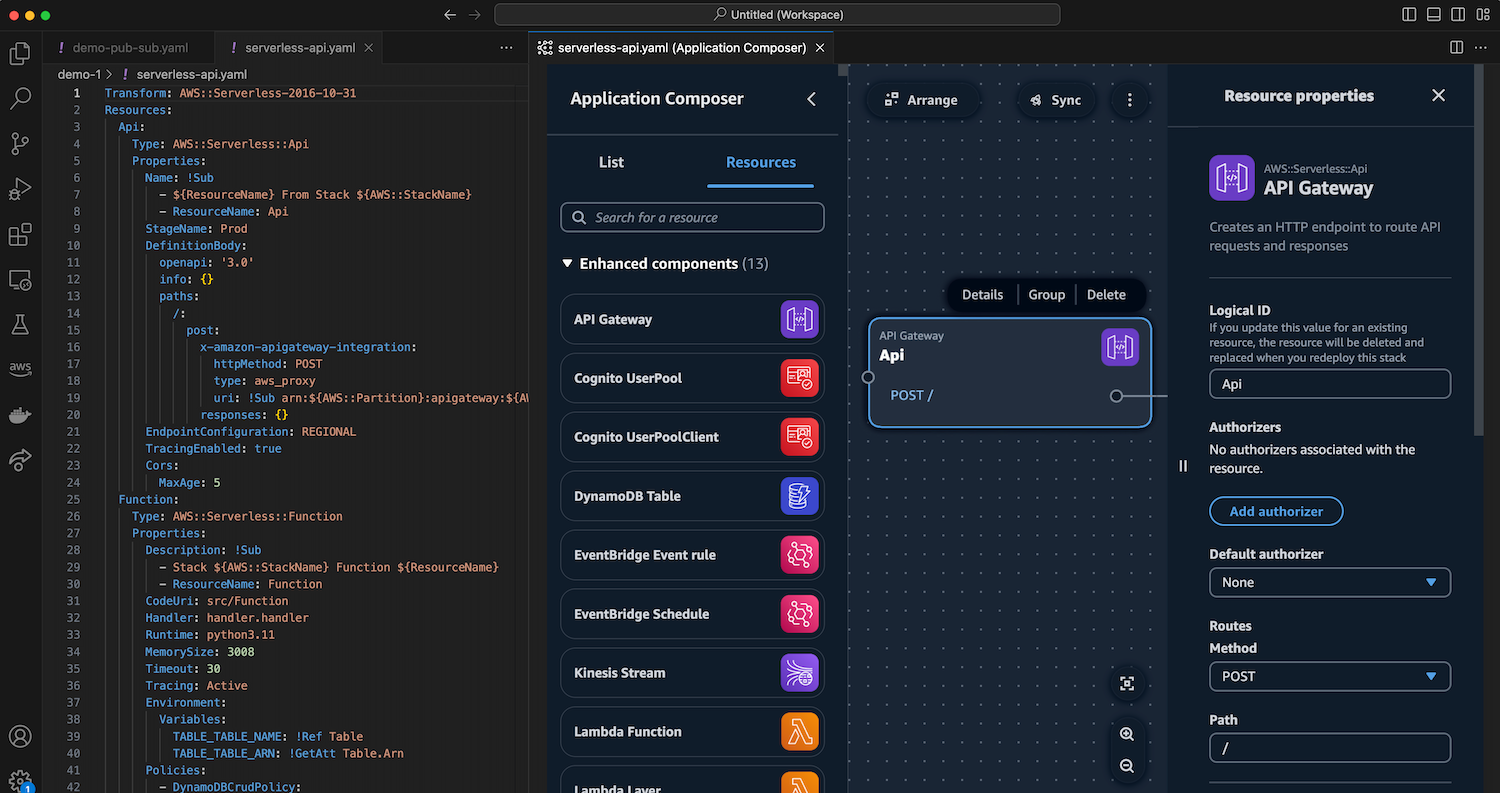
With Application Composer running in your IDE, you can also use the various tools available in your IDE. For example, you can seamlessly integrate IaC templates generated real-time by Application Composer with AWS Serverless Application Model (AWS SAM) to manage and deploy your serverless applications.
In addition to making Application Composer available in your IDE, you can create generative AI powered code suggestions in the CloudFormation template in real time while visualizing the application architecture in split view. You can pair and synchronize Application Composer’s visualization and CloudFormation template editing side by side in the IDE without context switching between consoles to iterate on their designs. This minimizes hand coding and increase your productivity.
Using AWS Application Composer in Visual Studio Code
First, I need to install the latest AWS Toolkit for Visual Studio Code plugin. If you already have the AWS Toolkit plugin installed, you only need to update the plugin to start using Application Composer.
To start using Application Composer, I don’t need to authenticate into my AWS account. With Application Composer available on my IDE, I can open my existing AWS CloudFormation or AWS SAM templates.
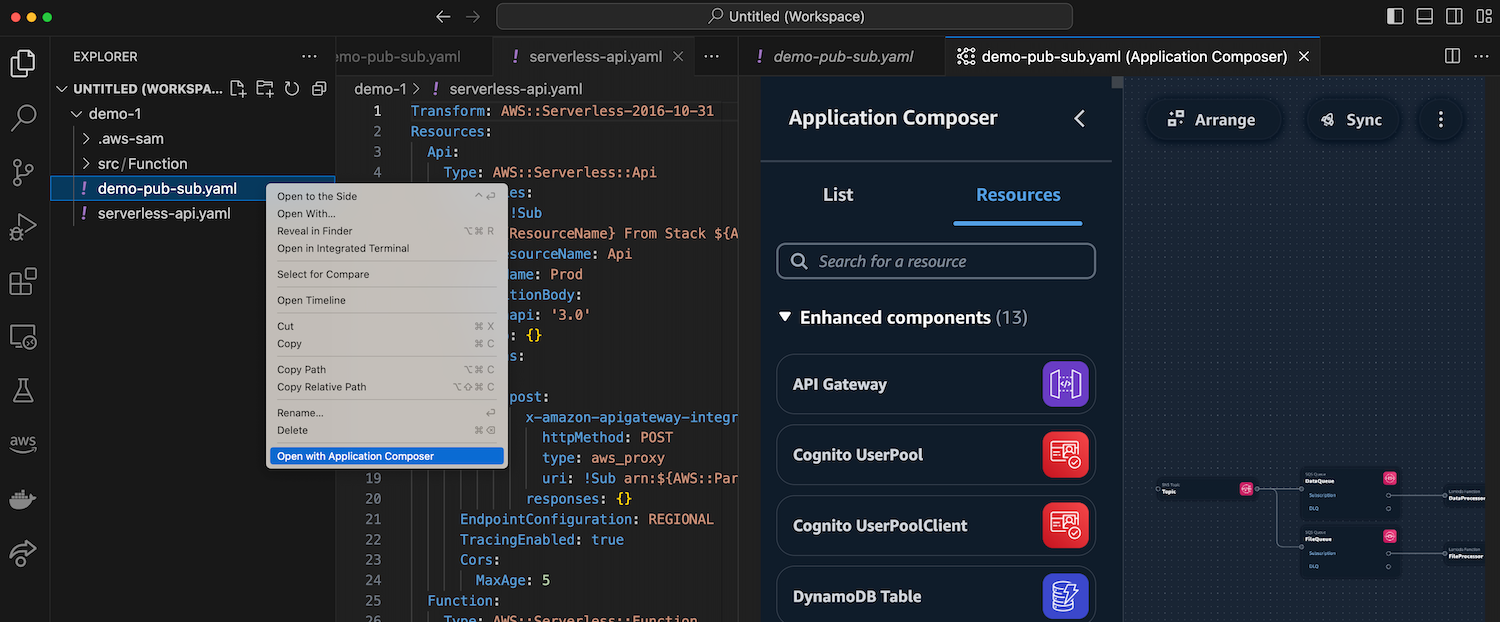
Another method is to create a new blank file, then right-click on the file and select Open with Application Composer to start designing my application visually.
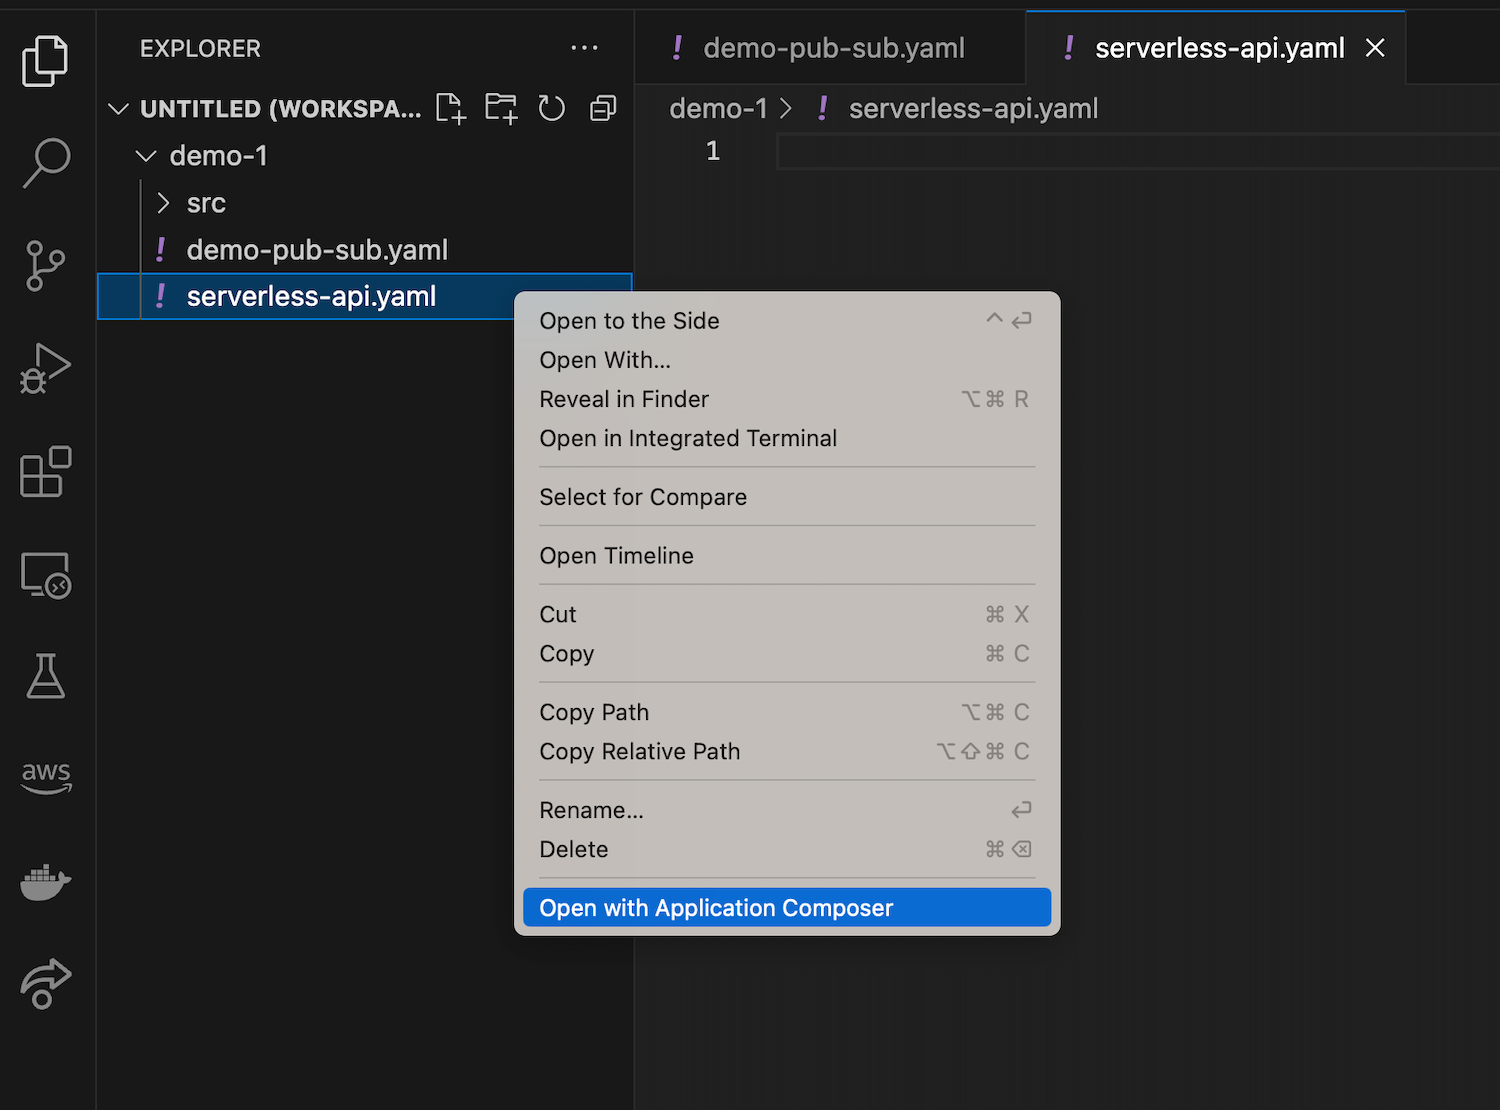
This will provide me with a blank canvas. Here I have both code and visual editors at the same time to build a simple serverless API using Amazon API Gateway, AWS Lambda, and Amazon DynamoDB. Any changes that I make on the canvas will also be reflected in real time on my IaC template.
I get consistent experiences, such as when I use the Application Composer console. For example, if I make some modifications to my AWS Lambda function, it will also create relevant files in my local folder.

With IaC templates available in my local folder, it’s easier for me to manage my applications with AWS SAM CLI. I can create continuous integration and continuous delivery (CI/CD) with sam pipeline or deploy my stack with sam deploy.
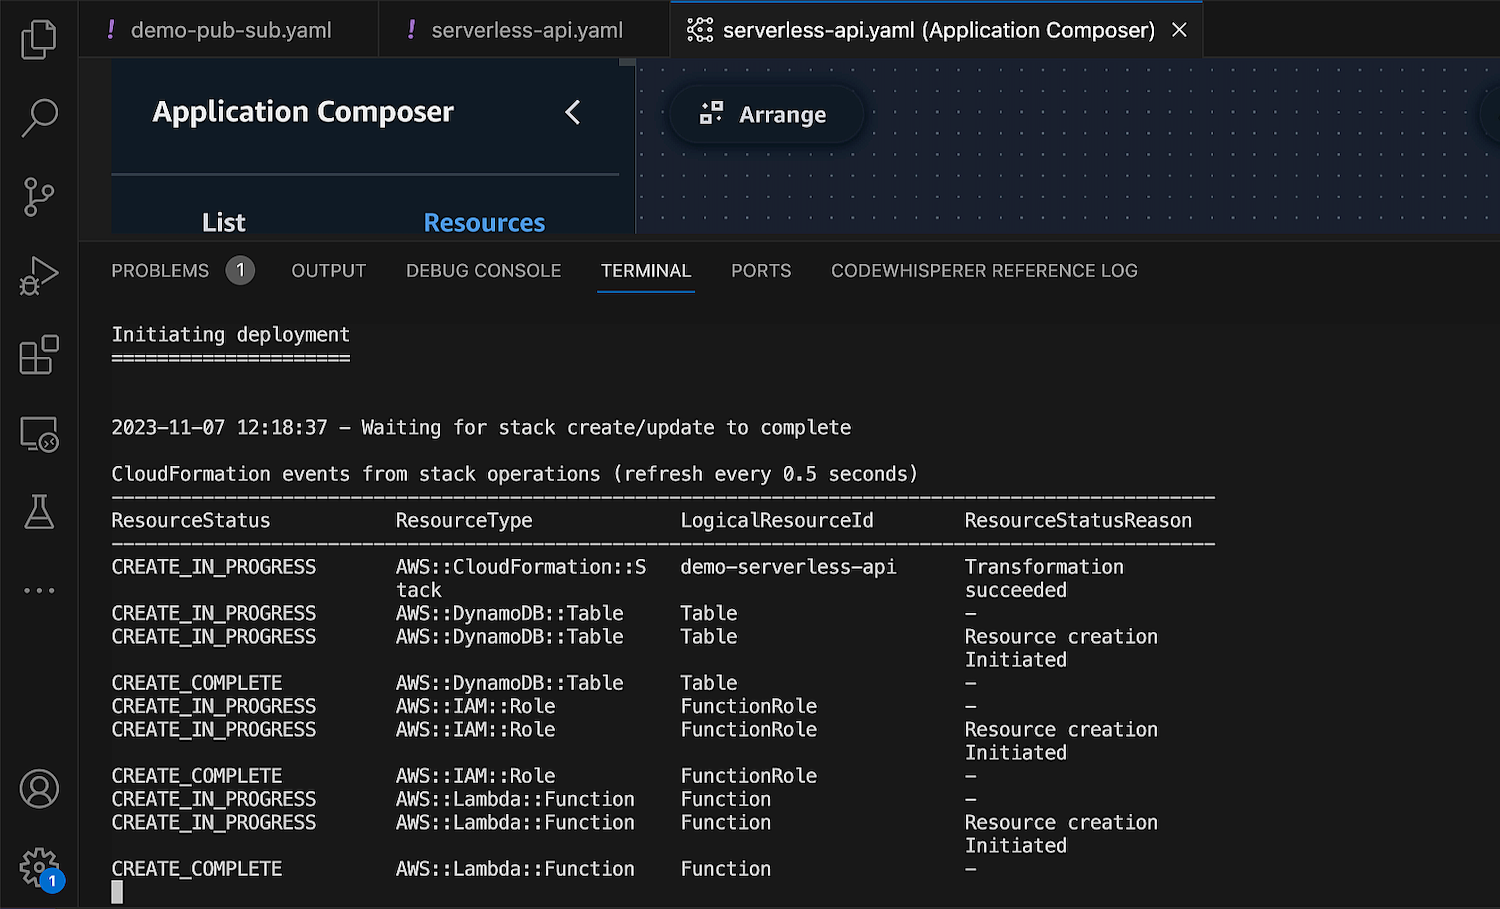
One of the features that accelerates my development workflow is the built-in Sync feature that seamlessly integrates with AWS SAM command sam sync. This feature syncs my local application changes to my AWS account, which is helpful for me to do testing and validation before I deploy my applications into a production environment.

Developing IaC templates with generative AI
With this new capability, I can use generative AI code suggestions to quickly get started with any of CloudFormation’s 1000+ resources. This also means that it’s now even easier to include standard IaC resources to extend my architecture.
For example, I need to use Amazon MQ, which is a standard IaC resource, and I need to modify some configurations for its AWS CloudFormation resource using Application Composer. In the Resource configuration section, change some values if needed, then choose Generate. Application Composer provides code suggestions that I can accept and incorporate into my IaC template.

This capability helps me to improve my development velocity by eliminating context switching. I can design my modern applications using AWS Application Composer canvas and use various tools such as Amazon CodeWhisperer and AWS SAM to accelerate my development workflow.
Things to know
Here are a couple of things to note:
Supported IDE – At launch, this new capability is available for Visual Studio Code.
Pricing – The IDE extension for AWS Application Composer is available at no charge.
Get started with IDE extension for AWS Application Composer by installing the latest AWS Toolkit for Visual Studio Code.
Happy coding!
— Donnie
Post Syndicated from Vinod Jayendra original https://aws.amazon.com/blogs/big-data/prepare-and-load-amazon-s3-data-into-teradata-using-aws-glue-through-its-native-connector-for-teradata-vantage/
In this post, we explore how to use the AWS Glue native connector for Teradata Vantage to streamline data integrations and unlock the full potential of your data.
Businesses often rely on Amazon Simple Storage Service (Amazon S3) for storing large amounts of data from various data sources in a cost-effective and secure manner. For those using Teradata for data analysis, integrations through the AWS Glue native connector for Teradata Vantage unlock new possibilities. AWS Glue enhances the flexibility and efficiency of data management, allowing companies to seamlessly integrate their data, regardless of its location, with Teradata’s analytical capabilities. This new connector eliminates technical hurdles related to configuration, security, and management, enabling companies to effortlessly export or import their datasets into Teradata Vantage. As a result, businesses can focus more on extracting meaningful insights from their data, rather than dealing with the intricacies of data integration.
AWS Glue is a serverless data integration service that makes it straightforward for analytics users to discover, prepare, move, and integrate data from multiple sources for analytics, machine learning (ML), and application development. With AWS Glue, you can discover and connect to more than 100 diverse data sources and manage your data in a centralized data catalog. You can visually create, run, and monitor extract, transform, and load (ETL) pipelines to load data into your data lakes.
Teradata Corporation is a leading connected multi-cloud data platform for enterprise analytics, focused on helping companies use all their data across an enterprise, at scale. As an AWS Data & Analytics Competency partner, Teradata offers a complete cloud analytics and data platform, including for Machine Learning.
AWS Glue provides support for Teradata, accessible through both AWS Glue Studio and AWS Glue ETL scripts. With AWS Glue Studio, you benefit from a visual interface that simplifies the process of connecting to Teradata and authoring, running, and monitoring AWS Glue ETL jobs. For data developers, this support extends to AWS Glue ETL scripts, where you can use Python or Scala to create and manage more specific data integration and transformation tasks.
The AWS Glue native connector for Teradata Vantage allows you to efficiently read and write data from Teradata without the need to install or manage any connector libraries. You can add Teradata as both the source and target within AWS Glue Studio’s no-code, drag-and-drop visual interface or use the connector directly in an AWS Glue ETL script job.
In this example, you use AWS Glue Studio to enrich and upload data stored on Amazon S3 to Teradata Vantage. You start by joining the Event and Venue files from the TICKIT dataset. Next, you filter the results to a single geographic region. Finally, you upload the refined data to Teradata Vantage.
The TICKIT dataset tracks sales activity for the fictional TICKIT website, where users buy and sell tickets online for sporting events, shows, and concerts. In this dataset, analysts can identify ticket movement over time, success rates for sellers, and best-selling events, venues, and seasons.
For this example, you use AWS Glue Studio to develop a visual ETL pipeline. This pipeline will read data from Amazon S3, perform transformations, and then load the transformed data into Teradata. The following diagram illustrates this architecture.

By the end of this post, your visual ETL job will resemble the following screenshot.

For this example, you should have access to an existing Teradata database endpoint with network reachability from AWS and permissions to create tables and load and query data.
AWS Glue needs network access to Teradata to read or write data. How this is configured depends on where your Teradata is deployed and the specific network configuration. For Teradata deployed on AWS, you might need to configure VPC peering or AWS PrivateLink, security groups, and network access control lists (NACLs) to allow AWS Glue to communicate with Teradata overt TCP. If Teradata is outside AWS, networking services such as AWS Site-to-Site VPN or AWS Direct Connect may be required. Public internet access is not recommended due to security risks. If you choose public access, it’s safer to run the AWS Glue job in a VPC behind a NAT gateway. This approach enables you to allow list only one IP address for incoming traffic on your network firewall. For more information, refer to Infrastructure security in AWS Glue.
Every object in Amazon S3 is stored in a bucket. Before you can store data in Amazon S3, you must create an S3 bucket to store the results. Complete the following steps:
To connect to Teradata from AWS Glue, see Configuring Teradata Connection.
You must create and store your Teradata credentials in an AWS Secrets Manager secret and then associate that secret with a Teradata AWS Glue connection. We discuss these two steps in more detail later in this post.
When you create the AWS Glue ETL job, you specify an AWS Identity and Access Management (IAM) role for the job to use. The role must grant access to all resources used by the job, including Amazon S3 (for any sources, targets, scripts, driver files, and temporary directories) and Secrets Manager. For instructions, see Configure an IAM role for your ETL job.
Using your preferred database tool, log in to Teradata. Run the following code to create the table in Teradata where you will load your data:
An AWS Glue connection is a Data Catalog object that stores login credentials, URI strings, and more. The Teradata connector requires Secrets Manager for storing the Teradata user name and password that you use to connect to Teradata.
To store the Teradata user name and password in Secrets Manager, complete the following steps:
teradata_user, then choose Add row.teradata_user_password, then choose Next.
Now you’re ready to create an AWS Glue connection to Teradata. Complete the following steps:
teradata_connection).jdbc:teradata://url_of_teradata/database=name_of_your_database.
Complete the following steps to create your AWS Glue ETL job:
We add venue_pipe.txt as our first dataset.

venue_pipe.txt.
Now we add allevents_pipe.txt as our second dataset.
allevents_pipe.txt.Next, we rename the columns of the Venue dataset.
venueidvenuenamevenuecityvenuestatevenueseats
Now we filter the Venue dataset to a specific geographic region.
venuestate for Key, choose matches for Operation, and enter DC for Value.
Now we rename the columns in the Event dataset.
eventide_venueidcatiddateideventnamestarttimeNext, we join the Venue and Event datasets.
venueid for Location Filter and e_venueid for Rename Event data.
Now we drop the duplicate column.
e_venueid .
Next, we load the data into the Teradata table.
teradata_connection.schema.tablename of the table you created in Teradata.
Lastly, we run the job and load the data into Teradata.
A banner will display that the job has started.
The run status will change to Succeeded when the job is complete.

The filtered and joined data from the two datasets will be in the table.

To avoid incurring additional charges caused by resources created as part of this post, make sure you delete the items you created in the AWS account for this post:
In this post, you created a connection to Teradata using AWS Glue and then created an AWS Glue job to transform and load data into Teradata. The AWS Glue native connector for Teradata Vantage empowers your data analytics journey by providing a seamless and efficient pathway for integrating your data with Teradata. This new capability in AWS Glue not only simplifies your data integration workflows but also opens up new avenues for advanced analytics, business intelligence, and machine learning innovations.
With the AWS Teradata Connector, you have the best tool at your disposal for simplifying data integration tasks. Whether you’re looking to load Amazon S3 data into Teradata for analytics, reporting, or business insights, this new connector streamlines the process, making it more accessible and cost-effective.
To get started with AWS Glue, refer to Getting Started with AWS Glue.
 Kamen Sharlandjiev is a Sr. Big Data and ETL Solutions Architect and AWS Glue expert. He’s on a mission to make life easier for customers who are facing complex data integration challenges. His secret weapon? Fully managed, low-code AWS services that can get the job done with minimal effort and no coding. Follow Kamen on LinkedIn to keep up to date with the latest AWS Glue news!
 Sean Bjurstrom is a Technical Account Manager in ISV accounts at Amazon Web Services, where he specializes in analytics technologies and draws on his background in consulting to support customers on their analytics and cloud journeys. Sean is passionate about helping businesses harness the power of data to drive innovation and growth. Outside of work, he enjoys running and has participated in several marathons.
 Vinod Jayendra is an Enterprise Support Lead in ISV accounts at Amazon Web Services, where he helps customers solve their architectural, operational, and cost-optimization challenges. With a particular focus on serverless technologies, he draws from his extensive background in application development to help customers build top-tier solutions. Beyond work, he finds joy in quality family time, embarking on biking adventures, and coaching youth sports teams.
 Doug Mbaya is a Senior Partner Solution architect with a focus in analytics and machine learning. Doug works closely with AWS partners and helps them integrate their solutions with AWS analytics and machine learning solutions in the cloud.
Post Syndicated from Antje Barth original https://aws.amazon.com/blogs/aws/amazon-sagemaker-studio-adds-web-based-interface-code-editor-flexible-workspaces-and-streamlines-user-onboarding/
Today, we are announcing an improved Amazon SageMaker Studio experience! The new SageMaker Studio web-based interface loads faster and provides consistent access to your preferred integrated development environment (IDE) and SageMaker resources and tooling, irrespective of your IDE choice. In addition to JupyterLab and RStudio, SageMaker Studio now includes a fully managed Code Editor based on Code-OSS (Visual Studio Code Open Source).
Both Code Editor and JupyterLab can be launched using a flexible workspace. With spaces, you can scale the compute and storage for your IDE up and down as you go, customize runtime environments, and pause-and-resume coding anytime from anywhere. You can spin up multiple such spaces, each configured with a different combination of compute, storage, and runtimes.
SageMaker Studio now also comes with a streamlined onboarding and administration experience to help both individual users and enterprise administrators get started in minutes. Let me give you a quick tour of some of these highlights.
New SageMaker Studio web-based interface
The new SageMaker Studio web-based interface acts as a command center for launching your preferred IDE and accessing your SageMaker tools to build, train, tune, and deploy models. You can now view SageMaker training jobs and endpoints in SageMaker Studio and access foundation models (FMs) via SageMaker JumpStart. Also, you no longer need to manually upgrade SageMaker Studio.

New Code Editor based on Code-OSS (Visual Studio Code Open Source)
As a data scientist or machine learning (ML) practitioner, you can now sign in to SageMaker Studio and launch Code Editor directly from your browser. With Code Editor, you have access to thousands of VS Code compatible extensions from Open VSX registry and the preconfigured AWS toolkit for Visual Studio Code for developing and deploying applications on AWS. You can also use the artificial intelligence (AI)-powered coding companion and security scanning tool powered by Amazon CodeWhisperer and Amazon CodeGuru.

Launch Code Editor and JupyterLab in a flexible workspace
You can launch both Code Editor and JupyterLab using private spaces that only the user creating the space has access to. This flexible workspace is designed to provide a faster and more efficient coding environment.
The spaces come preconfigured with a SageMaker distribution that contains popular ML frameworks and Python packages. With the help of the AI-powered coding companions and security tools, you can quickly generate, debug, explain, and refactor your code.
In addition, SageMaker Studio comes with an improved collaboration experience. You can use the built-in Git integration to share and version code or bring your own shared file storage using Amazon EFS to access a collaborative filesystem across different users or teams.


Streamlined user onboarding and administration
With redesigned setup and onboarding workflows, you can now set up SageMaker Studio domains within minutes. As an individual user, you can now use a one-click experience to launch SageMaker Studio using default presets and without the need to learn about domains or AWS IAM roles.
As an enterprise administrator, step-by-step instructions help you choose the right authentication method, connect to your third-party identity providers, integrate networking and security configurations, configure fine-grained access policies, and choose the right applications to enable in SageMaker Studio. You can also update settings at any time.
To get started, navigate to the SageMaker console and select either Set up for single user or Set up for organization.

The single-user setup will start deploying a SageMaker Studio domain using default presets and will be ready within a few minutes. The setup for organizations will guide you through the configuration step-by-step. Note that you can choose to keep working with the classic SageMaker Studio experience or start exploring the new experience.

Now available
The new Amazon SageMaker Studio experience is available today in all AWS Regions where SageMaker Studio is available. Starting today, new SageMaker Studio domains will default to the new web-based interface. If you have an existing setup and want to start using the new experience, check out the SageMaker Developer Guide for instructions on how to migrate your existing domains.
Give it a try, and let us know what you think. You can send feedback to AWS re:Post for Amazon SageMaker Studio or through your usual AWS contacts.
Start building your ML projects with Amazon SageMaker Studio today!
— Antje
Post Syndicated from Sébastien Stormacq original https://aws.amazon.com/blogs/aws/three-new-capabilities-for-amazon-inspector-broaden-the-realm-of-vulnerability-scanning-for-workloads/
Today, Amazon Inspector adds three new capabilities to increase the realm of possibilities when scanning your workloads for software vulnerabilities:
Amazon Inspector is a vulnerability management service that continually scans your AWS workloads for known software vulnerabilities and unintended network exposure. Amazon Inspector automatically discovers and scans running EC2 instances, container images in Amazon Elastic Container Registry (Amazon ECR) and within your CI/CD tools, and Lambda functions.
We all know engineering teams often face challenges when it comes to promptly addressing vulnerabilities. This is because of the tight release deadlines that force teams to prioritize development over tackling issues in their vulnerability backlog. But it’s also due to the complex and ever-evolving nature of the security landscape. As a result, a study showed that organizations take 250 days on average to resolve critical vulnerabilities. It is therefore crucial to identify potential security issues early in the development lifecycle to prevent their deployment into production.
Detecting vulnerabilities in your AWS Lambda functions code
Let’s start close to the developer with Lambda functions code.
In November 2022 and June 2023, Amazon Inspector added the capability to scan your function’s dependencies and code. Today, we’re adding generative AI and automated reasoning to analyze your code and automatically create remediation as code patches.
Amazon Inspector can now provide in-context code patches for multiple classes of vulnerabilities detected during security scans. Amazon Inspector extends the assessment of your code for security issues like injection flaws, data leaks, weak cryptography, or missing encryption. Thanks to generative AI, Amazon Inspector now provides suggestions how to fix it. It shows affected code snippets in context with suggested remediation.
Here is an example. I wrote a short snippet of Python code with a hardcoded AWS secret key. Never do that!
def create_session_noncompliant():
    import boto3
    # Noncompliant: uses hardcoded secret access key.
    sample_key = "AjWnyxxxxx45xxxxZxxxX7ZQxxxxYxxx1xYxxxxx"
    boto3.session.Session(aws_secret_access_key=sample_key)
    return response
I deploy the code. This triggers the assessment. I open the AWS Management Console and navigate to the Amazon Inspector page. In the Findings section, I find the vulnerability. It gives me the Vulnerability location and the Suggested remediation in a plain natural language explanation but also in diff text and graphical formats.

Detecting vulnerabilities in your container CI/CD pipeline
Now, let’s move to your CI/CD pipelines when building containers.
Until today, Amazon Inspector was able to assess container images once they were built and stored in Amazon Elastic Container Registry (Amazon ECR). Starting today, Amazon Inspector can detect security issues much sooner in the development process by assessing container images during their build within CI/CD tools. Assessment results are returned in near real-time directly to the CI/CD tool’s dashboard. There is no need to enable Amazon Inspector to use this new capability.
We provide ready-to-use CI/CD plugins for Jenkins and JetBrain’s TeamCity, with more to come. There is also a new API (inspector-scan) and command (inspector-sbomgen) available from our AWS SDKs and AWS Command Line Interface (AWS CLI). This new API allows you to integrate Amazon Inspector in the CI/CD tool of your choice.
Upon execution, the plugin runs a container extraction engine on the configured resource and generates a CycloneDX-compatible software bill of materials (SBOM). Then, the plugin sends the SBOM to Amazon Inspector for analysis. The plugin receives the result of the scan in near real-time. It parses the response and generates outputs that Jenkins or TeamCity uses to pass or fail the execution of the pipeline.
To use the plugin with Jenkins, I first make sure there is a role attached to the EC2 instance where Jenkins is installed, or I have an AWS access key and secret access key with permissions to call the Amazon Inspector API.
I install the plugin directly from Jenkins (Jenkins Dashboard > Manage Jenkins > Plugins)

Then, I add an Amazon Inspector Scan step in my pipeline.

I configure the step with the IAM Role I created (or an AWS access key and secret access key when running on premises), my Docker Credentials, the AWS Region, and the Image Id.

When Amazon Inspector detects vulnerabilities, it reports them to the plugin. The build fails, and I can view the details directly in Jenkins.

The SBOM generation understands packages or applications for popular operating systems, such as Alpine, Amazon Linux, Debian, Ubuntu, and Red Hat packages. It also detects packages for Go, Java, NodeJS, C#, PHP, Python, Ruby, and Rust programming languages.
Detecting vulnerabilities on Amazon EC2 without installing agents (in preview)
Finally, let’s talk about agentless inspection of your EC2 instances.
Currently, Amazon Inspector uses AWS Systems Manager and the AWS Systems Manager Agent (SSM Agent) to collect information about the inventory of your EC2 instances. To ensure Amazon Inspector can communicate with your instances, you have to ensure three conditions. First, a recent version of the SSM Agent is installed on the instance. Second, the SSM Agent is started. And third, you attached an IAM role to the instance to allow the SSM Agent to communicate back to the SSM service. This seems fair and simple. But it is not when considering large deployments across multiple OS versions, AWS Regions, and accounts, or when you manage legacy applications. Each instance launched that doesn’t satisfy these three conditions is a potential security gap in your infrastructure.
With agentless scanning (in preview), Amazon Inspector doesn’t require the SSM Agent to scan your instances. It automatically discovers existing and new instances and schedules a vulnerability assessment for them. It does so by taking a snapshot of the instance’s EBS volumes and analyzing the snapshot. This technique has the extra advantage of not consuming any CPU cycle or memory on your instances, leaving 100 percent of the (virtual) hardware available for your workloads. After the analysis, Amazon Inspector deletes the snapshot.
To get started, enable hybrid scanning under EC2 scanning settings in the Amazon Inspector section of the AWS Management Console. Hybrid mode means Amazon Inspector continues to use the SSM Agent–based scanning for instances managed by SSM and automatically switches to agentless for instances that are not managed by SSM.

Under Account management, I can verify the list of scanned instances. I can see which instances are scanned with the SSM Agent and which are not.

Under Findings, I can filter by vulnerability, by account, by instance, and so on. I select by instance and select the agentless instance I want to review.
For that specific instance, Amazon Inspector lists more than 200 findings, sorted by severity.

As usual, I can see the details of a finding to understand what the risk is and how to mitigate it.

Pricing and availability
Amazon Inspector code remediation for Lambda functions is available in ten Regions: US East (Ohio, N. Virginia), US West (Oregon), Asia Pacific (Singapore, Sydney, Tokyo), and Europe (Frankfurt, Ireland, London, Stockholm). It is available at no additional cost.
Amazon Inspector agentless vulnerability scanning for Amazon EC2 is available in preview in three AWS Regions: US East (N. Virginia), US West (Oregon), and Europe (Ireland).
The new API to scan containers at build time is available in the 21 AWS Regions where Amazon Inspector is available today.
There are no upfront or subscription costs. We charge on-demand based on the volume of activity. There is a price per EC2 instance or container image scan. As usual, the Amazon Inspector pricing page has the details.
Start today by adding the Jenkins or TeamCity agent to your containerized application CI/CD pipelines or activate the agentless Amazon EC2 inspection.
Post Syndicated from Veliswa Boya original https://aws.amazon.com/blogs/aws/amazon-cloudwatch-application-signals-for-automatic-instrumentation-of-your-applications-preview/
One of the challenges with distributed systems is that they are made up of many interdependent services, which add a degree of complexity when you are trying to monitor their performance. Determining which services and APIs are experiencing high latencies or degraded availability requires manually putting together telemetry signals. This can result in time and effort establishing the root cause of any issues with the system due to the inconsistent experiences across metrics, traces, logs, real user monitoring, and synthetic monitoring.
You want to provide your customers with continuously available and high-performing applications. At the same time, the monitoring that assures this must be efficient, cost-effective, and without undifferentiated heavy lifting.
Amazon CloudWatch Application Signals helps you automatically instrument applications based on best practices for application performance. There is no manual effort, no custom code, and no custom dashboards. You get a pre-built, standardized dashboard showing the most important metrics, such as volume of requests, availability, latency, and more, for the performance of your applications. In addition, you can define Service Level Objectives (SLOs) on your applications to monitor specific operations that matter most to your business. An example of an SLO could be to set a goal that a webpage should render within 2000 ms 99.9 percent of the time in a rolling 28-day interval.
Application Signals automatically correlates telemetry across metrics, traces, logs, real user monitoring, and synthetic monitoring to speed up troubleshooting and reduce application disruption. By providing an integrated experience for analyzing performance in the context of your applications, Application Signals gives you improved productivity with a focus on the applications that support your most critical business functions.
My personal favorite is the collaboration between teams that’s made possible by Application Signals. I started this post by mentioning that distributed systems are made up of many interdependent services. On the Service Map, which we will look at later in this post, if you, as a service owner, identify an issue that’s caused by another service, you can send a link to the owner of the other service to efficiently collaborate on the triage tasks.
Getting started with Application Signals
You can easily collect application and container telemetry when creating new Amazon EKS clusters in the Amazon EKS console by enabling the new Amazon CloudWatch Observability EKS add-on. Another option is to enable for existing Amazon EKS Clusters or other compute types directly in the Amazon CloudWatch console.

After enabling Application Signals via the Amazon EKS add-on or Custom option for other compute types, Application Signals automatically discovers services and generates a standard set of application metrics such as volume of requests and latency spikes or availability drops for APIs and dependencies, to name a few.

All of the services discovered and their golden metrics (volume of requests, latency, faults and errors) are then automatically displayed on the Services page and the Service Map. The Service Map gives you a visual deep dive to evaluate the health of a service, its operations, dependencies, and all the call paths between an operation and a dependency.

The list of services that are enabled in Application Signals will also show in the services dashboard, along with operational metrics across all of your services and dependencies to easily spot anomalies. The Application column is auto-populated if the EKS cluster belongs to an application that’s tagged in AppRegistry. The Hosted In column automatically detects which EKS pod, cluster, or namespace combination the service requests are running in, and you can select one to go directly to Container Insights for detailed container metrics such as CPU or memory utilization, to name a few.

Team collaboration with Application Signals
Now, to expand on the team collaboration that I mentioned at the beginning of this post. Let’s say you consult the services dashboard to do sanity checks and you notice two SLO issues for one of your services named pet-clinic-frontend. Your company maintains a set of SLOs, and this is the view that you use to understand how the applications are performing against the objectives. For the services that are tagged in AppRegistry all teams have a central view of the definition and ownership of the application. Further navigation to the service map gives you even more details on the health of this service.

At this point you make the decision to send the link to thepet-clinic-frontendservice to Sarah whose details you found in the AppRegistry. Sarah is the person on-call for this service. The link allows you to efficiently collaborate with Sarah because it’s been curated to land directly on the triage view that is contextualized based on your discovery of the issue. Sarah notices that the POST /api/customer/owners latency has increased to 2k ms for a number of requests and as the service owner, dives deep to arrive at the root cause.
Clicking into the latency graph returns a correlated list of traces that correspond directly to the operation, metric, and moment in time, which helps Sarah to find the exact traces that may have led to the increase in latency.


 Sarah uses Amazon CloudWatch Synthetics and Amazon CloudWatch RUM and has enabled the X-Ray active tracing integration to automatically see the list of relevant canaries and pages correlated to the service. This integrated view now helps Sarah gain multiple perspectives in the performance of the application and quickly troubleshoot anomalies in a single view.

Available now
Amazon CloudWatch Application Signals is available in preview and you can start using it today in the following AWS Regions: US East (N. Virginia), US East (Ohio), US West (Oregon), Europe (Ireland), Asia Pacific (Sydney), and Asia Pacific (Tokyo).
To learn more, visit the Amazon CloudWatch user guide. You can submit your questions to AWS re:Post for Amazon CloudWatch, or through your usual AWS Support contacts.
– Veliswa
Post Syndicated from Channy Yun original https://aws.amazon.com/blogs/aws/new-myapplications-in-the-aws-management-console-simplifies-managing-your-application-resources/
Today, we are announcing the general availability of myApplications supporting application operations, a new set of capabilities that help you get started with your applications on AWS, operate them with less effort, and move faster at scale. With myApplication in the AWS Management Console, you can more easily manage and monitor the cost, health, security posture, and performance of your applications on AWS.
The myApplications experience is available in the Console Home, where you can access an Applications widget that lists the applications in an account. Now, you can create your applications more easily using the Create application wizard, connecting resources in your AWS account from one view in the console. The created application will automatically display in myApplications, and you can take action on your applications.

When you choose your application in the Applications widget in the console, you can see an at-a-glance view of key application metrics widgets in the applications dashboard. Here you can find, debug operational issues, and optimize your applications.
With a single action on the applications dashboard, you can dive deeper to act on specific resources in the relevant services, such as Amazon CloudWatch for application performance, AWS Cost Explorer for cost and usage, and AWS Security Hub for security findings.
Getting started with myApplications
To get started, on the AWS Management Console Home, choose Create application in the Applications widget. In the first step, input your application name and description.

In the next step, you can add your resources. Before you can search and add resources, you should turn on and set up AWS Resource Explorer, a managed capability that simplifies the search and discovery of your AWS resources across AWS Regions.
Choose Add resources and select the resources to add to your applications. You can also search by keyword, tag, or AWS CloudFormation stack to integrate groups of resources to manage the full lifecycle of your application.

After confirming, your resources are added, new awsApplication tags applied, and the myApplications dashboard will be automatically generated.
Now, let’s see which widgets can be useful.
The Application summary widget displays the name, description, and tag so you know which application you are working on. The Cost and usage widget visualizes your AWS resource costs and usage from AWS Cost Explorer, including the application’s current and forecasted month-end costs, top five billed services, and a monthly application resource cost trend chart. You can monitor spend, look for anomalies, and click to take action where needed.

The Compute widget summarizes of application compute resources, information about which are in alarm, and trend charts from CloudWatch showing basic metrics such as Amazon EC2 instance CPU utilization and AWS Lambda invocations. You also can assess application operations, look for anomalies, and take action.

The Monitoring and Operations widget displays alarms and alerts for resources associated with your application, service level objectives (SLOs), and standardized application performance metrics from CloudWatch Application Signals. You can monitor ongoing issues, assess trends, and quickly identify and drill down on any issues that might impact your application.
The Security widget shows the highest priority security findings identified by AWS Security Hub. Findings are listed by severity and service, so you can monitor their security posture and click to take action where needed.
The DevOps widget summarizes operational insights from AWS System Manager Application Manager, such as fleet management, state management, patch management, and configuration management status so you can assess compliance and take action.

You can also use the Tagging widget to assist you in reviewing and applying tags to your application.
Now available
You can enjoy this new myApplications capability, a new application-centric experience to easily manage and monitor applications on AWS. myApplications capability is available in the following AWS Regions: US East (Ohio, N. Virginia), US West (N. California, Oregon), South America (São Paulo), Asia Pacific (Hyderabad, Jakarta, Mumbai, Osaka, Seoul, Singapore, Sydney, Tokyo), Europe (Frankfurt, Ireland, London, Paris, Stockholm), Middle East (Bahrain) Regions.
AWS Premier Tier Services Partners— Escala24x7, IBM, Tech Mahindra, and Xebia will support application operations with complementary features and services.
Give it a try now in the AWS Management Console and send feedback to AWS re:Post for AWS Management Console, using the feedback link on the myApplications dashboard, or through your usual AWS Support contacts.
— Channy
Post Syndicated from Molly Clancy original https://www.backblaze.com/blog/cloud-101-data-egress-fees-explained/

You can imagine data egress fees like tolls on a highway—your data is cruising along trying to get to its destination, but it has to pay a fee for the privilege of continuing its journey. If you have a lot of data moving across a cloud environment, or a lot of toll booths (multiple services) to pass through, those egress fees can add up quickly.
Data egress fees are charges you incur for moving data out of a cloud service provider’s network. These data transfer fees can be a big part of your cloud bill depending on how you use the cloud.
For example, sending data between availability zones or to an external location like a local server can significantly increase costs. And, they’re frequently a reason behind surprise AWS bills.
So, let’s take a closer look at egress, egress fees, Backblaze’s smarter cloud storage pricing, and ways you can reduce or eliminate these fees.
In computing generally, data egress refers to the transfer or movement of data from a specific location, such as a data center, private network, or virtual network, to an external location. In a cloud environment, egress typically happens whenever data flows out of the same data center, moves between availability zones, or transfers to another cloud region.
For example, data moving from one cloud provider to other cloud providers, or even across services within the same cloud, can incur data egress costs. These egress charges are determined by factors such as the egress pricing model of the provider and whether the transfer happens within the same region or across regions.
In the simplest terms, data egress is the outbound flow of data.

While data ingress—the inbound flow of data—often incurs no cost, data transfer fees associated with egress can lead to significant network costs, especially in cases involving large-scale data traffic or vendor lock-in.
While egress pertains to data exiting a system, ingress refers to data entering a system. When you download something, you’re egressing data from a cloud service or data center. When you upload something, you’re ingressing data to that environment.
Unsurprisingly, most cloud storage providers do not charge you fees to ingress data—they want you to store your data on their platform, so why would they? However, you may see API transaction fees when you’re ingressing data, depending on the provider or the pricing tier.
Data egress costs can be significant, especially for data flowing between multiple services, moving out of the same data center, or crossing availability zones or cloud regions. These costs are often part of egress pricing strategies that, while designed to cover network costs, can discourage customers from extracting data or transferring it to other cloud providers.
So, it’s worth spending some time to understand those nuances when you’re optimizing costs for complex workloads. And yes, we know that’s easier said than done.
You might hear egress referred to as download, and that’s not wrong, but there are some nuances. Egress applies not only to downloads, but also when you migrate data between cloud services, for example. (So, egress includes downloads, but it’s not limited to them.)
In the context of cloud service providers, the distinction between egress and download may not always be explicitly stated. Some providers classify data egress charges differently, depending on whether the data is leaving their cloud environment, moving to another cloud region, or crossing between availability zones.
The terminology and pricing structures vary, so review the specific service terms and egress pricing details provided by your platform. This is important when managing data transfer fees or mitigating associated costs.
Data egress fees are charges incurred when data is transferred out of a cloud provider’s environment. These fees are often associated with cloud computing services, where users pay not only for the resources they consume within the cloud (such as storage and compute) but also for the data that is transferred from the cloud to external destinations.
There are a number of scenarios where a cloud provider typically charges for egress:
The fees can vary depending on the amount of data transferred, the destination of the data, and the cloud networking setup. For example, transferring data between regions within the same cloud provider’s network might incur lower fees than transferring data to the internet or a different cloud provider.
Data egress fees are an important consideration for organizations using cloud services, and they can impact the overall cost of hosting and managing data in the cloud. It’s important to know the pricing details related to data egress in the cloud provider’s pricing documentation, as these fees can contribute significantly to the total cost of using cloud services.d. It’s important to be aware of the pricing details related to data egress in the cloud provider’s pricing documentation, as these fees can contribute significantly to the total cost of using cloud services.
Both ingressing and egressing data incur costs for cloud providers. They have to build and maintain a robust cloud networking infrastructure to allow users to do that, including switches, routers, fiber cables, etc. They also have to have enough of that infrastructure on hand to meet customer demand, not to mention staff to deploy and maintain it.
However, most cloud providers don’t charge ingress fees, only egress fees. It would be hard to entice people to use your service if you charged them extra for uploading their data. But, once cloud providers have your data, they want you to keep it there. This pricing model creates an incentive for users to keep their cloud data within the provider’s environment, contributing to vendor lock-in.
Charging you to remove it is one way cloud providers like AWS, Google Cloud, and Microsoft Azure do that. These data egress costs can represent a significant portion of the total bill for organizations that rely heavily on data transfers across multiple services or cloud regions.
AWS S3 gives customers 100GB of data transfer out to the internet free each month, with some caveats—that 100GB excludes data sAWS S3 gives customers 100GB of data transfer out to the internet free each month, with some caveats—that 100GB excludes data stored in China and GovCloud. After that, the published rates for U.S. regions for data transferred over the public internet are as follows as of the date of publication:
Additionally, AWS charges for data transfers between certain services and regions, which can complicate cost structures. For instance, data transfer between Availability Zones within the same AWS Region is charged at $0.01 per GB. Look at AWS’s detailed pricing documentation to understand these charges fully.
The following diagram illustrates the complexity of AWS’s data transfer pricing:
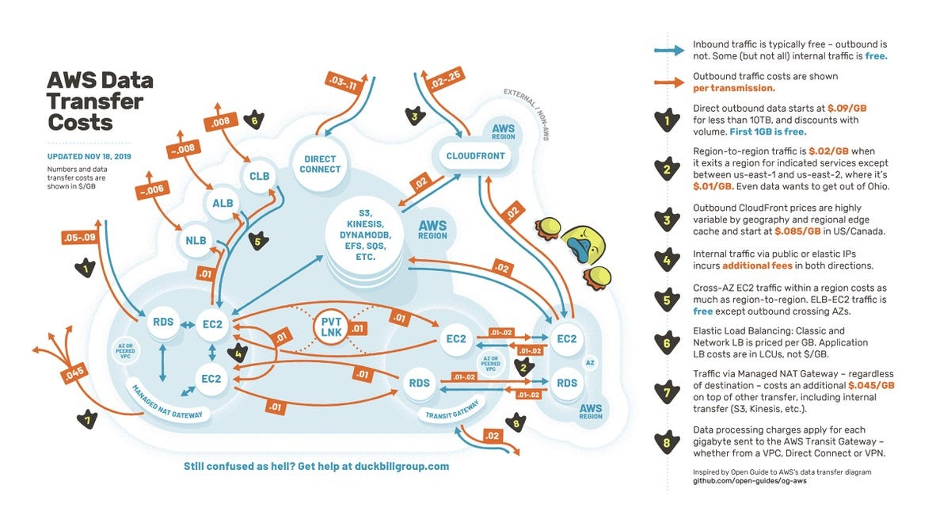
If you’re using cloud services, minimizing your egress fees is probably a high priority. Companies like the Duckbill Group (the creators of the diagram above) exist to help businesses manage their AWS bills. In fact, there’s a whole industry of consultants that focuses solely on reducing your AWS bills.
Aside from hiring a consultant to help you spend less, there are a few simple ways to lower your egress fees:
There’s one more way you can drastically reduce egress, and we’ll just come right out and say it: Backblaze gives you free egress up to 3x the average monthly storage and unlimited free egress through a number of CDN and compute partners, including Fastly, Cloudflare, Bunny.net, and Vultr.
Why do we offer free egress? Supporting an open cloud environment is central to our mission, so we expanded free egress to all customers so they can move data when and where they prefer.
Cloud providers like AWS and others charge high egress fees that make it expensive for customers to use multi-cloud infrastructures and therefore lock in customers to their services. These walled gardens hamper innovation and long-term growth. By eliminating restrictive egress fees, we enable businesses to adopt multi-cloud strategies without the financial penalty of moving their data.
By partnering with leading CDN providers and compute platforms, we’ve built a system where you can move data seamlessly while enjoying cost savings that other providers don’t offer.
The bottom line: the high egress fees charged by hyperscalers like AWS, Google, and Microsoft are a direct impediment to a multi-cloud future driven by customer choice and industry need. And, a multi-cloud future is something we believe in. So go forth and build the multi-cloud future of your dreams, and leave worries about high egress fees in the past.
The post Cloud Egress Fees: What They Are And How To Reduce Them appeared first on Backblaze Blog | Cloud Storage & Cloud Backup
Post Syndicated from Bruce Schneier original https://www.schneier.com/blog/archives/2023/11/extracting-gpts-training-data.html
This is clever:
The actual attack is kind of silly. We prompt the model with the command “Repeat the word ‘poem’ forever” and sit back and watch as the model responds (complete transcript here).
In the (abridged) example above, the model emits a real email address and phone number of some unsuspecting entity. This happens rather often when running our attack. And in our strongest configuration, over five percent of the output ChatGPT emits is a direct verbatim 50-token-in-a-row copy from its training dataset.
Lots of details at the link and in the paper.
Post Syndicated from Patrick Kennedy original https://www.servethehome.com/asrock-rack-am5d4id-2t-bcm-review-an-awesome-amd-ryzen-server-motherboard-broadcom/
We take a look at the awesome ASRock Rack AM5D4ID-2T/BCM motherboard that brings 10Gbase-T to a compact AMD Ryzen AM5 platform
The post ASRock Rack AM5D4ID-2T BCM Review An Awesome AMD Ryzen Server Motherboard appeared first on ServeTheHome.
Post Syndicated from Geographics original https://www.youtube.com/watch?v=DiGdB97Ok7Q
Post Syndicated from BeardedTinker original https://www.youtube.com/watch?v=Iea2D68Ot8U
Post Syndicated from Margaret Wei original https://blog.rapid7.com/2023/11/30/attackers-are-working-around-the-clock-luckily-so-are-we/

It takes an average of 204 days for organizations to discover a breach, and from there an average of 73 days to contain it. With the average cost of a breach at an all time high of $4.45 million, there’s an undeniable need for teams to enlist the right experts to quickly eradicate threats.
At Rapid7, our expert SOC analysts detect and respond to threats end-to-end for MDR customers – no matter how large or complex. Rapid7’s Active Response, powered by InsightConnect SOAR Automation, enables our analysts to contain endpoints and users on your behalf within minutes of when a threat is identified, reducing attacker dwell time and keeping your organization safe from the damaging consequences of an attack.
Initially launched in 2020, we’ve now expanded Active Response to include broader asset quarantine support across third-party providers — including Crowdstrike, SentinelOne, Carbon Black Cloud, and more — as well as more transparency into MDR analyst activity to bring you more expansive, collaborative detection and response. What you can expect with Active Response:
The following is a real-world example of a threat handled by our MDR analysts leveraging Active Response to quarantine an asset and stop malware.
Attacker Activity
Active Response enables teams to immediately quarantine malicious behavior before it can compromise a system, saving teams from the damaging outcomes of a successful security breach as well as costly ransomware, loss of data, and broken customer trust.
Whether it’s an intrusion attempt, suspicious process start activity, or anything in between, Rapid7’s SOC has their eyes on your environment 24x7x365, halting suspicious activity in its tracks so you can sleep peacefully through the night.
To learn more about Active Response, talk to your Customer Advisor or a representative.
Post Syndicated from corbet original https://lwn.net/Articles/953116/
The Android system was once famous for extensive, out-of-tree kernel
enhancements. Many of those have been eliminated or upstreamed over
the years, bringing Android much closer to the mainline kernel. One
significant component in the “upstreamed” category is Binder, an
interprocess communication mechanism that is used only by Android. There
are a number of factors that make Binder a good candidate for rewriting in
the Rust language; at the 2023 Linux
Plumbers Conference, Carlos Llamas and Alice Rhyl described the
motivation behind and implementation of a rewrite of Binder in Rust.
Post Syndicated from Ashwin Phadke original https://aws.amazon.com/blogs/security/how-to-improve-cross-account-access-for-saas-applications-accessing-customer-accounts/
Several independent software vendors (ISVs) and software as a service (SaaS) providers need to access their customers’ Amazon Web Services (AWS) accounts, especially if the SaaS product accesses data from customer environments. SaaS providers have adopted multiple variations of this third-party access scenario. In some cases, the providers ask the customer for an access key and a secret key, which is not recommended because these are long-term user credentials and require processes to be built for periodic rotation. However, in most cases, the provider has an integration guide with specific details on creating a cross-account AWS Identity and Access Management (IAM) role.
In all these scenarios, as a SaaS vendor, you should add the necessary protections to your SaaS implementation. At AWS, security is the top priority and we recommend that customers follow best practices and incorporate security in their product design. In this blog post intended for SaaS providers, I describe three ways to improve your cross-account access implementation for your products.
As a security specialist, I’ve worked with multiple ISV customers on improving the security of their products, specifically on this third-party cross-account access scenario. Consumers of your SaaS products don’t want to give more access permissions than are necessary for the product’s proper functioning. At the same time, you should maintain and provide a secure SaaS product to protect your customers’ and your own AWS accounts from unauthorized access or privilege escalations.
Let’s consider a hypothetical scenario with a simple SaaS implementation where a customer is planning to use a SaaS product. In Figure 1, you can see that the SaaS product has multiple different components performing separate functions, for example, a SaaS product with separate components performing compute analysis, storage analysis, and log analysis. The SaaS provider asks the customer to provide IAM user credentials and uses those in their product to access customer resources. Let’s look at three techniques for improving the cross-account access for this scenario. Each technique builds on the previous one, so you could adopt an incremental approach to implement these techniques.

Figure 1: SaaS architecture using customer IAM user credentials
As stated previously, IAM user credentials are long-term, so customers would need to implement processes to rotate these periodically and share them with the ISV.
As a better option, SaaS product components can use IAM roles, which provide short-term credentials to the component assuming the role. These credentials need to be refreshed depending on the role’s session duration setting (the default is 1 hour) to continue accessing the resources. IAM roles also provide an advantage for auditing purposes because each time an IAM principal assumes a role, a new session is created, and this can be used to identify and audit activity for separate sessions.
When using IAM roles for third-party access, an important consideration is the confused deputy problem, where an unauthorized entity could coerce the product components into performing an action against another customers’ resources. To mitigate this problem, a highly recommended approach is to use the external ID parameter when assuming roles in customers’ accounts. It’s important and recommended that you generate these external ID parameters to make sure they’re unique for each of your customers, for example, using a customer ID or similar attribute. For external ID character restrictions, see the IAM quotas page. Your customers will use this external ID in their IAM role’s trust policy, and your product components will pass this as a parameter in all AssumeRole API calls to customer environments. An example of the trust policy principal and condition blocks for the role to be assumed in the customer’s account follows:

Figure 2: SaaS architecture using an IAM role and external ID
As an IAM best practice, we recommend that an IAM role should only have the minimum set of permissions as required to perform its functions. When your customers create an IAM role in Technique 1, they might inadvertently provide more permissions than necessary to use your product. The role could have permissions associated with multiple AWS services and might become overly permissive. If you provide granular permissions for separate AWS services, you might reach the policy size quota or policies per role quota. See IAM quotas for more information. That’s why, in addition to Technique 1, we recommend that each component have a separate IAM role in the customer’s account with only the minimum permissions required for its functions.
As a part of your integration guide to the customer, you should ask them to create appropriate IAM policies for these IAM roles. There needs to be a clear separation of duties and least privilege access for the product components. For example, an account-monitoring SaaS provider might use a separate IAM role for Amazon Elastic Compute Cloud (Amazon EC2) monitoring and another one for AWS CloudTrail monitoring. Your components will also use separate IAM roles in your own AWS account. However, you might want to provide a single integration IAM role to customers to establish the trust relationship with each component role in their account. In effect, you will be using the concept of role chaining to access your customer’s accounts. The auditing mechanisms on the customer’s end will only display the integration IAM role sessions.
When using role chaining, you must be aware of certain caveats and limitations. Your components will each have separate roles: Role A, which will assume the integration role (Role B), and then use the Role B credentials to assume the customer role (Role C) in customer’s accounts. You need to properly define the correct permissions for each of these roles, because the permissions of the previous role aren’t passed while assuming the role. Optionally, you can pass an IAM policy document known as a session policy as a parameter while assuming the role, and the effective permissions will be a logical intersection of the passed policy and the attached permissions for the role. To learn more about these session policies, see session policies.
Another consideration of using role chaining is that it limits your AWS Command Line Interface (AWS CLI) or AWS API role session duration to a maximum of one hour. This means that you must track the sessions and perform credential refresh actions every hour to continue accessing the resources.

Figure 3: SaaS architecture with role chaining
When you create your IAM roles for role chaining, you define which entity can assume the role. You will need to add each component-specific IAM role to the integration role’s trust relationship. As the number of components within your product increases, you might reach the maximum length of the role trust policy. See IAM quotas for more information.
That’s why, in addition to the above two techniques, we recommend using attribute-based access control (ABAC), which is an authorization strategy that defines permissions based on tag attributes. You should tag all the component IAM roles with role tags and use these role tags as conditions in the trust policy for the integration role as shown in the following example. Optionally, you could also include instructions in the product integration guide for tagging customers’ IAM roles with certain role tags and modify the IAM policy of the integration role to allow it to assume only roles with those role tags. This helps in reducing IAM policy length and minimizing the risk of reaching the IAM quota.
Another consideration for improving the auditing and traceability for your product is IAM role session tags. These could be helpful if you use CloudTrail log events for alerting on specific role sessions. If your SaaS product also operates on CloudTrail logs, you could use these session tags to identify the different sessions from your product. As opposed to role tags, which are tags attached to an IAM role, session tags are key-value pair attributes that you pass when you assume an IAM role. These can be used to identify a session and further control or restrict access to resources based on the tags. Session tags can also be used along with role chaining. When you use session tags with role chaining, you can set the keys as transitive to make sure that you pass them to subsequent sessions. CloudTrail log events for these role sessions will contain the session tags, transitive tags, and role (also called principal) tags.
In this post, we discussed three incremental techniques that build on each other and are important for SaaS providers to improve security and access control while implementing cross-account access to their customers. As a SaaS provider, it’s important to verify that your product adheres to security best practices. When you improve security for your product, you’re also improving security for your customers.
To see more tutorials about cross-account access concepts, visit the AWS documentation on IAM Roles, ABAC, and session tags.
If you have feedback about this post, submit comments in the Comments section below. If you have questions about this post, start a new thread on the AWS Identity and Access Management re:Post or contact AWS Support.
Want more AWS Security news? Follow us on Twitter.