What a week! As Hacker Summer camp shifts into the rearview, it’s time to take a moment to reflect on the week, what we learned and the people we had the pleasure of meeting while out in Las Vegas. As is always the case at Black Hat 2024, the cybersecurity community was buzzing with the latest innovations and insights from their favorite vendors, industry speakers and training sessions. There was no shortage of information covered throughout the week, and with the sheer volume of it, it can be hard to catch everything going on. In this post I am going to do my part by attempting to summarize some of the key themes and takeaways from the event. So, with that, let’s get right to it.
Key highlights and trends from black hat 2024
The rise of advanced threats: AI and machine learning at the forefront. One of the most striking themes at Black Hat 2024 was the sophistication of modern cyber threats. This year, sessions highlighted how attackers are leveraging artificial intelligence (AI) and machine learning (ML) to lower the barrier to entry, increase the scale and impact of attacks and circumvent traditional controls. From deepfake technology used in phishing schemes to AI-driven automated attacks, the industry is witnessing a new era of cyber threats that require equally advanced defensive strategies and continuous learning to ensure security teams keep pace with emerging trends and threat vectors.
Zero trust and identity: the gradual shift towards never trust, always verify. Zero Trust was a major focal point at this year’s event. Experts and vendors alike emphasized the importance of adopting a Zero Trust approach to cybersecurity. This model, which operates on the principle of “never trust, always verify,” aims to minimize trust within and outside the network. The shift towards Zero Trust reflects the growing need for more robust security frameworks that can handle today’s complex threat environment.
Software supply chain security: extending your defense beyond the perimete. Software supply chain attacks were a hot topic, underscoring the need for organizations to extend their security measures beyond their immediate environment. Black Hat 2024 reinforced the importance of securing not just your own systems but also those of your vendors, partners and the software dependencies that modern applications consist of. Discussions centered on strategies for improving supply chain resilience, shifting security visibility and gates earlier on in the development lifecycle and the role of continuous monitoring in mitigating these risks over time.
Emerging technologies: navigating the new cybersecurity landscape. Black Hat 2024 showcased numerous emerging technologies and their implications for cybersecurity. Sessions explored the security challenges associated with Generative AI, blockchain, the Internet of Things (IoT) and Quantum Computing. As these technologies evolve, they bring both new opportunities and new risks, making it crucial for security professionals to stay informed and prepared.
Training and awareness: building a culture of security. Many sessions emphasized the critical role of security training and awareness programs. With human error often cited as a leading cause of security incidents, organizations are increasingly focusing on educating their employees and fostering a culture of security awareness. Training programs that address current threats and promote best practices are becoming integral to comprehensive security strategies.
Keynote sessions did not disappoint
The keynote sessions at Black Hat are always one of my personal favorite parts, and this year was no exception. While there were a number of sessions I found insightful and well worth the watch, one in particular that stood out was Thursday’s Fireside chat with Moxie Marlinspike, the Founder of Signal, and Jeff Moss, the Founder of Black Hat and member of the U.S. Department of Homeland Security Advisory Council. During the session they covered a range of topics, but chief among them was the future of privacy and the balance between privacy and security.
Product launches: Surface Command and Exposure Command unveiled
Beyond rich discussions and cutting-edge presentations, we made some significant waves with the launch of Surface Command and Exposure Command, two exciting new product offerings designed to unify your attack surface and deliver effective hybrid risk management. We covered these new products a little more in-depth here, but to recap:
Surface Command: unifying your attack surface
Surface Command offers a unified view of both internal and external attack surfaces, breaking down data silos and providing a comprehensive picture of your environment. This tool helps organizations identify and address vulnerabilities more effectively.
Exposure Command: prioritizing critical threats with precision
Exposure Command extends these capabilities by enriching asset data with high-fidelity risk context, enabling teams to prioritize and address the most critical threats with greater precision.
These launches are a testament to Rapid7’s commitment to advancing cybersecurity and providing our customers with the tools they need to stay ahead of potential threats, and represent the next chapter in our mission to enable security teams to take command of their attack surface.
What’s Next for Rapid7?
Black Hat 2024 was a microcosm of the dynamic and rapidly evolving nature of the cybersecurity landscape. The insights gained and the innovations showcased will undoubtedly influence the industry’s approach to security in the coming years. As we move forward, the lessons from Black Hat and the invaluable direct feedback will inform our strategy and drive the development of new capabilities to meet the ever-changing demands of our customers and the industry at large.
As we wrap up our experiences from Black Hat 2024, it’s clear that the cybersecurity landscape is evolving rapidly, with new threats and technologies shaping the way we approach security. The insights gained from the event, along with the direct feedback from industry peers, will be instrumental in guiding our strategy at Rapid7. We’re excited to continue innovating and leading the charge in helping organizations take command of their attack surfaces. Stay tuned as we build on these insights to deliver even more powerful solutions in the coming months.
The Paris 2024 Summer Olympics wrapped up on August 11, 2024, with the Olympic flag being lowered in the Stade de France after 16 days of competitions. With 329 events across 32 sports, over 10,000 athletes from 204 nations participated in the pursuit of medals and glory, creating some viral online moments along the way. In this post, we turn our attention to the closing ceremony, the impact of various Olympic moments on Internet traffic, and the cyber attacks faced by sponsors. We also examine email trends related to the Olympics, including mentions of Simone Biles, Snoop Dogg, and Imane Khelif.
Cloudflare has a global presence with data centers in over 330 cities, supporting millions of customers with different tools and products, which provides a global view of what’s happening on the Internet. This is helpful for improving security, privacy, efficiency, and speed, but also for observing Internet disruptions and traffic trends.
In our previous blog post about the opening ceremony and the early days of the event, we showed how France was impacted by the Olympics, with clear drops in traffic during the main events. The opening ceremony caused the most significant drop—traffic decreased by as much as 20% compared to the previous week. Other countries were also less online during that time, spending more time on broadcast TV.
Closing ceremony impact in France
The moment that the Golden Voyager (a golden dancing character) descended from the sky during the closing ceremony. Captured in a photo taken by Cloudflare CEO Matthew Prince, who was in attendance.
More than two weeks after the Summer Olympics began, the 3-hour closing ceremony on August 11, 2024, had a similar impact as the opening ceremony did on Internet traffic in France, although less pronounced. Internet traffic dropped by as much as 14% compared to the previous week at the start of the ceremony, around 19:15 UTC. Here is a breakdown of the top three traffic drops compared to the previous week during the ceremony, detailing the events occurring at those times. Our data provides insights with 15-minute granularity.
Moments of the closing ceremony by traffic drop in France
Time of drop (UTC)
Drop %
Events at the time
#1
~19:15
-14%
Léon Marchand, France’s swimming star, carried a lantern from the Cauldron at the Jardins des Tuileries to the Stade de France. Flags of all National Olympic Committees entered the stadium, followed by the athletes.
#2
~20:15
-13%
A Golden Voyager, inspired by French history, descended from the sky, followed by Nike, the Goddess of Victory. In the stands, LED bracelets—similar to those used at Taylor Swift concerts—created images of athletes, doves of peace, and the Olympic Rings.
#3
~21:30
-10%
Californian artist H.E.R. performed the U.S. national anthem and introduced Tom Cruise, who performed Mission Impossible stunts to transport the Olympic flag from Paris to Los Angeles.
During the closing ceremony, from 19:00 to 22:00 UTC, traffic in France was significantly lower than the previous week, down between 3% – 14%. The decreases were less pronounced during the middle and end of the event. Internet requests increased during band performances and the official closing speeches. Traffic also rose during Yseult’s finale, singing a rendition of Frank Sinatra’s “My Way,” contrasting with the significant drop during Celine Dion’s performance at the end of the opening ceremony.
In exploring traffic trends for other countries, we found that the closing ceremony didn’t have as clear an impact as the opening event did.
Taking a broader look at traffic in France during the entire Olympic period, daily traffic dropped by as much as 8% on July 28 but remained fairly stable afterward, with a 3% drop on August 8.
Mobile device use rose in France
Mobile device traffic share continued to grow during the event, with more people using mobile devices to access the Internet. This trend of more mobile use in France aligns not only with more tourists and visitors in the country during the Olympics – visitors more typically use mobile devices to access the Internet – but also with French people taking vacations and working less during this time. Weekly mobile device traffic share in France in mid-June was 49%, and since the Olympics started, it has increased to between 53% and 54%.
In France, mobile device use is higher on weekends. However, looking at daily trends, mobile traffic share on weekdays was clearly higher after July 26, when the Olympics began.
Parisians left, Olympic tourists arrived
We’ve seen before that Parisians appeared to left town (and the region) just before the Olympics. In the Paris region of Île-de-France, with the Olympics, traffic during the first week of the event dropped as much as 6% on July 30, compared to the previous week. Traffic picked up a bit on the second weekend of the Olympics but dropped even more during the second and final week.
The chart below illustrates daily traffic to the Île-de-France region, with a noticeable decline visible during the weekend before the Olympics that was more pronounced during the event.
Weekly traffic dropped 8% the week the Olympics started and remained stable the following week. Even so, by August 4, the last week of the Olympics, traffic was 23% lower in the Île-de-France region than in the week of June 30, when it was at its highest in recent weeks.
Significant moments: from Simone Biles to breakdancing debut
Below, we highlight specific Olympic events affecting Internet traffic that we were able to observe in our data from different locations (ordered by the numbers of medals in the event), starting from the first full competition day on Saturday, July 27, 2024.
Host nation France was clearly the one with more significant impacts to Internet traffic during relevant moments of the Olympics.
United States: The artistic gymnastics competition featuring four-time Olympic gold medalist Simone Biles had a greater impact on U.S. Internet traffic than the opening ceremony. On July 26-28, traffic dipped most significantly during Biles’ events. On the 28th, at 10:00 UTC, during her beam routine, traffic was already 4% lower than the previous week. It dropped by 6% at 10:45 UTC during her floor and vault routines.
On July 29, at 19:30 UTC, traffic dropped 4% during the swimming event where Ryan Murphy won the bronze medal in the men’s 100 m backstroke final.
Another notable drop occurred on August 10, with a 7% decrease around 15:00 UTC during the women’s football gold medal match between Brazil and the USA. Later that day, during the men’s basketball gold medal game between France and the USA, traffic dropped by as much as 6%.
Great Britain: The first weekend of the Olympics saw clear drops in traffic, with a 10% decrease compared to the previous week around 15:00 UTC on July 28, 2024. British athletes participated in several events during those busy days. Traffic the following weekend was slightly higher than in the first Olympic weekend but dropped again on the final day, August 11.
France: As previously noted, French swimmer Léon Marchand’s gold medal and Olympic record in the men’s 400-meter individual medley on July 28 had the most significant impact on French traffic during the Olympics, aside from the 20% drop seen during the opening ceremony. Traffic fell by 17% at 18:30 UTC during his event—the same level of drop seen during the closing ceremony. Similar impacts occurred during other swimming events:
July 29, 19:45 UTC, 14% drop during the Women’s 100 m Backstroke Semifinals featuring Yohann Ndoye-Brouard.
July 30, 19:00 UTC, 12% drop during the Men’s 200 m Butterfly Semifinals with Léon Marchand.
July 31, 18:30-20:30 UTC, 7% to 10% drop during the Men’s 200 m Butterfly final with Léon Marchand.
August 1, 18:45 UTC, 8% drop during swimming semifinals and finals.
Other notable drops include breakdancing:
August 9, 14:30 UTC, 10% drop during the Breaking dance debut with France’s participation.
August 10, 18:45-21:00 UTC, 7% drop during the Breaking B-Boys gold medal battle and the men’s basketball gold medal game, France vs USA.
August 11, 07:00 UTC, 8% drop during the women’s marathon.
Australia: During Mollie O’Callaghan’s victory in the women’s 200 m freestyle on July 29, at around 20:00 UTC, Australian traffic was 5% lower than the previous week, a larger drop than during the opening ceremony, which saw a 2% decrease.
On August 1, at around 18:45 UTC, traffic was 10% lower than the previous week during swimming events that led to Australia’s gold in the women’s 4x200m freestyle relay. And on August 11, at around 07:00 UTC, traffic dropped 7% compared to the previous week during the women’s marathon with Australian participants.
Japan: One of the most significant drops in traffic in Japan during the Olympics occurred on August 6, around the time Fumita Kenichiro from Japan won gold in the men’s Greco-Roman wrestling 60 kg final, followed by artistic swimming and the women’s table tennis competition, with traffic dropping 12% at 18:15 UTC.
On August 10, for several hours after 17:30 UTC, traffic in Japan was also lower than usual, with a drop of as much as 14%. This coincided with Japan’s gold medal win in the women’s javelin throw and the men’s breaking quarterfinals and semifinals.
Italy: During the event that gave Italy its first ever gold medal in artistic gymnastics, won by Alice D’Amato in the women’s balance beam event, traffic dropped 5% at around 10:45 UTC.
Netherlands: On the morning of July 28, the second full day of the Olympics, traffic in the Netherlands dropped by as much as 20% compared to the previous week, with Dutch athletes participating in several competitions.
On August 11, traffic dropped between 06:30 and 09:30 UTC, and by as much as 16% at 08:15 UTC, when Dutch runner Sifan Hassan won the gold medal in the women’s marathon.
South Korea: The Korean women’s archery team’s gold medal win on July 28 at 15:30 UTC led to an 8% drop in traffic, the most significant decrease noted in the country between July 26 and July 29.
On August 7, at 19:45 UTC, traffic was 9% lower during the Taekwondo gold medal event for Park Taejoon in the men’s -58 kg (under 58 kg) competition.
Brazil: Traffic in Brazil was 15% lower than the previous week on July 27 at around 19:30 UTC, surpassing the impact of the opening ceremony. This occurred as Brazilian swimmers Guilherme Costa and Maria Fernanda Costa competed in the men’s and women’s 400 m freestyle events.
On August 2, traffic in Brazil was 5% lower at around 00:30 UTC during the men’s surfing quarterfinals with Gabriel Medina and was 8% lower at around 01:00 UTC during the women’s surfing quarterfinals with Tatiana Weston-Webb.
Cape Verde: David Pina won the first Olympic medal in boxing for this archipelago nation off the western coast of Africa. On August 4, the amateur boxer took the bronze medal, with traffic dropping 12% in the country at around 15:00 UTC during the match.
DNS trends for official Olympic websites by country
On July 22, before the Olympics began, we reported on the heightened interest in official Olympic websites based on request data from our 1.1.1.1 DNS resolver. France initially dominated with 24% of DNS traffic, followed by the UK (20%) and the US (17%). However, when the Olympics started, the US took the lead, maintaining it throughout the event.
The following chart summarizes the highest shares of DNS request traffic by country during the Paris 2024 Summer Olympics. There was a shift in percentages that indicates a broader spread of interest across countries as the Olympics progressed, visible in the dynamic version of the map by day of the event that is available in our Paris 2024 Olympics report.
Here are the top 10 countries that during the event had more DNS traffic for Olympics official websites. The US took the “gold,” France the “silver,” and the UK the “bronze”:
United States: 18%
France: 16%
United Kingdom: 10%
Germany: 7%
Brazil: 6%
Australia: 5%
Canada: 2%
Japan: 2%
India: 2%
Russian Federation: 2%
We observed that the US overtook France for the #1 spot a few days before the event began. France also dropped to third place behind Germany on July 27, the first full day of competitions, and again after August 2, though interestingly, it returned to #2 the day after the Olympics ended.
As shown in the following daily ranking chart, the UK was #3 before the event began but dropped to #4 on August 1. Australia’s highest ranking was #3 on July 29, and #4 on August 10 and 11. Brazil’s best days, ranking #3, were on July 24-25, and on July 30, 31, and August 1.
In terms of volume of DNS traffic to our 1.1.1.1 resolver, the first full week of Olympic events saw the highest volume of requests related to official Olympic websites, with a 637% increase compared to the week before the Olympics began. This trend of peak traffic during the first week was consistent across most countries, except for Germany, Spain, India, Italy, and Russia, where the final week generated more DNS resolver traffic.
On a daily basis, worldwide DNS traffic to official Olympics domains peaked on August 2, followed by August 4 and August 5, marking the start of the second and final week of the event. Below are the top 3 days with the highest DNS traffic to official Olympic websites in the top 3 countries by traffic volume:
United States: July 30 (when the US women’s team won gold in artistic gymnastics and several medals were won in swimming), July 29, and August 5.
France: July 31 (when swimmer Léon Marchand won gold in the men’s 200 m butterfly final), July 29, and August 1.
Germany: July 27 (when swimmer Lukas Maertens won gold in the men’s 400 m freestyle final), August 8, and August 7.
Sports news sites
Looking at DNS traffic for sports news sites across different countries, the two weeks of the Olympics brought more traffic than any other week since June, including during the major football event, UEFA Euro 2024, held between June 14 and July 14. The Olympic weeks saw 17% more traffic than the week before the Olympics and 4% more DNS traffic than the best week of Euro 2024 (June 22-29).
From a daily perspective, the days with the highest traffic to sports news sites were August 10, August 3, July 28, and July 14 (related to the Euro 2024 final).
In the United States, NBC was not only the official broadcaster of the Olympics, but also created a dedicated website. NBC’s sports and NBC Olympics websites saw a significant rise in global DNS traffic, increasing up to 1,640% on July 28 compared to the previous week.
From official streaming services to Olympic sponsors
While the Olympics were still broadcast on several traditional national TV networks, streaming also played a key role, with Peacock TV (in the US and Canada) and Max (from Warner Bros. Discovery) in Europe offering several hours of Olympic content daily. The global traffic growth to these platforms was evident. On a weekly basis, DNS request traffic for streaming platforms featuring Olympic events grew by as much as 65%. Daily traffic peaked on July 30 (68% higher than the previous week), followed by July 29 and August 4. Peacock TV led over Max in terms of traffic.
Breakdancing, or “breaking,” made its first appearance in the 2024 Summer Olympics, leading to a surge in DNS traffic to breaking-related websites, particularly on August 9 and 10. Traffic peaked on August 9, with a 215% increase compared to the previous week, driven by viral moments like Australian Rachael Gunn’s performance.
How about the Paris Olympics sponsors? DNS traffic also increased, particularly in the early days of the event and the days leading up to it, with peak traffic on July 29 (15% higher than the previous week), followed by July 25 and 24 (the two days before the opening ceremony). Samsung saw the most significant impact during the early days of the Olympics, while Airbnb experienced a surge in traffic just before the opening ceremony (July 25).
Next stop: LA 2028
The closing ceremony concluded with a symbolic passing of the torch from Paris 2024 to Los Angeles 2028. Simone Biles handed the Olympic flag to Tom Cruise, who transported it Mission Impossible-style from Paris to a Venice Beach concert in LA featuring acts including the Red Hot Chili Peppers and Billie Eilish. Unsurprisingly, the official LA 2028 Olympics website saw a 1600% surge in DNS traffic on August 11 compared to the previous week.
DDoS attacks targeting Olympic-related and sponsor websites
As we observed during the 2024 elections, including the French elections, political parties are not the only targets of DDoS (Distributed Denial of Service) attacks during significant events. Attackers are aware of large global events. In a previous related blog post, we discussed attacks targeting French transportation and government websites. Below, let’s focus on Olympic-related and sponsor organizations.
In July, Cloudflare blocked a surge in DDoS attacks on Olympic partner websites – higher than in any other month of 2024. Daily DDoS attack requests jumped to 200 million, and in just 11 days of August, more DDoS requests (90 million) were blocked than in any full month in 2024 before the Olympics.
The largest spike in attacks occurred on July 29, targeting three sponsor websites simultaneously, with 84 million DDoS-related requests in a single day. The most intense DDoS attack peaked at 190,000 requests per second at 10:20 UTC.
The most significant specific attack was on the last day of the event, August 11, targeting a French transportation site. It lasted four minutes and peaked at over 500,000 requests per second at 05:09 UTC.
As highlighted in our Q2 DDoS report, most DDoS attacks are short-lived, as seen in the two mentioned attacks. While a 500,000 request per second (rps) attack is not large for Cloudflare, it can be devastating for websites not equipped to handle such traffic levels.
Analyzing the same pool of Olympic partner websites that use Cloudflare, total requests (including legitimate traffic and attacks) rose in July, reaching 4.2 billion—27% more than in May and 11% more than in June.
Rise in “Olympics” and “Paris 2024” emails
Major events often attract attention in the email realm, including spam and malicious emails, and the Olympics were no exception. From January 2024 through August 11, Cloudflare’s Cloud Email Security service processed over 1.7 million emails containing “Olympics” or “Paris 2024” in the subject. More than half of these emails (890,000) were sent during the Olympics (July 26 to August 11), with the highest volume (150,000 messages) on July 26, the day of the opening ceremony.
The week of July 22-28, coinciding with the first few days of the Olympics, saw a 304% increase in such emails compared to the previous week, and an astonishing 3111% increase compared to the busiest week in January.
Although the Olympics period (July 26 – August 11) was busy in terms of related emails, the percentages of spam and malicious messages were lower than before. However, over 6,200 emails were classified as spam (0.7%), and just 248 were identified as malicious or phishing (0.07%).
As noted in a previous blog post, since January 1, 2024, spam accounted for 1.3% of all emails with “Olympics” or “Paris 2024” in the subject, while malicious emails made up 0.1%. In a sample of 1,000 emails, roughly 13 would be spam and 1 would be malicious. The peak for malicious Olympic-related emails occurred during the week of May 6, with 0.6% classified as malicious. Although there was a decline after this peak, rates increased slightly in July, reaching 0.4% on July 8. Despite the surge in volume during the week of July 22, only 0.05% of emails were malicious.
Simone Biles and Snoop Dogg popular via email
Famous individuals are often used by attackers for email phishing. Among the athletes shining at the event, Simone Biles generated the most emails, but very few of them were spam or malicious. Biles led other popular names during the event, including those named below, ordered by number of email messages: Katie Ledecky (US), Imane Khelif (Algeria), Novak Djokovic (Serbia), Steph Curry (US), and Léon Marchand (France).
Since July 1, over 160,000 emails processed by Cloudflare’s Cloud Email Security service have included “Simone Biles” or “Biles” in the subject, with only 0.5% considered spam and 0.01% classified as malicious. (And 97% of those 160,000 emails were sent since the Olympics started on July 26.) The most emails were sent on August 5, followed by August 2 and July 28. Spam percentage peaked on July 24, with 5% of all emails considered spam.
Among famous attendees, Snoop Dogg topped the list ahead of other US team supporters like Martha Stewart, Flava Flav, and Jason Kelce. Since July, there have been over 6,600 emails with “Snoop Dogg” in the subject, with 40 classified as spam (0.6%) and 4 as malicious (0.06%).
Conclusion: from Paris to Los Angeles
The Paris 2024 Summer Olympics not only captivated millions worldwide with thrilling sports competitions, but also had a significant impact on global Internet traffic. Our data shows noticeable drops in Internet activity during key Olympic events, particularly in France, as viewers shifted from online activities to watching the games live. This trend underscores the enduring power of broadcast media during major global events, even in an increasingly digital age.
Additionally, the increase in DNS traffic for official Olympic websites and the surge in DNS traffic for streaming platforms covering the event indicates strong interest in online coverage, especially among certain audiences, complementing traditional TV viewership broadcast by national networks worldwide.
Finally, the heightened cybersecurity threats, including DDoS attacks on sponsor sites and the rise in Olympic-related emails (including spam and malicious ones), emphasize both the marketing impact of this global event and its vulnerabilities.
And after the Paris 2024 Summer Olympics, the 2024 Summer Paralympics are just around the corner (August 28-September 8), and in four years, it will be time for LA 2028.
As we’ve observed throughout the Paris 2024 Olympics, the Olympic spirit continues to capture interest and remains relevant across different media. This spirit, present for 2,800 years since Ancient Greece (dating back to 776 BC), still attracts and inspires humanity.
(Jorge Pacheco from the Cloudflare Radar team contributed to this blog post)
The Paris 2024 Summer Olympics wrapped up on August 11, 2024, with the Olympic flag being lowered in the Stade de France after 16 days of competitions. With 329 events across 32 sports, over 10,000 athletes from 204 nations participated in the pursuit of medals and glory, creating some viral online moments along the way. In this post, we turn our attention to the closing ceremony, the impact of various Olympic moments on Internet traffic, and the cyber attacks faced by sponsors. We also examine email trends related to the Olympics, including mentions of Simone Biles, Snoop Dogg, and Imane Khelif.
Cloudflare has a global presence with data centers in over 330 cities, supporting millions of customers with different tools and products, which provides a global view of what’s happening on the Internet. This is helpful for improving security, privacy, efficiency, and speed, but also for observing Internet disruptions and traffic trends.
In our previous blog post about the opening ceremony and the early days of the event, we showed how France was impacted by the Olympics, with clear drops in traffic during the main events. The opening ceremony caused the most significant drop—traffic decreased by as much as 20% compared to the previous week. Other countries were also less online during that time, spending more time on broadcast TV.
Closing ceremony impact in France
The moment that the Golden Voyager (a golden dancing character) descended from the sky during the closing ceremony. Captured in a photo taken by Cloudflare CEO Matthew Prince, who was in attendance.
More than two weeks after the Summer Olympics began, the 3-hour closing ceremony on August 11, 2024, had a similar impact as the opening ceremony did on Internet traffic in France, although less pronounced. Internet traffic dropped by as much as 14% compared to the previous week at the start of the ceremony, around 19:15 UTC. Here is a breakdown of the top three traffic drops compared to the previous week during the ceremony, detailing the events occurring at those times. Our data provides insights with 15-minute granularity.
Moments of the closing ceremony by traffic drop in France
Time of drop (UTC)
Drop %
Events at the time
#1
~19:15
-14%
Léon Marchand, France’s swimming star, carried a lantern from the Cauldron at the Jardins des Tuileries to the Stade de France. Flags of all National Olympic Committees entered the stadium, followed by the athletes.
#2
~20:15
-13%
A Golden Voyager, inspired by French history, descended from the sky, followed by Nike, the Goddess of Victory. In the stands, LED bracelets—similar to those used at Taylor Swift concerts—created images of athletes, doves of peace, and the Olympic Rings.
#3
~21:30
-10%
Californian artist H.E.R. performed the U.S. national anthem and introduced Tom Cruise, who performed Mission Impossible stunts to transport the Olympic flag from Paris to Los Angeles.
During the closing ceremony, from 19:00 to 22:00 UTC, traffic in France was significantly lower than the previous week, down between 3% – 14%. The decreases were less pronounced during the middle and end of the event. Internet requests increased during band performances and the official closing speeches. Traffic also rose during Yseult’s finale, singing a rendition of Frank Sinatra’s “My Way,” contrasting with the significant drop during Celine Dion’s performance at the end of the opening ceremony.
In exploring traffic trends for other countries, we found that the closing ceremony didn’t have as clear an impact as the opening event did.
Taking a broader look at traffic in France during the entire Olympic period, daily traffic dropped by as much as 8% on July 28 but remained fairly stable afterward, with a 3% drop on August 8.
Mobile device use rose in France
Mobile device traffic share continued to grow during the event, with more people using mobile devices to access the Internet. This trend of more mobile use in France aligns not only with more tourists and visitors in the country during the Olympics – visitors more typically use mobile devices to access the Internet – but also with French people taking vacations and working less during this time. Weekly mobile device traffic share in France in mid-June was 49%, and since the Olympics started, it has increased to between 53% and 54%.
In France, mobile device use is higher on weekends. However, looking at daily trends, mobile traffic share on weekdays was clearly higher after July 26, when the Olympics began.
Parisians left, Olympic tourists arrived
We’ve seen before that Parisians appeared to left town (and the region) just before the Olympics. In the Paris region of Île-de-France, with the Olympics, traffic during the first week of the event dropped as much as 6% on July 30, compared to the previous week. Traffic picked up a bit on the second weekend of the Olympics but dropped even more during the second and final week.
The chart below illustrates daily traffic to the Île-de-France region, with a noticeable decline visible during the weekend before the Olympics that was more pronounced during the event.
Weekly traffic dropped 8% the week the Olympics started and remained stable the following week. Even so, by August 4, the last week of the Olympics, traffic was 23% lower in the Île-de-France region than in the week of June 30, when it was at its highest in recent weeks.
Significant moments: from Simone Biles to breakdancing debut
Below, we highlight specific Olympic events affecting Internet traffic that we were able to observe in our data from different locations (ordered by the numbers of medals in the event), starting from the first full competition day on Saturday, July 27, 2024.
Host nation France was clearly the one with more significant impacts to Internet traffic during relevant moments of the Olympics.
United States: The artistic gymnastics competition featuring four-time Olympic gold medalist Simone Biles had a greater impact on U.S. Internet traffic than the opening ceremony. On July 26-28, traffic dipped most significantly during Biles’ events. On the 28th, at 10:00 UTC, during her beam routine, traffic was already 4% lower than the previous week. It dropped by 6% at 10:45 UTC during her floor and vault routines.
On July 29, at 19:30 UTC, traffic dropped 4% during the swimming event where Ryan Murphy won the bronze medal in the men’s 100m backstroke final.
Another notable drop occurred on August 10, with a 7% decrease around 15:00 UTC during the women’s football gold medal match between Brazil and the USA. Later that day, during the men’s basketball gold medal game between France and the USA, traffic dropped by as much as 6%.
Great Britain: The first weekend of the Olympics saw clear drops in traffic, with a 10% decrease compared to the previous week around 15:00 UTC on July 28, 2024. British athletes participated in several events during those busy days. Traffic the following weekend was slightly higher than in the first Olympic weekend but dropped again on the final day, August 11.
France: As previously noted, French swimmer Léon Marchand’s gold medal and Olympic record in the men’s 400-meter individual medley on July 28 had the most significant impact on French traffic during the Olympics, aside from the 20% drop seen during the opening ceremony. Traffic fell by 17% at 18:30 UTC during his event—the same level of drop seen during the closing ceremony. Similar impacts occurred during other swimming events:
July 29, 19:45 UTC, 14% drop during the Women’s 100m Backstroke Semifinals featuring Yohann Ndoye-Brouard.
July 30, 19:00 UTC, 12% drop during the Men’s 200m Butterfly Semifinals with Léon Marchand.
July 31, 18:30-20:30 UTC, 7% to 10% drop during the Men’s 200m Butterfly final with Léon Marchand.
August 1, 18:45 UTC, 8% drop during swimming semifinals and finals.
Other notable drops include breakdancing:
August 9, 14:30 UTC, 10% drop during the Breaking dance debut with France’s participation.
August 10, 18:45-21:00 UTC, 7% drop during the Breaking B-Boys gold medal battle and the men’s basketball gold medal game, France vs USA.
August 11, 07:00 UTC, 8% drop during the women’s marathon.
Australia: During Mollie O’Callaghan’s victory in the women’s 200m freestyle on July 29, at around 20:00 UTC, Australian traffic was 5% lower than the previous week, a larger drop than during the opening ceremony, which saw a 2% decrease.
On August 1, at around 18:45 UTC, traffic was 10% lower than the previous week during swimming events that led to Australia’s gold in the women’s 4x200m freestyle relay. And on August 11, at around 07:00 UTC, traffic dropped 7% compared to the previous week during the women’s marathon with Australian participants.
Japan: One of the most significant drops in traffic in Japan during the Olympics occurred on August 6, around the time Fumita Kenichiro from Japan won gold in the men’s Greco-Roman wrestling 60kg final, followed by artistic swimming and the women’s table tennis competition, with traffic dropping 12% at 18:15 UTC.
On August 10, for several hours after 17:30 UTC, traffic in Japan was also lower than usual, with a drop of as much as 14%. This coincided with Japan’s gold medal win in the women’s javelin throw and the men’s breaking quarterfinals and semifinals.
Italy: During the event that gave Italy its first ever gold medal in artistic gymnastics, won by Alice D’Amato in the women’s balance beam event, traffic dropped 5% at around 10:45 UTC.
Netherlands: On the morning of July 28, the second full day of the Olympics, traffic in the Netherlands dropped by as much as 20% compared to the previous week, with Dutch athletes participating in several competitions.
On August 11, traffic dropped between 06:30 and 09:30 UTC, and by as much as 16% at 08:15 UTC, when Dutch runner Sifan Hassan won the gold medal in the women’s marathon.
South Korea: The Korean women’s archery team’s gold medal win on July 28 at 15:30 UTC led to an 8% drop in traffic, the most significant decrease noted in the country between July 26 and July 29.
On August 7, at 19:45 UTC, traffic was 9% lower during the Taekwondo gold medal event for Park Taejoon in the men’s -58kg (under 58kg) competition.
Brazil: Traffic in Brazil was 15% lower than the previous week on July 27 at around 19:30 UTC, surpassing the impact of the opening ceremony. This occurred as Brazilian swimmers Guilherme Costa and Maria Fernanda Costa competed in the men’s and women’s 400m freestyle events.
On August 2, traffic in Brazil was 5% lower at around 00:30 UTC during the men’s surfing quarterfinals with Gabriel Medina and was 8% lower at around 01:00 UTC during the women’s surfing quarterfinals with Tatiana Weston-Webb.
Cape Verde: David Pina won the first Olympic medal in boxing for this archipelago nation off the western coast of Africa. On August 4, the amateur boxer took the bronze medal, with traffic dropping 12% in the country at around 15:00 UTC during the match.
DNS trends for official Olympic websites by country
On July 22, before the Olympics began, we reported on the heightened interest in official Olympic websites based on request data from our 1.1.1.1 DNS resolver. France initially dominated with 24% of DNS traffic, followed by the UK (20%) and the US (17%). However, when the Olympics started, the US took the lead, maintaining it throughout the event.
The following chart summarizes the highest shares of DNS request traffic by country during the Paris 2024 Summer Olympics. There was a shift in percentages that indicates a broader spread of interest across countries as the Olympics progressed, visible in the dynamic version of the map by day of the event that is available in our Paris 2024 Olympics report.
Here are the top 10 countries that during the event had more DNS traffic for Olympics official websites. The US took the “gold,” France the “silver,” and the UK the “bronze”:
United States: 18%
France: 16%
United Kingdom: 10%
Germany: 7%
Brazil: 6%
Australia: 5%
Canada: 2%
Japan: 2%
India: 2%
Russian Federation: 2%
We observed that the US overtook France for the #1 spot a few days before the event began. France also dropped to third place behind Germany on July 27, the first full day of competitions, and again after August 2, though interestingly, it returned to #2 the day after the Olympics ended.
As shown in the following daily ranking chart, the UK was #3 before the event began but dropped to #4 on August 1. Australia’s highest ranking was #3 on July 29, and #4 on August 10 and 11. Brazil’s best days, ranking #3, were on July 24-25, and on July 30, 31, and August 1.
In terms of volume of DNS traffic to our 1.1.1.1 resolver, the first full week of Olympic events saw the highest volume of requests related to official Olympic websites, with a 637% increase compared to the week before the Olympics began. This trend of peak traffic during the first week was consistent across most countries, except for Germany, Spain, India, Italy, and Russia, where the final week generated more DNS resolver traffic.
On a daily basis, worldwide DNS traffic to official Olympics domains peaked on August 2, followed by August 4 and August 5, marking the start of the second and final week of the event. Below are the top 3 days with the highest DNS traffic to official Olympic websites in the top 3 countries by traffic volume:
United States: July 30 (when the US women’s team won gold in artistic gymnastics and several medals were won in swimming), July 29, and August 5.
France: July 31 (when swimmer Léon Marchand won gold in the men’s 200m butterfly final), July 29, and August 1.
Germany: July 27 (when swimmer Lukas Maertens won gold in the men’s 400m freestyle final), August 8, and August 7.
Sports news sites
Looking at DNS traffic for sports news sites across different countries, the two weeks of the Olympics brought more traffic than any other week since June, including during the major football event, UEFA Euro 2024, held between June 14 and July 14. The Olympic weeks saw 17% more traffic than the week before the Olympics and 4% more DNS traffic than the best week of Euro 2024 (June 22-29).
From a daily perspective, the days with the highest traffic to sports news sites were August 10, August 3, July 28, and July 14 (related to the Euro 2024 final).
In the United States, NBC was not only the official broadcaster of the Olympics, but also created a dedicated website. NBC’s sports and NBC Olympics websites saw a significant rise in global DNS traffic, increasing up to 1,640% on July 28 compared to the previous week.
From official streaming services to Olympic sponsors
While the Olympics were still broadcast on several traditional national TV networks, streaming also played a key role, with Peacock TV (in the US and Canada) and Max (from Warner Bros. Discovery) in Europe offering several hours of Olympic content daily. The global traffic growth to these platforms was evident. On a weekly basis, DNS request traffic for streaming platforms featuring Olympic events grew by as much as 65%. Daily traffic peaked on July 30 (68% higher than the previous week), followed by July 29 and August 4. Peacock TV led over Max in terms of traffic.
Breakdancing, or “breaking,” made its first appearance in the 2024 Summer Olympics, leading to a surge in DNS traffic to breaking-related websites, particularly on August 9 and 10. Traffic peaked on August 9, with a 215% increase compared to the previous week, driven by viral moments like Australian Rachael Gunn’s performance.
How about the Paris Olympics sponsors? DNS traffic also increased, particularly in the early days of the event and the days leading up to it, with peak traffic on July 29 (15% higher than the previous week), followed by July 25 and 24 (the two days before the opening ceremony). Samsung saw the most significant impact during the early days of the Olympics, while Airbnb experienced a surge in traffic just before the opening ceremony (July 25).
Next stop: LA 2028
The closing ceremony concluded with a symbolic passing of the torch from Paris 2024 to Los Angeles 2028. Simone Biles handed the Olympic flag to Tom Cruise, who transported it Mission Impossible-style from Paris to a Venice Beach concert in LA featuring acts including the Red Hot Chili Peppers and Billie Eilish. Unsurprisingly, the official LA 2028 Olympics website saw a 1600% surge in DNS traffic on August 11 compared to the previous week.
DDoS attacks targeting Olympic-related and sponsor websites
As we observed during the 2024 elections, including the French elections, political parties are not the only targets of DDoS (Distributed Denial of Service) attacks during significant events. Attackers are aware of large global events. In a previous related blog post, we discussed attacks targeting French transportation and government websites. Below, let’s focus on Olympic-related and sponsor organizations.
In July, Cloudflare blocked a surge in DDoS attacks on Olympic partner websites – higher than in any other month of 2024. Daily DDoS attack requests jumped to 200 million, and in just 11 days of August, more DDoS requests (90 million) were blocked than in any full month in 2024 before the Olympics.
The largest spike in attacks occurred on July 29, targeting three sponsor websites simultaneously, with 84 million DDoS-related requests in a single day. The most intense DDoS attack peaked at 190,000 requests per second at 10:20 UTC.
The most significant specific attack was on the last day of the event, August 11, targeting a French transportation site. It lasted four minutes and peaked at over 500,000 requests per second at 05:09 UTC.
As highlighted in our Q2 DDoS report, most DDoS attacks are short-lived, as seen in the two mentioned attacks. While a 500,000 request per second (rps) attack is not large for Cloudflare, it can be devastating for websites not equipped to handle such traffic levels.
Analyzing the same pool of Olympic partner websites that use Cloudflare, total requests (including legitimate traffic and attacks) rose in July, reaching 4.2 billion—27% more than in May and 11% more than in June.
Rise in “Olympics” and “Paris 2024” emails
Major events often attract attention in the email realm, including spam and malicious emails, and the Olympics were no exception. From January 2024 through August 11, Cloudflare’s Cloud Email Security service processed over 1.7 million emails containing “Olympics” or “Paris 2024” in the subject. More than half of these emails (890,000) were sent during the Olympics (July 26 to August 11), with the highest volume (150,000 messages) on July 26, the day of the opening ceremony.
The week of July 22-28, coinciding with the first few days of the Olympics, saw a 304% increase in such emails compared to the previous week, and an astonishing 3111% increase compared to the busiest week in January.
Although the Olympics period (July 26 – August 11) was busy in terms of related emails, the percentages of spam and malicious messages were lower than before. However, over 6,200 emails were classified as spam (0.7%), and just 248 were identified as malicious or phishing (0.07%).
As noted in a previous blog post, since January 1, 2024, spam accounted for 1.3% of all emails with “Olympics” or “Paris 2024” in the subject, while malicious emails made up 0.1%. In a sample of 1,000 emails, roughly 13 would be spam and 1 would be malicious. The peak for malicious Olympic-related emails occurred during the week of May 6, with 0.6% classified as malicious. Although there was a decline after this peak, rates increased slightly in July, reaching 0.4% on July 8. Despite the surge in volume during the week of July 22, only 0.05% of emails were malicious.
Simone Biles and Snoop Dogg popular via email
Famous individuals are often used by attackers for email phishing. Among the athletes shining at the event, Simone Biles generated the most emails, but very few were spam or malicious. Biles led other popular names during the event, including those named below, ordered by number of email messages: Katie Ledecky (US), Imane Khelif (Algeria), Novak Djokovic (Serbia), Steph Curry (US), and Léon Marchand (France).
Since July 1, over 160,000 emails processed by Cloudflare’s Cloud Email Security service have included “Simone Biles” or “Biles” in the subject, with only 0.5% considered spam and 0.01% classified as malicious. (And 97% of those 160,000 emails were sent since the Olympics started on July 26.) The most emails were sent on August 5, followed by August 2 and July 28. Spam percentage peaked on July 24, with 5% of all emails considered spam.
Among famous attendees, Snoop Dogg topped the list ahead of other US team supporters like Martha Stewart, Flava Flav, and Jason Kelce. Since July, there have been over 6,600 emails with “Snoop Dogg” in the subject, with 40 classified as spam (0.6%) and 4 as malicious (0.06%).
Conclusion: from Paris to Los Angeles
The Paris 2024 Summer Olympics not only captivated millions worldwide with thrilling sports competitions, but also had a significant impact on global Internet traffic. Our data shows noticeable drops in Internet activity during key Olympic events, particularly in France, as viewers shifted from online activities to watching the games live. This trend underscores the enduring power of broadcast media during major global events, even in an increasingly digital age.
Additionally, the increase in DNS traffic for official Olympic websites and the surge in DNS traffic for streaming platforms covering the event indicates strong interest in online coverage, especially among certain audiences, complementing traditional TV viewership broadcast by national networks worldwide.
Finally, the heightened cybersecurity threats, including DDoS attacks on sponsor sites and the rise in Olympic-related emails (including spam and malicious ones), emphasize both the marketing impact of this global event and its vulnerabilities.
And after the Paris 2024 Summer Olympics, the 2024 Summer Paralympics are just around the corner (August 28-September 8), and in four years, it will be time for LA 2028.
As we’ve observed throughout the Paris 2024 Olympics, the Olympic spirit continues to capture interest and remains relevant across different media. This spirit, present for 2,800 years since Ancient Greece (dating back to 776 BC), still attracts and inspires humanity.
(Jorge Pacheco from the Cloudflare Radar team contributed to this blog post)
Претърсванията на Европейската прокуратура в “Булгартрансгаз” (БТГ) и “Главболгарстрой” (ГБС) са заради схемата им за евентуално източване на около 100 млн. лв. европейски средства от проекта за разширяването на подземното…
Microsoft is addressing 88 vulnerabilities this August 2024 Patch Tuesday. Microsoft has evidence of in-the-wild exploitation and/or public disclosure for ten of the vulnerabilities published today, which is significantly more than usual. At time of writing, all six of the known-exploited vulnerabilities patched today are listed on CISA KEV. Microsoft is also patching five critical remote code execution (RCE) vulnerabilities today. 11 browser vulnerabilities have already been published separately this month, and are not included in the total.
Patch Tuesday watchers will know that today’s haul of four publicly-disclosed vulnerabilities and six further exploited-in-the-wild vulnerabilities is a much larger batch than usual. We’ll first address those vulnerabilities where public disclosure exists but no patch is available: the noteworthy Windows OS downgrade attacks disclosed at Black Hat last week. We’ll then examine those vulnerabilities published today which Microsoft knows to be exploited in the wild already, and then take a look at the other publicly-disclosed vulnerabilities published this month.
Windows Update: 50% patched zero-day Downdate attack
First things first: what if your patched Windows asset suddenly wasn’t patched, up to and including the hypervisor? That was the question asked and answered in a Black Hat talk by SafeBreach last week. In response, Microsoft has published two vulnerabilities. Microsoft was first notified of these vulnerabilities back in February 2024, and the advisories concede that the Black Hat talk was “appropriately coordinated with Microsoft.”
CVE-2024-38202 describes an elevation of privilege vulnerability in the Windows Update Stack, and exploitation requires that an attacker convinces an administrative user to perform a system restore — unusual, certainly, but social engineers can accomplish many things. Microsoft optimistically assesses exploitation of this vulnerability as less likely. The advisory does not explain how a user with basic privileges can modify the target asset’s System directory, which is required to plant the malicious system restore files, although the SafeBreach write-up does explain the flaw in significant detail. No patch is yet available, although the advisory states that a security update to mitigate this threat is under development. Microsoft provides several recommended actions, which do not mitigate the vulnerability, but can at least provide additional barriers to exploitation and put in place some useful additional visibility of the attack surface and exploitation attempts. One possible outcome of exploitation is that an attacker could modify the integrity and repair utility so that it will no longer detect corruptions in Windows system files.
CVE-2024-21302 is the second half of the downgrade attack pair discovered by SafeBreach. Exploitation allows an attacker with administrator privileges to replace updated Windows system files with older versions and thus reintroduce vulnerabilities to Virtualization-based security (VBS). Patches are available; however, defenders must note that the patch does not automatically remediate assets, but instead delivers an opt-in Microsoft-signed revocation policy, which brings with it the risk of a boot loop if applied and then improperly reverted. Significant guidance is available under KB5042562: Guidance for blocking rollback of Virtualization-based Security (VBS) related security updates.
Windows WinSock: zero-day EoP
Moving on to known-exploited vulnerabilities: the Windows Ancillary Function Driver for WinSock receives a patch for exploited-in-the-wild elevation of privilege vulnerability CVE-2024-38193. Successful exploitation is via a use-after-free memory management bug, and could lead to SYSTEM privileges. The advisory doesn’t provide further clues, but with existing in-the-wild exploitation, low attack complexity, no user interaction involved, and low privileges required, this is one to patch immediately to keep malware at bay.
Windows Power Dependency Coordinator: zero-day EoP
While we’re looking at exploited-in-the-wild, use-after-free vulnerabilities with minimalist advisories: CVE-2024-38107 also leads to SYSTEM privileges via abuse of the Windows Power Dependency Coordinator, which allows Windows computers to wake almost instantly from sleep. Of course, nothing comes for free: this vulnerability requires no user interaction, has low attack complexity, and requires low privileges. Patch all your Windows assets sooner rather than later.
Windows Kernel: zero-day EoP
Still on the topic of exploited-in-the-wild, elevation-to-SYSTEM vulnerabilities: CVE-2024-38106 requires an attacker to win a race condition which falls under CWE-591: Sensitive Data Storage in Improperly Locked Memory. Although the advisory for CVE-2024-38106 does not provide further detail, a reasonable assumption here might be that the vulnerability could be similar to CVE-2023-36403, where exploitation relies on a flaw in the way the Windows kernel handles locking for registry virtualization, which allows Windows to redirect globally-impactful registry read/write operations to per-user locations to support legacy applications which are not UAC-compatible. Curiously, Windows Server 2012 does not receive a patch for CVE-2024-38106, so either the vulnerability was introduced in a later codebase, or Microsoft is hoping that attackers won’t notice.
Windows SmartScreen: zero-day MotW bypass
CVE-2024-38213 describes a Mark of the Web (MotW) security bypass vulnerability in all current Windows products. An attacker who convinces a user to open a malicious file could bypass SmartScreen, which would normally warn the user about files downloaded from the internet, which Windows would otherwise have tagged with MotW. CVE-2024-38213 likely offers less utility to attackers than a broadly-similar SmartScreen bypass published in February 2024, since unlike today’s offering, the advisory for CVE-2024-21351 also described the potential for code injection into SmartScreen itself. The lower CVSSv3 base score for CVE-2024-21351 reflects that difference.
Edge Internet Explorer mode: zero-day EoP
Although Edge RCE vulnerability CVE-2024-38178 is already known to be exploited in the wild, it likely won’t be top of anyone’s list of greatest concerns this month. The advisory clarifies that successful exploitation would require the attacker to not only convince a user to click a malicious link, but also to first prepare the target asset so that it uses Edge in Internet Explorer Mode. IE Mode provides backwards-compatibility functionality so that users can view legacy websites which rely on the fascinating idiosyncrasies of Internet Explorer; such sites are often served by enterprise legacy web applications, which goes a long way to explaining Microsoft’s continued motivation to keep Internet Explorer somewhat alive. If not already enabled on the target asset, the attacker would have to achieve a modification of Edge settings to enable the “Allow sites to be reloaded in Internet Explorer” setting. Subsequent exploitation would involve convincing the user to open an Internet Explorer mode tab within Edge and then opening the malicious URL. Remediation involves patching Windows itself; all current versions of Windows are affected.
Microsoft Project: zero-day RCE
Rounding out this month’s half dozen exploited-in-the-wild vulnerabilities is CVE-2024-38189, which describes RCE in Microsoft Project. Exploitation requires that an attacker convince the user to open a malicious file, and is possible only where the “Block macros from running in Office files from the Internet” policy is disabled — it is enabled by default — and the “VBA Macro Notification Settings” are set to a low enough level. Happily, the Preview Pane is not an attack vector in this case.
Microsoft Office: zero-day spoofing
Published last week to acknowledge its public disclosure, and patched today for all current versions of Office, CVE-2024-38200 describes a spoofing vulnerability. Exploitation requires that the user click a malicious link. Although the advisory doesn’t describe the impact, the weakness is CWE-200: Exposure of Sensitive Information to an Unauthorized Actor, and the FAQ mentions outgoing NTLM traffic; reading between the lines, it’s highly likely that NTLM hashes are exposed upon successful exploitation.
The advisory suggests mitigating factors which may already apply, or which may prove helpful to improve security posture: adding users to the Protected Users Security Group, which prevents the use of NTLM authentication, and blocking outbound SMB connections to port 445. Both of these mitigation measures may break legacy authentication in some scenarios.
Somewhat unusually, Microsoft claims to have fixed this vulnerability twice, since in addition to today’s patches, an alternative fix was enabled via Feature Flighting on 2024-07-30 for all in-support versions of Office and 365. Microsoft still recommends that customers update to the 2024-08-13 patches to receive the final version of the fix. Somewhat confusingly, the FAQ then goes on to say that the Security Updates table will be revised when the update is publicly available; however, it’s likely that Microsoft will update the FAQ in the near future to clarify that a this was a minor FAQ editing oversight rather than a suggestion that further patches are expected.
Windows Line Printer Daemon: zero-day RCE
Line Printer Daemon (LPD) vulnerabilities are like buses: you wait ages for one, and then two come along in quick succession. Last month’s denial of service vulnerability is now joined by CVE-2024-38199, a publicly-disclosed RCE vulnerability. Exploitation requires that an attacker sends a malicious print task to a shared vulnerable Windows Line Printer Daemon service across the network. Many admins won’t need to worry about this vulnerability, since Microsoft has been encouraging everyone to migrate away from LPD for almost a decade, and it isn’t installed by default on Windows products newer than Server 2012. Still, patches are available for Windows Server 2008 SP2, Server 2022 23H2, and everything in between.
SharePoint & Exchange update
As something of an olive branch for defenders who may now be eyeing their to-do list with concern, Microsoft has not published any SharePoint or Exchange vulnerabilities this month.
Microsoft lifecycle update
All versions of Visual Studio for Mac retire on 2024-08-31 and will no longer receive any further updates — including security patches — after that date. The URL seems to anticipate that some people will have questions: https://learn.microsoft.com/en-us/visualstudio/mac/what-happened-to-vs-for-mac. Microsoft suggests the C# Dev Kit for Visual Studio Code as one possible alternative.
Customers use Amazon Web Services (AWS) to securely build, deploy, and scale their applications. As your organization grows, you want to streamline permissions management towards least privilege for your identities and resources. At AWS, we see two customer personas working towards least privilege permissions: security teams and developers. Security teams want to centrally inspect permissions across their organizations to identify and remediate access-related risks, such as excessive permissions, anomalous access to resources or compliance of identities. Developers want policy verification tools that help them set effective permissions and maintain least privilege as they build their applications.
Customers are increasingly turning to cloud infrastructure entitlement management (CIEM) solutions to guide their permissions management strategies. CIEM solutions are designed to identify, manage, and mitigate risks associated with access privileges granted to identities and resources in cloud environments. While the specific pillars of CIEM vary, four fundamental capabilities are widely recognized: rightsizing permissions, detecting anomalies, visualization, and compliance reporting. AWS provides these capabilities through services such as AWS Identity and Access Management (IAM) Access Analyzer, Amazon GuardDuty, Amazon Detective, AWS Audit Manager, and AWS Security Hub. I explore these services in this blog post.
Rightsizing permissions
Customers primarily explore CIEM solutions to rightsize their existing permissions by identifying and remediating identities with excessive permissions that pose potential security risks. In AWS, IAM Access Analyzer is a powerful tool designed to assist you in achieving this goal. IAM Access Analyzer guides you to set, verify, and refine permissions.
After IAM Access Analyzer is set up, it continuously monitors AWS Identity and Access Management (IAM) users and roles within your organization and offers granular visibility into overly permissive identities. This empowers your security team to centrally review and identify instances of unused access, enabling them to take proactive measures to refine access and mitigate risks.
While most CIEM solutions prioritize tools for security teams, it’s essential to also help developers make sure that their policies adhere to security best practices before deployment. IAM Access Analyzer provides developers with policy validation and custom policy checks to make sure their policies are functional and secure. Now, they can use policy recommendations to refine unused access, making sure that identities have only the permissions required for their intended functions.
Anomaly detection
Security teams use anomaly detection capabilities to identify unexpected events, observations, or activities that deviate from the baseline behavior of an identity. In AWS, Amazon GuardDuty supports anomaly detection in an identity’s usage patterns, such as unusual sign-in attempts, unauthorized access attempts, or suspicious API calls made using compromised credentials.
By using machine learning and threat intelligence, GuardDuty can establish baselines for normal behavior and flag deviations that might indicate potential threats or compromised identities. When establishing CIEM capabilities, your security team can use GuardDuty to identify threat and anomalous behavior pertaining to their identities.
Visualization
With visualization, you have two goals. The first is to centrally inspect the security posture of identities, and the second is to comprehensively understand how identities are connected to various resources within your AWS environment. IAM Access Analyzer provides a dashboard to centrally review identities. The dashboard helps security teams gain visibility into the effective use of permissions at scale and identify top accounts that need attention. By reviewing the dashboard, you can pinpoint areas that need focus by analyzing accounts with the highest number of findings and the most commonly occurring issues such as unused roles.
Amazon Detective helps you to visually review individual identities in AWS. When GuardDuty identifies a threat, Detective generates a visual representation of identities and their relationships with resources, such as Amazon Elastic Compute Cloud (Amazon EC2) instances, Amazon Simple Storage Service (Amazon S3) buckets, or AWS Lambda functions. This graphical view provides a clear understanding of the access patterns associated with each identity. Detective visualizes access patterns, highlighting unusual or anomalous activities related to identities. This can include unauthorized access attempts, suspicious API calls, or unexpected resource interactions. You can depend on Detective to generate a visual representation of the relationship between identities and resources.
Compliance reporting
Security teams work with auditors to assess whether identities, resources, and permissions adhere to the organization’s compliance requirements. AWS Audit Manager automates evidence collection to help you meet compliance reporting and audit needs. These automated evidence packages include reporting on identities. Specifically, you can use Audit Manager to analyze IAM policies and roles to identify potential misconfigurations, excessive permissions, or deviations from best practices.
Audit Manager provides detailed compliance reports that highlight non-compliant identities or access controls, allowing your auditors and security teams to take corrective actions and support ongoing adherence to regulatory and organizational standards. In addition to monitoring and reporting, Audit Manager offers guidance to remediate certain types of non-compliant identities or access controls, reducing the burden on security teams and supporting timely resolution of identified issues.
Single pane of glass
While customers appreciate the diverse capabilities AWS offers across various services, they also seek a unified and consolidated view that brings together data from these different sources. AWS Security Hub addresses this need by providing a single pane of glass that enables you to gain a holistic understanding of your security posture. Security Hub acts as a centralized hub, consuming findings from multiple AWS services and presenting a comprehensive view of how identities are being managed and used across the organization.
Conclusion
CIEM solutions are designed to identify, manage, and mitigate risks associated with access privileges granted to identities and resources in cloud environments. The AWS services mentioned in this post can help you achieve your CIEM goals. If you want to explore CIEM capabilities in AWS, use the services mentioned in this post or see the following resources.
Markdown editors are a dime a dozen. Cheaper than that, actually,
since many of them are open‑source software. Despite the sheer number of
options, finding an editor that has all of the features that one might want can
be tricky. For some users, Zettlr
might the right tool. It is a What You See is What You
Mean (WYSIWYM) editor that stores its work locally as plain Markdown
files. The project is billed as a “one-stop publication
workbench“, and is suitable for writing anything from blog posts to
academic papers, maintaining a personal journal, or keeping notes in a Zettlekasten. It
is simple to get started with, but rewards deeper exploration and
customization.
Amazon DataZone has announced a set of new data governance capabilities—domain units and authorization policies—that enable you to create business unit-level or team-level organization and manage policies according to your business needs. With the addition of domain units, users can organize, create, search, and find data assets and projects associated with business units or teams. With authorization policies, those domain unit users can set access policies for creating projects and glossaries, and using compute resources within Amazon DataZone.
As an Amazon DataZone administrator, you can now create domain units (such as Sales or Marketing) under the top-level domain and assign domain unit owners to further manage the data team’s structure. Amazon DataZone users can log in to the portal to browse and search the catalog by domain units, and subscribe to data produced by specific business units. Additionally, authorization policies can be configured for a domain unit permitting actions such as who can create projects, metadata forms, and glossaries within their domain units. Authorized portal users can then log in to the Amazon DataZone portal and create entities such as projects and create metadata forms using the authorized projects.
Amazon DataZone enables you to discover, access, share, and govern data at scale across organizational boundaries, reducing the undifferentiated heavy lifting of making data and analytics tools accessible to everyone in the organization. With Amazon DataZone, data users like data engineers, data scientists, and data analysts can share and access data across AWS accounts using a unified data portal, allowing them to discover, use, and collaborate on this data across their teams and organizations. Additionally, data owners and data stewards can make data discovery simpler by adding business context to data while balancing access governance to the data in the UI.
In this post, we discuss common approaches to structuring domain units, use cases that customers in the healthcare and life sciences (HCLS) industry encounter, and how to get started with the new domain units and authorization policies features from Amazon DataZone.
Approaches to structuring domain units
Domains are top-level entities that encompass multiple domain units as sub-entities, each with specific policies. Organizations can adopt different approaches when defining and structuring domains and domain units. Some strategies align these units with data domains, whereas others follow organizational structures or lines of business. In this section, we explore a few examples of domains, domain units, and how to organize data assets and products within these constructs.
Domains aligned with the organization
Domain units can be built using the organizational structure, lines of businesses, or use cases. For example, HCLS organizations typically have a range of domains that encompass various aspects of their operations and services. Customers are using domains and domain units to improve searchability and findability of data assets within an organized tree-like structure, and enable individual organizational units to control their own authorization policies.
One of the core benefits of organizing entities as domain units is to enable search and self-service access across various domain units. The following are some common domain units within the HCLS sector:
Commercials – Commercial aspects of products or services related to the life sciences and activities such as market analysis, product positioning, pricing, distribution, and customer engagement. There could be several child domain units, such as contract research organization.
Research and development – Pharmaceutical and medical device development. Some examples of child domain units include drug discovery and clinical trials management.
Clinical services – Hospital and clinic management. Examples of child domain units include physician and nursing services.
Revenue cycle management – Patient billing and claims processing. Examples of child domain units include insurance and payer relations.
The following are common domains and domain units that apply across industries:
Supply chain and logistics – Procurement and inventory management.
Regulatory compliance and quality assurance – Compliance with industry specific regulations, quality management systems, and accreditation.
Marketing – Strategies, techniques, and practices aimed at promoting products, services, or ideas to potential customers. Some examples of child domain units are campaigns and events.
Sales – Sales process, key performance indicators (KPIs), and metrics.
For example, one of our customers, AWS Data Platform, uses Amazon DataZone to provide secure, trusted, convenient, and fast access to AWS business data.
“At AWS, our vision is to provide customers with reliable, secure, and self-service access to exabyte-scale data while ensuring data governance and compliance. With Amazon DataZone domain units, we are able to organize a vast and growing number of datasets to align with the organizational structure of the customers my teams serve internally. This simplifies data discovery and helps us organize business units’ data in a hierarchical manner for data-driven decision-making at AWS. Amazon DataZone authorization policies coupled with domain units enable a powerful yet flexible way of decentralizing data governance and helps tailor access policies to individual business units. With these features, we are able to reduce the undifferentiated heavy lift while building and managing data products.”
– Arnaud Mauvais, Director of Software Development at AWS.
Domains aligned with data ownership
The term data domain is crucial within the realm of data governance. It signifies a distinct field or classification of data that an organization oversees and regulates. Data domains form a foundational pillar in data governance frameworks. The concept of data domains plays a pivotal role in data governance, empowering organizations to systematically structure, administer, and harness their data assets. This strategic approach aligns data resources with business goals, fostering informed decision-making processes.
You can either define each data domain as a top-level domain or define a top-level data domain (for example, Organization) with several child domain units, such as:
Customer data – This domain unit includes all data related to customers, such as customer profiles. Several other child domain units with policies can be built within customer domain units, such as customer interactions and profiles.
Financial data – This domain unit encompasses data related to financial information.
Human resources data – This domain unit includes employee-related data.
Product data – This domain unit covers data related to products or services offered by the organization.
Authorization policies for domains and domain units
Amazon DataZone domain units provide you with a robust and flexible data governance solution tailored to your organizational structure. These domain units empower individual business lines or teams to establish their own authorization policies, enabling self-service governance over critical actions such as publishing data assets and utilizing compute resources within Amazon DataZone. The authorization policies enabled by domain units allow you to grant granular access rights to users and groups, empowering them to manage domain units, project memberships, and creation of content such as projects, metadata forms, glossaries and custom asset types.
Domain governance authorization policies help organizations maintain data privacy, confidentiality, and integrity by controlling and limiting access to sensitive or critical data. They also support data-driven decision-making by making sure authorized users have appropriate access to the information they need to perform their duties. Similarly, authorization policies can help organizations govern the management of organizational domains, collaboration, and metadata. These policies can help define roles like data governance owner, data product owners, and data stewards.
Additionally, these policies facilitate metadata management, glossary administration, and domain ownership, so data governance practices are aligned with the specific needs and requirements of each business line or team. By using domain units and their associated authorization policies, organizations can decentralize data governance responsibilities while maintaining a consistent and controlled approach to data asset and metadata management. This distributed governance model promotes ownership and accountability within individual business lines, fostering a culture of data stewardship and enabling more agile and responsive data management practices.
Use cases for domain units
Amazon DataZone domain units help customers in various industries securely and efficiently govern their data, collaborate on important data management initiatives, and help in complying with relevant regulations. These capabilities are particularly valuable for customers in industries with strict data privacy and security requirements, such as HCLS, financial services, and the public sector. Amazon DataZone domain units enable you to maintain control over your data while facilitating seamless collaboration and helping you adhere to regulations like Health Insurance Portability and Accountability Act (HIPAA), General Data Protection Regulation (GDPR), and others specific to your industry.
The following are key benefits of Amazon DataZone domain units for HCLS customers:
Secure and compliant data sharing – Amazon DataZone domain units help provide a secure mechanism for you to share sensitive data, such as protected health information (PHI) and personally identifiable information (PII). This helps organizations with regulatory requirements maintain the privacy and security of their data.
Scalable and flexible data management – Amazon DataZone domain units offer a scalable and flexible data management solution that enables you to manage and curate your data, while also enabling efficient data discovery and access.
Streamlined collaboration and governance – The platform provides a centralized and controlled environment for teams to collaborate on data-driven projects. It enables effective data governance, allowing you to define and enforce policies, provide clarity on who has access to data, and maintain control over sensitive information.
Granular authorization policies – Amazon DataZone domain units allow you to define and enforce fine-grained authorization policies, maintain tight control over your data, and streamline data-driven collaboration and governance across your teams.
Solution overview
On the AWS Management Console, the administrator (AWS account user) creates the Amazon DataZone domain. As the creator of the domain, they can choose to add other single sign-on (SSO) and AWS Identity and Access Management (IAM) users as owners to manage the domain. Under the domain, domain units (such as Sales, Marketing, and Finance) can be created to reflect a hierarchy that aligns with the organization’s data ecosystem. Ownership of these domain units can be assigned to business leaders, who may expand a hierarchy representing their data teams and later set policies that enable users and projects to perform specific actions. With the domain structure in place, you can organize your assets under appropriate domain units. The organization of assets to domain units starts with projects being assigned to a domain unit at time of creation and assets then being cataloged within the project. Catalog consumers then browse the domain hierarchy to find assets related to specific business functions. They can also search for assets using a domain unit as a search facet.
Domain units set the foundation for how authorization policies permit users to perform actions in Amazon DataZone, such as who can create and join projects. Amazon DataZone creates a set of managed authorization policies for every domain unit, and domain unit owners create grants within a policy to users and projects.
There are two Amazon DataZone entities that have policies created on them. The first is a domain unit where the owners can decide who may perform actions such as creating domains, projects, joining projects, creating metadata forms, and so on. The policies have an option to cascade the grant down through child domain units. These policies are managed through the Amazon DataZone portal, and their grants can be applied to two principal types:
User-based policies – These policies grant users (IAM, SSO, and SSO groups) permission to perform an action (such as create domain units and projects, join projects, and take ownership of domain units and projects)
Project-based policies – These policies grant a project permission to perform an action (such as create metadata forms, glossaries, or custom asset types)
The second Amazon DataZone entity is a blueprint (defines the tools and services for Amazon DataZone environments), where a data platform user (AWS account user) who owns the Amazon DataZone blueprint can decide which projects use their resources through environment profile creation on the Amazon DataZone portal. There are two approaches to specify which projects can use the blueprint to create an environment profile:
Account users can use domain units as a delegation mechanism to pass the trust of using the blueprint to a business leader (domain unit owner) on the Amazon DataZone portal
Account users can directly grant a specific project permission to use the blueprint
These policies can be managed through the console and Amazon DataZone portal.
The following figure is an example domain structure for the ABC Corp domain. Domain units are created under the ABC Corp domain with domain unit owners assigned. Authorization policies are applied for each domain unit and dictate the actions users and projects can perform.
In the following sections, we walk through the steps to get started with the data management governance capabilities in Amazon DataZone.
Create an Amazon DataZone domain
With Amazon DataZone, administrators log in to the console and create an Amazon DataZone domain. Additional domain unit owners can be added to help manage the domain. For more information, refer to Managing Amazon DataZone domains and user access.
Create domain units to represent your business units
To create a domain unit, complete the following steps:
Log in to the DataZone data portal and choose Domain in toolbar to view your domain units.
As the domain unit owner, choose Create Domain Unit.
Provide your domain unit details (representing different lines of business).
You can create additional domain units in a nested fashion.
For each domain unit, assign owners to manage the domain unit and its authorization policies.
Apply authorization policies so domain units can self-govern
Amazon DataZone managed authorization policies are available for every domain unit, and domain unit owners can grant access through that policy to users and projects. Policies are either user-based (granted to users) or project-based (granted to projects).
On the Authorization Policies tab of a domain unit, grant authorization policies to users or projects permitting them to perform certain actions. For this example, we choose Project creation policy for the Sales domain.
Choose Add Policy Grant to add either select users and groups, all users, or all groups.
With this, a Sales team member can log in to the data portal and create projects under the Sales domain.
Conclusion
In this post, we discussed common approaches to structuring domain units, use cases that customers in the HCLS industry encounter, and how to get started with the new domain units and authorization policies features from Amazon DataZone.
Domain units provide clean separation between data areas, making the discoverability of data efficient for users. Authorization policies, in combination with domain units, provide the governance layer controlling access to the data and provide control over how the data is cataloged. Together, Amazon DataZone domain units and authorization policies make organization and governance possible across your data.
Amazon DataZone domain units and authorization policies are available in all AWS Regions where Amazon DataZone is available. To learn more, refer to Working with domain units.
About the Authors
David Victoria is a Senior Technical Product Manager with Amazon DataZone at AWS. He focuses on improving administration and governance capabilities needed for customers to support their analytics systems. He is passionate about helping customers realize the most value from their data in a secure, governed manner. Outside of work, he enjoys hiking, traveling, and making his newborn baby laugh.
Nora O Sullivan is a Senior Solutions Architect at AWS. She focuses on helping HCLS customers choose the right AWS services for their data and analytics needs so they can derive value from their data. Outside of work, she enjoys golfing and discovering new wines and authors.
Navneet Srivastava, a Principal Specialist and Analytics Strategy Leader, develops strategic plans for building an end-to-end analytical strategy for large biopharma, healthcare, and life sciences organizations. Navneet is responsible for helping life sciences organizations and healthcare companies deploy data governance and analytical applications, electronic medical records, devices, and AI/ML-based applications while educating customers about how to build secure, scalable, and cost-effective AWS solutions. His expertise spans across data analytics, data governance, AI, ML, big data, and healthcare-related technologies.
The last Amazon Prime Day 2024 (July 17-18) was Amazon’s biggest Prime Day shopping event ever, with record sales and more items sold during the two-day event than any previous Prime Day event. Prime members shopped for millions of deals and saved billions across more than 35 categories globally.
I live in South Korea, but luckily I was staying in Seattle to attend the AWS Heroes Summit during Prime Day 2024. I signed up for a Prime membership and used Rufus, my new AI-powered conversational shopping assistant, to search for items quickly and easily. Prime members in the U.S. like me chose to consolidate their deliveries on millions of orders during Prime Day, saving an estimated 10 million trips. This consolidation results in lower carbon emissions on average.
We know from Jeff’s annual blog post that AWS runs the Amazon website and mobile app that makes these short-term, large scale global events feasible. (check out his 2016, 2017, 2019, 2020, 2021, 2022, and 2023 posts for a look back). Today I want to share top numbers from AWS that made my amazing shopping experience possible.
Prime Day 2024 – all the numbers Here are some of the most interesting and/or mind-blowing metrics:
Amazon EC2 – Since many of Amazon.com services such as Rufus and Search use AWS artificial intelligence (AI) chips under the hood, Amazon deployed a cluster of over 80,000 Inferentia and Trainium chips for Prime Day. During Prime Day 2024, Amazon used over 250K AWS Graviton chips to power more than 5,800 distinct Amazon.com services (double that of 2023).
Amazon EBS – In support of Prime Day, Amazon provisioned 264 PiB of Amazon EBS storage in 2024, a 62 percent increase compared to 2023. When compared to the day before Prime Day 2024, Amazon.com performance on Amazon EBS jumped by 5.6 trillion read/write I/O operations during the event, or an increase of 64 percent compared to Prime Day 2023. Also, when compared to the day before Prime Day 2024, Amazon.com transferred an incremental 444 petabytes of data during the event, or an increase of 81 percent compared to Prime Day 2023.
Amazon Aurora – On Prime Day, 6,311 database instances running the PostgreSQL-compatible and MySQL-compatible editions of Amazon Aurora processed more than 376 billion transactions, stored 2,978 terabytes of data, and transferred 913 terabytes of data.
Amazon DynamoDB – DynamoDB powers multiple high-traffic Amazon properties and systems including Alexa, the Amazon.com sites, and all Amazon fulfillment centers. Over the course of Prime Day, these sources made tens of trillions of calls to the DynamoDB API. DynamoDB maintained high availability while delivering single-digit millisecond responses and peaking at 146 million requests per second.
Amazon ElastiCache – ElastiCache served more than quadrillion requests on a single day with a peak of over 1 trillion requests per minute.
Amazon QuickSight – Over the course of Prime Day 2024, one Amazon QuickSight dashboard used by Prime Day teams saw 107K unique hits, 1300+ unique visitors, and delivered over 1.6M queries.
Amazon SageMaker – SageMaker processed more than 145B inference requests during Prime Day.
Amazon Simple Email Service (Amazon SES)– SES sent 30 percent more emails for Amazon.com during Prime Day 2024 vs 2023, delivering 99.23 percent of those emails to customers.
Amazon GuardDuty – During Prime Day 2024, Amazon GuardDuty monitored nearly 6 trillion log events per hour, a 31.9% increase from the previous year’s Prime Day.
AWS CloudTrail – CloudTrail processed over 976 billion events in support of Prime Day 2024.
Amazon CloudFront – CloudFront handled a peak load of over 500 million HTTP requests per minute, for a total of over 1.3 trillion HTTP requests during Prime Day 2024, a 30 percent increase in total requests compared to Prime Day 2023.
Prepare to Scale As Jeff noted in every year, rigorous preparation is key to the success of Prime Day and our other large-scale events. For example, 733 AWS Fault Injection Service experiments were run to test resilience and ensure Amazon.com remains highly available on Prime Day.
If you are preparing for a similar business-critical events, product launches, and migrations, I strongly recommend that you take advantage of newly-branded AWS Countdown, a support program designed for your project lifecycle to assess operational readiness, identify and mitigate risks, and plan capacity, using proven playbooks developed by AWS experts. For example, with additional help from AWS Countdown, Legal Zoom successfully migrated 450 servers with minimal issues and continues to leverage AWS Countdown Premium to streamline and expedite the launch of SaaS applications.
We look forward to seeing what other records will be broken next year!
In today’s data-driven world, seamless integration and transformation of data across diverse sources into actionable insights is paramount. AWS Glue is a serverless data integration service that helps analytics users to discover, prepare, move, and integrate data from multiple sources for analytics, machine learning (ML), and application development. With AWS Glue, you can discover and connect to hundreds of diverse data sources and manage your data in a centralized data catalog. It enables you to visually create, run, and monitor extract, transform, and load (ETL) pipelines to load data into your data lakes.
In this blog post, we explore how to use the SFTP Connector for AWS Glue from the AWS Marketplace to efficiently process data from Secure File Transfer Protocol (SFTP) servers into Amazon Simple Storage Service (Amazon S3), further empowering your data analytics and insights.
Introducing the SFTP connector for AWS Glue
The SFTP connector for AWS Glue simplifies the process of connecting AWS Glue jobs to extract data from SFTP storage and to load data into SFTP storage. This connector provides comprehensive access to SFTP storage, facilitating cloud ETL processes for operational reporting, backup and disaster recovery, data governance, and more.
Solution overview
In this example, you use AWS Glue Studio to connect to an SFTP server, then enrich that data and upload it to Amazon S3. The SFTP connector is used to manage the connection to the SFTP server. You will load the event data from the SFTP site, join it to the venue data stored on Amazon S3, apply transformations, and store the data in Amazon S3. The event and venue files are from the TICKIT dataset.
The TICKIT dataset tracks sales activity for the fictional TICKIT website, where users buy and sell tickets online for sporting events, shows, and concerts. In this dataset, analysts can identify ticket movement over time, success rates for sellers, and best-selling events, venues, and seasons.
For this example, you use AWS Glue Studio to develop a visual ETL pipeline. This pipeline will read data from an SFTP server, perform transformations, and then load the transformed data into Amazon S3. The following diagram illustrates this architecture.
By the end of this post, your visual ETL job will resemble the following screenshot.
Access to an SFTP server with permissions to upload and download data.
If the SFTP server is hosted on Amazon Elastic Compute Cloud (Amazon EC2), we recommend that the network communication between the SFTP server and the AWS Glue job happens within the virtual private cloud (VPC) as pictured in the preceding architecture diagram. Running your Glue job within a VPC and security group will be discussed further in the steps to create the AWS Glue job.
If the SFTP server is hosted within your on-premises network, we recommend that the network communication between the SFTP server and the Glue job happens through VPN or AWS DirectConnect.
Access to an S3 bucket or the permissions to create an S3 bucket. We recommend that you connect to that bucket using a gateway endpoint. This will allow you to connect to your S3 bucket directly from your VPC. If you need to create an S3 bucket to store the results, complete the following steps:
On the Amazon S3 console, choose Buckets in the navigation pane.
Choose Create bucket.
For Name, enter a globally unique name for your bucket; for example, tickit-use1-<accountnumber>.
Choose Create bucket.
For this demonstration, create a folder with the name tickit in your S3 bucket.
Load the allevents_pipe.txt file and venue_pipe.txt file from the TICKIT dataset to your SFTP server.
Store SFTP server sign-in credentials
An AWS Glue connection is a Data Catalog object that stores connection information, such as URI strings and location to credentials that are stored in a Secrets Manager secret.
To store the SFTP server username and password in Secrets Manager, complete the following steps:
On the Secrets Manager console, choose Secrets in the navigation pane.
Choose Store a new secret.
Select Other type of secret.
Enter host as Secret key and your SFTP server’s IP address (for example, 153.47.122) as the Secret value, then choose Add row.
Enter the username as Secret key and your SFTP username as Secret value, then choose Add row.
Enter password as Secret key and your SFTP password as Secret value, then choose Add row.
Enter keyS3Uri as Secret Key and the Amazon S3 location of your SFTP secret key file as Secret value
Note: Secret Value is the full S3 path where the SFTP server key file is stored. For example:s3://sftp-bucket-johndoe123/id_rsa.
For Secret name, enter a descriptive name, then choose Next.
Choose Next to move to the review step, then choose Store.
Create a connection to the SFTP server in AWS Glue
Complete the following steps to create your connection to the SFTP server.
On the AWS Glue console, under Data Catalog in the navigation pane, choose Connections.
Select the SFTP connector for AWS Glue 4.0. Then choose Create connection.
Enter a name for the connection and then, under Connection access, choose the Secrets Manager secret you created for you SFTP server credentials.
Create a connection to the VPC in AWS Glue
A data connection is used to establish network connectivity between the VPC and the AWS Glue job. To create the VPC connection, complete the following steps.
On the AWS Glue console page, click on Data Connections location on the left side menu.
Click the Create connection button in the Connections panel.
Select Network
Select the VPC, Subnet, and Security Group that your SFTP server resides in. Click Next.
Name the connection SFTP VPC Connect and then click
Deploy the solution
Now that we completed the prerequisites, we are going to setup the AWS Glue Studio job for this solution. We will create a glue studio job, add events and venue data from the SFTP server, carry out data transformations and load transformed data to s3.
Create your AWS Glue Studio job:
On the AWS Glue console, under ETL Jobs in the navigation pane, choose Visual ETL.
Select Visual ETL in the central pane.
Choose the pencil icon to enter a name for your job.
Choose the Job details tab.
Scroll down to and select Advanced properties and expand.
Scroll to Connections and select SFTP VPC Connect.
Choose Visual to go back to the workflow editor page.
Add the events data from the SFTP server as your first data set:
Choose Add nodes and select SFTP Connector for AWS Glue 4.0 on the Sources
Enter the following for Data source properties for:
Connection: Select the connection to the SFTP server that you created in Create the connection to the SFTP server in AWS Glue.
Enter the following key-value pairs:
Key
Value
header
false
path
/files (this should be the path to the event file in your SFTP server)
fileFormat
csv
delimiter
|
Rename the columns of the Event dataset:
Choose Add nodes and choose Change Schema on the Transforms
Enter the following transform properties:
For Name, enter Rename Event data.
For Node parents, select SFTP Connector for AWS Glue 4.0.
In the Change Schema section, map the source keys to the target keys:
col0: eventid
col1: e_venueid
col2: catid
col3: dateid
col4: eventname
col5: starttime
Add the venue_pipe.txt file from the SFTP site:
Choose Add nodes and choose SFTP Connector for AWS Glue 4.0 on the Sources
Enter the following for Data source properties for:
Connection: Select the connection to the SFTP server that you created in Create the connection to the SFTP server in AWS Glue.
Enter the following key-value pairs:
Key
Value
header
false
path
/files (this should be the path to the venue file in your SFTP site)
fileFormat
csv
delimiter
|
Rename the columns of the venue dataset:
Choose Add nodes and choose Change Schema on the Transforms
Enter the following transform properties:
For Name, enter Rename Venue data.
For Node parents, select Venue.
In the Change Schema section, map the source keys to the target keys:
col0: venueid
col1: venuename
col2: venuecity
col3: venuestate
col4: venueseats
Join the venue and event datasets.
Choose Add nodes and choose Join on the Transforms
Enter the following transform properties:
For Name, enter Join.
For Node parents, select Rename Venue data and Rename Event data.
For Join type¸ select Inner join.
For Join conditions, select venueid for Rename Venue data and e_venueid for Rename Event data.
Drop the duplicate field:
Choose Add nodes and choose Drop Fields on the Transforms
Enter the following transform properties:
For Name, enter Drop Fields.
For Node parents, select Join.
In the DropFields section, select e_venueid.
Load the data into your S3 bucket:
Choose Add nodes and choose Amazon S3 from the Sources
Enter the following transform properties:
For Node parents, select Drop Fields.
For Format, select CSV.
For Compression Type, select None.
For S3 Target Location, choose your S3 bucket and enter your desired file name followed by a slash (/).
You can now save and run your AWS Glue visual ETL Job. Run the job and then go to the Runs tab to monitor its progress. After the job has completed, the Run status will change to Succeeded. The data will be in the target S3 bucket.
Clean up
To avoid incurring additional charges caused by resources created as part of this post, make sure you delete the items created in the AWS Account for this post:
Delete the Secrets Manager key created for the SFTP connector . credentials.
Delete the SFTP connector.
Unsubscribe from the SFTP Connector in AWS Marketplace.
Delete the data loaded to the Amazon S3 bucket and the bucket.
Delete the AWS Glue visual ETL job.
Conclusion
In this blog post, we demonstrated how to use the SFTP connector for AWS Glue to streamline the processing of data from SFTP servers into Amazon S3. This integration plays a pivotal role in enhancing your data analytics capabilities by offering an efficient and straightforward method to bring together disparate data sources. Whether your goal is to analyze SFTP server data for actionable insights, bolster your reporting mechanisms, or enrich your business intelligence tools, this connector ensures a more streamlined and cost-effective approach to achieving your data objectives.
Sean Bjurstrom is a Technical Account Manager in ISV accounts at Amazon Web Services, where he specializes in Analytics technologies and draws on his background in consulting to support customers on their analytics and cloud journeys. Sean is passionate about helping businesses harness the power of data to drive innovation and growth. Outside of work, he enjoys running and has participated in several marathons.
Seun Akinyosoye is a Sr. Technical Account Manager supporting public sector customer at Amazon Web Services. Seun has a background in analytics, data engineering which he uses to help customers achieve their outcomes and goals. Outside of work Seun enjoys spending time with his family, reading, traveling and supporting his favorite sports teams.
Vinod Jayendra is a Enterprise Support Lead in ISV accounts at Amazon Web Services, where he helps customers in solving their architectural, operational, and cost optimization challenges. With a particular focus on Serverless technologies, he draws from his extensive background in application development to deliver top-tier solutions. Beyond work, he finds joy in quality family time, embarking on biking adventures, and coaching youth sports team.
Kamen Sharlandjiev is a Sr. Big Data and ETL Solutions Architect, MWAA and AWS Glue ETL expert. He’s on a mission to make life easier for customers who are facing complex data integration and orchestration challenges. His secret weapon? Fully managed AWS services that can get the job done with minimal effort. Follow Kamen on LinkedIn to keep up to date with the latest MWAA and AWS Glue features and news!
Chris Scull is a Solutions Architect dealing in orchestration tools and modern cloud technologies. With two years of experience at AWS, Chris has developed an interest in Amazon Managed Workflows for Apache Airflow, which allows for efficient data processing and workflow management. Additionally, he is passionate about exploring the capabilities of GenAI with Bedrock, a platform for building generative AI applications on AWS.
Shengjie Luo is a Big data architect of Amazon Cloud Technology professional service team. Responsible for solutions consulting, architecture and delivery of AWS based data warehouse and data lake, and good at server-less computing, data migration, cloud data integration, data warehouse planning, data service architecture design and implementation.
Qiushuang Feng is a Solutions Architect at AWS, responsible for Enterprise customers’ technical architecture design, consulting, and design optimization on AWS Cloud services. Before joining AWS, Qiushuang worked in IT companies such as IBM and Oracle, and accumulated rich practical experience in development and analytics.
In today’s rapidly evolving landscape, where AI is reshaping industries and transforming workflows, the role of developers has never been more critical. As business leaders, fostering an environment where developers feel valued, motivated, and empowered is essential to harnessing their full potential and keeping your business profitable and innovative.
In this blog post, we’ll explore actionable tips and strategies to supercharge developer happiness, ensuring your team remains productive, engaged, and ahead of the AI curve. We’ll walk you through ways to secure your code with AI, how to increase productivity with a strong developer experience, and, of course, invite you to join us at GitHub Universe 2024 to see the very best of the latest AI tooling in action.
Boost productivity with a great developer experience
Developer experience is more than just a buzzword—it’s a critical factor in driving productivity and collaboration within software development teams. A seamless developer experience allows developers to get into the flow state more easily, where their productivity and creativity can peak. This flow state—characterized by uninterrupted concentration and a deep sense of involvement in the task—is crucial for tackling complex coding challenges.
This work environment needs to be built intentionally, and the research backs it up. Developers who carve out time for deep work enjoy 50% more productivity, while those that get work they find engaging are 30% more productive.
How does this impact businesses? Well, because a developer that can significantly reduce their context-switching and mental load can also produce code faster and at a higher quality.
When developers understand their code, they’re 42% more productive. When developers are able to get faster turnaround times, they are 20% more innovative. These are tangible, individual benefits that in turn directly impact the output of developer teams.
Now is the time for leaders to invest in creating a great developer experience. By prioritizing the developer experience, you’re setting your team up to harness the full potential of the latest AI and platform engineering advances, ensuring your business stays ahead of the curve. Curious to learn more? Then dive into how a great developer experience fuels productivity with our latest research.
Use AI to secure your code
Historically, developers and security teams have found themselves at odds due to competing business goals. Shifting security left incorporates security earlier in the software development lifecycle, but in practice it has primarily shifted responsibility to developers without necessarily giving them the required expertise.
This, combined with the context switching inherent in development work, makes addressing security concerns particularly challenging. With AI, developers now have powerful tools at their disposal to enhance code security. AI can:
Improve detection rates
Provide near-instant fixes with context
Enable application security (AppSec) at scale
These three improvements make it easier for developers to integrate robust security measures without sacrificing productivity, and transform the relationship between developers and security teams into a collaborative partnership.
Introducing a new security tool doesn’t have to be a daunting task either. By following a few simple steps, organizations can ensure a smooth transition and broad adoption.
Document the tool’s features and usage to set the foundation and set realistic expectations to help align goals across teams.
Recognize and celebrate successes to showcase the value of the new tool.
Adopt a go-with-the-flow approach and organize hackathons to further drive engagement and interest.
Listen to developer feedback continuously improve and refine security practices.
AI-powered security tools not only enhance the efficiency and effectiveness of AppSec, but also empower developers to take a proactive role in securing their code. This shift not only improves overall security posture, but also fosters a culture of shared responsibility and continuous learning, ultimately leading to more secure and resilient applications.
See exactly why security should be built into the developer workflow. 👇
Customize your LLMs
Organizations that take AI a step further and customize their AI tools are poised to lead the pack.
Large language models (LLMs) are trained on vast amounts of text data and can perform a variety of natural language processing tasks like translation, summarization, question-answering, and text generation. Customizing a pre-trained LLM goes beyond mere training—it involves adapting the model to perform specific tasks relevant to the organization’s needs. This level of customization helps developers maintain their flow state and significantly boost productivity and efficiency.
Customization techniques like retrieval-augmented generation (RAG), in-context learning, and fine-tuning enable LLMs to deliver more accurate and contextually appropriate responses:
RAG combines retrieval-based and generation-based approaches in natural language processing. It enhances LLMs by integrating information retrieval techniques, where relevant documents or snippets are retrieved from a vector database to assist in generating more accurate and contextually appropriate responses. This approach allows the model to access and utilize external knowledge, making the generated output more informed and relevant to the user’s query.
In-context learning refers to a model’s ability to adapt and respond to new tasks or inputs based on the context provided in the input prompt without requiring additional training. The model leverages its pre-trained knowledge and the context given in the input to perform tasks effectively.
Fine-tuning, on the other hand, is a process in which an LLM is further trained on a specific dataset to adapt it to a particular task or domain. During fine-tuning, the model’s parameters are adjusted based on the new dataset, which typically involves supervised learning with labeled data. This process allows the model to specialize and improve its performance on specific tasks, (such as text classification, question answering, or machine translation), by leveraging the general knowledge acquired during its initial pre-training phase.
By implementing these customization strategies, businesses can unlock the full potential of their AI tools. Customized LLMs not only improve developer productivity—they also enhance the quality and relevance of AI-generated content.
Fostering collaboration doesn’t just make software development faster, it also helps teams build better products and boost job satisfaction. By making your repository as collaborative as possible, you’ll optimize success. This includes focusing on:
Repository settings: properly configuring repository settings to control visibility, access, and contribution workflows lays the foundation for collaboration.
Repository contents: including essential files like README.md, LICENSE.md, CONTRIBUTING.md, CODEOWNERS, and CODE_OF_CONDUCT.md helps collaborators understand the project, its purpose, and how to contribute.
Automation and checks: implementing automation tools such as linters, continuous integration (CI), and continuous deployment (CD) pipelines streamlines the development process, ensures code quality, and enables immediate feedback.
Security practices: enforcing role-based access control, managing secrets securely, and scanning code for vulnerabilities can foster trust and protect the project from vulnerabilities.
Issue templates: providing structured issue templates guides contributors in providing necessary information and context when reporting bugs.
Community engagement: engaging with the project’s community through meetups, project blogs, discussions, and other channels fosters belonging and builds relationships.
Invest in your team’s learning opportunities
When you signal to your team that you value their career growth and exposure to learning opportunities, it can boost happiness and job satisfaction, leading to increased productivity, collaboration, and better problem solving.
Encouraging your developer teams to attend conferences like GitHub Universe 2024 is a strategic investment in their professional growth and your business’ success. Our global developer event provides an unparalleled platform for the best in software development to gather and expand their knowledge, stay updated on the latest AI-powered tools, and bring fresh ideas back to their teams.
Here are a few highlights of what you and your team can expect:
Help your developers get in the flow and stay there with sessions, demos, panels, and more on the powerful tools and techniques that enhance productivity and satisfaction.
Connect with other technical leaders to share experiences, challenges, and best practices. Expand your network with valuable industry contacts.
Get a first look at GitHub’s product roadmap and see how upcoming features and enhancements can help you stay ahead in a competitive landscape.
Gain technical skills with GitHub certifications and workshops designed to enhance your expertise in a rapidly evolving industry.
Learn the latest on GitHub Copilot and stay ahead with the latest coding practices and techniques.
Get your tickets today. You can take advantage of our group discount and get four tickets for the price of three. (That’s a 25% savings!)
If you’re flying solo, you can also use our Early Bird discount and save 20% off one in-person ticket, only until September 3.
Reach new levels of creativity and efficiency
Incorporating these five business strategies can transform your development process and increase developer happiness. By investing in these areas, you empower your team, foster a culture of continuous learning, and position your organization for success in the rapidly evolving tech landscape.
The
PostgreSQL project has
released beta
versions of PostgreSQL 17 containing several interesting security and usability
improvements, alongside the usual performance improvements and bug fixes. If the
release proceeds according to the usual timeline, the full release of version 17
is expected in September or October.
The most important changes are in what PostgreSQL does when a database
supervisor has their credentials revoked, and added
support for incremental database backups.
Lix, the fork of Nix that LWN covered in July, has made its second release since forking. This one includes substantial changes to the backend code, including removing a dependency on Bison, and getting a change to the Nix language back upstream.
The general theme of Lix 2.91 is to perform another wave of
refactorings and design improvements in preparation for our evolution
plans.
Nevertheless, there are a few exciting user facing changes[.]
The collective thoughts of the interwebz
Manage Consent
To provide the best experiences, we use technologies like cookies to store and/or access device information. Consenting to these technologies will allow us to process data such as browsing behavior or unique IDs on this site. Not consenting or withdrawing consent, may adversely affect certain features and functions.
Functional
Always active
The technical storage or access is strictly necessary for the legitimate purpose of enabling the use of a specific service explicitly requested by the subscriber or user, or for the sole purpose of carrying out the transmission of a communication over an electronic communications network.
Preferences
The technical storage or access is necessary for the legitimate purpose of storing preferences that are not requested by the subscriber or user.
Statistics
The technical storage or access that is used exclusively for statistical purposes.The technical storage or access that is used exclusively for anonymous statistical purposes. Without a subpoena, voluntary compliance on the part of your Internet Service Provider, or additional records from a third party, information stored or retrieved for this purpose alone cannot usually be used to identify you.
Marketing
The technical storage or access is required to create user profiles to send advertising, or to track the user on a website or across several websites for similar marketing purposes.



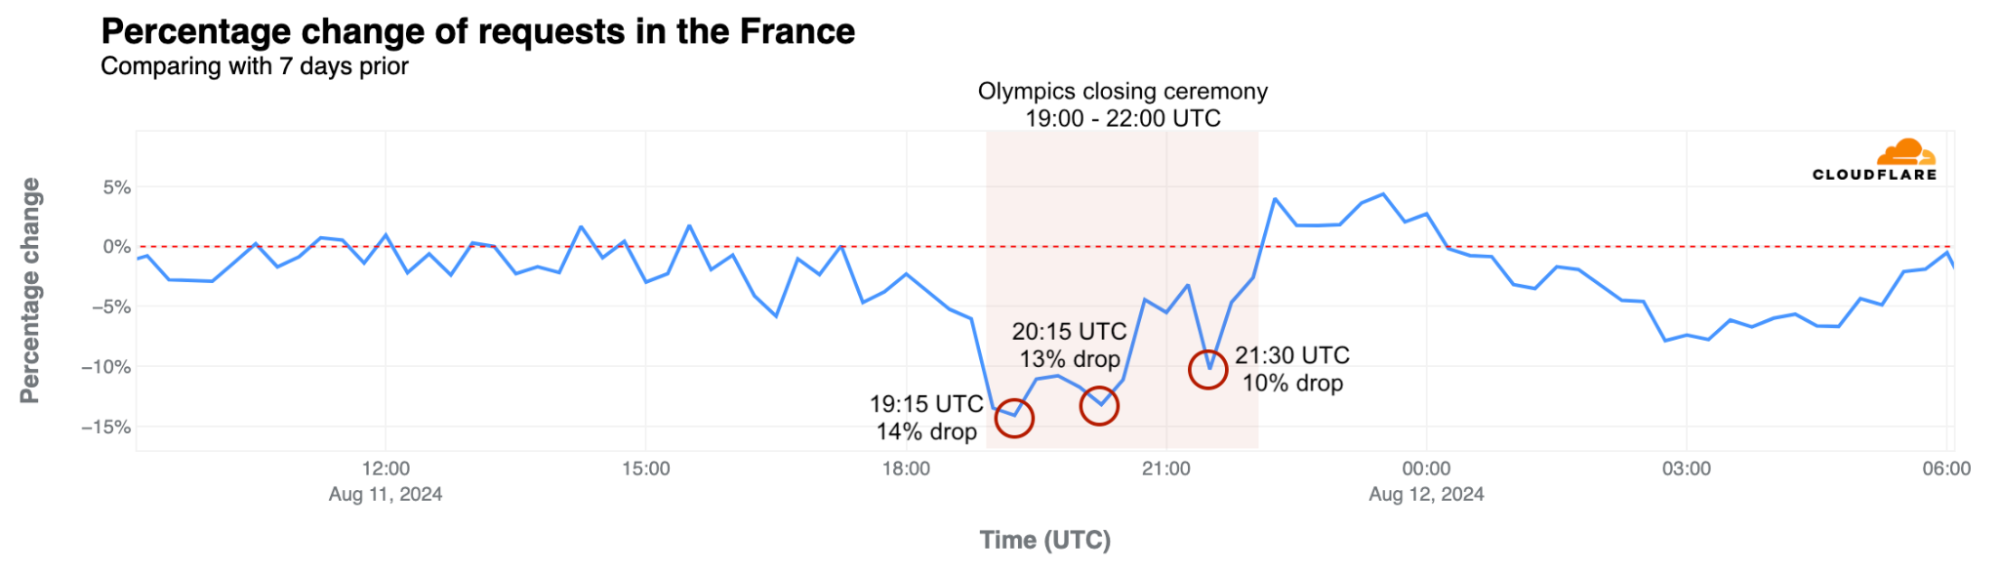
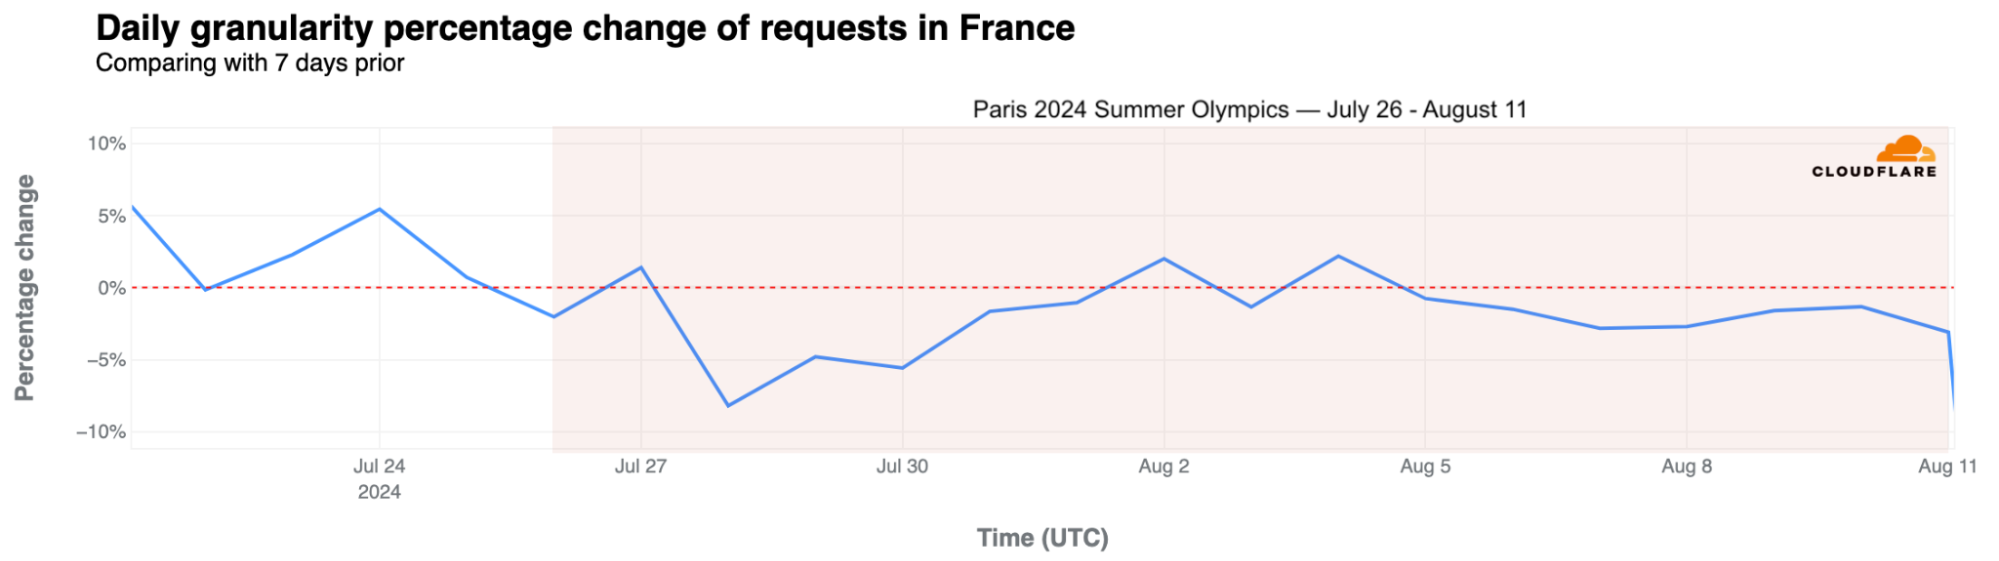
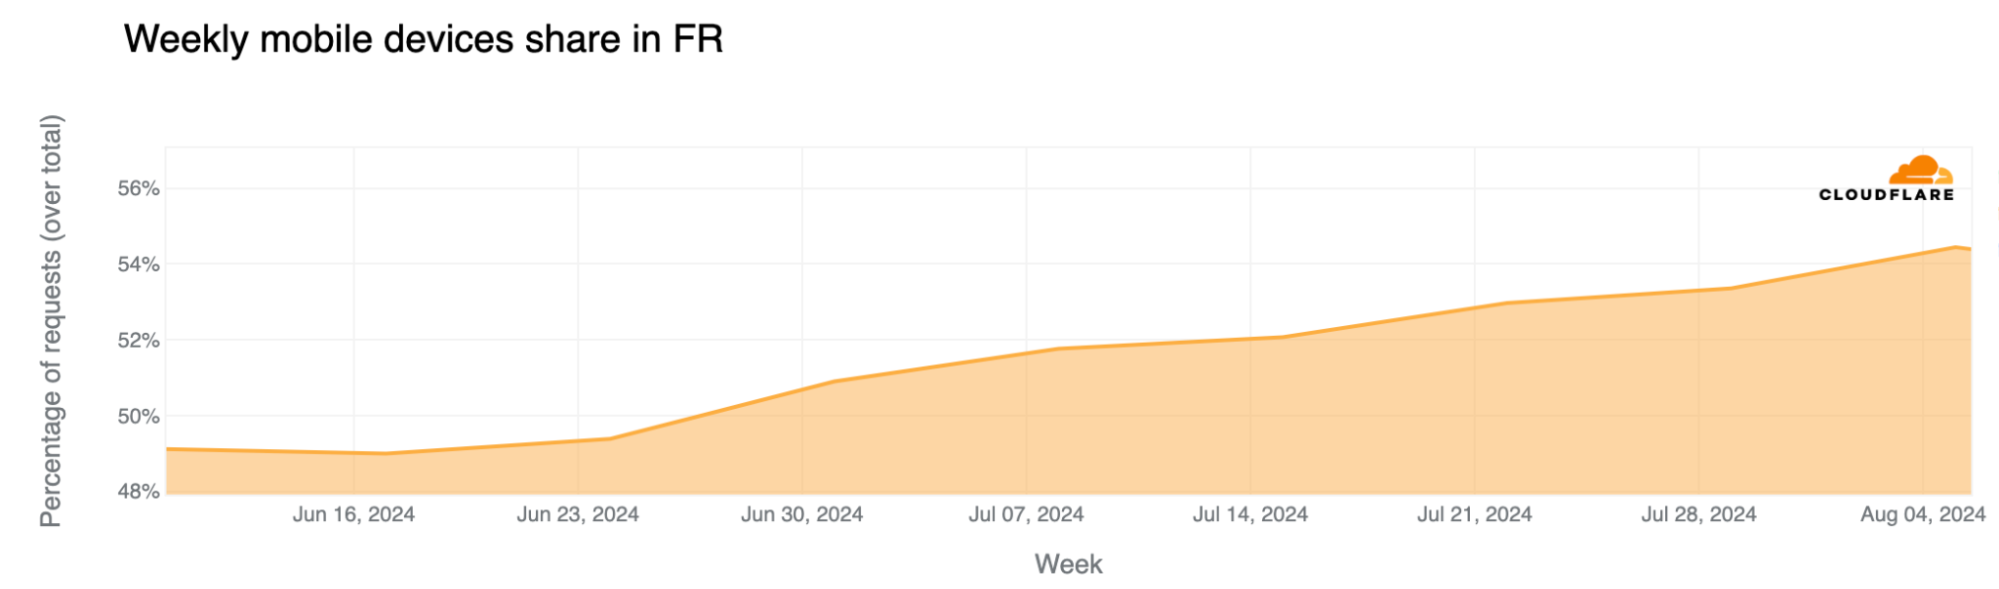
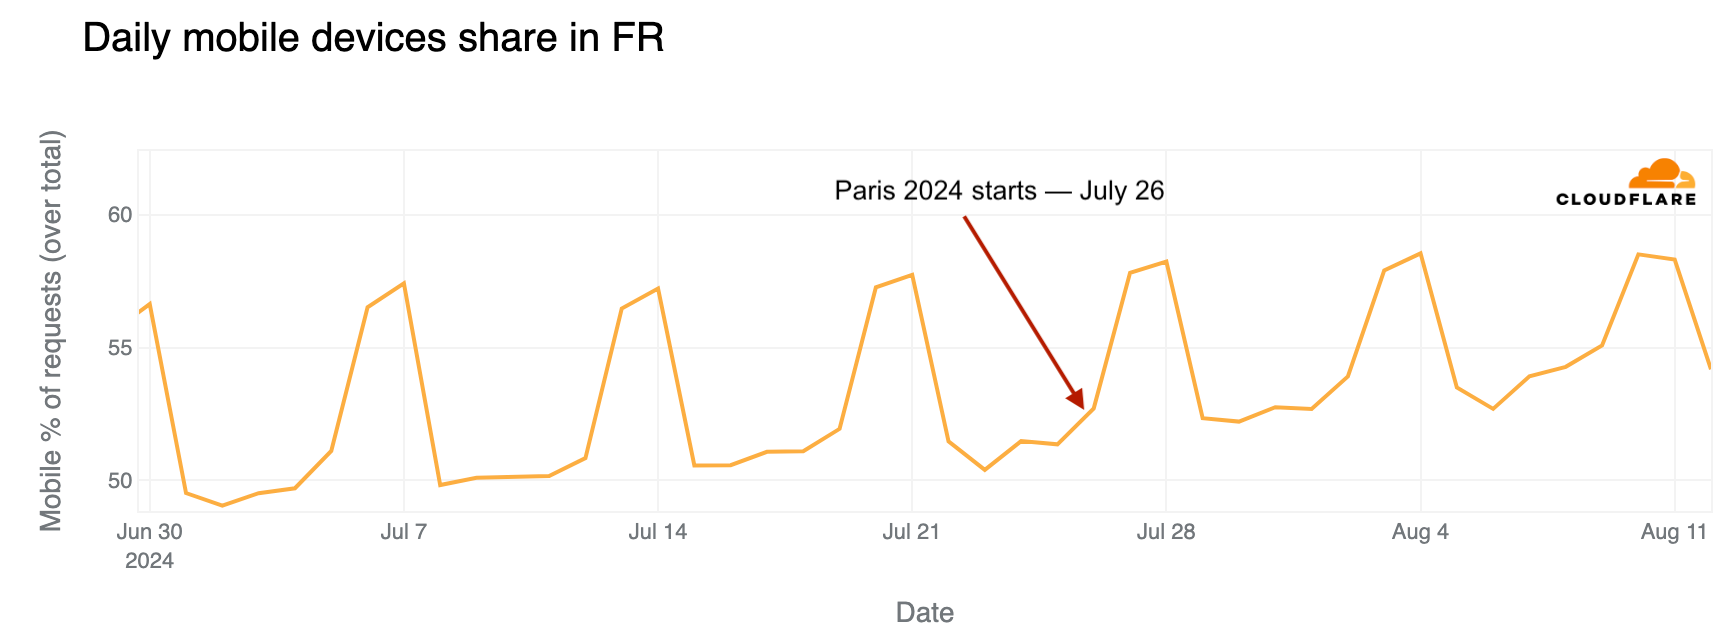
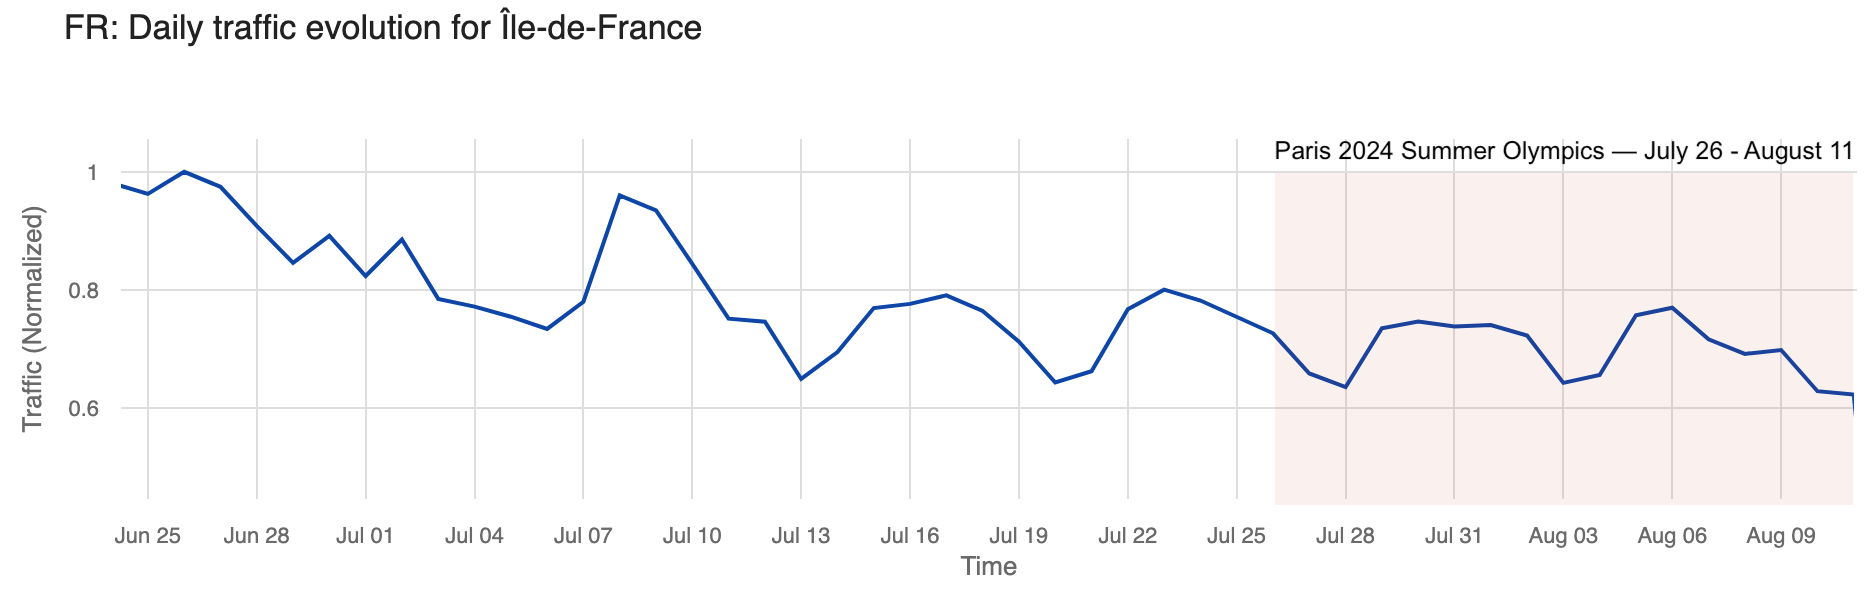
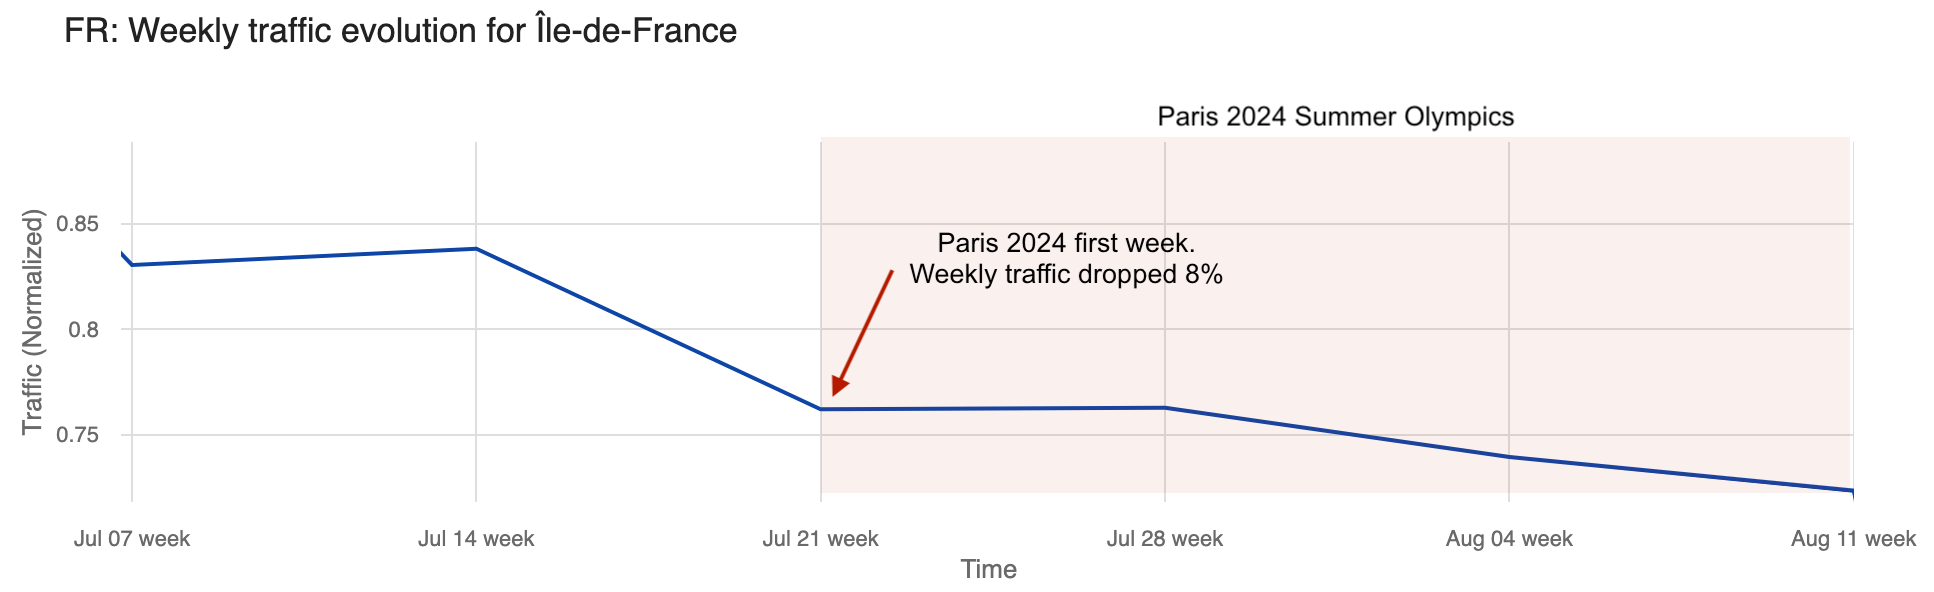
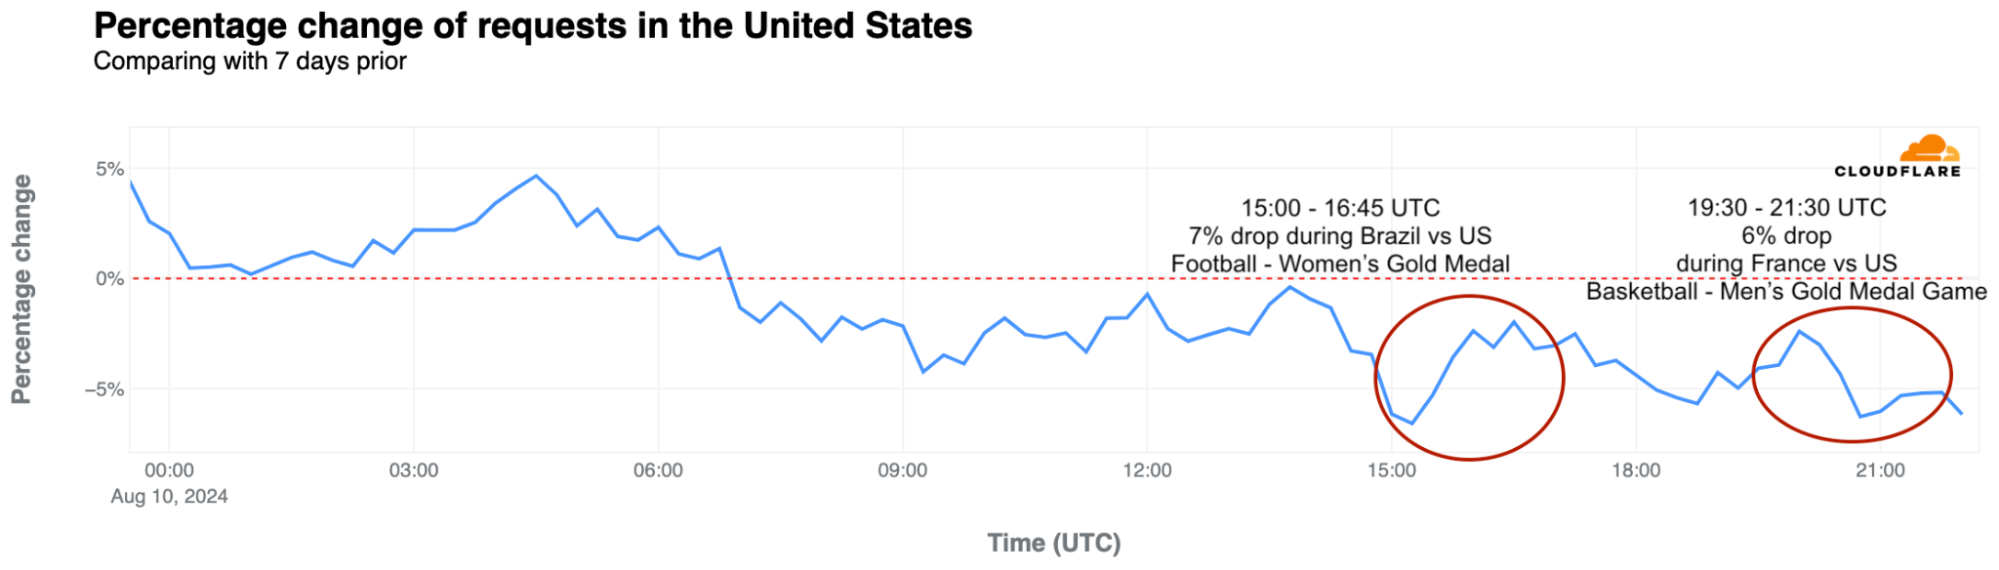
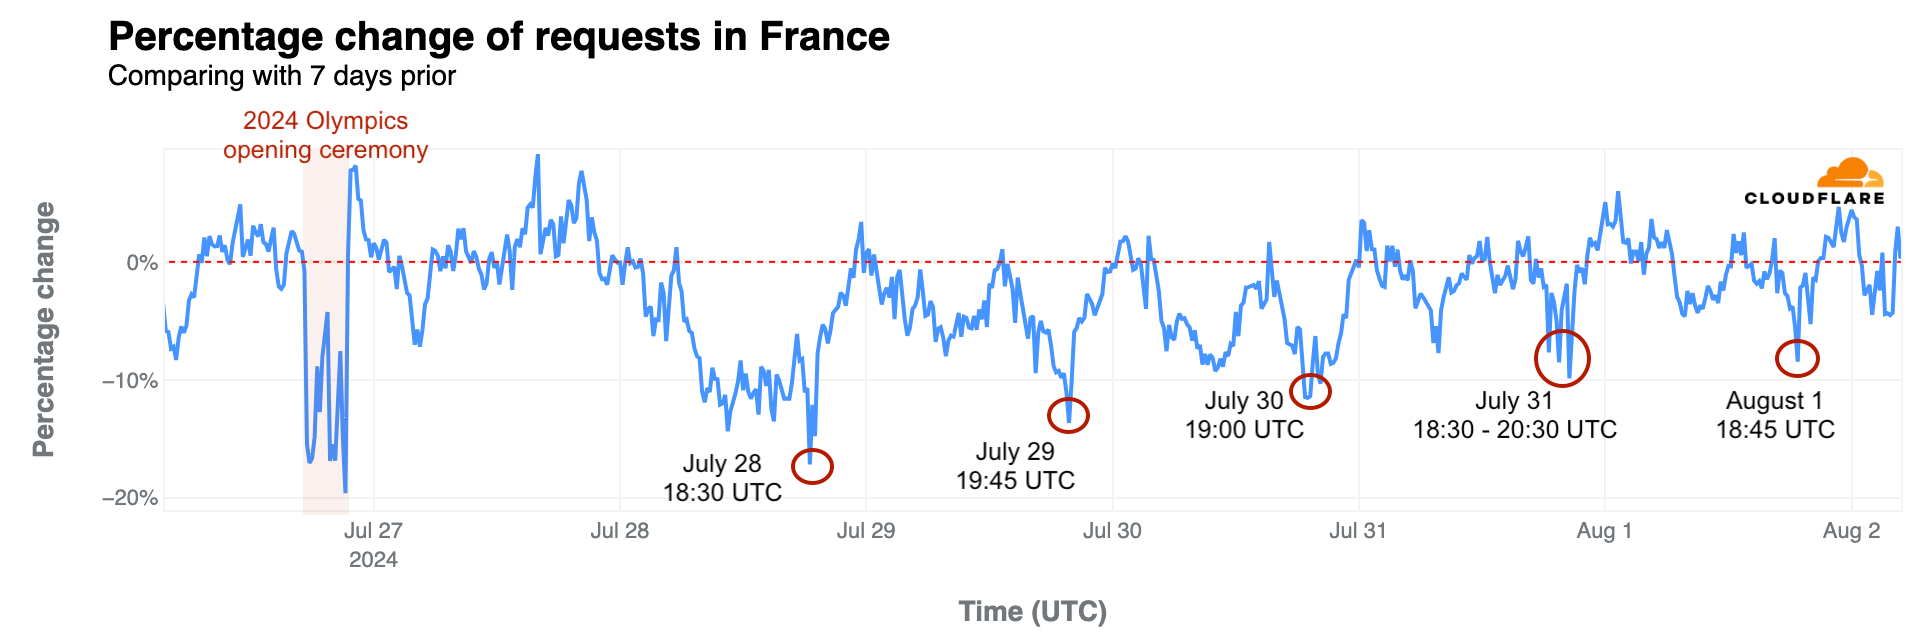
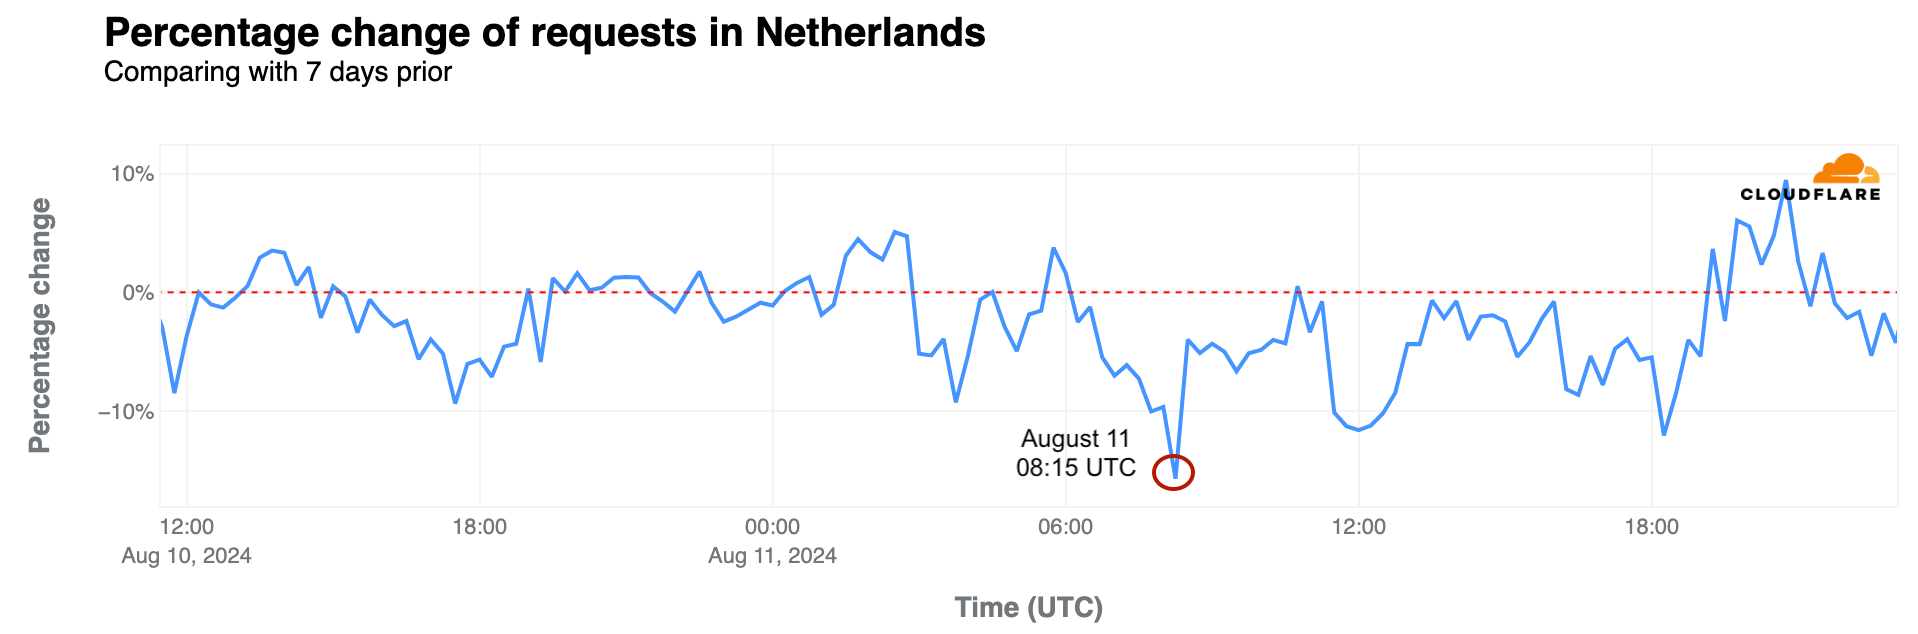
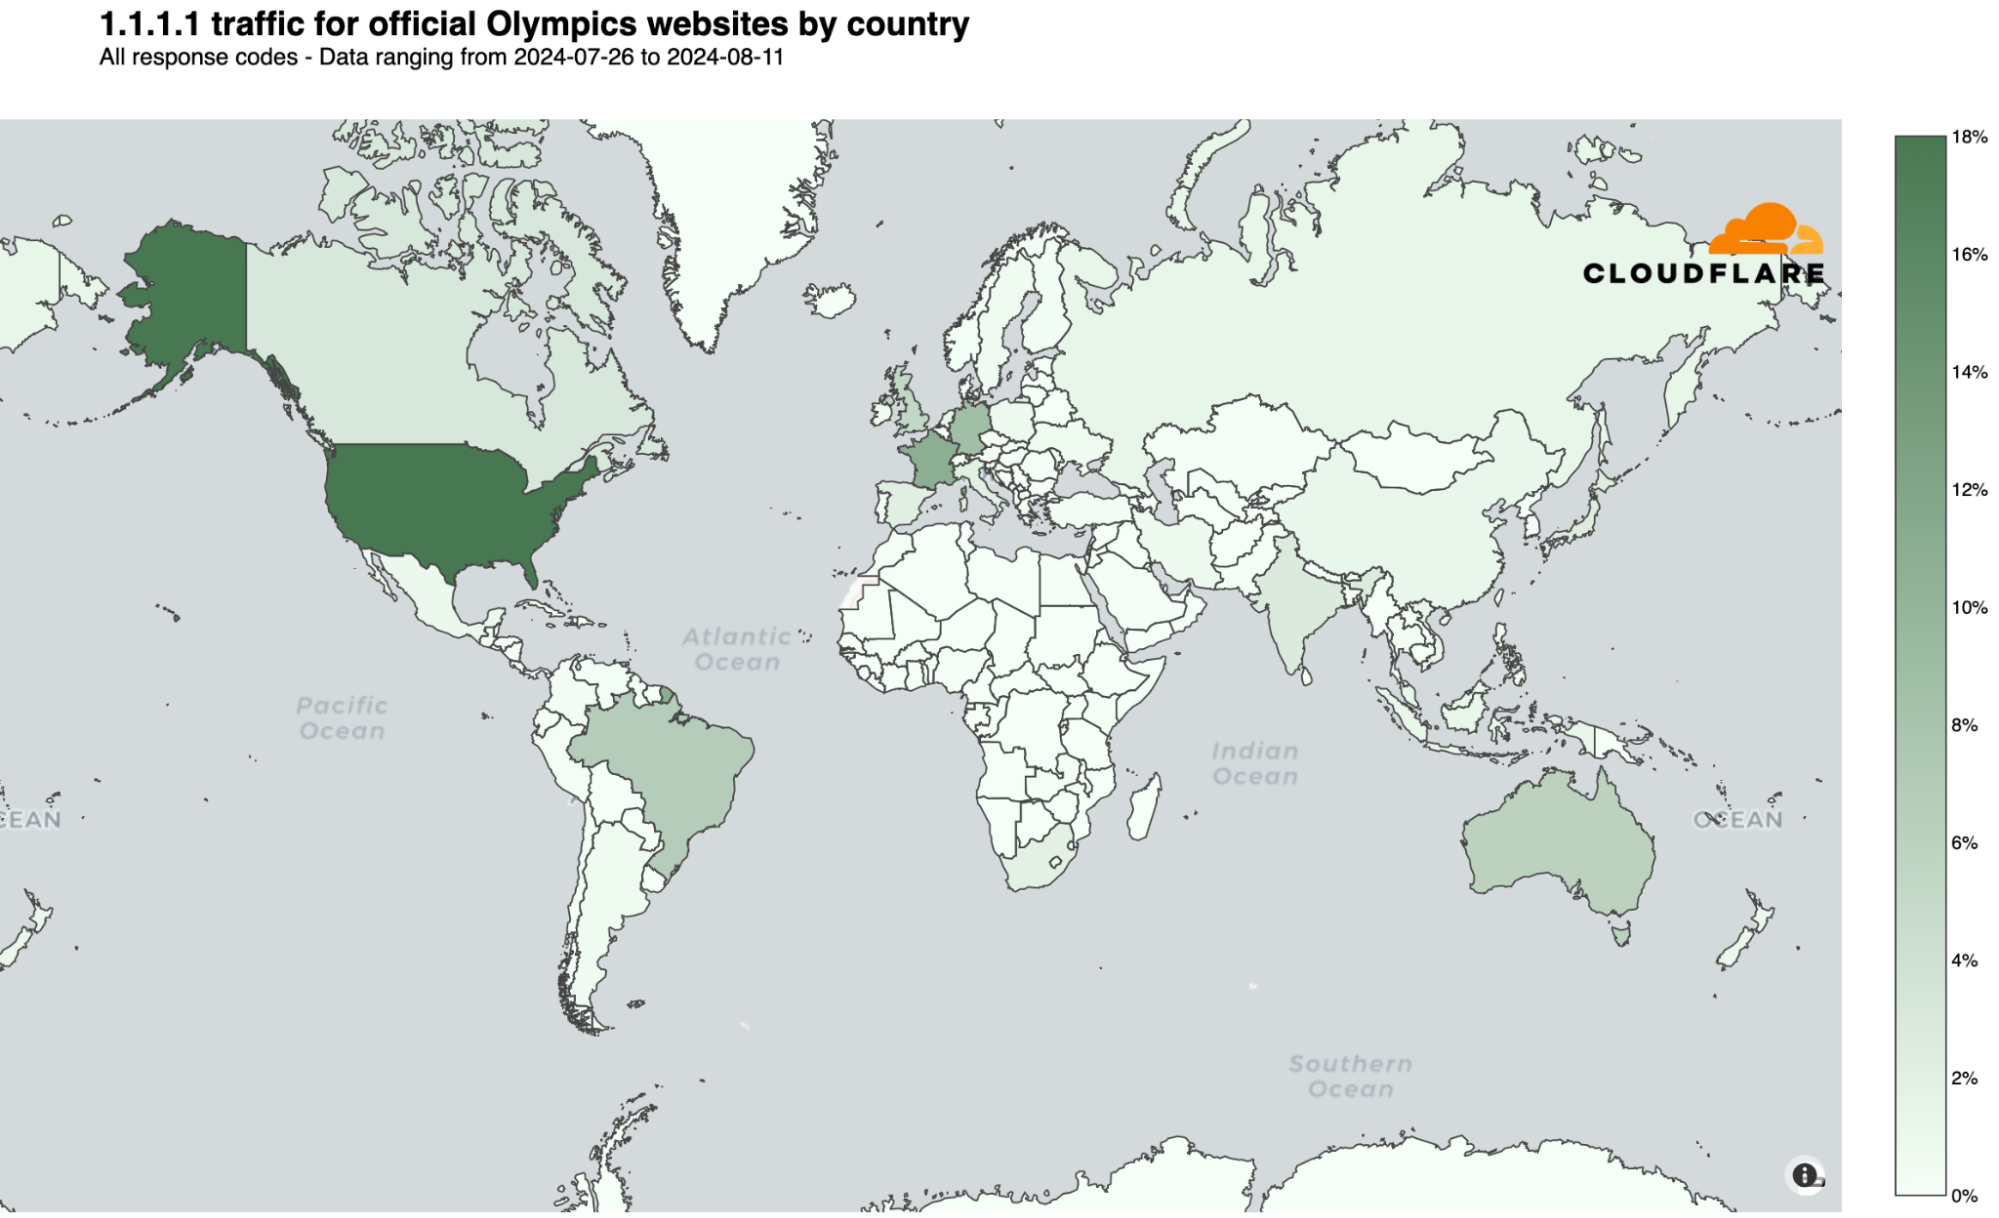
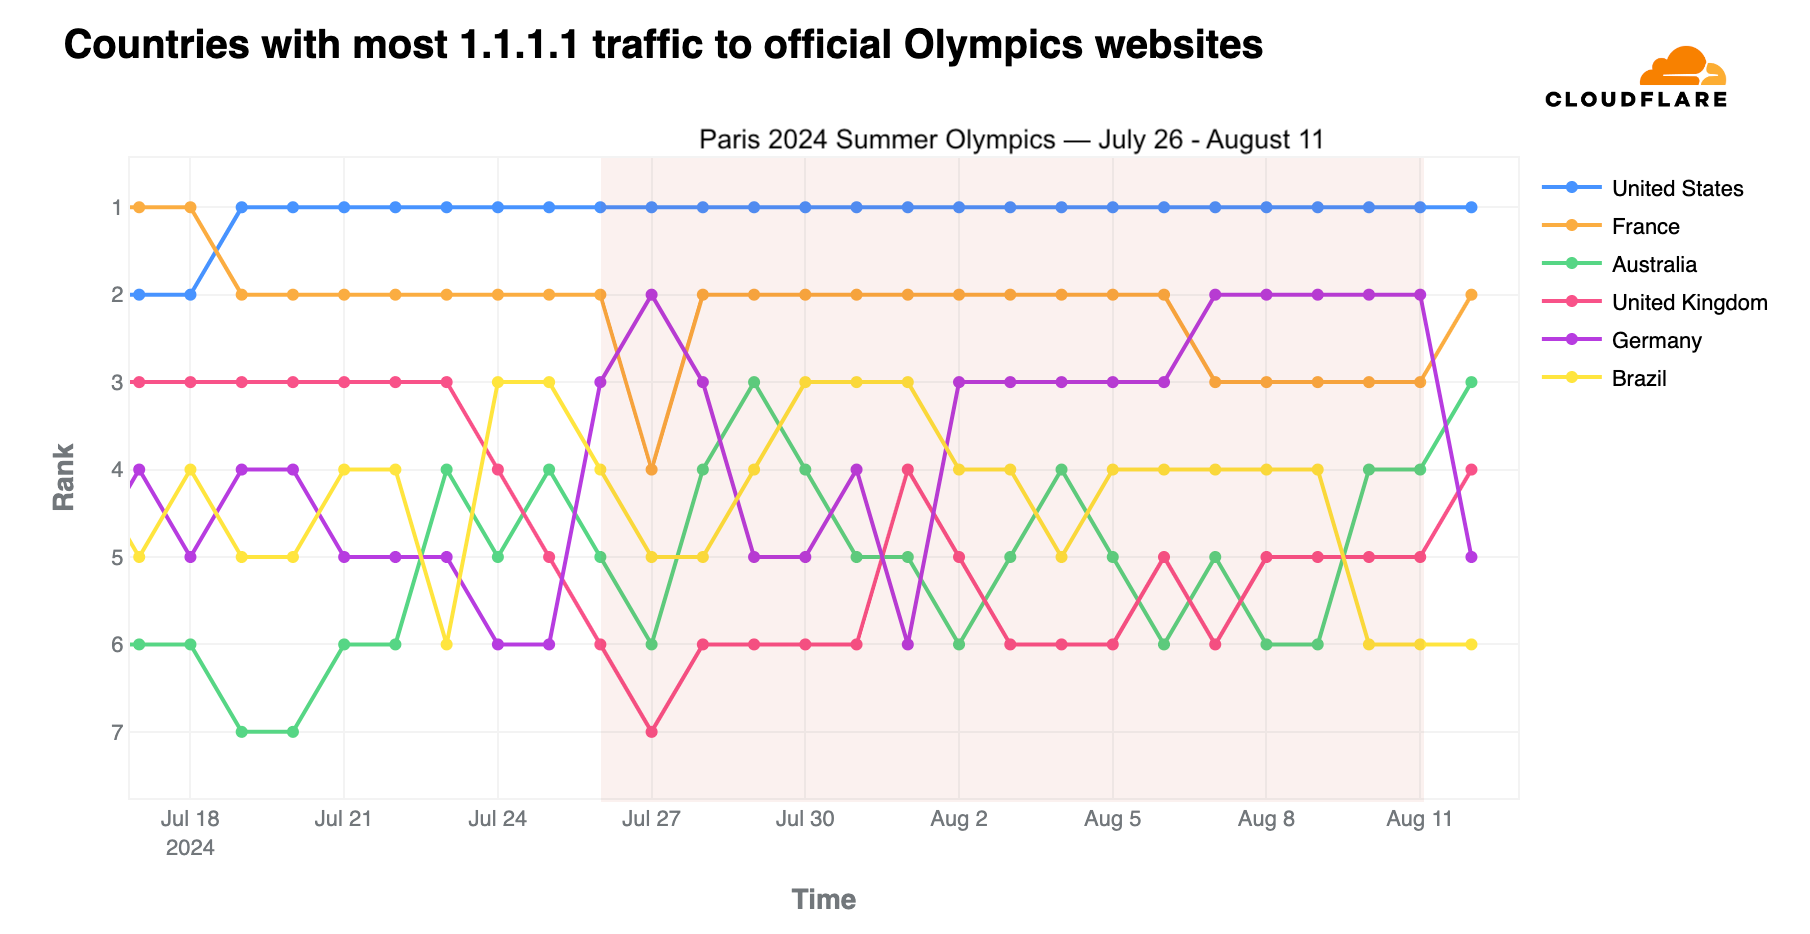
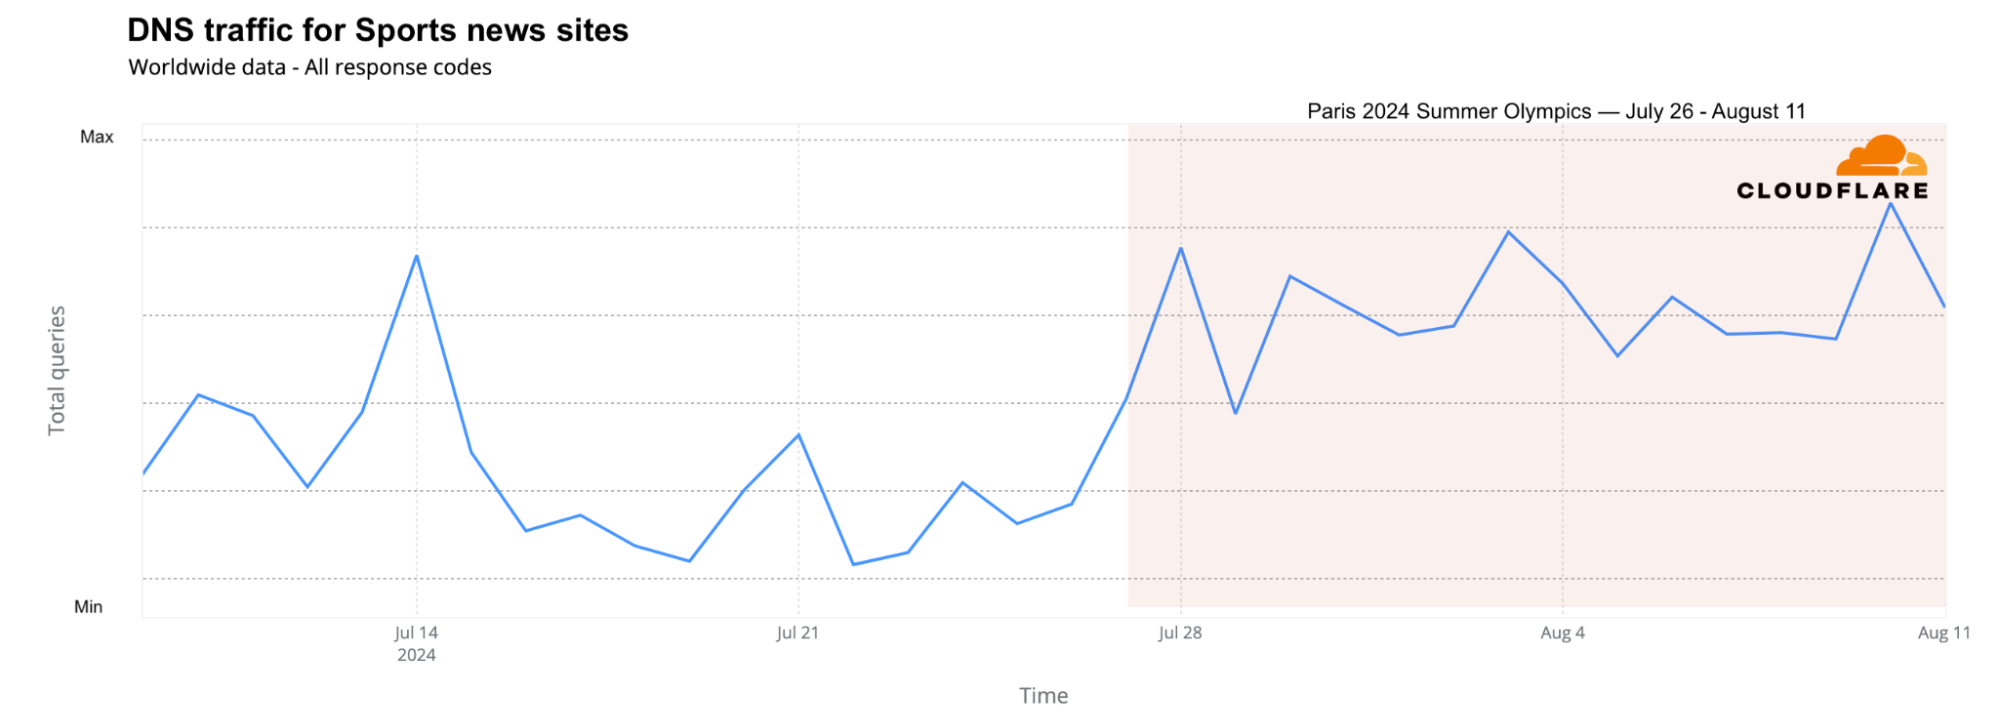
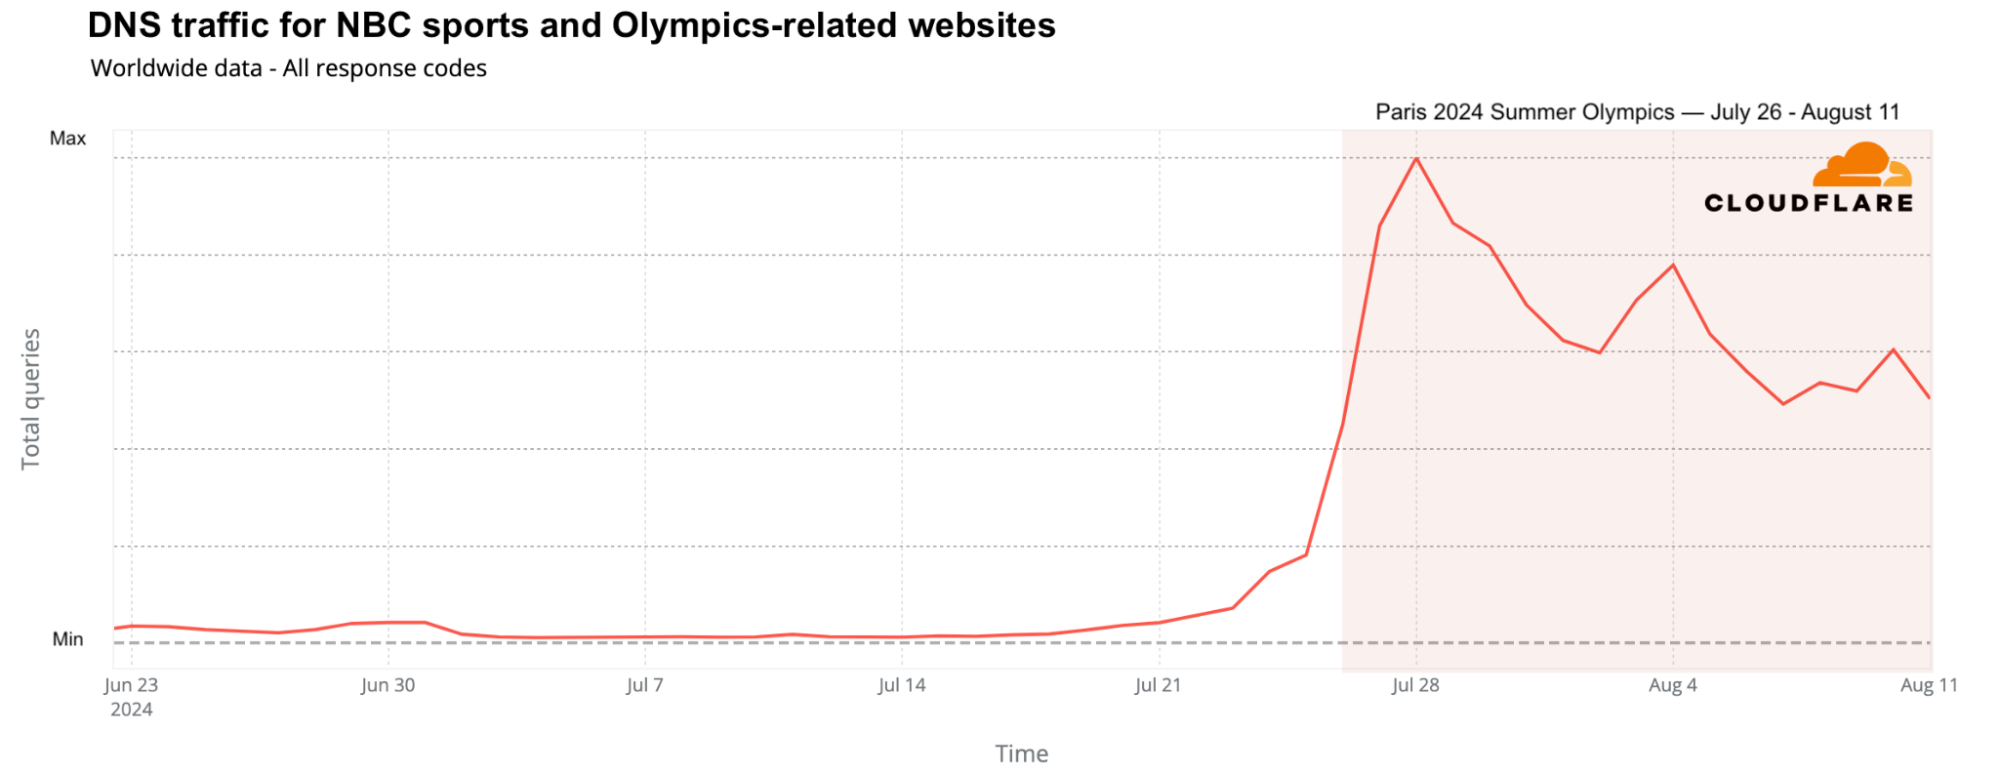
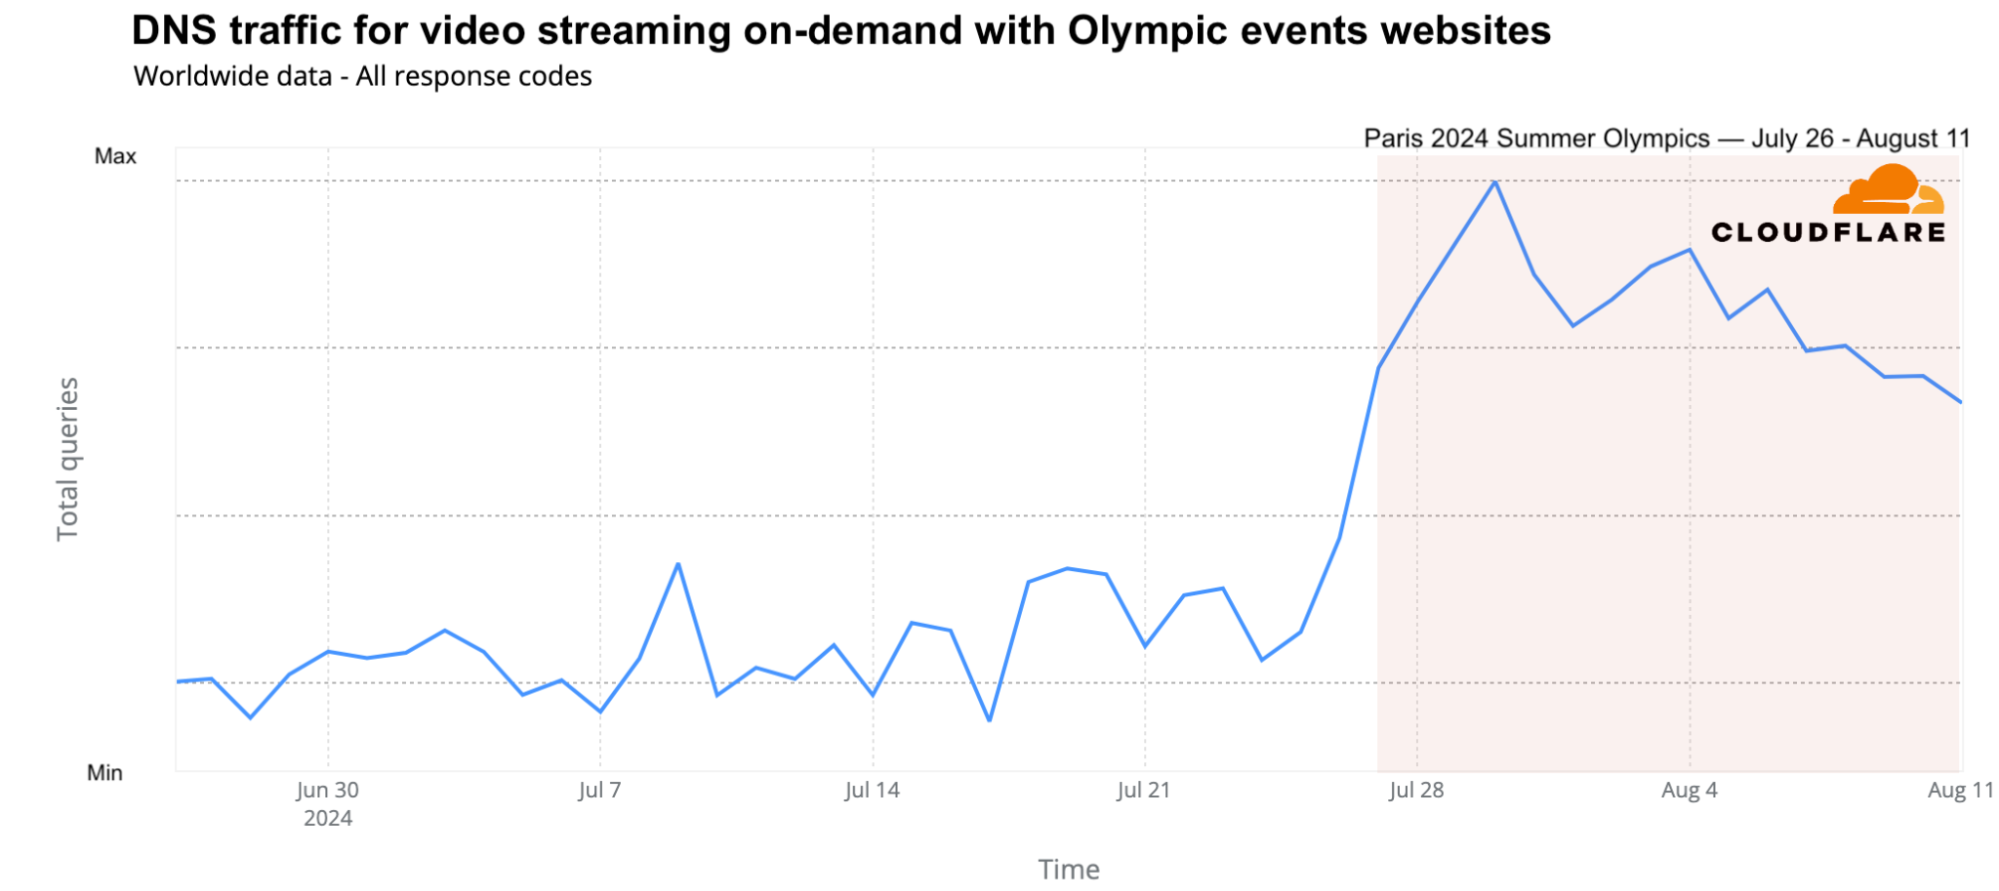
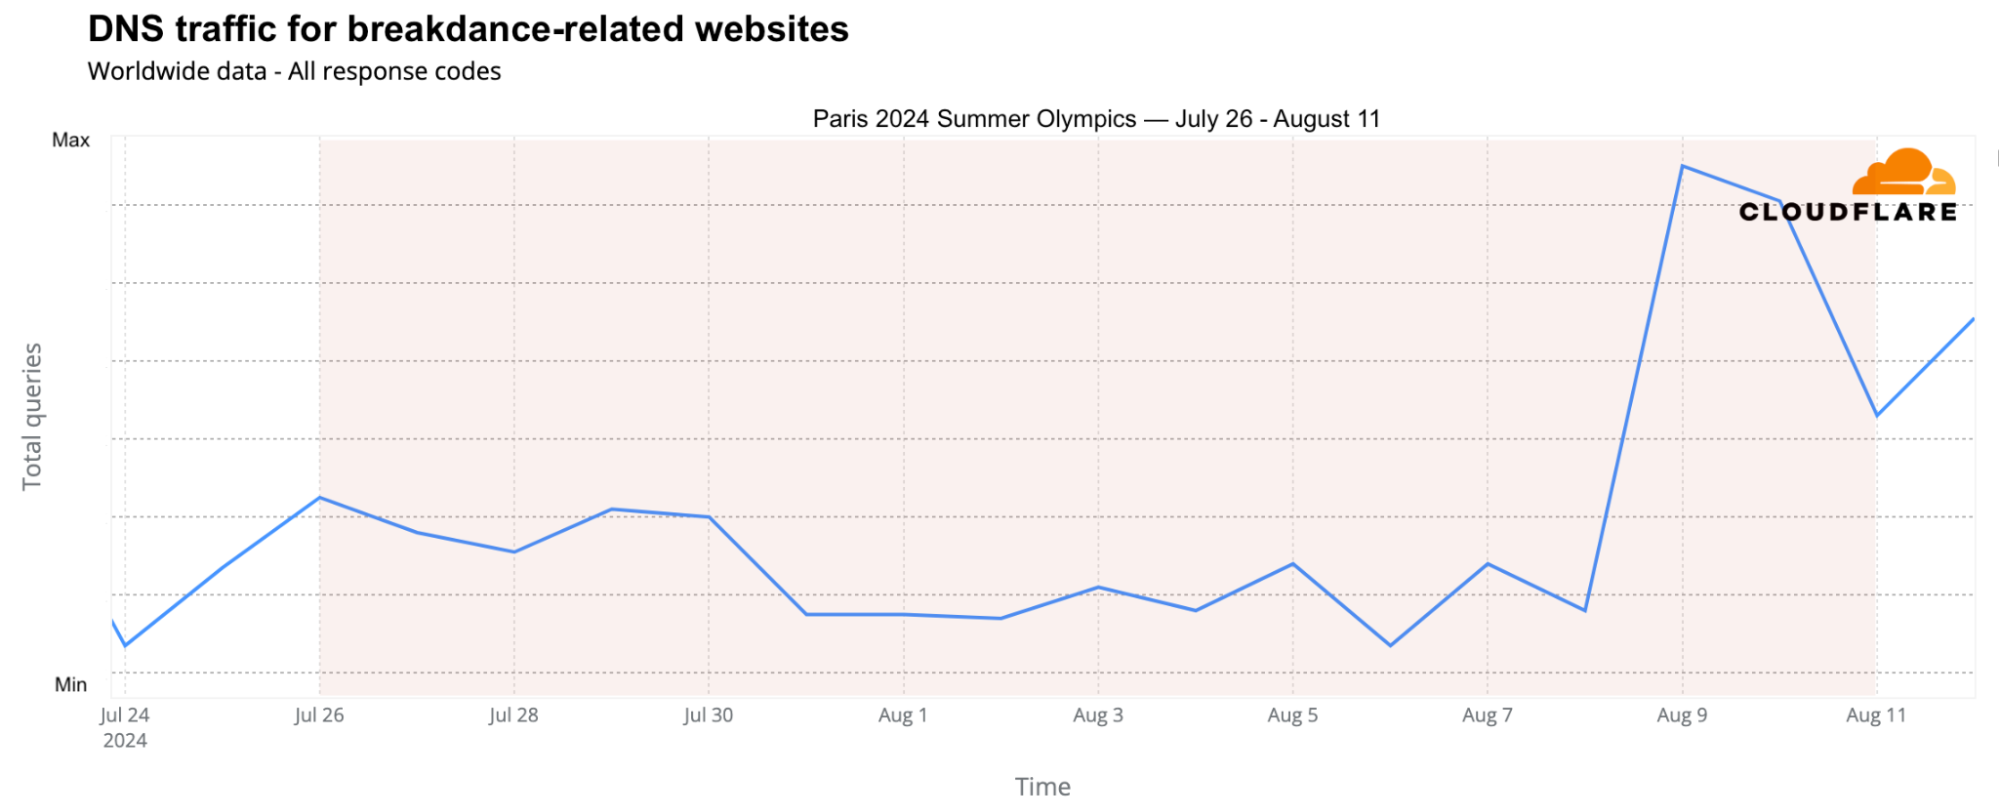
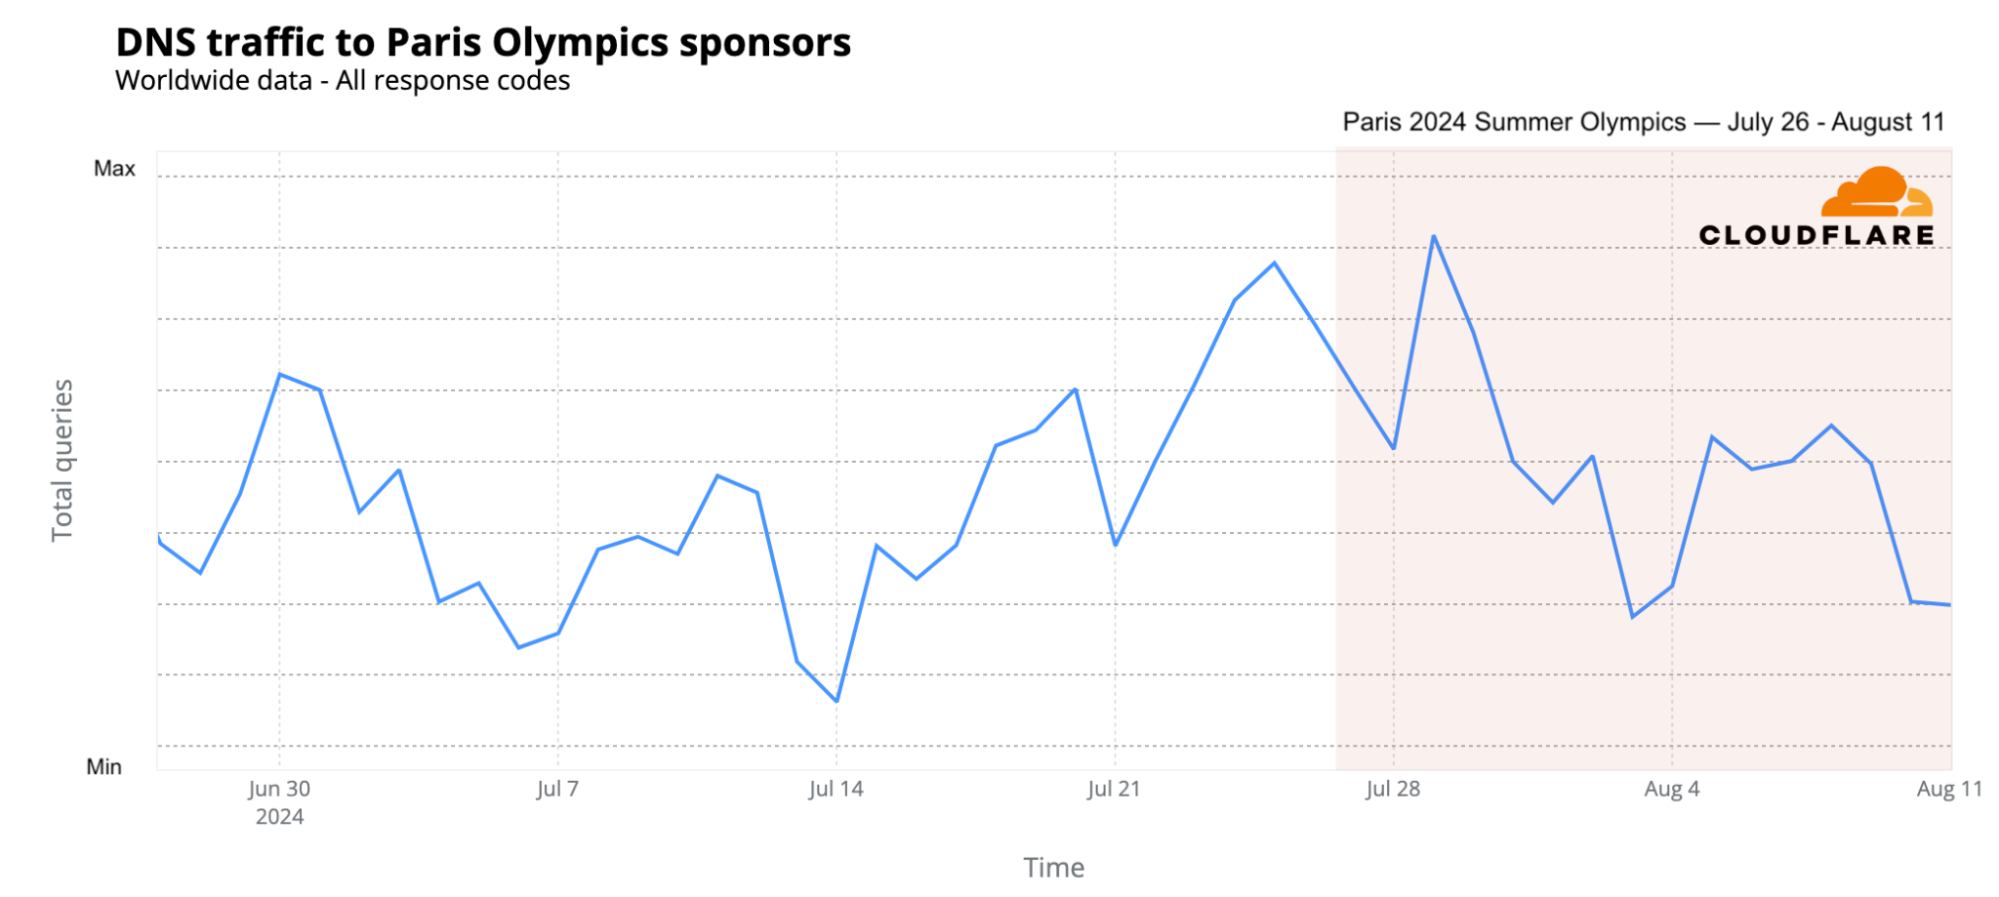
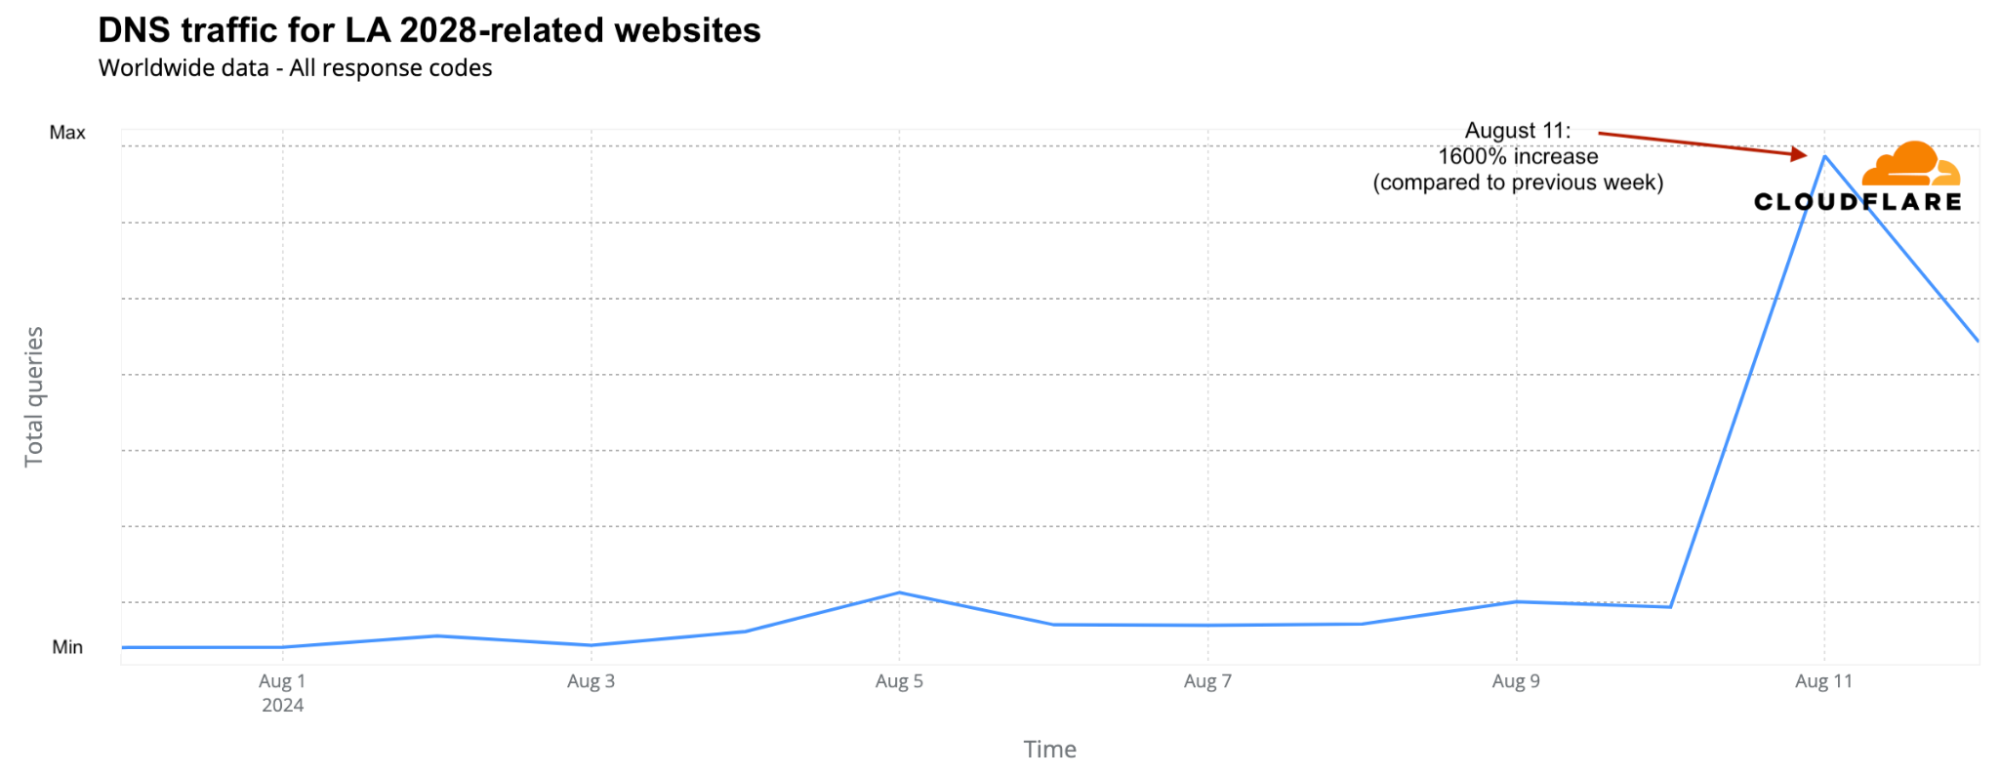
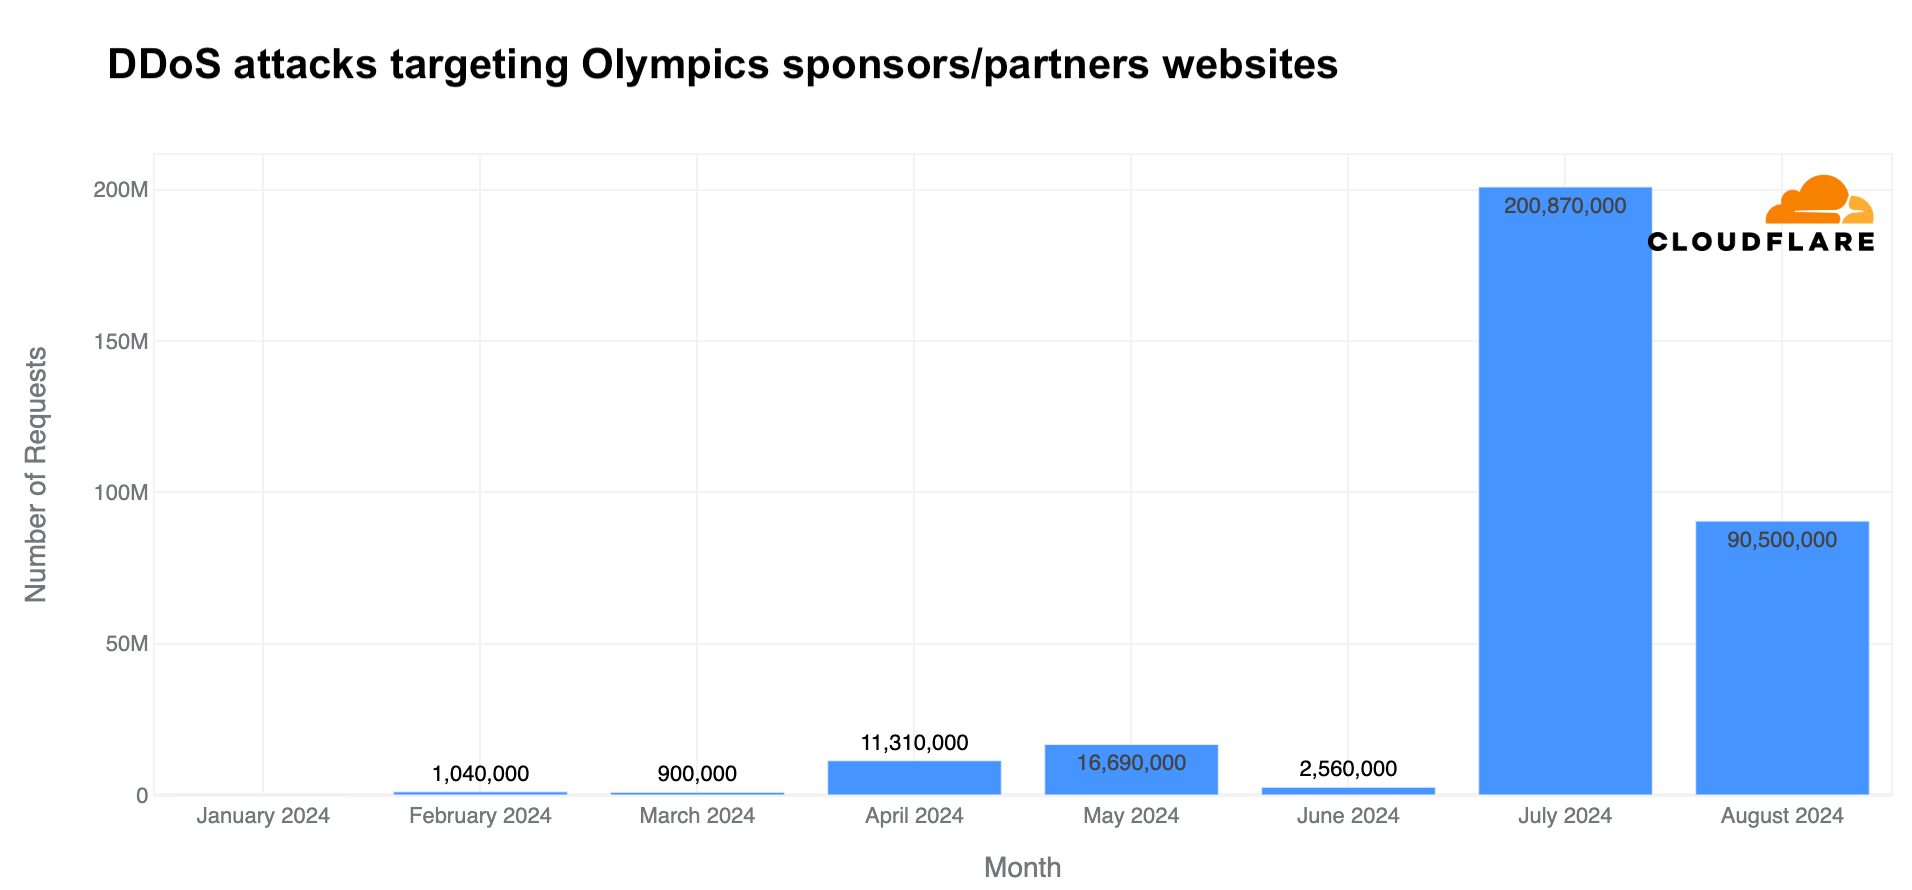
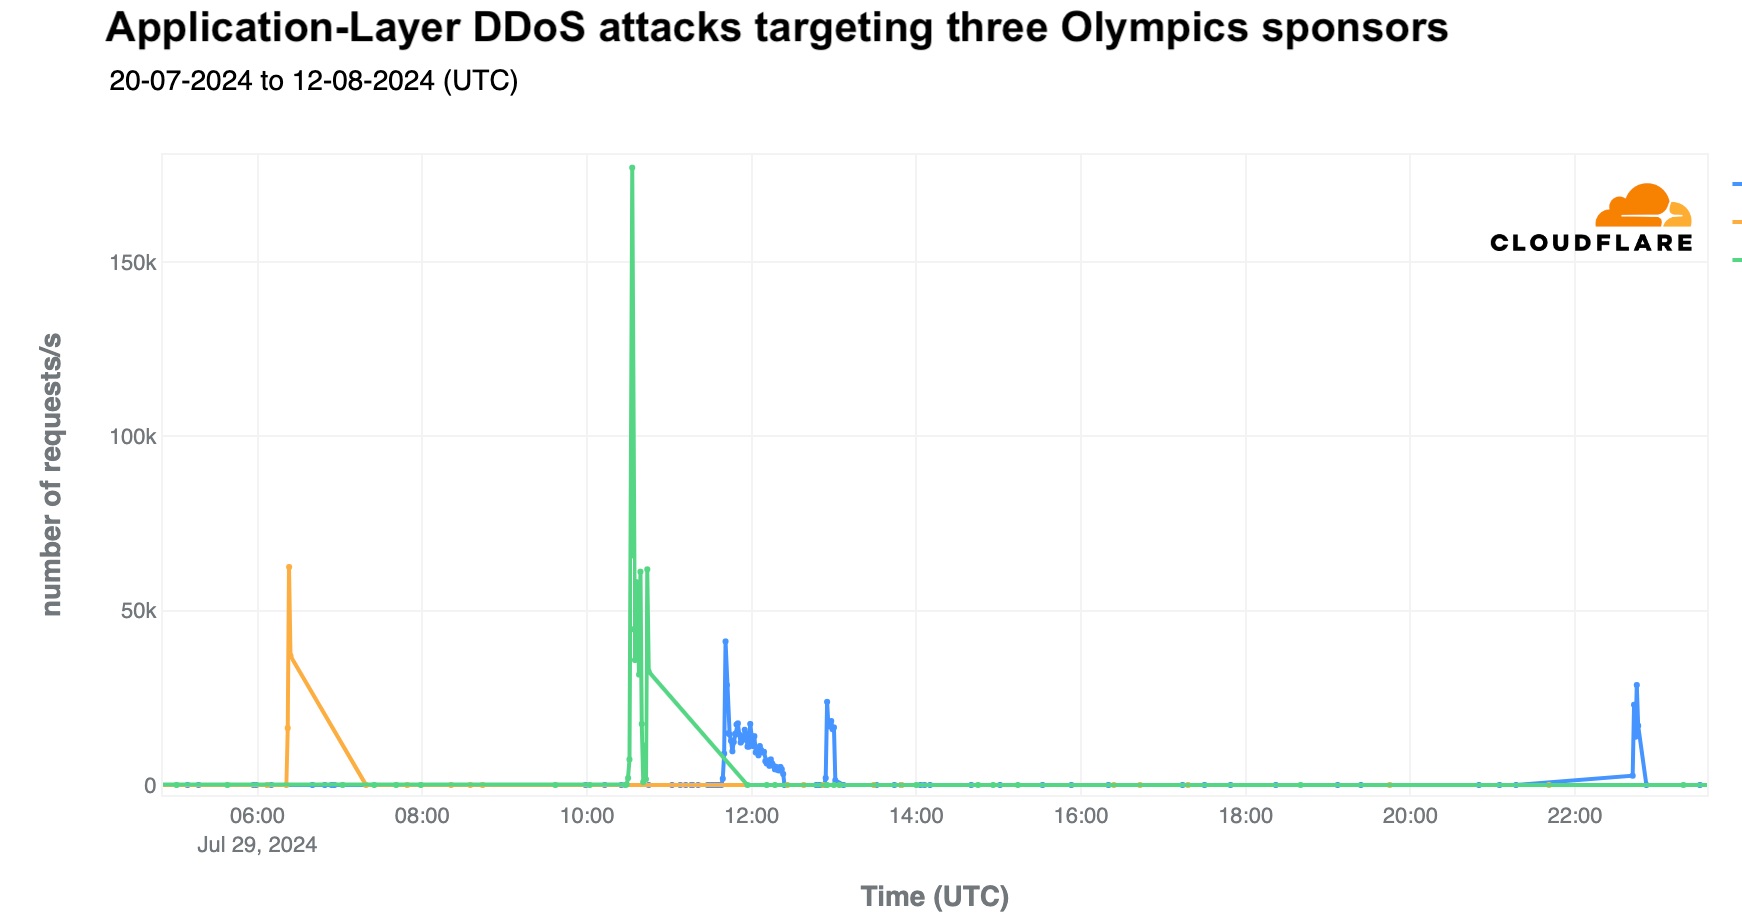
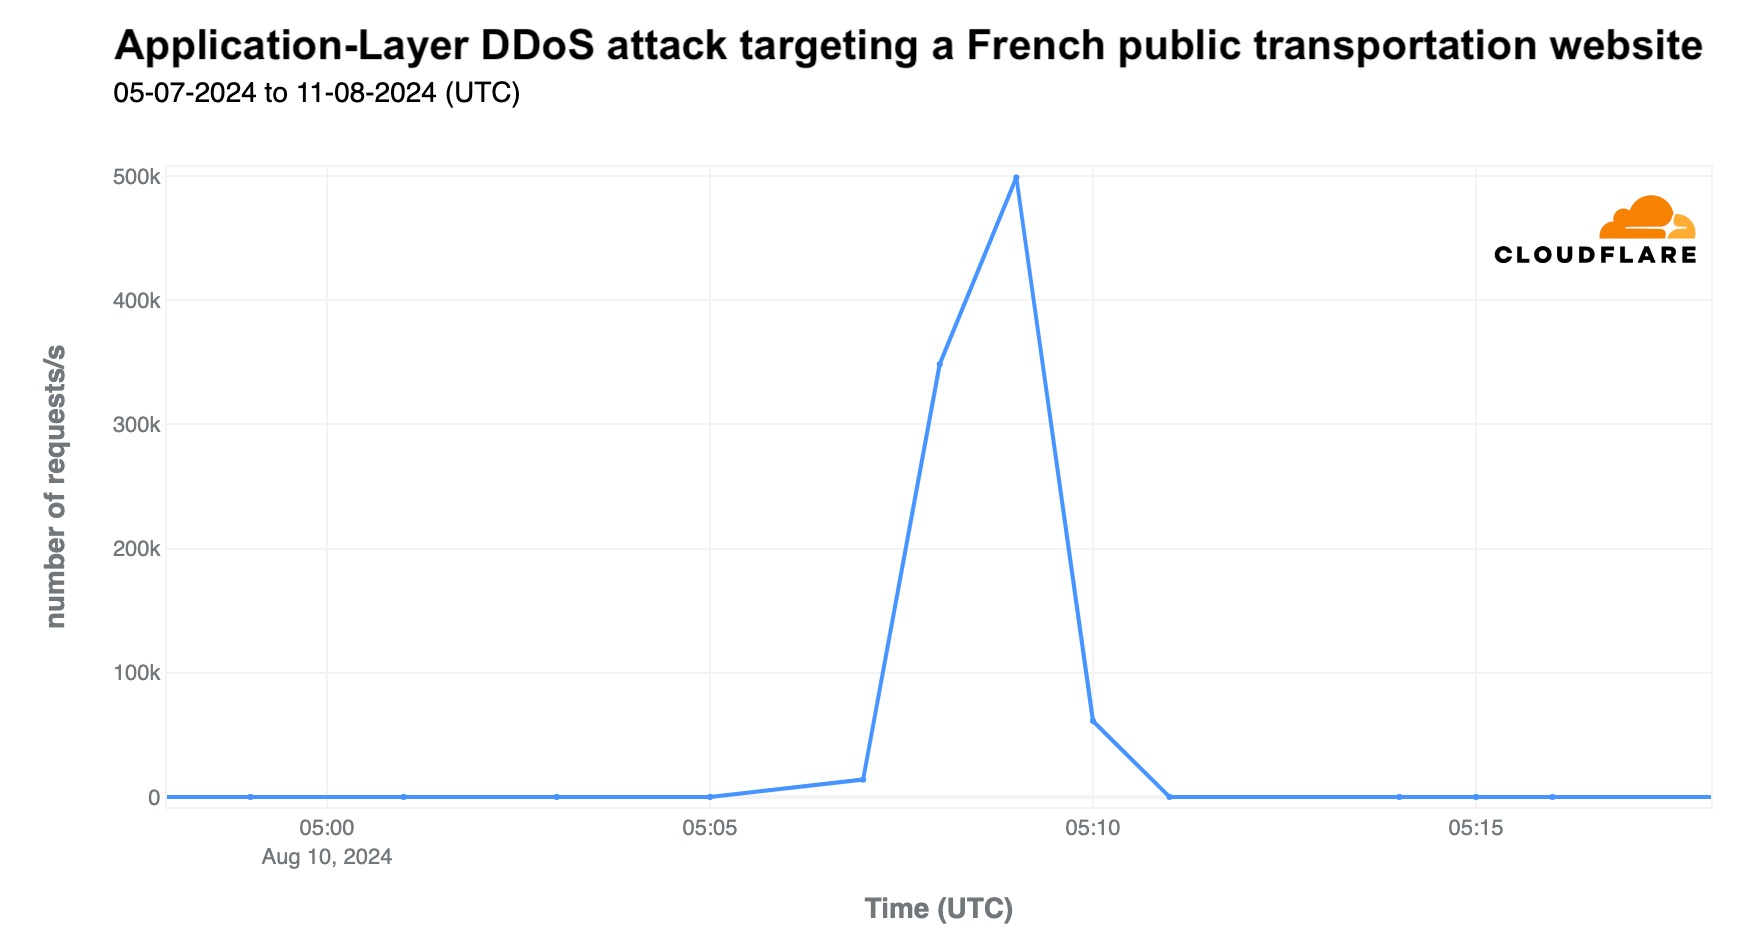
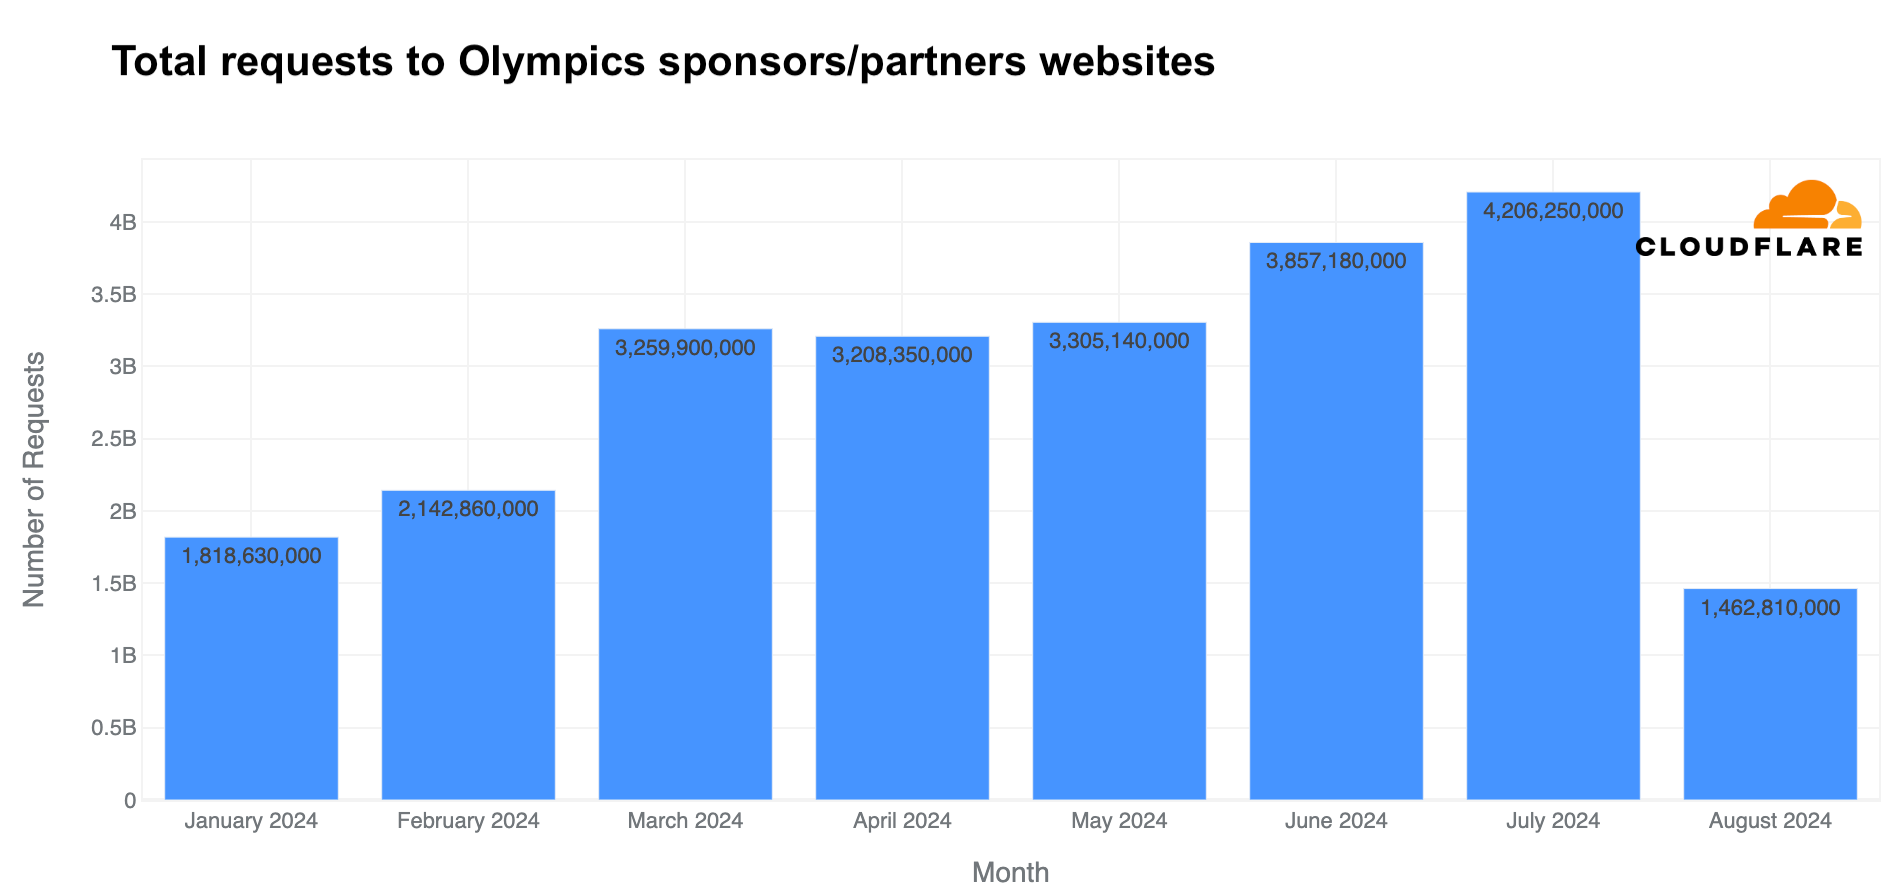
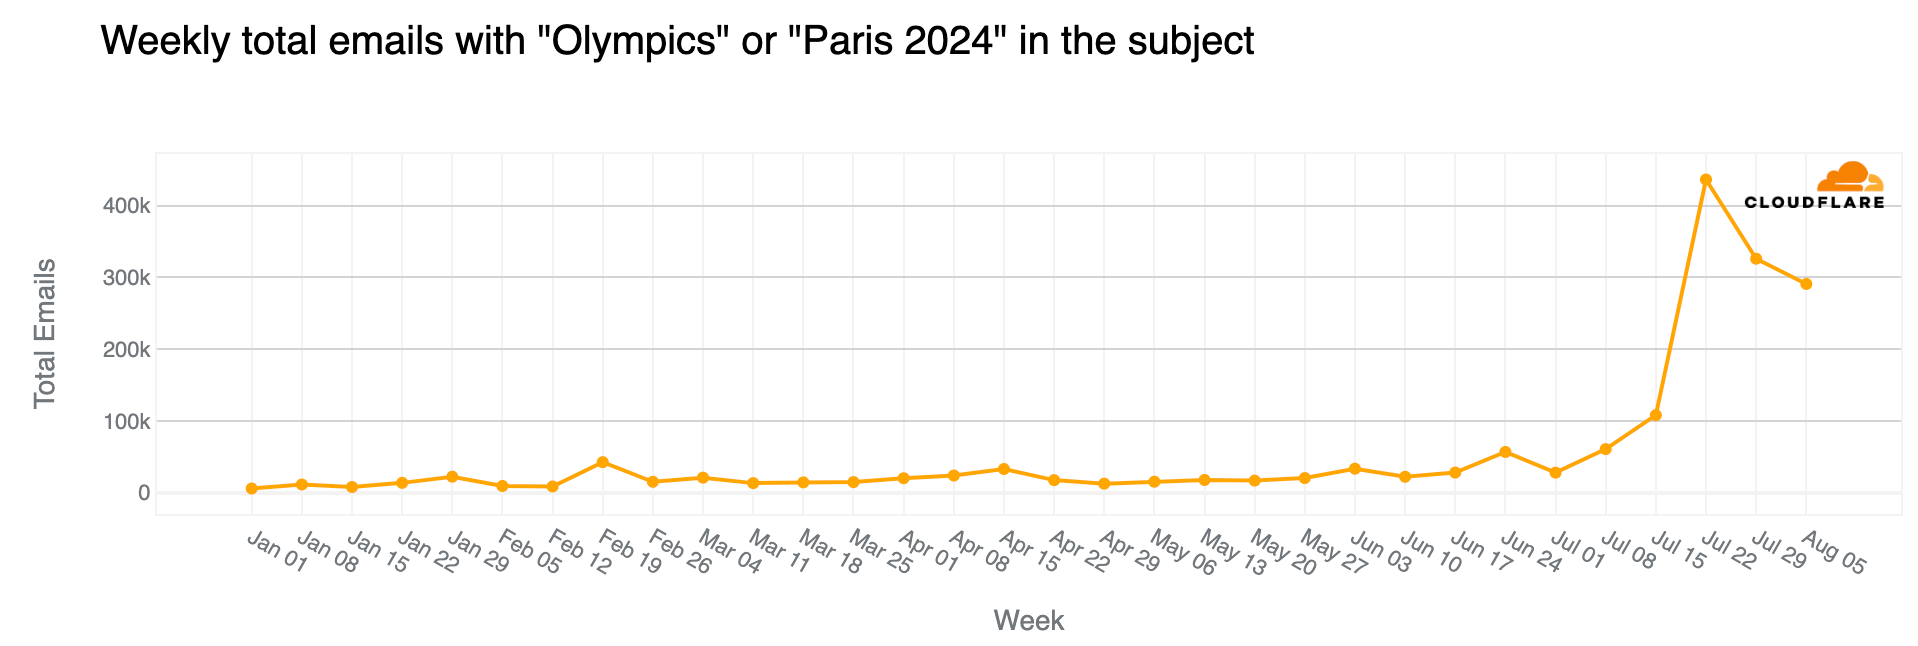
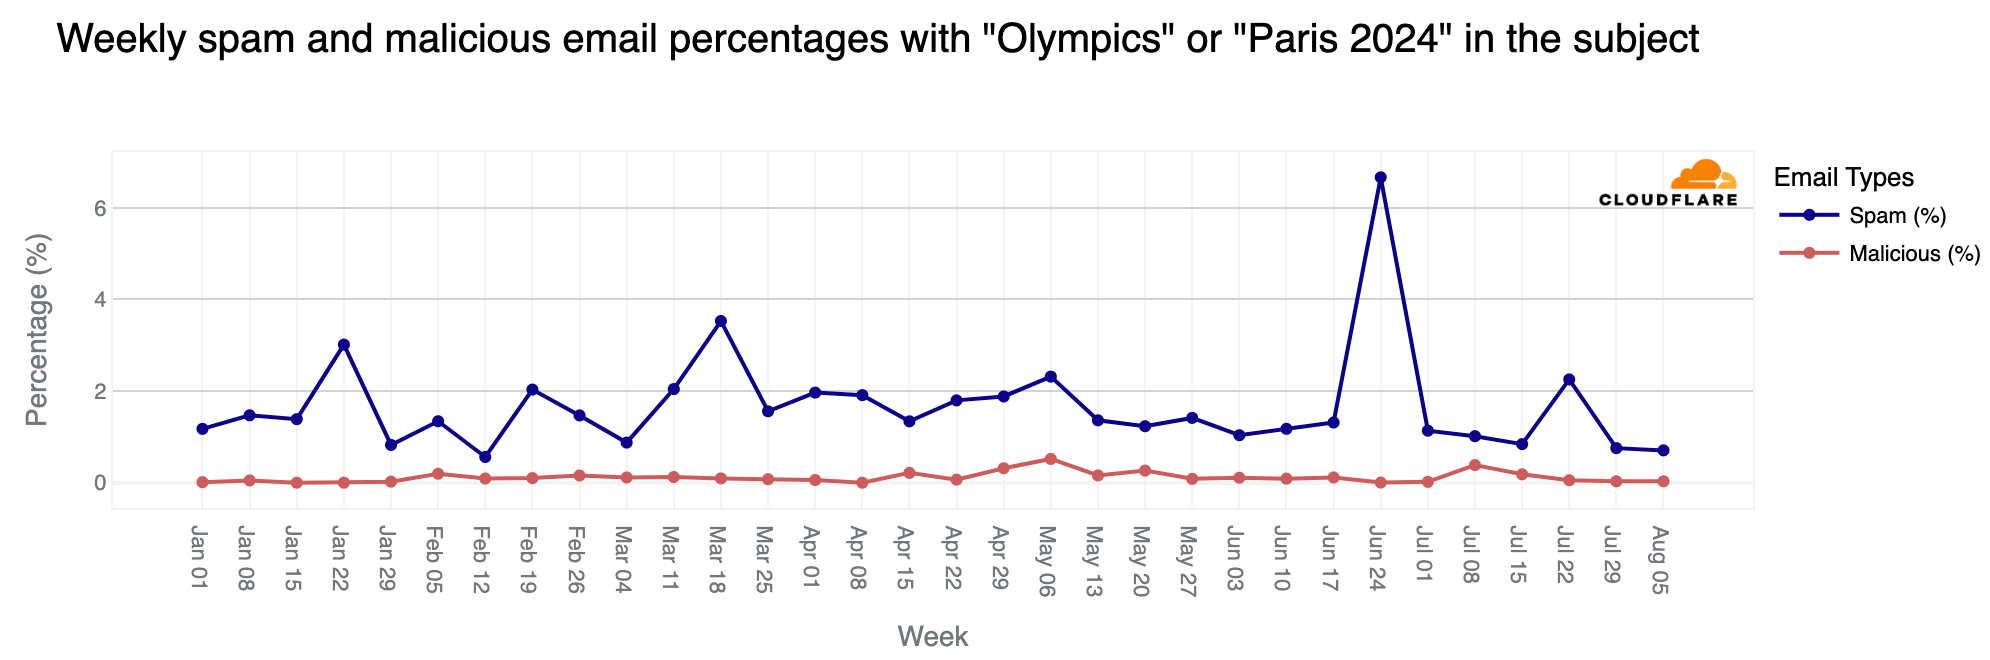
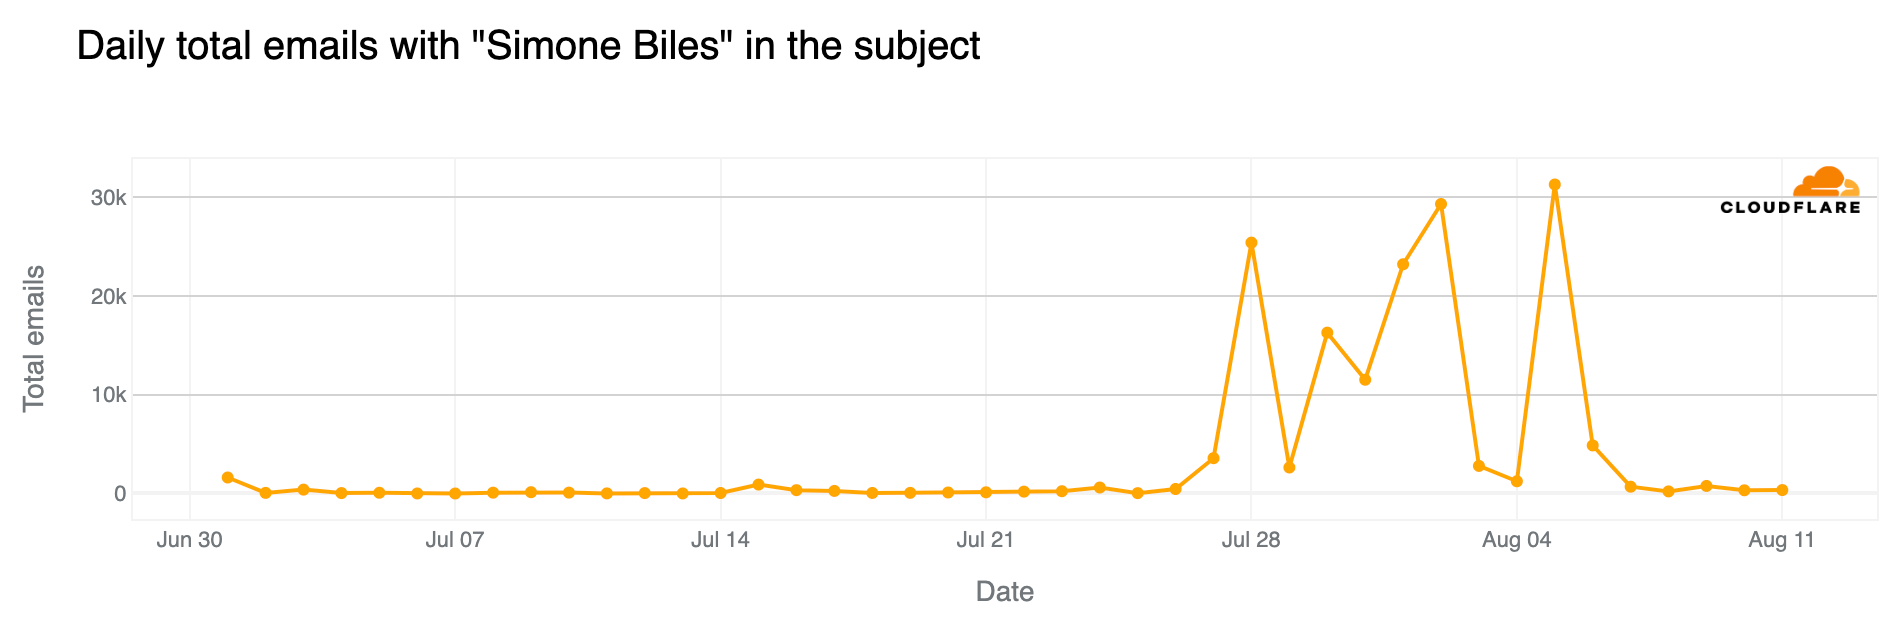



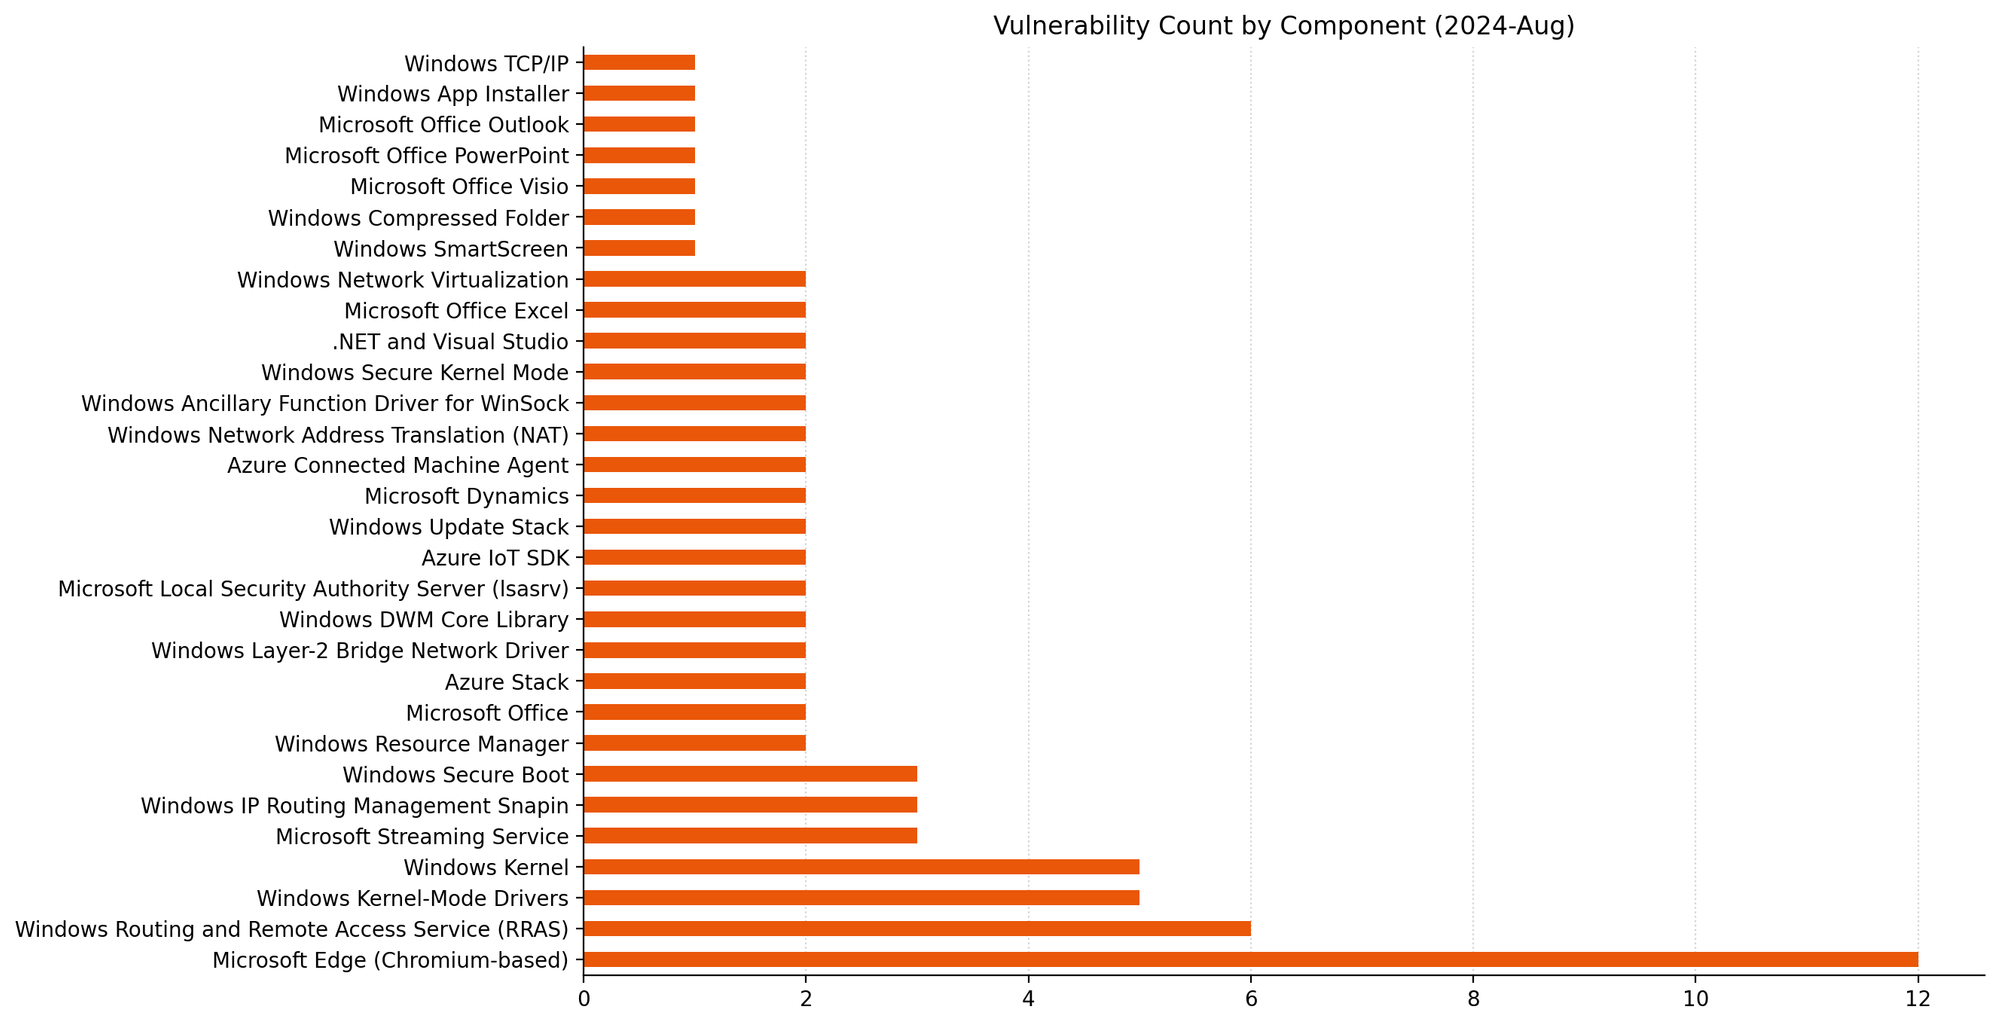
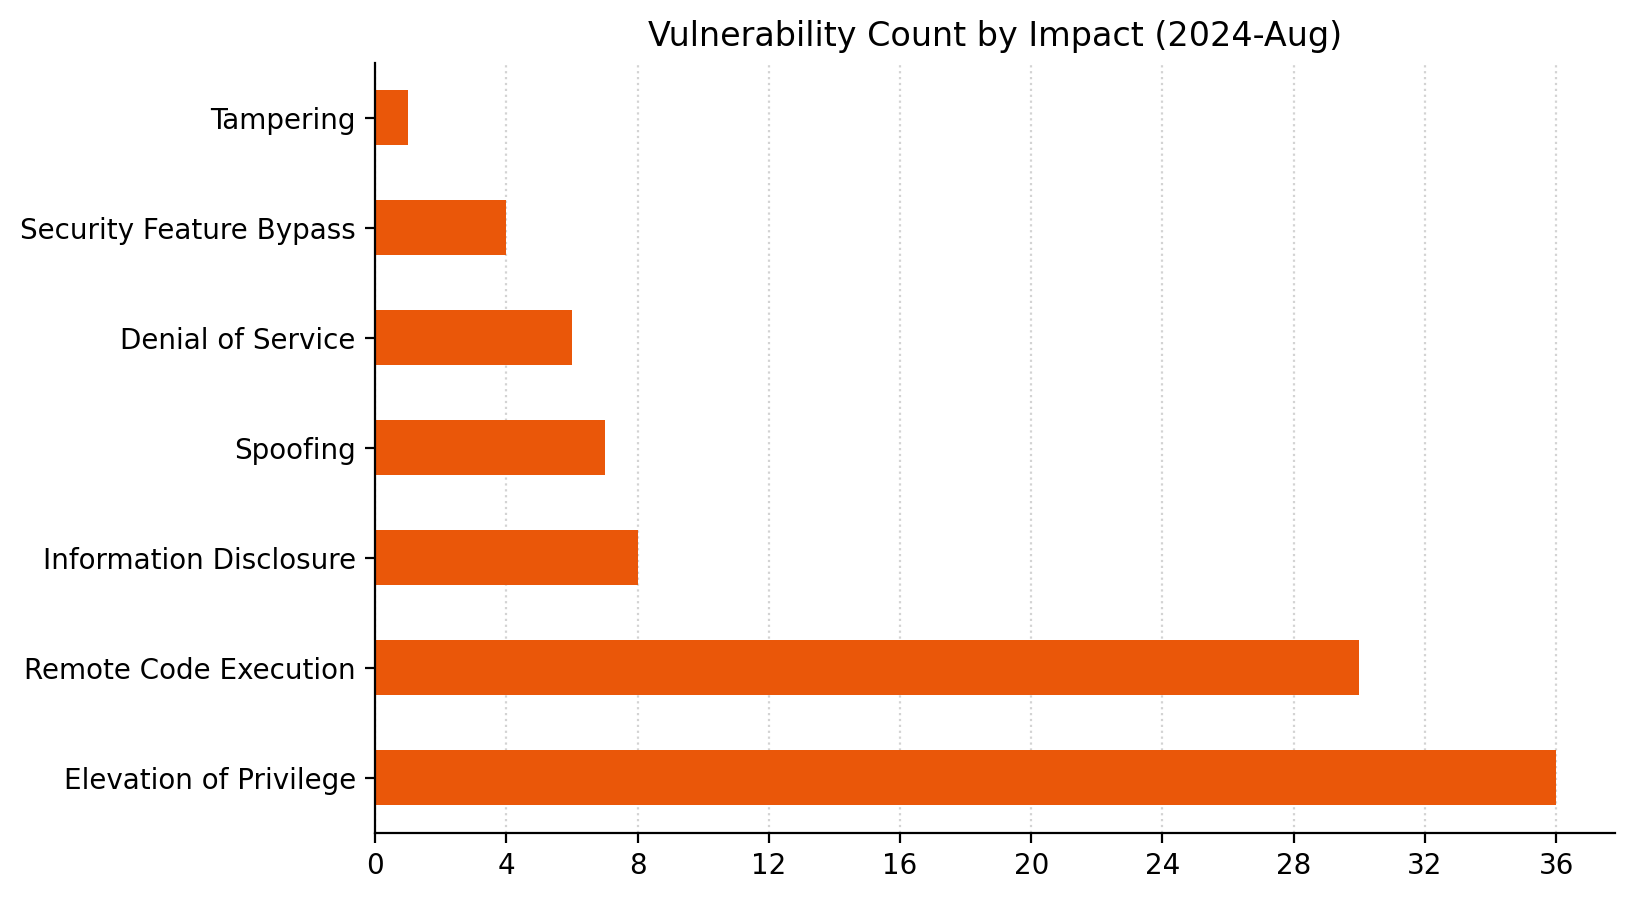
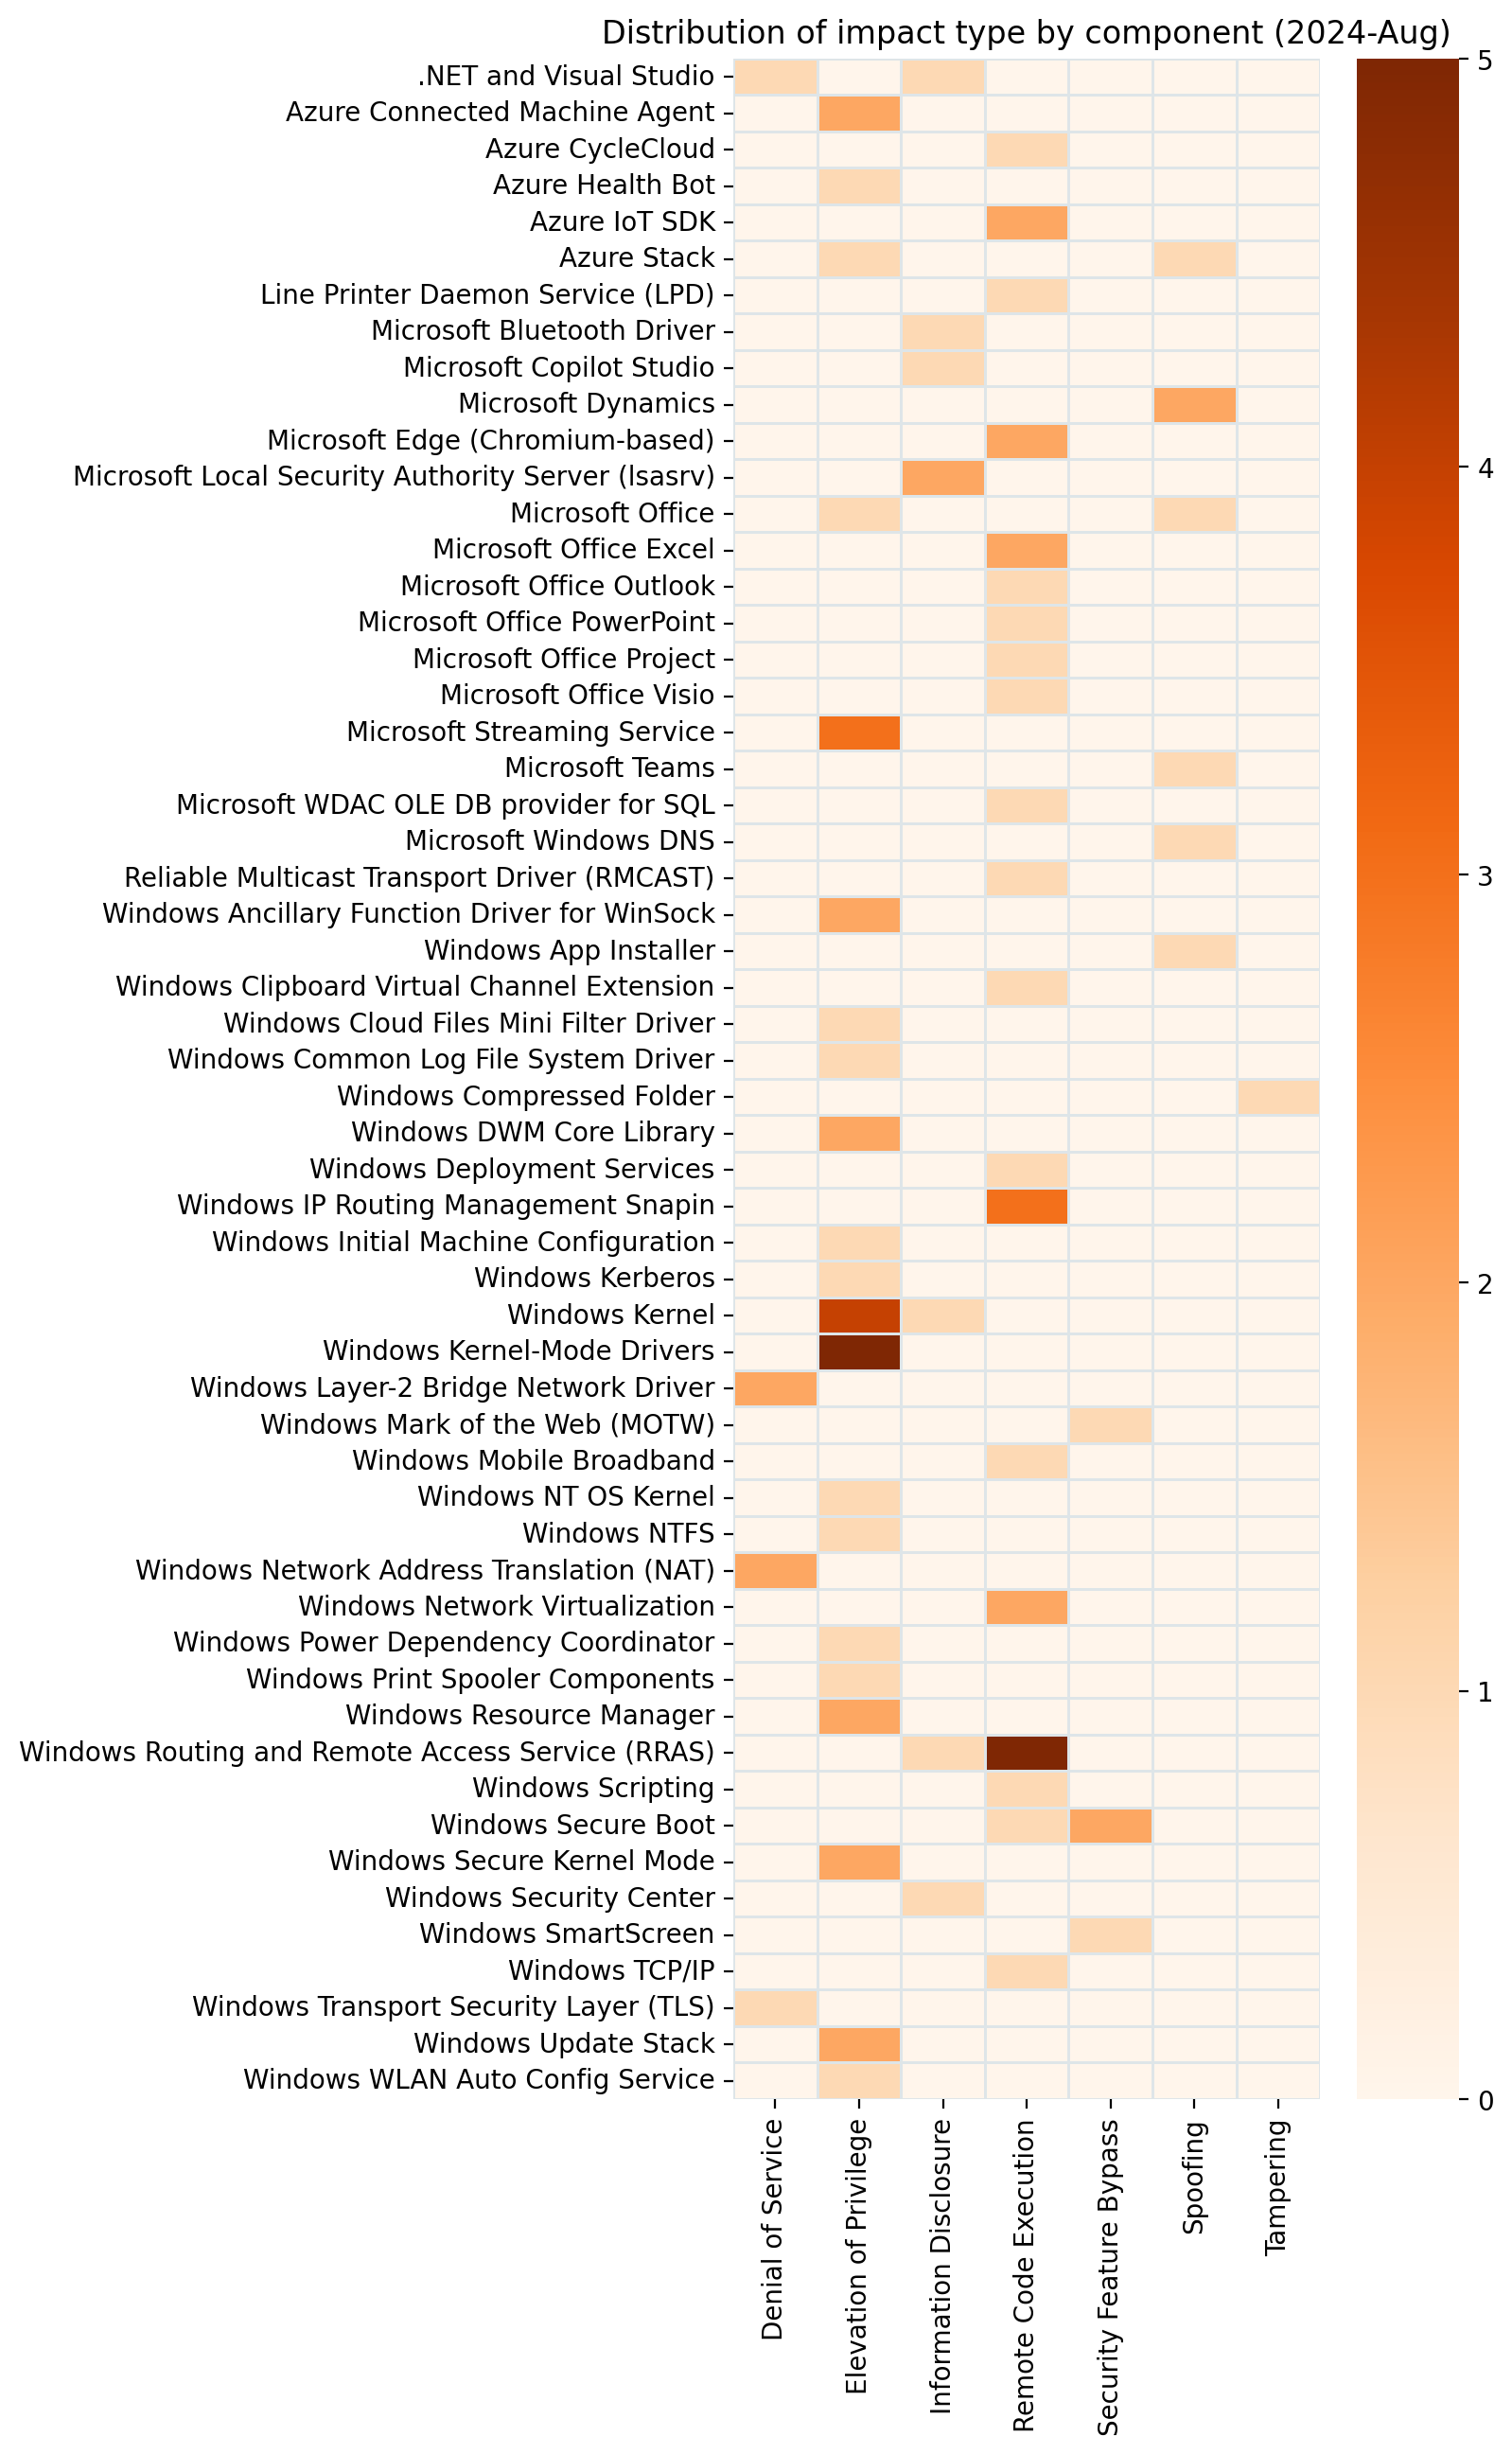
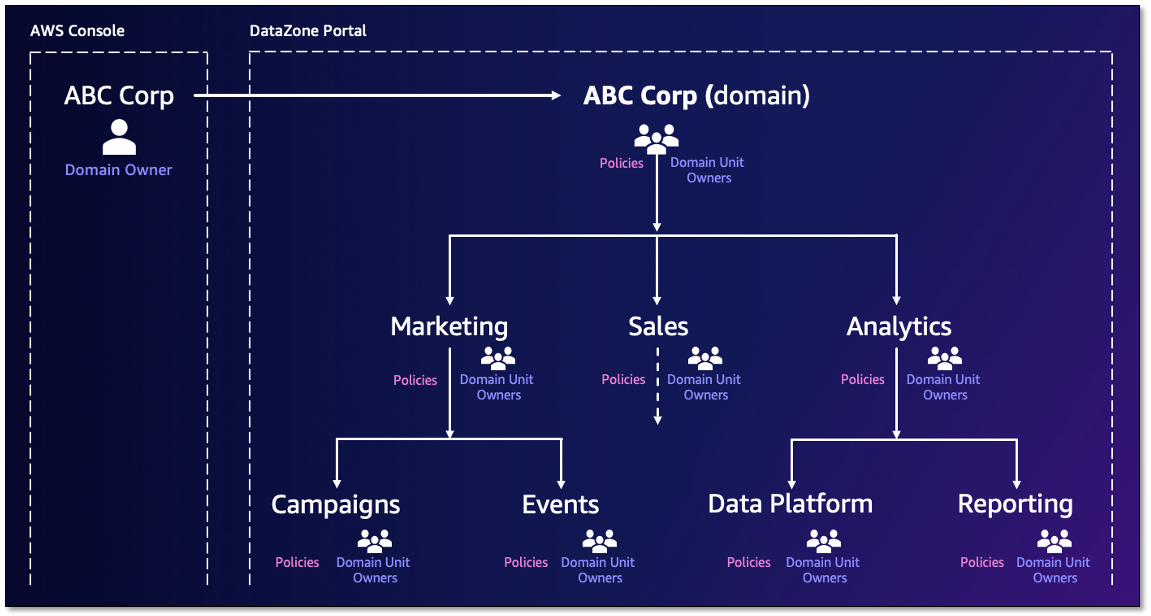
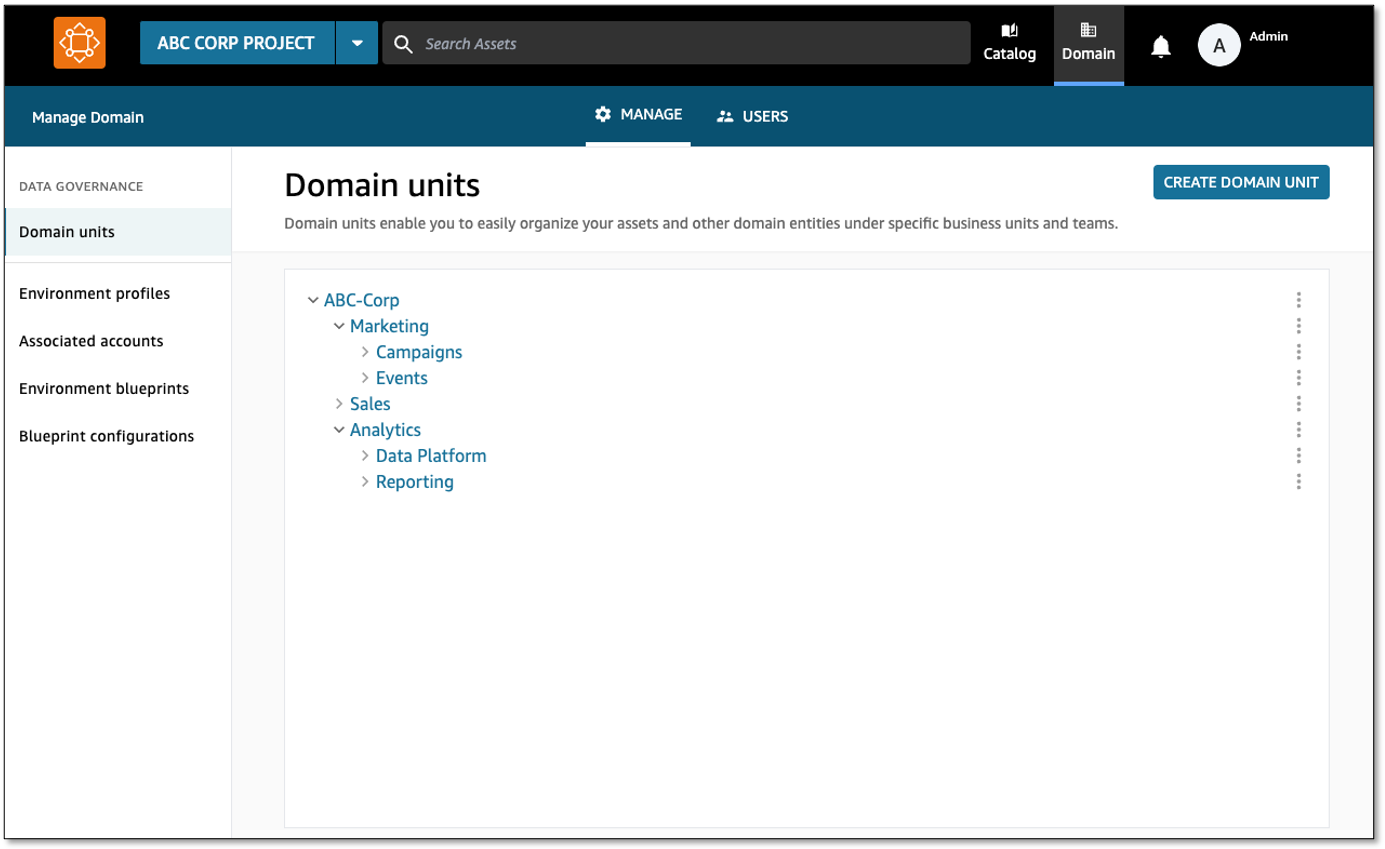
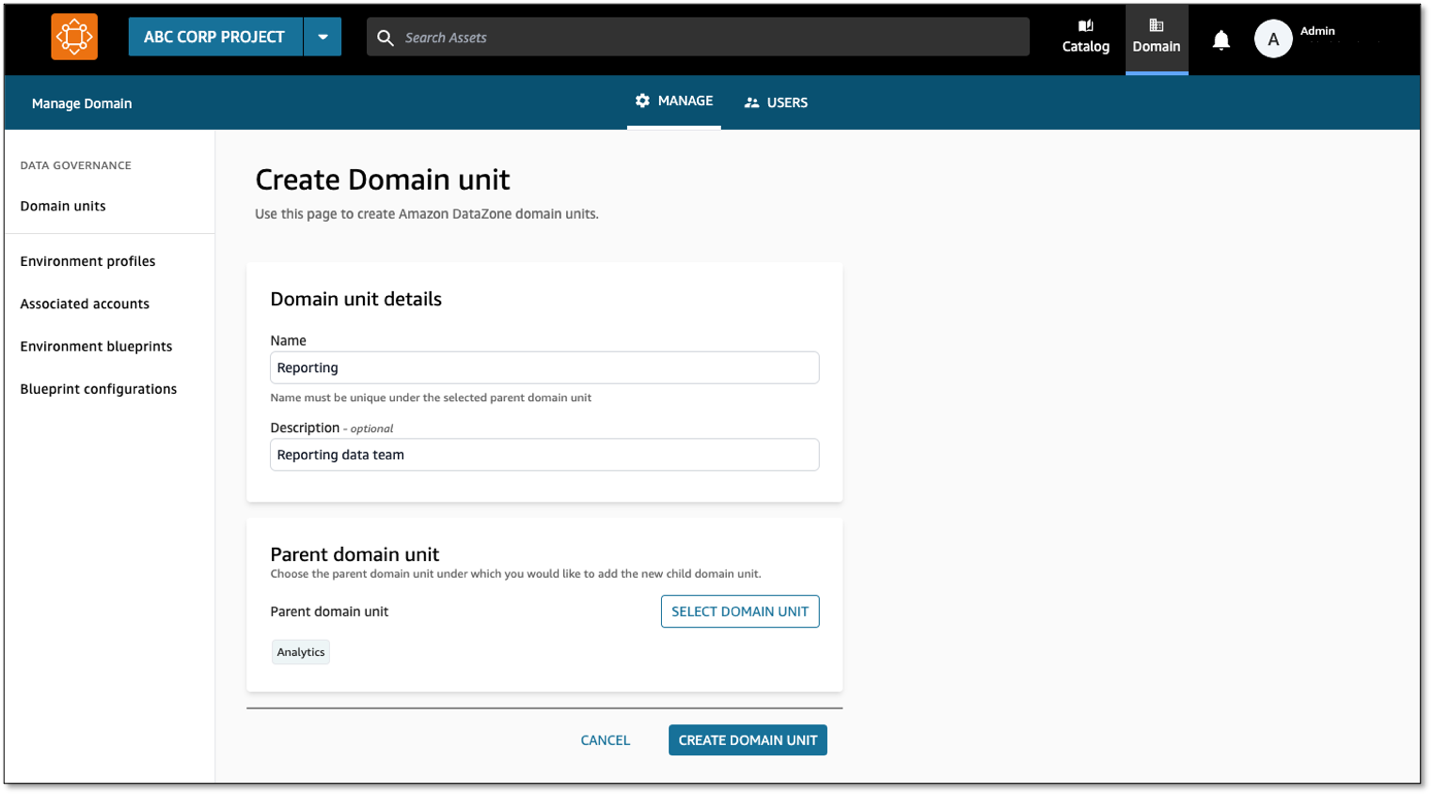
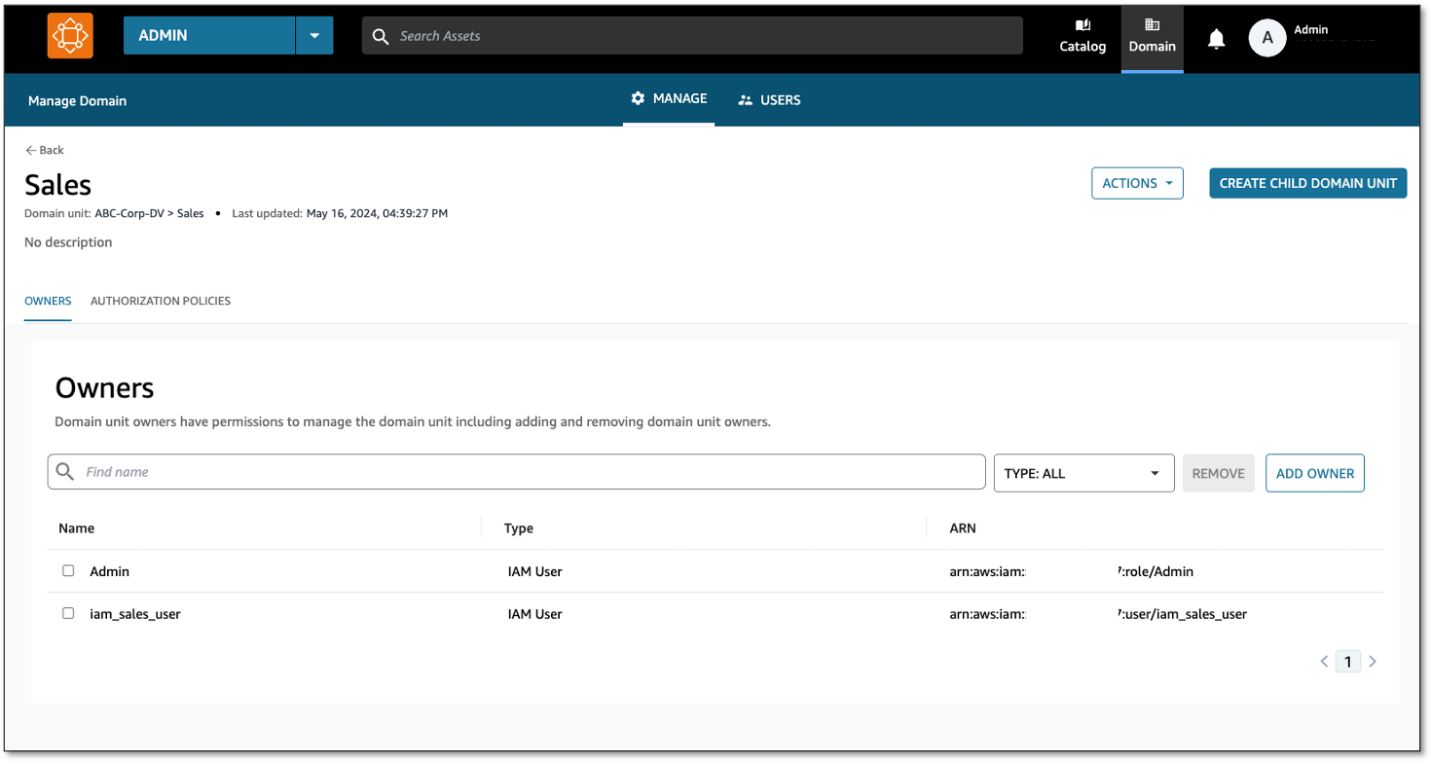
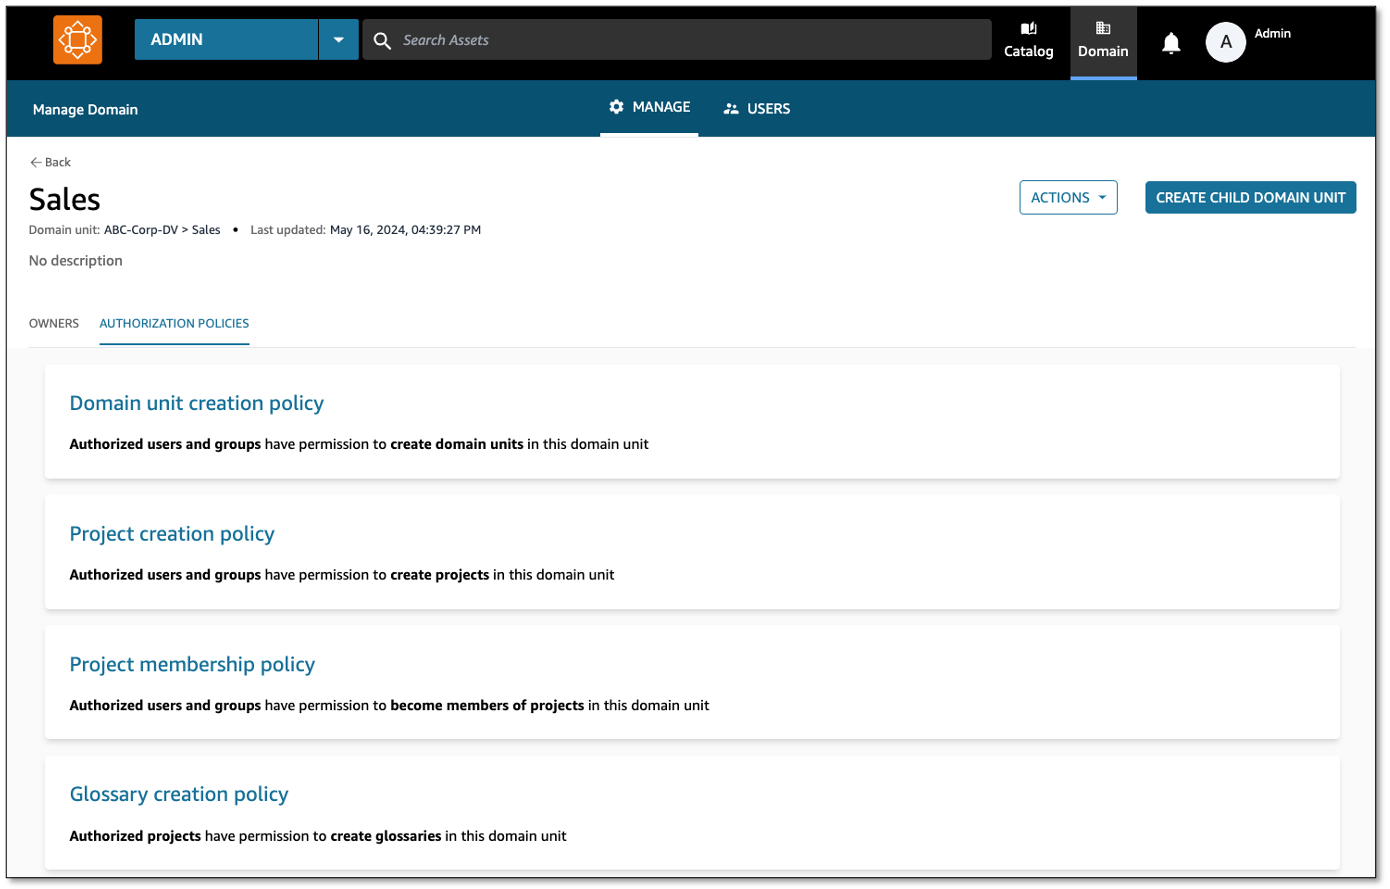
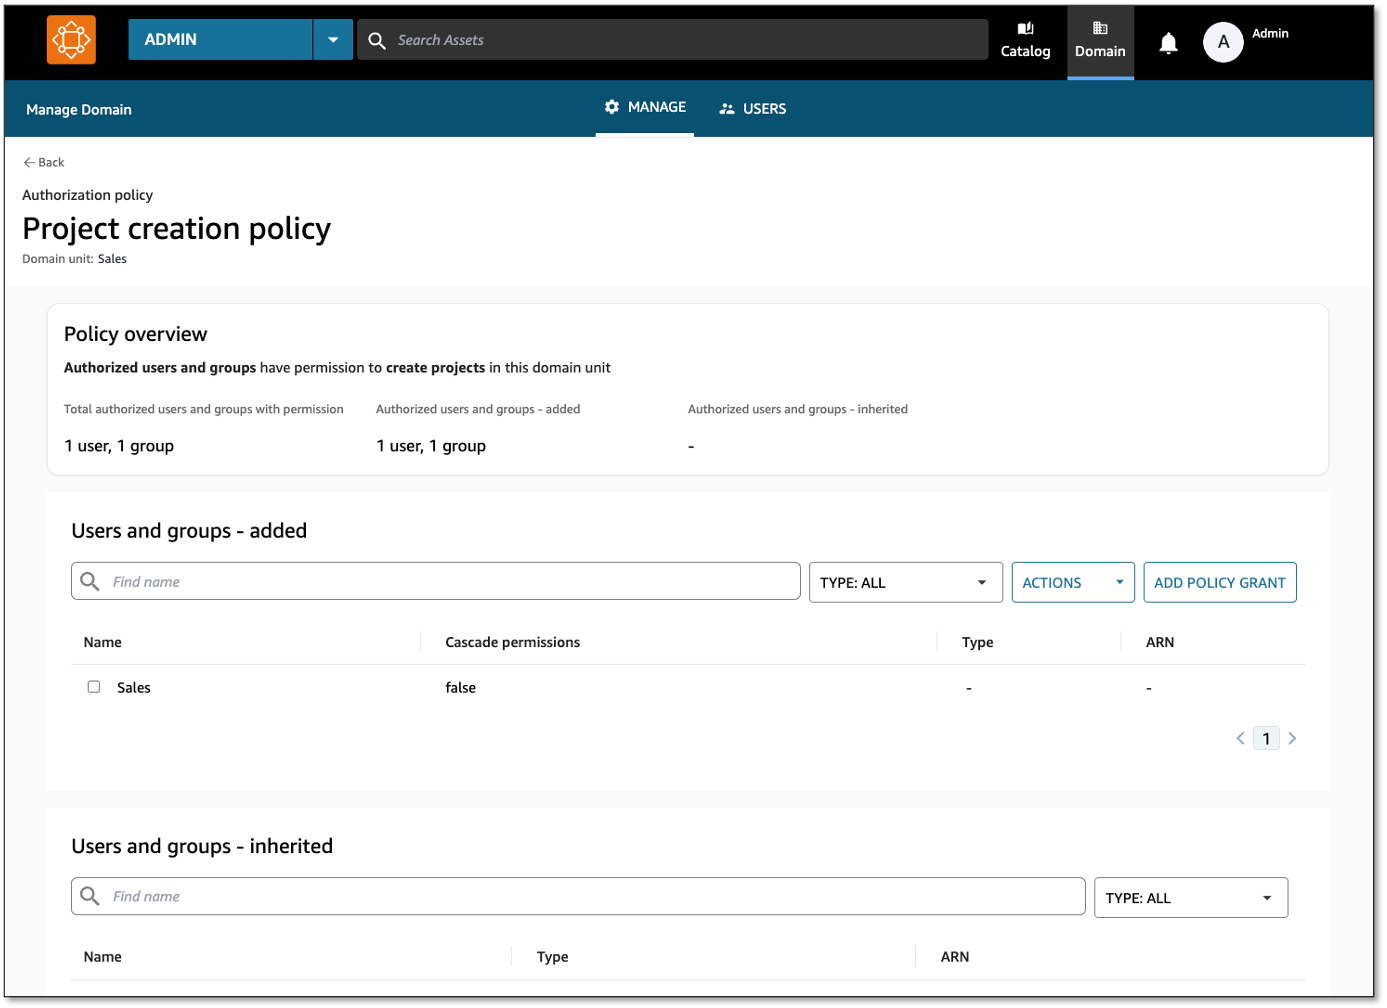
 David Victoria is a Senior Technical Product Manager with Amazon DataZone at AWS. He focuses on improving administration and governance capabilities needed for customers to support their analytics systems. He is passionate about helping customers realize the most value from their data in a secure, governed manner. Outside of work, he enjoys hiking, traveling, and making his newborn baby laugh.
 Nora O Sullivan is a Senior Solutions Architect at AWS. She focuses on helping HCLS customers choose the right AWS services for their data and analytics needs so they can derive value from their data. Outside of work, she enjoys golfing and discovering new wines and authors.
 Navneet Srivastava, a Principal Specialist and Analytics Strategy Leader, develops strategic plans for building an end-to-end analytical strategy for large biopharma, healthcare, and life sciences organizations. Navneet is responsible for helping life sciences organizations and healthcare companies deploy data governance and analytical applications, electronic medical records, devices, and AI/ML-based applications while educating customers about how to build secure, scalable, and cost-effective AWS solutions. His expertise spans across data analytics, data governance, AI, ML, big data, and healthcare-related technologies.


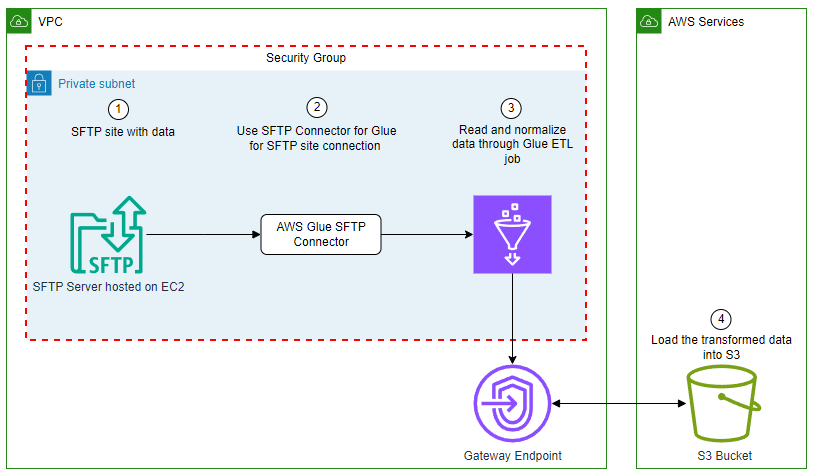
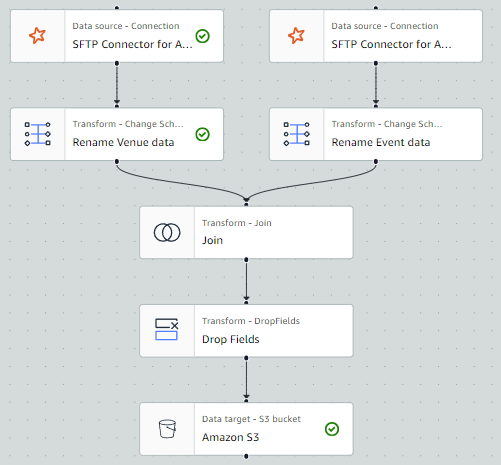
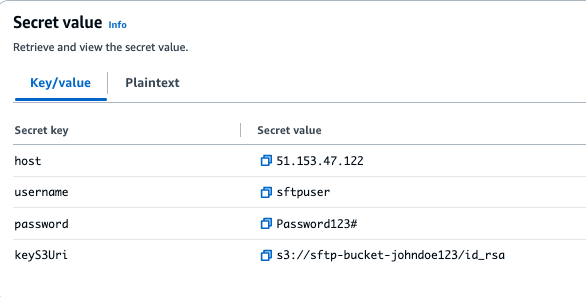
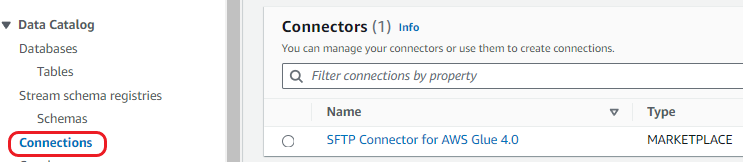
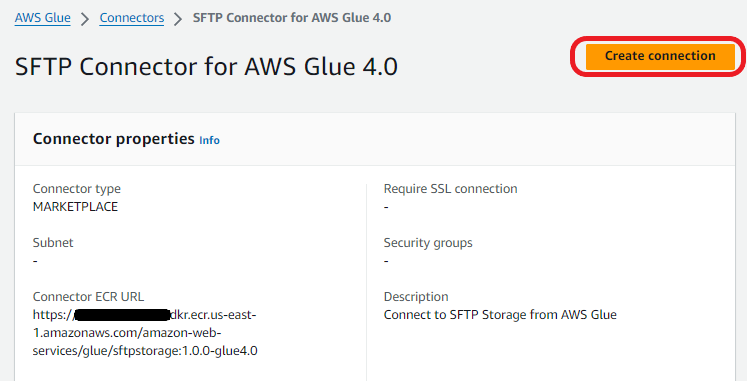
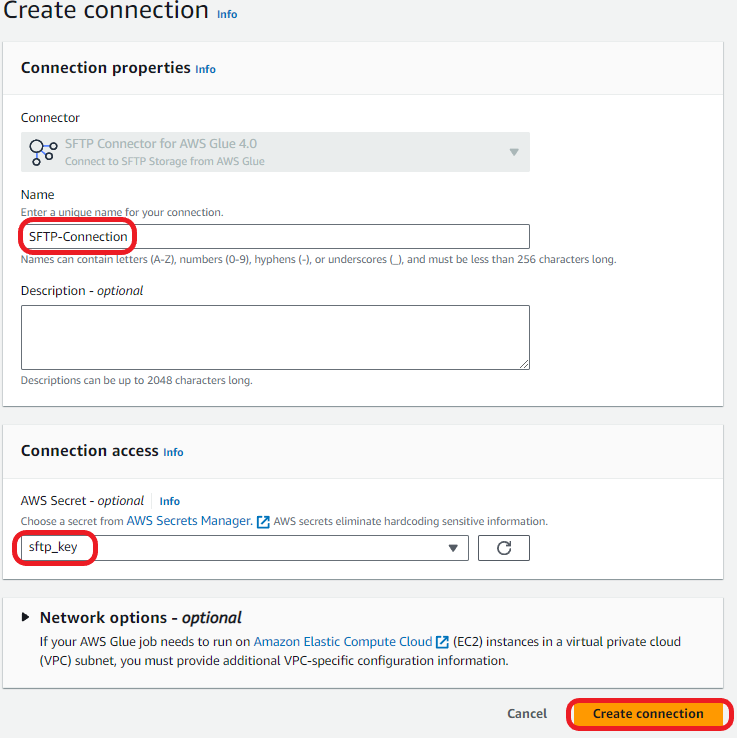

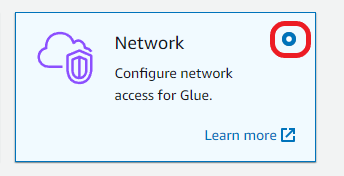
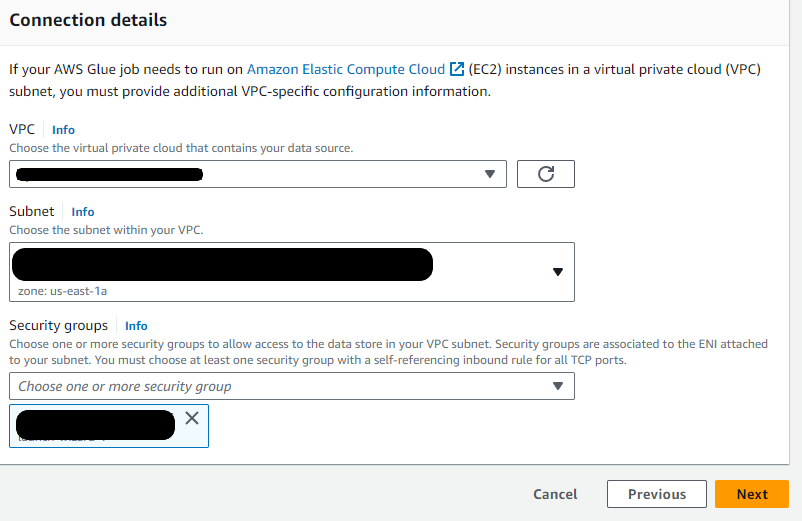
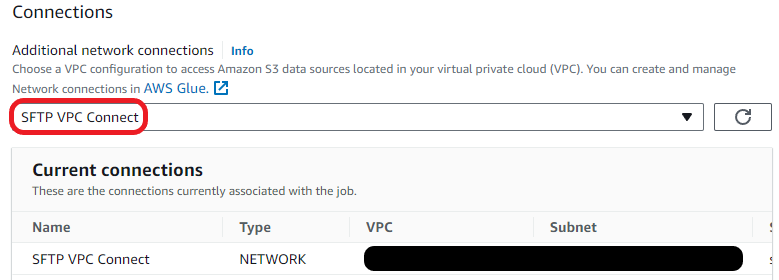
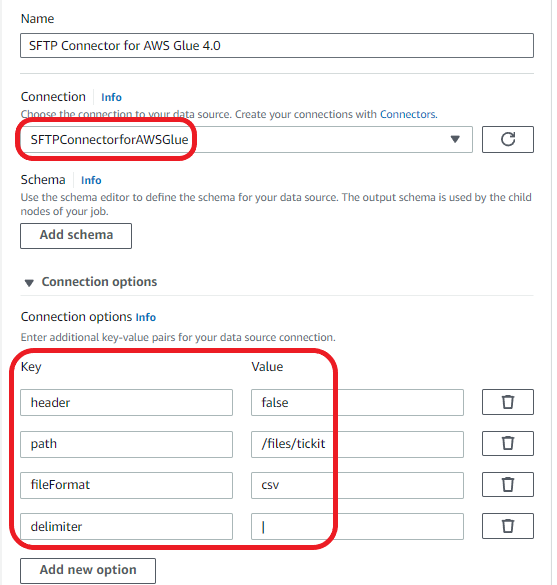
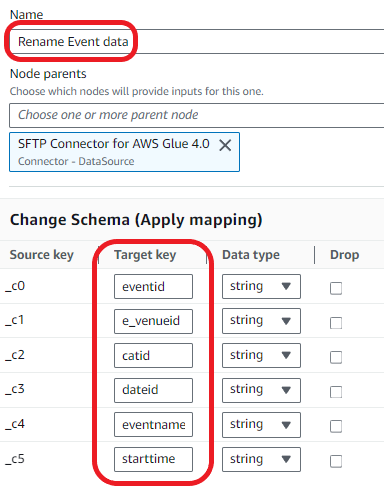
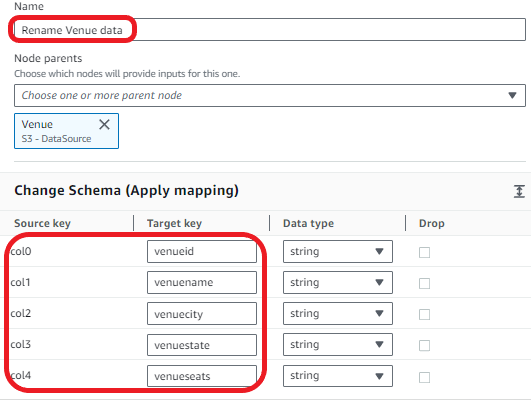
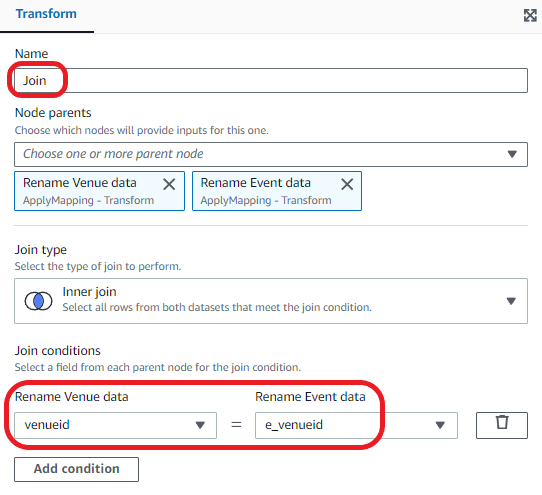
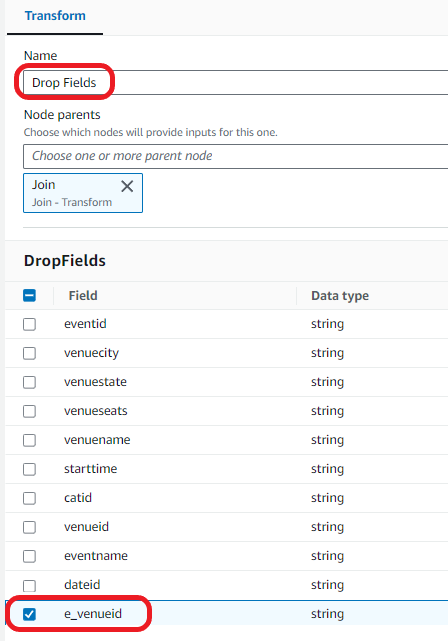
 Sean Bjurstrom is a Technical Account Manager in ISV accounts at Amazon Web Services, where he specializes in Analytics technologies and draws on his background in consulting to support customers on their analytics and cloud journeys. Sean is passionate about helping businesses harness the power of data to drive innovation and growth. Outside of work, he enjoys running and has participated in several marathons.
 Seun Akinyosoye is a Sr. Technical Account Manager supporting public sector customer at Amazon Web Services. Seun has a background in analytics, data engineering which he uses to help customers achieve their outcomes and goals. Outside of work Seun enjoys spending time with his family, reading, traveling and supporting his favorite sports teams.
 Vinod Jayendra is a Enterprise Support Lead in ISV accounts at Amazon Web Services, where he helps customers in solving their architectural, operational, and cost optimization challenges. With a particular focus on Serverless technologies, he draws from his extensive background in application development to deliver top-tier solutions. Beyond work, he finds joy in quality family time, embarking on biking adventures, and coaching youth sports team.
 Kamen Sharlandjiev is a Sr. Big Data and ETL Solutions Architect, MWAA and AWS Glue ETL expert. He’s on a mission to make life easier for customers who are facing complex data integration and orchestration challenges. His secret weapon? Fully managed AWS services that can get the job done with minimal effort. Follow Kamen on
 Chris Scull is a Solutions Architect dealing in orchestration tools and modern cloud technologies. With two years of experience at AWS, Chris has developed an interest in Amazon Managed Workflows for Apache Airflow, which allows for efficient data processing and workflow management. Additionally, he is passionate about exploring the capabilities of GenAI with Bedrock, a platform for building generative AI applications on AWS.
 Shengjie Luo is a Big data architect of Amazon Cloud Technology professional service team. Responsible for solutions consulting, architecture and delivery of AWS based data warehouse and data lake, and good at server-less computing, data migration, cloud data integration, data warehouse planning, data service architecture design and implementation.
 Qiushuang Feng is a Solutions Architect at AWS, responsible for Enterprise customers’ technical architecture design, consulting, and design optimization on AWS Cloud services. Before joining AWS, Qiushuang worked in IT companies such as IBM and Oracle, and accumulated rich practical experience in development and analytics.