Post Syndicated from corbet original https://lwn.net/Articles/941083/
OpenSSH 9.4 has been released. Changes this time include the ability to
forward Unix-domain sockets, a tags mechanism for more flexible
configuration, and more.
Post Syndicated from corbet original https://lwn.net/Articles/941083/
OpenSSH 9.4 has been released. Changes this time include the ability to
forward Unix-domain sockets, a tags mechanism for more flexible
configuration, and more.
Post Syndicated from jake original https://lwn.net/Articles/941082/
Security updates have been issued by Debian (firefox-esr), Fedora (chromium, kernel, krb5, and rust), and Ubuntu (graphite-web and velocity).
Post Syndicated from Bruce Schneier original https://www.schneier.com/blog/archives/2023/08/cryptographic-flaw-in-libbitcoin-explorer-cryptocurrency-wallet.html
Cryptographic flaws still matter. Here’s a flaw in the random-number generator used to create private keys. The seed has only 32 bits of entropy.
Seems like this flaw is being exploited in the wild.
EDITED TO ADD (8/14): A good explainer.
Post Syndicated from corbet original https://lwn.net/Articles/940290/
The LWN.net Weekly Edition for August 10, 2023 is available.
Post Syndicated from jake original https://lwn.net/Articles/940780/
The global interpreter lock (GIL) has been a part of CPython since the
beginning—nearly—but
that seems likely to change over the next five or so
years. As we described last week, the
Python steering council has announced
its intention to start moving toward a no-GIL
CPython, potentially as soon as Python 3.13 in October 2024
for the preliminaries. The no-GIL version of CPython comes from Sam
Gross, who introduced
it as a proof-of-concept nearly two years
ago; now, the idea has been formalized in a Python Enhancement Proposal
(PEP) that describes no-GIL mode and how it interacts with the rest of the
Python ecosystem.
Post Syndicated from Talks at Google original https://www.youtube.com/watch?v=fJcTWXMmsxc
Post Syndicated from Jakub Oleksy original https://github.blog/2023-08-09-github-availability-report-july-2023/
In July, we experienced one incident that resulted in degraded performance across GitHub services.
July 21 13:07 UTC (lasting 59 minutes)
On July 21 at 13:07 UTC, GitHub experienced a partial power outage in one of our redundant data centers, which resulted in a loss of compute capacity. GitHub updated the status of six services to yellow at 13:12 UTC. The vast majority of customer impact occurred in the first 10 minutes up to 13:17 UTC as requests were internally rerouted to other nodes in the data center, but we elected to keep status at yellow until full capacity was restored out of an abundance of caution. As a result of this incident, we are conducting reviews of all power feeds with each of our datacenter partners. We have also identified improvements to reduce recovery time after power was restored and are evaluating ways to reduce the time to fail over all traffic.
Please follow our status page for real-time updates on status changes. To learn more about what we’re working on, check out the GitHub Engineering Blog.
The post GitHub Availability Report: July 2023 appeared first on The GitHub Blog.
Post Syndicated from Veliswa Boya original https://aws.amazon.com/blogs/aws/new-file-release-for-amazon-fsx-for-lustre/
Amazon FSx for Lustre provides fully managed shared storage with the scalability and high performance of the open-source Lustre file systems to support your Linux-based workloads. FSx for Lustre is for workloads where storage speed and throughput matter. This is because FSx for Lustre helps you avoid storage bottlenecks, increase utilization of compute resources, and decrease time to value for workloads that include artificial intelligence (AI) and machine learning (ML), high performance computing (HPC), financial modeling, and media processing. FSx for Lustre integrates natively with Amazon Simple Storage Service (Amazon S3), synchronizing changes in both directions with automatic import and export, so that you can access your Amazon S3 data lakes through a high-performance POSIX-compliant file system on demand.
Today, I’m excited to announce file release for FSx for Lustre. This feature helps you manage your data lifecycle by releasing file data that has been synchronized with Amazon S3. File release frees up storage space so that you can continue writing new data to the file system while retaining on-demand access to released files through the FSx for Lustre lazy loading from Amazon S3. You specify a directory to release from, and optionally a minimum amount of time since last access, so that only data from the specified directory, and the minimum amount of time since last access (if specified), is released. File release helps you with data lifecycle management by moving colder file data to S3 enabling you to take advantage of S3 tiering.
File release tasks are initiated using the AWS Management Console, or by making an API call using the AWS CLI, AWS SDK, or Amazon EventBridge Scheduler to schedule release tasks at regular intervals. You can choose to receive completion reports at the end of your release task if so desired.
Initiating a Release Task
As an example, let’s look at how to use the console to initiate a release task. To specify criteria for files to release (for example, directories or time since last access), we define release data repository tasks (DRTs). DRTs release all files that are synchronized with Amazon S3 and that meet the specified criteria. It’s worth noting that release DRTs are processed in sequence. This means that if you submit a release DRT while another DRT (for example, import or export) is in progress, the release DRT will be queued but not processed until after the import or export DRT has completed.
Note: For the data repository association to work, automatic backups for the file system must be disabled (use the Backups tab to do this). Secondly, ensure that the file system and the associated S3 bucket are in the same AWS Region.
I already have an FSx for Lustre file system my-fsx-test.
 I create a data repository association, which is a link between a directory on the file system and an S3 bucket or prefix.

I specify the name of the S3 bucket or an S3 prefix to be associated with the file system.
 After the data repository association has been created, I select Create release task.


The release task will release directories or files that you want to release based on your specific criteria (again, important to remember that these files or directories must be synchronized with an S3 bucket in order for the release to work). If you specified the minimum last access for release (in addition to the directory), files that have not been accessed more recently than that will be released.
In my example, I chose to Disable completion reports. However, if you choose to Enable completion reports, the release task will produce a report at the end of the release task.
Files that have been released can still be accessed using existing FSx for Lustre functionality to automatically retrieve data from Amazon S3 back to the file system on demand. This is because, although released, their metadata stays on the file system.
File release won’t automatically prevent your file system from becoming full. It remains important to ensure that you don’t write more data than the available storage capacity before you run the next release task.
Now Available
File release on FSx for Lustre is available today in all AWS Regions where FSx for Lustre is supported, on all new or existing S3-linked file systems running Lustre version 2.12 or later. With file release on FSx for Lustre, there is no additional cost. However, if you release files that you later access again from the file system, you will incur normal Amazon S3 request and data retrieval costs where applicable when those files are read back into the file system.
To learn more, visit the Amazon FSx for Lustre Page, and please send feedback to AWS re:Post for Amazon FSx for Lustre or through your usual AWS support contacts.
– Veliswa
Post Syndicated from Matt Granger original https://www.youtube.com/watch?v=XmhD2sm6ClA
Post Syndicated from Virendhar Sivaraman original https://aws.amazon.com/blogs/big-data/monitor-data-pipelines-in-a-serverless-data-lake/
AWS serverless services, including but not limited to AWS Lambda, AWS Glue, AWS Fargate, Amazon EventBridge, Amazon Athena, Amazon Simple Notification Service (Amazon SNS), Amazon Simple Queue Service (Amazon SQS), and Amazon Simple Storage Service (Amazon S3), have become the building blocks for any serverless data lake, providing key mechanisms to ingest and transform data without fixed provisioning and the persistent need to patch the underlying servers. The combination of a data lake in a serverless paradigm brings significant cost and performance benefits. The advent of rapid adoption of serverless data lake architectures—with ever-growing datasets that need to be ingested from a variety of sources, followed by complex data transformation and machine learning (ML) pipelines—can present a challenge. Similarly, in a serverless paradigm, application logs in Amazon CloudWatch are sourced from a variety of participating services, and traversing the lineage across logs can also present challenges. To successfully manage a serverless data lake, you require mechanisms to perform the following actions:
In this post, we will walk you through a solution to efficiently track and analyze ETL jobs in a serverless data lake environment. By monitoring application logs, you can gain insights into job execution, troubleshoot issues promptly to ensure the overall health and reliability of data pipelines.
The serverless monitoring solution focuses on achieving the following goals:
To illustrate the solution, we create a serverless data lake with a monitoring solution. For simplicity, we create a serverless data lake with the following components:
The serverless monitoring solution is devised to be loosely coupled as plug-and-play components that complement an existing data lake. The Lambda-based ETL tasks state changes are tracked using AWS Lambda Destinations. We have used an SNS topic for routing both success and failure states for the Lambda-based tasks. In the case of AWS Glue-based tasks, we have configured EventBridge rules to capture state changes. These event changes are also routed to the same SNS topic. For demonstration purposes, this post only provides state monitoring for Lambda and AWS Glue, but you can extend the solution to other AWS services.
The following figure illustrates the architecture of the solution.

The architecture contains the following components:
The source code to implement this solution uses AWS Cloud Development Kit (AWS CDK) and is available on the GitHub repo monitor-serverless-datalake. This AWS CDK stack provisions required network components and the following:
You can also follow the instructions in the GitHub repo to deploy the serverless monitoring solution. It takes about 10 minutes to deploy this solution.
We still need a Slack channel to which the alerts are delivered. Complete the following steps:
The following screenshot shows the field names to use.

The following is a sample message for the preceding template.

datalake-monitoring secret.slack_webhook secret.
The next step is to load some sample data. Copy the sample data files to the landing bucket using the following command:
In the next sections, we show how Lambda functions, AWS Glue crawlers, and AWS Glue jobs work for data ingestion.
On the EventBridge console, enable the rules that trigger the lambda-success and lambda-fail functions every 5 minutes:

After a few minutes, the failure events are relayed to the Slack channel. The following screenshot shows an example message.

Disable the rules after testing to avoid repeated messages.
On the AWS Glue console, navigate to the Crawlers page. Here you can start the following crawlers:
In a minute, the glue-crawler-fail crawler’s status changes to Failed, which triggers a notification in Slack in near-real time.

On the AWS Glue console, navigate to the Jobs page, where you can start the following jobs:
In a few minutes, the glue-job-fail job status changes to Failed, which triggers a notification in Slack in near-real time.

The monitoring metrics are persisted in Amazon S3 for analysis and can be used of historical analysis.
On the Athena console, navigate to the monitor database and run the following query to find the service that failed the most often:

Over time with rich observability data – time series based monitoring data analysis will yield interesting findings.
The overall cost of the solution is less than one dollar but to avoid future costs, make sure to clean up the resources created as part of this post.
The post provided an overview of a serverless data lake monitoring solution that you can configure and deploy to integrate with enterprise serverless data lakes in just a few hours. With this solution, you can monitor a serverless data lake, send alerts in near-real time, and analyze performance metrics for all ETL tasks operating in the data lake. The design was intentionally kept simple to demonstrate the idea; you can further extend this solution with Athena and Amazon QuickSight to generate custom visuals and reporting. Check out the GitHub repo for a sample solution and further customize it for your monitoring needs.
 Virendhar (Viru) Sivaraman is a strategic Senior Big Data & Analytics Architect with Amazon Web Services. He is passionate about building scalable big data and analytics solutions in the cloud. Besides work, he enjoys spending time with family, hiking & mountain biking.
 Vivek Shrivastava is a Principal Data Architect, Data Lake in AWS Professional Services. He is a Bigdata enthusiast and holds 14 AWS Certifications. He is passionate about helping customers build scalable and high-performance data analytics solutions in the cloud. In his spare time, he loves reading and finds areas for home automation.
Post Syndicated from Veliswa Boya original https://aws.amazon.com/blogs/aws/welcome-to-aws-storage-day-2023/
Welcome to the fifth annual AWS Storage Day! This virtual event is happening today starting at 9:00 AM Pacific Time (12:00 PM Eastern Time) and is available for you to watch on the AWS On Air Twitch channel. The first AWS Storage Day was hosted in 2019, and this event has grown into an innovation day that we look forward to delivering to you every year. In last year’s Storage Day post, I wrote about the constant innovations in AWS Storage aimed at helping you put your data to work while keeping it secure and protected. This year, Storage Day is focused on storage for AI/ML, data protection and resiliency, and the benefits of moving to the cloud.
AWS Storage Day Key Themes
When it comes to storage for AI/ML, data volumes are increasing at an unprecedented rate, exploding from terabytes to petabytes and even to exabytes. With a modern data architecture on AWS, you can rapidly build scalable data lakes, use a broad and deep collection of purpose-built data services, scale your systems at a low cost without compromising performance, share data across organizational boundaries, and manage compliance, security, and governance, allowing you to make decisions with speed and agility at scale.
To train machine learning models and build Generative AI applications, you must have the right data strategy in place. So, I’m happy to see that, among the list of sessions to look forward to at the live event, the Optimize generative AI and ML with AWS Infrastructure session will discuss how you can transform your data into meaningful insights.
Whether you’re just getting started with the cloud, planning to migrate applications to AWS, or already building applications on AWS, we have resources to help you protect your data and meet your business continuity objectives. Our data protection and resiliency features and solutions can help you meet your business continuity goals and deliver disaster recovery during data loss events, across recovery point and time objectives (RPO and RTO). With the unprecedented data growth happening in the world today, determining where your data is stored, how it’s secured, and who has access to it is a higher priority than ever. Be sure to join the Protect data in AWS amid a rapidly evolving cyber landscape session to learn more.
When moving data to the cloud, you need to understand where you’re moving it for different use cases, the types of data you’re moving, and the network resources available, among other considerations. There are many reasons to move to the cloud, recently, Enterprise Strategy Group (ESG) validated that organizations reduced compute, networking, and storage costs by up to 66 percent by migrating on-premises workloads to AWS Cloud infrastructure. ESG confirmed that migrating on-premises workloads to AWS provides organizations with reduced costs, increased performance, improved operational efficiency, faster time to value, and improved business agility.
We have a number of sessions that discuss how to move to the cloud, based on your use case. I’m most looking forward to the Hybrid cloud storage and edge compute: AWS, where you need it session, which will discuss considerations for workloads that can’t fully move to the cloud.
Tune in to learn from experts about new announcements, leadership insights, and educational content related to the broad portfolio of AWS Storage services and features that address all these themes and more. Today, we have announcements related to Amazon Simple Storage Service (Amazon S3), Amazon FSx for Windows File Server, Amazon Elastic File System (Amazon EFS), Amazon FSx for OpenZFS, and more.
Let’s get into it.

15 Years of Amazon EBS
Not long ago, I was reading Jeff Barr’s post titled 15 Years of AWS Blogging! In this post, Jeff mentioned a few posts he wrote for the earliest AWS services and features. Amazon Elastic Block Store (Amazon EBS) is on this list as a service that simplifies the use of Amazon EC2.
Well, it’s been 15 years since the launch of Amazon EBS was announced, and today we celebrate 15 years of this service. If you were one of the original users who put Amazon EBS to good use and provided us with the very helpful feedback that helped us invent and simplify, iterate and improve, I’m sure you can’t believe how time flies. Today, Amazon EBS handles more than 100 trillion I/O operations daily, and over 390 million EBS volumes are created every day.
If you’re new to Amazon EBS, join us for a fireside chat with Matt Garman, Senior Vice President, Sales, Marketing, and Global Services at AWS, and learn the strategy and customer challenges behind the launch of the service in 2008. You’ll also hear from long-term EBS customer, Stripe, about its growth with EBS since Stripe was launched 12 years ago.
Amazon EBS has continuously improved its scalability and performance to support more customer workloads as the direct storage attachment for Amazon EC2 instances. With the launch of Amazon EC2 M7i instances, powered by custom 4th Generation Intel Xeon Scalable processors, on August 2, you can attach up to 128 Amazon EBS volumes, an increase from 28 on a previous generation M6i instance. The higher number of volume attachments means you can increase storage density per instance and improve resource utilization, reducing total compute cost.
You can host up to 127 containers per instance for larger database applications and scale them more cost effectively before needing to provision more instances and only pay for resources you need. With a higher number of volume attachments, you can fully utilize the memory and vCPU available on these powerful M7i instances as your database storage footprint grows. EBS is also increasing the number of multi-volume snapshots you can create, for up to 128 EBS volumes attached to an instance, enabling you to create crash-consistent backups of all volumes attached to an instance.
Join the 15 years of innovations with Amazon EBS session for a discussion about how the original vision for Amazon EBS has evolved to meet your growing demands for cloud infrastructure.
Mountpoint for Amazon S3
Now generally available, Mountpoint for Amazon S3 is a new open source file client that delivers high throughput access, lowering compute costs for data lakes on Amazon S3. Mountpoint for Amazon S3 is a file client that translates local file system API calls to S3 object API calls. Using Mountpoint for Amazon S3, you can mount an Amazon S3 bucket as a local file system on your compute instance, to access your objects through a file interface with the elastic storage and throughput of Amazon S3. Mountpoint for Amazon S3 supports sequential and random read operations on existing files, and sequential write operations for creating new files.
The Deep dive and demo of Mountpoint for Amazon S3 session demonstrates how to use the file client to access objects in Amazon S3 using file APIs, making it easier to store data at scale and maximize the value of your data with analytics and machine learning workloads. Read this blog post to learn more about Mountpoint for Amazon S3 and how to get started, including a demo.
Put Cold Storage to Work Faster with Amazon S3 Glacier Flexible Retrieval
Amazon S3 Glacier Flexible Retrieval improves data restore time by up to 85 percent, at no additional cost. Faster data restores automatically apply to the Standard retrieval tier when using Amazon S3 Batch Operations. These restores begin to return objects within minutes, so you can process restored data faster. Processing restored data in parallel with ongoing restores helps you accelerate data workflows and quickly respond to business needs. Now, whether you’re transcoding media, restoring operational backups, training machine learning models, or analyzing historical data, you can speed up your data restores from archive.
Coupled with the S3 Glacier improvements to restore throughput by up to 10 times for millions of objects announced in 2022, S3 Glacier data restores of all sizes now benefit from both faster starts and shorter completion times.

Join the Maximize the value of cold data with Amazon S3 Glacier session to learn how Amazon S3 Glacier is helping organizations of all sizes and from all industries transform their data archiving to unlock business value, increase agility, and save on storage costs. Read this blog post to learn more about the Amazon S3 Glacier Flexible Retrieval performance improvements and follow step-by-step guidance on how to get started with faster standard retrievals from S3 Glacier Flexible Retrieval.
Supporting a Broad Spectrum of File Workloads
To serve a broad spectrum of use cases that rely on file systems, we offer a portfolio of file system services, each targeting a different set of needs. Amazon EFS is a serverless file system built to deliver an elastic experience for sharing data across compute resources. Amazon FSx makes it easier and cost-effective for you to launch, run, and scale feature-rich, high-performance file systems in the cloud, enabling you to move to the cloud with no changes to your code, processes, or how you manage your data.
Power ML research and big data analytics with Amazon EFS
Amazon EFS offers serverless and fully scalable file storage, designed for high scalability in both storage capacity and throughput performance. Just last week, we announced enhanced support for faster read and write IOPS, making it easier to power more demanding workloads. We’ve improved the performance capabilities of Amazon EFS by adding support for up to 55,000 read IOPS and up to 25,000 write IOPS per file system. These performance enhancements help you to run more demanding workflows, such as machine learning (ML) research with KubeFlow, financial simulations with IBM Symphony, and big data processing with Domino Data Lab, Hadoop, and Spark.
Join the Build and run analytics and SaaS applications at scale session to hear how recent Amazon EFS performance improvements can help power more workloads.
Multi-AZ file systems on Amazon FSx for OpenZFS
You can now use a multi-AZ deployment option when creating file systems on Amazon FSx for OpenZFS, making it easier to deploy file storage that spans multiple AWS Availability Zones to provide multi-AZ resilience for business-critical workloads. With this launch, you can take advantage of the power, agility, and simplicity of Amazon FSx for OpenZFS for a broader set of workloads, including business-critical workloads like database, line-of-business, and web-serving applications that require highly available shared storage that spans multiple AZs.
The new multi-AZ file systems are designed to deliver high levels of performance to serve a broad variety of workloads, including performance-intensive workloads such as financial services analytics, media and entertainment workflows, semiconductor chip design, and game development and streaming, up to 21 GB per second of throughput and over 1 million IOPS for frequently accessed cached data, and up to 10 GB per second and 350,000 IOPS for data accessed from persistent disk storage.
Join the Migrate NAS to AWS to reduce TCO and gain agility session to learn more about multi-AZs with Amazon FSx for OpenZFS.
New, Higher Throughput Capacity Levels on Amazon FSx for Windows File Server
Performance improvements for Amazon FSx for Windows File Server help you accelerate time-to-results for performance-intensive workloads such as SQL Server databases, media processing, cloud video editing, and virtual desktop infrastructure (VDI).
We’re adding four new, higher throughput capacity levels to increase the maximum I/O available up to 12 GB per second from the previous I/O of 2 GB per second. These throughput improvements come with correspondingly higher levels of disk IOPS, designed to deliver an increase up to 350,000 IOPS.
In addition, by using FSx for Windows File Server, you can provision IOPS higher than the default 3 IOPS per GiB for your SSD file system. This allows you to scale SSD IOPS independently from storage capacity, allowing you to optimize costs for performance-sensitive workloads.
Join the Migrate NAS to AWS to reduce TCO and gain agility session to learn more about the performance improvements for Amazon FSx for Windows File Server.
Logically Air-Gapped Vault for AWS Backup
AWS Backup is a fully managed, policy-based data protection solution that enables customers to centralize and automate backup restores across 19 AWS services (spanning compute, storage, and databases) and third-party applications such as VMware Cloud on AWS and on-premises, as well as SAP HANA on Amazon EC2.
Today, we’re announcing the preview of logically air-gapped vault as a new type of AWS Backup Vault that acts as an additional layer of protection to mitigate against malware events. With logically air-gapped vault, customers can recover their application data through a different trusted account.
Join the Deep dive on data recovery for ransomware events session to learn more about logically air-gapped vault for AWS Backup.
Copy Data to and from Other Clouds with AWS DataSync
AWS DataSync is an online data movement and discovery service that simplifies data migration and helps you quickly, easily, and securely transfer your file or object data to, from, and between AWS storage services. In addition to support of data migration to and from AWS storage services, DataSync supports copying to and from other clouds such as Google Cloud Storage, Azure Files, and Azure Blob Storage. Using DataSync, you can move your object data at scale between Amazon S3 compatible storage on other clouds and AWS storage services such as Amazon S3. We’re now expanding the support of DataSync for copying data to and from other clouds to include DigitalOcean Spaces, Wasabi Cloud Storage, Backblaze B2 Cloud Storage, Cloudflare R2 Storage, and Oracle Cloud Storage.
Join the Identify and accelerate data migrations at scale session to learn more about this expanded support for DataSync.
Join Us Online
Join us today for the AWS Storage Day virtual event on the AWS On Air channel on Twitch. The event will be live starting at 9:00 AM Pacific Time (12:00 PM Eastern Time) on August 9. All sessions will be available on demand approximately two days after Storage Day.
We look forward to seeing you on Twitch!
– Veliswa
Post Syndicated from Cliff Robinson original https://www.servethehome.com/sk-hynix-sampling-321-layer-1tb-nand-for-denser-ssds/
SK hynix is now sampling 321-layer 1Tb NAND to enable even denser SSDs than its previous generation 238-layer 512Gb NAND
The post SK hynix Sampling 321-Layer 1Tb NAND For Denser SSDs appeared first on ServeTheHome.
Post Syndicated from Jeff Barr original https://aws.amazon.com/blogs/aws/mountpoint-for-amazon-s3-generally-available-and-ready-for-production-workloads/
Mountpoint for Amazon S3 is an open source file client that makes it easy for your file-aware Linux applications to connect directly to Amazon Simple Storage Service (Amazon S3) buckets. Announced earlier this year as an alpha release, it is now generally available and ready for production use on your large-scale read-heavy applications: data lakes, machine learning training, image rendering, autonomous vehicle simulation, ETL, and more. It supports file-based workloads that perform sequential and random reads, sequential (append only) writes, and that don’t need full POSIX semantics.
Why Files?
Many AWS customers use the S3 APIs and the AWS SDKs to build applications that can list, access, and process the contents of an S3 bucket. However, many customers have existing applications, commands, tools, and workflows that know how to access files in UNIX style: reading directories, opening & reading existing files, and creating & writing new ones. These customers have asked us for an official, enterprise-ready client that supports performant access to S3 at scale. After speaking with these customers and asking lots of questions, we learned that performance and stability were their primary concerns, and that POSIX compliance was not a necessity.
When I first wrote about Amazon S3 back in 2006 I was very clear that it was intended to be used as an object store, not as a file system. While you would not want use the Mountpoint / S3 combo to store your Git repositories or the like, using it in conjunction with tools that can read and write files, while taking advantage of S3’s scale and durability, makes sense in many situations.
All About Mountpoint
Mountpoint is conceptually very simple. You create a mount point and mount an Amazon S3 bucket (or a path within a bucket) at the mount point, and then access the bucket using shell commands (ls, cat, dd, find, and so forth), library functions (open, close, read, write, creat, opendir, and so forth) or equivalent commands and functions as supported in the tools and languages that you already use.
Under the covers, the Linux Virtual Filesystem (VFS) translates these operations into calls to Mountpoint, which in turns translates them into calls to S3: LIST, GET, PUT, and so forth. Mountpoint strives to make good use of network bandwidth, increasing throughput and allowing you to reduce your compute costs by getting more work done in less time.
Mountpoint can be used from an Amazon Elastic Compute Cloud (Amazon EC2) instance, or within an Amazon Elastic Container Service (Amazon ECS) or Amazon Elastic Kubernetes Service (EKS) container. It can also be installed on your existing on-premises systems, with access to S3 either directly or over an AWS Direct Connect connection via AWS PrivateLink for Amazon S3.
Installing and Using Mountpoint for Amazon S3
Mountpoint is available in RPM format and can easily be installed on an EC2 instance running Amazon Linux. I simply fetch the RPM and install it using yum:
For the last couple of years I have been regularly fetching images from several of the Washington State Ferry webcams and storing them in my wsdot-ferry bucket:

I collect these images in order to track the comings and goings of the ferries, with a goal of analyzing them at some point to find the best times to ride. My goal today is to create a movie that combines an entire day’s worth of images into a nice time lapse. I start by creating a mount point and mounting the bucket:
I can traverse the mount point and inspect the bucket:
I can create my animation with a single command:
And here’s what I get:

As you can see, I used Mountpoint to access the existing image files and to write the newly created animation back to S3. While this is a fairly simple demo, it does show how you can use your existing tools and skills to process objects in an S3 bucket. Given that I have collected several million images over the years, being able to process them without explicitly syncing them to my local file system is a big win.
Mountpoint for Amazon S3 Facts
Here are a couple of things to keep in mind when using Mountpoint:
Pricing – There are no new charges for the use of Mountpoint; you pay only for the underlying S3 operations. You can also use Mountpoint to access requester-pays buckets.
Performance – Mountpoint is able to take advantage of the elastic throughput offered by S3, including data transfer at up to 100 Gb/second between each EC2 instance and S3.
Credentials – Mountpoint accesses your S3 buckets using the AWS credentials that are in effect when you mount the bucket. See the CONFIGURATION doc for more information on credentials, bucket configuration, use of requester pays, some tips for the use of S3 Object Lambda, and more.
Operations & Semantics – Mountpoint supports basic file operations, and can read files up to 5 TB in size. It can list and read existing files, and it can create new ones. It cannot modify existing files or delete directories, and it does not support symbolic links or file locking (if you need POSIX semantics, take a look at Amazon FSx for Lustre). For more information about the supported operations and their interpretation, read the SEMANTICS document.
Storage Classes – You can use Mountpoint to access S3 objects in all storage classes except S3 Glacier Flexible Retrieval, S3 Glacier Deep Archive, S3 Intelligent-Tiering Archive Access Tier, and S3 Intelligent-Tiering Deep Archive Access Tier.
Open Source – Mountpoint is open source and has a public roadmap. Your contributions are welcome; be sure to read our Contributing Guidelines and our Code of Conduct first.
Hop On
As you can see, Mountpoint is really cool and I am guessing that you are going to find some awesome ways to put it to use in your applications. Check it out and let me know what you think!
— Jeff;
Post Syndicated from Macey Neff original https://aws.amazon.com/blogs/compute/building-a-high-performance-windows-workstation-on-aws-for-graphics-intensive-applications/
This blog post is written by Mike Lim, Senior Public Sector SA.
Video editing, professional visualization, and video games can be resource demanding applications that require high performance Windows workstations with GPUs. When developing these resource demanding applications, a high-performance remote display protocol is desirable in order to access the instances’ graphical desktops from the internet. Using NICE DCV provides a bandwidth-adaptive streaming protocol that provides near real-time responsiveness without compromising image quality. Customers using NICE DCV can leverage Amazon EC2 G4 and Amazon EC2 G5 GPU instances which support graphic-intensive applications in the cloud using a pay-as-you-go pricing model. By using Amazon Elastic Compute Cloud (Amazon EC2) with NICE DCV, customers can run graphically intensive applications remotely and stream their user interface to simpler client machines, eliminating the need for expensive dedicated workstations.
This post shows how you can provision and manage an Amazon EC2 GPU Windows instance and access it via the high-performance NICE DCV remote display protocol.
The solution is illustrated in the following figure.

Figure 1: Solution overview
We used the AWS CloudFormation Infrastructure-as-Code (IaC) service to provision our solution. Our CloudFormation template provides the following functionality:
1. Using AWS CloudFormation, you can specify your choice of EC2 instance type, the Amazon Virtual Private Cloud (Amazon VPC), and subnet in which to provision. You also have the option to assign a static IPv4 address. NICE DCV server is installed to provide remote access, and you can specify the choice of graphics driver to install.
2. A security group is created and associated with the EC2 instance, and it acts as a firewall.
3. An AWS Identity and Access Management (IAM) role is created and associated with the EC2 instance using an instance profile. It lets your instance access Amazon Simple Storage Service (Amazon S3) buckets for NICE DCV server license validation, and download and install the latest graphics drivers.
4. The IAM role also makes sure that your EC2 instance can be managed by AWS Systems Manager. This service provides in-browser command line and graphical access to your Windows instance via Session Manager and Fleet Manager from the AWS Management Console.
The following sections walk through the steps to setup and maintain your graphics workstation. To begin, you need an AWS account. For this walkthrough, we provision a g5.xlarge instance for cloud gaming.
For best performance and lowest latency, you will want to provision EC2 in the AWS Region nearest to you. Before proceeding, verify that the g5.xlarge instance type is available in your desired AWS Region, and the Availability Zones (AZs) in which it is available.
Log in to your Amazon EC2 console and select your AWS Region. From the navigation pane, choose Instance Types to view the instance types available. In the search bar, filter instances types to the specific instance type you want, in this case g5.xlarge. Toggle the display preferences (gear) icon to display Availability zones column.
In the following screenshot, the g5.xlarge instance is available in two of the three AZs in eu-west-2 Europe London Region.

Figure 2: Amazon EC2 console instance types
Your AWS account has a limit on the number and type of EC2 instances types you can run, and you need to make sure you have enough quota to run the g5.xlarge instance.
Go to the Service Quotas console for your AWS Region. Under AWS services in the navigation pane, select Amazon Elastic Compute Cloud (Amazon EC2) and search for Running On-Demand G and VT instances. Verify that the Applied quota value number is equal or more than the number of vCPUs for the instance size you need. In the following screenshot, the applied quota value is 64. It lets us launch instance sizes from 4 vCPUs xlarge up to 64 vCPUs 16xlarge instance size.

Figure 3: Service Quotas console
You can request a higher quota value by selecting Request quota increase.
Download the CloudFormation template file from aws-samples GitHub repository. Go to the CloudFormation console for your AWS Region to create a stack, and upload your downloaded file.
The CloudFormation parameters page is divided into the following sections:
We go through the configuration settings for each section in detail.
In this section, we select the Windows Amazon Machine Image (AMI) to use, EC2 instance type to provision, and graphics driver to install. The default AMI is Microsoft Windows Server 2022.
Replace the instanceType value with g5.xlarge.

Figure 4: CloudFormation parameters: AMI and instance type
Select driverType based on your instance type and the following use case:
Note that GRID and NVIDIA gaming drivers’ downloads are available to AWS customers only. Upon installation of the software, you are bound by the terms of the NVIDIA GRID Cloud End User License Agreement.
For our walkthrough, select NVIDIA-Gaming for driverType.
In this section, we specify the VPC and subnet in which to provision our EC2 instance. You can select default VPC from the vpcID dropdown. Make sure that the subnetID value you select is in your selected VPC and resides in an AZ that has your instance type offering. You can also change the EC2 instance name.
Select Yes for the assignStaticIP option if you want to associate a static Internet IPv4 address. Note that there is a small hourly charge when the instance is not running.

Figure 5: CloudFormation parameters: Amazon EC2 configuration
Here, we specify the source prefixes allowed to access our instance. The default values allow access from all addresses. To secure access to your instance, you may want to limit the source prefix to your IP address.
To get your IPv4 address, go to https://checkip.amazonaws.com and append /32 to the value for ingressIPv4. The default VPC and subnet is IPv4 only. Therefore, you can enter ::1/128 to explicitly block all IPv6 access for ingressIPv6.

Figure 6: CloudFormation parameters: Allowed inbound source IP prefixes
The default Amazon Elastic Block Store (Amazon EBS) volume size is 30 GiB. You can specify a larger size by changing the volumeSize value.

Figure 7: CloudFormation parameters: Amazon EBS volume configuration
Continue to provision your stack.
NICE DCV provides an HTML5 client for web browser access. For performance and additional features, such as QUIC UDP transport protocol support and USB remotization support, install the native client from the NICE DCV download page. NICE DCV offers native clients for Windows, MacOS for both Intel and Apple M1 processors, and modern Linux distributions including RHEL, SUSE Linux, and Ubuntu.
Once provisioning is complete, go to the Outputs section.

Figure 8: CloudFormation Outputs
The following URLs are available.
We go through the purpose of each URL in the following sections.
To log in, you must specify an administrator password. Open the SSMsessionManager value URL in a new browser tab and run the command net user administrator <YOUR-PASSWORD> where <YOUR-PASSWORD> is the password on which you decided.

Figure 9: Systems Manager session manager
Copy DCVWebConsole value, open the NICE DCV client from your local machine and either use the copied value or the IP address to connect. Log in as administrator with the password that you have configured. Alternatively, enter the URL in the format dcv://<EC2-IP-Address> in a browser URL bar to automatically launch and connect a locally installed NICE DCV client to your EC2 instance.

Figure 10: NICE DCV client
Use this link to manage your EC2 instance in the Amazon EC2 console. If you did not select the static IP address option, then use this page to get the assigned IP address whenever you stop and start your instance.
The RdpConnect link provides in-browser Remote Desktop Protocol (RDP) console access to your Windows instance. Choose User credentials for Authentication Type. Enter administrator for username and the password that you have configured.

Figure 11: Fleet Manager Remote Desktop
To update NICE DCV server, log in via Fleet Manager Remote Desktop and run c:\users\administrator\update-DCV.cmd script. In the following screenshot, we successfully upgraded NICE DCV server from version 2022.2-14521 to 2023.0-15065.

Figure 12: Updating NICE DCV server
You can use the download-<DRIVER_TYPE>-driver.cmd batch file to download the latest graphics driver for your instance type GPU. Downloaded files are located in the Downloads\Drivers folder.

Figure 13: Graphics driver download scripts
AWS Command Line interface (AWS CLI v2) is installed in the instance. You can use it to view the different versions available on the driver S3 bucket. For example, the command aws s3 ls –recursive s3://nvidia-gaming/windows/ | sort /R lists NVIDIA gaming drivers available for download. NVIDIA GRID and AMD drivers are in the s3://ec2-windows-nvidia-drivers and s3://ec2-amd-windows-drivers S3 buckets respectively.

Figure 14: Listing graphics drivers on S3 bucket
Use the command aws s3 cp s3://<S3_BUCKET_PATH>/<FILE-NAME>. to copy a specific driver from the S3 bucket to your local directory.
You can refer to Install NVIDIA drivers on Windows instances and Install AMD drivers on Windows instances for NVIDIA and AMD drivers installation instructions respectively.
You may want to customize the instance to your needs. For NVIDIA GPU instances, you can optimize GPU settings to achieve the best performance.
If you are doing video editing, then you can enable high color accuracy, configure multi-channel audio, and enable accurate audio/video sync. For gaming, you may enable gamepad support to use a DualShock 4 or Xbox 360 controller. NICE DCV session storage is enabled. This lets you transfer files using NICE DCV client. More configuration options are available from the NICE DCV User Guide and Administrator Guide.
When you have finished using your EC2 instance, you can release all provisioned resources by going to CloudFormation console to delete your stack.
The Amazon G4 and G5 GPU instance types are suitable for graphics-intensive applications, and NICE DCV provides a responsive and high image quality display protocol for remote access. Using the CloudFormation template from amazon-ec2-nice-dcv-samples GitHub site, you can build and maintain your own high performance Windows graphics workstation in the AWS cloud
Post Syndicated from Channy Yun original https://aws.amazon.com/blogs/aws/new-improve-amazon-s3-glacier-flexible-restore-time-by-up-to-85-using-standard-retrieval-tier-and-s3-batch-operations/
Last year, Amazon S3 Glacier celebrated its tenth anniversary. Amazon S3 Glacier is the leader in cloud cold storage, and I wrote about its innovations over the last decade.
The Amazon S3 Glacier storage classes provide you with long-term, secure, and durable storage options to optimally archive your data at the lowest cost. The Amazon S3 Glacier storage classes (Amazon S3 Glacier Instant Retrieval, Amazon S3 Glacier Flexible Retrieval, and Amazon S3 Glacier Deep Archive) are purpose-built for colder data, providing you with retrieval flexibility from milliseconds to days, in addition to the ability to store archive data for as low as $1 per terabyte per month.
Many customers tell us that they are keeping their data for longer periods of time because they recognize its future value potential, and that they are already monetizing subsets of their archival data, or plan to use large sets of their archive data in the future. Modern data archiving is not only about optimizing storage costs for cold data; it’s also about setting up mechanisms so that when you need to put that data to work for your business, you can access it as quickly as your business requirements demand.
In 2022, AWS customers restored over 32 billion objects from Amazon S3 Glacier. Customers need to retrieve archived objects quickly when transcoding media, restoring operational backups, training machine learning (ML) models, or analyzing historical data. While customers using S3 Glacier Instant Retrieval can access their data in just milliseconds, S3 Glacier Flexible Retrieval is lower cost and provides three retrieval options: expedited retrievals in 1–5 minutes, standard retrievals in 3–5 hours, and free bulk retrievals in 5–12 hours. S3 Glacier Deep Archive is our lowest cost storage class and provides data retrieval within 12 hours using the standard retrieval option or 48 hours using the bulk retrieval option.
In November 2022, Amazon S3 Glacier improved restore throughput by up to 10 times at no additional cost when retrieving large volumes of archived data in S3 Glacier Flexible Retrieval and S3 Glacier Deep Archive. With Amazon S3 Batch Operations, you can automatically initiate requests at a faster rate, allowing you to restore billions of objects containing petabytes of data.
To continue the decade-long trend of cold storage innovation, we are announcing today the general availability of faster Standard retrievals from S3 Glacier Flexible Retrieval by up to 85 percent, at no additional cost. Faster data restores automatically apply to the Standard retrieval tier when using S3 Batch Operations.
Using S3 Batch Operations, you can restore archived data at scale by providing a manifest of objects to be retrieved and specifying a retrieval tier. With S3 Batch Operations, restores in the Standard retrieval tier now typically begin to return objects to you within minutes, down from 3–5 hours, so you can easily speed up your data restores from archive.
Additionally, S3 Batch Operations improves overall restore throughput by applying new performance optimizations to your jobs. As a result, you can restore your data faster and process restored objects sooner. Processing restored data in parallel with ongoing restores helps you accelerate data workflows and quickly respond to business needs.
Getting Started with Faster Standard Retrievals from S3 Glacier Flexible Retrieval
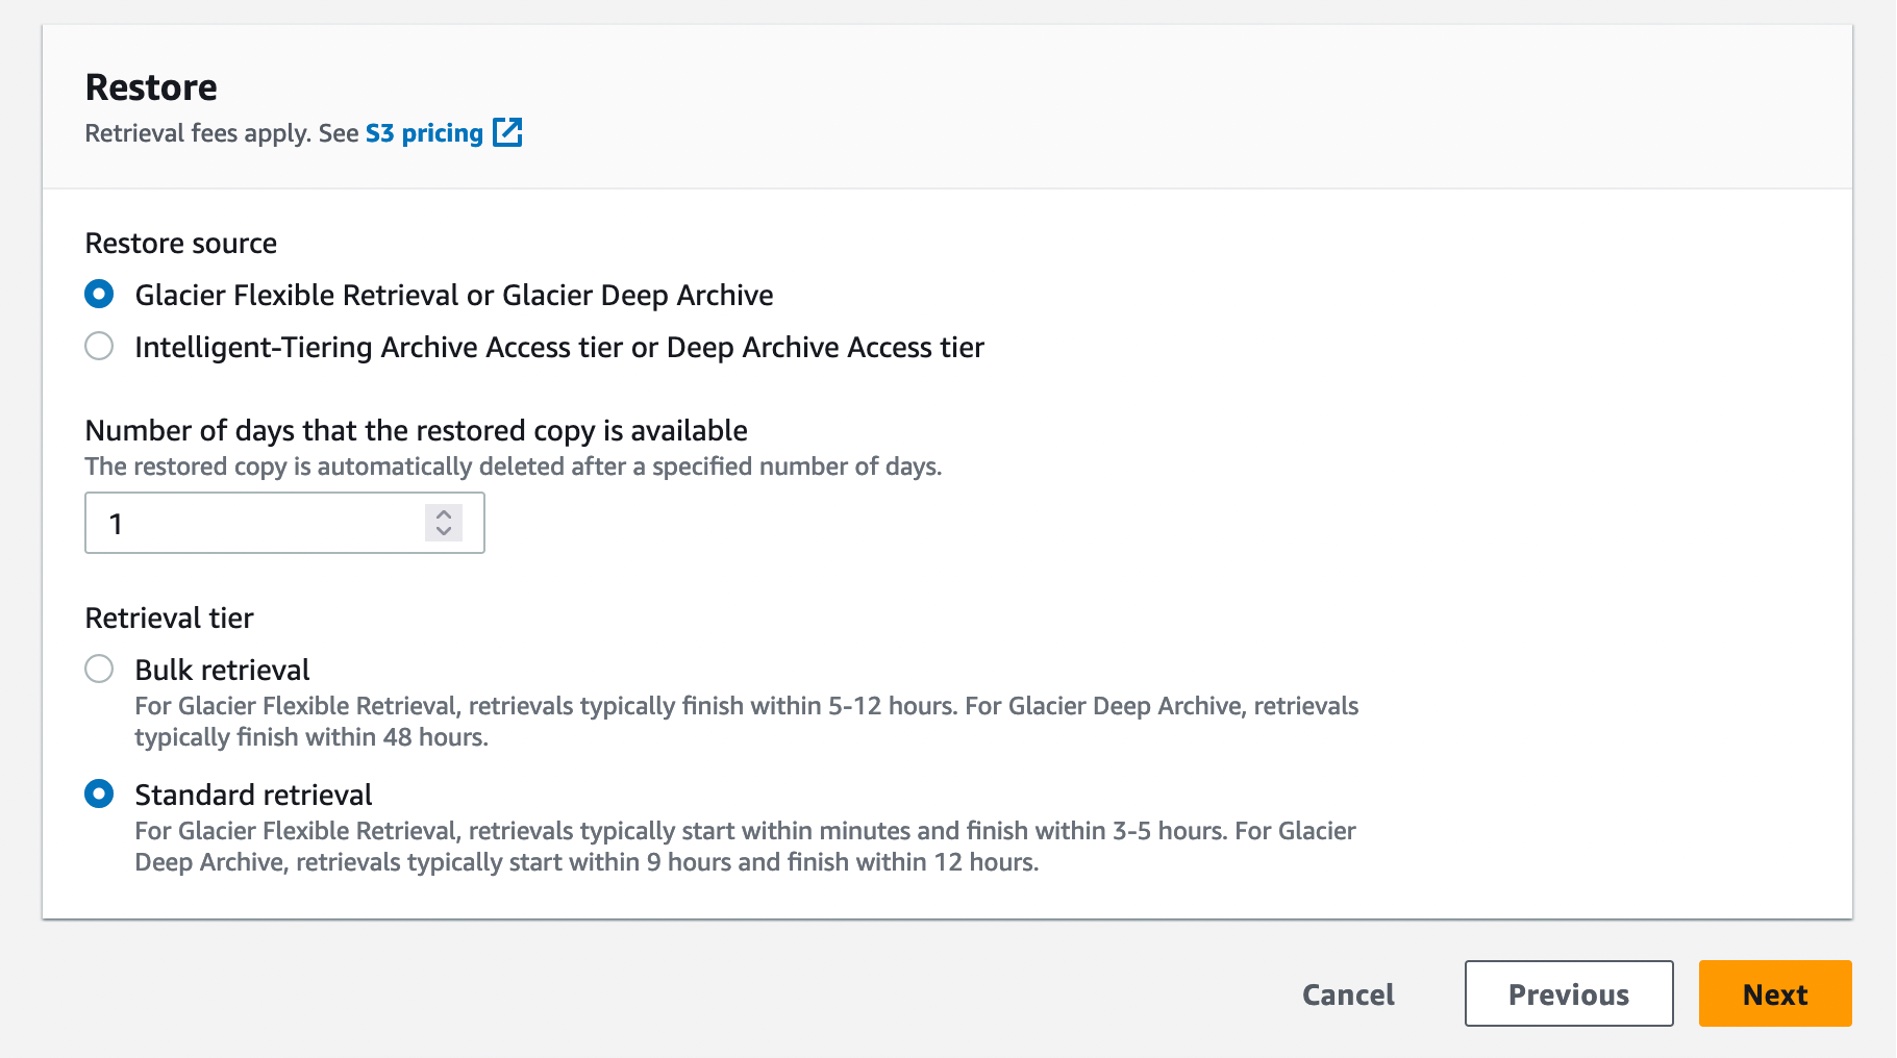
To restore archived data with this performance improvement, you can use S3 Batch Operations to perform both large- and small-scale batch operations on S3 objects. S3 Batch Operations can perform a single operation on lists of S3 objects that you specify. You can use S3 Batch Operations through the AWS Management Console, AWS Command Line Interface (AWS CLI), SDKs, or REST API.
To create a batch job, choose Batch Operations on the left navigation pane of the Amazon S3 console and choose Create job. You can select one of the manifest formats, a list of S3 objects that contains object keys that you want to retrieve. If your manifest format is a CSV file, each row in the file must include the bucket name, object key, and, optionally, the object version.

In the next step, choose the operation that you want to perform on all objects listed in the manifest. The Restore operation initiates restore requests for archived objects on a list of S3 objects that you specify. Using a restore operation results in a restore request for every object that is specified in the manifest.
When you restore with the Standard retrieval tier from the S3 Glacier Flexible Retrieval storage class, you automatically get faster retrievals.
You can also create a restore job with S3InitiateRestoreObject job using the AWS CLI:
$aws s3control create-job \
     --region us-east-1 \
     --account-id 123456789012 \
     --operation '{"S3InitiateRestoreObject": { "ExpirationInDays": 1, "GlacierJobTier":"STANDARD"} }' \
     --report '{"Bucket":"arn:aws:s3:::reports-bucket ","Prefix":"batch-op-restore-job", "Format":" S3BatchOperations_CSV_20180820","Enabled":true,"ReportScope":"FailedTasksOnly"}' \
     --manifest '{"Spec":{"Format":"S3BatchOperations_CSV_20180820", "Fields":["Bucket","Key"]},"Location":{"ObjectArn":"arn:aws:s3:::inventory-bucket/inventory_for_restore.csv", "ETag":"<ETag>"}}' \
     --role-arn arn:aws:iam::123456789012:role/s3batch-role
You can then check the status of the job submission of the requests by running the following CLI command:
$ aws s3control describe-job \
     --region us-east-1 \
     --account-id 123456789012 \
     --job-id <JobID> \
     --query 'Job'.'ProgressSummary'
You can view and update the job status, add notifications and logging, track job failures, and generate completion reports. S3 Batch Operations job activity is recorded as events in AWS CloudTrail. For tracking job events, you can create a custom rule in Amazon EventBridge and send these events to the target notification resource of your choice, such as Amazon Simple Notification Service (Amazon SNS).
When you create an S3 Batch Operations job, you can also request a completion report for all tasks or just for failed tasks. The completion report contains additional information for each task, including the object key name and version, status, error codes, and descriptions of any errors.
For more information, see Tracking job status and completion reports in the Amazon S3 User Guide.
Here is the result of a sample retrieval job with 250 objects, each sized 100 MB. As you can see from the Previous restore performance line (blue line at the right), these restores would typically finish in 3–5 hours using Standard retrievals. Now, when you use Standard retrievals with S3 Batch Operations, your job typically starts within minutes, as shown in the Improved restore performance line (orange line at the left), improving data restore time by up to 85 percent.

To learn more, see Restoring archived objects at scale from the Amazon S3 Glacier storage classes on the AWS Storage Blog and Restoring an archived object in the Amazon S3 User Guide.
Now Available
Faster standard retrievals for Amazon S3 Glacier Flexible Retrieval are now available in all AWS Regions, including the AWS GovCloud (US) Regions and China Regions. This performance improvement is available to you at no additional cost. You are charged for S3 Batch Operations and data retrievals. For more information, see the S3 pricing page.
 Lastly, we published a new ebook titled “Maximize the value of cold storage with Amazon S3 Glacier“. Read this ebook to learn how Amazon S3 Glacier is helping organizations of all sizes and from all industries transform their data archiving to unlock business value, increase agility, and save on storage costs.
To learn more, visit the S3 Glacier storage classes page and getting started guide, and send feedback to AWS re:Post for S3 Glacier or through your usual AWS Support contacts.
I’m really excited for you to start using this new feature, and I look forward to hearing about even more ways you are reinventing your business with archive data.
— Channy
Post Syndicated from corbet original https://lwn.net/Articles/940912/
Security updates have been issued by Debian (cjose, hdf5, and orthanc), Fedora (java-17-openjdk and seamonkey), Red Hat (curl, dbus, iperf3, kernel, kpatch-patch, libcap, libxml2, nodejs:16, nodejs:18, postgresql:10, postgresql:12, postgresql:13, and python-requests), SUSE (bluez, cjose, gstreamer-plugins-bad, gstreamer-plugins-base, gstreamer-plugins-good, gstreamer-plugins-ugly, keylime, openssl-1_1, openssl-3, pipewire, poppler, qemu, rubygem-actionpack-4_2, rubygem-actionpack-5_1, rust1.71, tomcat, webkit2gtk3, and wireshark), and Ubuntu (binutils, dotnet6, dotnet7, openssh, php-dompdf, and unixodbc).
Post Syndicated from Srinivasa Shaik original https://aws.amazon.com/blogs/architecture/how-thomson-reuters-monitors-and-tracks-aws-health-alerts-at-scale/
Thomson Reuters Corporation is a leading provider of business information services. The company’s products include highly specialized information-enabled software and tools for legal, tax, accounting and compliance professionals combined with the world’s most trusted global news service: Reuters.
Thomson Reuters is committed to a cloud first strategy on AWS, with thousands of applications hosted on AWS that are critical to its customers, with a growing number of AWS accounts that are used by different business units to deploy the applications. Service Management in Thomson Reuters is a centralized team, who needs an efficient way to measure, monitor and track the health of AWS services across the AWS environment. AWS Health provides the required visibility to monitor the performance and availability of AWS services and scheduled changes or maintenance that may impact their applications.
With approximately 16,000 AWS Health events received in 2022 alone due to the scale at which Thomson Reuters is operating on AWS, manually tracking AWS Health events is challenging. This necessitates a solution to provide centralized visibility of Health alerts across the organization, and an efficient way to track and monitor the Health events across the AWS accounts. Thomson Reuters requires retaining AWS Health event history for a minimum of 2 years to derive indicators affecting performance and availability of applications in the AWS environment and thereby ensuring high service levels to customers. Thomson Reuters utilizes ServiceNow for tracking IT operations and Datadog for infrastructure monitoring which is integrated with AWS Health to measure and track all the events and estimate the health performance with key indicators. Before this solution, Thomson Reuters didn’t have an efficient way to track scheduled events, and no metrics to identify the applications impacted by these Health events.
In this post, we will discuss how Thomson Reuters has implemented a solution to track and monitor AWS Health events at scale, automate notifications, and efficiently track AWS scheduled changes. This gives Thomson Reuters visibility into the health of AWS resources using Health events, and allows them to take proactive measures to minimize impact to their applications hosted on AWS.
Thomson Reuters leverages AWS Organizations to centrally govern their AWS environment. AWS Organization helps to centrally manage accounts and resources, optimize the cost, and simplify billing. The AWS environment in Thomson Reuters has a dedicated organizational management account to create Organizational Units (OUs), and policies to manage the organization’s member accounts. Thomson Reuters enabled organizational view within AWS Health, which once activated provides an aggregated view of AWS Health events across all their accounts (Figure 1).

Figure 1. Architecture to track and monitor AWS Health events
Let us walk through the architecture of this solution:
AWS Health Event Type “Account Notification” provides information about the administration or security of AWS accounts and services. These events are mostly informative, but some of them need urgent action, and tracking each of these events within Thomson Reuters incident management is substantial. Thomson Reuters has decided to route these events to Datadog, which is monitored by the Global Command Center from the centralized Service Management team. All other AWS Health Event types are tracked using ServiceNow.
Thomson Reuters leverages ServiceNow for incident management and change management across the organization, including both AWS cloud and on-premises applications. This allows Thomson Reuters to continue using the existing proven process to track scheduled changes in AWS through the ServiceNow change management process and AWS Health issues and investigations by using ServiceNow incident management, notify relevant teams, and monitor until resolution. Any AWS service maintenance or issues reported through AWS Health are tracked in ServiceNow.
One of the challenges while processing thousands of AWS Health events every month is also to identify and track events that has the potential to cause significant impact to the applications. Thomson Reuters decided to exclude events that are not relevant for Thomson Reuters hosted Regions, or specific AWS services. The process of identifying events to include is a continuous iterative effort, relying on the data captured in DynamoDB tables and from experiences of different teams. AWS EventBridge simplifies the process of filtering out events by eliminating the need to develop a custom application.
ServiceNow is used to create various dashboards which are important to Thomson Reuters leadership to view the health of the AWS environment in a glance, and detailed dashboards for individual application, business units and AWS Regions are also curated for specific requirements. This solution allows Thomson Reuters to capture metrics which helps to understand the scheduled changes that AWS performs and identify the underlying resources that are impacted in different AWS accounts. The ServiceNow incidents created from Health events are used to take real-time actions to mitigate any potential issues.
Thomson Reuters has a business requirement to persist AWS Health event history for a minimum of 2 years, and a need for customized dashboards for leadership to view performance and availability metrics across applications. This necessitated the creation of dashboards in ServiceNow. Figures 2, 3, and 4 are examples of dashboards that are created to provide a comprehensive view of AWS Health events across the organization.

Figure 2. ServiceNow dashboard with a consolidated view of AWS Health events

Figure 3. ServiceNow dashboard with a consolidated view of AWS Health events

Figure 4. ServiceNow dashboard showing AWS Health events
Thomson Reuters leverages Datadog as its strategic platform to observe, monitor, and track the infrastructure, applications and more. Health events with the category type Account Notification are forwarded to Datadog and are monitored by Thomson Reuters Global Command Center part of the Service Management. Account notifications are important to track as they contain information about administration or security of AWS accounts. Like ServiceNow, Datadog is also used to curate separate dashboards with unique Datadog monitors for monitoring and tracking these events (Figure 5). Currently, the Thomson Reuters Service Management team are the main consumers of these Datadog alerts, but in the future the strategy would be to route relevant and important notifications only to the concerned application team by ensuring a mandatory and robust tagging standards on the existing AWS accounts for all AWS resource types.

Figure 5. Datadog dashboard for AWS Health event type account notification
Thomson Reuters will continue to enhance the logic for identifying important Health events that require attention, reducing noise by filtering out unimportant ones. Thomson Reuters plan to develop a self-service subscription model, allowing application teams to opt into the Health events related to their applications.
The next key focus will also be to look at automating actions for specific AWS Health scheduled events wherever possible, such as responding to maintenance with AWS System Manager Automation documents.
By using this solution, Thomson Reuters can effectively monitor and track AWS Health events at scale using the preferred internal tools ServiceNow and Datadog. Integration with ServiceNow allowed Thomson Reuters to measure and track all the events and estimate the health performance with key indicators that can be generated from ServiceNow. This architecture provided an efficient way to track the AWS scheduled changes, capture metrics to understand the various schedule changes that AWS is doing and resources that are getting impacted in different AWS accounts. This solution provides actionable insights from the AWS Health events, allowing Thomson Reuters to take real-time actions to mitigate impacts to the applications and thus offer high Service levels to Thomson Reuters customers.
Post Syndicated from Dina Kozlov original http://blog.cloudflare.com/introducing-per-hostname-tls-settings/


One of the goals of Cloudflare is to give our customers the necessary knobs to enable security in a way that fits their needs. In the realm of SSL/TLS, we offer two key controls: setting the minimum TLS version, and restricting the list of supported cipher suites. Previously, these settings applied to the entire domain, resulting in an “all or nothing” effect. While having uniform settings across the entire domain is ideal for some users, it sometimes lacks the necessary granularity for those with diverse requirements across their subdomains.
It is for that reason that we’re excited to announce that as of today, customers will be able to set their TLS settings on a per-hostname basis.
In an ideal world, every domain could be updated to use the most secure and modern protocols without any setbacks. Unfortunately, that's not the case. New standards and protocols require adoption in order to be effective. TLS 1.3 was standardized by the IETF in April 2018. It removed the vulnerable cryptographic algorithms that TLS 1.2 supported and provided a performance boost by requiring only one roundtrip, as opposed to two. For a user to benefit from TLS 1.3, they need their browser or device to support the new TLS version. For modern browsers and devices, this isn’t a problem – these operating systems are built to dynamically update to support new protocols. But legacy clients and devices were, obviously, not built with the same mindset. Before 2015, new protocols and standards were developed over decades, not months or years, so the clients were shipped out with support for one standard — the one that was used at the time.
If we look at Cloudflare Radar, we can see that about 62.9% of traffic uses TLS 1.3. That’s quite significant for a protocol that was only standardized 5 years ago. But that also means that a significant portion of the Internet continues to use TLS 1.2 or lower.
The same trade-off applies for encryption algorithms. ECDSA was standardized in 2005, about 20 years after RSA. It offers a higher level of security than RSA and uses shorter key lengths, which adds a performance boost for every request. To use ECDSA, a domain owner needs to obtain and serve an ECDSA certificate and the connecting client needs to support cipher suites that use elliptical curve cryptography (ECC). While most publicly trusted certificate authorities now support ECDSA-based certificates, the slow rate of adoption has led many legacy systems to only support RSA, which means that restricting applications to only support ECC-based algorithms could prevent access from those that use older clients and devices.
When it comes to security and accessibility, it’s important to find the right middle ground for your business.
To maintain brand, most companies deploy all of their assets under one domain. It’s common for the root domain (e.g. example.com) to be used as a marketing website to provide information about the company, its mission, and the products and services it offers. Then, under the same domain, you might have your company blog (e.g. blog.example.com), your management portal (e.g. dash.example.com), and your API gateway (e.g. api.example.com).
The marketing website and the blog are similar in that they’re static sites that don’t collect information from the accessing users. On the other hand, the management portal and API gateway collect and present sensitive data that needs to be protected.
When you’re thinking about which settings to deploy, you want to consider the data that’s exchanged and the user base. The marketing website and blog should be accessible to all users. You can set them up to support modern protocols for the clients that support them, but you don’t necessarily want to restrict access for users that are accessing these pages from old devices.
The management portal and API gateway should be set up in a manner that provides the best protection for the data exchanged. That means dropping support for less secure standards with known vulnerabilities and requiring new, secure protocols to be used.
To be able to achieve this setup, you need to be able to configure settings for every subdomain within your domain individually.
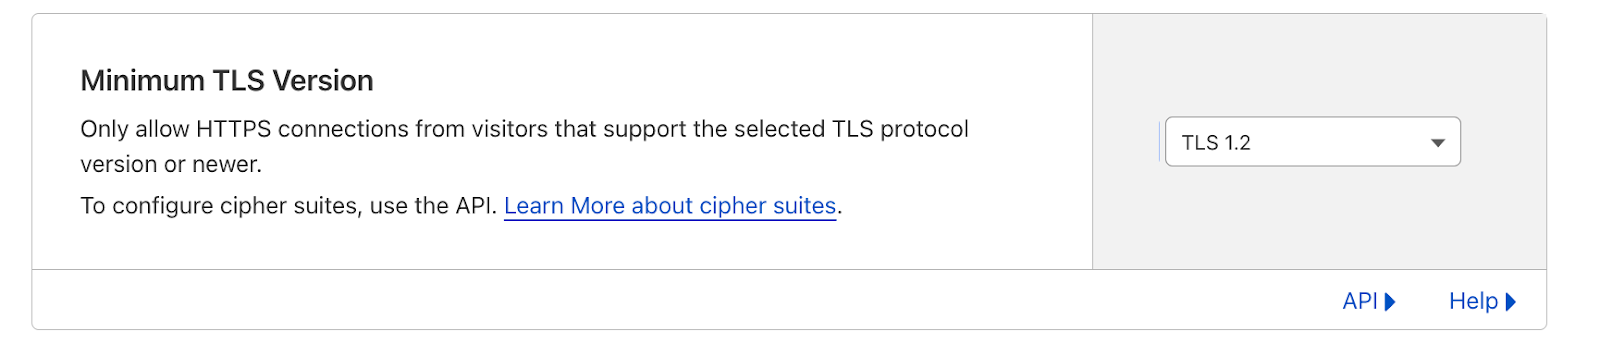
Customers that use Cloudflare’s Advanced Certificate Manager can configure TLS settings on individual hostnames within a domain. Customers can use this to enable HTTP/2, or to configure the minimum TLS version and the supported ciphers suites on a particular hostname. Any settings that are applied on a specific hostname will supersede the zone level setting. The new capability also allows you to have different settings on a hostname and its wildcard record; which means you can configure example.com to use one setting, and *.example.com to use another.
Let’s say that you want the default min TLS version for your domain to be TLS 1.2, but for your dashboard and API subdomains, you want to set the minimum TLS version to be TLS 1.3. In the Cloudflare dashboard, you can set the zone level minimum TLS version to 1.2 as shown below. Then, to make the minimum TLS version for the dashboard and API subdomains TLS 1.3, make a call to the per-hostname TLS settings API endpoint with the specific hostname and setting.
This is all available, starting today, through the API endpoint! And if you’d like to learn more about how to use our per-hostname TLS settings, please jump on over to our developer documentation.
Post Syndicated from The History Guy: History Deserves to Be Remembered original https://www.youtube.com/watch?v=F76xG5ObwXQ
Post Syndicated from Bruce Schneier original https://www.schneier.com/blog/archives/2023/08/using-machine-learning-to-detect-keystrokes.html
Researchers have trained a ML model to detect keystrokes by sound with 95% accuracy.
“A Practical Deep Learning-Based Acoustic Side Channel Attack on Keyboards”
Abstract: With recent developments in deep learning, the ubiquity of microphones and the rise in online services via personal devices, acoustic side channel attacks present a greater threat to keyboards than ever. This paper presents a practical implementation of a state-of-the-art deep learning model in order to classify laptop keystrokes, using a smartphone integrated microphone. When trained on keystrokes recorded by a nearby phone, the classifier achieved an accuracy of 95%, the highest accuracy seen without the use of a language model. When trained on keystrokes recorded using the video-conferencing software Zoom, an accuracy of 93% was achieved, a new best for the medium. Our results prove the practicality of these side channel attacks via off-the-shelf equipment and algorithms. We discuss a series of mitigation methods to protect users against these series of attacks.
News article.