Post Syndicated from Veliswa Boya original https://aws.amazon.com/blogs/aws/welcome-to-aws-storage-day-2023/
Welcome to the fifth annual AWS Storage Day! This virtual event is happening today starting at 9:00 AM Pacific Time (12:00 PM Eastern Time) and is available for you to watch on the AWS On Air Twitch channel. The first AWS Storage Day was hosted in 2019, and this event has grown into an innovation day that we look forward to delivering to you every year. In last year’s Storage Day post, I wrote about the constant innovations in AWS Storage aimed at helping you put your data to work while keeping it secure and protected. This year, Storage Day is focused on storage for AI/ML, data protection and resiliency, and the benefits of moving to the cloud.
AWS Storage Day Key Themes
When it comes to storage for AI/ML, data volumes are increasing at an unprecedented rate, exploding from terabytes to petabytes and even to exabytes. With a modern data architecture on AWS, you can rapidly build scalable data lakes, use a broad and deep collection of purpose-built data services, scale your systems at a low cost without compromising performance, share data across organizational boundaries, and manage compliance, security, and governance, allowing you to make decisions with speed and agility at scale.
To train machine learning models and build Generative AI applications, you must have the right data strategy in place. So, I’m happy to see that, among the list of sessions to look forward to at the live event, the Optimize generative AI and ML with AWS Infrastructure session will discuss how you can transform your data into meaningful insights.
Whether you’re just getting started with the cloud, planning to migrate applications to AWS, or already building applications on AWS, we have resources to help you protect your data and meet your business continuity objectives. Our data protection and resiliency features and solutions can help you meet your business continuity goals and deliver disaster recovery during data loss events, across recovery point and time objectives (RPO and RTO). With the unprecedented data growth happening in the world today, determining where your data is stored, how it’s secured, and who has access to it is a higher priority than ever. Be sure to join the Protect data in AWS amid a rapidly evolving cyber landscape session to learn more.
When moving data to the cloud, you need to understand where you’re moving it for different use cases, the types of data you’re moving, and the network resources available, among other considerations. There are many reasons to move to the cloud, recently, Enterprise Strategy Group (ESG) validated that organizations reduced compute, networking, and storage costs by up to 66 percent by migrating on-premises workloads to AWS Cloud infrastructure. ESG confirmed that migrating on-premises workloads to AWS provides organizations with reduced costs, increased performance, improved operational efficiency, faster time to value, and improved business agility.
We have a number of sessions that discuss how to move to the cloud, based on your use case. I’m most looking forward to the Hybrid cloud storage and edge compute: AWS, where you need it session, which will discuss considerations for workloads that can’t fully move to the cloud.
Tune in to learn from experts about new announcements, leadership insights, and educational content related to the broad portfolio of AWS Storage services and features that address all these themes and more. Today, we have announcements related to Amazon Simple Storage Service (Amazon S3), Amazon FSx for Windows File Server, Amazon Elastic File System (Amazon EFS), Amazon FSx for OpenZFS, and more.
Let’s get into it.

15 Years of Amazon EBS
Not long ago, I was reading Jeff Barr’s post titled 15 Years of AWS Blogging! In this post, Jeff mentioned a few posts he wrote for the earliest AWS services and features. Amazon Elastic Block Store (Amazon EBS) is on this list as a service that simplifies the use of Amazon EC2.
Well, it’s been 15 years since the launch of Amazon EBS was announced, and today we celebrate 15 years of this service. If you were one of the original users who put Amazon EBS to good use and provided us with the very helpful feedback that helped us invent and simplify, iterate and improve, I’m sure you can’t believe how time flies. Today, Amazon EBS handles more than 100 trillion I/O operations daily, and over 390 million EBS volumes are created every day.
If you’re new to Amazon EBS, join us for a fireside chat with Matt Garman, Senior Vice President, Sales, Marketing, and Global Services at AWS, and learn the strategy and customer challenges behind the launch of the service in 2008. You’ll also hear from long-term EBS customer, Stripe, about its growth with EBS since Stripe was launched 12 years ago.
Amazon EBS has continuously improved its scalability and performance to support more customer workloads as the direct storage attachment for Amazon EC2 instances. With the launch of Amazon EC2 M7i instances, powered by custom 4th Generation Intel Xeon Scalable processors, on August 2, you can attach up to 128 Amazon EBS volumes, an increase from 28 on a previous generation M6i instance. The higher number of volume attachments means you can increase storage density per instance and improve resource utilization, reducing total compute cost.
You can host up to 127 containers per instance for larger database applications and scale them more cost effectively before needing to provision more instances and only pay for resources you need. With a higher number of volume attachments, you can fully utilize the memory and vCPU available on these powerful M7i instances as your database storage footprint grows. EBS is also increasing the number of multi-volume snapshots you can create, for up to 128 EBS volumes attached to an instance, enabling you to create crash-consistent backups of all volumes attached to an instance.
Join the 15 years of innovations with Amazon EBS session for a discussion about how the original vision for Amazon EBS has evolved to meet your growing demands for cloud infrastructure.
Mountpoint for Amazon S3
Now generally available, Mountpoint for Amazon S3 is a new open source file client that delivers high throughput access, lowering compute costs for data lakes on Amazon S3. Mountpoint for Amazon S3 is a file client that translates local file system API calls to S3 object API calls. Using Mountpoint for Amazon S3, you can mount an Amazon S3 bucket as a local file system on your compute instance, to access your objects through a file interface with the elastic storage and throughput of Amazon S3. Mountpoint for Amazon S3 supports sequential and random read operations on existing files, and sequential write operations for creating new files.
The Deep dive and demo of Mountpoint for Amazon S3 session demonstrates how to use the file client to access objects in Amazon S3 using file APIs, making it easier to store data at scale and maximize the value of your data with analytics and machine learning workloads. Read this blog post to learn more about Mountpoint for Amazon S3 and how to get started, including a demo.
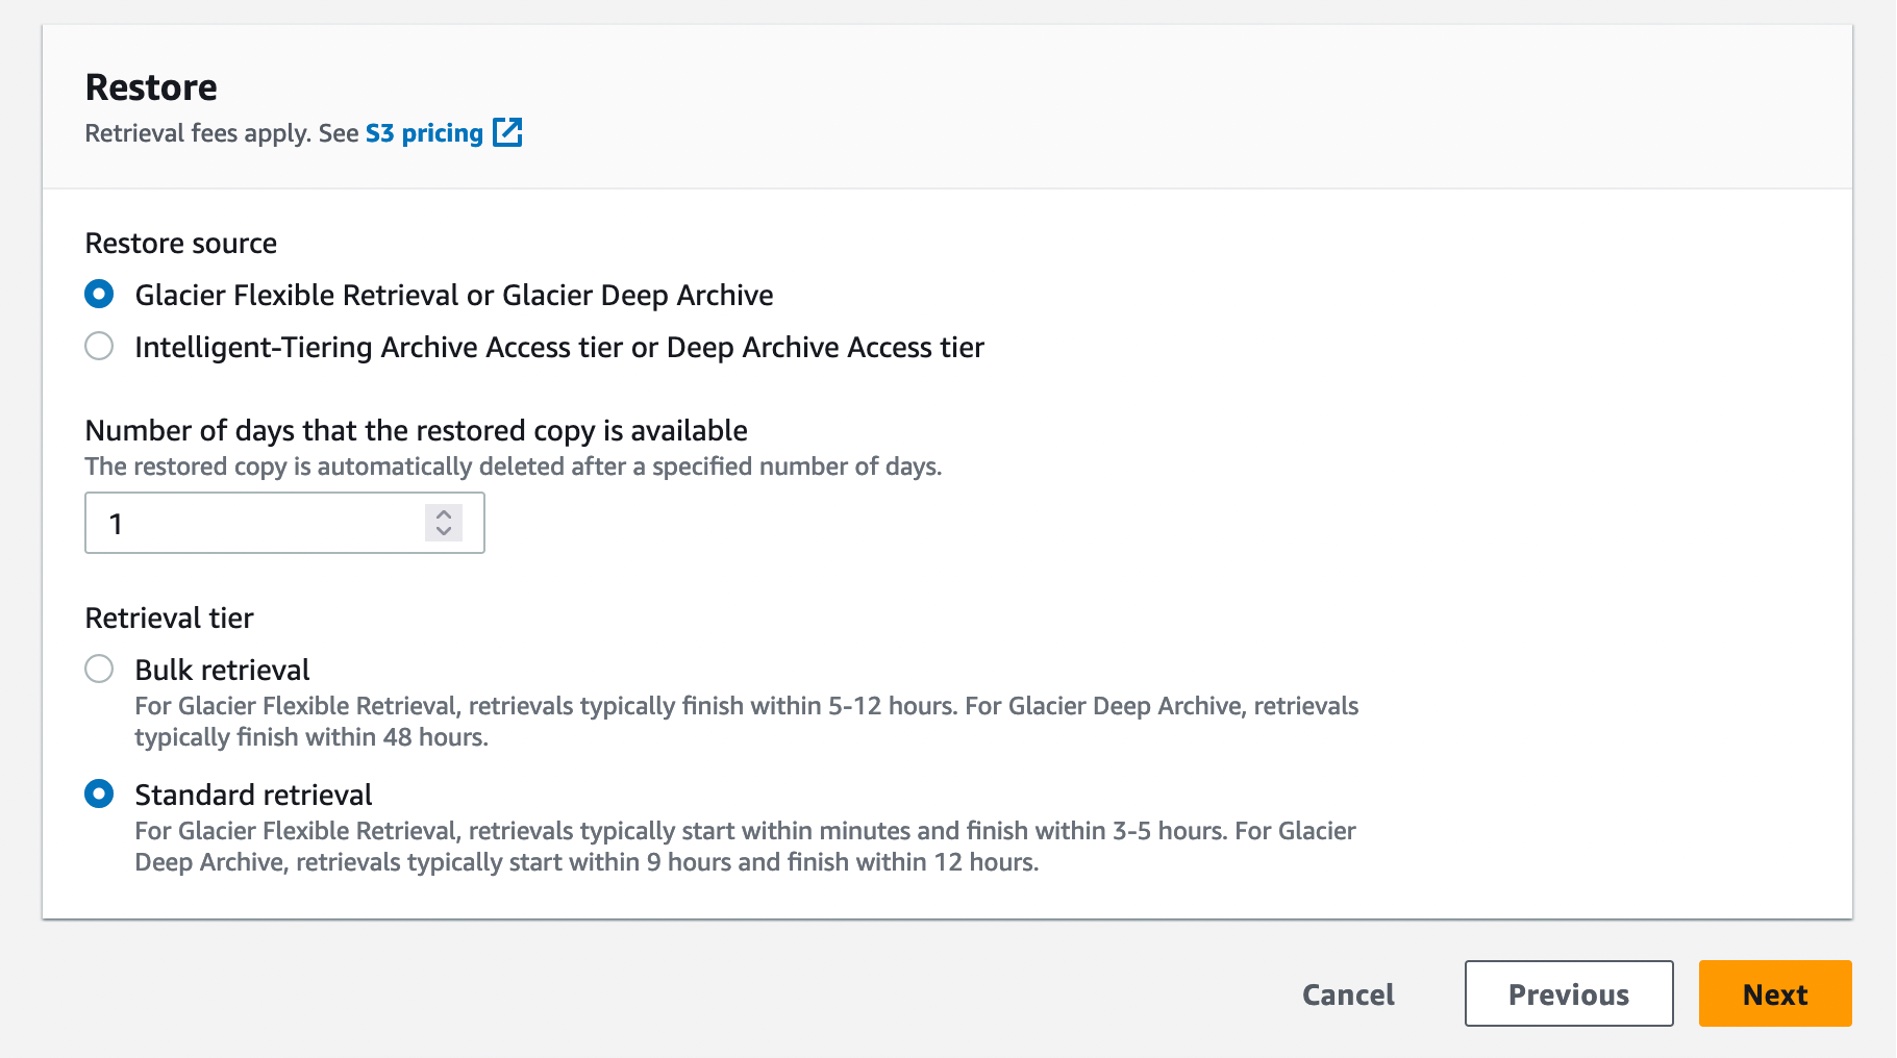
Put Cold Storage to Work Faster with Amazon S3 Glacier Flexible Retrieval
Amazon S3 Glacier Flexible Retrieval improves data restore time by up to 85 percent, at no additional cost. Faster data restores automatically apply to the Standard retrieval tier when using Amazon S3 Batch Operations. These restores begin to return objects within minutes, so you can process restored data faster. Processing restored data in parallel with ongoing restores helps you accelerate data workflows and quickly respond to business needs. Now, whether you’re transcoding media, restoring operational backups, training machine learning models, or analyzing historical data, you can speed up your data restores from archive.
Coupled with the S3 Glacier improvements to restore throughput by up to 10 times for millions of objects announced in 2022, S3 Glacier data restores of all sizes now benefit from both faster starts and shorter completion times.

Join the Maximize the value of cold data with Amazon S3 Glacier session to learn how Amazon S3 Glacier is helping organizations of all sizes and from all industries transform their data archiving to unlock business value, increase agility, and save on storage costs. Read this blog post to learn more about the Amazon S3 Glacier Flexible Retrieval performance improvements and follow step-by-step guidance on how to get started with faster standard retrievals from S3 Glacier Flexible Retrieval.
Supporting a Broad Spectrum of File Workloads
To serve a broad spectrum of use cases that rely on file systems, we offer a portfolio of file system services, each targeting a different set of needs. Amazon EFS is a serverless file system built to deliver an elastic experience for sharing data across compute resources. Amazon FSx makes it easier and cost-effective for you to launch, run, and scale feature-rich, high-performance file systems in the cloud, enabling you to move to the cloud with no changes to your code, processes, or how you manage your data.
Power ML research and big data analytics with Amazon EFS
Amazon EFS offers serverless and fully scalable file storage, designed for high scalability in both storage capacity and throughput performance. Just last week, we announced enhanced support for faster read and write IOPS, making it easier to power more demanding workloads. We’ve improved the performance capabilities of Amazon EFS by adding support for up to 55,000 read IOPS and up to 25,000 write IOPS per file system. These performance enhancements help you to run more demanding workflows, such as machine learning (ML) research with KubeFlow, financial simulations with IBM Symphony, and big data processing with Domino Data Lab, Hadoop, and Spark.
Join the Build and run analytics and SaaS applications at scale session to hear how recent Amazon EFS performance improvements can help power more workloads.
Multi-AZ file systems on Amazon FSx for OpenZFS
You can now use a multi-AZ deployment option when creating file systems on Amazon FSx for OpenZFS, making it easier to deploy file storage that spans multiple AWS Availability Zones to provide multi-AZ resilience for business-critical workloads. With this launch, you can take advantage of the power, agility, and simplicity of Amazon FSx for OpenZFS for a broader set of workloads, including business-critical workloads like database, line-of-business, and web-serving applications that require highly available shared storage that spans multiple AZs.
The new multi-AZ file systems are designed to deliver high levels of performance to serve a broad variety of workloads, including performance-intensive workloads such as financial services analytics, media and entertainment workflows, semiconductor chip design, and game development and streaming, up to 21 GB per second of throughput and over 1 million IOPS for frequently accessed cached data, and up to 10 GB per second and 350,000 IOPS for data accessed from persistent disk storage.
Join the Migrate NAS to AWS to reduce TCO and gain agility session to learn more about multi-AZs with Amazon FSx for OpenZFS.
New, Higher Throughput Capacity Levels on Amazon FSx for Windows File Server
Performance improvements for Amazon FSx for Windows File Server help you accelerate time-to-results for performance-intensive workloads such as SQL Server databases, media processing, cloud video editing, and virtual desktop infrastructure (VDI).
We’re adding four new, higher throughput capacity levels to increase the maximum I/O available up to 12 GB per second from the previous I/O of 2 GB per second. These throughput improvements come with correspondingly higher levels of disk IOPS, designed to deliver an increase up to 350,000 IOPS.
In addition, by using FSx for Windows File Server, you can provision IOPS higher than the default 3 IOPS per GiB for your SSD file system. This allows you to scale SSD IOPS independently from storage capacity, allowing you to optimize costs for performance-sensitive workloads.
Join the Migrate NAS to AWS to reduce TCO and gain agility session to learn more about the performance improvements for Amazon FSx for Windows File Server.
Logically Air-Gapped Vault for AWS Backup
AWS Backup is a fully managed, policy-based data protection solution that enables customers to centralize and automate backup restores across 19 AWS services (spanning compute, storage, and databases) and third-party applications such as VMware Cloud on AWS and on-premises, as well as SAP HANA on Amazon EC2.
Today, we’re announcing the preview of logically air-gapped vault as a new type of AWS Backup Vault that acts as an additional layer of protection to mitigate against malware events. With logically air-gapped vault, customers can recover their application data through a different trusted account.
Join the Deep dive on data recovery for ransomware events session to learn more about logically air-gapped vault for AWS Backup.
Copy Data to and from Other Clouds with AWS DataSync
AWS DataSync is an online data movement and discovery service that simplifies data migration and helps you quickly, easily, and securely transfer your file or object data to, from, and between AWS storage services. In addition to support of data migration to and from AWS storage services, DataSync supports copying to and from other clouds such as Google Cloud Storage, Azure Files, and Azure Blob Storage. Using DataSync, you can move your object data at scale between Amazon S3 compatible storage on other clouds and AWS storage services such as Amazon S3. We’re now expanding the support of DataSync for copying data to and from other clouds to include DigitalOcean Spaces, Wasabi Cloud Storage, Backblaze B2 Cloud Storage, Cloudflare R2 Storage, and Oracle Cloud Storage.
Join the Identify and accelerate data migrations at scale session to learn more about this expanded support for DataSync.
Join Us Online
Join us today for the AWS Storage Day virtual event on the AWS On Air channel on Twitch. The event will be live starting at 9:00 AM Pacific Time (12:00 PM Eastern Time) on August 9. All sessions will be available on demand approximately two days after Storage Day.
We look forward to seeing you on Twitch!
– Veliswa


 Virendhar (Viru) Sivaraman is a strategic Senior Big Data & Analytics Architect with Amazon Web Services. He is passionate about building scalable big data and analytics solutions in the cloud. Besides work, he enjoys spending time with family, hiking & mountain biking.
 Vivek Shrivastava is a Principal Data Architect, Data Lake in AWS Professional Services. He is a Bigdata enthusiast and holds 14 AWS Certifications. He is passionate about helping customers build scalable and high-performance data analytics solutions in the cloud. In his spare time, he loves reading and finds areas for home automation.


 Lastly, we published a new ebook titled “