Post Syndicated from corbet original https://lwn.net/Articles/964042/
The LWN.net Weekly Edition for March 7, 2024 is available.
Post Syndicated from corbet original https://lwn.net/Articles/964042/
The LWN.net Weekly Edition for March 7, 2024 is available.
Post Syndicated from Talks at Google original https://www.youtube.com/watch?v=3nxh-GeJrSs
Post Syndicated from Chris McPeek original https://aws.amazon.com/blogs/compute/building-a-serverless-streaming-pipeline-to-deliver-reliable-messaging/
This post is written by Jeff Harman, Senior Prototyping Architect, Vaibhav Shah, Senior Solutions Architect and Erik Olsen, Senior Technical Account Manager.
Many industries are required to provide audit trails for decision and transactional systems. AI assisted decision making requires monitoring the full inputs to the decision system in near real time to prevent fraud, detect model drift, and discrimination. Modern systems often use a much wider array of inputs for decision making, including images, unstructured text, historical values, and other large data elements. These large data elements pose a challenge to traditional audit systems that deal with relatively small text messages in structured formats. This blog shows the use of serverless technology to create a reliable, performant, traceable, and durable streaming pipeline for audit processing.
Consider the following four requirements to develop an architecture for audit record ingestion:
The following diagram shows an architecture that meets these requirements and models the flow of the audit record through the system.

The primary source of latency is the time it takes for an audit record to be transmitted across the network. Applications sending audit records make an API call to an Amazon API Gateway endpoint. An AWS Lambda function receives the message and an Amazon ElastiCache for Redis cluster provides a low latency initial storage mechanism for the audit record. Once the data is stored in ElastiCache, the AWS Step Functions workflow then orchestrates the communication and persistence functions.
Subscribers receive four Amazon Simple Notification Service (Amazon SNS) notifications pertaining to arrival and storage of the audit record payload, storage of the audit record metadata, and audit record archive completion. Users can subscribe an Amazon Simple Queue Service (SQS) queue to the SNS topic and use fan out mechanisms to achieve high reliability.
Any failure by the three fundamental processing steps: Ingestion, Data Archive, and Metadata Archive triggers a message in an SQS Dead Letter Queue (DLQ) which contains the original request and an explanation of the failure reason. Any failure in the Ingest Message function invokes the Ingest Message Failure function, which stores the original parameters to the S3 Failed Message Storage bucket for later analysis.
The Step Functions workflow provides orchestration and parallel path execution for the system. The detailed workflow below shows the execution flow and notification actions. The transformer steps convert the internal data structures into the format required for consumers.

There are types three events and messages managed by this system:
The message producer calls the API Gateway endpoint, which enforces the security requirements defined by the business. In this implementation, API Gateway uses an API key for providing more robust security. API Gateway also creates a security header for consumption by the Ingest Message Lambda function. API Gateway can be configured to enforce message format standards, see Use request validation in API Gateway for more information.
The Ingest Message Lambda function generates a message ID that tracks the message payload throughout its lifecycle. Then it stores the full message in the ElastiCache for Redis cache. The Ingest Message Lambda function generates an internal message with all the elements necessary as described above. Finally, the Lambda function handler code starts the Step Functions workflow with the internal message payload.
If the Ingest Message Lambda function fails for any reason, the Lambda function invokes the Ingestion Failure Handler Lambda function. This Lambda function writes any recoverable incoming message data to an S3 bucket and sends a notification on the Ingest Message dead letter queue.
The Step Functions workflow then runs three processes in parallel.
After each of the Lambda functions’ processes complete, the Lambda function sends a notification to the SNS notification topic to alert subscribers that each action is complete. When both Message Metadata and Message Archive Lambda functions are done, the Final Aggregation function makes a final update to the metadata in DynamoDB to include S3 reference information and to remove the ElastiCache Redis reference.
The source code for this implementation can be found at https://github.com/aws-samples/blog-serverless-reliable-messaging
git clone https://github.com/aws-samples/blog-serverless-reliable-messaging.gitblog_serverless_reliable_messagingsam buildsam deploy –-guided. You are asked to supply the following parameters:
Once you have deployed the stack, you can test it through the API gateway endpoint with the API key that is referenced in the deployment output. There are two methods for retrieving the API key either via the AWS console (from the link provided in the output – ApiKeyConsole) or via the AWS CLI (from the AWS CLI reference in the output – APIKeyCLI).
You can test directly in the Lambda service console by invoking the ingest message function.
A test message is available at the root of the project test_message.json for direct Lambda function testing of the Ingest function.
{
"isBase64Encoded": false,
"statusCode": 200,
"headers": {
"Access-Control-Allow-Headers": "Content-Type",
"Access-Control-Allow-Origin": "*",
"Access-Control-Allow-Methods": "OPTIONS,POST"
},
"body": "{\"messageID\": \"XXXXXXXXXXXXXX\"}"
}<project name>-s3messagearchive-xxxxxx“, find the payload of the original json with a key based on the date and time of the script execution, e.g.: YEAR/MONTH/DAY/HOUR/MINUTE with a file name of the messageIDmetaDataTable, you should find a record with a messageID equal to the messageID from above that contains all of the metadata related to the payloadA python script is included with the code in the test_client folder
python3 -m pip install -r ./test_client/requirements.txtpython3 ./test_client/test_client.py
{
"messageID": " XXXXXXXXXXXXXX"
}<project name>-s3messagearchive-xxxxxx“, you should be able to find the payload of the original json with a key based on the date and time of the script execution, e.g.: YEAR/MONTH/DAY/HOUR/MINUTE with a file name of the messageIDmetaDataTable, you should find a record with a messageID equal to the messageID from above that contains all of the meta data related to the payloadThis blog describes architectural patterns, messaging patterns, and data structures that support a highly reliable messaging system for large messages. The use of serverless services including Lambda functions, Step Functions, ElastiCache, DynamoDB, and S3 meet the requirements of modern audit systems to be scalable and reliable. The architecture shared in this blog post is suitable for a highly regulated environment to store and track messages that are larger than typical logging systems, records sized between 256k and 6MB. The architecture serves as a blueprint that can be extended and adapted to fit further serverless use cases.
For serverless learning resources, visit Serverless Land.
Post Syndicated from jzb original https://lwn.net/Articles/960630/
The Fedora Project switched
to MariaDB as the default implementation of MySQL in Fedora 19 in 2013. Once a drop-in
replacement for MySQL, MariaDB has diverged enough that this is no longer
the case—and, despite concerns about Oracle
and optimism that MariaDB would supplant MySQL, the reality is that MySQL
and MariaDB seem to be here to stay. With that in mind, Fedora developer
Michal Schorm
proposed that the project revise the way MySQL and MariaDB
are packaged in Fedora starting with Fedora 40.
Post Syndicated from jzb original https://lwn.net/Articles/964574/
The postmarketOS project, which produces
a Linux distribution for phones and mobile devices,
has announced
that it is in the early stages of adding systemd to make it easier to support GNOME and KDE.
Users who prefer the OpenRC
init system are assured they will still have that option when building their own
images “as long as OpenRC is in Alpine Linux (on which postmarketOS is
“:
based)
As with text editors, some people are really passionate about their favorite init
systems. When discussing this announcement, please keep a friendly tone. Remember
that we all share the love for free and open source software, and that our
communities work best if we focus on shared values instead of fighting over what
implementations to use.
Proof-of-concept images
are available now for a limited set of devices. Users are warned these images are “buggy,
“. Those interested
unreliable, and NOT suitable for use on a device you rely on
in helping with testing and development are encouraged to follow along and report
bugs on the systemd
issue at GitLab.
Post Syndicated from Abhishek Gupta original https://aws.amazon.com/blogs/aws/amazon-rds-now-supports-io2-block-express-volumes-for-mission-critical-database-workloads/
Today, I am pleased to announce the availability of Provisioned IOPS (PIOPS) io2 Block Express storage volumes for all database engines in Amazon Relational Database Service (Amazon RDS). Amazon RDS provides you the flexibility to choose between different storage types depending on the performance requirements of your database workload. io2 Block Express volumes are designed for critical database workloads that require high performance and high throughput at low latency.
Lower latency and higher availability for I/O intensive workloads
With io2 Block Express volumes, your database workloads will benefit from consistent sub-millisecond latency, enhanced durability to 99.999 percent over io1 volumes, and drive 20x more IOPS from provisioned storage (up to 1,000 IOPS per GB) at the same price as io1. You can upgrade from io1 volumes to io2 Block Express volumes without any downtime, significantly improving the performance and reliability of your applications without increasing storage cost.
“We migrated all of our primary Amazon RDS instances to io2 Block Express within 2 weeks,” said Samir Goel, Director of Engineering at Figma, a leading platform for teams that design and build digital products. “Io2 Block Express has had a profound impact on the availability of the database layer at Figma. We have deeply appreciated the consistency of performance with io2 Block Express — in our observations, the latency variability has been under 0.1ms.”
io2 Block Express volumes support up to 64 TiB of storage, up to 256,000 Provisioned IOPS, and a maximum throughput of 4,000 MiB/s. The throughput of io2 Block Express volumes varies based on the amount of provisioned IOPS and volume storage size. Here is the range for each database engine and storage size:
| Database engine | Storage size | Provisioned IOPS | Maximum throughput |
| Db2, MariaDB, MySQL, and PostgreSQL | Between 100 and 65,536 GiB | 1,000–256,000 IOPS | 4,000 MiB/s |
| Oracle | Between 100 and 199 GiB | 1,000–199,000 IOPS | 4,000 MiB/s |
| Oracle | Between 200 and 65,536 GiB | 1,000–256,000 IOPS | 4,000 MiB/s |
| SQL Server | Between 20 and 16,384 GiB | 1,000–64,000 IOPS | 4,000 MiB/s |
Getting started with io2 Block Express in Amazon RDS
You can use the Amazon RDS console to create a new RDS instance configured with an io2 Block Express volume or modify an existing instance with io1, gp2, or gp3 volumes.
Here’s how you would create an Amazon RDS for PostgreSQL instance with io2 Block Express volume.
Start with the basic information such as engine and version. Then, choose Provisioned IOPS SDD (io2) from the Storage type options:

Use the following AWS CLI command to create a new RDS instance with io2 Block Express volume:
aws rds create-db-instance --storage-type io2 --db-instance-identifier new-db-instance --db-instance-class db.t4g.large --engine mysql --master-username masteruser --master-user-password <enter password> --allocated-storage 400 --iops 3000Similarly, to modify an existing RDS instance to use io2 Block Express volume:
aws rds modify-db-instance --db-instance-identifier existing-db-instance --storage-type io2 --allocated-storage 500 --iops 3000 --apply-immediatelyThings to know
Available now
Amazon RDS io2 Block Express storage volumes are supported for all RDS database engines and are available in US East (Ohio, N. Virginia), US West (N. California, Oregon), Asia Pacific (Hong Kong, Mumbai, Osaka, Seoul, Singapore, Sydney, Tokyo), Canada (Central), Europe (Frankfurt, Ireland, London, Stockholm), and Middle East (Bahrain) Regions.
In terms of pricing and billing, io1 volumes and io2 Block Express storage volumes are billed at the same rate. For more information, see the Amazon RDS pricing page.
Learn more by reading about Provisioned IOPS SSD storage in the Amazon RDS User Guide.
— Abhishek
Post Syndicated from Taylor Jacobsen original https://aws.amazon.com/blogs/aws/introducing-the-newest-heroes-of-the-year-march-2024/
AWS Heroes are inspirational thought leaders who go above and beyond to knowledge share in a variety of ways. You can find them speaking at local meetups, AWS Community Days, or even at re:Invent. And these technical experts are never done learning—they’re passionate about solving problems and creating content to enable the community to build faster on AWS. We’re excited to announce the first cohort of Heroes in 2024…
Let’s give a round of applause to our new Heroes!
 Community Hero Awedis Keofteian is a DevOps Engineer at Anghami. He has a strong background in DevOps practices, and he leverages modern technologies to enhance scalability, reliability, and efficiency in Anghami’s cloud-based architecture. His journey began as an AWS Community Builder, and over time, he took the helm as the leader of the AWS User Group in Beirut. Awedis is passionate about nurturing and supporting the growth of AWS communities, and shares his knowledge across DevOps, automation, serverless, and cloud technologies.
 Security Hero Daniel Aniszkiewicz is a Senior Software Engineer at Algoteque International Hub. He co-organizes the Wrocław AWS User Group, and is passionate about contributing to the growth and engagement of the local AWS community. Daniel is also a seasoned speaker and loves to share his knowledge with others, such as presenting at re:Invent, AWS meetups, and AWS Community Days. He is particularly focused on promoting Amazon Verified Permissions and Cedar through workshops, blog posts, IaC templates, and open source projects.
 Serverless Hero Hazel Sáenz is a Software Architect at Cognits. Her primary focus is modernizing on-premises applications to cloud environments using AWS, and predominantly designs high workload architectures in serverless frameworks. Hazel enjoys sharing her knowledge with the community through technical talks at local and international events, participating in AWS Summits, AWS Community Days, and meetups, as well as writing technical articles in both English and Spanish. Additionally, she is the leader of the AWS User Group Guatemala, where she excels at organizing inclusive events and sharing her knowledge with the community.
 DevTools Hero Kenta Goto is a Backend Tech Lead and an enthusiastic contributor to AWS CDK. He has been selected as a top contributor and a trusted reviewer in AWS CDK, and serves as a maintainer for the community-driven CDK Construct Library. Kenta is also a conference speaker, having presented at the AWS Dev Day in Japan in 2022 and 2023. Furthermore, he actively contributes to the open source community by developing and publishing his self-made AWS tools and AWS CDK Construct libraries, which are used worldwide.
 Community Hero Martin Damovsky is a Cloud Governance Lead at Ataccama.com, an AWS Partner providing Unified Data Management Solutions. He has been particularly interested in AWS Control Tower Account Factory for Terraform, Cloud Intelligence Dashboard, and security and govern tools, such as AWS Security Hub, Amazon GuardDuty, and AWS Config. Martin is a leader for AWS User Group Prague, and he enjoys sharing his knowledge with the greater AWS community through his blog and speaking at meetups, podcasts, and conferences.
 Community Hero Rafał Mituła is a Cloud Data Engineer and Architect within the Data & AI division at Chaos Gears. He is actively involved in the AWS community, co-organizing the AWS User Group Warsaw meetups and the AWS Community Day Poland conference. In addition to his technical and organizational roles, Rafał shares his expertise by speaking at conferences and leading workshops aimed at introducing new builders to AWS and data analytics, such as the AWS Data Engineering Immersion Days.
 Security Hero Sena Yakut is a Senior Cloud Security Engineer at Lyrebird Studio. She has a master’s degree in cloud security, and builds security requirements for architectural designs, providing threat management and security concepts and services using AWS. Sena shares her knowledge through blog posts across various platforms, and engaging in discussions about cloud security at events, such as AWS Community Day Türkiye, and DevOpsDays Istanbul. As an active blogger and speaker, she enjoys learning new security features on AWS and informing others about them.
 Community Hero Tiago Rodrigues is a Senior Cloud Consultant at tecRacer.com, an AWS Premier Partner and AWS Advanced Training Partner. He specializes in migrations from on-premises environments to the cloud, as well as modernizing architectures and implementing serverless solutions. Beyond his role, Tiago is deeply committed to knowledge sharing and actively contributes to the AWS community through engagements, such as the AWS User Group Lisbon, educational workshops, and guest lectures at universities. He is passionate about education and innovation, and developed an open source mobile app, AWSary, which is an AWS dictionary designed to provide solution architect diagram drawings and quick insights into AWS services.
Please visit the AWS Heroes website if you’d like to learn more about the AWS Heroes program or to connect with a Hero near you.
— Taylor
Post Syndicated from daroc original https://lwn.net/Articles/964377/
QUIC is a UDP-based transport protocol that forms the foundation of
HTTP/3.
It was initially developed at Google in 2012, and became an
IETF standard in
2021. Work on the protocol did not stop with its standardization, however. The
QUIC working group
published several follow-up standards. Now, it is working on
four more extensions to QUIC intended to patch over various shortcomings in the
current protocol — although progress has not been quick.
Post Syndicated from Will Smythe original https://github.blog/2024-03-06-how-github-uses-merge-queue-to-ship-hundreds-of-changes-every-day/
At GitHub, we use merge queue to merge hundreds of pull requests every day. Developing this feature and rolling it out internally did not happen overnight, but the journey was worth it—both because of how it has transformed the way we deploy changes to production at scale, but also how it has helped improve the velocity of customers too. Let’s take a look at how this feature was developed and how you can use it, too.
| Merge queue is generally available and is also now available on GitHub Enterprise Server! Find out more. |
In 2020, engineers from across GitHub came together with a goal: improve the process for deploying and merging pull requests across the GitHub service, and specifically within our largest monorepo. This process was becoming overly complex to manage, required special GitHub-only logic in the codebase, and required developers to learn external tools, which meant the engineers developing for GitHub weren’t actually using GitHub in the same way as our customers.
To understand how we got to this point in 2020, it’s important to look even further back.
By 2016, nearly 1,000 pull requests were merging into our large monorepo every month. GitHub was growing both in the number of services deployed and in the number of changes shipping to those services. And because we deploy changes prior to merging them, we needed a more efficient way to group and deploy multiple pull requests at the same time. Our solution at this time was trains. A train was a special pull request that grouped together multiple pull requests (passengers) that would be tested, deployed, and eventually merged at the same time. A user (called a conductor) was responsible for handling most aspects of the process, such as starting a deployment of the train and handling conflicts that arose. Pipelines were added to help manage the rollout path. Both these systems (trains and pipelines) were only used on our largest monorepo and were implemented in our internal deployment system.
Trains helped improve velocity at first, but over time started to negatively impact developer satisfaction and increase the time to land a pull request. Our internal Developer Experience (DX) team regularly polls our developers to learn about pain points to help inform where to invest in improvements. These surveys consistently rated deployment as the most painful part of the developer’s daily experience, highlighting the complexity and friction involved with building and shepherding trains in particular. This qualitative data was backed by our quantitative metrics. These showed a steady increase in the time it took from pull request to shipped code.
Trains could also grow large, containing the changes of 15 pull requests. Large trains frequently “derailed” due to a deployment issue, conflicts, or the need for an engineer to remove their change. On painful occasions, developers could wait 8+ hours after joining a train for it to ship, only for it to be removed due to a conflict between two pull requests in the train.
Trains were also not used on every repository, meaning the developer experience varied significantly between different services. This led to confusion when engineers moved between services or contributed to services they didn’t own, which is fairly frequent due to our inner source model.
In short, our process was significantly impacting the productivity of our engineering teams—both in our large monorepo and service repositories.
By 2020, it was clear that our internal tools and processes for deploying and merging across our repositories were limiting our ability to land pull requests as often as we needed. Beyond just improving velocity, it became clear that our new solution needed to:
The merge queue project began as part of an overall effort within GitHub to improve availability and remove friction that was preventing developers from shipping at the frequency and level of quality that was needed. Initially, it was only focused on providing a solution for us, but was built with the expectation that it would eventually be made available to customers.
By mid-2021, a few small, internal repositories started testing merge queue, but moving our large monorepo would not happen until the next year for a few reasons.
For one, we could not stop deploying for days or weeks in order to swap systems. At every stage of the project we had to have a working system to ship changes. At a maximum, we could block deployments for an hour or so to run a test or transition. GitHub is remote-first and we have engineers throughout the world, so there are quieter times but never a free pass to take the system offline.
Changing the way thousands of developers deploy and merge changes also requires lots of communication to ensure teams are able to maintain velocity throughout the transition. Training 1,000 engineers on a new system overnight is difficult, to say the least.
By rolling out changes to the process in phases (and sometimes testing and rolling back changes early in the morning before most developers started working) we were able to slowly transition our large monorepo and all of our repositories responsible for production services onto merge queue by 2023.
Merge queue has become the single entry point for shipping code changes at GitHub. It was designed and tested at scale, shipping 30,000+ pull requests with their associated 4.5 million CI runs, for GitHub.com before merge queue was made generally available.
For GitHub and our “deploy the merge process,” merge queue dynamically forms groups of pull requests that are candidates for deployment, kicks off builds and tests via GitHub Actions, and ensures our main branch is never updated to a failing commit by enforcing branch protection rules. Pull requests in the queue that conflict with one another are automatically detected and removed, with the queue automatically re-forming groups as needed.
Because merge queue is integrated into the pull request workflow (and does not require knowledge of special ChatOps commands, or use of labels or special syntax in comments to manage state), our developer experience is also greatly improved. Developers can add their pull request to the queue and, if they spot an issue with their change, leave the queue with a single click.
We can now ship larger groups without the pitfalls and frictions of trains. Trains (our old system) previously limited our ability to deploy more than 15 changes at once, but now we can now safely deploy 30 or more if needed.
Every month, over 500 engineers merge 2,500 pull requests into our large monorepo with merge queue, more than double the volume from a few years ago. The average wait time to ship a change has also been reduced by 33%. And it’s not just numbers that have improved. On one of our periodic developer satisfaction surveys, an engineer called merge queue “one of the best quality-of-life improvements to shipping changes that I’ve seen a GitHub!” It’s not a stretch to say that merge queue has transformed the way GitHub deploys changes to production at scale.
Merge queue is available to public repositories on GitHub.com owned by organizations and to all repositories on GitHub Enterprise (Cloud or Server).
To learn more about merge queue and how it can help velocity and developer satisfaction on your busiest repositories, see our blog post, GitHub merge queue is generally available.
Interested in joining GitHub? Check out our open positions or learn more about our platform.
The post How GitHub uses merge queue to ship hundreds of changes every day appeared first on The GitHub Blog.
Post Syndicated from Edvin Hallvaxhiu original https://aws.amazon.com/blogs/big-data/build-a-pseudonymization-service-on-aws-to-protect-sensitive-data-part-2/
Part 1 of this two-part series described how to build a pseudonymization service that converts plain text data attributes into a pseudonym or vice versa. A centralized pseudonymization service provides a unique and universally recognized architecture for generating pseudonyms. Consequently, an organization can achieve a standard process to handle sensitive data across all platforms. Additionally, this takes away any complexity and expertise needed to understand and implement various compliance requirements from development teams and analytical users, allowing them to focus on their business outcomes.
Following a decoupled service-based approach means that, as an organization, you are unbiased towards the use of any specific technologies to solve your business problems. No matter which technology is preferred by individual teams, they are able to call the pseudonymization service to pseudonymize sensitive data.
In this post, we focus on common extract, transform, and load (ETL) consumption patterns that can use the pseudonymization service. We discuss how to use the pseudonymization service in your ETL jobs on Amazon EMR (using Amazon EMR on EC2) for streaming and batch use cases. Additionally, you can find an Amazon Athena and AWS Glue based consumption pattern in the GitHub repo of the solution.
The following diagram describes the solution architecture.

The account on the right hosts the pseudonymization service, which you can deploy using the instructions provided in the Part 1 of this series.
The account on the left is the one that you set up as part of this post, representing the ETL platform based on Amazon EMR using the pseudonymization service.
You can deploy the pseudonymization service and the ETL platform on the same account.
Amazon EMR empowers you to create, operate, and scale big data frameworks such as Apache Spark quickly and cost-effectively.
In this solution, we show how to consume the pseudonymization service on Amazon EMR with Apache Spark for batch and streaming use cases. The batch application reads data from an Amazon Simple Storage Service (Amazon S3) bucket, and the streaming application consumes records from Amazon Kinesis Data Streams.
Both applications use a common utility function that makes HTTP POST calls against the API Gateway that is linked to the pseudonymization AWS Lambda function. The REST API calls are made per Spark partition using the Spark RDD mapPartitions function. The POST request body contains the list of unique values for a given input column. The POST request response contains the corresponding pseudonymized values. The code swaps the sensitive values with the pseudonymized ones for a given dataset. The result is saved to Amazon S3 and the AWS Glue Data Catalog, using Apache Iceberg table format.
Iceberg is an open table format that supports ACID transactions, schema evolution, and time travel queries. You can use these features to implement the right to be forgotten (or data erasure) solutions using SQL statements or programming interfaces. Iceberg is supported by Amazon EMR starting with version 6.5.0, AWS Glue, and Athena. Batch and streaming patterns use Iceberg as their target format. For an overview of how to build an ACID compliant data lake using Iceberg, refer to Build a high-performance, ACID compliant, evolving data lake using Apache Iceberg on Amazon EMR.
You must have the following prerequisites:
git clone or the download option.Open a new bash terminal and navigate to the root folder of the cloned repository.
The source code for the proposed patterns can be found in the cloned repository. It uses the following parameters:
As described in the prerequisites, before you deploy the solution, upload the Parquet files of the test dataset to Amazon S3. Then provide the S3 path of the folder containing the files as the parameter <S3_INPUT_PATH>.
We create the solution resources via AWS CloudFormation. You can deploy the solution by running the deploy_1.sh script, which is inside the deployment_scripts folder.
After the deployment prerequisites have been satisfied, enter the following command to deploy the solution:
sh ./deployment_scripts/deploy_1.sh \
-a <ARTEFACT_S3_BUCKET> \
-r <AWS_REGION> \
-p <AWS_PROFILE> \
-s <SUBNET_ID> \
-e <EP_URL> \
-x <API_SECRET> \
-i <S3_INPUT_PATH>
The output should look like the following screenshot.

The required parameters for the cleanup command are printed out at the end of the run of the deploy_1.sh script. Make sure to note down these values.
In the CloudFormation template deployed using the deploy_1.sh script, the EMR step containing the Spark batch application is added at the end of the EMR cluster setup.
To verify the results, check the S3 bucket identified in the CloudFormation stack outputs with the variable SparkOutputLocation.


You can also use Athena to query the table pseudo_table in the database blog_batch_db.

To destroy the resources created as part of this exercise,
in a bash terminal, navigate to the root folder of the cloned repository. Enter the cleanup command shown as the output of the previously run deploy_1.sh script:
sh ./deployment_scripts/cleanup_1.sh \
-a <ARTEFACT_S3_BUCKET> \
-s <STACK_NAME> \
-r <AWS_REGION> \
-e <EMR_CLUSTER_ID>
The output should look like the following screenshot.

We create the solution resources via AWS CloudFormation. You can deploy the solution by running the deploy_2.sh script, which is inside the deployment_scripts folder. The CloudFormation stack template for this pattern is available in the GitHub repo.
After the deployment prerequisites have been satisfied, enter the following command to deploy the solution:
sh deployment_scripts/deploy_2.sh \
-a <ARTEFACT_S3_BUCKET> \
-r <AWS_REGION> \
-p <AWS_PROFILE> \
-s <SUBNET_ID> \
-e <EP_URL> \
-x <API_SECRET>
The output should look like the following screenshot.

The required parameters for the cleanup command are printed out at the end of the output of the deploy_2.sh script. Make sure to save these values to use later.
In the CloudFormation template deployed using the deploy_2.sh script, the EMR step containing the Spark streaming application is added at the end of the EMR cluster setup. To test the end-to-end pipeline, you need to push records to the deployed Kinesis data stream. With the following commands in a bash terminal, you can activate a Kinesis producer that will continuously put records in the stream, until the process is manually stopped. You can control the producer’s message volume by modifying the BATCH_SIZE and the THREADS_NUM variables.


In the Athena query editor, check the results by querying the table pseudo_table in the database blog_stream_db.

To destroy the resources created as part of this exercise, complete the following steps:
sh ./deployment_scripts/cleanup_2.sh \
-a <ARTEFACT_S3_BUCKET> \
-s <STACK_NAME> \
-r <AWS_REGION> \
-e <EMR_CLUSTER_ID>
The output should look like the following screenshot.

Use cases might differ in requirements with respect to data size, compute capacity, and cost. We have provided some benchmarking and factors that may influence performance; however, we strongly advise you to validate the solution in lower environments to see if it meets your particular requirements.
You can influence the performance of the proposed solution (which aims to pseudonymize a dataset using Amazon EMR) by the maximum number of parallel calls to the pseudonymization service and the payload size for each call. In terms of parallel calls, factors to consider are the GetSecretValue calls limit from Secrets Manager (10.000 per second, hard limit) and the Lambda default concurrency parallelism (1,000 by default; can be increased by quota request). You can control the maximum parallelism adjusting the number of executors, the number of partitions composing the dataset, and the cluster configuration (number and type of nodes). In terms of payload size for each call, factors to consider are the API Gateway maximum payload size (6 MB) and the Lambda function maximum runtime (15 minutes). You can control the payload size and the Lambda function runtime by adjusting the batch size value, which is a parameter of the PySpark script that determines the number of items to be pseudonymized per each API call. To capture the influence of all these factors and assess the performance of the consumption patterns using Amazon EMR, we have designed and monitored the following scenarios.
To assess the performance for the batch consumption pattern, we ran the pseudonymization application with three input datasets composed of 1, 10, and 100 Parquet files of 97.7 MB each. We generated the input files using the dataset_generator.py script.
The cluster capacity nodes were 1 primary (m5.4xlarge) and 15 core (m5d.8xlarge). This cluster configuration remained the same for all three scenarios, and it allowed the Spark application to use up to 100 executors. The batch_size, which was also the same for the three scenarios, was set to 900 VINs per API call, and the maximum VIN size was 5 bytes.
The following table captures the information of the three scenarios.
| Execution ID | Repartition | Dataset Size | Number of Executors | Cores per Executor | Executor Memory | Runtime |
| A | 800 | 9.53 GB | 100 | 4 | 4 GiB | 11 minutes, 10 seconds |
| B | 80 | 0.95 GB | 10 | 4 | 4 GiB | 8 minutes, 36 seconds |
| C | 8 | 0.09 GB | 1 | 4 | 4 GiB | 7 minutes, 56 seconds |
As we can see, properly parallelizing the calls to our pseudonymization service enables us to control the overall runtime.
In the following examples, we analyze three important Lambda metrics for the pseudonymization service: Invocations, ConcurrentExecutions, and Duration.
The following graph depicts the Invocations metric, with the statistic SUM in orange and RUNNING SUM in blue.

By calculating the difference between the starting and ending point of the cumulative invocations, we can extract how many invocations were made during each run.
| Run ID | Dataset Size | Total Invocations |
| A | 9.53 GB | 1.467.000 – 0 = 1.467.000 |
| B | 0.95 GB | 1.467.000 – 1.616.500 = 149.500 |
| C | 0.09 GB | 1.616.500 – 1.631.000 = 14.500 |
As expected, the number of invocations increases proportionally by 10 with the dataset size.
The following graph depicts the total ConcurrentExecutions metric, with the statistic MAX in blue.

The application is designed such that the maximum number of concurrent Lambda function runs is given by the amount of Spark tasks (Spark dataset partitions), which can be processed in parallel. This number can be calculated as MIN (executors x executor_cores, Spark dataset partitions).
In the test, run A processed 800 partitions, using 100 executors with four cores each. This makes 400 tasks processed in parallel so the Lambda function concurrent runs can’t be above 400. The same logic was applied for runs B and C. We can see this reflected in the preceding graph, where the amount of concurrent runs never surpasses the 400, 40, and 4 values.
To avoid throttling, make sure that the amount of Spark tasks that can be processed in parallel is not above the Lambda function concurrency limit. If that is the case, you should either increase the Lambda function concurrency limit (if you want to keep up the performance) or reduce either the amount of partitions or the number of available executors (impacting the application performance).
The following graph depicts the Lambda Duration metric, with the statistic AVG in orange and MAX in green.

As expected, the size of the dataset doesn’t affect the duration of the pseudonymization function run, which, apart from some initial invocations facing cold starts, remains constant to an average of 3 milliseconds throughout the three scenarios. This because the maximum number of records included in each pseudonymization call is constant (batch_size value).
Lambda is billed based on the number of invocations and the time it takes for your code to run (duration). You can use the average duration and invocations metrics to estimate the cost of the pseudonymization service.
To assess the performance for the streaming consumption pattern, we ran the producer.py script, which defines a Kinesis data producer that pushes records in batches to the Kinesis data stream.
The streaming application was left running for 15 minutes and it was configured with a batch_interval of 1 minute, which is the time interval at which streaming data will be divided into batches. The following table summarizes the relevant factors.
| Repartition | Cluster Capacity Nodes | Number of Executors | Executor’s Memory | Batch Window | Batch Size | VIN Size |
| 17 |
1 Primary (m5.xlarge), 3 Core (m5.2xlarge) |
6 | 9 GiB | 60 seconds | 900 VINs/API call. | 5 Bytes / VIN |
The following graphs depict the Kinesis Data Streams metrics PutRecords (in blue) and GetRecords (in orange) aggregated with 1-minute period and using the statistic SUM. The first graph shows the metric in bytes, which peaks 6.8 MB per minute. The second graph shows the metric in record count peaking at 85,000 records per minute.


We can see that the metrics GetRecords and PutRecords have overlapping values for almost the entire application’s run. This means that the streaming application was able to keep up with the load of the stream.
Next, we analyze the relevant Lambda metrics for the pseudonymization service: Invocations, ConcurrentExecutions, and Duration.
The following graph depicts the Invocations metric, with the statistic SUM (in orange) and RUNNING SUM in blue.

By calculating the difference between the starting and ending point of the cumulative invocations, we can extract how many invocations were made during the run. In specific, in 15 minutes, the streaming application invoked the pseudonymization API 977 times, which is around 65 calls per minute.
The following graph depicts the total ConcurrentExecutions metric, with the statistic MAX in blue.

The repartition and the cluster configuration allow the application to process all Spark RDD partitions in parallel. As a result, the concurrent runs of the Lambda function are always equal to or below the repartition number, which is 17.
To avoid throttling, make sure that the amount of Spark tasks that can be processed in parallel is not above the Lambda function concurrency limit. For this aspect, the same suggestions as for the batch use case are valid.
The following graph depicts the Lambda Duration metric, with the statistic AVG in blue and MAX in orange.

As expected, aside the Lambda function’s cold start, the average duration of the pseudonymization function was more or less constant throughout the run. This because the batch_size value, which defines the number of VINs to pseudonymize per call, was set to and remained constant at 900.
The ingestion rate of the Kinesis data stream and the consumption rate of our streaming application are factors that influence the number of API calls made against the pseudonymization service and therefore the related cost.
The following graph depicts the Lambda Invocations metric, with the statistic SUM in orange, and the Kinesis Data Streams GetRecords.Records metric, with the statistic SUM in blue. We can see that there is correlation between the amount of records retrieved from the stream per minute and the amount of Lambda function invocations, thereby impacting the cost of the streaming run.

In addition to the batch_interval, we can control the streaming application’s consumption rate using Spark streaming properties like spark.streaming.receiver.maxRate and spark.streaming.blockInterval. For more details, refer to Spark Streaming + Kinesis Integration and Spark Streaming Programming Guide.
Navigating through the rules and regulations of data privacy laws can be difficult. Pseudonymization of PII attributes is one of many points to consider while handling sensitive data.
In this two-part series, we explored how you can build and consume a pseudonymization service using various AWS services with features to assist you in building a robust data platform. In Part 1, we built the foundation by showing how to build a pseudonymization service. In this post, we showcased the various patterns to consume the pseudonymization service in a cost-efficient and performant manner. Check out the GitHub repository for additional consumption patterns.
 Edvin Hallvaxhiu is a Senior Global Security Architect with AWS Professional Services and is passionate about cybersecurity and automation. He helps customers build secure and compliant solutions in the cloud. Outside work, he likes traveling and sports.
 Rahul Shaurya is a Principal Big Data Architect with AWS Professional Services. He helps and works closely with customers building data platforms and analytical applications on AWS. Outside of work, Rahul loves taking long walks with his dog Barney.
 Andrea Montanari is a Senior Big Data Architect with AWS Professional Services. He actively supports customers and partners in building analytics solutions at scale on AWS.
 María Guerra is a Big Data Architect with AWS Professional Services. Maria has a background in data analytics and mechanical engineering. She helps customers architecting and developing data related workloads in the cloud.
 Pushpraj Singh is a Senior Data Architect with AWS Professional Services. He is passionate about Data and DevOps engineering. He helps customers build data driven applications at scale.
Post Syndicated from Patrick Kennedy original https://www.servethehome.com/amd-infinity-fabric-afl-scale-up-competitor-to-nvidia-nvlink-coming-to-broadcom-switches-in-pcie-gen7/
AMD’s AFL Infinity Fabric scale-up competitor to NVIDIA NVLink is coming to Broadcom switches in the PCIe Gen7 era
The post AMD Infinity Fabric AFL Scale Up Competitor to NVIDIA NVLink Coming to Broadcom Switches in PCIe Gen7 appeared first on ServeTheHome.
Post Syndicated from Steve Welham original https://blog.cloudflare.com/introducing-magic-cloud-networking

Today we are excited to announce Magic Cloud Networking, supercharged by Cloudflare’s recent acquisition of Nefeli Networks’ innovative technology. These new capabilities to visualize and automate cloud networks will give our customers secure, easy, and seamless connection to public cloud environments.
Public clouds offer organizations a scalable and on-demand IT infrastructure without the overhead and expense of running their own datacenter. Cloud networking is foundational to applications that have been migrated to the cloud, but is difficult to manage without automation software, especially when operating at scale across multiple cloud accounts. Magic Cloud Networking uses familiar concepts to provide a single interface that controls and unifies multiple cloud providers’ native network capabilities to create reliable, cost-effective, and secure cloud networks.
Nefeli’s approach to multi-cloud networking solves the problem of building and operating end-to-end networks within and across public clouds, allowing organizations to securely leverage applications spanning any combination of internal and external resources. Adding Nefeli’s technology will make it easier than ever for our customers to connect and protect their users, private networks and applications.
Compared with a traditional on-premises data center network, cloud networking promises simplicity:
However, that promise has not yet been fully realized. Our customers have described several reasons cloud networking is difficult:
Nefeli considered all these problems and the tensions between different customer perspectives to identify where the problem should be solved.
Consider a train system. To operate effectively it has three key layers:
A train system with good tracks, trains, and signals could still be operating below its full potential because its agents are unable to keep up with passenger demand. The result is that passengers cannot plan itineraries or purchase tickets.
The train company eliminates bottlenecks in process flow by simplifying the schedules, simplifying the pricing, providing agents with better booking systems, and installing automated ticket machines. Now the same fast and reliable infrastructure of tracks, trains, and signals can be used to its full potential.

In networking, there are an analogous set of three layers, called the networking planes:
In public cloud networks, these layers map to:
Like our train example, most of the problems that our customers experience with cloud networking are in the third layer: the management plane.
Nefeli simplifies, unifies, and automates cloud network management and operations.

One common approach to tackle management problems in cloud networks is introducing Virtual Network Functions (VNFs), which are virtual machines (VMs) that do packet forwarding, in place of native cloud data plane constructs. Some VNFs are routers, firewalls, or load-balancers ported from a traditional network vendor’s hardware appliances, while others are software-based proxies often built on open-source projects like NGINX or Envoy. Because VNFs mimic their physical counterparts, IT teams could continue using familiar management tooling, but VNFs have downsides:
For these reasons, enterprises are turning away from VNF-based solutions and increasingly looking to rely on the native network capabilities of their cloud service providers. The built-in public cloud networking is elastic, performant, robust, and priced on usage, with high-availability options integrated and backed by the cloud provider’s service level agreement.
In our train example, the tracks and trains are good. Likewise, the cloud network data plane is highly capable. Changing the data plane to solve management plane problems is the wrong approach. To make this work at scale, organizations need a solution that works together with the native network capabilities of cloud service providers.
Nefeli leverages native cloud data plane constructs rather than third party VNFs.
The Nefeli team has joined Cloudflare to integrate cloud network management functionality with Cloudflare One. This capability is called Magic Cloud Networking and with it, enterprises can use the Cloudflare dashboard and API to manage their public cloud networks and connect with Cloudflare One.
Just as train providers are focused only on completing train journeys in their own network, cloud service providers deliver network connectivity and tools within a single cloud account. Many large enterprises have hundreds of cloud accounts across multiple cloud providers. In an end-to-end network this creates disconnected networking silos which introduce operational inefficiencies and risk.
Imagine you are trying to organize a train journey across Europe, and no single train company serves both your origin and destination. You know they all offer the same basic service: a seat on a train. However, your trip is difficult to arrange because it involves multiple trains operated by different companies with their own schedules and ticketing rates, all in different languages!
Magic Cloud Networking is like an online travel agent that aggregates multiple transportation options, books multiple tickets, facilitates changes after booking, and then delivers travel status updates.

Through the Cloudflare dashboard, you can discover all of your network resources across accounts and cloud providers and visualize your end-to-end network in a single interface. Once Magic Cloud Networking discovers your networks, you can build a scalable network through a fully automated and simple workflow.
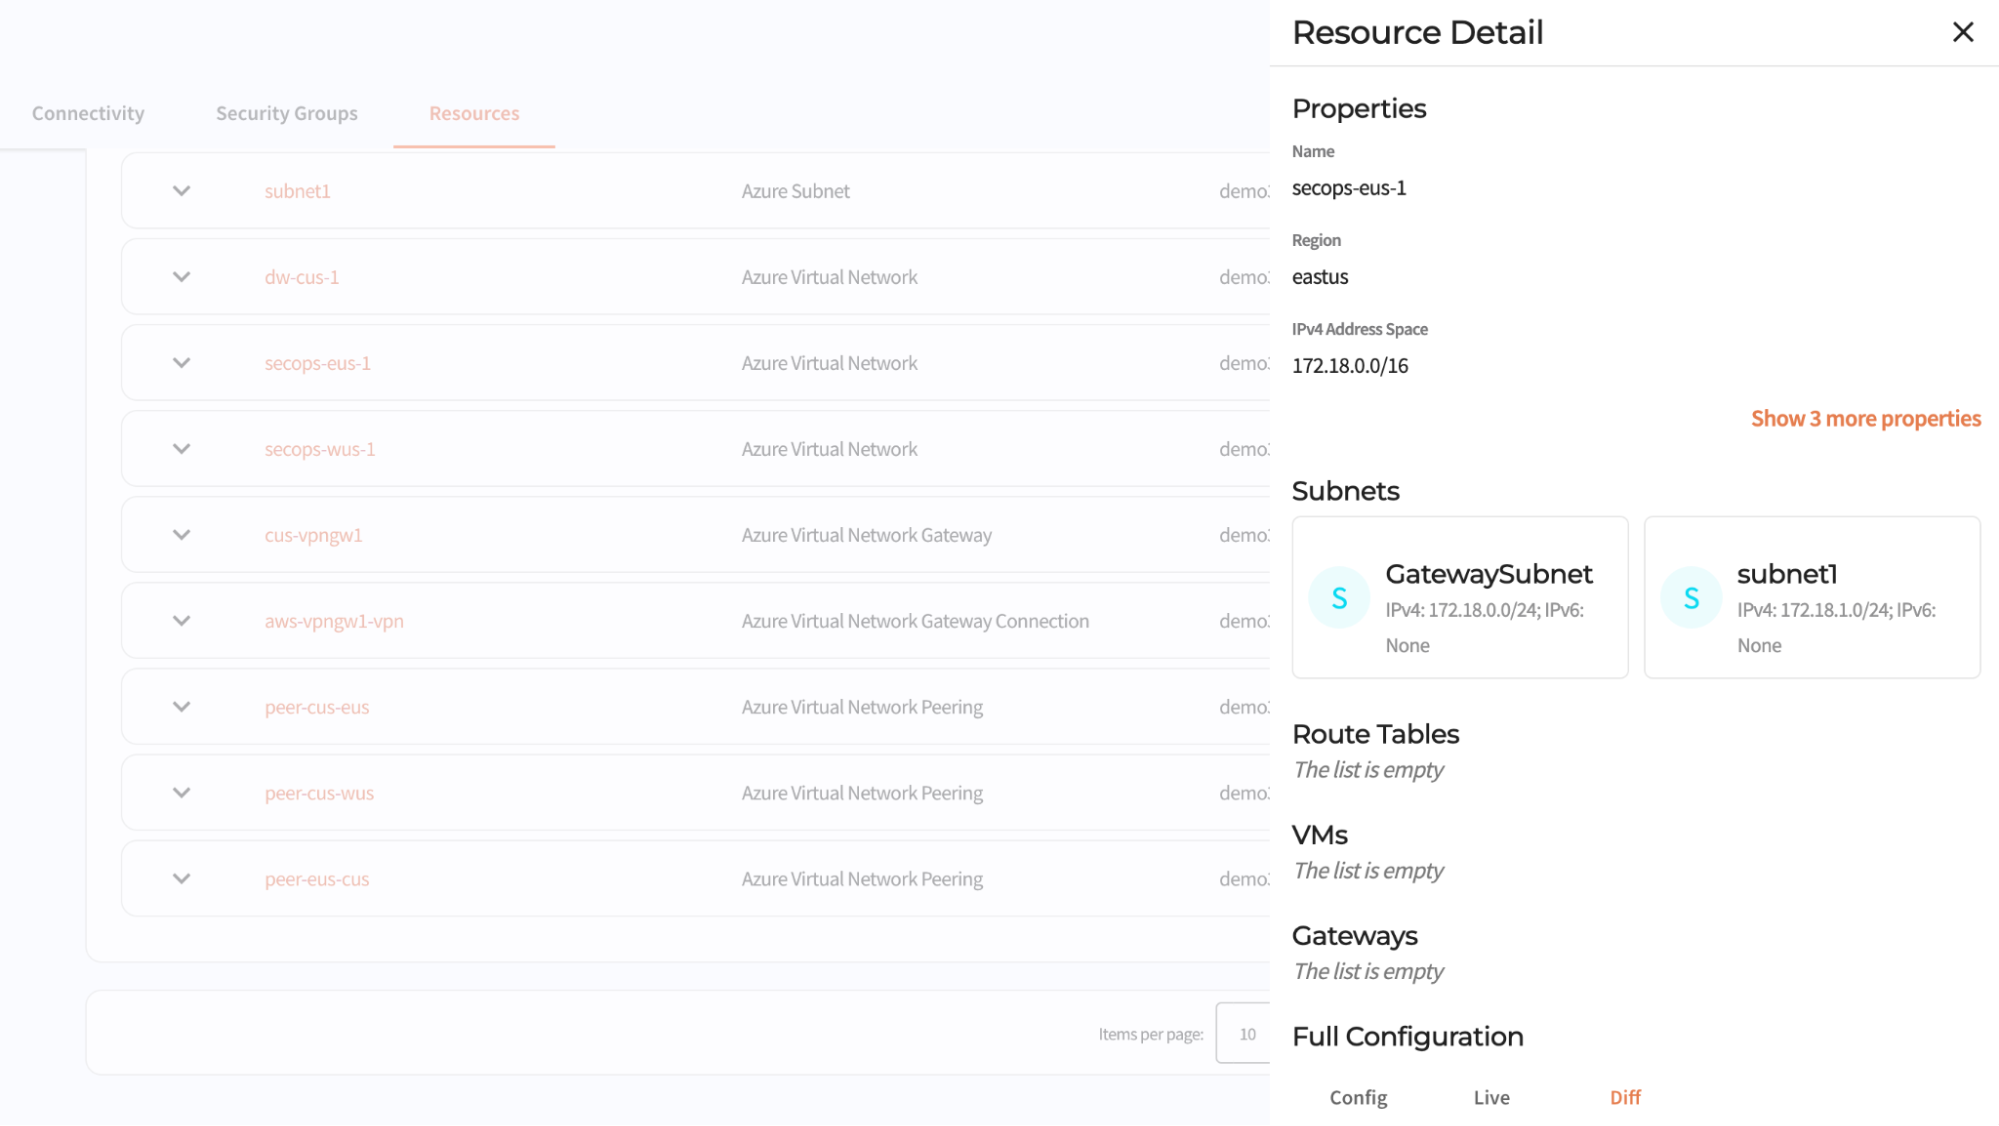
Public clouds are used to deliver applications and services. Each cloud provider offers a composable stack of modular building blocks (resources) that start with the foundation of a billing account and then add on security controls. The next foundational layer, for server-based applications, is VPC networking. Additional resources are built on the VPC network foundation until you have compute, storage, and network infrastructure to host the enterprise application and data. Even relatively simple architectures can be composed of hundreds of resources.
The trouble is, these resources expose abstractions that are different from the building blocks you would use to build a service on prem, the abstractions differ between cloud providers, and they form a web of dependencies with complex rules about how configuration changes are made (rules which differ between resource types and cloud providers). For example, say I create 100 VMs, and connect them to an IP network. Can I make changes to the IP network while the VMs are using the network? The answer: it depends.
Magic Cloud Networking handles these differences and complexities for you. It configures native cloud constructs such as VPN gateways, routes, and security groups to securely connect your cloud VPC network to Cloudflare One without having to learn each cloud’s incantations for creating VPN connections and hubs.
Returning to our train system example, what if the railway maintenance staff find a dangerous fault on the railroad track? They manually set the signal to a stop light to prevent any oncoming trains using the faulty section of track. Then, what if, by unfortunate coincidence, the scheduling office is changing the signal schedule, and they set the signals remotely which clears the safety measure made by the maintenance crew? Now there is a problem that no one knows about and the root cause is that multiple authorities can change the signals via different interfaces without coordination.

The same problem exists in cloud networks: configuration changes are made by different teams using different automation and configuration interfaces across a spectrum of roles such as billing, support, security, networking, firewalls, database, and application development.
Once your network is deployed, Magic Cloud Networking monitors its configuration and health, enabling you to be confident that the security and connectivity you put in place yesterday is still in place today. It tracks the cloud resources it is responsible for, automatically reverting drift if they are changed out-of-band, while allowing you to manage other resources, like storage buckets and application servers, with other automation tools. And, as you change your network, Cloudflare takes care of route management, injecting and withdrawing routes globally across Cloudflare and all connected cloud provider networks.
Magic Cloud Networking is fully programmable via API, and can be integrated into existing automation toolchains.
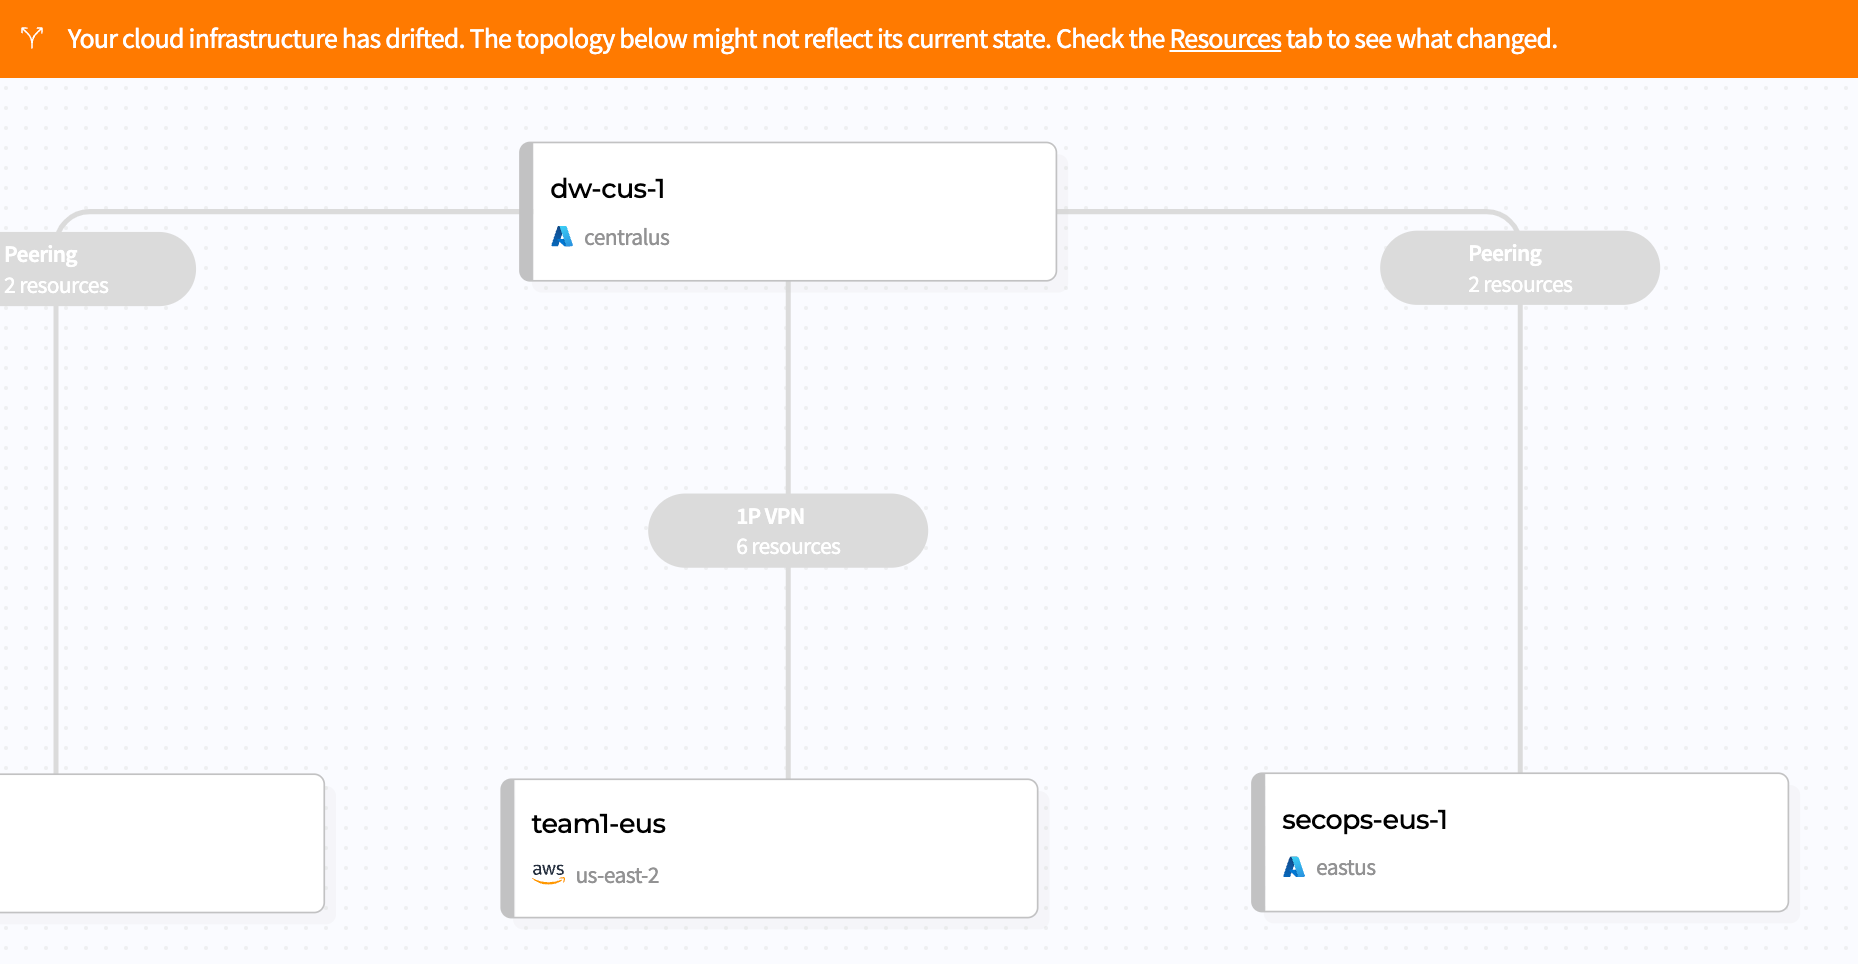
We are thrilled to introduce Magic Cloud Networking as another pivotal step to fulfilling the promise of the Connectivity Cloud. This marks our initial stride in empowering customers to seamlessly integrate Cloudflare with their public clouds to get securely connected, stay securely connected, and gain flexibility and cost savings as they go.
Join us on this journey for early access: learn more and sign up here.

Post Syndicated from Ignat Korchagin original https://blog.cloudflare.com/linux-kernel-hardening
The Linux kernel is the heart of many modern production systems. It decides when any code is allowed to run and which programs/users can access which resources. It manages memory, mediates access to hardware, and does a bulk of work under the hood on behalf of programs running on top. Since the kernel is always involved in any code execution, it is in the best position to protect the system from malicious programs, enforce the desired system security policy, and provide security features for safer production environments.
In this post, we will review some Linux kernel security configurations we use at Cloudflare and how they help to block or minimize a potential system compromise.
When a machine (either a laptop or a server) boots, it goes through several boot stages:
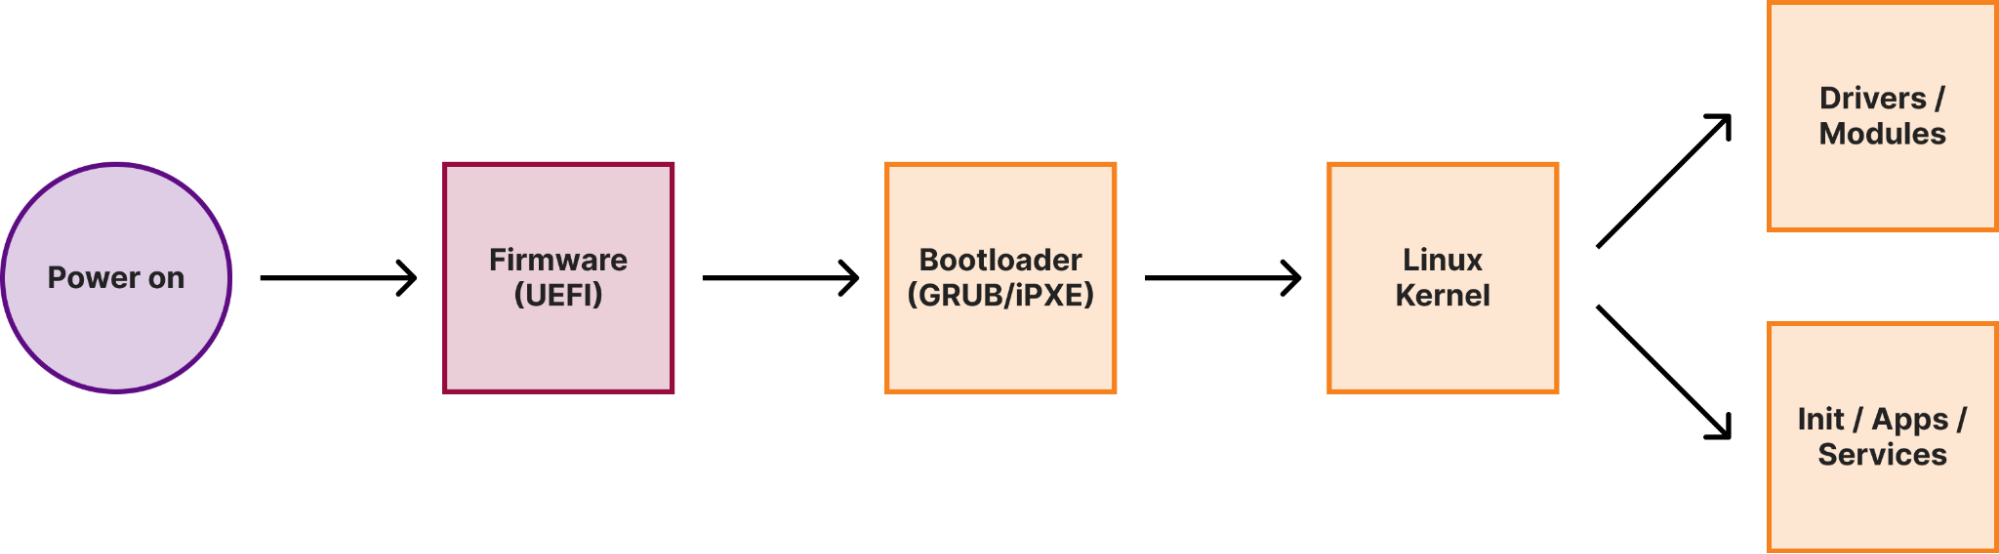
Within a secure boot architecture each stage from the above diagram verifies the integrity of the next stage before passing execution to it, thus forming a so-called secure boot chain. This way “trustworthiness” is extended to every component in the boot chain, because if we verified the code integrity of a particular stage, we can trust this code to verify the integrity of the next stage.
We have previously covered how Cloudflare implements secure boot in the initial stages of the boot process. In this post, we will focus on the Linux kernel.
Secure boot is the cornerstone of any operating system security mechanism. The Linux kernel is the primary enforcer of the operating system security configuration and policy, so we have to be sure that the Linux kernel itself has not been tampered with. In our previous post about secure boot we showed how we use UEFI Secure Boot to ensure the integrity of the Linux kernel.
But what happens next? After the kernel gets executed, it may try to load additional drivers, or as they are called in the Linux world, kernel modules. And kernel module loading is not confined just to the boot process. A module can be loaded at any time during runtime — a new device being plugged in and a driver is needed, some additional extensions in the networking stack are required (for example, for fine-grained firewall rules), or just manually by the system administrator.
However, uncontrolled kernel module loading might pose a significant risk to system integrity. Unlike regular programs, which get executed as user space processes, kernel modules are pieces of code which get injected and executed directly in the Linux kernel address space. There is no separation between the code and data in different kernel modules and core kernel subsystems, so everything can access everything. This means that a rogue kernel module can completely nullify the trustworthiness of the operating system and make secure boot useless. As an example, consider a simple Debian 12 (Bookworm installation), but with SELinux configured and enforced:
ignat@dev:~$ lsb_release --all
No LSB modules are available.
Distributor ID:	Debian
Description:	Debian GNU/Linux 12 (bookworm)
Release:	12
Codename:	bookworm
ignat@dev:~$ uname -a
Linux dev 6.1.0-18-cloud-amd64 #1 SMP PREEMPT_DYNAMIC Debian 6.1.76-1 (2024-02-01) x86_64 GNU/Linux
ignat@dev:~$ sudo getenforce
Enforcing
Now we need to do some research. First, we see that we’re running 6.1.76 Linux Kernel. If we explore the source code, we would see that inside the kernel, the SELinux configuration is stored in a singleton structure, which is defined as follows:
struct selinux_state {
#ifdef CONFIG_SECURITY_SELINUX_DISABLE
	bool disabled;
#endif
#ifdef CONFIG_SECURITY_SELINUX_DEVELOP
	bool enforcing;
#endif
	bool checkreqprot;
	bool initialized;
	bool policycap[__POLICYDB_CAP_MAX];

	struct page *status_page;
	struct mutex status_lock;

	struct selinux_avc *avc;
	struct selinux_policy __rcu *policy;
	struct mutex policy_mutex;
} __randomize_layout;
From the above, we can see that if the kernel configuration has CONFIG_SECURITY_SELINUX_DEVELOP enabled, the structure would have a boolean variable enforcing, which controls the enforcement status of SELinux at runtime. This is exactly what the above $ sudo getenforce command returns. We can double check that the Debian kernel indeed has the configuration option enabled:
ignat@dev:~$ grep CONFIG_SECURITY_SELINUX_DEVELOP /boot/config-`uname -r`
CONFIG_SECURITY_SELINUX_DEVELOP=y
Good! Now that we have a variable in the kernel, which is responsible for some security enforcement, we can try to attack it. One problem though is the __randomize_layout attribute: since CONFIG_SECURITY_SELINUX_DISABLE is actually not set for our Debian kernel, normally enforcing would be the first member of the struct. Thus if we know where the struct is, we immediately know the position of the enforcing flag. With __randomize_layout, during kernel compilation the compiler might place members at arbitrary positions within the struct, so it is harder to create generic exploits. But arbitrary struct randomization within the kernel may introduce performance impact, so is often disabled and it is disabled for the Debian kernel:
ignat@dev:~$ grep RANDSTRUCT /boot/config-`uname -r`
CONFIG_RANDSTRUCT_NONE=y
We can also confirm the compiled position of the enforcing flag using the pahole tool and either kernel debug symbols, if available, or (on modern kernels, if enabled) in-kernel BTF information. We will use the latter:
ignat@dev:~$ pahole -C selinux_state /sys/kernel/btf/vmlinux
struct selinux_state {
	bool                       enforcing;            /*     0     1 */
	bool                       checkreqprot;         /*     1     1 */
	bool                       initialized;          /*     2     1 */
	bool                       policycap[8];         /*     3     8 */

	/* XXX 5 bytes hole, try to pack */

	struct page *              status_page;          /*    16     8 */
	struct mutex               status_lock;          /*    24    32 */
	struct selinux_avc *       avc;                  /*    56     8 */
	/* --- cacheline 1 boundary (64 bytes) --- */
	struct selinux_policy *    policy;               /*    64     8 */
	struct mutex               policy_mutex;         /*    72    32 */

	/* size: 104, cachelines: 2, members: 9 */
	/* sum members: 99, holes: 1, sum holes: 5 */
	/* last cacheline: 40 bytes */
};
So enforcing is indeed located at the start of the structure and we don’t even have to be a privileged user to confirm this.
Great! All we need is the runtime address of the selinux_state variable inside the kernel:
(shell/bash)
ignat@dev:~$ sudo grep selinux_state /proc/kallsyms
ffffffffbc3bcae0 B selinux_state
With all the information, we can write an almost textbook simple kernel module to manipulate the SELinux state:
Mymod.c:
#include <linux/module.h>

static int __init mod_init(void)
{
	bool *selinux_enforce = (bool *)0xffffffffbc3bcae0;
	*selinux_enforce = false;
	return 0;
}

static void mod_fini(void)
{
}

module_init(mod_init);
module_exit(mod_fini);

MODULE_DESCRIPTION("A somewhat malicious module");
MODULE_AUTHOR("Ignat Korchagin <[email protected]>");
MODULE_LICENSE("GPL");
And the respective Kbuild file:
obj-m := mymod.o
With these two files we can build a full fledged kernel module according to the official kernel docs:
ignat@dev:~$ cd mymod/
ignat@dev:~/mymod$ ls
Kbuild  mymod.c
ignat@dev:~/mymod$ make -C /lib/modules/`uname -r`/build M=$PWD
make: Entering directory '/usr/src/linux-headers-6.1.0-18-cloud-amd64'
  CC [M]  /home/ignat/mymod/mymod.o
  MODPOST /home/ignat/mymod/Module.symvers
  CC [M]  /home/ignat/mymod/mymod.mod.o
  LD [M]  /home/ignat/mymod/mymod.ko
  BTF [M] /home/ignat/mymod/mymod.ko
Skipping BTF generation for /home/ignat/mymod/mymod.ko due to unavailability of vmlinux
make: Leaving directory '/usr/src/linux-headers-6.1.0-18-cloud-amd64'
If we try to load this module now, the system may not allow it due to the SELinux policy:
ignat@dev:~/mymod$ sudo insmod mymod.ko
insmod: ERROR: could not load module mymod.ko: Permission denied
We can workaround it by copying the module into the standard module path somewhere:
ignat@dev:~/mymod$ sudo cp mymod.ko /lib/modules/`uname -r`/kernel/crypto/
Now let’s try it out:
ignat@dev:~/mymod$ sudo getenforce
Enforcing
ignat@dev:~/mymod$ sudo insmod /lib/modules/`uname -r`/kernel/crypto/mymod.ko
ignat@dev:~/mymod$ sudo getenforce
Permissive
Not only did we disable the SELinux protection via a malicious kernel module, we did it quietly. Normal sudo setenforce 0, even if allowed, would go through the official selinuxfs interface and would emit an audit message. Our code manipulated the kernel memory directly, so no one was alerted. This illustrates why uncontrolled kernel module loading is very dangerous and that is why most security standards and commercial security monitoring products advocate for close monitoring of kernel module loading.
But we don’t need to monitor kernel modules at Cloudflare. Let’s repeat the exercise on a Cloudflare production kernel (module recompilation skipped for brevity):
ignat@dev:~/mymod$ uname -a
Linux dev 6.6.17-cloudflare-2024.2.9 #1 SMP PREEMPT_DYNAMIC Mon Sep 27 00:00:00 UTC 2010 x86_64 GNU/Linux
ignat@dev:~/mymod$ sudo insmod /lib/modules/`uname -r`/kernel/crypto/mymod.ko
insmod: ERROR: could not insert module /lib/modules/6.6.17-cloudflare-2024.2.9/kernel/crypto/mymod.ko: Key was rejected by service
We get a Key was rejected by service error when trying to load a module, and the kernel log will have the following message:
ignat@dev:~/mymod$ sudo dmesg | tail -n 1
[41515.037031] Loading of unsigned module is rejected
This is because the Cloudflare kernel requires all the kernel modules to have a valid signature, so we don’t even have to worry about a malicious module being loaded at some point:
ignat@dev:~$ grep MODULE_SIG_FORCE /boot/config-`uname -r`
CONFIG_MODULE_SIG_FORCE=y
For completeness it is worth noting that the Debian stock kernel also supports module signatures, but does not enforce it:
ignat@dev:~$ grep MODULE_SIG /boot/config-6.1.0-18-cloud-amd64
CONFIG_MODULE_SIG_FORMAT=y
CONFIG_MODULE_SIG=y
# CONFIG_MODULE_SIG_FORCE is not set
…
The above configuration means that the kernel will validate a module signature, if available. But if not – the module will be loaded anyway with a warning message emitted and the kernel will be tainted.
Signed kernel modules are great, but it creates a key management problem: to sign a module we need a signing keypair that is trusted by the kernel. The public key of the keypair is usually directly embedded into the kernel binary, so the kernel can easily use it to verify module signatures. The private key of the pair needs to be protected and secure, because if it is leaked, anyone could compile and sign a potentially malicious kernel module which would be accepted by our kernel.
But what is the best way to eliminate the risk of losing something? Not to have it in the first place! Luckily the kernel build system will generate a random keypair for module signing, if none is provided. At Cloudflare, we use that feature to sign all the kernel modules during the kernel compilation stage. When the compilation and signing is done though, instead of storing the key in a secure place, we just destroy the private key:
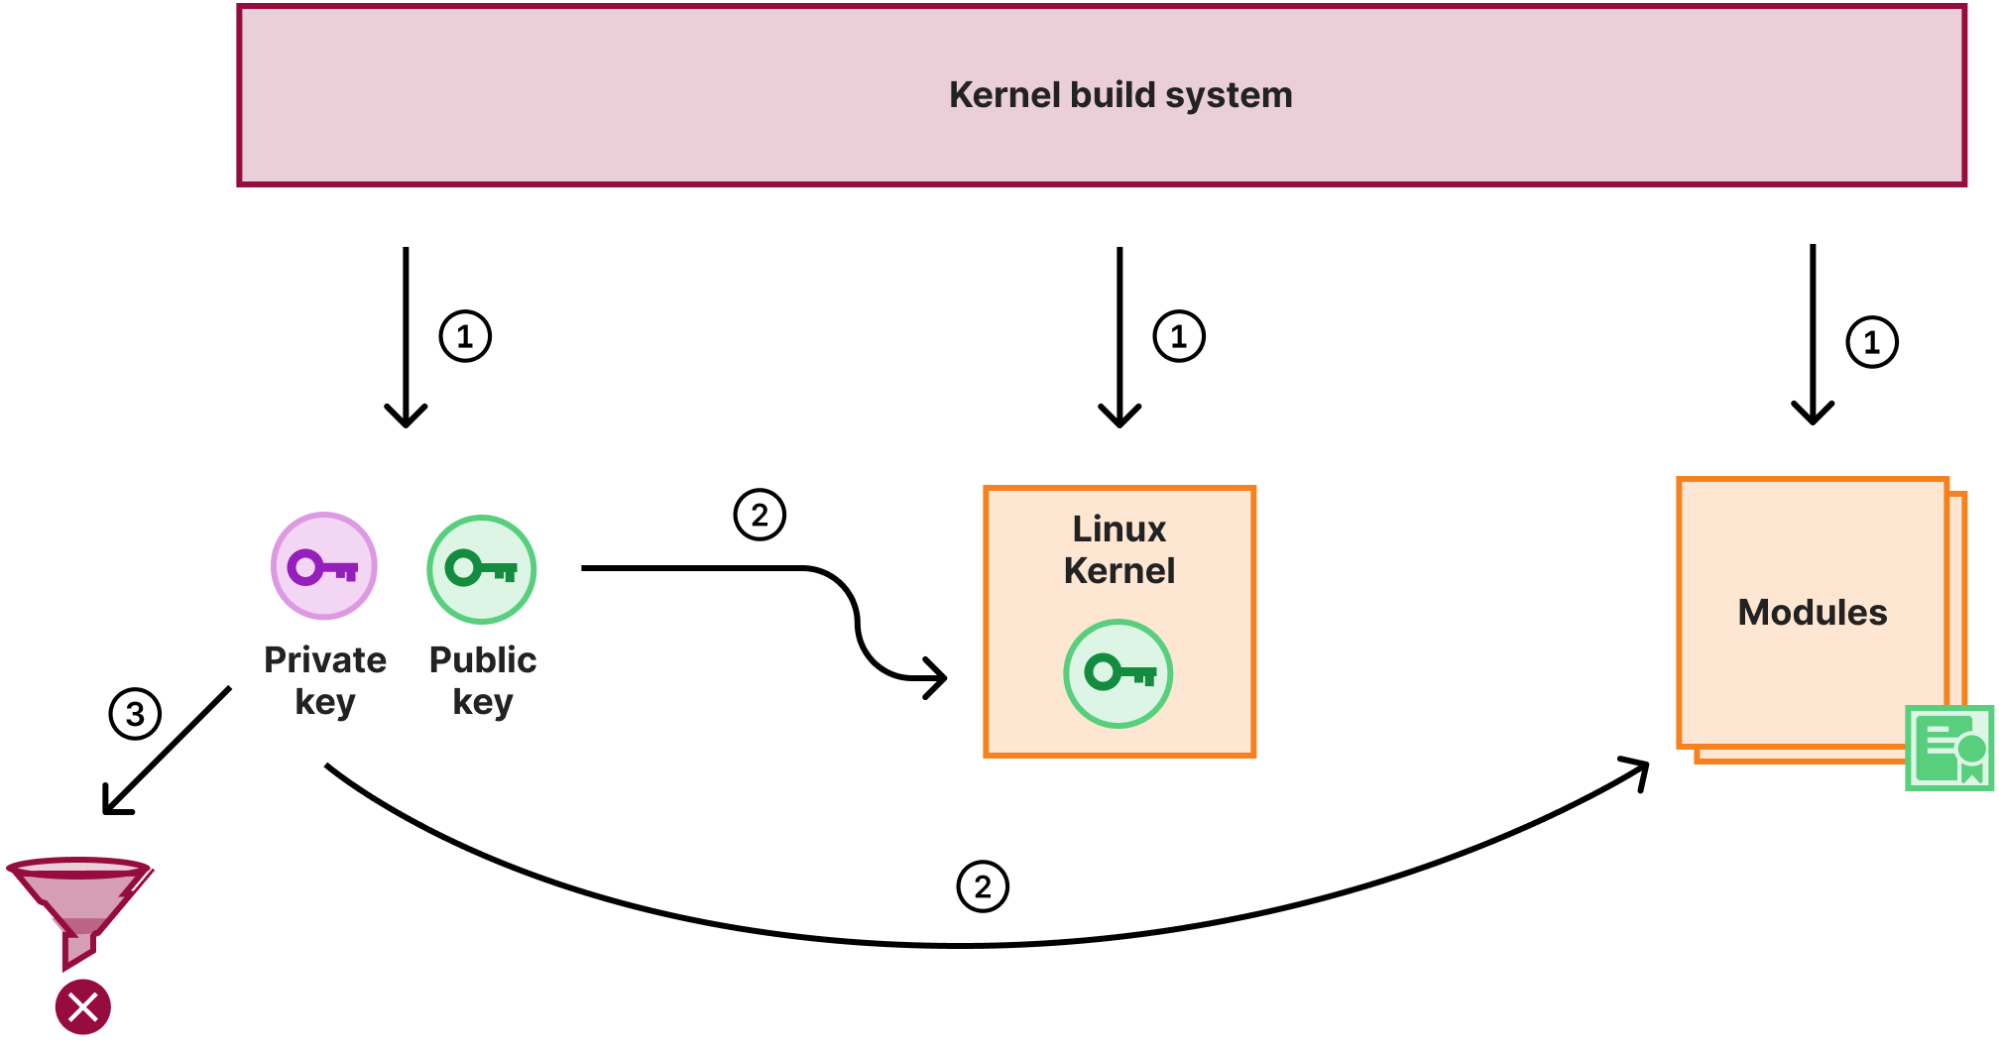
So with the above process:
With this scheme not only do we not have to worry about module signing key management, we also use a different key for each kernel we release to production. So even if a particular build process is hijacked and the signing key is not destroyed and potentially leaked, the key will no longer be valid when a kernel update is released.
There are some flexibility downsides though, as we can’t “retrofit” a new kernel module for an already released kernel (for example, for a new piece of hardware we are adopting). However, it is not a practical limitation for us as we release kernels often (roughly every week) to keep up with a steady stream of bug fixes and vulnerability patches in the Linux Kernel.
KEXEC (or kexec_load()) is an interesting system call in Linux, which allows for one kernel to directly execute (or jump to) another kernel. The idea behind this is to switch/update/downgrade kernels faster without going through a full reboot cycle to minimize the potential system downtime. However, it was developed quite a while ago, when secure boot and system integrity was not quite a concern. Therefore its original design has security flaws and is known to be able to bypass secure boot and potentially compromise system integrity.
We can see the problems just based on the definition of the system call itself:
struct kexec_segment {
	const void *buf;
	size_t bufsz;
	const void *mem;
	size_t memsz;
};
...
long kexec_load(unsigned long entry, unsigned long nr_segments, struct kexec_segment *segments, unsigned long flags);
So the kernel expects just a collection of buffers with code to execute. Back in those days there was not much desire to do a lot of data parsing inside the kernel, so the idea was to parse the to-be-executed kernel image in user space and provide the kernel with only the data it needs. Also, to switch kernels live, we need an intermediate program which would take over while the old kernel is shutting down and the new kernel has not yet been executed. In the kexec world this program is called purgatory. Thus the problem is evident: we give the kernel a bunch of code and it will happily execute it at the highest privilege level. But instead of the original kernel or purgatory code, we can easily provide code similar to the one demonstrated earlier in this post, which disables SELinux (or does something else to the kernel).
At Cloudflare we have had kexec_load() disabled for some time now just because of this. The advantage of faster reboots with kexec comes with a (small) risk of improperly initialized hardware, so it was not worth using it even without the security concerns. However, kexec does provide one useful feature — it is the foundation of the Linux kernel crashdumping solution. In a nutshell, if a kernel crashes in production (due to a bug or some other error), a backup kernel (previously loaded with kexec) can take over, collect and save the memory dump for further investigation. This allows to more effectively investigate kernel and other issues in production, so it is a powerful tool to have.
Luckily, since the original problems with kexec were outlined, Linux developed an alternative secure interface for kexec: instead of buffers with code it expects file descriptors with the to-be-executed kernel image and initrd and does parsing inside the kernel. Thus, only a valid kernel image can be supplied. On top of this, we can configure and require kexec to ensure the provided images are properly signed, so only authorized code can be executed in the kexec scenario. A secure configuration for kexec looks something like this:
ignat@dev:~$ grep KEXEC /boot/config-`uname -r`
CONFIG_KEXEC_CORE=y
CONFIG_HAVE_IMA_KEXEC=y
# CONFIG_KEXEC is not set
CONFIG_KEXEC_FILE=y
CONFIG_KEXEC_SIG=y
CONFIG_KEXEC_SIG_FORCE=y
CONFIG_KEXEC_BZIMAGE_VERIFY_SIG=y
…
Above we ensure that the legacy kexec_load() system call is disabled by disabling CONFIG_KEXEC, but still can configure Linux Kernel crashdumping via the new kexec_file_load() system call via CONFIG_KEXEC_FILE=y with enforced signature checks (CONFIG_KEXEC_SIG=y and CONFIG_KEXEC_SIG_FORCE=y).
Note that stock Debian kernel has the legacy kexec_load() system call enabled and does not enforce signature checks for kexec_file_load() (similar to module signature checks):
ignat@dev:~$ grep KEXEC /boot/config-6.1.0-18-cloud-amd64
CONFIG_KEXEC=y
CONFIG_KEXEC_FILE=y
CONFIG_ARCH_HAS_KEXEC_PURGATORY=y
CONFIG_KEXEC_SIG=y
# CONFIG_KEXEC_SIG_FORCE is not set
CONFIG_KEXEC_BZIMAGE_VERIFY_SIG=y
…
Even on the stock Debian kernel if you try to repeat the exercise we described in the “Secure boot” section of this post after a system reboot, you will likely see it would fail to disable SELinux now. This is because we hardcoded the kernel address of the selinux_state structure in our malicious kernel module, but the address changed now:
ignat@dev:~$ sudo grep selinux_state /proc/kallsyms
ffffffffb41bcae0 B selinux_state
Kernel Address Space Layout Randomization (or KASLR) is a simple concept: it slightly and randomly shifts the kernel code and data on each boot:
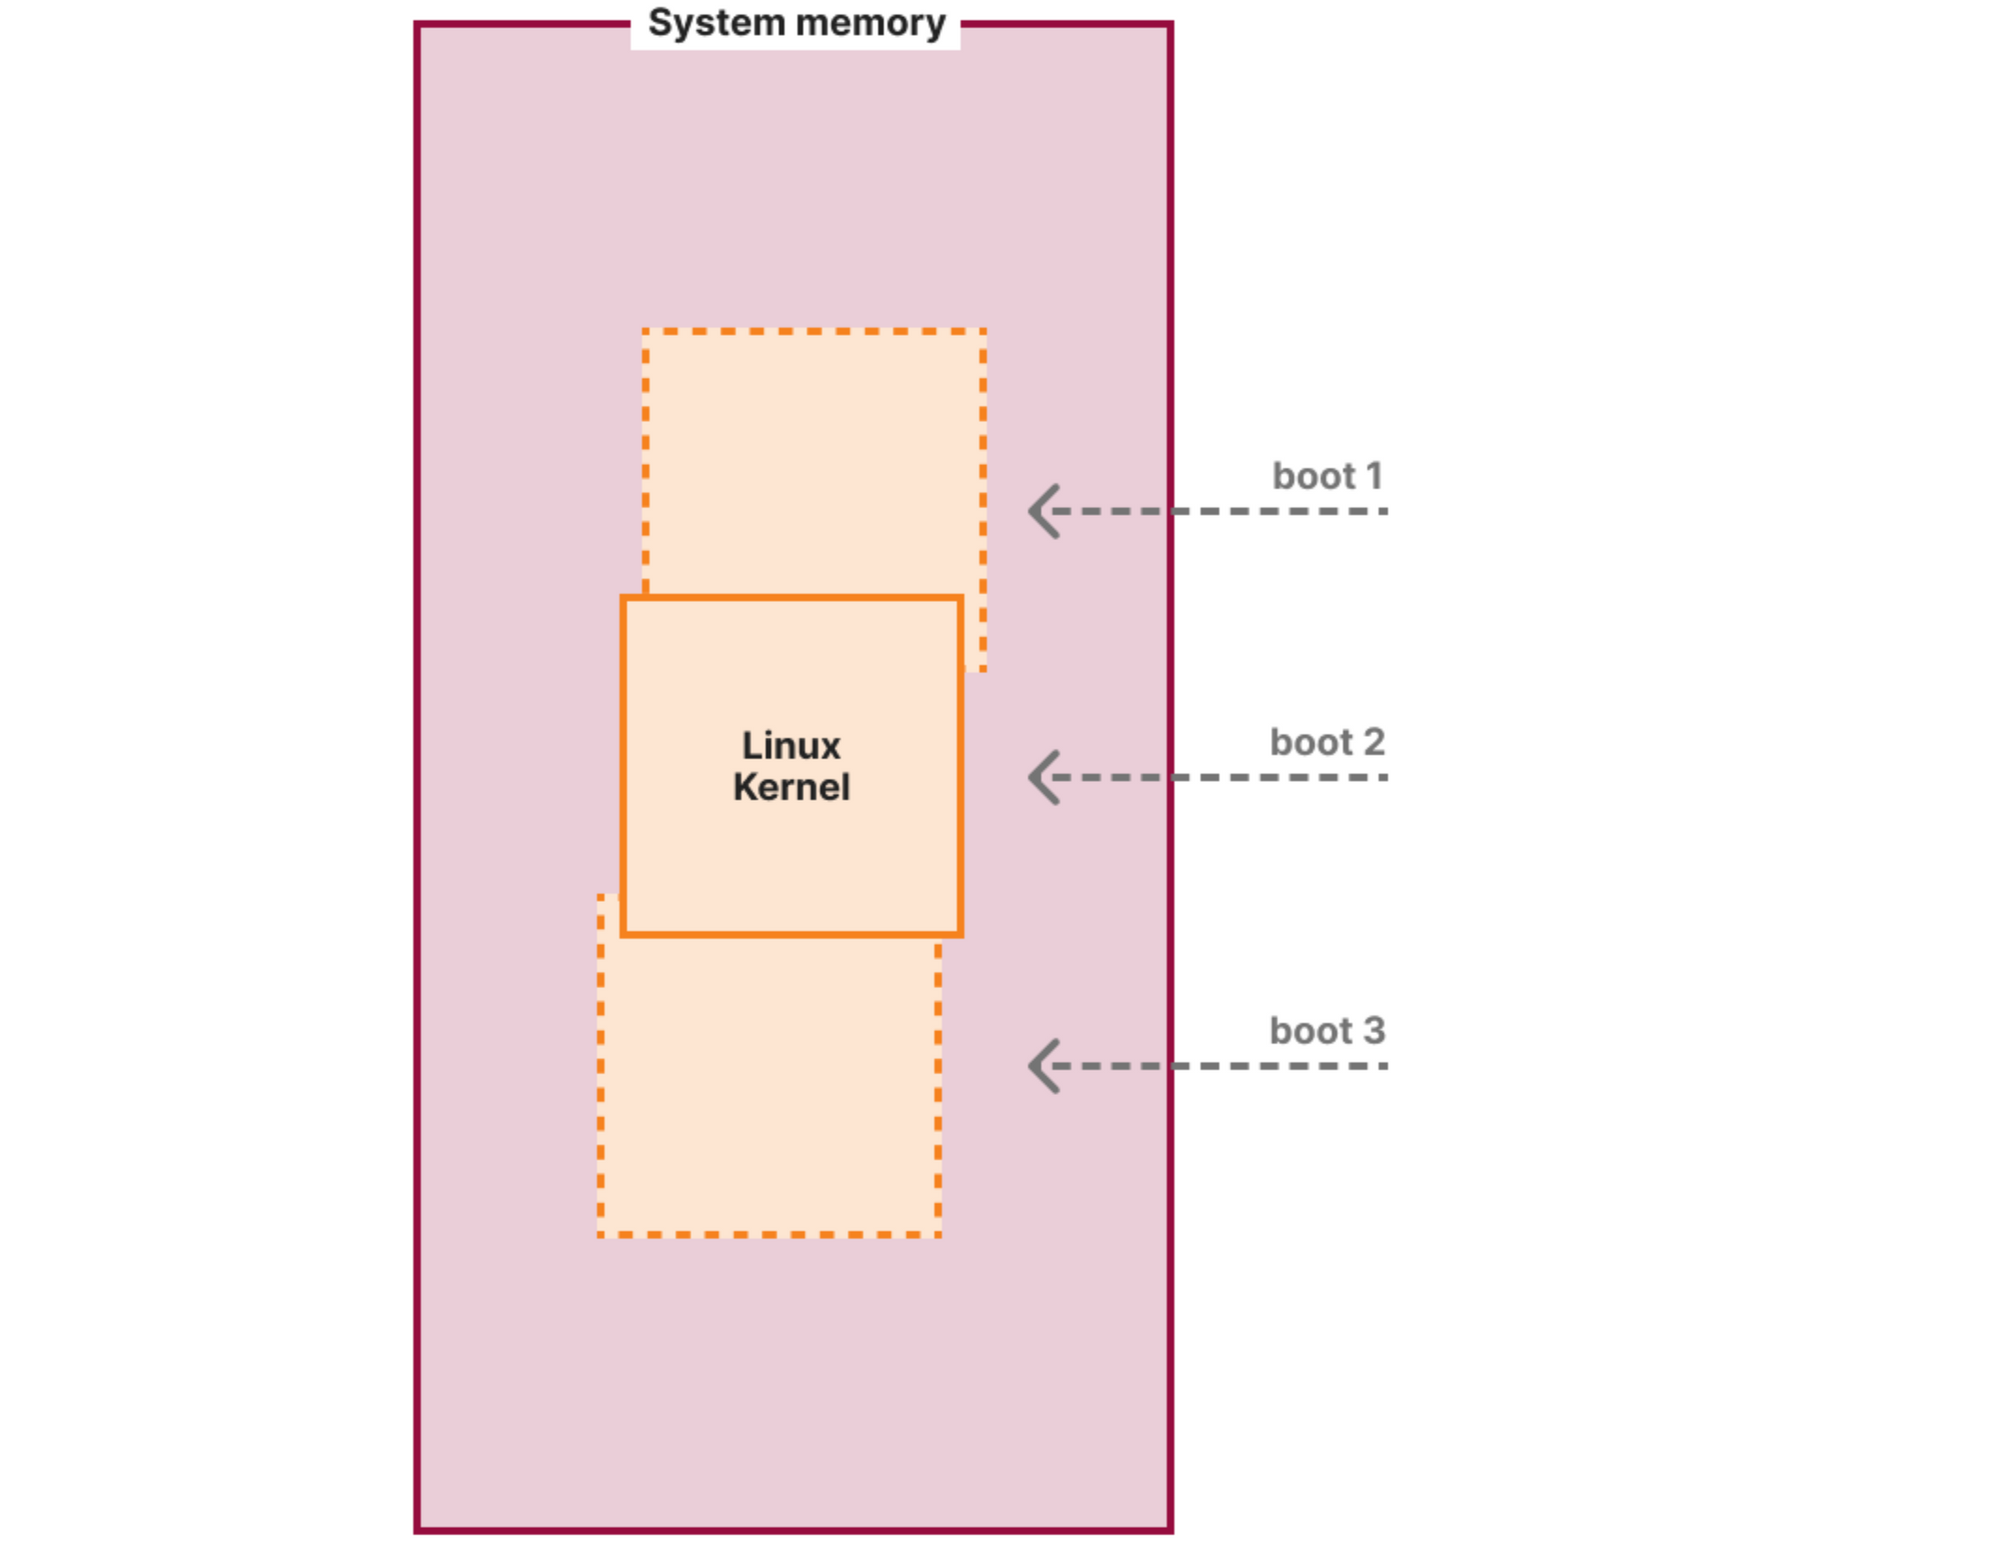
This is to combat targeted exploitation (like the malicious module in this post) based on the knowledge of the location of internal kernel structures and code. It is especially useful for popular Linux distribution kernels, like the Debian one, because most users use the same binary and anyone can download the debug symbols and the System.map file with all the addresses of the kernel internals. Just to note: it will not prevent the module loading and doing harm, but it will likely not achieve the targeted effect of disabling SELinux. Instead, it will modify a random piece of kernel memory potentially causing the kernel to crash.
Both the Cloudflare kernel and the Debian one have this feature enabled:
ignat@dev:~$ grep RANDOMIZE_BASE /boot/config-`uname -r`
CONFIG_RANDOMIZE_BASE=y
While KASLR helps with targeted exploits, it is quite easy to bypass since everything is shifted by a single random offset as shown on the diagram above. Thus if the attacker knows at least one runtime kernel address, they can recover this offset by subtracting the runtime address from the compile time address of the same symbol (function or data structure) from the kernel’s System.map file. Once they know the offset, they can recover the addresses of all other symbols by adjusting them by this offset.
Therefore, modern kernels take precautions not to leak kernel addresses at least to unprivileged users. One of the main tunables for this is the kptr_restrict sysctl. It is a good idea to set it at least to 1 to not allow regular users to see kernel pointers:
(shell/bash)
ignat@dev:~$ sudo sysctl -w kernel.kptr_restrict=1
kernel.kptr_restrict = 1
ignat@dev:~$ grep selinux_state /proc/kallsyms
0000000000000000 B selinux_state
Privileged users can still see the pointers:
ignat@dev:~$ sudo grep selinux_state /proc/kallsyms
ffffffffb41bcae0 B selinux_state
Similar to kptr_restrict sysctl there is also dmesg_restrict, which if set, would prevent regular users from reading the kernel log (which may also leak kernel pointers via its messages). While you need to explicitly set kptr_restrict sysctl to a non-zero value on each boot (or use some system sysctl configuration utility, like this one), you can configure dmesg_restrict initial value via the CONFIG_SECURITY_DMESG_RESTRICT kernel configuration option. Both the Cloudflare kernel and the Debian one enforce dmesg_restrict this way:
ignat@dev:~$ grep CONFIG_SECURITY_DMESG_RESTRICT /boot/config-`uname -r`
CONFIG_SECURITY_DMESG_RESTRICT=y
Worth noting that /proc/kallsyms and the kernel log are not the only sources of potential kernel pointer leaks. There is a lot of legacy in the Linux kernel and [new sources are continuously being found and patched]. That’s why it is very important to stay up to date with the latest kernel bugfix releases.
Linux Security Modules (LSM) is a hook-based framework for implementing security policies and Mandatory Access Control in the Linux Kernel. We have [covered our usage of another LSM module, BPF-LSM, previously].
BPF-LSM is a useful foundational piece for our kernel security, but in this post we want to mention another useful LSM module we use — the Lockdown LSM. Lockdown can be in three states (controlled by the /sys/kernel/security/lockdown special file):
ignat@dev:~$ cat /sys/kernel/security/lockdown
[none] integrity confidentiality
none is the state where nothing is enforced and the module is effectively disabled. When Lockdown is in the integrity state, the kernel tries to prevent any operation, which may compromise its integrity. We already covered some examples of these in this post: loading unsigned modules and executing unsigned code via KEXEC. But there are other potential ways (which are mentioned in the LSM’s man page), all of which this LSM tries to block. confidentiality is the most restrictive mode, where Lockdown will also try to prevent any information leakage from the kernel. In practice this may be too restrictive for server workloads as it blocks all runtime debugging capabilities, like perf or eBPF.
Let’s see the Lockdown LSM in action. On a barebones Debian system the initial state is none meaning nothing is locked down:
ignat@dev:~$ uname -a
Linux dev 6.1.0-18-cloud-amd64 #1 SMP PREEMPT_DYNAMIC Debian 6.1.76-1 (2024-02-01) x86_64 GNU/Linux
ignat@dev:~$ cat /sys/kernel/security/lockdown
[none] integrity confidentiality
We can switch the system into the integrity mode:
ignat@dev:~$ echo integrity | sudo tee /sys/kernel/security/lockdown
integrity
ignat@dev:~$ cat /sys/kernel/security/lockdown
none [integrity] confidentiality
It is worth noting that we can only put the system into a more restrictive state, but not back. That is, once in integrity mode we can only switch to confidentiality mode, but not back to none:
ignat@dev:~$ echo none | sudo tee /sys/kernel/security/lockdown
none
tee: /sys/kernel/security/lockdown: Operation not permitted
Now we can see that even on a stock Debian kernel, which as we discovered above, does not enforce module signatures by default, we cannot load a potentially malicious unsigned kernel module anymore:
ignat@dev:~$ sudo insmod mymod/mymod.ko
insmod: ERROR: could not insert module mymod/mymod.ko: Operation not permitted
And the kernel log will helpfully point out that this is due to Lockdown LSM:
ignat@dev:~$ sudo dmesg | tail -n 1
[21728.820129] Lockdown: insmod: unsigned module loading is restricted; see man kernel_lockdown.7
As we can see, Lockdown LSM helps to tighten the security of a kernel, which otherwise may not have other enforcing bits enabled, like the stock Debian one.
If you compile your own kernel, you can go one step further and set the initial state of the Lockdown LSM to be more restrictive than none from the start. This is exactly what we did for the Cloudflare production kernel:
ignat@dev:~$ grep LOCK_DOWN /boot/config-6.6.17-cloudflare-2024.2.9
# CONFIG_LOCK_DOWN_KERNEL_FORCE_NONE is not set
CONFIG_LOCK_DOWN_KERNEL_FORCE_INTEGRITY=y
# CONFIG_LOCK_DOWN_KERNEL_FORCE_CONFIDENTIALITY is not set
In this post we reviewed some useful Linux kernel security configuration options we use at Cloudflare. This is only a small subset, and there are many more available and even more are being constantly developed, reviewed, and improved by the Linux kernel community. We hope that this post will shed some light on these security features and that, if you haven’t already, you may consider enabling them in your Linux systems.
Tune in for more news, announcements and thought-provoking discussions! Don’t miss the full Security Week hub page.
Post Syndicated from Brian Tokuyoshi original https://blog.cloudflare.com/treating-sase-anxiety

We understand that your VeloCloud deployment may be partially or even fully deployed. You may be experiencing discomfort from SASE anxiety. Symptoms include:
If you’re a VeloCloud customer, we are here to help you with your transition to Magic WAN, with planning, products and services. You’ve experienced the turbulence, and that’s why we are taking steps to help. First, it’s necessary to illustrate what’s fundamentally wrong with the architecture by acquisition model in order to define the right path forward. Second, we document the steps involved for making a transition from VeloCloud to Cloudflare. Third, we are offering a helping hand to help VeloCloud customers to get their SASE strategies back on track.
Your IT organization must deliver stability across your information systems, because the future of your business depends on the decisions that you make today. You need to make sure that your SASE journey is backed by vendors that you can depend on. Indecisive vendors and unclear strategies rarely inspire confidence, and it’s driving organizations to reconsider their relationship.
It’s not just VeloCloud that’s pivoting. Many vendors are chasing the brass ring to meet the requirement for Single Vendor SASE, and they’re trying to reduce their time to market by acquiring features on their checklist, rather than taking the time to build the right architecture for consistent management and user experience. It’s led to rapid consolidation of both startups and larger product stacks, but now we’re seeing many many instances of vendors having to rationalize their overlapping product lines. Strange days indeed.
But the thing is, Single Vendor SASE is not a feature checklist game. It’s not like shopping for PC antivirus software where the most attractive option was the one with the most checkboxes. It doesn’t matter if you acquire a large stack of product acronyms (ZTNA, SD-WAN, SWG, CASB, DLP, FWaaS, SD-WAN to name but a few) if the results are just as convoluted as the technology it aims to replace.
If organizations are new to SASE, then it can be difficult to know what to look for. However, one clear sign of trouble is taking an SSE designed by one vendor and combining it with SD-WAN from another. Because you can’t get a converged platform out of two fundamentally incongruent technologies.
The conceptual model for SASE typically illustrates two half circles, with one consisting of cloud-delivered networking and the other being cloud-delivered security. With this picture in mind, it’s easy to see how one might think that combining an implementation of cloud-delivered networking (VeloCloud SD-WAN) and an implementation of cloud-delivered security (Symantec Network Protection – SSE) might satisfy the requirements. Does Single Vendor SASE = SD-WAN + SSE?
In practice, networking and network security do not exist in separate universes, but SD-WAN and SSE implementations do, especially when they were designed by different vendors. That’s why the math doesn’t work, because even with the requisite SASE functionality, the implementation of the functionality doesn’t fit. SD-WAN is designed for network connectivity between sites over the SD-WAN fabric, whereas SSE largely focuses on the enforcement of security policy for user->application traffic from remote users or traffic leaving (rather than traversing) the SD-WAN fabric. Therefore, to bring these two worlds together, you end up with security inconsistency, proxy chains which create a burden on latency, or implementing security at the edge rather than in the cloud.
At Cloudflare, the basis for our approach to single vendor SASE starts from building a global network designed with private data centers, overprovisioned network and compute capacity, and a private backbone designed to deliver our customer’s traffic to any destination. It’s what we call any-to-any connectivity. It’s not using the public cloud for SASE services, because the public cloud was designed as a destination for traffic rather than being optimized for transit. We are in full control of the design of our data centers and network and we’re obsessed with making it even better every day.
It’s from this network that we deliver networking and security services. Conceptually, we implement a philosophy of composability, where the fundamental network connection between the customer’s site and the Cloudflare data center remains the same across different use cases. In practice, and unlike traditional approaches, it means no downtime for service insertion when you need more functionality — the connection to Cloudflare remains the same. It’s the services and the onboarding of additional destinations that changes as organizations expand their use of Cloudflare.
From the perspective of branch connectivity, use Magic WAN for the connectivity that ties your business together, no matter which way traffic passes. That’s because we don’t treat the directions of your network traffic as independent problems. We solve for consistency by on-ramping all traffic through one of Cloudflare’s 310+ anycasted data centers (whether inbound, outbound, or east-west) for enforcement of security policy. We solve for latency by eliminating the need to forward traffic to a compute location by providing full compute services in every data center. We implement SASE using a light edge / heavy cloud model, with services delivered within the Cloudflare connectivity cloud rather than on-prem.
Start by contacting us to get a consultation session with our solutions architecture team. Our architects specialize in network modernization and can map your SASE goals across a series of smaller projects. We’ve worked with hundreds of organizations to achieve their SASE goals with the Cloudflare connectivity cloud and can build a plan that your team can execute on.
For product education, join one of our product workshops on Magic WAN to get a deep dive into how it’s built and how it can be rolled out to your locations. Magic WAN uses a light edge, heavy cloud model that has multiple network insertion models (whether a tunnel from an existing device, using our turnkey Magic WAN Connector, or deploying a virtual appliance) which can work in parallel or as a replacement for your branch connectivity needs, thus allowing you to migrate at your pace. Our specialist teams can help you mitigate transitionary hardware and license costs as you phase out VeloCloud and accelerate your rollout of Magic WAN.
The Magic WAN technical engineers have a number of resources to help you build product knowledge as well. This includes reference architectures and quick start guides that address your organization’s connectivity goals, whether sizing down your on-prem network in favor of the emerging “coffee shop networking” philosophy, retiring legacy SD-WAN, and full replacement of conventional MPLS.
For services, our customer success teams are ready to support your transition, with services that are tailored specifically for Magic WAN migrations both large and small.
Interested in learning more? Contact us to get started, and we’ll help you with your SASE journey. Contact us to learn how to replace VeloCloud with Cloudflare Magic WAN and use our network as an extension of yours.
Post Syndicated from Dan Hall original https://blog.cloudflare.com/eliminate-vpn-vulnerabilities-with-cloudflare-one

On January 19, 2024, the Cybersecurity & Infrastructure Security Agency (CISA) issued Emergency Directive 24-01: Mitigate Ivanti Connect Secure and Ivanti Policy Secure Vulnerabilities. CISA has the authority to issue emergency directives in response to a known or reasonably suspected information security threat, vulnerability, or incident. U.S. Federal agencies are required to comply with these directives.
Federal agencies were directed to apply a mitigation against two recently discovered vulnerabilities; the mitigation was to be applied within three days. Further monitoring by CISA revealed that threat actors were continuing to exploit the vulnerabilities and had developed some workarounds to earlier mitigations and detection methods. On January 31, CISA issued Supplemental Direction V1 to the Emergency Directive instructing agencies to immediately disconnect all instances of Ivanti Connect Secure and Ivanti Policy Secure products from agency networks and perform several actions before bringing the products back into service.
This blog post will explore the threat actor’s tactics, discuss the high-value nature of the targeted products, and show how Cloudflare’s Secure Access Service Edge (SASE) platform protects against such threats.
As a side note and showing the value of layered protections, Cloudflare’s WAF had proactively detected the Ivanti zero-day vulnerabilities and deployed emergency rules to protect Cloudflare customers.
Forensic investigations (see the Volexity blog for an excellent write-up) indicate that the attacks began as early as December 2023. Piecing together the evidence shows that the threat actors chained two previously unknown vulnerabilities together to gain access to the Connect Secure and Policy Secure appliances and achieve unauthenticated remote code execution (RCE).
CVE-2023-46805 is an authentication bypass vulnerability in the products’ web components that allows a remote attacker to bypass control checks and gain access to restricted resources. CVE-2024-21887 is a command injection vulnerability in the products’ web components that allows an authenticated administrator to execute arbitrary commands on the appliance and send specially crafted requests. The remote attacker was able to bypass authentication and be seen as an “authenticated” administrator, and then take advantage of the ability to execute arbitrary commands on the appliance.
By exploiting these vulnerabilities, the threat actor had near total control of the appliance. Among other things, the attacker was able to:
This is a serious incident that is exposing customers to significant risk. CISA is justified in issuing their directive, and Ivanti is working hard to mitigate the threat and develop patches for the software on their appliances. But it also serves as another indictment of the legacy “castle-and-moat” security paradigm. In that paradigm, remote users were outside the castle while protected applications and resources remained inside. The moat, consisting of a layer of security appliances, separated the two. The moat, in this case the Ivanti appliance, was responsible for authenticating and authorizing users, and then connecting them to protected applications and resources. Attackers and other bad actors were blocked at the moat.
This incident shows us what happens when a bad actor is able to take control of the moat itself, and the challenges customers face to recover control. Two typical characteristics of vendor-supplied appliances and the legacy security strategy highlight the risks:
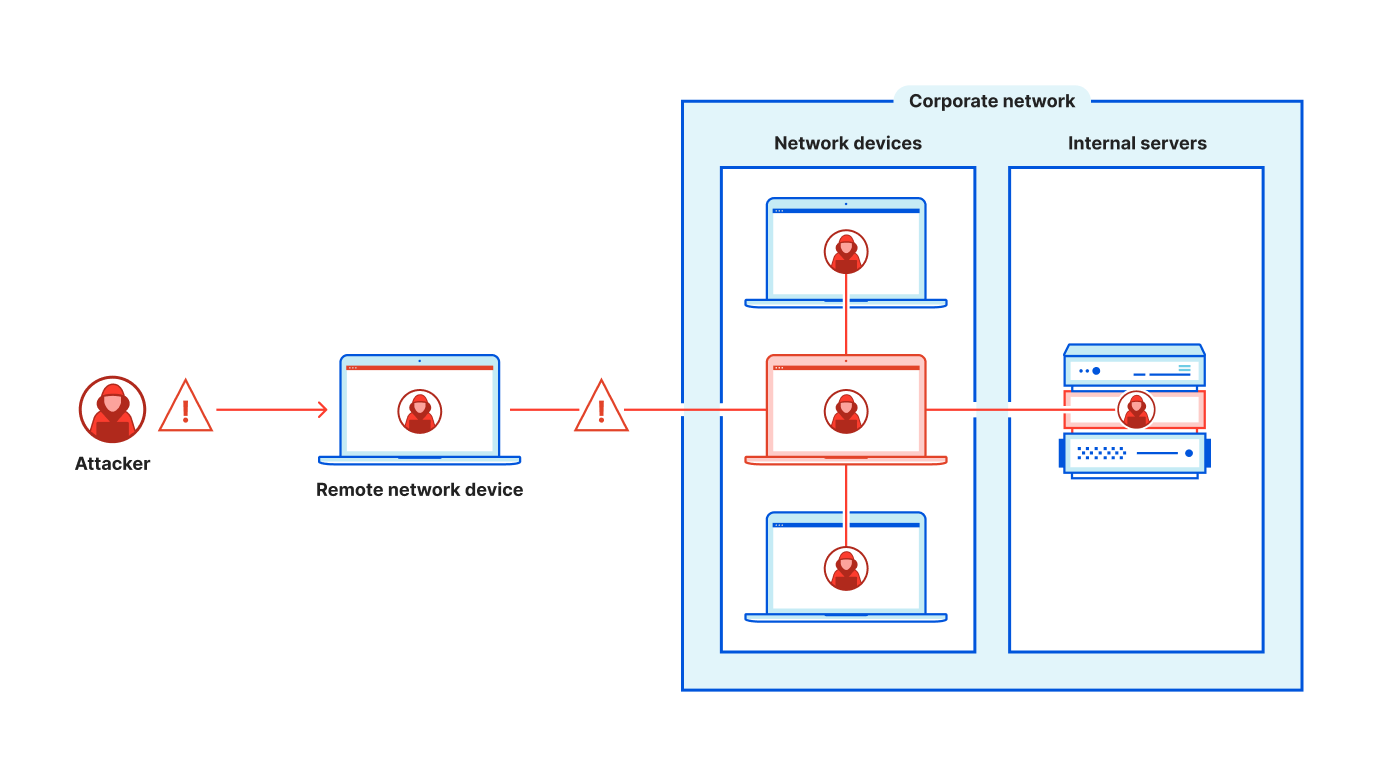
Cloudflare One is Cloudflare’s SSE and single-vendor SASE platform. While Cloudflare One spans broadly across security and networking services (and you can read about the latest additions here), I want to focus on the two points noted above.
First, Cloudflare One employs the principles of Zero Trust, including the principle of least privilege. As such, users that authenticate successfully only have access to the resources and applications necessary for their role. This principle also helps in the event of a compromised user account as the bad actor does not have indiscriminate network-level access. Rather, least privilege limits the range of lateral movement that a bad actor has, effectively reducing the blast radius.
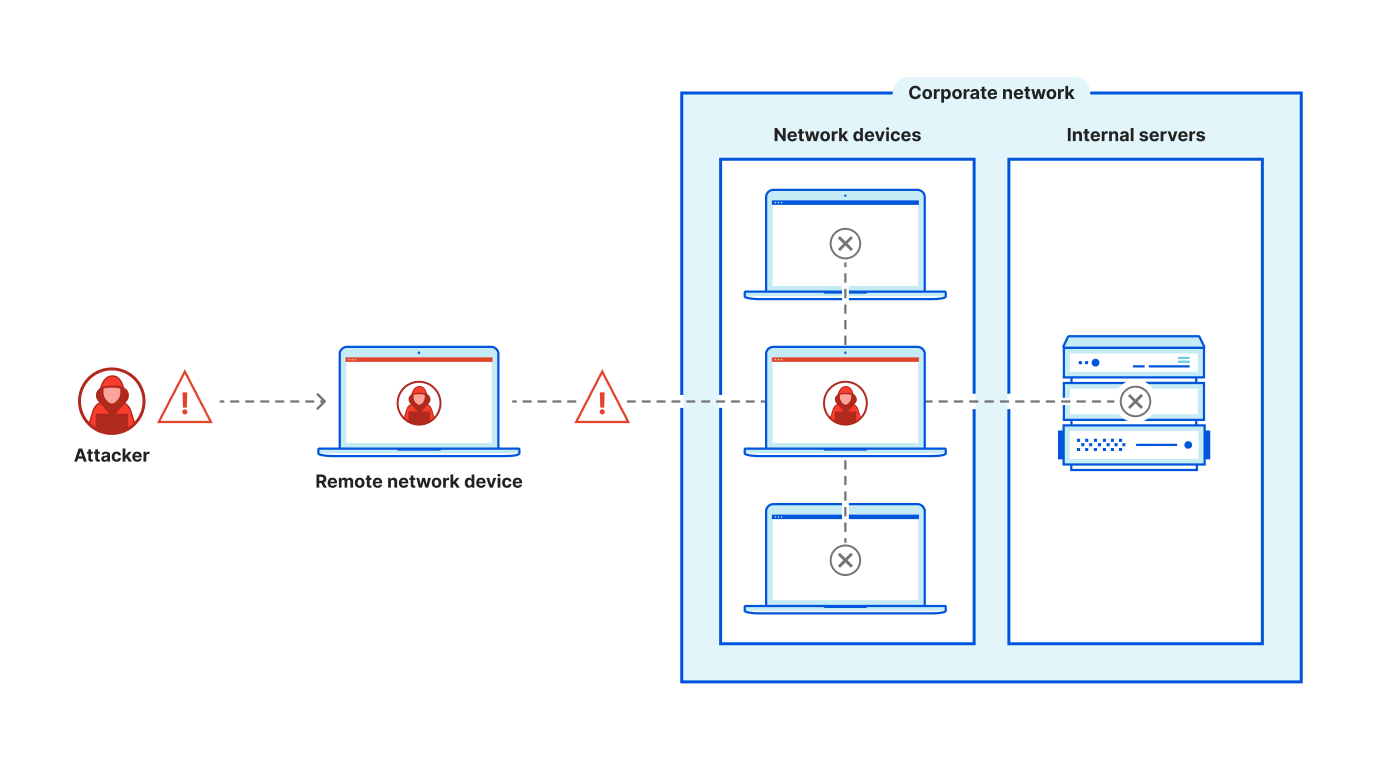
Second, while customer administrators need to have access to configure their services and policies, Cloudflare One does not provide any external access to the system internals of Cloudflare’s platform. Without that access, a bad actor would not be able to launch the types of attacks executed when they had access to the internals of the Ivanti appliance.
If your organization is impacted by the CISA directive, or you are just ready to modernize and want to augment or replace your current VPN solution, Cloudflare is here to help. Cloudflare’s Zero Trust Network Access (ZTNA) service, part of the Cloudflare One platform, is the fastest and safest way to connect any user to any application.
Contact us to get immediate onboarding help or to schedule an architecture workshop to help you augment or replace your Ivanti (or any) VPN solution.
Not quite ready for a live conversation? Read our learning path article on how to replace your VPN with Cloudflare or our SASE reference architecture for a view of how all of our SASE services and on-ramps work together.
Post Syndicated from Ben Ritter original https://blog.cloudflare.com/announcing-express-cni

We’re excited to announce the largest update to Cloudflare Network Interconnect (CNI) since its launch, and because we’re making CNIs faster and easier to deploy, we’re calling this Express CNI. At the most basic level, CNI is a cable between a customer’s network router and Cloudflare, which facilitates the direct exchange of information between networks instead of via the Internet. CNIs are fast, secure, and reliable, and have connected customer networks directly to Cloudflare for years. We’ve been listening to how we can improve the CNI experience, and today we are sharing more information about how we’re making it faster and easier to order CNIs, and connect them to Magic Transit and Magic WAN.
Interconnection services provide a private connection that allows you to connect your networks to other networks like the Internet, cloud service providers, and other businesses directly. This private connection benefits from improved connectivity versus going over the Internet and reduced exposure to common threats like Distributed Denial of Service (DDoS) attacks.
Cost is an important consideration when evaluating any vendor for interconnection services. The cost of an interconnection is typically comprised of a fixed port fee, based on the capacity (speed) of the port, and the variable amount of data transferred. Some cloud providers also add complex inter-region bandwidth charges.
Other important considerations include the following:
Cloudflare does not charge a port fee for Cloudflare Network Interconnect, nor do we charge for inter-region bandwidth. Using CNI with products like Magic Transit and Magic WAN may even reduce bandwidth spending with Internet service providers. For example, you can deliver Magic Transit-cleaned traffic to your data center with a CNI instead of via your Internet connection, reducing the amount of bandwidth that you would pay an Internet service provider for.
To underscore the value of CNI, one vendor charges nearly \$20,000 a year for a 10 Gigabit per second (Gbps) direct connect port. The same 10 Gbps CNI on Cloudflare for one year is $0. Their cost also does not include any costs related to the amount of data transferred between different regions or geographies, or outside of their cloud. We have never charged for CNIs, and are committed to making it even easier for customers to connect to Cloudflare, and destinations beyond on the open Internet.
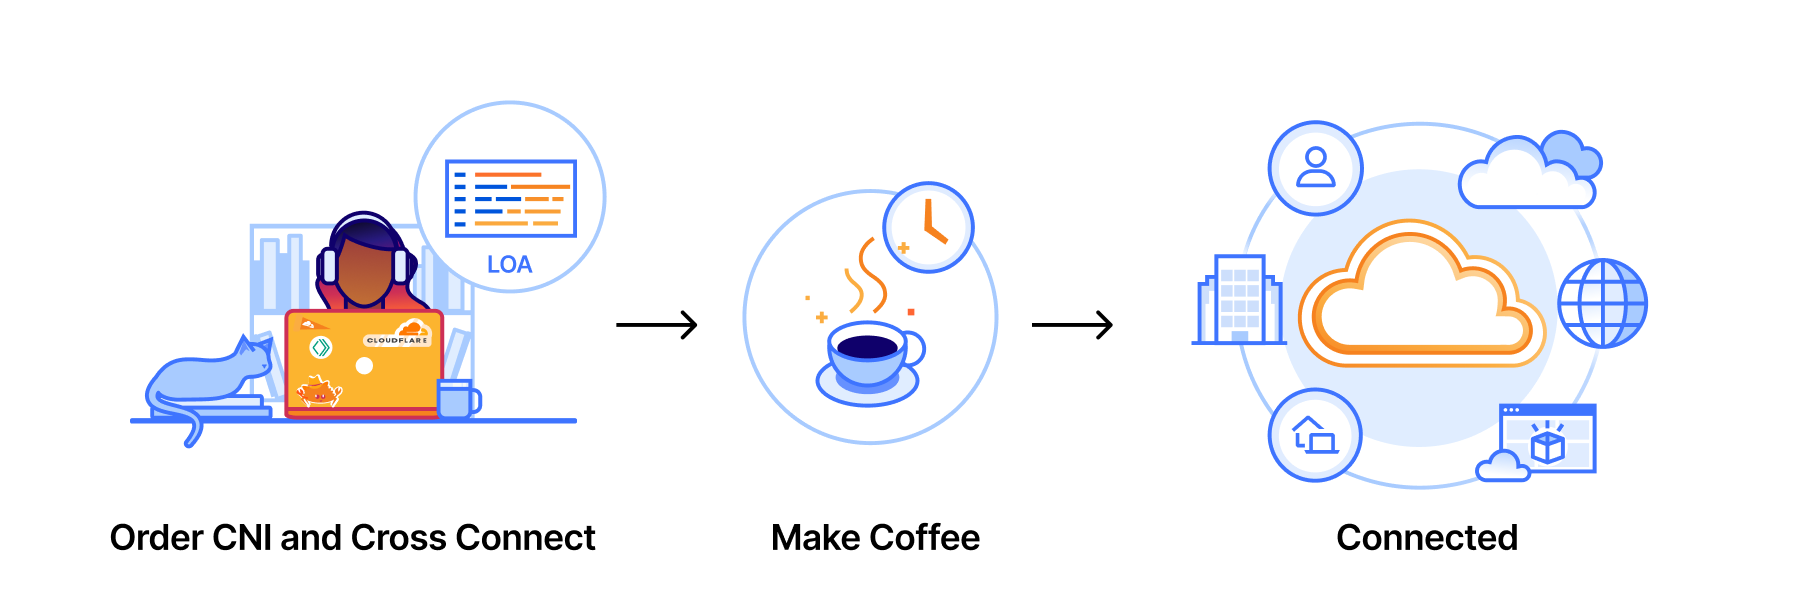
Our first big announcement is a new, faster approach to CNI provisioning and deployment. Starting today, all Magic Transit and Magic WAN customers can order CNIs directly from their Cloudflare account. The entire process is about 3 clicks and takes less than 3 minutes (roughly the time to make coffee). We’re going to show you how simple it is to order a CNI.
The first step is to find out whether Cloudflare is in the same data center or colocation facility as your routers, servers, and network hardware. Let’s navigate to the new “Interconnects” section of the Cloudflare dashboard, and order a new Direct CNI.
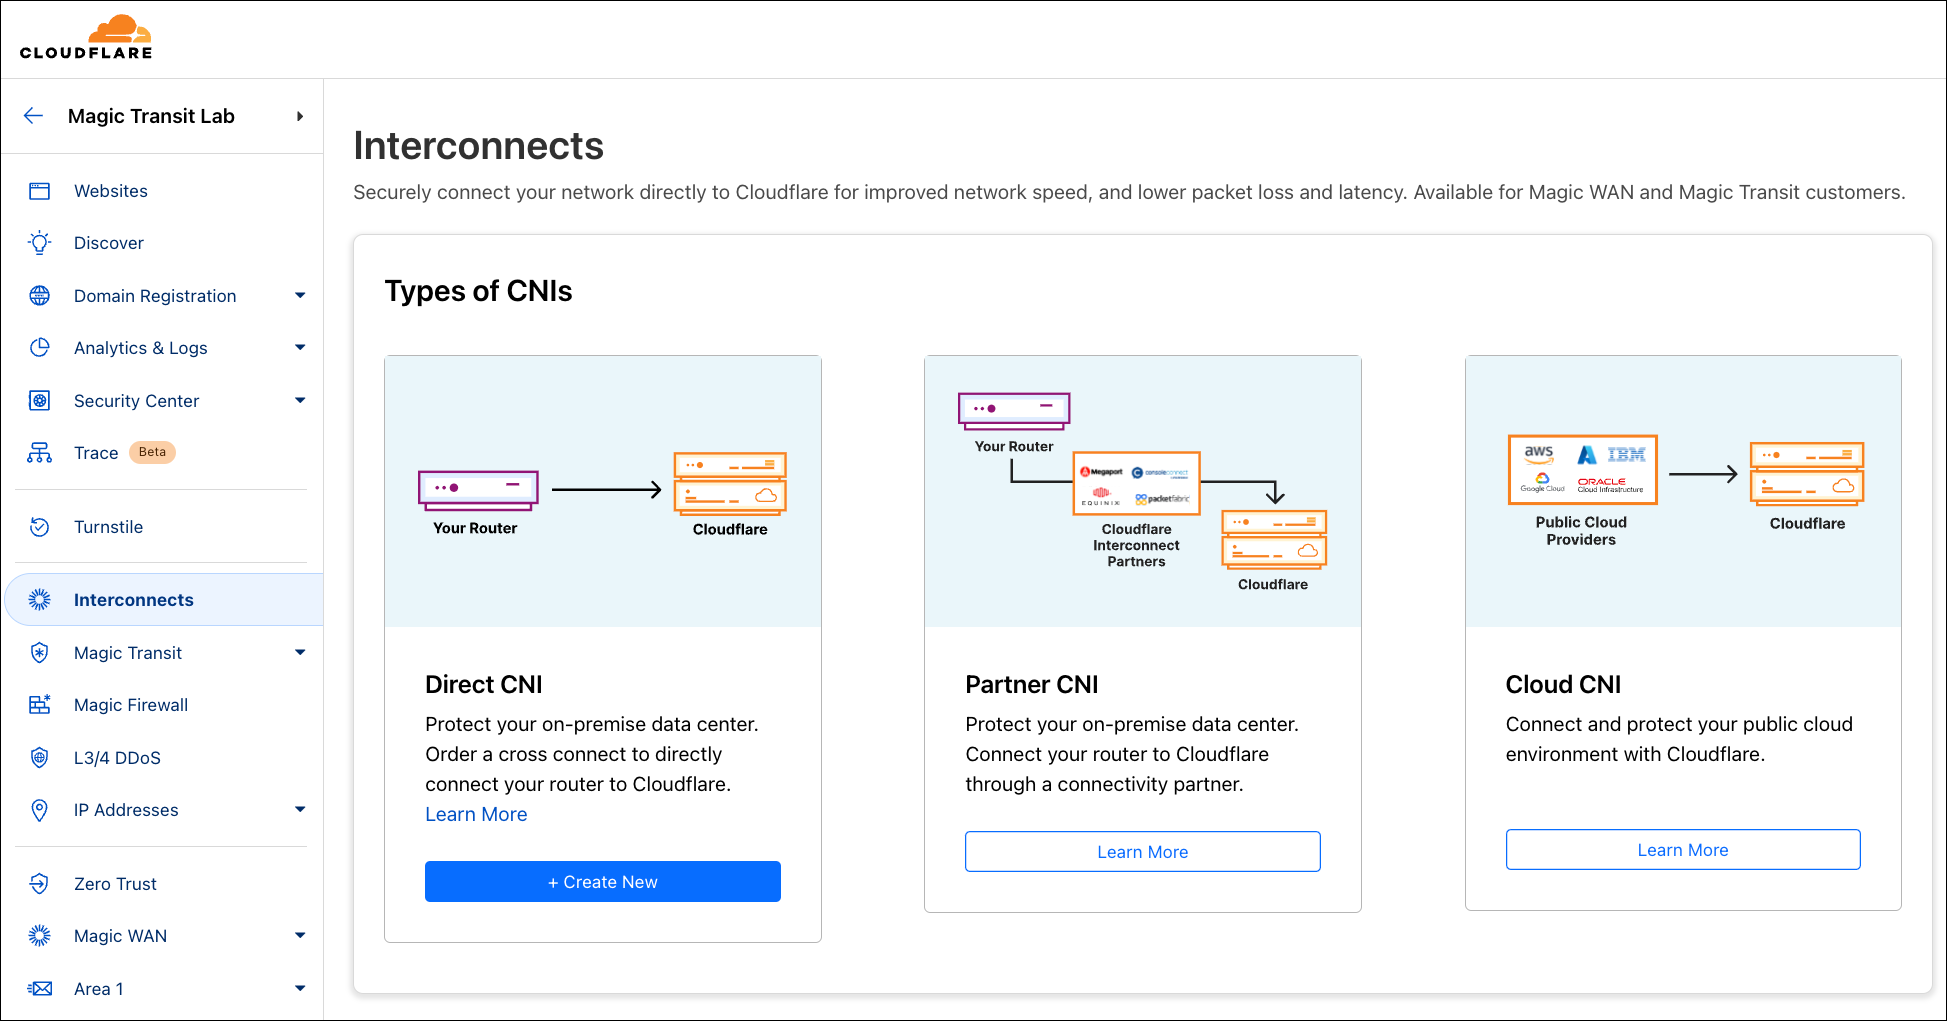
Search for the city of your data center, and quickly find out if Cloudflare is in the same facility. I’m going to stand up a CNI to connect my example network located in Ashburn, VA.
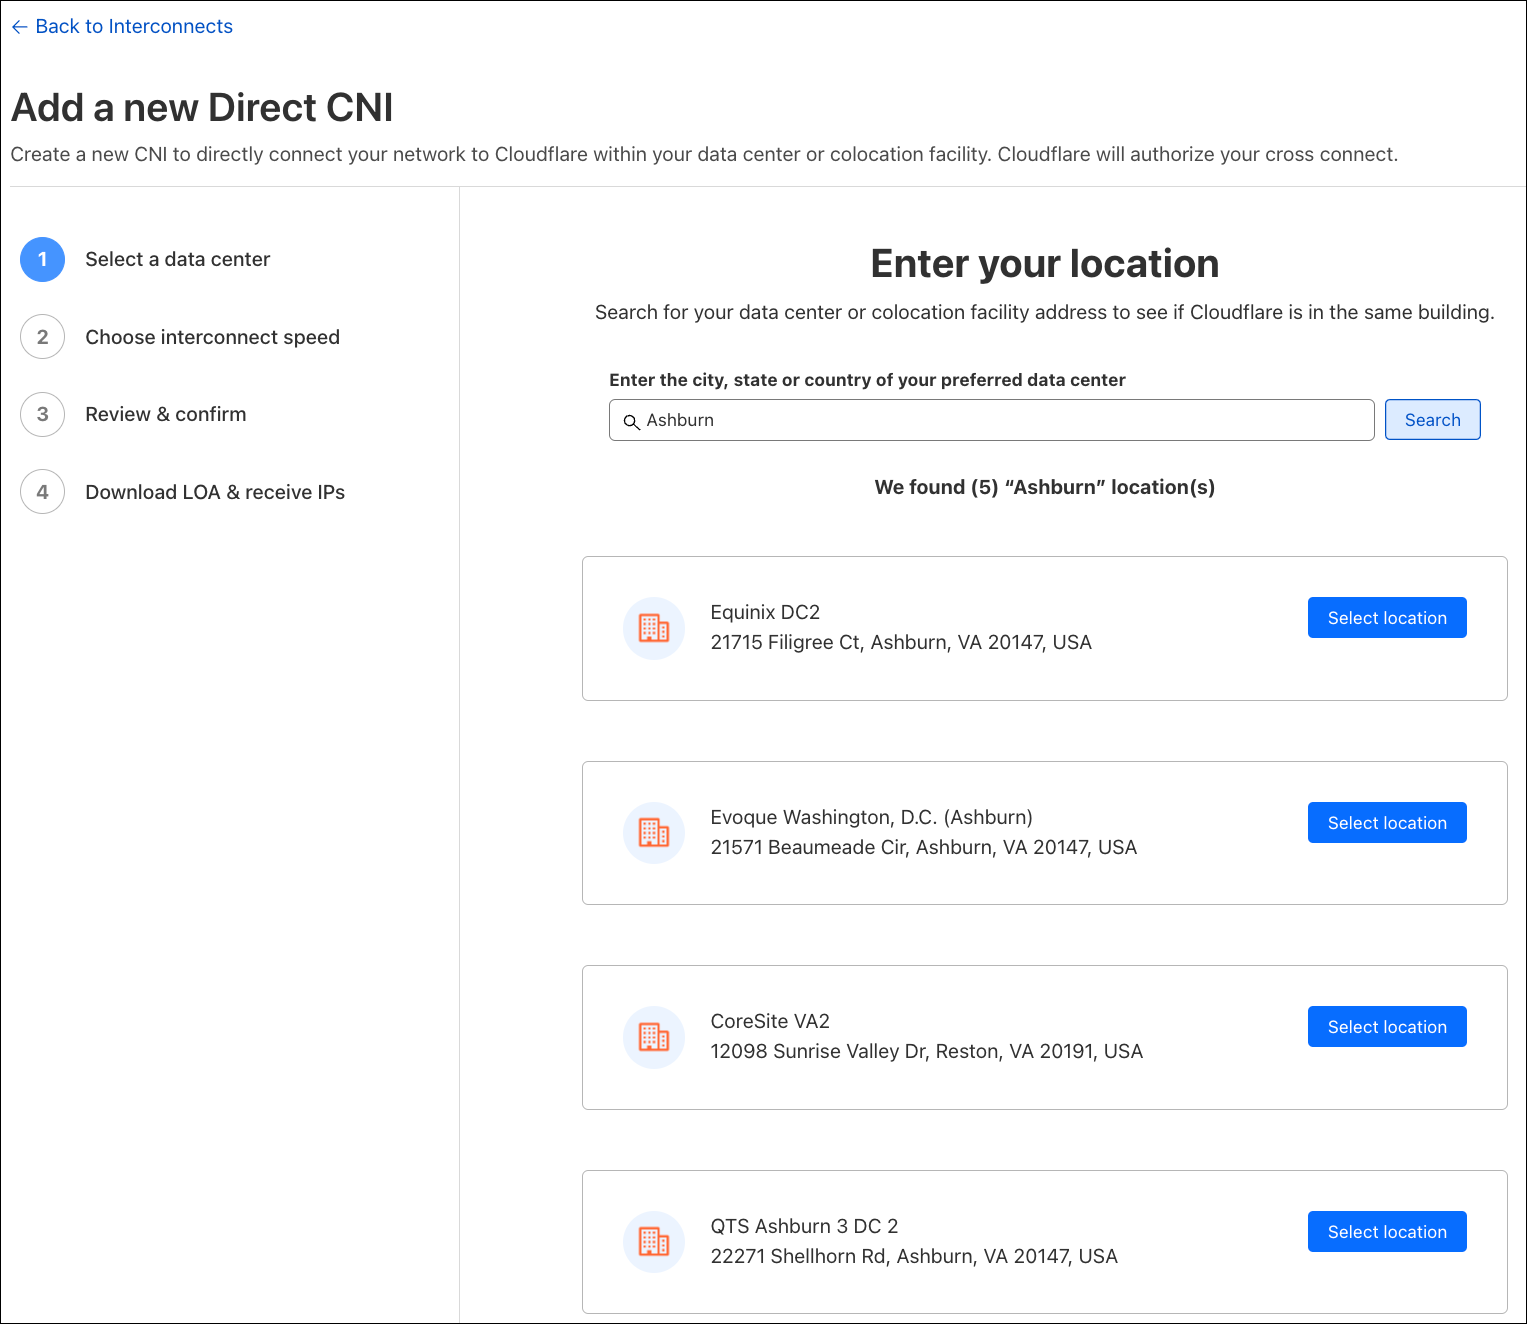
It looks like Cloudflare is in the same facility as my network, so I’m going to select the location where I’d like to connect.
As of right now, my data center is only exchanging a few hundred Megabits per second of traffic on Magic Transit, so I’m going to select a 1 Gigabit per second interface, which is the smallest port speed available. I can also order a 10 Gbps link if I have more than 1 Gbps of traffic in a single location. Cloudflare also supports 100 Gbps CNIs, but if you have this much traffic to exchange with us, we recommend that you coordinate with your account team.
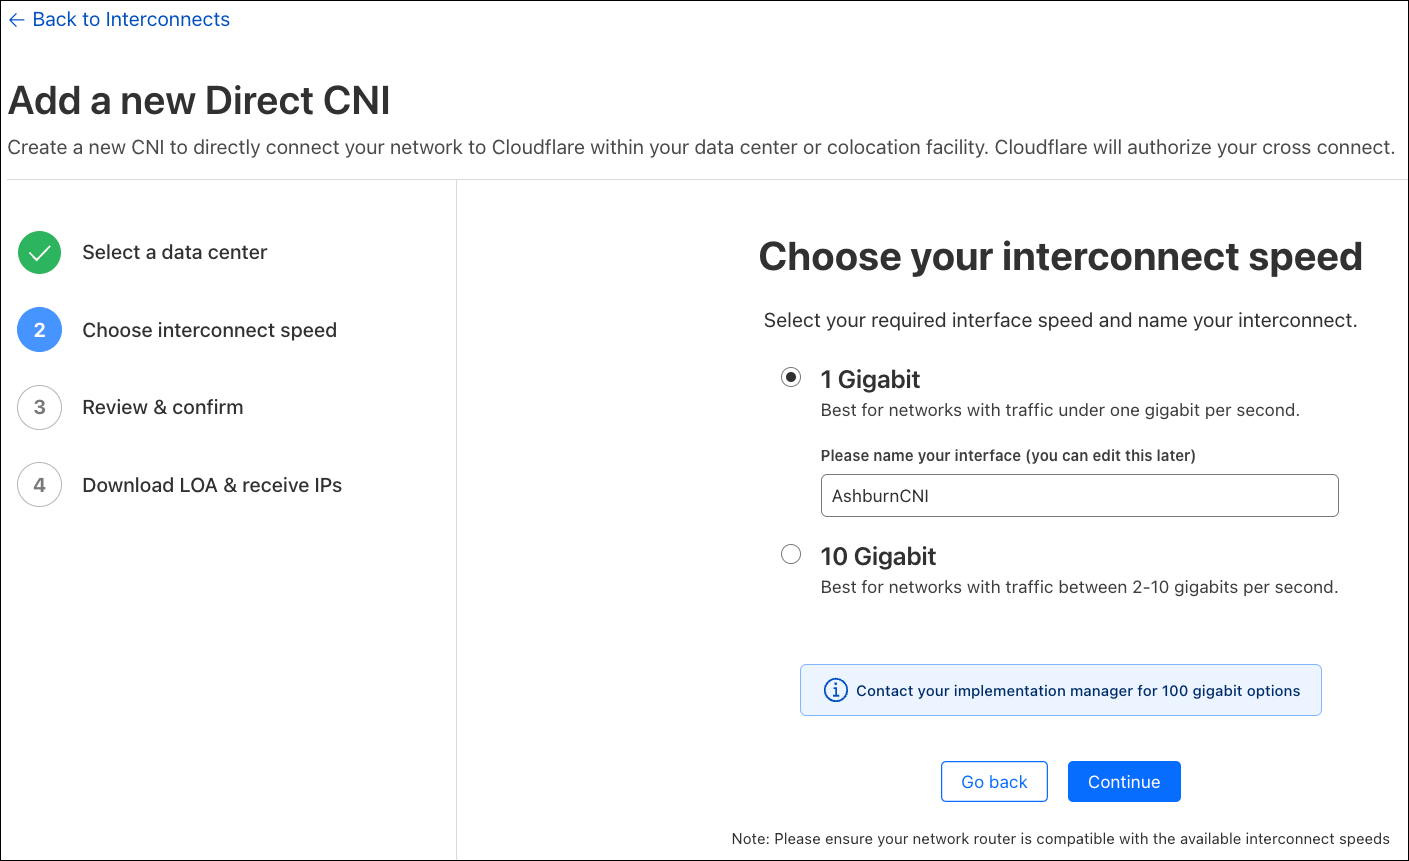
After selecting your preferred port speed, you can name your CNI, which will be referenceable later when you direct your Magic Transit or Magic WAN traffic to the interconnect. We are given the opportunity to verify that everything looks correct before confirming our CNI order.
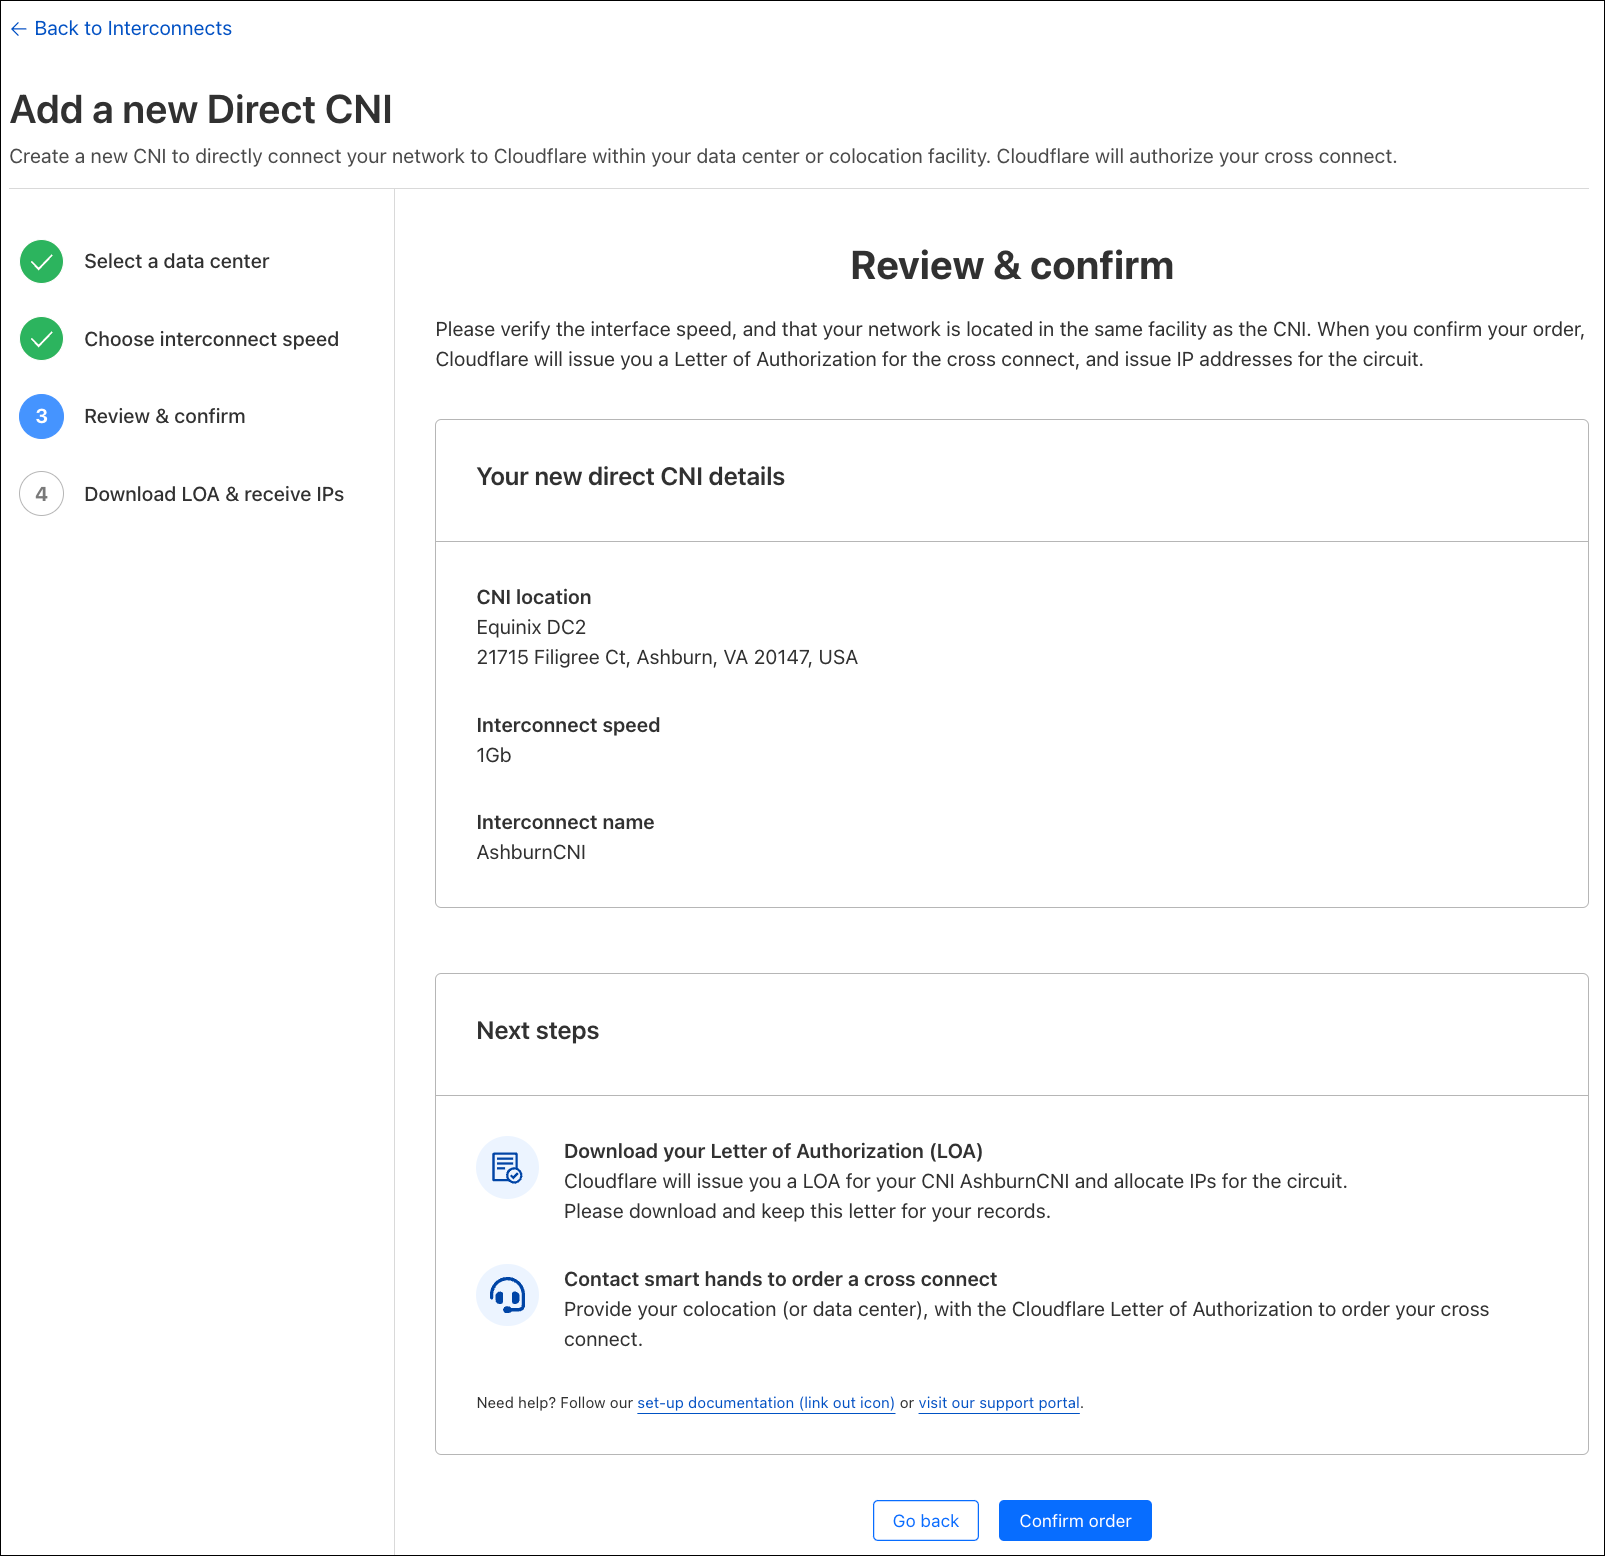
Once we click the “Confirm Order” button, Cloudflare will provision an interface on our router for your CNI, and also assign IP addresses for you to configure on your router interface. Cloudflare will also issue you a Letter of Authorization (LOA) for you to order a cross connect with the local facility. Cloudflare will provision a port on our router for your CNI within 3 minutes of your order, and you will be able to ping across the CNI as soon as the interface line status comes up.
After downloading the Letter of Authorization (LOA) to order a cross connect, we’ll navigate back to our Interconnects area. Here we can see the point to point IP addressing, and the CNI name that is used in our Magic Transit or Magic WAN configuration. We can also redownload the LOA if needed.
Our second major announcement is that Express CNI dramatically simplifies how Magic Transit and Magic WAN customers connect to Cloudflare. Getting packets into Magic Transit or Magic WAN in the past with a CNI required customers to configure a GRE (Generic Routing Encapsulation) tunnel on their router. These configurations are complex, and not all routers and switches support these changes. Since both Magic Transit and Magic WAN protect networks, and operate at the network layer on packets, customers rightly asked us, “If I connect directly to Cloudflare with CNI, why do I also need a GRE tunnel for Magic Transit and Magic WAN?”
Starting today, GRE tunnels are no longer required with Express CNI. This means that Cloudflare supports standard 1500-byte packets on the CNI, and there’s no need for complex GRE or MSS adjustment configurations to get traffic into Magic Transit or Magic WAN. This significantly reduces the amount of configuration required on a router for Magic Transit and Magic WAN customers who can connect over Express CNI. If you’re not familiar with Magic Transit, the key takeaway is that we’ve reduced the complexity of changes you must make on your router to protect your network with Cloudflare.
We’re excited about how Express CNI simplifies connecting to Cloudflare’s network. Some customers connect to Cloudflare through our Interconnection Platform Partners, like Equinix and Megaport, and we plan to bring the Express CNI features to our partners too.
We have upgraded a number of our data centers to support Express CNI, and plan to upgrade many more over the next few months. We are rapidly expanding the number of global locations that support Express CNI as we install new network hardware. If you’re interested in connecting to Cloudflare with Express CNI, but are unable to find your data center, please let your account team know.
If you’re on an existing classic CNI today, and you don’t need Express CNI features, there is no obligation to migrate to Express CNI. Magic Transit and Magic WAN customers have been asking for BGP support to control how Cloudflare routes traffic back to their networks, and we expect to extend BGP support to Express CNI first, so keep an eye out for more Express CNI announcements later this year.
As we’ve demonstrated above, Express CNI makes it fast and easy to connect your network to Cloudflare. If you’re a Magic Transit or Magic WAN customer, the new “Interconnects” area is now available on your Cloudflare dashboard. To deploy your first CNI, you can follow along with the screenshots above, or refer to our updated interconnects documentation.
Post Syndicated from Dan Hall original https://blog.cloudflare.com/zero-trust-warp-with-a-masque

In June 2023, we told you that we were building a new protocol, MASQUE, into WARP. MASQUE is a fascinating protocol that extends the capabilities of HTTP/3 and leverages the unique properties of the QUIC transport protocol to efficiently proxy IP and UDP traffic without sacrificing performance or privacy
At the same time, we’ve seen a rising demand from Zero Trust customers for features and solutions that only MASQUE can deliver. All customers want WARP traffic to look like HTTPS to avoid detection and blocking by firewalls, while a significant number of customers also require FIPS-compliant encryption. We have something good here, and it’s been proven elsewhere (more on that below), so we are building MASQUE into Zero Trust WARP and will be making it available to all of our Zero Trust customers — at WARP speed!
This blog post highlights some of the key benefits our Cloudflare One customers will realize with MASQUE.
Cloudflare is on a mission to help build a better Internet. And it is a journey we’ve been on with our device client and WARP for almost five years. The precursor to WARP was the 2018 launch of 1.1.1.1, the Internet’s fastest, privacy-first consumer DNS service. WARP was introduced in 2019 with the announcement of the 1.1.1.1 service with WARP, a high performance and secure consumer DNS and VPN solution. Then in 2020, we introduced Cloudflare’s Zero Trust platform and the Zero Trust version of WARP to help any IT organization secure their environment, featuring a suite of tools we first built to protect our own IT systems. Zero Trust WARP with MASQUE is the next step in our journey.
WireGuard was the perfect choice for the 1.1.1.1 with WARP service in 2019. WireGuard is fast, simple, and secure. It was exactly what we needed at the time to guarantee our users’ privacy, and it has met all of our expectations. If we went back in time to do it all over again, we would make the same choice.
But the other side of the simplicity coin is a certain rigidity. We find ourselves wanting to extend WireGuard to deliver more capabilities to our Zero Trust customers, but WireGuard is not easily extended. Capabilities such as better session management, advanced congestion control, or simply the ability to use FIPS-compliant cipher suites are not options within WireGuard; these capabilities would have to be added on as proprietary extensions, if it was even possible to do so.
Plus, while WireGuard is popular in VPN solutions, it is not standards-based, and therefore not treated like a first class citizen in the world of the Internet, where non-standard traffic can be blocked, sometimes intentionally, sometimes not. WireGuard uses a non-standard port, port 51820, by default. Zero Trust WARP changes this to use port 2408 for the WireGuard tunnel, but it’s still a non-standard port. For our customers who control their own firewalls, this is not an issue; they simply allow that traffic. But many of the large number of public Wi-Fi locations, or the approximately 7,000 ISPs in the world, don’t know anything about WireGuard and block these ports. We’ve also faced situations where the ISP does know what WireGuard is and blocks it intentionally.
This can play havoc for roaming Zero Trust WARP users at their local coffee shop, in hotels, on planes, or other places where there are captive portals or public Wi-Fi access, and even sometimes with their local ISP. The user is expecting reliable access with Zero Trust WARP, and is frustrated when their device is blocked from connecting to Cloudflare’s global network.
Now we have another proven technology — MASQUE — which uses and extends HTTP/3 and QUIC. Let’s do a quick review of these to better understand why Cloudflare believes MASQUE is the future.
HTTP/3 and QUIC are among the most recent advancements in the evolution of the Internet, enabling faster, more reliable, and more secure connections to endpoints like websites and APIs. Cloudflare worked closely with industry peers through the Internet Engineering Task Force on the development of RFC 9000 for QUIC and RFC 9114 for HTTP/3. The technical background on the basic benefits of HTTP/3 and QUIC are reviewed in our 2019 blog post where we announced QUIC and HTTP/3 availability on Cloudflare’s global network.
Most relevant for Zero Trust WARP, QUIC delivers better performance on low-latency or high packet loss networks thanks to packet coalescing and multiplexing. QUIC packets in separate contexts during the handshake can be coalesced into the same UDP datagram, thus reducing the number of receive and system interrupts. With multiplexing, QUIC can carry multiple HTTP sessions within the same UDP connection. Zero Trust WARP also benefits from QUIC’s high level of privacy, with TLS 1.3 designed into the protocol.
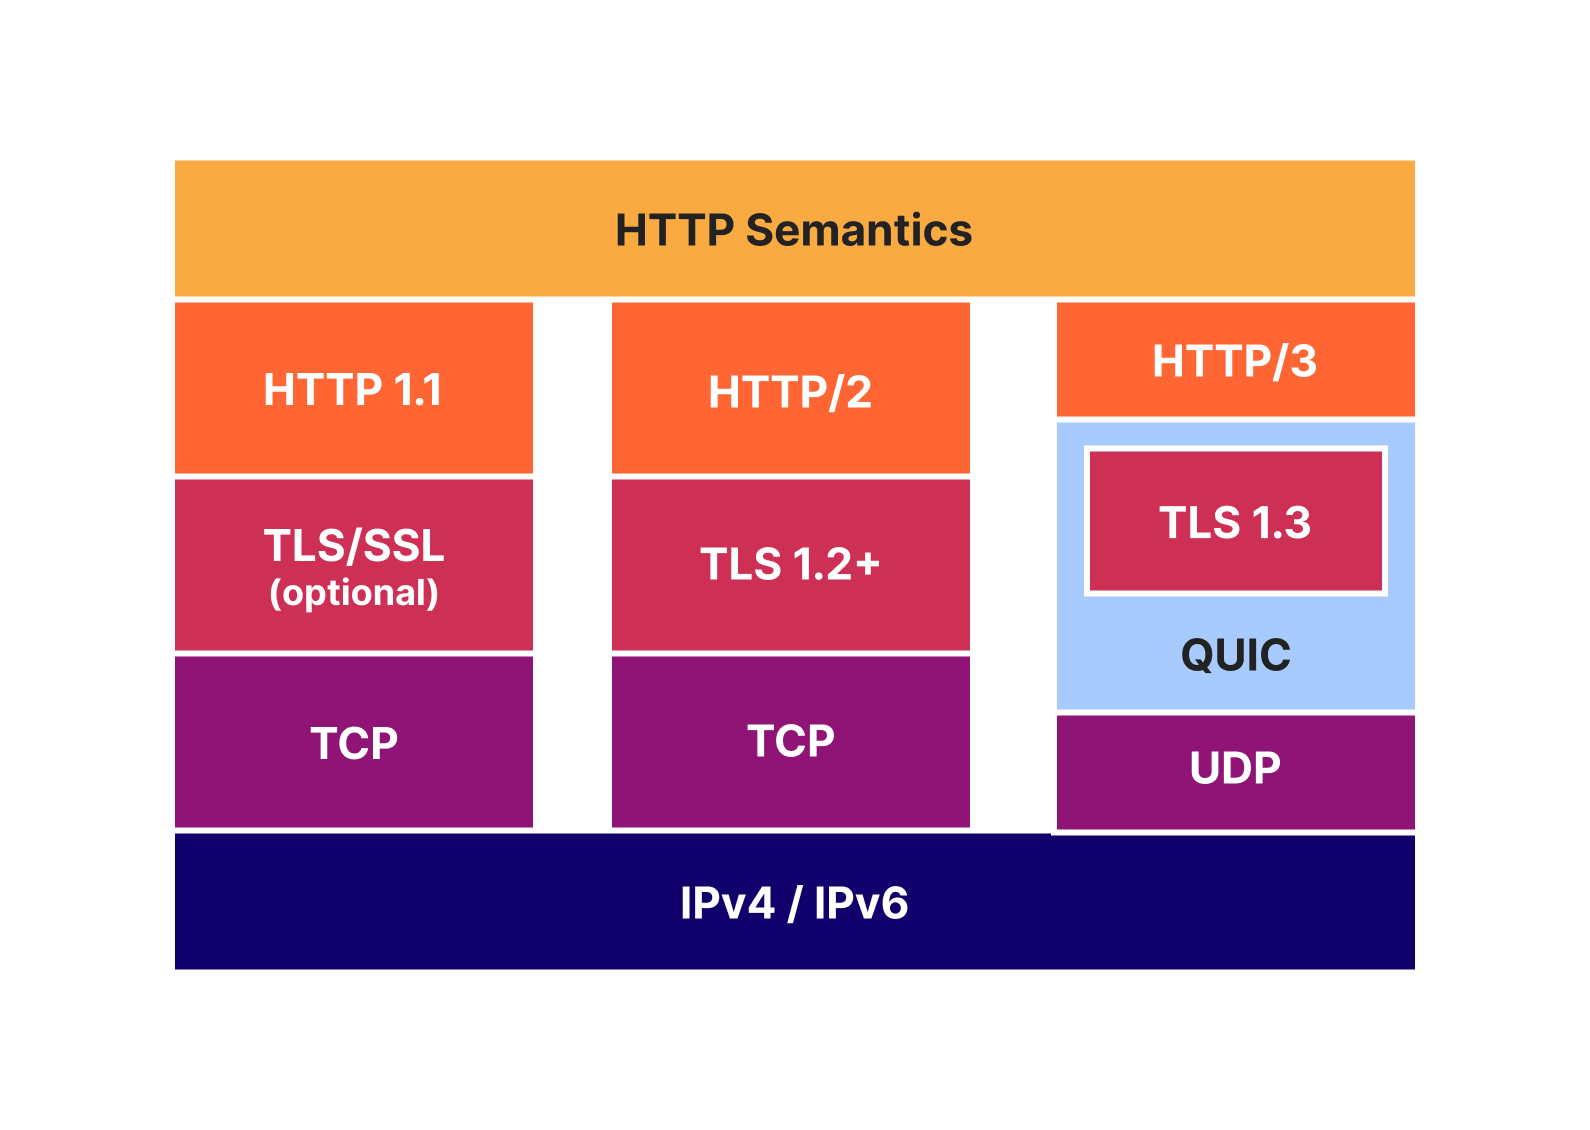
MASQUE unlocks QUIC’s potential for proxying by providing the application layer building blocks to support efficient tunneling of TCP and UDP traffic. In Zero Trust WARP, MASQUE will be used to establish a tunnel over HTTP/3, delivering the same capability as WireGuard tunneling does today. In the future, we’ll be in position to add more value using MASQUE, leveraging Cloudflare’s ongoing participation in the MASQUE Working Group. This blog post is a good read for those interested in digging deeper into MASQUE.
OK, so Cloudflare is going to use MASQUE for WARP. What does that mean to you, the Zero Trust customer?
Cloudflare’s network today spans more than 310 cities in over 120 countries, and interconnects with over 13,000 networks globally. HTTP/3 and QUIC were introduced to the Cloudflare network in 2019, the HTTP/3 standard was finalized in 2022, and represented about 30% of all HTTP traffic on our network in 2023.
We are also using MASQUE for iCloud Private Relay and other Privacy Proxy partners. The services that power these partnerships, from our Rust-based proxy framework to our open source QUIC implementation, are already deployed globally in our network and have proven to be fast, resilient, and reliable.
Cloudflare is already operating MASQUE, HTTP/3, and QUIC reliably at scale. So we want you, our Zero Trust WARP users and Cloudflare One customers, to benefit from that same reliability and scale.
Employees need to be able to connect from anywhere that has an Internet connection. But that can be a challenge as many security engineers will configure firewalls and other networking devices to block all ports by default, and only open the most well-known and common ports. As we pointed out earlier, this can be frustrating for the roaming Zero Trust WARP user.
We want to fix that for our users, and remove that frustration. HTTP/3 and QUIC deliver the perfect solution. QUIC is carried on top of UDP (protocol number 17), while HTTP/3 uses port 443 for encrypted traffic. Both of these are well known, widely used, and are very unlikely to be blocked.
We want our Zero Trust WARP users to reliably connect wherever they might be.
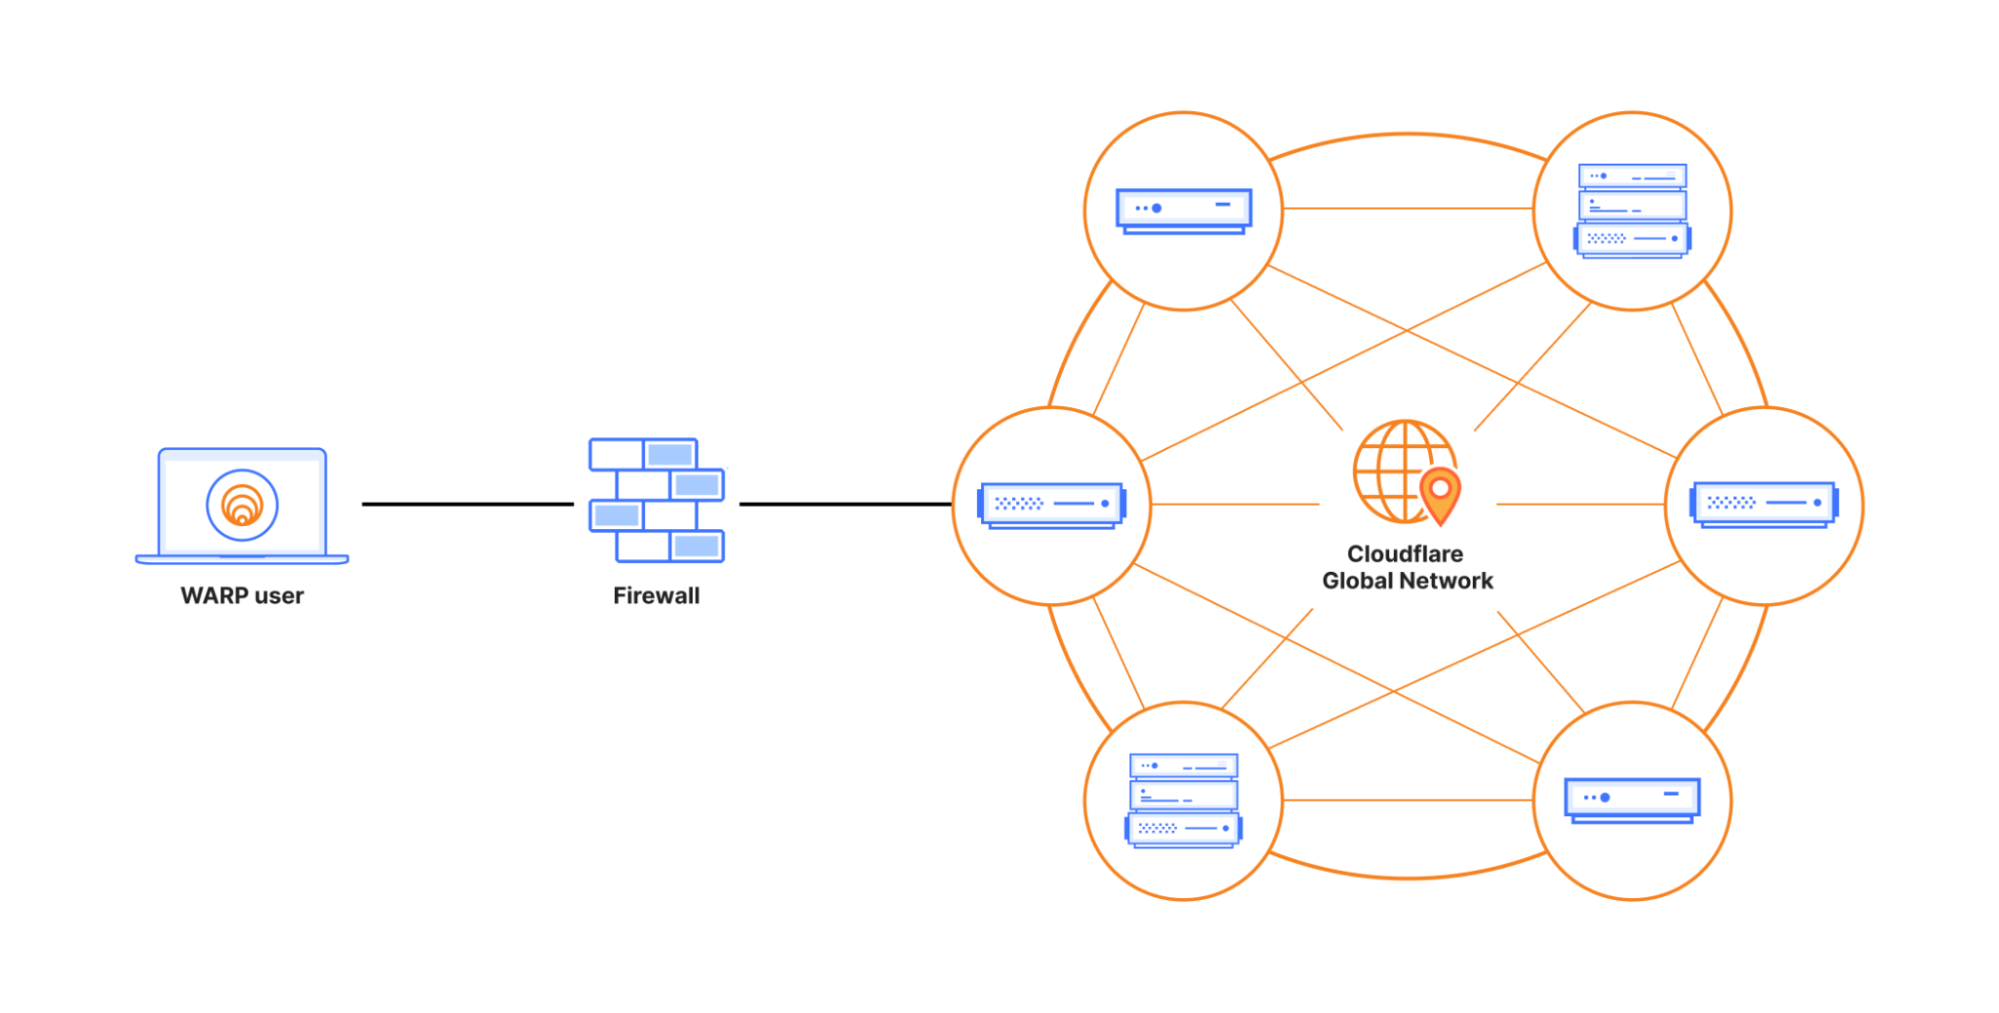
MASQUE leverages TLS 1.3 with QUIC, which provides a number of cipher suite choices. WireGuard also uses standard cipher suites. But some standards are more, let’s say, standard than others.
NIST, the National Institute of Standards and Technology and part of the US Department of Commerce, does a tremendous amount of work across the technology landscape. Of interest to us is the NIST research into network security that results in FIPS 140-2 and similar publications. NIST studies individual cipher suites and publishes lists of those they recommend for use, recommendations that become requirements for US Government entities. Many other customers, both government and commercial, use these same recommendations as requirements.
Our first MASQUE implementation for Zero Trust WARP will use TLS 1.3 and FIPS compliant cipher suites.

Cloudflare engineers are hard at work implementing MASQUE for the mobile apps, the desktop clients, and the Cloudflare network. Progress has been good, and we will open this up for beta testing early in the second quarter of 2024 for Cloudflare One customers. Your account team will be reaching out with participation details.
Cloudflare launched WARP five years ago, and we’ve come a long way since. This introduction of MASQUE to Zero Trust WARP is a big step, one that will immediately deliver the benefits noted above. But there will be more — we believe MASQUE opens up new opportunities to leverage the capabilities of QUIC and HTTP/3 to build innovative Zero Trust solutions. And we’re also continuing to work on other new capabilities for our Zero Trust customers.
Cloudflare is committed to continuing our mission to help build a better Internet, one that is more private and secure, scalable, reliable, and fast. And if you would like to join us in this exciting journey, check out our open positions.
Post Syndicated from Patrick Kennedy original https://www.servethehome.com/broadcom-fires-a-shot-at-astera-labs-and-more-with-new-pcie-and-cxl-retimers/
Broadcom has seen the success of Astera Labs in the PCIe retimer market and is launching CXL/ PCIe Gen5 and Gen6 retimers built on 5nm process
The post Broadcom Fires a Shot at Astera Labs with New PCIe and CXL Retimers appeared first on ServeTheHome.
Post Syndicated from jzb original https://lwn.net/Articles/964559/
Security updates have been issued by Debian (libapache2-mod-auth-openidc, libuv1, php-phpseclib, and phpseclib), Red Hat (buildah, cups, curl, device-mapper-multipath, emacs, fence-agents, frr, fwupd, gmp, gnutls, golang, haproxy, keylime, libfastjson, libmicrohttpd, linux-firmware, mysql, openssh, rear, skopeo, sqlite, squid, systemd, and tomcat), Slackware (mozilla), SUSE (kernel-firmware-nvidia-gspx-G06, nvidia-open- driver-G06-signed, postgresql-jdbc, python, python-cryptography, rubygem-rack, wpa_supplicant, and xmlgraphics-batik), and Ubuntu (c-ares, firefox, libde265, libgit2, and ruby-image-processing).