In the AWS Security Profile series, we interview Amazon Web Services (AWS) thought leaders who help keep our customers safe and secure. This interview features Jana Kay, Cloud Security Strategist. Jana shares her unique career journey, insights on the Security and Resiliency of the Cloud Tabletop Exercise (TTX) program, thoughts on the data protection and cloud security landscape, and more.
How long have you been at AWS and what do you do in your current role? I’ve been at AWS a little over four years. I started in 2018 as a Cloud Security Strategist, and in my opinion, I have one of the coolest jobs at AWS. I get to help customers think through how to use the cloud to address some of their most difficult security challenges, by looking at trends and emerging and evolving issues, and anticipating those that might still be on the horizon. I do this through various means, such as whitepapers, short videos, and tabletop exercises. I love working on a lot of different projects, which all have an impact on customers and give me the opportunity to learn new things myself all the time!
How did you get started in the security space? What about it piqued your interest? After college, I worked in the office of a United States senator, which led me to apply to the Harvard Kennedy School for a graduate degree in public policy. When I started graduate school, I wasn’t sure what my focus would be, but my first day of class was September 11, 2001, which obviously had a tremendous impact on me and my classmates. I first heard about the events of September 11 while I was in an international security policy class, taught by the late Dr. Ash Carter. My classmates and I came from a range of backgrounds, cultures, and professions, and Dr. Carter challenged us to think strategically and objectively—but compassionately—about what was unfolding in the world and our responsibility to effect change. That experience led me to pursue a career in security. I concentrated in international security and political economy, and after graduation, accepted a Presidential Management Fellowship in the Office of the Secretary of Defense at the Pentagon, where I worked for 16 years before coming to AWS.
What’s been the most dramatic change you’ve seen in the security industry? From the boardroom to builder teams, the understanding that security has to be integrated into all aspects of an organization’s ecosystem has been an important shift. Acceptance of security as foundational to the health of an organization has been evolving for a while, and a lot of organizations have more work to do, but overall there is prioritization of security within organizations.
What are your thoughts on the security of the cloud today? There are a lot of great technologies—such as AWS Data Protection services—that can help you with data protection, but it’s equally important to have the right processes in place and to create a strong culture of data protection. Although one of the biggest shifts I’ve seen in the industry is recognition of the importance of security, we still have a ways to go for people to understand that security and data protection is everyone’s job, not just the job of security experts. So when we talk about data protection and privacy issues, a lot of the conversation focuses on things like encryption, but the conversation shouldn’t end there because ultimately, security is only as good as the processes and people who implement it.
Do you have a favorite AWS Security service and why? I like anything that helps simplify my life, so AWS Control Tower is one of my favorites. It has so much functionality. Not only does AWS Control Tower help you set up multi-account AWS environments, you can use it to help identify which of your resources are compliant. The dashboard, which allows for visibility of provisioned accounts, controls enabled policy enforcement and can help you detect noncompliant resources.
What are you currently working on that you’re excited about? Currently, my focus is the Security and Resiliency of the Cloud Tabletop Exercise (TTX). It’s a 3-hour interactive event about incident response in which participants discuss how to prevent, detect, contain, and eradicate a simulated cyber incident. I’ve had the opportunity to conduct the TTX in South America, the Middle East, Europe, and the US, and it’s been so much fun meeting customers and hearing the discussions during the TTX and how much participants enjoy the experience. It scales well for groups of different sizes—and for a single customer or industry or for multiple customers or industries—and it’s been really interesting to see how the conversations change depending on the participants.
How does the Security and Resiliency of the Cloud Tabletop Exercise help security professionals hone their skills? One of the great things about the tabletop is that it involves interacting with other participants. So it’s an opportunity for security professionals and business leaders to learn from their peers, hear different perspectives, and understand all facets of the problem and potential solutions. Often our participants range from CISOs to policymakers to technical experts, who come to the exercise with different priorities for data protection and different ideas on how to solve the scenarios that we present. The TTX isn’t a technical exercise, but participants link their collective understanding of what capabilities are needed in a given scenario to what services are available to them and then finally how to implement those services. One of the things that I hope participants leave with is a better understanding of the AWS tools and services that are available to them.
How can customers learn more about the Security and Resiliency of the Cloud Tabletop Exercise? To learn more about the TTX, reach out to your account manager.
Is there something you wish customers would ask you about more often? I wish they’d ask more about what they should be doing to prepare for a cyber incident. It’s one thing to have an incident response plan; it’s another thing to be confident that it’s going to work if you ever need it. If you don’t practice the plan, how do you know that it’s effective, if it has gaps, or if everyone knows their role in an incident?
How about outside of work—any hobbies? I’m the mother of a teenager and tween, so between keeping up with their activities, I wish I had more time for hobbies! But someday soon, I’d like to get back to traveling more for leisure, reading for fun, and playing tennis.
If you have feedback about this post, submit comments in the Comments section below. If you have questions about this post, contact AWS Support.
Want more AWS Security news? Follow us on Twitter.
Organizations have chosen to build data lakes on top of Amazon Simple Storage Service (Amazon S3) for many years. A data lake is the most popular choice for organizations to store all their organizational data generated by different teams, across business domains, from all different formats, and even over history. According to a study, the average company is seeing the volume of their data growing at a rate that exceeds 50% per year, usually managing an average of 33 unique data sources for analysis.
Teams often try to replicate thousands of jobs from relational databases with the same extract, transform, and load (ETL) pattern. There is lot of effort in maintaining the job states and scheduling these individual jobs. This approach helps the teams add tables with few changes and also maintains the job status with minimum effort. This can lead to a huge improvement in the development timeline and tracking the jobs with ease.
In this post, we show you how to easily replicate all your relational data stores into a transactional data lake in an automated fashion with a single ETL job using Apache Iceberg and AWS Glue.
Solution architecture
Data lakes are usually organized using separate S3 buckets for three layers of data: the raw layer containing data in its original form, the stage layer containing intermediate processed data optimized for consumption, and the analytics layer containing aggregated data for specific use cases. In the raw layer, tables usually are organized based on their data sources, whereas tables in the stage layer are organized based on the business domains they belong to.
This post provides an AWS CloudFormation template that deploys an AWS Glue job that reads an Amazon S3 path for one data source of the data lake raw layer, and ingests the data into Apache Iceberg tables on the stage layer using AWS Glue support for data lake frameworks. The job expects tables in the raw layer to be structured in the way AWS Database Migration Service (AWS DMS) ingests them: schema, then table, then data files.
This solution uses AWS Systems Manager Parameter Store for table configuration. You should modify this parameter specifying the tables you want to process and how, including information such as primary key, partitions, and the business domain associated. The job uses this information to automatically create a database (if it doesn’t already exist) for every business domain, create the Iceberg tables, and perform the data loading.
Finally, we can use Amazon Athena to query the data in the Iceberg tables.
The following diagram illustrates this architecture.
This implementation has the following considerations:
All tables from the data source must have a primary key to be replicated using this solution. The primary key can be a single column or a composite key with more than one column.
If the data lake contains tables that don’t need upserts or don’t have a primary key, you can exclude them from the parameter configuration and implement traditional ETL processes to ingest them into the data lake. That’s outside of the scope of this post.
If there are additional data sources that need to be ingested, you can deploy multiple CloudFormation stacks, one to handle each data source.
The AWS Glue job is designed to process data in two phases: the initial load that runs after AWS DMS finishes the full load task, and the incremental load that runs on a schedule that applies change data capture (CDC) files captured by AWS DMS. Incremental processing is performed using an AWS Glue job bookmark.
There are nine steps to complete this tutorial:
Set up a source endpoint for AWS DMS.
Deploy the solution using AWS CloudFormation.
Review the AWS DMS replication task.
Optionally, add permissions for encryption and decryption or AWS Lake Formation.
Review the table configuration on Parameter Store.
Before we create our AWS DMS task, we need to set up a source endpoint to connect to the source database:
On the AWS DMS console, choose Endpoints in the navigation pane.
Choose Create endpoint.
If your database is running on Amazon RDS, choose Select RDS DB instance, then choose the instance from the list. Otherwise, choose the source engine and provide the connection information either through AWS Secrets Manager or manually.
For Endpoint identifier, enter a name for the endpoint; for example, source-postgresql.
Choose Create endpoint.
Deploy the solution using AWS CloudFormation
Create a CloudFormation stack using the provided template. Complete the following steps:
Choose Launch Stack:
Choose Next.
Provide a stack name, such as transactionaldl-postgresql.
Enter the required parameters:
DMSS3EndpointIAMRoleARN – The IAM role ARN for AWS DMS to write data into Amazon S3.
ReplicationInstanceArn – The AWS DMS replication instance ARN.
S3BucketStage – The name of the existing bucket used for the stage layer of the data lake.
S3BucketGlue – The name of the existing S3 bucket for storing AWS Glue scripts.
S3BucketRaw – The name of the existing bucket used for the raw layer of the data lake.
SourceEndpointArn – The AWS DMS endpoint ARN that you created earlier.
SourceName – The arbitrary identifier of the data source to replicate (for example, postgres). This is used to define the S3 path of the data lake (raw layer) where data will be stored.
Do not modify the following parameters:
SourceS3BucketBlog – The bucket name where the provided AWS Glue script is stored.
SourceS3BucketPrefix – The bucket prefix name where the provided AWS Glue script is stored.
Choose Next twice.
Select I acknowledge that AWS CloudFormation might create IAM resources with custom names.
Choose Create stack.
After approximately 5 minutes, the CloudFormation stack is deployed.
Review the AWS DMS replication task
The AWS CloudFormation deployment created an AWS DMS target endpoint for you. Because of two specific endpoint settings, the data will be ingested as we need it on Amazon S3.
On the AWS DMS console, choose Endpoints in the navigation pane.
Search for and choose the endpoint that begins with dmsIcebergs3endpoint.
Review the endpoint settings:
DataFormat is specified as parquet.
TimestampColumnName will add the column last_update_time with the date of creation of the records on Amazon S3.
The deployment also creates an AWS DMS replication task that begins with dmsicebergtask.
Choose Replication tasks in the navigation pane and search for the task.
You will see that the Task Type is marked as Full load, ongoing replication. AWS DMS will perform an initial full load of existing data, and then create incremental files with changes performed to the source database.
On the Mapping Rules tab, there are two types of rules:
A selection rule with the name of the source schema and tables that will be ingested from the source database. By default, it uses the sample database provided in the prerequisites, dms_sample, and all tables with the keyword %.
Two transformation rules that include in the target files on Amazon S3 the schema name and table name as columns. This is used by our AWS Glue job to know to which tables the files in the data lake correspond.
Let’s change some configurations to finish our task preparation.
On the Actions menu, choose Modify.
In the Task Settings section, under Stop task after full load completes, choose Stop after applying cached changes.
This way, we can control the initial load and incremental file generation as two different steps. We use this two-step approach to run the AWS Glue job once per each step.
Under Task logs, choose Turn on CloudWatch logs.
Choose Save.
Wait about 1 minute for the database migration task status to show as Ready.
Add permissions for encryption and decryption or Lake Formation
Optionally, you can add permissions for encryption and decryption or Lake Formation.
Add encryption and decryption permissions
If your S3 buckets used for the raw and stage layers are encrypted using AWS Key Management Service (AWS KMS) customer managed keys, you need to add permissions to allow the AWS Glue job to access the data:
For AWS KMS with key policies, refer to Allow key users to use the KMS key to understand how to modify the KMS policy to allow the IAM role GlueJobRole to use it
Add Lake Formation permissions
If you’re managing permissions using Lake Formation, you need to allow your AWS Glue job to create your domain’s databases and tables through the IAM role GlueJobRole.
Grant permissions to create databases (for instructions, refer to Creating a Database).
After you complete the later step of performing the initial data load, make sure to also add permissions for consumers to query the tables. The job role will become the owner of all the tables created, and the data lake admin can then perform grants to additional users.
Review table configuration in Parameter Store
The AWS Glue job that performs the data ingestion into Iceberg tables uses the table specification provided in Parameter Store. Complete the following steps to review the parameter store that was configured automatically for you. If needed, modify according to your own needs.
On the Parameter Store console, choose My parameters in the navigation pane.
The CloudFormation stack created two parameters:
iceberg-config for job configurations
iceberg-tables for table configuration
Choose the parameter iceberg-tables.
The JSON structure contains information that AWS Glue uses to read data and write the Iceberg tables on the target domain:
One object per table – The name of the object is created using the schema name, a period, and the table name; for example, schema.table.
primaryKey – This should be specified for every source table. You can provide a single column or a comma-separated list of columns (without spaces).
partitionCols – This optionally partitions columns for target tables. If you don’t want to create partitioned tables, provide an empty string. Otherwise, provide a single column or a comma-separated list of columns to be used (without spaces).
If you want to use your own data source, use the following JSON code and replace the text in CAPS from the template provided. If you’re using the sample data source provided, keep the default settings:
Now that the required configuration is finished, we ingest the initial data. This step includes three parts: ingesting the data from the source relational database into the raw layer of the data lake, creating the Iceberg tables on the stage layer of the data lake, and verifying results using Athena.
Ingest data into the raw layer of the data lake
To ingest data from the relational data source (PostgreSQL if you are using the sample provided) to our transactional data lake using Iceberg, complete the following steps:
On the AWS DMS console, choose Database migration tasks in the navigation pane.
Select the replication task you created and on the Actions menu, choose Restart/Resume.
Wait about 5 minutes for the replication task to complete. You can monitor the tables ingested on the Statistics tab of the replication task.
After some minutes, the task finishes with the message Full load complete.
On the Amazon S3 console, choose the bucket you defined as the raw layer.
Under the S3 prefix defined on AWS DMS (for example, postgres), you should see a hierarchy of folders with the following structure:
Before running the job, let’s navigate the script of the AWS Glue job provided as part of the CloudFormation stack to understand its behavior.
On the AWS Glue Studio console, choose Jobs in the navigation pane.
Search for the job that starts with IcebergJob- and a suffix of your CloudFormation stack name (for example, IcebergJob-transactionaldl-postgresql).
Choose the job.
The job script gets the configuration it needs from Parameter Store. The function getConfigFromSSM() returns job-related configurations such as source and target buckets from where the data needs to be read and written. The variable ssmparam_table_values contain table-related information like the data domain, table name, partition columns, and primary key of the tables that needs to be ingested. See the following Python code:
The script uses an arbitrary catalog name for Iceberg that is defined as my_catalog. This is implemented on the AWS Glue Data Catalog using Spark configurations, so a SQL operation pointing to my_catalog will be applied on the Data Catalog. See the following code:
The script iterates over the tables defined in Parameter Store and performs the logic for detecting if the table exists and if the incoming data is an initial load or an upsert:
# Iteration over tables stored on Parameter Store
for key in ssm_param_table_values:
    # Get table data
    isTableExists = False
    schemaName, tableName = key.split('.')
    logger.info(f'Processing table : {tableName}')
The initialLoadRecordsSparkSQL() function loads initial data when no operation column is present in the S3 files. AWS DMS adds this column only to Parquet data files produced by the continuous replication (CDC). The data loading is performed using the INSERT INTO command with SparkSQL. See the following code:
Now we run the AWS Glue job to ingest the initial data into the Iceberg tables. The CloudFormation stack adds the --datalake-formats parameter, adding the required Iceberg libraries to the job.
Choose Run job.
Choose Job Runs to monitor the status. Wait until the status is Run Succeeded.
Verify the data loaded
To confirm that the job processed the data as expected, complete the following steps:
On the Athena console, choose Query Editor in the navigation pane.
Verify AwsDataCatalog is selected as the data source.
Under Database, choose the data domain that you want to explore, based on the configuration you defined in the parameter store. If using the sample database provided, use sports.
Under Tables and views, we can see the list of tables that were created by the AWS Glue job.
Choose the options menu (three dots) next to the first table name, then choose Preview Data.
You can see the data loaded into Iceberg tables.
Perform incremental data loading
Now we start capturing changes from our relational database and applying them to the transactional data lake. This step is also divided in three parts: capturing the changes, applying them to the Iceberg tables, and verifying the results.
Capture changes from the relational database
Due to the configuration we specified, the replication task stopped after running the full load phase. Now we restart the task to add incremental files with changes into the raw layer of the data lake.
On the AWS DMS console, select the task we created and ran before.
On the Actions menu, choose Resume.
Choose Start task to start capturing changes.
To trigger new file creation on the data lake, perform inserts, updates, or deletes on the tables of your source database using your preferred database administration tool. If using the sample database provided, you could run the following SQL commands:
UPDATE dms_sample.nfl_stadium_data_upd
SET seatin_capacity=93703
WHERE team = 'Los Angeles Rams' and sport_location_id = '31';

update  dms_sample.mlb_data
set bats = 'R'
where mlb_id=506560 and bats='L';

update dms_sample.sporting_event
set start_date  = current_date
where id=11 and sold_out=0;
On the AWS DMS task details page, choose the Table statistics tab to see the changes captured.
Open the raw layer of the data lake to find a new file holding the incremental changes inside every table’s prefix, for example under the sporting_event prefix.
The record with changes for the sporting_event table looks like the following screenshot.
Notice the Op column in the beginning identified with an update (U). Also, the second date/time value is the control column added by AWS DMS with the time the change was captured.
Apply changes on the Iceberg tables using AWS Glue
Now we run the AWS Glue job again, and it will automatically process only the new incremental files since the job bookmark is enabled. Let’s review how it works.
The dedupCDCRecords() function performs deduplication of data because multiple changes to a single record ID could be captured within the same data file on Amazon S3. Deduplication is performed based on the last_update_time column added by AWS DMS that indicates the timestamp of when the change was captured. See the following Python code:
On line 99, the upsertRecordsSparkSQL() function performs the upsert in a similar fashion to the initial load, but this time with a SQL MERGE command.
Review the applied changes
Open the Athena console and run a query that selects the changed records on the source database. If using the provided sample database, use one the following SQL queries:
SELECT * FROM "sports"."nfl_stadiu_data_upd"
WHERE team = 'Los Angeles Rams' and sport_location_id = 31
LIMIT 1;
Monitor table ingestion
The AWS Glue job script is coded with simple Python exception handling to catch errors during processing a specific table. The job bookmark is saved after each table finishes processing successfully, to avoid reprocessing tables if the job run is retried for the tables with errors.
The AWS Command Line Interface (AWS CLI) provides a get-job-bookmark command for AWS Glue that provides insight into the status of the bookmark for each table processed.
On the AWS Glue Studio console, choose the ETL job.
Choose the Job Runs tab and copy the job run ID.
Run the following command on a terminal authenticated for the AWS CLI, replacing <GLUE_JOB_RUN_ID> on line 1 with the value you copied. If your CloudFormation stack is not named transactionaldl-postgresql, provide the name of your job on line 2 of the script:
In this solution, when a table processing causes an exception, the AWS Glue job will not fail according to this logic. Instead, the table will be added into an array that is printed after the job is complete. In such scenario, the job will be marked as failed after it tries to process the rest of the tables detected on the raw data source. This way, tables without errors don’t have to wait until the user identifies and solves the problem on the conflicting tables. The user can quickly detect job runs that had issues using the AWS Glue job run status, and identify which specific tables are causing the problem using the CloudWatch logs for the job run.
The job script implements this feature with the following Python code:
# Performed for every table
        try:
            # Table processing logic
        except Exception as e:
            logger.info(f'There is an issue with table: {tableName}')
            logger.info(f'The exception is : {e}')
            errored_table_list.append(tableName)
            continue
        job.commit()
if (len(errored_table_list)):
    logger.info('Total number of errored tables are ',len(errored_table_list))
    logger.info('Tables that failed during processing are ', *errored_table_list, sep=', ')
    raise Exception(f'***** Some tables failed to process.')
The following screenshot shows how the CloudWatch logs look for tables that cause errors on processing.
The CloudFormation stack deploys an Amazon EventBridge rule (disabled by default) that can trigger the AWS Glue job to run on a schedule. To provide your own schedule and enable the rule, complete the following steps:
On the EventBridge console, choose Rules in the navigation pane.
Search for the rule prefixed with the name of your CloudFormation stack followed by JobTrigger (for example, transactionaldl-postgresql-JobTrigger-randomvalue).
Choose the rule.
Under Event Schedule, choose Edit.
The default schedule is configured to trigger every hour.
When you finish setting up the cron expression, choose Next three times, and finally choose Update Rule to save changes.
The rule is created disabled by default to allow you to run the initial data load first.
Activate the rule by choosing Enable.
You can use the Monitoring tab to view rule invocations, or directly on the AWS Glue Job Run details.
Conclusion
After deploying this solution, you have automated the ingestion of your tables on a single relational data source. Organizations using a data lake as their central data platform usually need to handle multiple, sometimes even tens of data sources. Also, more and more use cases require organizations to implement transactional capabilities to the data lake. You can use this solution to accelerate the adoption of such capabilities across all your relational data sources to enable new business use cases, automating the implementation process to derive more value from your data.
About the Authors
Luis Gerardo Baeza is a Big Data Architect in the Amazon Web Services (AWS) Data Lab. He has 12 years of experience helping organizations in the healthcare, financial and education sectors to adopt enterprise architecture programs, cloud computing, and data analytics capabilities. Luis currently helps organizations across Latin America to accelerate strategic data initiatives.
SaiKiran Reddy Aenugu is a Data Architect in the Amazon Web Services (AWS) Data Lab. He has 10 years of experience implementing data loading, transformation, and visualization processes. SaiKiran currently helps organizations in North America to adopt modern data architectures such as data lakes and data mesh. He has experience in the retail, airline, and finance sectors.
Narendra Merla is a Data Architect in the Amazon Web Services (AWS) Data Lab. He has 12 years of experience in designing and productionalizing both real-time and batch-oriented data pipelines and building data lakes on both cloud and on-premises environments. Narendra currently helps organizations in North America to build and design robust data architectures, and has experience in the telecom and finance sectors.
Many people, when they are installing a Linux distribution for a single
purpose such as
running containers, would prefer an install-and-forget
type of deployment. At FOSDEM 2023 in Brussels, several
projects of this minimal Linux distribution type were presented. Fedora
CoreOS, Ubuntu Core, openSUSE MicroOS, and Bottlerocket OS
all tackle this problem in their own way. The talks at FOSDEM gave an
interesting overview of how these projects differ in their approaches.
The 6.1.12 and 5.15.94
stable kernel updates have been released, each with the usual set of
important fixes. There is also a 5.10.168 release in the works, but it ran
into some snags in the
review process; it can be expected shortly.
The Value Flywheel Effect: Power the Future and Accelerate Your Organization to the Modern Cloud by David Anderson with Mark McCann and Michael O’Reilly
With this post, I’d like to share a new book that got my attention. It’s a book at the intersection of business, technology, and people. This is a great read for anyone who wants to understand how organizations can evolve to maximize the business impact of new technologies and speed up their internal processes.
Last year at re:Invent, I had the opportunity to meet David Anderson. As Director of Technology at Liberty Mutual, he drove the technology change when the global insurance company, founded in 1912, moved its services to the cloud and adopted a serverless-first strategy. He created an environment where experimentation was normal, and software engineers had time and space to learn. This worked so well that, at some point, he had four AWS Heroes in his extended team.
A few months before, I heard that David was writing a book with Mark McCann and Michael O’Reilly. They all worked together at Liberty Mutual, and they were distilling their learnings to help other organizations implement a similar approach. The book was just out when we met, and I was curious to learn more, starting from the title. We met in the expo area, and David was kind enough to give me a signed copy of the book.
The book is published by IT Revolution, the same publisher behind some of my favorite books such as The Phoenix Project, Team Topologies, and Accelerate. The book is titled The Value Flywheel Effect because when you connect business and technology in an organization, you start to turn a flywheel that builds momentum with each small win.
The Value Flywhell The four phases of the Value Flywheel are:
Clarity of Purpose – This is the part where you look at what is really important for your organization, what makes your company different, and define your North Star and how to measure your distance from it. In this phase, you look at the company through the eyes of the CEO.
Challenge & Landscape – Here you prepare the organization and set up the environment for the teams. We often forget the social aspect of technical teams and great focus is given here on how to set up the right level of psychological safety for teams to operate. This phase is for engineers.
Next Best Action – In this phase, you think like a product leader and plan the next steps with a focus on how to improve the developer experience. One of the key aspects is that “code is a liability” and the less code you write to solve a business problem, the better it is for speed and maintenance. For example, you can avoid some custom implementations and offload their requirements to capabilities offered by cloud providers.
Long-Term Value – This is the CTO perspective, looking at how to set up a problem-preventing culture with well-architected systems and a focus on observability and sustainability. Sustainability here is not just considering the global environment but also the teams and the people working for the organization.
As you would expect from a flywheel, you should iterate on these four phases so that every new spin gets easier and faster.
Wardley Mapping One thing that I really appreciate from the book is how it made it easy for me to use Wardley mapping (usually applied to a business context) in a technical scenario. Wardley maps, invented by Simon Wardley, provide a visual representation of the landscape in which a business operates.
Each map consists of a value chain, where you draw the components that your customers need. The components are connected to show how they depend on each other. The position of the components is based on how visible they are to customers (vertical) and their evolution status from genesis to being a product or a commodity (horizontal). Over time, some components evolve from being custom-built to becoming a product or being commoditized. This displays on the map with a natural movement to the right as things evolve. For example, data centers were custom-built in the past, but then they became a standard product, and cloud computing made them available as a commodity.
With mapping, you can more easily understand what improvements you need and what gaps you have in your technical solution. In this way, engineers can identify which components they should focus on to maximize their impact and what parts are not strategic and can be offloaded to a SaaS solution. It’s a sort of evolutionary architecture where mapping gives a way to look ahead at how the system should evolve over time and where inertia can slow down the evolution of part of the system.
Sometimes it seems the same best practices apply everywhere but this is not true. An advantage of mapping is that it helps identify the best team and methodology to use based on a component evolution status as described by its horizontal position on a map. For example, an “explorer” attitude is best suited for components in their genesis or being custom built, a “villager” works best on products, and when something becomes a commodity you need a “town planner.”
More Tools and Less Code The authors look at many available tools and frameworks. For example, the book introduces the North Star Framework, a way to manage products by first identifying their most important metric (the North Star), and Gojko Adzic‘s Impact Mapping, a collaborative planning technique that focuses on leading indicators to help teams make a big impact with their software products. By the way, Gojko is also an AWS Serverless Hero.
Another interesting point is how to provide engineers with the necessary time and space to learn. I specifically like how internal events are called out and compared to public conferences. In internal events, engineers have a chance to use a new technology within their company environment, making it easier to demonstrate what can be done with all the limits of an actual scenario.
Finally, I’d like to highlight this part that clearly defines what the book intends by the statements, “code is a liability”:
“When you ask a software team to build something, they deliver a system, not lines of code. The asset is not the code; the asset is the system. The less code in the system, the less overhead you have bought. Some developers may brag about how much code they’ve written, but this isn’t something to brag about.”
This is not a programming book, and serverless technologies are used as examples of how you can speed up the flywheel. If you are looking for a technical deep dive on serverless technologies, you can find more on Serverless Land, a site that brings together the latest information and learning resources for serverless computing, or have a look at the Serverless Architectures on AWS book.
Now that every business is a technology business, The Value Flywheel Effect is about how to accelerate and transform an organization. It helps set the right environment, purpose, and stage to modernize your applications as you adopt cloud computing and get the benefit of it.
You can meet David, Mark, and Michael at the Serverless Edge, where a team of engineers, tech enthusiasts, marketers, and thought leaders obsessed with technology help learn and communicate how serverless can transform a business model.
This post is written by Yashlin Naidoo, Cloud Support Engineer.
Amazon Simple Notification Service (Amazon SNS) enables you to send notifications directly to a mobile push endpoint. For iOS apps, Amazon SNS dispatches the notification on your application’s behalf to the Apple Push Notification service (APNs).
Amazon SNS supports two methods for authenticating with iOS mobile push endpoints when sending a mobile push notification via the APNs:
Certificate-based authentication
Token-based authentication
To use certificate-based authentication, you must configure Amazon SNS with a provider certificate. Amazon SNS will use this certificate on your behalf to establish a secure connection with the APNs to dispatch your mobile push notifications. For each application that you support, you will need to provide unique certificates.
As the number of applications you manage grows, you will also need to create and manage an increasing number of certificates. Furthermore, certificates expire yearly, and you must renew them to ensure that Amazon SNS can continue to send mobile push notifications on your behalf. To learn more about how to use certificate-based authentication, see Certificate-based authentication for iOS applications with Amazon SNS on the AWS Compute Blog.
There are several benefits in using token-based authentication:
You can use a single token that is shared among all of your applications.
You can remove the need for yearly certificate renewal for certificate-based authentication.
You can improve the security of your application by using token-based requests. For these requests, your credentials are never transferred from Amazon SNS to your mobile push notification provider, making the communication less likely to be compromised.
Token-based authentication is the latest authentication method provided by the APNs that improves security for your applications, requires less management effort, and is more efficient. We recommend migrating as soon as possible to ensure the security and ease of operations of your applications.
This blog post provides step-by-step instructions for migrating your iOS application from certificate-based authentication to token-based authentication with Amazon SNS. You will learn how to create a new token using your Apple developer account. Next, you will migrate your platform application to token-based authentication. Finally, you will test your application by sending a test push notification via Amazon SNS to a device to confirm the successful migration.
Before proceeding with this migration, we recommend to stop sending push notifications to your applications until the migration is complete to avoid any disruptions in your message delivery workloads.
Walkthrough
You can also create a test platform application with token-based authentication to ensure that the Amazon SNS platform application is created successfully. Finally, you can create a device token and send a test push notification to it. Once confirmed that the application works correctly, you can migrate your main platform application to token-based authentication.
Under Register a New Key, for Key Name, type the token key name and tick the box for Apple Push Notifications service (APNs) for the key services.
Select Continue.
In the Register a New Key section, check that all values were entered correctly.
Select Register to register the new token key.
Download your token key. Store it in a safe location, as you can’t download the token key again.
Migrating your platform application from certificate-based authentication to token-based authentication
Navigate to the Amazon SNS console. Expand the Mobile menu and choose Push Notification.
Choose your platform application.
Choose Edit. Under Apple credentials section choose Token:
Under Token, select Choose file to upload the .p8 token key file.
Provide values for signing key ID, team ID and bundle ID. These values can be found in your Apple Developer account. Ensure that your bundle ID is identical to the ID used for this application with certificate-based authentication.
Event notifications – optional: refer to the following guide for enabling event notifications: Mobile app events
Choose Save changes. This changes your platform application to token-based authentication.
Testing push notification delivery to your device
In this section, you will test sending a push notification to your device using the Amazon SNS console and the AWS Command Line Interface (AWS CLI).
Amazon SNS console
From the Amazon SNS console, navigate to your platform endpoint and choose Publish message.
For message body, select Custom payload for each delivery protocol to send to the endpoint. This example uses a custom payload that allows you to provide additional APNs headers:
Choose Publish message.
The push notification is delivered to your device:
The push notification is delivered to your device:
Troubleshooting
You might encounter various errors when migrating to token-based authentication. This section explains how to troubleshoot these errors.
If a message is not delivered after publishing it to your platform application endpoint, refer to the Amazon CloudWatch failed logs of your platform application. These logs are named sns/your-aws-region/your-accountID/app/platform_name/application_name/Failure.
Once you have navigated to your platform application’s CloudWatch failed log group, click on one of the log streams based on the time that you published the message. Focus on the following attributes:
statusCode: error messages are grouped according to the status code.
status : shows whether a message was delivered successfully to the provider or if it failed to deliver.
providerResponse: provides the response message from the provider and is only shown in case a message failed to deliver.
We will look through messages that failed to deliver because of the following errors:
The cause of this error can be an incorrect token key ID, team ID or if the token is invalid.
To resolve this issue, go to your Apple Developer account and ensure that you are providing the correct token ID, team ID and that your token key exists.
The cause of this error can be an incorrect bundle ID or a device token that was created with the wrong bundle ID.
To resolve this issue, go to your Apple Developer account and navigate to your existing certificate used when migrating to token-based authentication. Confirm the bundle ID assigned to this certificate and ensure you are using the same ID for your platform application and also for your device tokens.
Conclusion
Developers can send mobile push notifications for the APNs using token-based authentication by using a .p8 key to authenticate an Apple device endpoint. This is the recommended authentication method due to improved security and lower management effort by removing the need for annual certificate renewal and by being able to share tokens among multiple applications.
To learn more about APNs token-based authentication with Amazon SNS, visit the Amazon SNS Developer Guide.
For more serverless learning resources, visit Serverless Land.
Industrial Control System (ICS) networking stacks are often the go-to bogeyman for infosec and cybersecurity professionals, and doubly so for offensive, red-team style security folks. How often have you been new on site, all ready to run a bog-standard nmap scan across the internal address space, only to be stopped by a frantic senior manager, “No, you can’t scan 192.168.69.0/24, that’s where the factory floor operates!”
“Why not?” you might ask—after all, isn’t it important to scan your IP-connected assets regularly to make sure they’re all accounted for and patched? Isn’t that kind of the one thing we tell literally anyone who asks, right after making sure your passwords are nice and long and random?
“Oh no,” this manager might plead, “if you scan them, they fall over, and it kills production. Minutes of downtime costs millions!”
Well, I’m happy to report that today, Rapid7’s Andreas Galauner has produced a technical deep dive whitepaper into the mysterious and opaque world of PLC protocols, and specifically, how you, intrepid IT explorer, can safely and securely scan around your CODESYS-based ICS footprint.
CODESYS is a protocol suite that runs a whole lot of industrial equipment. Sometimes it’s labeled clearly as such, and sometimes it’s not mentioned at all in the docs. While it is IP-based, it also uses some funky features of UDP multicast, which is one reason why scanning (or worse, fuzzing) these things blindly can cause a lot of trouble in the equipment that depends on it.
No spoilers, but if you’re the sort who always wondered why, exactly, flinging packets at the ICS network can lead to heartache and lost productivity, this is the paper for you. This goes double if you’re already a bit of a networking nerd.
If you’re not sure, here’s an easy test. Go and read this Errata Security blog about the infamous Hacker Jeopardy telnet question real quick. If you have any emotional response at all (hilarity, enlightenment, outrage, or a mix of all three), you’re definitely in the audience for this paper.
Best of all, this paper comes with some tooling; Andy has graciously open sourced a Wireshark plugin for CODESYS analysis, and an Nmap NSE script for safer scanning. You can grab those, right now, at our GitHub repo. Cower in the dark about ICS networks no more!
Security updates have been issued by Debian (imagemagick), Fedora (xml-security-c), Red Hat (grub2), SUSE (chromium, freerdp, libbpf, and python-setuptools), and Ubuntu (fig2dev and python-django).
What will it take for policy makers to take cybersecurity seriously? Not minimal-change seriously. Not here-and-there seriously. But really seriously. What will it take for policy makers to take cybersecurity seriously enough to enact substantive legislative changes that would address the problems? It’s not enough for the average person to be afraid of cyberattacks. They need to know that there are engineering fixes—and that’s something we can provide.
For decades, I have been waiting for the “big enough” incident that would finally do it. In 2015, Chinese military hackers hacked the Office of Personal Management and made off with the highly personal information of about 22 million Americans who had security clearances. In 2016, the Mirai botnet leveraged millions of Internet-of-Things devices with default admin passwords to launch a denial-of-service attack that disabled major Internet platforms and services in both North America and Europe. In 2017, hackers—years later we learned that it was the Chinese military—hacked the credit bureau Equifax and stole the personal information of 147 million Americans. In recent years, ransomware attacks have knocked hospitals offline, and many articles have been written about Russia inside the U.S. power grid. And last year, the Russian SVR hacked thousands of sensitive networks inside civilian critical infrastructure worldwide in what we’re now calling Sunburst (and used to call SolarWinds).
Those are all major incidents to security people, but think about them from the perspective of the average person. Even the most spectacular failures don’t affect 99.9% of the country. Why should anyone care if the Chinese have his or her credit records? Or if the Russians are stealing data from some government network? Few of us have been directly affected by ransomware, and a temporary Internet outage is just temporary.
Cybersecurity has never been a campaign issue. It isn’t a topic that shows up in political debates. (There was one question in a 2016 Clinton–Trump debate, but the response was predictably unsubstantive.) This just isn’t an issue that most people prioritize, or even have an opinion on.
So, what will it take? Many of my colleagues believe that it will have to be something with extreme emotional intensity—sensational, vivid, salient—that results in large-scale loss of life or property damage. A successful attack that actually poisons a water supply, as someone tried to do in January by raising the levels of lye at a Florida water-treatment plant. (That one was caught early.) Or an attack that disables Internet-connected cars at speed, something that was demonstrated by researchers in 2014. Or an attack on the power grid, similar to what Russia did to the Ukraine in 2015 and 2016. Will it take gas tanks exploding and planes falling out of the sky for the average person to read about the casualties and think “that could have been me”?
Here’s the real problem. For the average nonexpert—and in this category I include every lawmaker—to push for change, they not only need to believe that the present situation is intolerable, they also need to believe that an alternative is possible. Real legislative change requires a belief that the never-ending stream of hacks and attacks is not inevitable, that we can do better. And that will require creating working examples of secure, dependable, resilient systems.
Providing alternatives is how engineers help facilitate social change. We could never have eliminated sales of tungsten-filament household light bulbs if fluorescent and LED replacements hadn’t become available. Reducing the use of fossil fuel for electricity generation requires working wind turbines and cost-effective solar cells.
We need to demonstrate that it’s possible to build systems that can defend themselves against hackers, criminals, and national intelligence agencies; secure Internet-of-Things systems; and systems that can reestablish security after a breach. We need to prove that hacks aren’t inevitable, and that our vulnerability is a choice. Only then can someone decide to choose differently. When people die in a cyberattack and everyone asks “What can be done?” we need to have something to tell them.
We don’t yet have the technology to build a truly safe, secure, and resilient Internet and the computers that connect to it. Yes, we have lots of security technologies. We have older secure systems—anyone still remember Apollo’s DomainOS and MULTICS?—that lost out in a market that didn’t reward security. We have newer research ideas and products that aren’t successful because the market still doesn’t reward security. We have even newer research ideas that won’t be deployed, again, because the market still prefers convenience over security.
What I am proposing is something more holistic, an engineering research task on a par with the Internet itself. The Internet was designed and built to answer this question: Can we build a reliable network out of unreliable parts in an unreliable world? It turned out the answer was yes, and the Internet was the result. I am asking a similar research question: Can we build a secure network out of insecure parts in an insecure world? The answer isn’t obviously yes, but it isn’t obviously no, either.
While any successful demonstration will include many of the security technologies we know and wish would see wider use, it’s much more than that. Creating a secure Internet ecosystem goes beyond old-school engineering to encompass the social sciences. It will include significant economic, institutional, and psychological considerations that just weren’t present in the first few decades of Internet research.
Cybersecurity isn’t going to get better until the economic incentives change, and that’s not going to change until the political incentives change. The political incentives won’t change until there is political liability that comes from voter demands. Those demands aren’t going to be solely the results of insecurity. They will also be the result of believing that there’s a better alternative. It is our task to research, design, build, test, and field that better alternative—even though the market couldn’t care less right now.
This essay originally appeared in the May/June 2021 issue of IEEE Security & Privacy. I forgot to publish it here.
Computing combines a very broad mixture of concepts and skills. We work to support any school to teach students about the whole of computing and how to create with digital technologies. A key part of this support is The Computing Curriculum.
We help schools around the world teach their learners computing.
The Computing Curriculum: Free and comprehensive
The Computing Curriculum is our complete bank of free lesson plans and other resources that offer you everything you need to teach computing lessons to all school-aged learners. It helps you cover the full breadth of computing, including computing systems, programming, creating media, data and information, and societal impacts of digital technology.
The 500 hours of free, downloadable resources within The Computing Curriculum include all the materials you need in your classroom: from lesson plans and slide decks to activity sheets, homework, and assessments. To our knowledge, this is the most comprehensive set of free teaching and learning materials for computing and digital skills in the world.
We continuously update The Computing Curriculum to reflect the latest research about this young subject.
Our Curriculum’s resources are based on clear progression and content frameworks we’ve designed, and we continuously update them based on the latest research and feedback from practising teachers. Doing this is particularly important for computing education resources, because computing is a young subject where thoughts and understanding about the best teaching approaches are still evolving.
Computing lesson plans that save time and engage your learners
With The Computing Curriculum, we support educators of all levels of experience. Whether you specialise in computing, or you are a newcomer to the subject, the Curriculum will save you time and help you deliver engaging lessons.
In our 2022 survey of teachers who have used The Computing Curriculum resources:
91% said the Curriculum was effective or very effective at saving teachers time
89% said it was effective or very effective at developing teachers’ subject knowledge
81% said it was effective or very effective at engaging students
The resources are organised as themed units, and they support your computing lesson planning, preparation, and delivery because they are comprehensive as well as adaptable. You are free to use the resources as they are, or adjust them to your context, access to hardware, and learners’ needs and experience level.
The Computing Curriculum will help you plan and deliver engaging lessons.
One aspect of The Computing Curriculum that will facilitate your teaching is the progression framework on which the resources are based. In creating the resources, we have considered the learning objectives throughout each unit and year group, and throughout the entire schooling period. This progression is detailed in curriculum maps and learning graphs, and you’ll be able to use these documents to plan your lessons and to check your learners’ understanding.
Start teaching with The Computing Curriculum
You can download and use the resources for the year groups you teach computing right now. And please tell us of your experiences using The Computing Curriculum in your classroom, so that we can make the resources even better for educators around the world.
We’ve come a long way since the launch of the m1.small instance in 2006, adding instances with additional memory, compute power, and your choice of Intel, AMD, or Graviton processors. The original general-purpose “one size fits all” instance has evolved into six families, each one optimized for specific uses cases, with over 600 generally available instances in all.
New M7g and R7g Today I am happy to tell you about the newest Amazon EC2 instance types, the M7g and the R7g. Both types are powered by the latest generation AWS Graviton3 processors, and are designed to deliver up to 25% better performance than the equivalent sixth-generation (M6g and R6g) instances, making them the best performers in EC2.
The M7g instances are for general purpose workloads such as application servers, microservices, gaming servers, mid-sized data stores, and caching fleets. The R7g instances are a great fit for memory-intensive workloads such as open-source databases, in-memory caches, and real-time big data analytics.
Here are the specs for the M7g instances:
Instance Name
vCPUs
Memory
Network Bandwidth
EBS Bandwidth
m7g.medium
1
4 GiB
up to 12.5 Gbps
up to 10 Gbps
m7g.large
2
8 GiB
up to 12.5 Gbps
up to 10 Gbps
m7g.xlarge
4
16 GiB
up to 12.5 Gbps
up to 10 Gbps
m7g.2xlarge
8
32 GiB
up to 15 Gbps
up to 10 Gbps
m7g.4xlarge
16
64 GiB
up to 15 Gbps
up to 10 Gbps
m7g.8xlarge
32
128 GiB
15 Gbps
10 Gbps
m7g.12xlarge
48
192 GiB
22.5 Gbps
15 Gbps
m7g.16xlarge
64
256 GiB
30 Gbps
20 Gbps
m7g.metal
64
256 GiB
30 Gbps
20 Gbps
And here are the specs for the R7g instances:
Instance Name
vCPUs
Memory
Network Bandwidth
EBS Bandwidth
r7g.medium
1
8 GiB
up to 12.5 Gbps
up to 10 Gbps
r7g.large
2
16 GiB
up to 12.5 Gbps
up to 10 Gbps
r7g.xlarge
4
32 GiB
up to 12.5 Gbps
up to 10 Gbps
r7g.2xlarge
8
64 GiB
up to 15 Gbps
up to 10 Gbps
r7g.4xlarge
16
128 GiB
up to 15 Gbps
up to 10 Gbps
r7g.8xlarge
32
256 GiB
15 Gbps
10 Gbps
r7g.12xlarge
48
384 GiB
22.5 Gbps
15 Gbps
r7g.16xlarge
64
512 GiB
30 Gbps
20 Gbps
r7g.metal
64
512 GiB
30 Gbps
20 Gbps
Both types of instances are equipped with DDR5 memory, which provides up to 50% higher memory bandwidth than the DDR4 memory used in previous generations. Here’s an infographic that I created to highlight the principal performance and capacity improvements that we have made available with the new instances:
If you are not yet running your application on Graviton instances, be sure to take advantage of the AWS Graviton Ready Program. The partners in this program provide services and solutions that will help you to migrate your application and to take full advantage of all that the Graviton instances have to offer. Other helpful resources include the Porting Advisor for Graviton and the Graviton Fast Start program.
The instances are built on the AWS Nitro System, and benefit from multiple features that enhance security: always-on memory encryption, a dedicated cache for each vCPU, and support for pointer authentication. They also support encrypted EBS volumes, which protect data at rest on the volume, data moving between the instance and the volume, snapshots created from the volume, and volumes created from those snapshots. To learn more about these and other Nitro-powered security features, be sure to read The Security Design of the AWS Nitro System.
Pricing and Regions M7g and R7g instances are available today in the US East (N. Virginia), US East (Ohio), US West (Oregon), and Europe (Ireland) AWS Regions in On-Demand, Spot, Reserved Instance, and Savings Plan form.
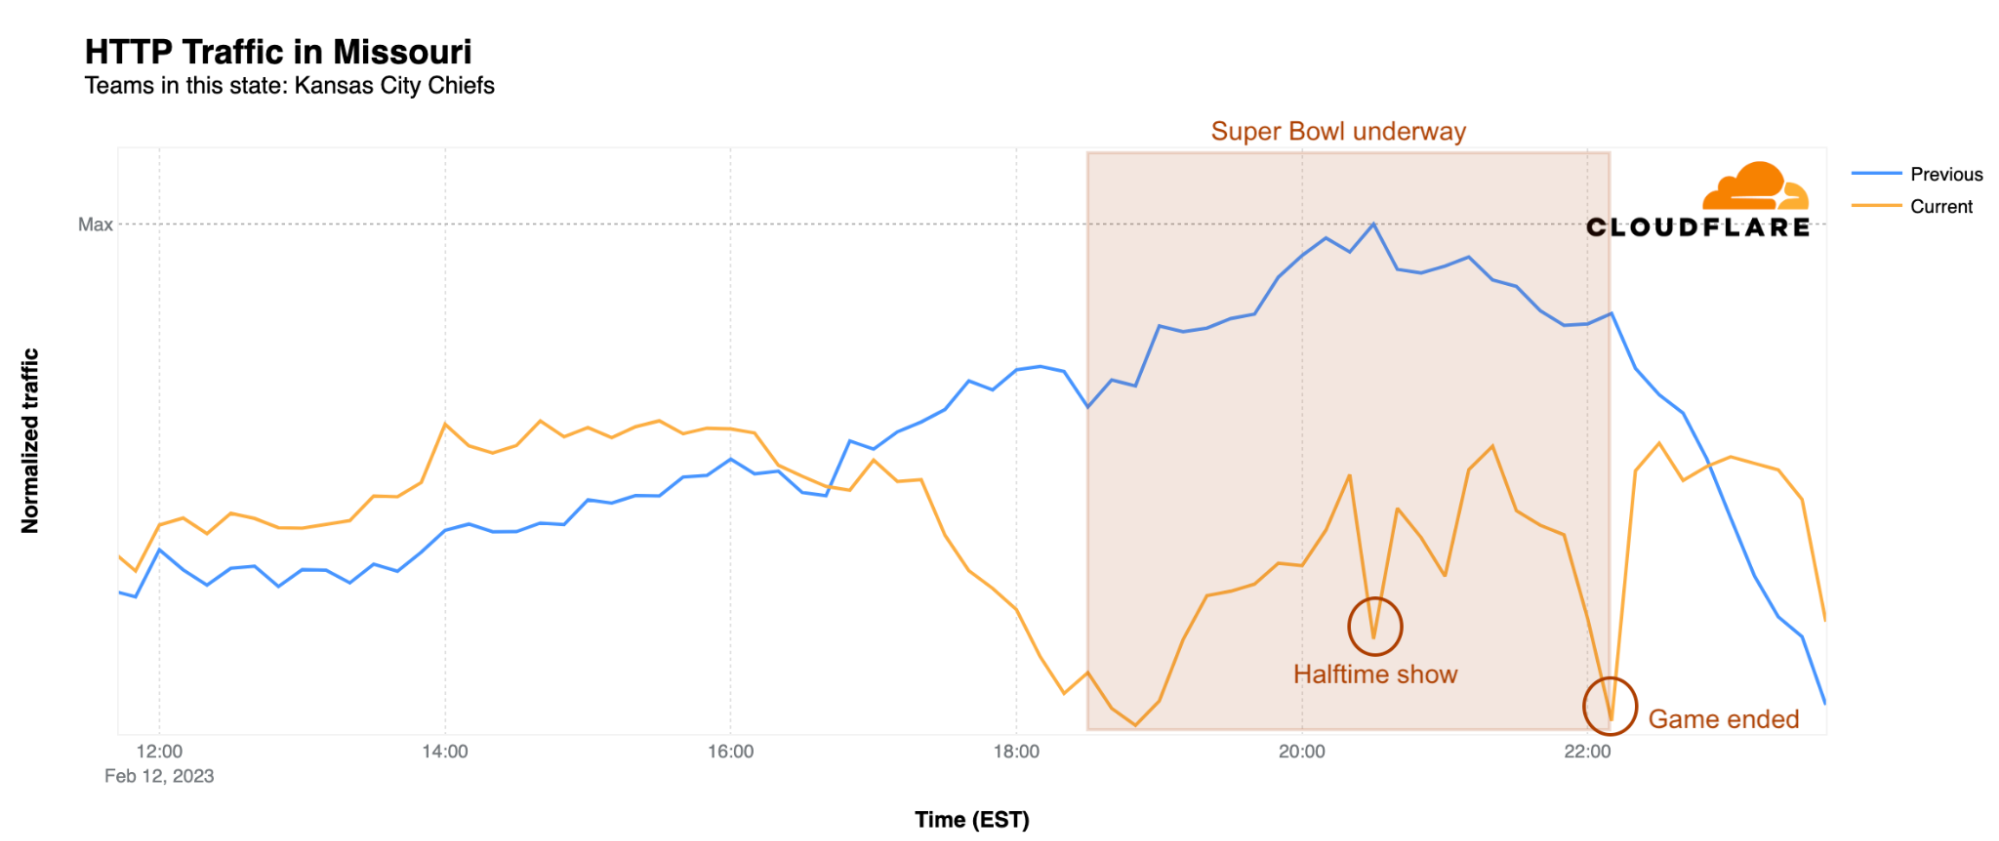
The Super Bowl has been happening since the end of the 1966 season, the same year that the ARPANET project, which gave birth to the Internet, was initiated. Around 20 years ago, 50% of the US population were Internet users, and that number is now around 92%. So, it’s no surprise that interest in an event like Super Bowl LVII resulted in a noticeable dip in Internet traffic in the United States at the time of the game’s kickoff, dropping to around 5% lower than the previous Sunday. During the game, Rihanna’s halftime show also caused a significant drop in Internet traffic across most states, with Pennsylvania and New York feeling the biggest impact, but messaging and video platforms saw a surge of traffic right after her show ended.
In this blog post, we will dive into who the biggest winners were among Super Bowl advertisers, as well as examine how traffic to food delivery services, social media and sports and betting websites changed during the game. In addition, we look at traffic trends seen at city and state levels during the game, as well as email threat volume across related categories in the weeks ahead of the game.
Cloudflare Radar uses a variety of sources to provide aggregate information about Internet traffic and attack trends. In this blog post, as we did last year and the year before, we use DNS name resolution data from our 1.1.1.1 resolver to estimate traffic to websites. We can’t see who visited the websites mentioned, or what anyone did on the websites, but DNS can give us an estimate of the interest generated by the ads or across a set of sites in the categories listed above.
Ads: are URLs no longer cool?
In contrast to Super Bowl commercials of the past 25 years, many of this year’s advertisements didn’t include a URL, possibly suggesting strong confidence by brands in their search engine results placement, or an assumption that the viewer would engage with the brand through an app on their phone, rather than a website. To that end, several ads did include an app store-related call to action, encouraging the viewer to download the associated mobile app. And possibly in an effort to capitalize on the success of Coinbase’s QR code commercial during Super Bowl LVI, a number of brands, including Toyota, Michelob Ultra, and Mr. Peanut included QR codes as a way for viewers to get additional information or see more.
As we did last year, we again tracked DNS request traffic to our 1.1.1.1 resolver in United States data centers for domains associated with the advertised products or brands. Traffic growth is plotted against a baseline calculated as the mean request volume for the associated domains between 1200-1500 EST on Sunday, February 12 (Super Bowl Sunday.) Although over 50 brands advertised during the game, the brands highlighted below were chosen because their advertisements drove some of the largest percentage traffic spikes, as well as one interesting tale.
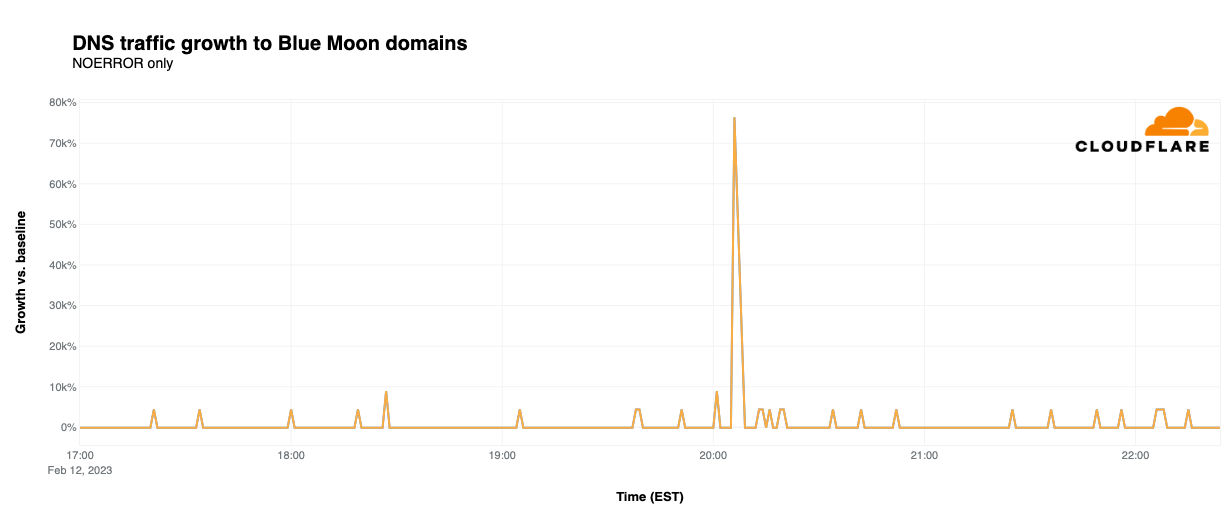
BlueMoon
Although the commercial initially seemed to be for sibling beer brands Coors Light and Miller Lite, there was a twist at the end, This twist was only fitting, as the ad was actually for Blue Moon, which is often served with a twist of orange on the rim of the glass. Although beer ads don’t usually drive significant traffic spikes, this one did, reaching 76,400% above baseline for Blue Moon’s site. Coors Light saw a 275% bump in DNS traffic coincident with the ad, while Miller Lite grew 120%. However, traffic for Coors and Miller was fairly volatile at other times during the game.
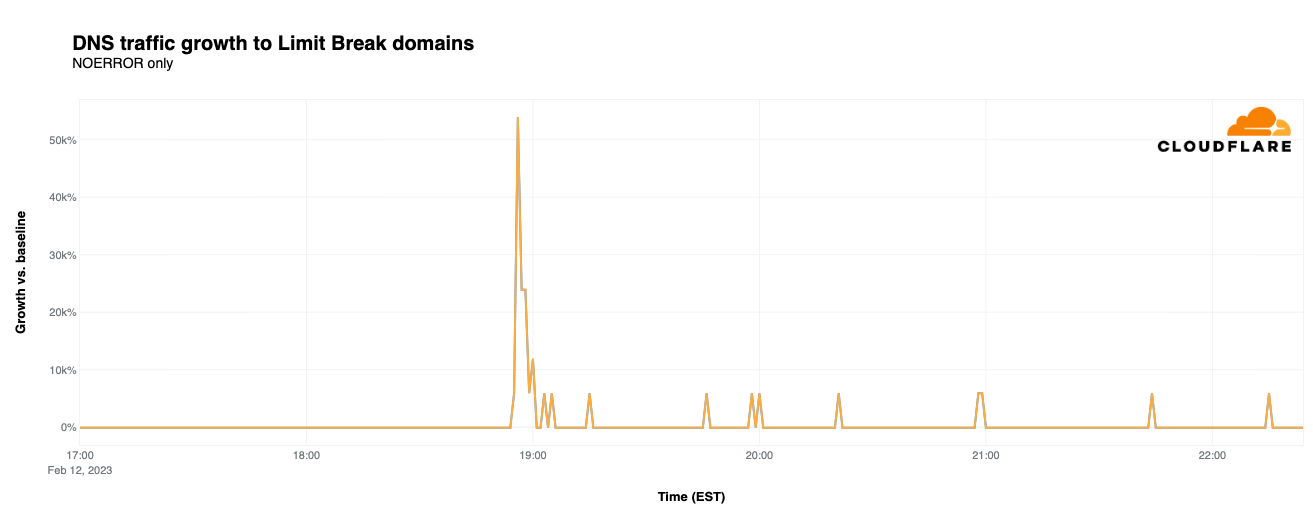
LimitBreak
Although last year’s advertisements included a number of cryptocurrency-related brands, they were all but absent from this year’s slate of ads. The closest we got during this year’s game was a commercial from LimitBreak, which describes itself as “bringing the free-to-play gaming experience to Web3 and beyond”, in which it promoted a giveaway of thousands of its Dragon series NFTs. This ad featured a QR code and a URL, and given the nearly 54,000% increase in DNS traffic observed, both were effective means of driving traffic to the LimitBreak website.
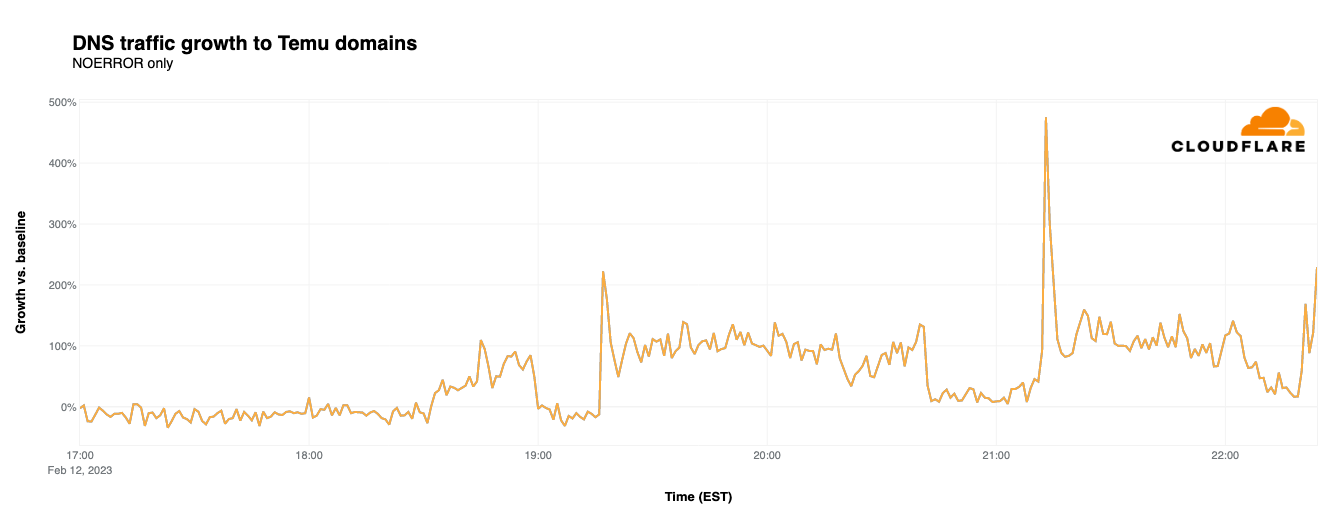
Temu
Upstart mobile shopping app Temu purchased multiple Super Bowl ad slots to promote its “shop like a billionaire” campaign, urging viewers to download its mobile app. As seen in the graph below, these advertisements drove spikes in traffic, and continued engagement, each time they ran. The first airing at 19:16 EST drove a 222% spike over baseline in DNS traffic. However, the second airing at 21:12 EST apparently resulted in significantly more interest, driving a 475% traffic increase. A third airing at 22:20 EST reached 169% over baseline, with another one just after that reaching over 200%.
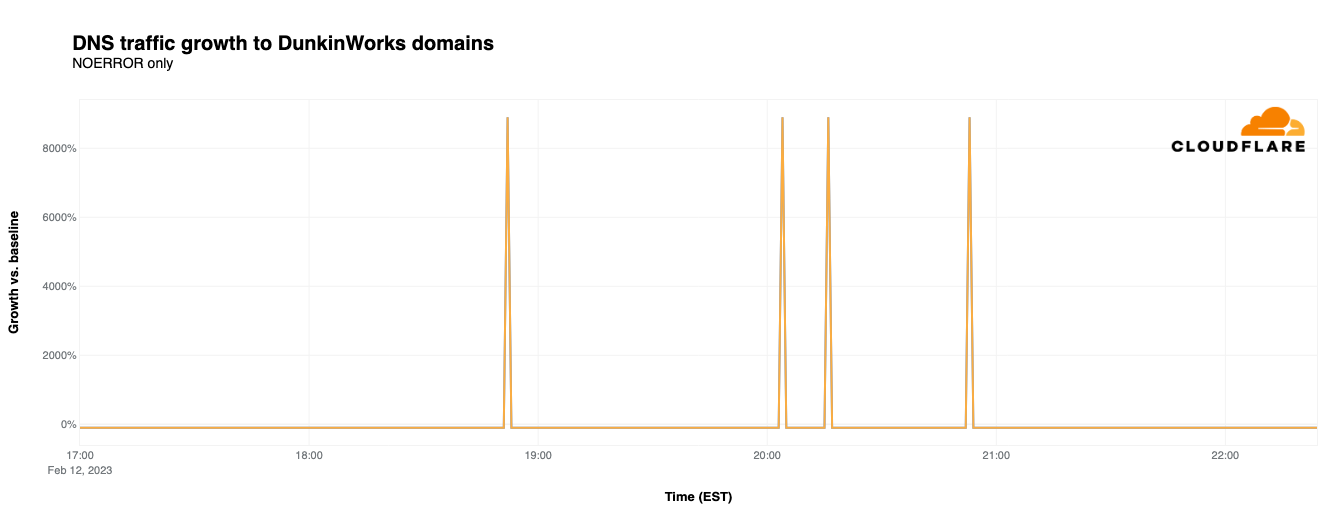
Dunkin’
In early January, Boston-area media blew up with the news that local celebrity Ben Affleck was spotted working the drive-through window at one of the coffee chain’s Medford locations, raising some speculation that he was filming a Super Bowl commercial. That speculation turned out to be true, as the commercial aired at 18:53 EST. But the commercial had a side effect: DNS traffic for dunkin.com, associated with DunkinWorks (a small personal coaching and training business), spiked 8,000% when the commercial aired, as shown in the graph below. (It isn’t clear what drove the later three spikes for dunkin.com, as the advertisement didn’t air again nationally during the remainder of the game.) We can only hope that the dunkin.com system administrators were fueled with plenty of coffee and donuts as they dealt with the rapid growth in traffic.
Site categories: touchdowns bring attention
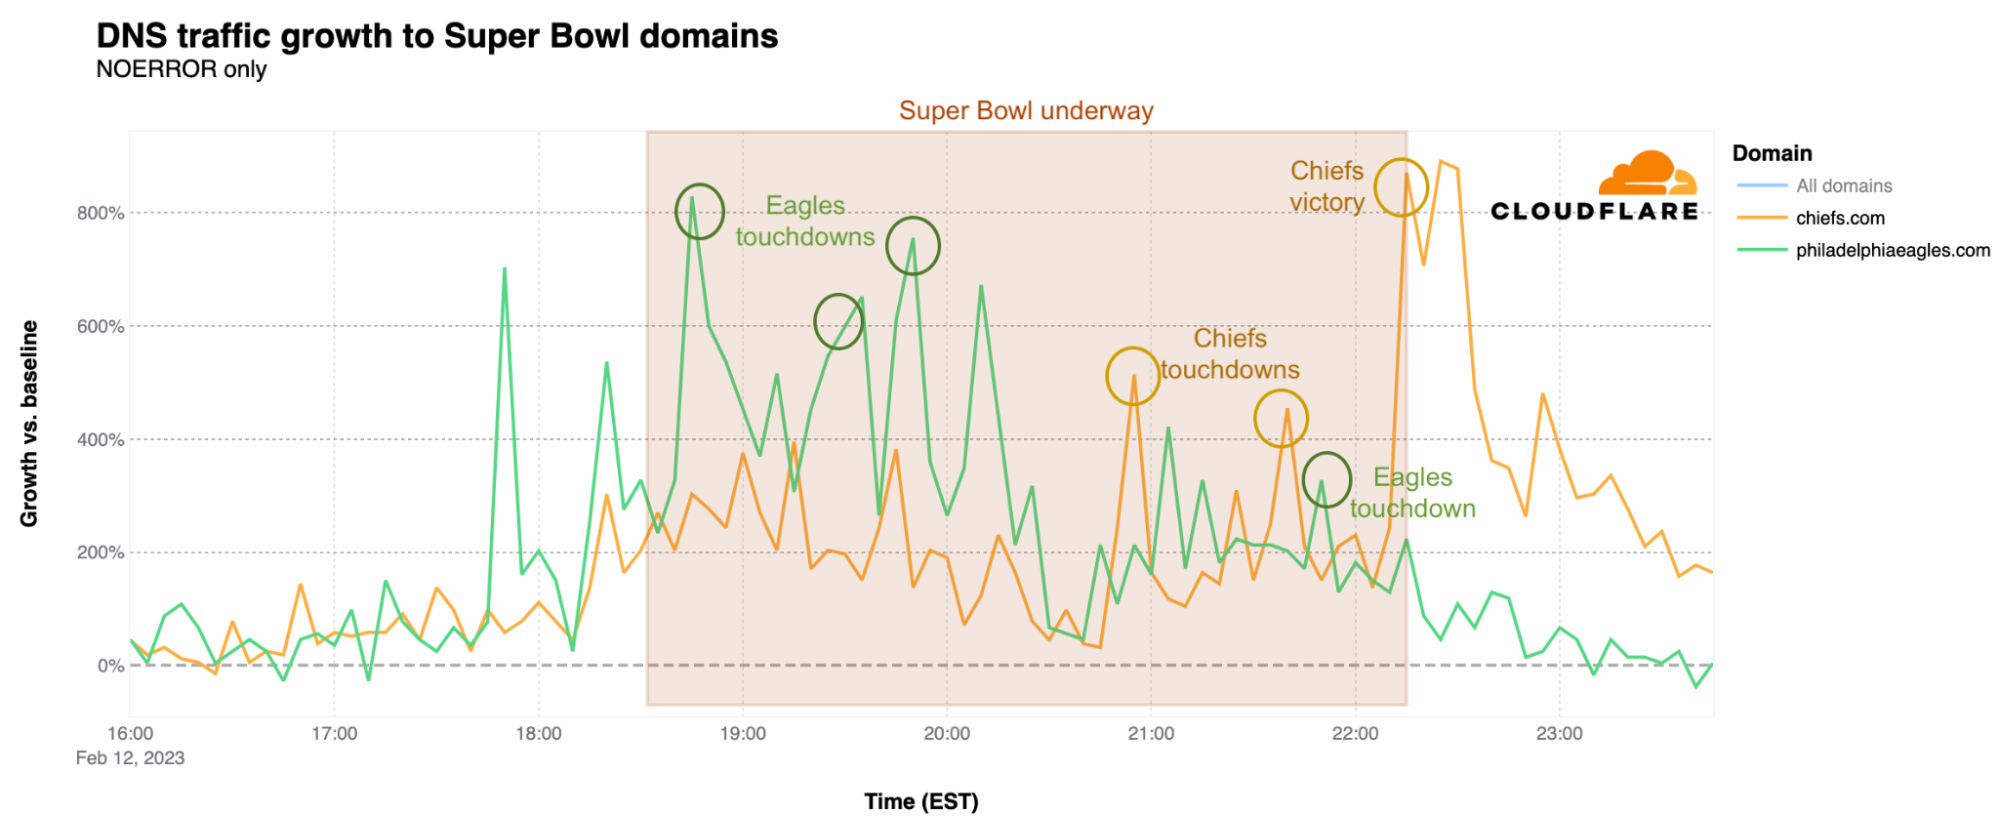
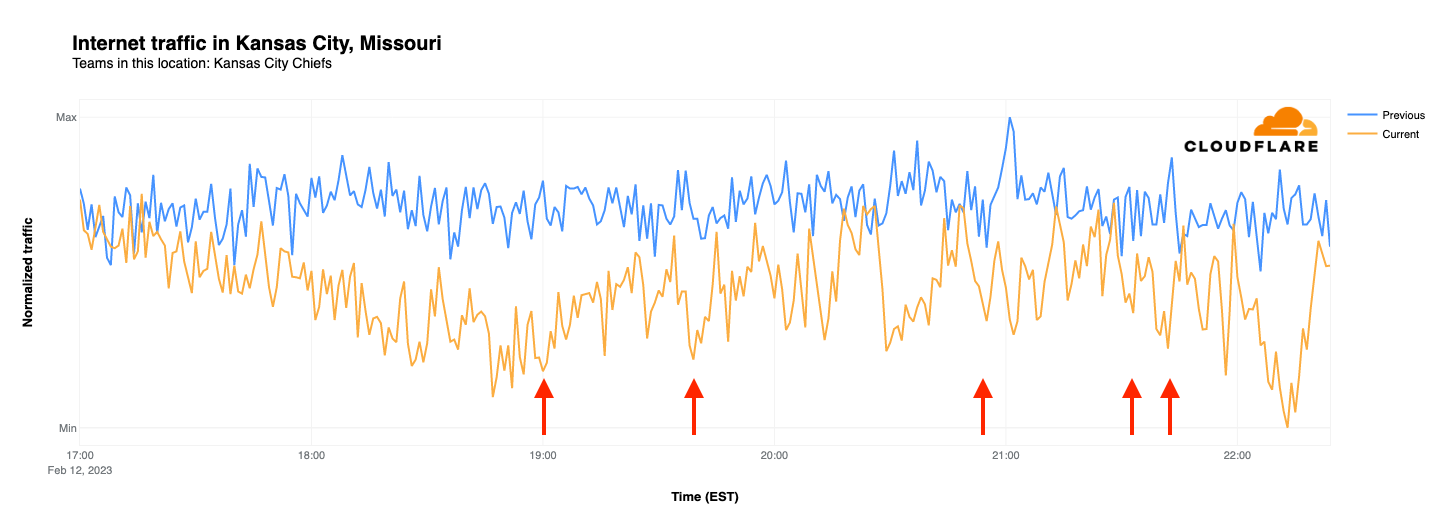
As we saw last year, there are two factors that bring a surge of traffic to the websites of Super Bowl participants: touchdowns and winning. However, nothing is more impactful than the sweet taste of victory. Both the Kansas City Chiefs’ and Philadelphia Eagles’ websites experienced a surge in DNS traffic just before the game started, as compared to a baseline calculated as the mean request volume for the associated domains between 12:00-15:00 EST on Sunday, February 12 (Super Bowl Sunday.). The Eagles website had its peak just around the time of the kickoff, with 828% growth over baseline, and continued to grow more rapidly than traffic to the Chiefs’ website until 20:55 EST, when traffic to chiefs.com began to pull ahead.
What happened at that time? That was the moment of the Chiefs’ third touchdown of the game, when DNS traffic to the team’s website had its first peak of the evening, at 514% above baseline. There was a clear spike during another Chiefs touchdown at 21:42 EST, at 454% above baseline, but that was nothing compared to the end of the game, when the Kansas City Chiefs were once again, after their 2019 victory, the winners. At 22:15 EST, when the game ended, DNS traffic to the Chiefs’ website was 871% higher, and peaked 10 minutes later at 890%, as compared to the baseline. At this same time, DNS traffic for the Eagles’ website dropped significantly. As we saw last year as well, winning the Super Bowl clearly drives increased traffic to the victor’s website.
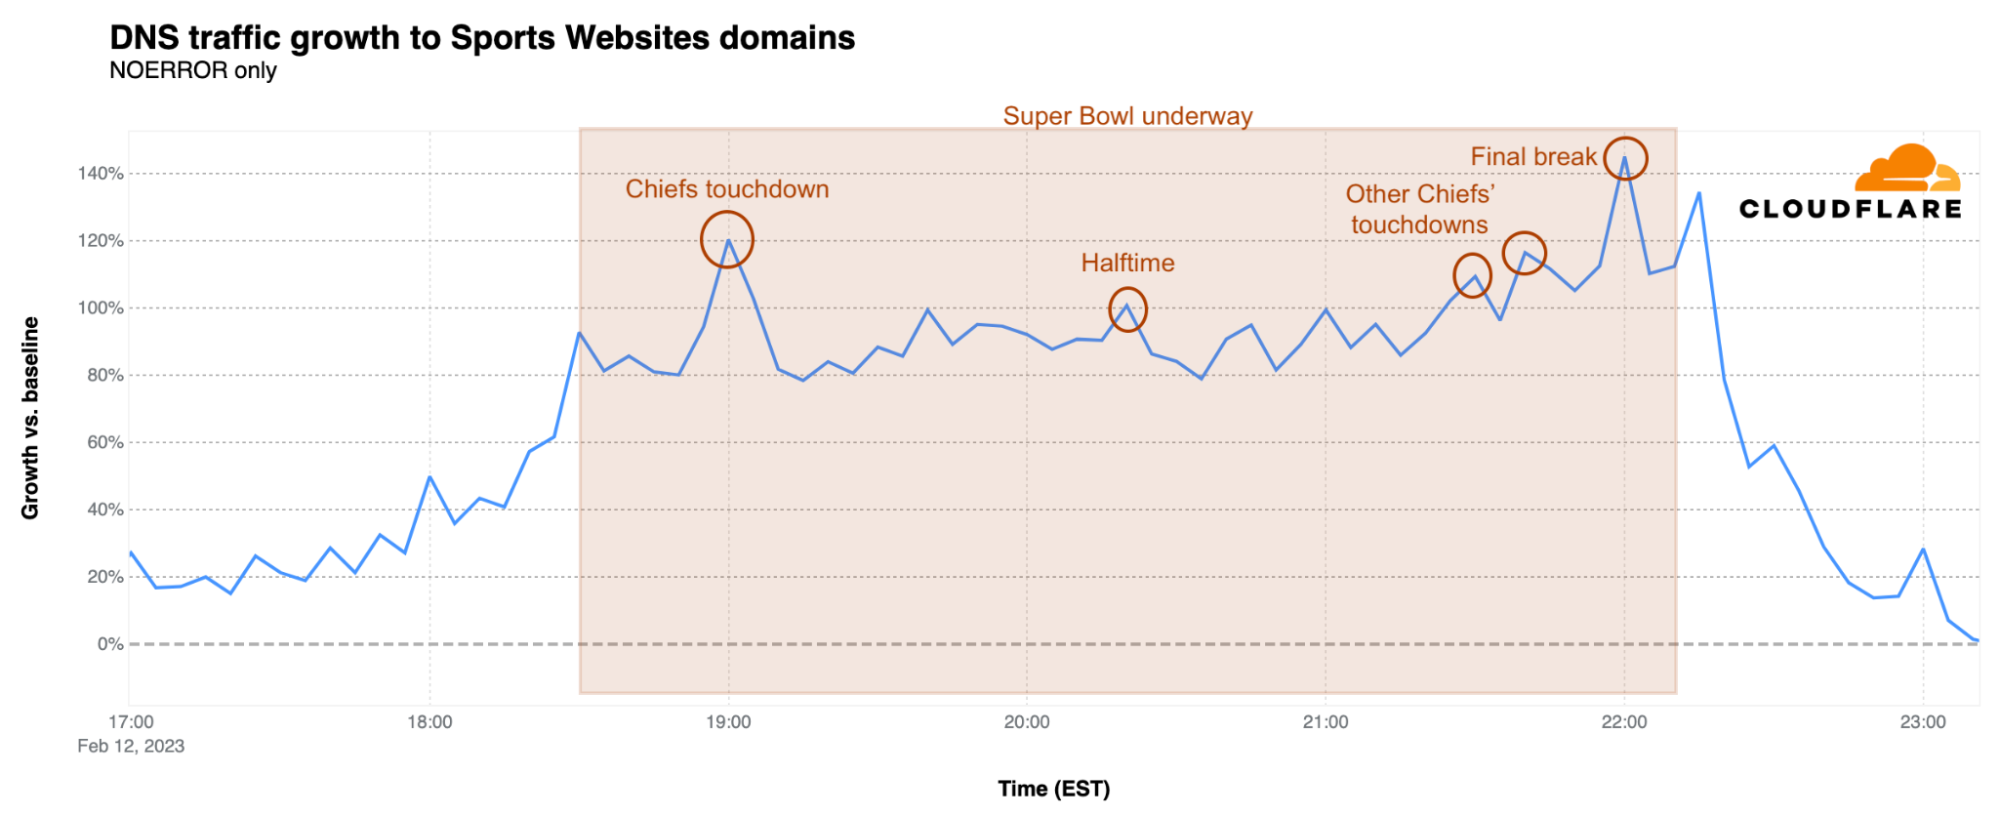
Sports websites trends also followed the in-game events. There was a clear spike to approximately 90% above baseline when the game started at 18:30 EST, with further growth to 120% over baseline at 19:00 EST during the Kansas City Chiefs’ first touchdown. There were also clear spikes at 21:30 and 21:40 EST coinciding with the two more Chiefs touchdowns. The Super Bowl peak for these websites was reached during the final break at 22:00 EST, reaching 145% above baseline, just before the Chiefs’ game-winning field goal. After a brief drop as the game ended, there was an additional spike to 134%.
Rihanna’s impact on messaging and social media sites
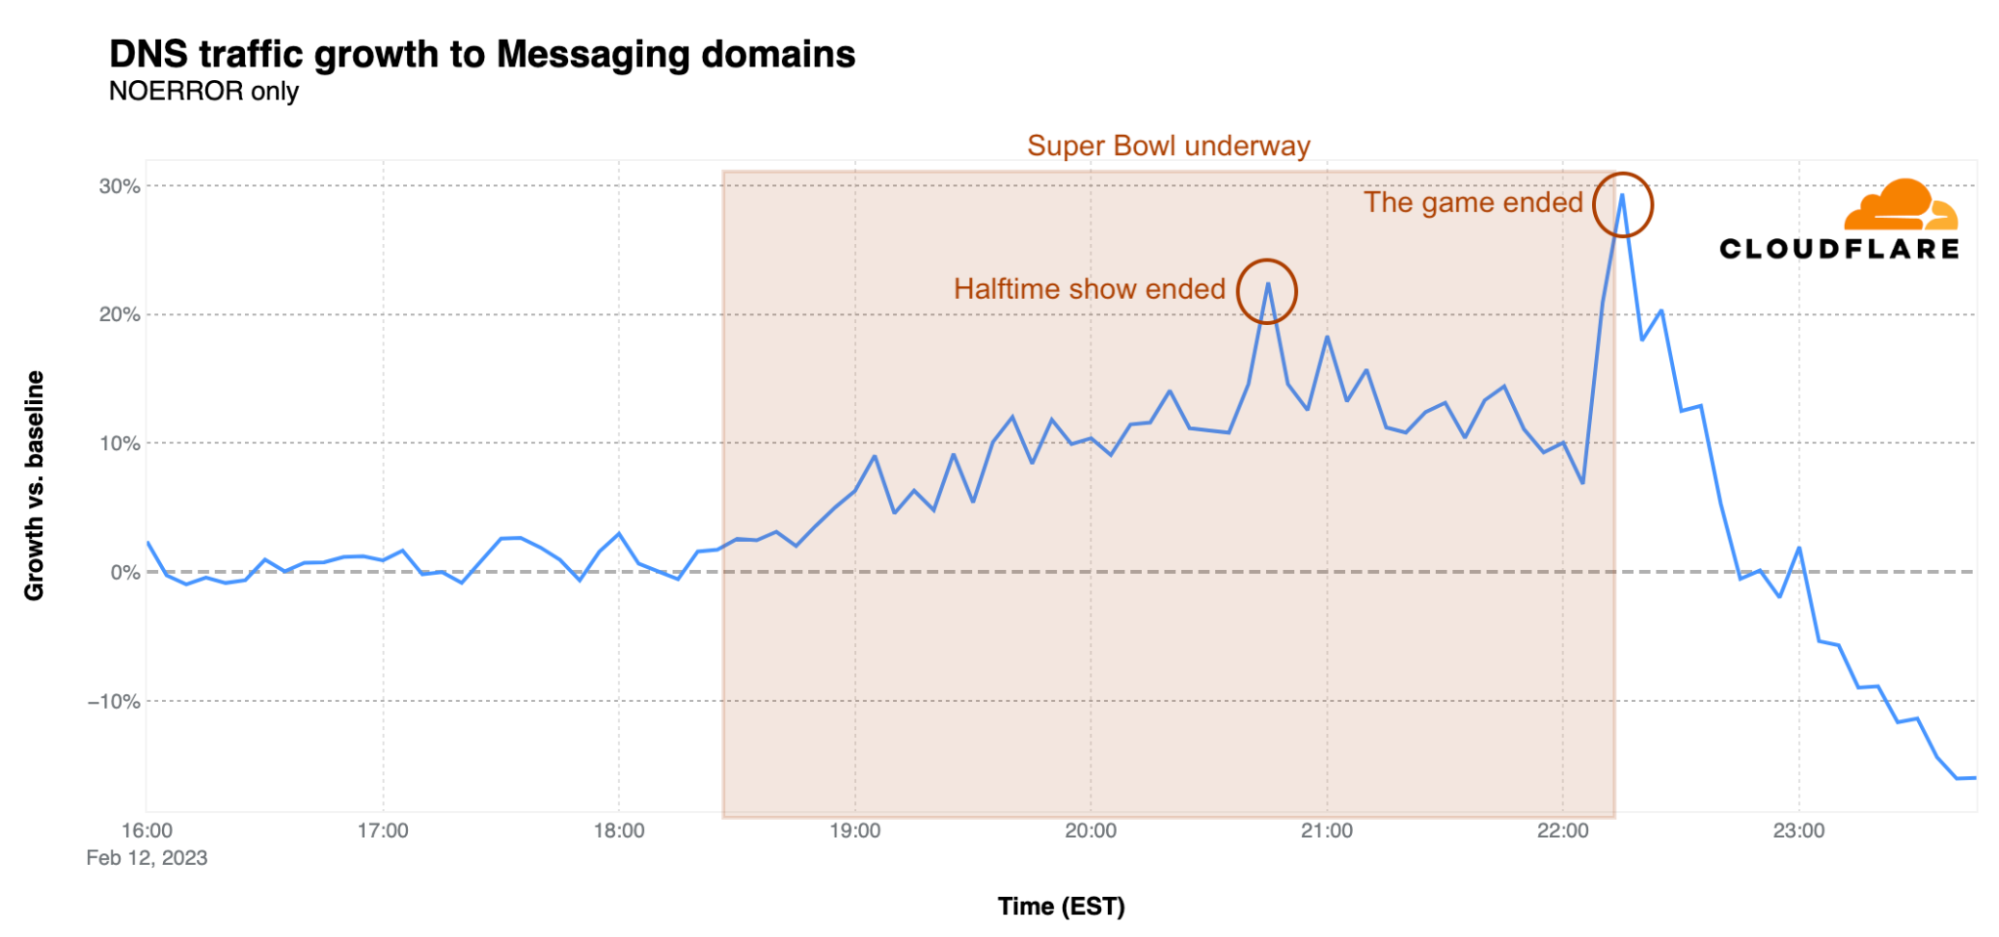
What happened following Rihanna’s performance during the Super Bowl halftime show? As the game resumed, we saw a clear increase in traffic for messaging websites, with a first peak right after the end of the show at around 20:45 EST, 22% over baseline. The biggest peak, however, was when the game ended. At 22:15 EST, DNS traffic for messaging sites was 30% higher than the earlier baseline.
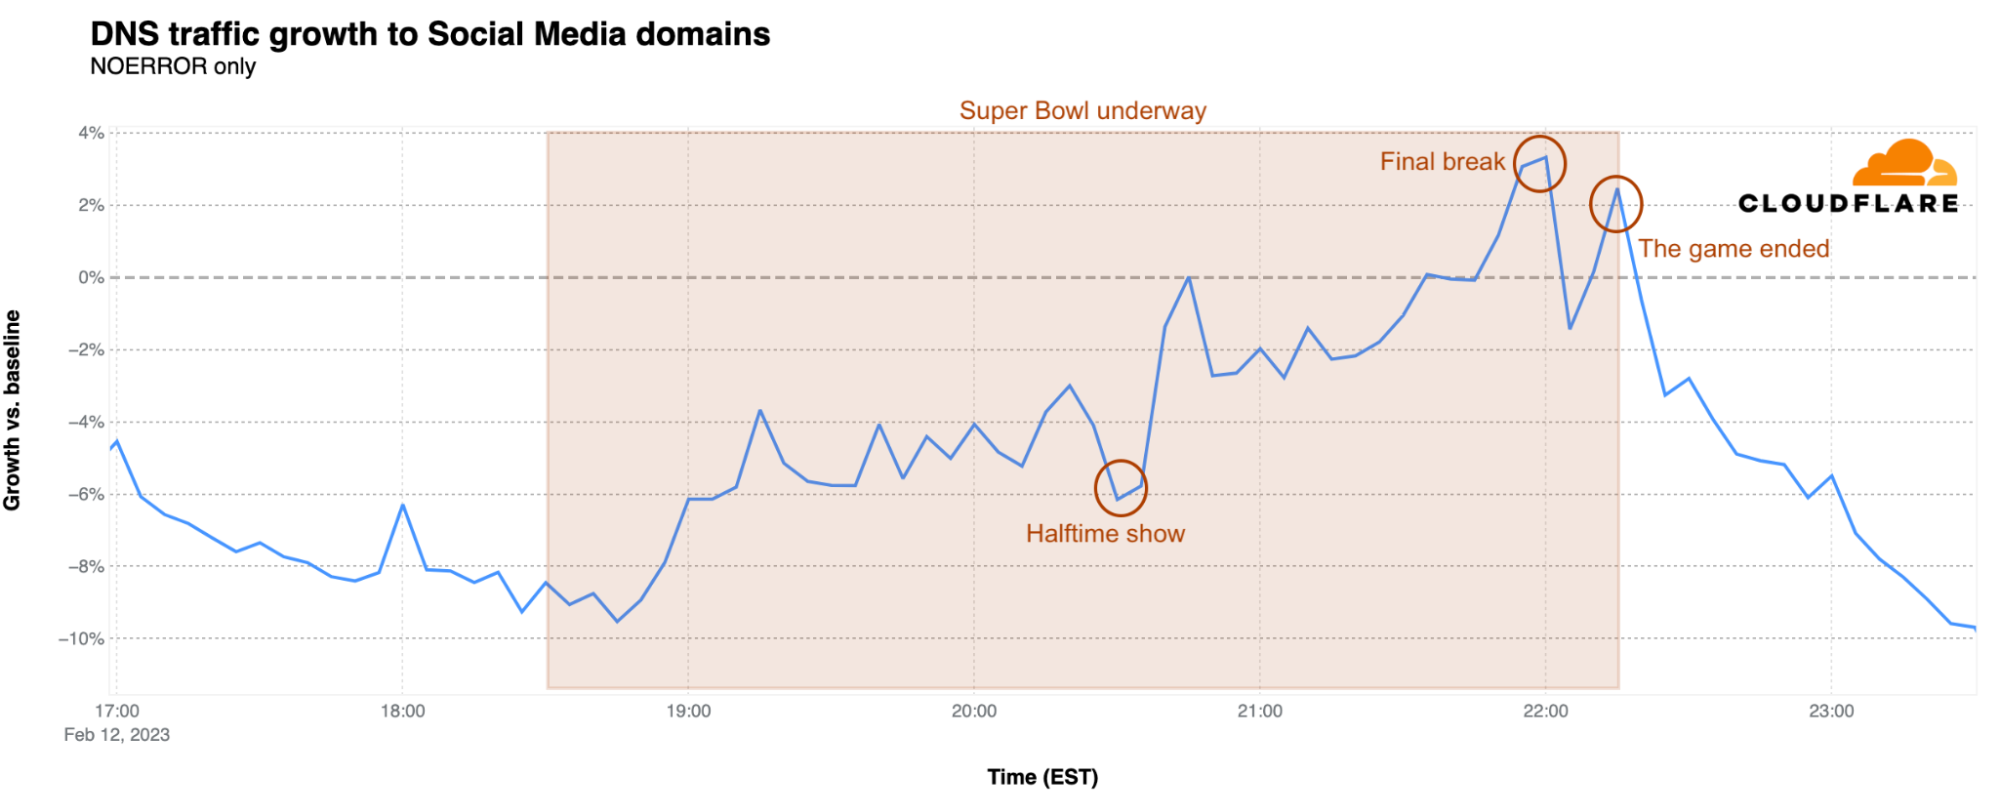
Rihanna’s announcement of her second pregnancy, which made news after her performance, also impacted traffic to social media platforms. After a small increase when halftime started, there was a clear drop during Rihanna’s show, followed by a jump from 6% below baseline back to 0% right after the show. An additional 3% of traffic growth was reached during the final break at 22:00 EST, just before the Kansas City Chiefs’ winning field goal. After a brief drop, traffic reached 2% above baseline as the game ended.
Is halftime also a time for rewatching ads?
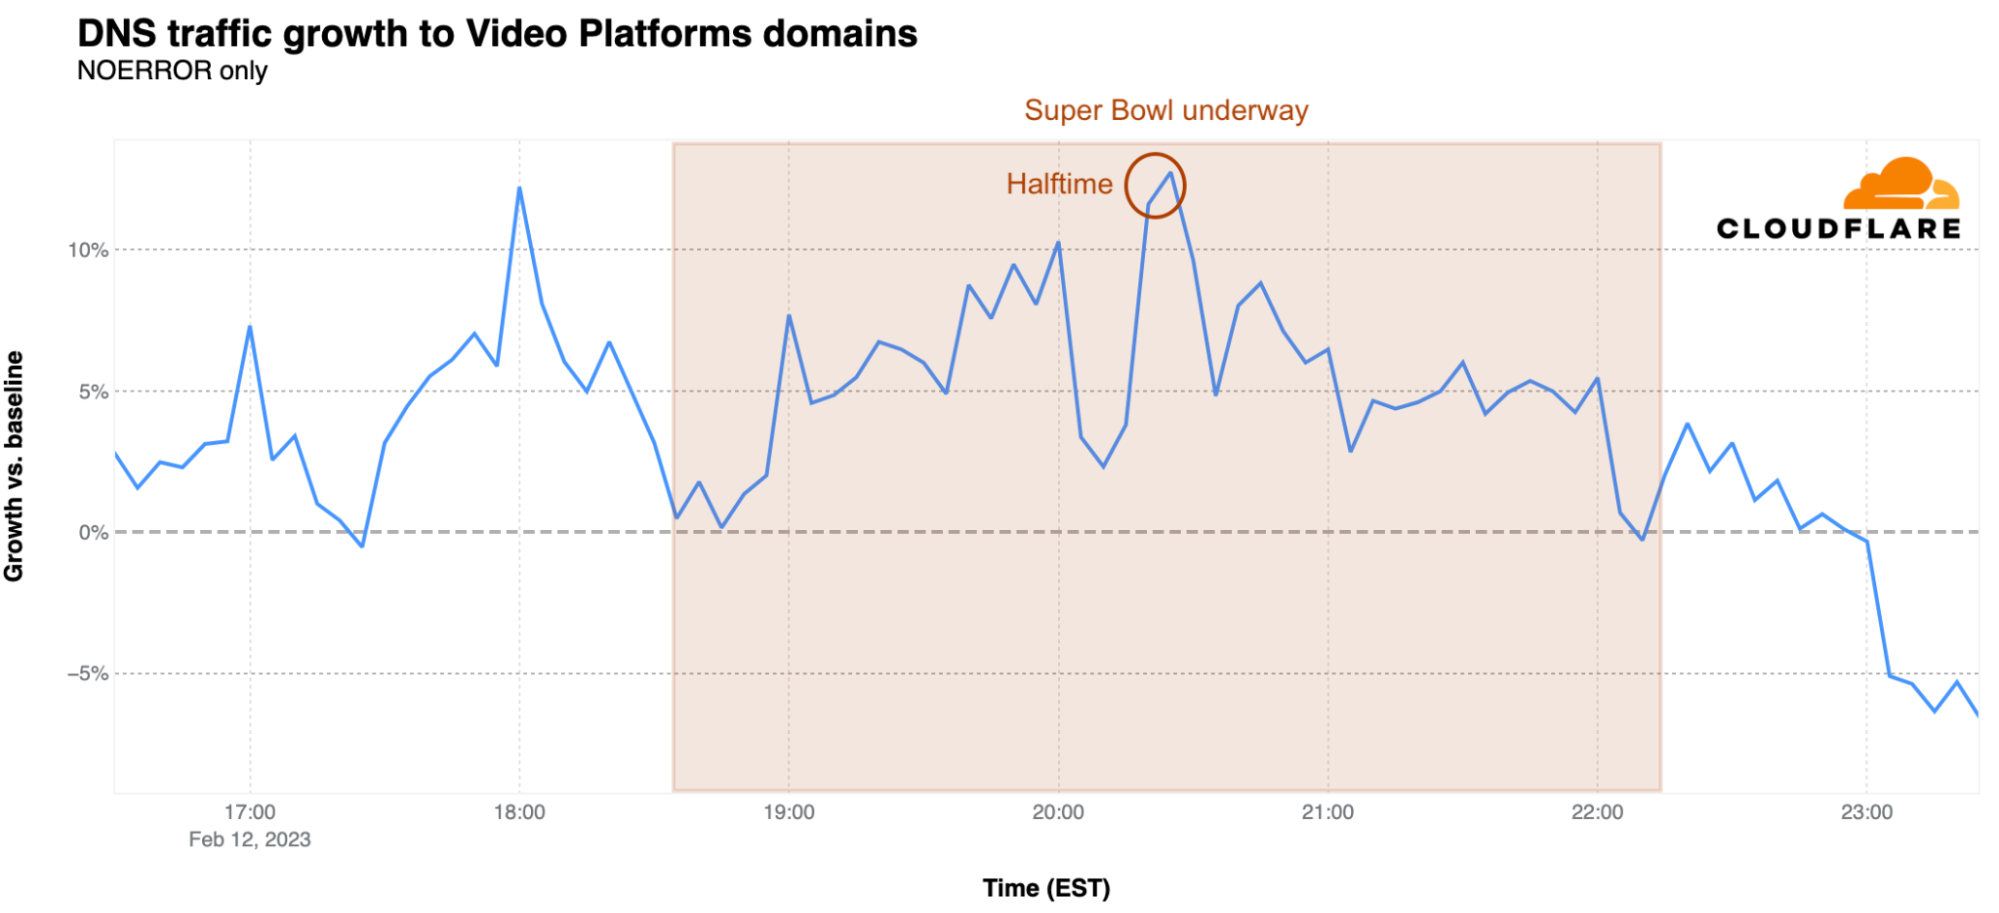
The arrival of halftime at 20:21 EST also brought a surge in DNS traffic for video platforms. The first peak was reached at 18:00 EST, before the game started, at 12% above baseline. The peak during halftime was reached at 20:25 EST with 13% growth above baseline, suggesting that viewers may have been looking at that time to Super Bowl related videos or just using the time to browse those platforms.
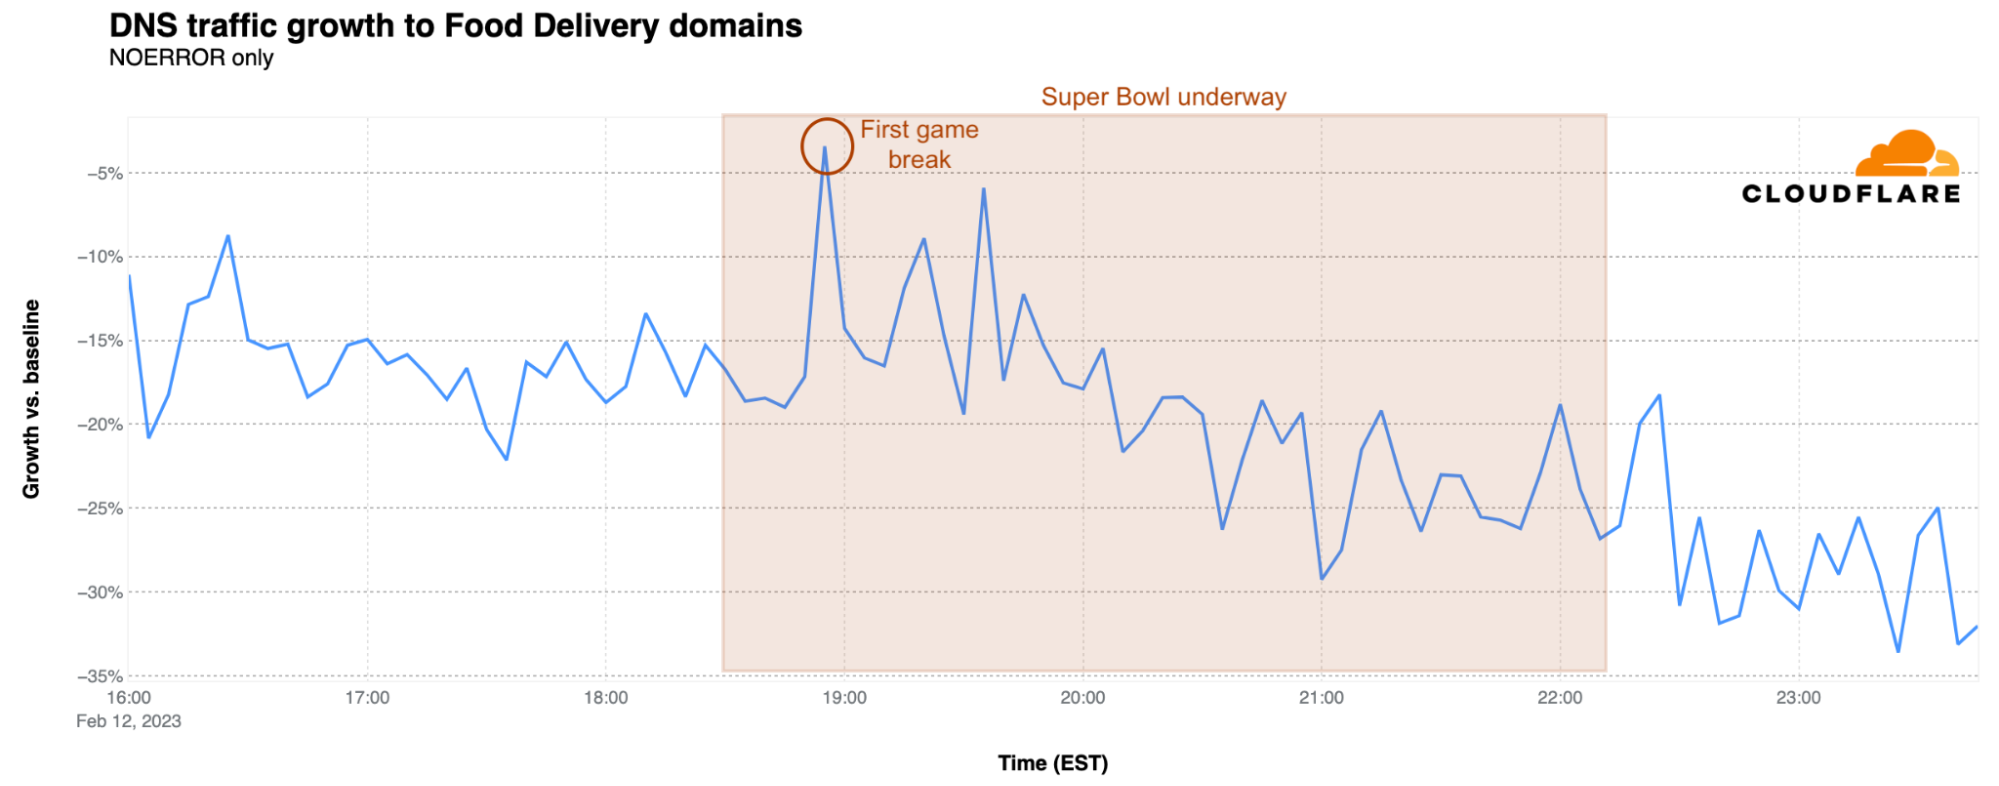
Food delivery websites saw flat to lower DNS traffic just before the game as compared to the earlier baseline, suggesting that food orders were placed/scheduled earlier in the afternoon, hours before the game. At kickoff, traffic was 19% below baseline, but there was a clear spike at the time of the first break and right after the first Kansas City touchdown at 18:55 EST. After falling again during the game, there was a small increase in traffic observed just after the game ended.
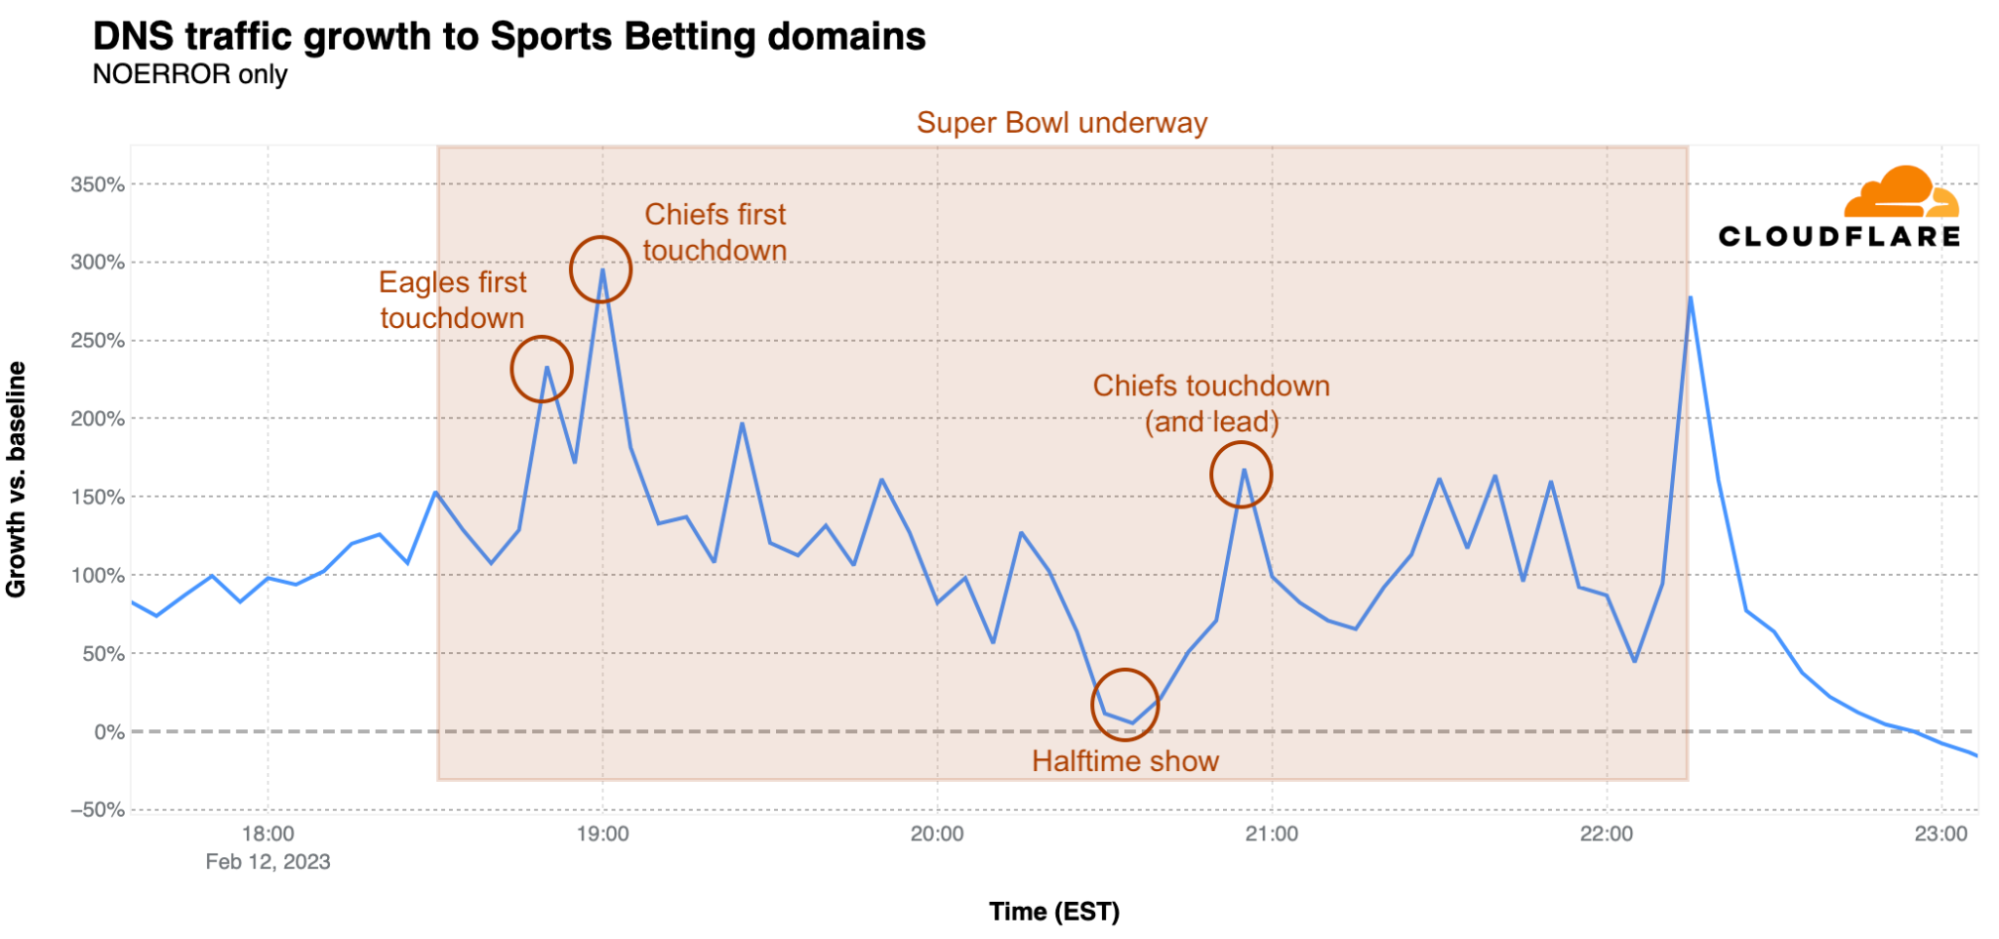
What about betting sites? They expected a big day during the Super Bowl, given that more states have recently legalized gambling on sports. The peak was reached at 19:00 EST, as DNS traffic reached 295% over baseline, when the Chiefs had their first touchdown, The first Eagles touchdown, minutes before, resulted in a 233% spike. The lowest traffic for betting sites during the Super Bowl was during the halftime show. In the second half of the game, two other clear spikes in traffic are visible. The first was at 20:55 EST at 167% above baseline when the Chiefs pulled ahead with a touchdown, and then a jump to 278% over baseline when the game ended.
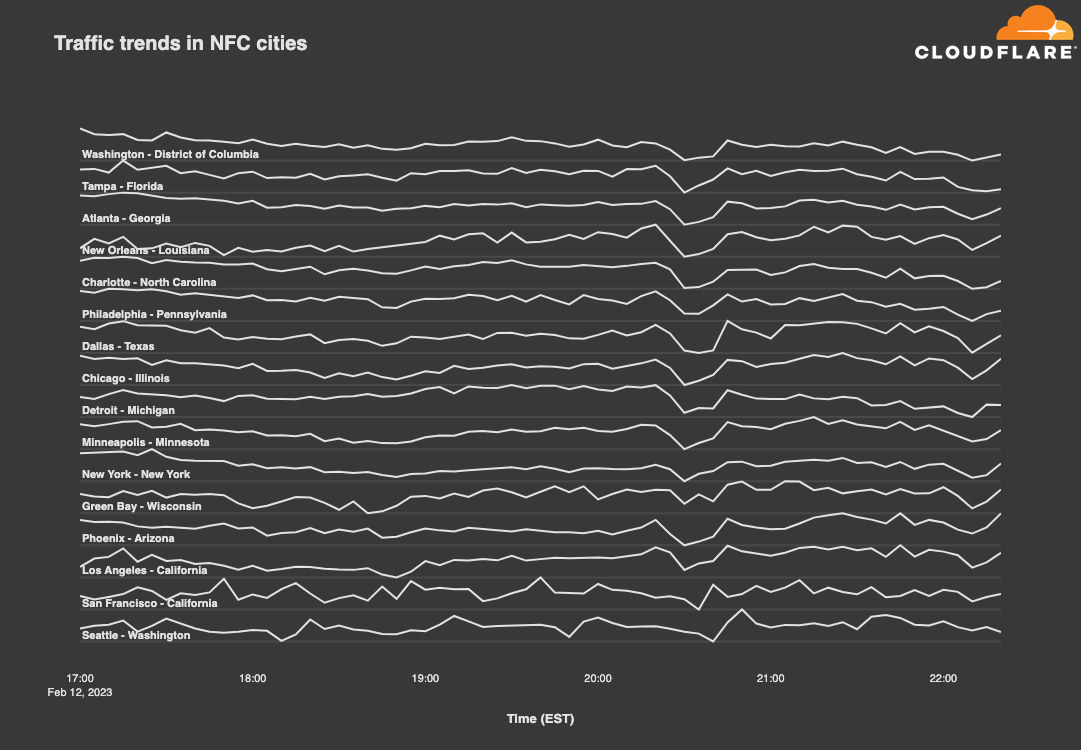
Rihanna runs this town city
While the so-called NFL cities across the country are loyal to their local teams, looking at traffic trends across cities from both conferences makes it clear that fans everywhere find joy, not division, in the unknown pleasures of a good halftime show. The drop visible in both graphs below between 20:30-20:50 EST coincides with Rihanna’s return to live performance, as she last performed live in January 2018. Based on the observed drop in traffic, viewers apparently turned away from their computers and devices, giving their attention to Rihanna, or at least stopped their general Internet surfing during the halftime show. As the graphs show, traffic recovered as soon as halftime was over.
Zooming in to individual cities, we examined the traffic patterns observed in both Philadelphia and Kansas City. While both teams have fans across the country, we can use their home cities as a proxy. In this case, we compared normalized Internet traffic levels between 17:00-22:30 EST on Super Bowl Sunday (February 12) with the same time frame on the prior Sunday (February 5).
In Kansas City last Sunday, traffic volumes remained fairly consistent across the surveyed time period. However, on Super Bowl Sunday, traffic levels were initially similar, but by the start of the game were 84% lower than the same time the previous week. Slight drops in traffic are visible coincident with Chiefs touchdowns, but don’t stand out from the overall noisiness of the graph. The graph reached its nadir at 22:13 EST when the Chiefs broke the tie and kicked the game-winning field goal, with the significant drop in traffic likely due to an increased shift in focus towards the outcome of the game, even by those that hadn’t previously been paying close attention.
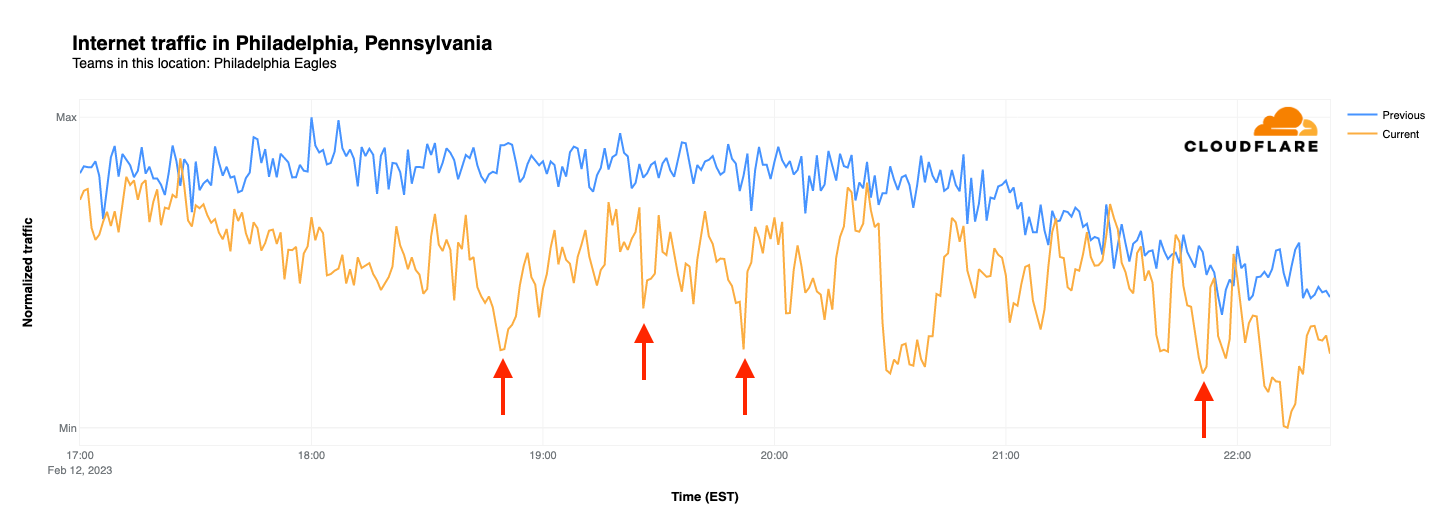
As the graph below shows, last Sunday saw Internet traffic in Philadelphia gradually decline as the evening wore on. On Super Bowl Sunday, traffic started out slightly lower than the week prior, and also diverged as game time approached, reaching nearly 50% lower at kickoff. As the Eagles took an early lead, their first touchdown resulted in a noticeable drop in traffic from Philadelphia, seen at 18:52 EST, less than 10 minutes after the start of the game. Visible drops in traffic are also coincident with the Eagles’ other three touchdowns, although they don’t stand out against the volatility of the graph. Traffic began to drop towards the end of the game, as the tie score added tension, and reached its lowest point when it became clear that the Eagles were not going to emerge victorious in Super Bowl LVII.
State-level traffic trends: the winning impact
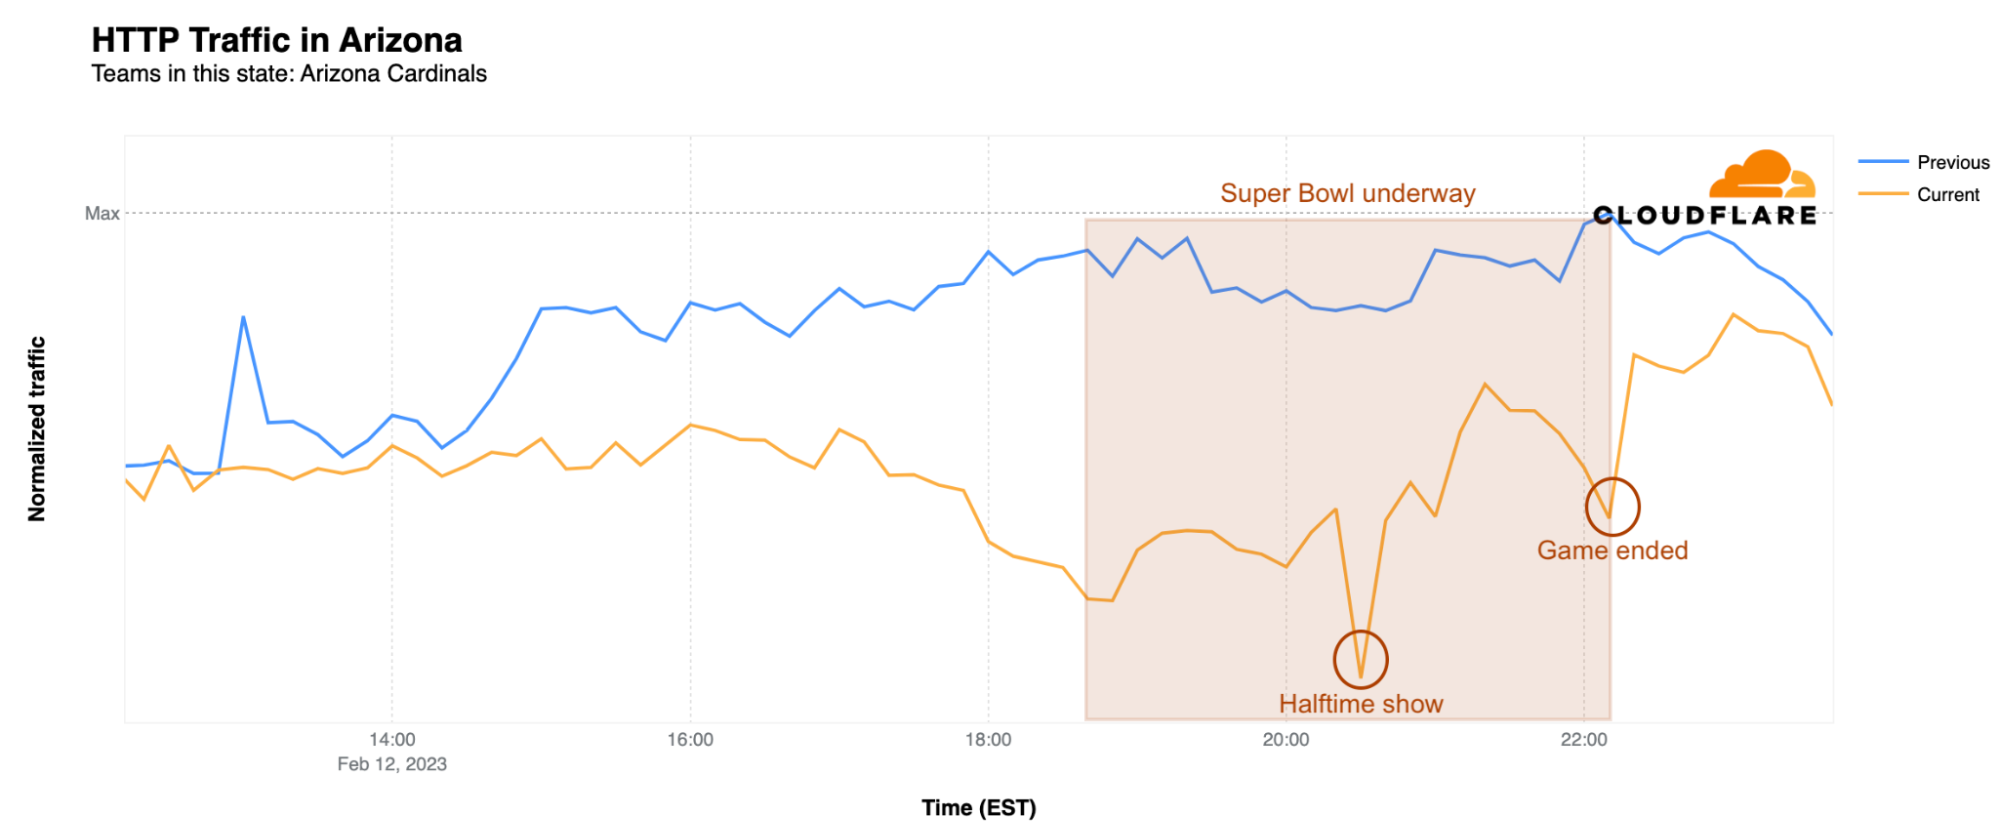
In addition to looking at traffic impacts at a city level, we can also zoom out to examine Internet traffic trends in the Super Bowl states. Arizona, which hosted the big game at State Farm Stadium in Glendale, saw a drop in state-level traffic starting around 13:00 EST. At the time of the kickoff, traffic was 25% lower than the previous Sunday, but the biggest impact was during the wildly popular halftime show by Rihanna. At 20:30 EST, traffic was 29% lower than the same time on the previous Sunday. After the game ended, traffic levels returned to normal around 23:30 EST.
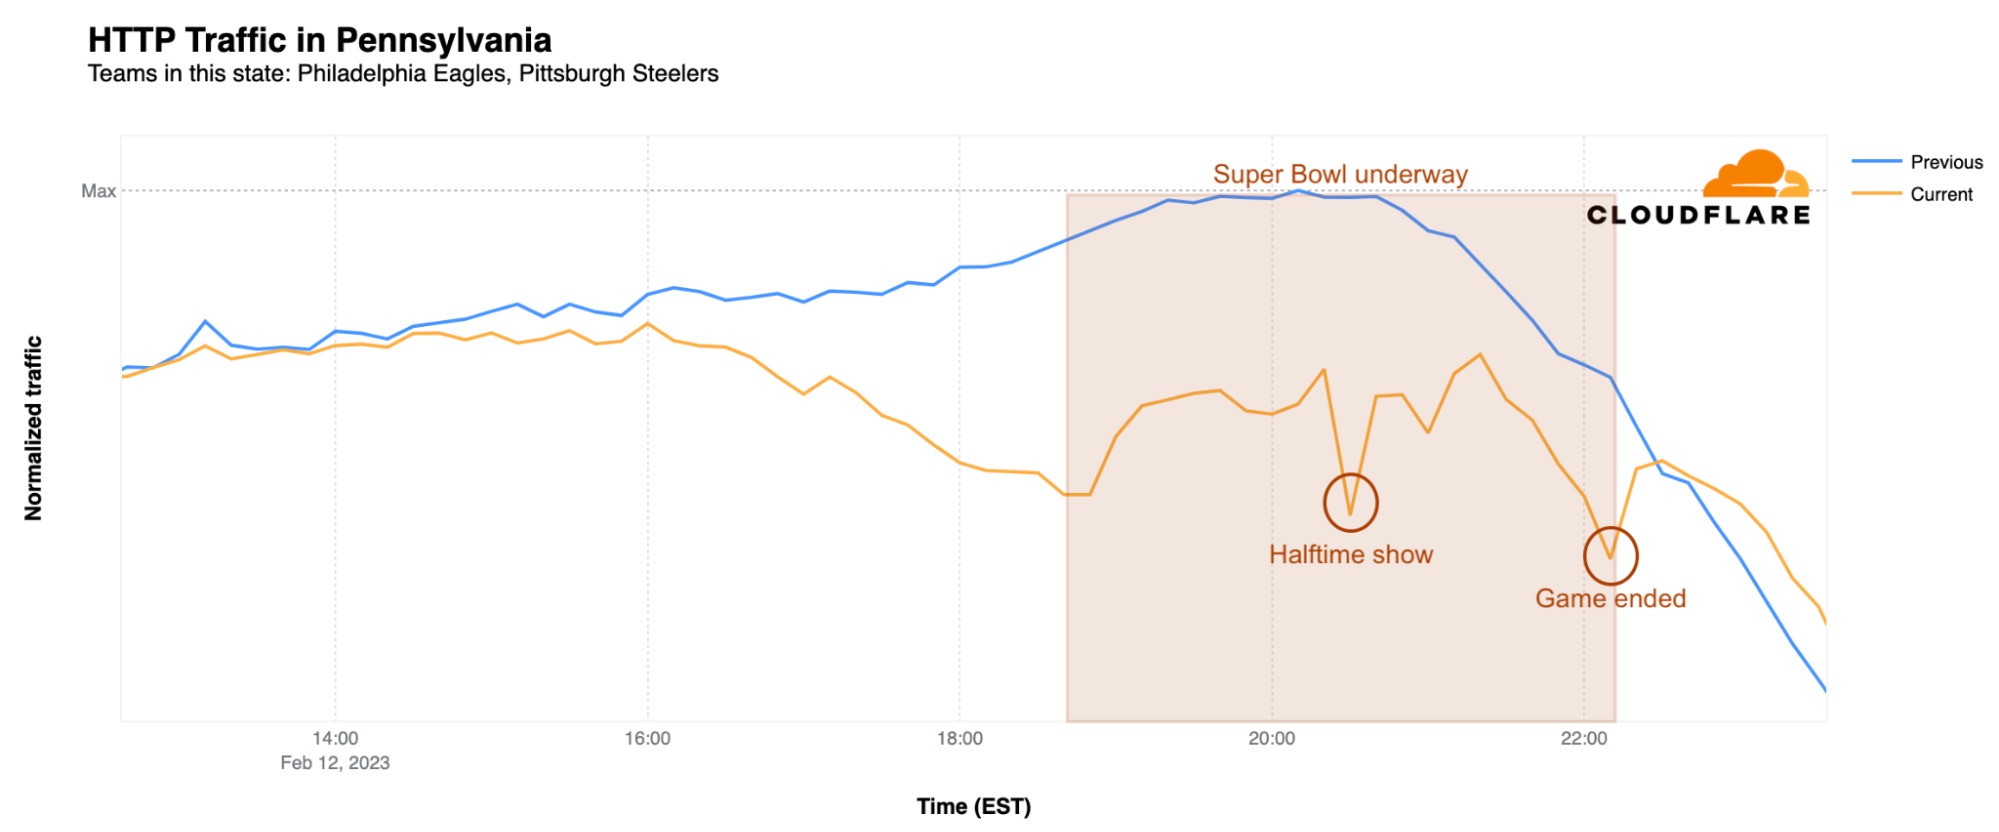
In Pennsylvania, home of the Philadelphia Eagles, traffic began to dip after 15:00 EST and reached its first low point around kickoff, when it was 28% lower than the previous Sunday. Just like in Arizona, the biggest difference was during Rihanna’s halftime show, when it was a whopping 33% lower than usual. However, just a few minutes after the game ended at 22:30 EST, traffic returned to normal.
What about the winning team’s state of Missouri? There, traffic started to decrease only after 17:00 EST and was actually higher than the previous Sunday before that point. With the kickoff came a clear drop, resulting in 28% less traffic than the previous Sunday at the same time. Traffic increased a bit heading towards halftime, but dropped again during Rihanna’s show, when it was 30% lower than usual. The biggest drop in traffic, not surprisingly, was during the exciting moment of the Kansas City Chiefs’ winning field goal. At 22:15 EST, traffic was 33% lower than the previous Sunday. However, after 22:50 EST, Internet traffic in Missouri was back on the fast track, with traffic increasing to levels higher than the previous Sunday.
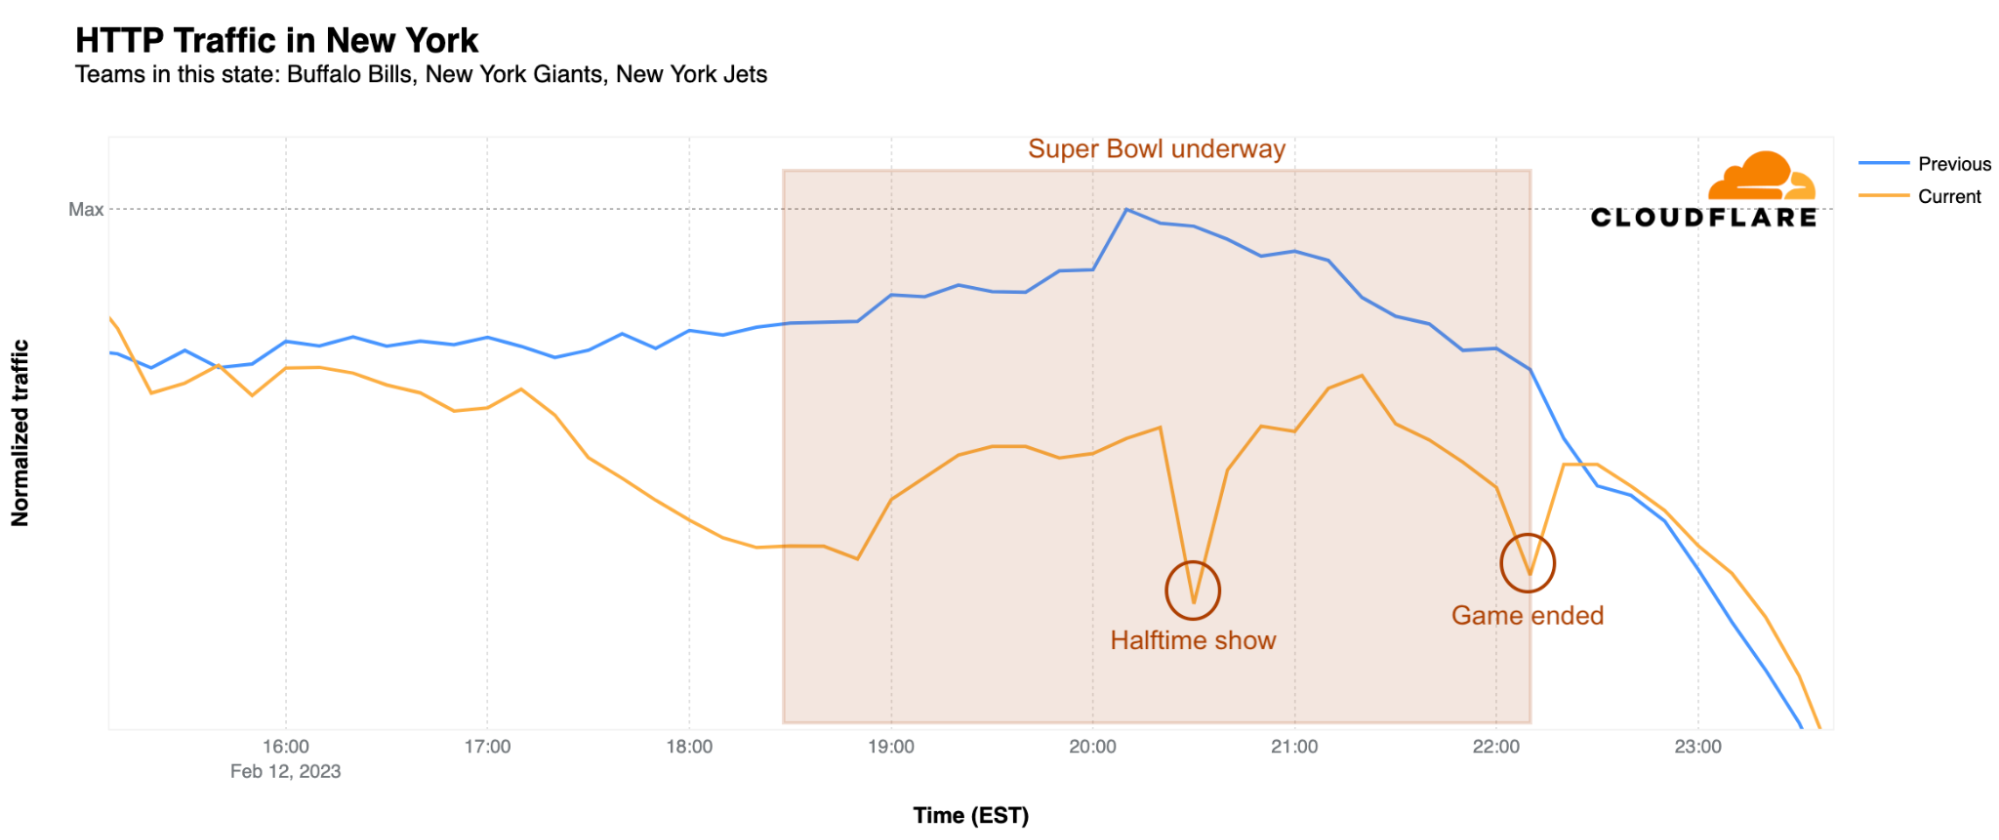
Rihanna’s halftime performance had a clear impact on Internet traffic at a state level, which dropped across all states with NFL teams at the time of her show. Below we take a closer look at the most populous states, among which Pennsylvania, New York and Arizona were winners, with the largest traffic declines. The impacts in Pennsylvania and Arizona are shown above, and the graph below shows the traffic trends seen in New York.
California, Texas, Florida, and New York all had their fair share of Internet traffic dropping before and throughout the game, but it was during the halftime show when things really got interesting. At the time of Rihanna’s performance, Internet traffic in California was 24% lower than the previous Sunday, while in Texas it was 21% below a week earlier, and Florida also saw a 21% drop. Meanwhile, New York had a clear 30% decrease in traffic during the show and, as shown above, Pennsylvania took the cake with a 33% drop. Illinois, Ohio, Georgia, North Carolina, and Michigan were close behind with 23%, 27%, 22%, 25%, and 22% drops respectively.
This seems to be a clear indication that the Super Bowl in general, but also the much-anticipated halftime shows, and the winning celebrations, all have a massive impact on the Internet, causing a noticeable dip in Internet traffic, especially in the state of the winning team.
Do email spammers and scammers take advantage of “The Big Game”?
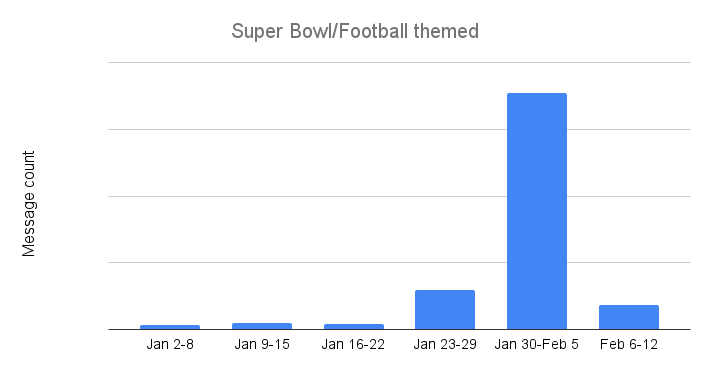
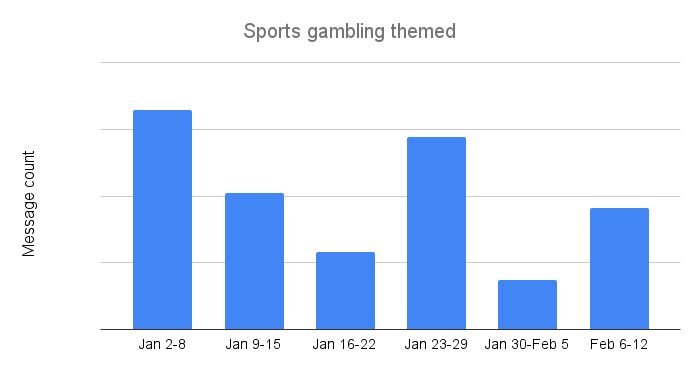
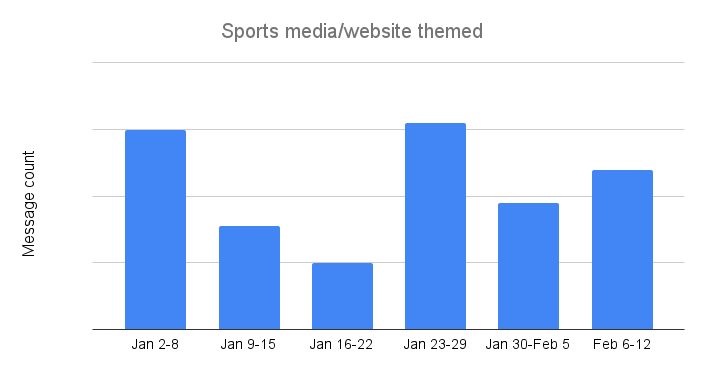
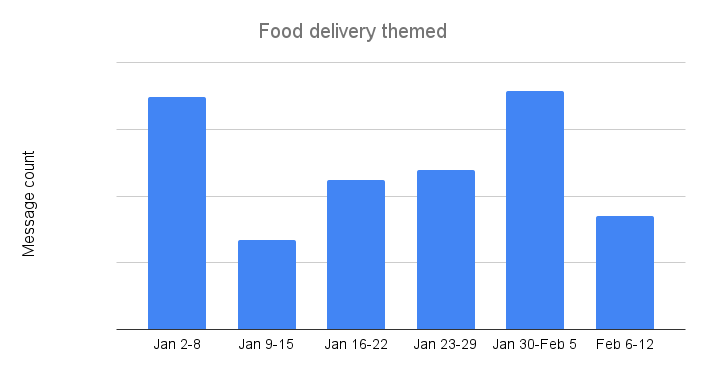
Spammers and scammers will frequently try to take advantage of the popularity of major events when running their campaigns, hoping the tie-in will entice the user to open the message and click on a malicious link, or visit a malicious website where they give up a password or credit card number. Cloudflare Area 1 Email Security analyzed the subject lines of email messages processed by the service in the weeks leading up to the Super Bowl to identify malicious, suspicious, and spam messages across four topic areas: Super Bowl/football, sports gambling, sports media/websites, and food delivery.
As the “regular” season NFL games wrapped up, Super Bowl and football themed email threat volume remained relatively low. However, campaigns clearly picked up between January 23-29 as the message count grew sevenfold. However, campaigns kicked into high gear once the Chiefs and Eagles were headed to the Super Bowl, as the number of identified messages between January 30 and February 5 was nearly six times higher than the previous week. These campaigns quickly ended in the week before the big game, though, as Super Bowl and football themed suspicious, malicious, and spam email volume dropped by nearly 90%.
Overall, the number of sports gambling themed subject lines remained fairly low over the survey period. This is somewhat surprising, given that an increasing number of US states have recently legalized betting on sporting events. Interestingly, the trend was highest at the beginning of the year, although that first week was too late to capture potential interest in college football “bowl” games. However, the weeks ahead of the NFL conference championship games (January 23-29) and the Super Bowl (February 6-12) saw message volume increase to levels nearly 2.5x higher than previous weeks.
Sports media and website themed suspicious, malicious, and spam email messages apparently don’t draw the clicks, because the volume of such messages seen by Cloudflare Area 1 has remained extremely low since the start of the year, but peaked during the week of January 23-29. And although lower in volume, the observed trends were similar to those seen for sports gambling, with peaks during the same weeks.
For many people, the Super Bowl is less about the football game than it is about the commercials and the food, and the growth of food delivery services over the last few years have made it easier to ensure that the snacks and libations never run out during the game. Scammers and spammers have apparently learned to take advantage of this hunger, as food delivery themed email messages saw the highest counts across the four categories reviewed here. Peak message counts were seen the weeks of January 2-8 and January 30-February 5. Message volume the weeks following these peaks fell by over 50% in both cases.
Conclusion
As we have seen time and again, advertising during the Super Bowl can drive significant traffic spikes, and apparently this holds true even if a URL isn’t included as a call to action within the commercial. In addition, the trends observed during the game remain a clear reminder that human behavior drives Internet traffic, especially when the halftime show features a popular singer that last performed live five years ago.
Visit Cloudflare Radar for up to date Internet traffic and attack trends, and follow the Cloudflare Radar Twitter and Mastodon accounts for regular insights on Internet events.
In this blog post, we show you how to create an Amazon QuickSight dashboard to visualize the policy validation findings from AWS Identity and Access Management (IAM) Access Analyzer. You can use this dashboard to better understand your policies and how to achieve least privilege by periodically validating your IAM roles against IAM best practices. This blog post walks you through the deployment for a multi-account environment using AWS Organizations.
Policy validation is a feature of IAM Access Analyzer that guides you to author and validate secure and functional policies with more than 100 policy checks. You can use these checks when creating new policies or to validate existing policies. To learn how to use IAM Access Analyzer policy validation APIs when creating new policies, see Validate IAM policies in CloudFormation templates using IAM Access Analyzer. In this post, we focus on how to validate existing IAM policies.
Approach to visualize IAM Access Analyzer findings
As shown in Figure 1, there are four high-level steps to build the visualization.
Figure 1: Steps to visualize IAM Access Analyzer findings
Collect IAM policies
To validate your IAM policies with IAM Access Analyzer in your organization, start by periodically sending the content of your IAM policies (inline and customer-managed) to a central account, such as your Security Tooling account.
Validate IAM policies
After you collect the IAM policies in a central account, run an IAM Access Analyzer ValidatePolicy API call on each policy. The API calls return a list of findings. The findings can help you identify issues, provide actionable recommendations to resolve the issues, and enable you to author functional policies that can meet security best practices. The findings are stored in an Amazon Simple Storage Service (Amazon S3) bucket. To learn about different findings, see Access Analyzer policy check reference.
Visualize findings
IAM Access Analyzer policy validation findings are stored centrally in an S3 bucket. The S3 bucket is owned by the central (hub) account of your choosing. You can use Amazon Athena to query the findings from the S3 bucket, and then create a QuickSight analysis to visualize the findings.
Publish dashboards
Finally, you can publish a shareable QuickSight dashboard. Figure 2 shows an example of the dashboard.
Figure 2: Dashboard overview
Design overview
This implementation is a serverless job initiated by Amazon EventBridge rules. It collects IAM policies into a hub account (such as your Security Tooling account), validates the policies, stores the validation results in an S3 bucket, and uses Athena to query the findings and QuickSight to visualize them. Figure 3 gives a design overview of our implementation.
Figure 3: Design overview of the implementation
As shown in Figure 3, the implementation includes the following steps:
A time-based rule is set to run daily. The rule triggers an AWS Lambda function that lists the IAM policies of the AWS account it is running in.
When new messages are received, the Amazon SQS queue initiates the second Lambda function. For each message, the Lambda function extracts the policy document and validates it by using the IAM Access Analyzer ValidatePolicy API call.
The Lambda function stores validation results in an S3 bucket.
An AWS Glue table contains the schema for the IAM Access Analyzer findings. Athena natively uses the AWS Glue Data Catalog.
Athena queries the findings stored in the S3 bucket.
QuickSight uses Athena as a data source to visualize IAM Access Analyzer findings.
Benefits of the implementation
By implementing this solution, you can achieve the following benefits:
Store your IAM Access Analyzer policy validation results in a scalable and cost-effective manner with Amazon S3.
Add scalability and fault tolerance to your validation workflow with Amazon SQS.
Partition your evaluation results in Athena and restrict the amount of data scanned by each query, helping to improve performance and reduce cost.
Gain insights from IAM Access Analyzer policy validation findings with QuickSight dashboards. You can use the dashboard to identify IAM policies that don’t comply with AWS best practices and then take action to correct them.
Prerequisites
Before you implement the solution, make sure you’ve completed the following steps:
If you plan to deploy the implementation in a multi-account environment using Organizations, enable all features and enable trusted access with Organizations to operate a service-managed stack set.
Note: This implementation works in accounts that don’t have AWS Lake Formation enabled. If Lake Formation is enabled in your account, you might need to grant Lake Formation permissions in addition to the implementation IAM permissions. For details, see Lake Formation access control overview.
Walkthrough
In this section, we will show you how to deploy an AWS CloudFormation template to your central account (such as your Security Tooling account), which is the hub for IAM Access Analyzer findings. The central account collects, validates, and visualizes your findings.
To deploy the implementation to your multi-account environment
Deploy the CloudFormation stack to your central account.
In your central account, run the following commands in a terminal. These commands clone the GitHub repository and deploy the CloudFormation stack to your central account.
# A) Clone the repository
git clone https://github.com/aws-samples/visualize-iam-access-analyzer-policy-validation-findings.git # B) Switch to the repository's directory
cd visualize-iam-access-analyzer-policy-validation-findings # C) Deploy the CloudFormation stack to your central security account (hub). For<AWSRegion>enter your AWS Region without quotes.
make deploy-hub aws-region=<AWSRegion>
If you want to send IAM policies from other member accounts to your central account, you will need to make note of the CloudFormation stack outputs for SQSQueueUrl and KMSKeyArn when the deployment is complete.
make describe-hub-outputs aws-region=<AWSRegion>
Switch to your organization’s management account and deploy the stack sets to the member accounts. For <SQSQueueUrl> and <KMSKeyArn>, use the values from the previous step.
# Create a CloudFormation stack set to deploy the resources to the member accounts.

make deploy-members SQSQueueUrl=<SQSQueueUrl> KMSKeyArn=<KMSKeyArn< aws-region=<AWSRegion>
To deploy the QuickSight dashboard to your central account
Make sure that QuickSight is using the IAM role aws-quicksight-service-role.
In QuickSight, in the navigation bar at the top right, choose your account (indicated by a person icon) and then choose Manage QuickSight.
On the Manage QuickSight page, in the menu at the left, choose Security & Permissions.
On the Security & Permissions page, under QuickSight access to AWS services, choose Manage.
For IAM role, choose Use an existing role, and then do one of the following:
If you see a list of existing IAM roles, choose the role
# <aws-region> your Quicksight main Region, for example eu-west-1
# <account-id> The ID of your account, for example 123456789012
# <namespace-name> Quicksight namespace, for example default.
# You can list the namespaces by using aws quicksight list-namespaces --aws-account-id<account-id>
aws quicksight list-users --region <aws-region> --aws-account-id <account-id> --namespace <namespace-name>
Make a note of the user’s ARN that you want to grant permissions to list, describe, or update the QuickSight dashboard. This information is found in the arn element. For example, arn:aws:quicksight:us-east-1:111122223333:user/default/User1
To launch the deployment stack for the QuickSight dashboard, run the following command. Replace <quicksight-user-arn> with the user’s ARN from the previous step.
make deploy-dashboard-hub aws-region=<AWSRegion> quicksight-user-arn=<quicksight-user-arn>
Publish and share the QuickSight dashboard with the policy validation findings
You can publish your QuickSight dashboard and then share it with other QuickSight users for reporting purposes. The dashboard preserves the configuration of the analysis at the time that it’s published and reflects the current data in the datasets used by the analysis.
To publish the QuickSight dashboard
In the QuickSight console, choose Analyses and then choose access-analyzer-validation-findings.
In your analysis, in the application bar at the upper right, choose Share, and then choose Publish dashboard.
On the Publish dashboard page, choose Publish new dashboard as and enter IAM Access Analyzer Policy Validation.
Choose Publish dashboard. The dashboard is now published.
On the QuickSight start page, choose Dashboards.
Select the IAM Access Analyzer Policy Validation dashboard. IAM Access Analyzer policy validation findings will appear within the next 24 hours.
Note: If you don’t want to wait until the Lambda function is initiated automatically, you can invoke the function that lists customer-managed policies and inline policies by using the aws lambda invoke AWS CLI command on the hub account and wait one to two minutes to see the policy validation findings:
In the QuickSight console, choose Dashboards and then choose IAM Access Analyzer Policy Validation.
In your dashboard, in the application bar at the upper right, choose Share, and then choose Share dashboard.
On the Share dashboard page that opens, do the following:
For Invite users and groups to dashboard on the left pane, enter a user email or group name in the search box. Users or groups that match your query appear in a list below the search box. Only active users and groups appear in the list.
For the user or group that you want to grant access to the dashboard, choose Add. Then choose the level of permissions that you want them to have.
After you grant users access to a dashboard, you can copy a link to it and send it to them.
Your teams can use this dashboard to better understand their IAM policies and how to move toward least-privilege permissions, as outlined in the section Validate your IAM roles of the blog post Top 10 security items to improve in your AWS account.
Clean up
To avoid incurring additional charges in your accounts, remove the resources that you created in this walkthrough.
Before deleting the CloudFormation stacks and stack sets in your accounts, make sure that the S3 buckets that you created are empty. To delete everything (including old versioned objects) in a versioned bucket, we recommend emptying the bucket through the console. Before deleting the CloudFormation stack from the central account, delete the Athena workgroup.
To delete remaining resources from your AWS accounts
Delete the CloudFormation stack from your central account by running the following command. Make sure to replace <AWSRegion> with your own Region.
make delete-stackset-instances aws-region=<AWSRegion>

# Wait for the operation to finish. You can check its progress on the CloudFormation console.

make delete-stackset aws-region=<AWSRegion>
Delete the QuickSight dashboard by running the following command using the central account credentials. Make sure to replace <AWSRegion> with your own Region.
In this post, you learned how to validate your existing IAM policies by using the IAM Access Analyzer ValidatePolicy API and visualizing the results with AWS analytics tools. By using the implementation, you can better understand your IAM policies and work to reach least privilege in a scalable, fault-tolerant, and cost-effective way. This will help you identify opportunities to tighten your permissions and to grant the right fine-grained permissions to help enhance your overall security posture.
If you have feedback about this post, submit comments in the Comments section below. If you have questions about this post, start a new thread on the AWS Security, Identity, & Compliance re:Post.
Want more AWS Security news? Follow us on Twitter.
The collective thoughts of the interwebz
Manage Consent
To provide the best experiences, we use technologies like cookies to store and/or access device information. Consenting to these technologies will allow us to process data such as browsing behavior or unique IDs on this site. Not consenting or withdrawing consent, may adversely affect certain features and functions.
Functional
Always active
The technical storage or access is strictly necessary for the legitimate purpose of enabling the use of a specific service explicitly requested by the subscriber or user, or for the sole purpose of carrying out the transmission of a communication over an electronic communications network.
Preferences
The technical storage or access is necessary for the legitimate purpose of storing preferences that are not requested by the subscriber or user.
Statistics
The technical storage or access that is used exclusively for statistical purposes.The technical storage or access that is used exclusively for anonymous statistical purposes. Without a subpoena, voluntary compliance on the part of your Internet Service Provider, or additional records from a third party, information stored or retrieved for this purpose alone cannot usually be used to identify you.
Marketing
The technical storage or access is required to create user profiles to send advertising, or to track the user on a website or across several websites for similar marketing purposes.


 SaiKiran Reddy Aenugu is a Data Architect in the Amazon Web Services (AWS) Data Lab. He has 10 years of experience implementing data loading, transformation, and visualization processes. SaiKiran currently helps organizations in North America to adopt modern data architectures such as data lakes and data mesh. He has experience in the retail, airline, and finance sectors.
 Narendra Merla is a Data Architect in the Amazon Web Services (AWS) Data Lab. He has 12 years of experience in designing and productionalizing both real-time and batch-oriented data pipelines and building data lakes on both cloud and on-premises environments. Narendra currently helps organizations in North America to build and design robust data architectures, and has experience in the telecom and finance sectors.