Post Syndicated from Jeremy Winters original https://aws.amazon.com/blogs/big-data/automate-your-validated-dataset-deployment-using-amazon-quicksight-and-aws-cloudformation/
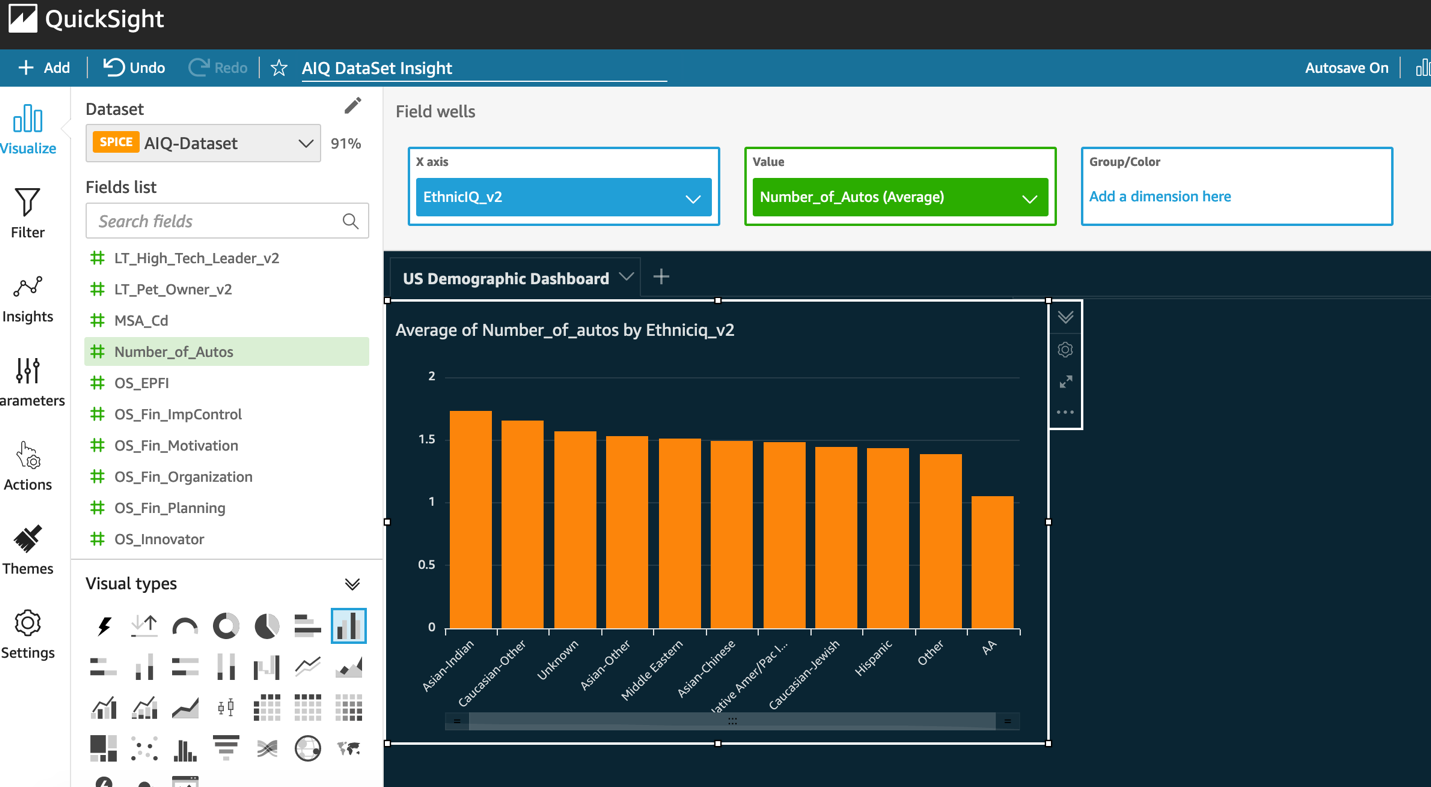
A lot of the power behind business intelligence (BI) and data visualization tools such as Amazon QuickSight comes from the ability to work interactively with data through a GUI. Report authors create dashboards using GUI-based tools, then in just a few clicks can share the dashboards with business users and decision-makers. This workflow empowers authors to create and manage the QuickSight resources and dashboards they’re responsible for providing.
Developer productivity is a great benefit of UI-based development, but enterprise customers often need to consider additional factors in their BI implementation:
- Promoting objects through environments (development, testing, production, and so on)
- Scaling for hundreds of authors and thousands of users
- Implementing data security, such as row-level and column-level rules to filter the data elements visible to specific users
- Regulatory requirements, processes, and compliance controls.
Approaches such as source control-backed CI/CD pipelines allow you to address compliance requirements and security gates with automation. For example, a hypothetical build pipeline for a Java Springboot application may enable developers to build and deploy freely to a dev environment, but the code must pass tests and vulnerability scans before being considered for promotion to upper environments. A human approval step then takes place before the code is released into production. Processes such as this provide quality, consistency, auditability, and accountability for the code being released.
The QuickSight API provides functionality for automation pipelines. Pipeline developers can use the API to migrate QuickSight resources from one environment to another. The API calls that facilitate handling QuickSight datasets enables inspection of the JSON representation of the dataset definition.
This post presents an example of how a QuickSight administrator can automate data resource management and security validation through use of the QuickSight API and AWS CloudFormation.
Solution overview
The model implements security rules that rely on naming conventions for tables and columns as an integral part of the security model. Instead of relying on naming conventions, you may want to use a lookup table or similar approach to store the relationships between data tables and security tables.
We guide you through the following steps:
- Create relational database tables to be secured.
- Create a QuickSight dataset in your dev account.
- Generate a CloudFormation template using a Python script that allows you to enforce row-level and column-level security in each environment. You can customize this script to the needs of your organization.
- Use the generated CloudFormation template to deploy through dev, test, and prod using your change management process.
You can use AWS CloudFormation to manage several types of QuickSight resources, but dataset resources are a critical junction for security, so they are our focus in this post.
To implement data security rules in a large organization, controls must be in place to agree upon and implement the rules from a process perspective. This post dives deep into using code to validate security aspects of your QuickSight deployment, but data security requires more than code. The approaches put forward are intended as a part of a larger change management process, much of which is based around human review and approval.
In addition to having a change management process in place, we suggest managing your AWS resources using a CI/CD pipeline. The nature of change management and CI/CD processes can vary greatly, and are outside the scope of this post.
Prerequisites
This post assumes a basic command of the following:
We don’t go into the broader picture of integrating into a full CI/CD process, so an understanding of CI/CD is helpful, but not required.
Security rules for your organization
Before we can write a script to confirm security rules have been applied correctly, we need to know what the security rules actually are. This means we need to determine the following:
- What – What is the data we are trying to secure? Which fields in the database are sensitive? Which field values will be used to filter access?
- Who – Who are the users and groups that should be provided access to the data and fields we have identified?
In concrete terms, we need to match identities (users and groups) to actual data values (used in row-level security) and sensitive fields (for column-level security). Identities such as users and groups typically correlate to entities in external systems such as Active Directory, but you can use native QuickSight users and groups.
For this post, we define the following rules that indicate the relationship between database objects (tables and fields) and how they should be secured. Keep in mind that these example rules may not apply to every organization. Security should be developed to match your requirements and processes.
- Any field name with
_sensitive appended to it is identified as containing sensitive data. For example, a column named salary_usd_sensitive should be restricted. For our scenario, we say that the user should be a member of the QuickSight restricted group in order to access sensitive fields. No other groups are allowed access to these fields.
- For a given table, a companion table with
_rls appended to the name contains the row-level security rules used to secure the table. In this model, the row-level security rules for the employees table are found in the employees_rls table.
- Row-level security rules must be sourced 100% from the underlying data store. This means that you can’t upload rules via the QuickSight console, or use custom SQL in QuickSight to create the rules. Rules can be provided as views (if supported by the underlying data store) as long as the view definition is managed using a change management process.
- The dataset name should match the name of the underlying database table.
These rules rely on a well-structured change management process for the database. If users and developers have access to change database objects in production, the rules won’t carry much weight. For examples of automated schema management using open-source CI/CD tooling, refer to Deploy, track, and roll back RDS database code changes using open source tools Liquibase and Jenkins and How to Integrate Amazon RDS Schema Changes into CI/CD Pipelines with GitLab and Liquibase.
From the QuickSight perspective, our database becomes the source of the “what” and “who” we discussed earlier. QuickSight doesn’t own the security rules, it merely implements the rules as defined in the database.
Security rule management with database objects
For this post, we source data from a Postgres database using a read-only user created for QuickSight.
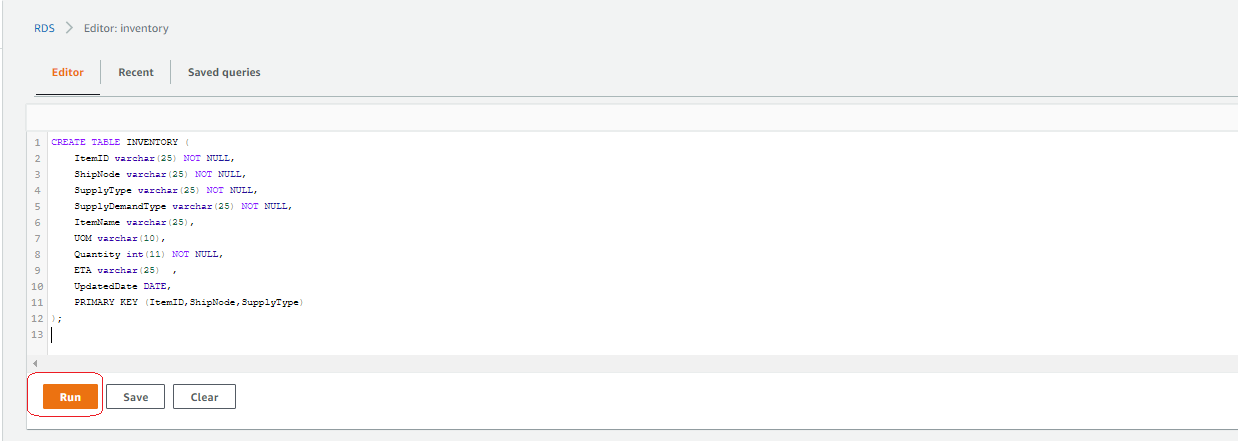
First, we create our schema and a data table with a few rows inserted:
create schema if not exists ledger;

--the table we are securing
drop table if exists ledger.transactions;
create table if not exists ledger.transactions (
    txn_id integer,
    txn_type varchar(100),
    txn_desc varchar(100),
    txn_amt float,
    department varchar(100),
    discount_sensitive float
);

insert into ledger.transactions (
    txn_id,
    txn_type,
    txn_desc,
    txn_amt,
    department,
    discount_sensitive
)
values
(1, 'expense', 'commission', -1000.00, 'field sales', 0.0),
(2, 'revenue', 'widgets',  15000.00, 'field sales', 1000.00),
(3, 'revenue', 'interest', 1000.00, 'corporate', 0.0),
(4, 'expense', 'taxes', -1234.00, 'corporate', 0.0),
(5, 'revenue', 'doodads', 1000.00, 'field sales', 100.0)
;
Note the field discount_sensitive. In our security model, any field name with _sensitive appended to it is identified as containing sensitive data. This information is used later when we implement column-level security. In our example, we have the luxury of using naming conventions to tag the sensitive fields, but that isn’t always possible. Other options could involve the use of SQL comments, or creating a table that provides a lookup for sensitive fields. Which method you choose depends upon your data and requirements, and should be supported by a change management process.
Row-level security table
The following SQL creates a table containing the row-level security rules for the ledger.transactions table, then inserts rules that match the example discussed earlier:
drop table if exists ledger.transactions_rls;
create table ledger.transactions_rls (
    groupname varchar(100),
    department varchar(1000)
);


insert into ledger.transactions_rls (groupname, department)
values
('restricted', null), --null indicates all values
('anybody', 'field sales');
For more information about how to restrict access to a dataset using row-level security, refer to Using row-level security (RLS) with user-based rules to restrict access to a dataset
These rules match the specified QuickSight user groups to values in the department field of the transactions table.
Our last step in Postgres is to create a user that has read-only access to our tables. All end-user or SPICE refresh queries from QuickSight are run using this user. See the following code:
drop role if exists qs_user;
create role qs_user login password 'GETABETTERPASSSWORD';
grant connect on database quicksight TO qs_user;
grant usage on schema ledger to qs_user;
grant select on ledger.transactions to qs_user;
grant select on ledger.transactions_rls to qs_user;
Create user groups
Our security model provides permissions based on group membership. Although QuickSight allows for these groups to be sourced from external systems such as Active Directory, our example uses native QuickSight groups.
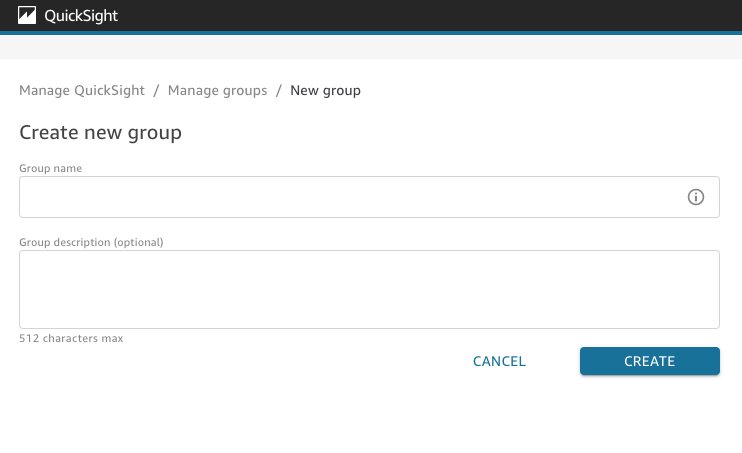
We create our groups using the following AWS Command Line Interface (AWS CLI) commands. Take note of the restricted group we’re creating; this is the group we use to grant access to sensitive data columns.
aws quicksight create-group \
--aws-account-id YOUR_AWS_ACCOUNT_ID_HERE \
--namespace default \
--group-name restricted

aws quicksight create-group \
--aws-account-id YOUR_AWS_ACCOUNT_ID_HERE \
--namespace default \
--group-name anybody
You can also add a user to your group with the following code:
aws quicksight create-group-membership \
--aws-account-id YOUR_AWS_ACCOUNT_ID_HERE \
--namespace default \
--group-name anybody \
--member-name [email protected]
The Python script
Now that we have set up our database and groups, we switch focus to the Python script used for the following actions:
- Extracting the definition of a manually created dataset using the QuickSight API
- Ensuring that the dataset definition meets security standards
- Restructuring the dataset definition into the format of a CloudFormation template
- Writing the CloudFormation template to a JSON file
In the header of the script, you can see the following variables, which you should set to values in your own AWS environment:
# Parameters for the source data set
region_name = 'AWS_REGION_NAME'
aws_account_id = "AWS_ACCOUNT_ID"
source_data_set_id = "ID_FOR_THE_SOURCE_DATA_SET"

# Parameters are used when creating the cloudformation template
target_data_set_name = "DATA_SET_DISPLAY_NAME"
target_data_set_id = "NEW_DATA_SET_ID"
template_file_name = "dataset.json"
QuickSight datasets have a name and an ID. The name is displayed in the QuickSight UI, and the ID is used to reference the dataset behind the scenes. The ID must be unique for a given account and Region, which is why QuickSight uses UUIDs by default, but you can use any unique string.
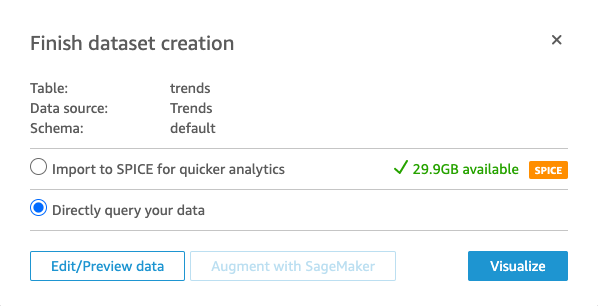
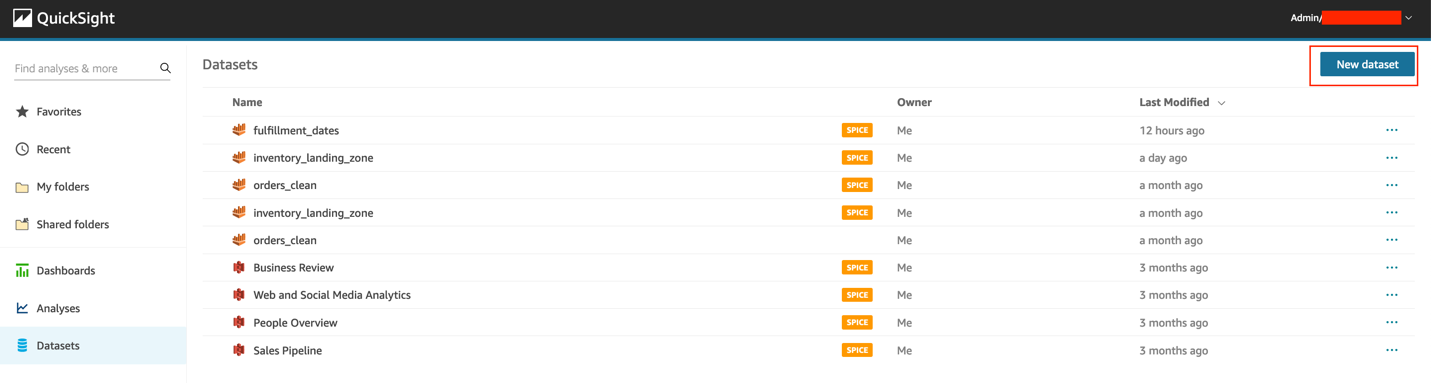
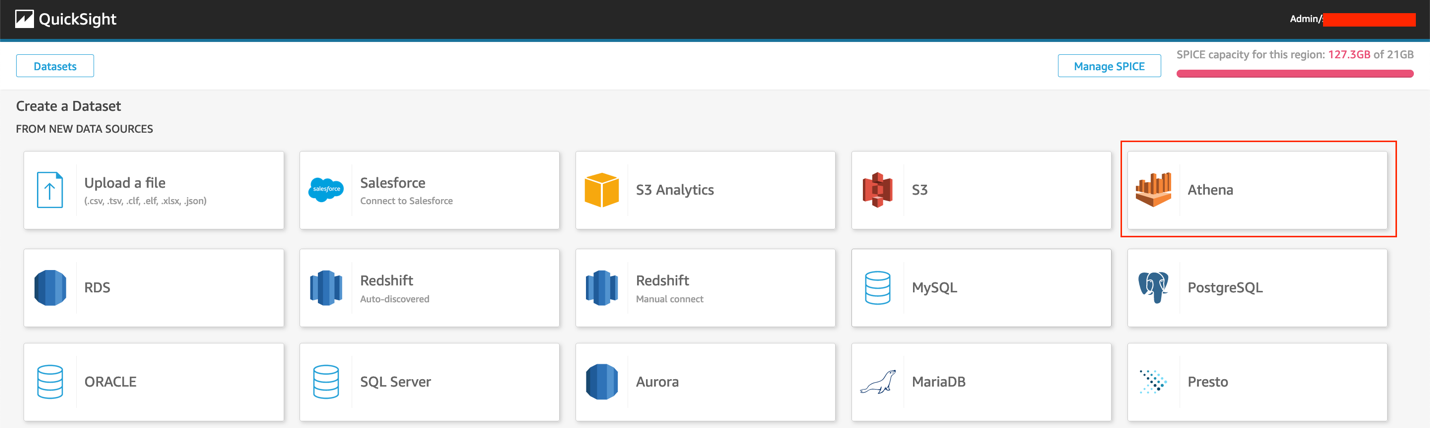
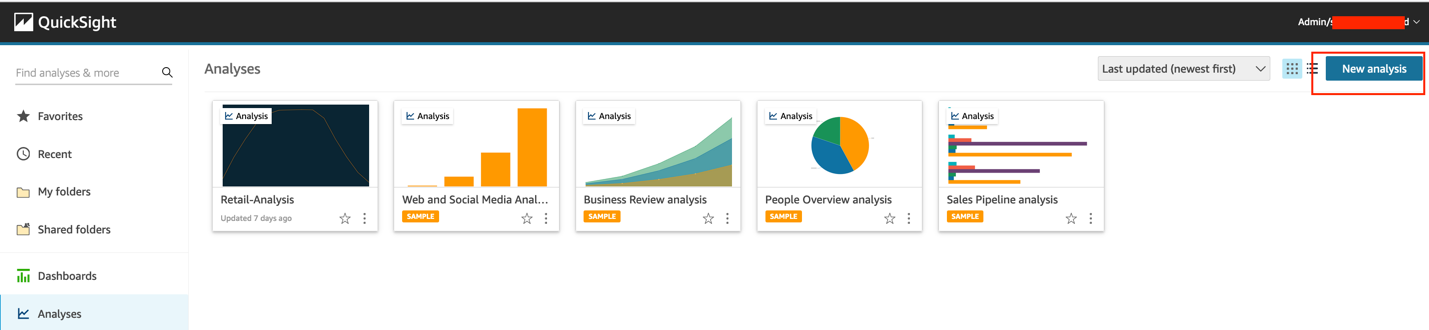
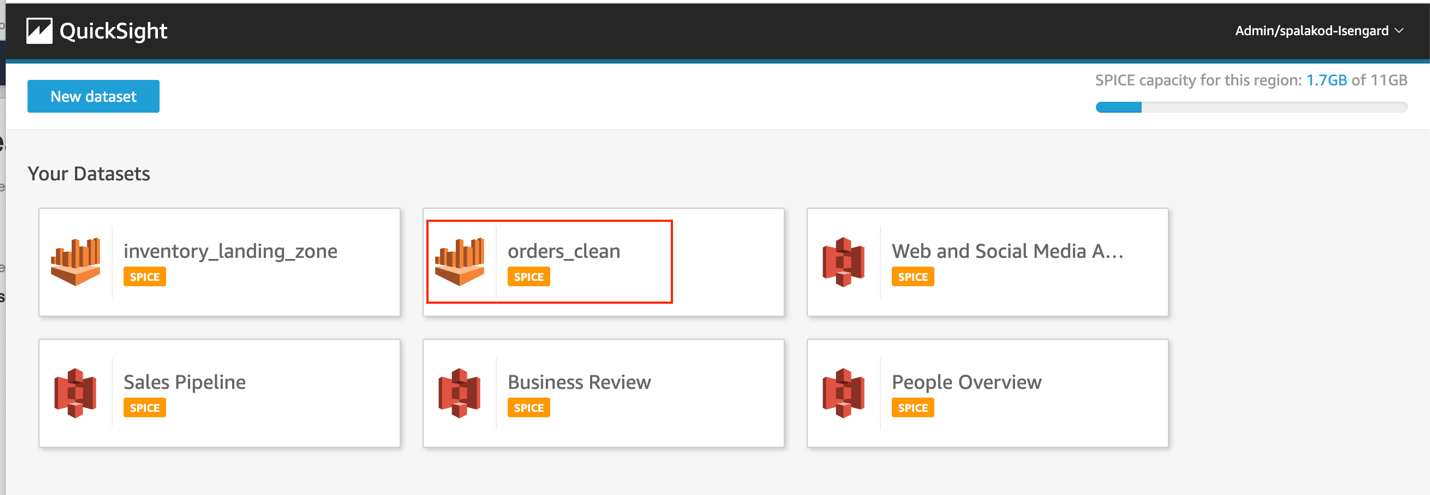
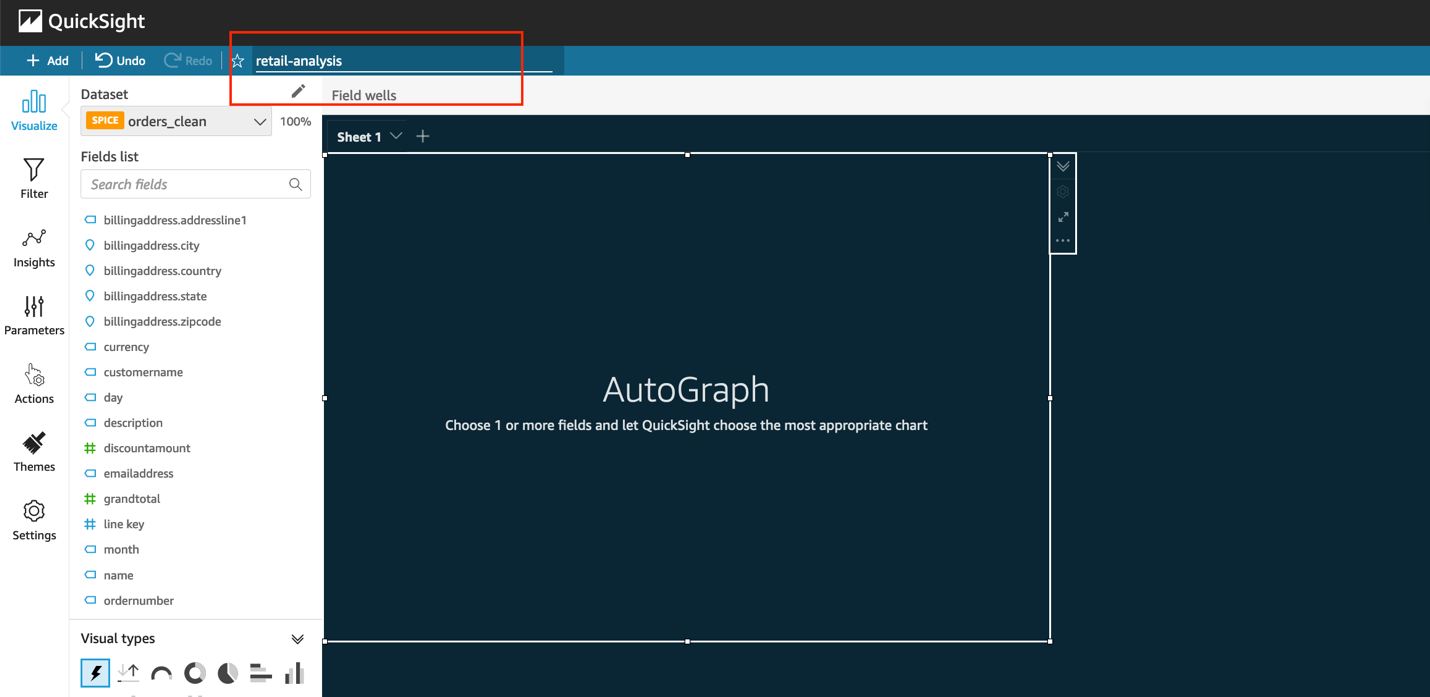
Create the datasets
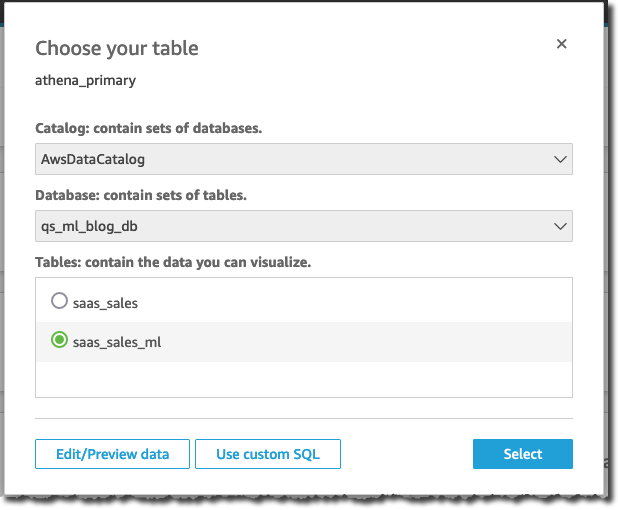
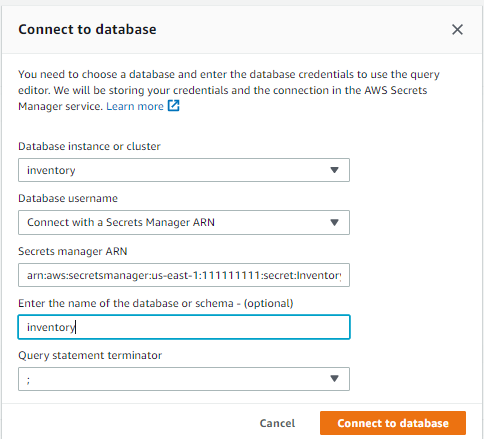
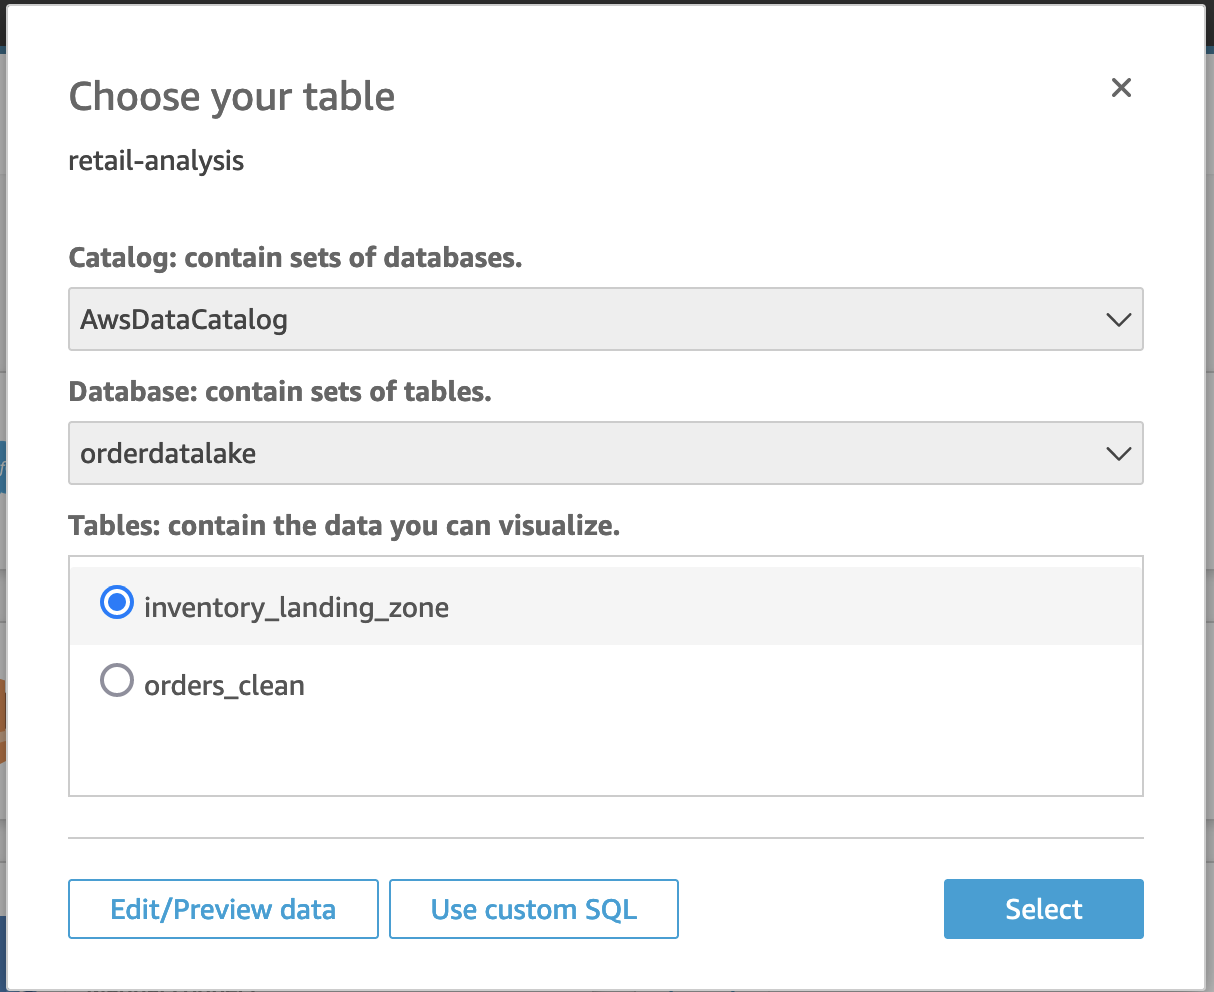
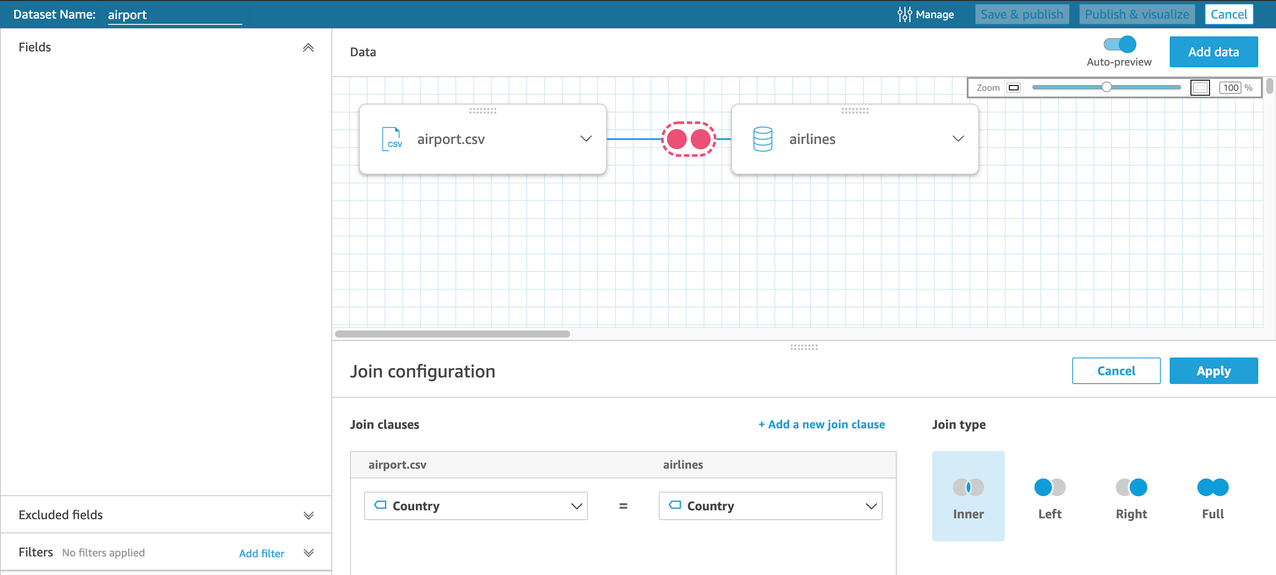
You can use the QuickSight GUI or Public API to create a dataset for the transactions_rls and transactions tables. For instructions, refer to Creating a dataset from a database. Connect to the database, create the datasets, then apply transactions_rls as the row-level security for the transactions dataset. You can use the following list-data-sets AWS CLI call to verify that your tables were created successfully:
$ aws quicksight list-data-sets --aws-account-id YOURACCOUNT
{
    "DataSetSummaries": [
       {
            "Arn": "arn:aws:quicksight:us-west-2:YOURACCOUNT:dataset/<ID>",
            "DataSetId": "<ID>",
            "Name": "transactions",
            "CreatedTime": "2021-09-15T15:41:56.716000-07:00",
            "LastUpdatedTime": "2021-09-15T16:38:03.658000-07:00",
            "ImportMode": "SPICE",
            "RowLevelPermissionDataSet": {
                "Namespace": "default",
                "Arn": "arn:aws:quicksight:us-west-2: YOURACCOUNT:dataset/<RLS_ID>",
                "PermissionPolicy": "GRANT_ACCESS",
                "FormatVersion": "VERSION_1",
                "Status": "ENABLED"
            },
            "RowLevelPermissionTagConfigurationApplied": false,
            "ColumnLevelPermissionRulesApplied": true
        },
        {
            "Arn": "arn:aws:quicksight:us-west-2: YOURACCOUNT:dataset/<RLS_ID>",
            "DataSetId": "<RLS_ID>",
            "Name": "transactions_rls",
            "CreatedTime": "2021-09-15T15:42:37.313000-07:00",
            "LastUpdatedTime": "2021-09-15T15:42:37.520000-07:00",
            "ImportMode": "SPICE",
            "RowLevelPermissionTagConfigurationApplied": false,
            "ColumnLevelPermissionRulesApplied": false
        }
    ]
}
Script overview
Our script is based around the describe_data_set method of the Boto3 QuickSight client. This method returns a Python dictionary containing all the attributes associated with a dataset resource. Our script analyzes these dictionaries, then coerces them into the structure required for dataset creation using AWS CloudFormation. The structure of the describe_data_set method and the AWS::QuickSight::DataSet CloudFormation resource are very similar, but not quite identical.
The following are the top-level fields in the response for the Boto3 QuickSight client describe_data_set method:
{
    'DataSet': {
        'Arn': 'string',
        'DataSetId': 'string',
        'Name': 'string',
        'CreatedTime': datetime(2015, 1, 1),
        'LastUpdatedTime': datetime(2015, 1, 1),
        'PhysicalTableMap': {},
        'LogicalTableMap': {...},
        'OutputColumns': [...],
        'ImportMode': 'SPICE'|'DIRECT_QUERY',
        'ConsumedSpiceCapacityInBytes': 123,
        'ColumnGroups': [...],
        'FieldFolders': {...},
        'RowLevelPermissionDataSet': {...},
        'ColumnLevelPermissionRules': [...]
    },
    'RequestId': 'string',
    'Status': 123
}
Our script converts the response from the API to the structure required for creating a dataset using AWS CloudFormation.
The following are the top-level fields in the AWS::QuickSight::DataSet CloudFormation resource:
{
  "Type" : "AWS::QuickSight::DataSet",
  "Properties" : {
      "AwsAccountId" : String,
      "ColumnGroups" : [ ColumnGroup, ... ],
      "ColumnLevelPermissionRules" : [ ColumnLevelPermissionRule, ... ],
      "DataSetId" : String,
      "FieldFolders" : {Key : Value, ...},
      "ImportMode" : String,
      "IngestionWaitPolicy" : IngestionWaitPolicy,
      "LogicalTableMap" : {Key : Value, ...},
      "Name" : String,
      "Permissions" : [ ResourcePermission, ... ],
      "PhysicalTableMap" : {Key : Value, ...},
      "RowLevelPermissionDataSet" : RowLevelPermissionDataSet,
      "Tags" : [ Tag, ... ]
    }
}
The key differences between both JSON structures are as follows:
describe_data_set contains Arn, CreatedTime, and LastUpdatedTime, which are useful fields but only relevant to an existing resource- AWS CloudFormation requires
AwsAccountId when creating the resource
- AWS CloudFormation accepts tags for the dataset, but
describe_data_set doesn’t provide them
- The AWS CloudFormation
Permissions property allows for assigning AWS Identity and Access Management (IAM) permissions at the time of creation
Our script is able to selectively choose the top-level properties we want from the describe_data_set response, then add the fields that AWS CloudFormation requires for resource creation.
Validate security
Before the script creates the CloudFormation template, it performs validations to ensure that our dataset conforms to the defined security rules.
The following is the snippet from our script that performs validation for row-level security:
if 'RowLevelPermissionDataSet' in describe_response['DataSet']:
    if describe_response['DataSet']['RowLevelPermissionDataSet'] is None:
        raise Exception("row level permissions must be applied!")
    else:
        # now we look up the rls data set so that we can confirm that it conforms to our rules
        rls_dataset_id = describe_response['DataSet']['RowLevelPermissionDataSet']['Arn'].split('/')[-1]
        rls_response = client.describe_data_set(
            AwsAccountId = aws_account_id,
            DataSetId = rls_dataset_id
        )

        rls_table_map = rls_response['DataSet']['PhysicalTableMap']

        # rls table must not be custom SQL
        if 'CustomSql' in rls_table_map[list(rls_table_map.keys())[0]]:
            raise Exception("RLS data set can not contain custom SQL!")

        # confirm that the database table name is what we expect it to be
        if rls_response['DataSet']['Name'] != describe_response['DataSet']['Name'] + '_rls':
            raise Exception("RLS data set name must match pattern tablename_rls!")
The steps in the code are as follows:
- Ensure that any row-level security is applied (this is the bare minimum).
- Look up the dataset that contains the row-level security rules using another Boto3 call.
- Confirm that the row-level security dataset is not custom SQL.
- Confirm that the name of the table is as expected, with
_rls appended to the name of the table being secured.
The use of custom SQL for sourcing row-level security rules isn’t secure in our case, because a QuickSight developer could use SQL to alter the underlying rules. Because of this, our model requires that a physical table from the dataset is used as the row-level security rule source. Of course, it’s possible to use a view in the database to provide the rules. A view is okay because the definition (in our scenario) is governed by a change management process, as opposed to the custom SQL, which the QuickSight developer can create.
The rules being implemented for your specific organization will be different. You may need to connect to a database directly from your Python script in order to validate the dataset was created in a secure manner. Regardless of your actual rules, the describe_data_set API method provides you the details you need to begin validation of the dataset.
Column-level security
Our model for column-level security indicates that any database field name that ends in _sensitive should only be accessible to members of a QuickSight group named restricted. Instead of validating that the dataset has the column-level security rules applied correctly, we simply enforce the rules directly in two steps:
- Identify the sensitive fields.
- Create a dictionary and add it to our dataset with the key
ColumnLevelPermissionRules.
To identify the sensitive fields, we create a list and iterate through the input columns of the physical table:
sensitive_fields = []
input_columns = physical_table_map[list(physical_table_map.keys())[0]]["RelationalTable"]["InputColumns"]
for input_column in input_columns:
    field_name = input_column['Name']
    if field_name[-10:len(field_name)] == '_sensitive':
        sensitive_fields.append(field_name)
The result is a list of sensitive fields. We can then take this list and integrate it into the dataset through the use of a dictionary:
if len(sensitive_fields) > 0:
    data_set["ColumnLevelPermissionRules"] = [
        {
            "Principals": [
                {"Ref": "RestrictedUserGroupArn"}
            ],
            "ColumnNames": sensitive_fields
        }
    ]
Instead of specifying a specific principal, we reference the CloudFormation template parameter RestrictedUserGroupArn. The ARN for the restricted group is likely to vary, especially if you’re deploying to another AWS account. Using a template parameter allows us to specify the ARN at the time of dataset creation in the new environment.
Access to the dataset QuickSight resources
The Permissions structure is added to the definition for each dataset:
"Permissions": [
    {
        "Principal": {
            "Ref": "QuickSightAdminPrincipal"
        },
        "Actions": [
            "quicksight:DescribeDataSet",
            "quicksight:DescribeDataSetPermissions",
            "quicksight:PassDataSet",
            "quicksight:DescribeIngestion",
            "quicksight:ListIngestions",
            "quicksight:UpdateDataSet",
            "quicksight:DeleteDataSet",
            "quicksight:CreateIngestion",
            "quicksight:CancelIngestion",
            "quicksight:UpdateDataSetPermissions"
        ]
    }
]
A value for the QuickSightAdminPrincipal CloudFormation template parameter is provided at the time of stack creation. The preceding structure provides the principal access to manage the QuickSight dataset resource itself. Note that this is not the same as data access (though an admin user could manually remove the row-level security rules). Row-level and column-level security rules indicate whether a given user has access to specific data, whereas these permissions allow for actions on the definition of the dataset, such as the following:
- Updating or deleting the dataset
- Changing the security permissions
- Initiating and monitoring SPICE refreshes
End-users don’t require this access in order to use a dashboard created from the dataset.
Run the script
Our script requires you to specify the dataset ID, which is not the same as the dataset name. To determine the ID, use the AWS CLI list-data-sets command.
To set the script parameters, you can edit the following lines to match your environment:
# parameters for the source data set
region_name = 'us-west-2'
aws_account_id = "<YOUR_ACCOUNT_ID>"
source_data_set_id = "<SOURCE_DATA_SET_ID>"

# parameters for the target data set
target_data_set_name = "DATA_SET_PRESENTATION_NAME"
target_data_set_id = "NEW_DATA_SET_ID"
The following snippet runs the Python script:
$ quicksight_security % python3 data_set_to_cf.py
row level security validated!
the following sensitive fields were found: ['discount_sensitive']
cloudformation template written to dataset.json
cli-input-json file written to params.json
CloudFormation template
Now that the security rules have been validated, our script can generate the CloudFormation template. The describe_response_to_cf_data_set method accepts a describe_data_set response as input (along with a few other parameters) and returns a dictionary that reflects the structure of an AWS::QuickSight::DataSet CloudFormation resource. Our code uses this method once for the primary dataset, and again for the _rls rules. This method handles selecting values from the response, prunes some unnecessary items (such as empty tag lists), and replaces a few values with CloudFormation references. These references allow us to provide parameter values to the template, such as QuickSight principals and the data source ARN.
You can view the template using the cat command:
$ quicksight_security % cat dataset.json
{
    "AWSTemplateFormatVersion": "2010-09-09",
    "Description": "Creates a QuickSight Data Set",
    "Parameters": {
        "DataSourceArn": {
            "Type": "String",
            "Description": "ARN for Postgres data source resource"
        },
        "QuickSightOwnerPrincipal": {
            "Type": "String",
            "Description": "ARN for a QuickSight principal who will be granted API access to the datasets"
        },
        "RestrictedUserGroupArn": {
            "Type": "String",
            "Description": "ARN for a QuickSight principal who will be granted access to sensitive fields"
        }
    },
    "Resources": {
        "NewDataSet": {
            "Type": "AWS::QuickSight::DataSet",
            "Properties": {
                "DataSetId": "NEW_DATA_SET_ID",
                "Name": "DATA_SET_PRESENTATION_NAME",
                "AwsAccountId": {
                    "Ref": "AWS::AccountId"
                },
                "Permissions": [
                    {
                        "Principal": {
                            "Ref": "QuickSightAdminPrincipal"
                        },
                        "Actions": [
                            "quicksight:DescribeDataSet",
                            "quicksight:DescribeDataSetPermissions",
                            "quicksight:PassDataSet",
                            "quicksight:DescribeIngestion",
                            "quicksight:ListIngestions",
                            "quicksight:UpdateDataSet",
                            "quicksight:DeleteDataSet",
                            "quicksight:CreateIngestion",
                            "quicksight:CancelIngestion",
                            "quicksight:UpdateDataSetPermissions"
                        ]
                    }
                ],
                "FieldFolders": {},
                "ImportMode": "DIRECT_QUERY",
                "LogicalTableMap": {
                    "e2305db4-2c79-4ac4-aff5-224b8c809767": {
                        "Alias": "transactions",
                        "DataTransforms": [
                            {
                                "ProjectOperation": {
                                    "ProjectedColumns": [
                                        "txn_id",
                                        "txn_type",
                                        "txn_desc",
                                        "txn_amt",
                                        "department",
                                        "discount_sensitive"
                                    ]
                                }
                            }
                        ],
                        "Source": {
                            "PhysicalTableId": "someguid-2c79-4ac4-aff5-224b8c809767"
                        }
                    }
                },
                "PhysicalTableMap": {
                    "e2305db4-2c79-4ac4-aff5-224b8c809767": {
                        "RelationalTable": {
                            "DataSourceArn": {
                                "Ref": "DataSourceArn"
                            },
                            "Schema": "ledger",
                            "Name": "transactions",
                            "InputColumns": [
                                {
                                    "Name": "txn_id",
                                    "Type": "INTEGER"
                                },
                                {
                                    "Name": "txn_type",
                                    "Type": "STRING"
                                },
                                {
                                    "Name": "txn_desc",
                                    "Type": "STRING"
                                },
                                {
                                    "Name": "txn_amt",
                                    "Type": "DECIMAL"
                                },
                                {
                                    "Name": "department",
                                    "Type": "STRING"
                                },
                                {
                                    "Name": "discount_sensitive",
                                    "Type": "DECIMAL"
                                }
                            ]
                        }
                    }
                },
                "RowLevelPermissionDataSet": {
                    "Namespace": "default",
                    "Arn": {
                        "Fn::GetAtt": [
                            "NewDataSetRLS",
                            "Arn"
                        ]
                    },
                    "PermissionPolicy": "GRANT_ACCESS",
                    "FormatVersion": "VERSION_1"
                },
                "ColumnLevelPermissionRules": [
                    {
                        "Principals": [
                            {
                                "Ref": "RestrictedUserGroupArn"
                            }
                        ],
                        "ColumnNames": [
                            "discount_sensitive"
                        ]
                    }
                ]
            }
        },
        "NewDataSetRLS": {
            "Type": "AWS::QuickSight::DataSet",
            "Properties": {
                "DataSetId": "NEW_DATA_SET_ID_rls",
                "Name": "DATA_SET_PRESENTATION_NAME_rls",
                "AwsAccountId": {
                    "Ref": "AWS::AccountId"
                },
                "Permissions": [
                    {
                        "Principal": {
                            "Ref": "QuickSightAdminPrincipal"
                        },
                        "Actions": [
                            "quicksight:DescribeDataSet",
                            "quicksight:DescribeDataSetPermissions",
                            "quicksight:PassDataSet",
                            "quicksight:DescribeIngestion",
                            "quicksight:ListIngestions",
                            "quicksight:UpdateDataSet",
                            "quicksight:DeleteDataSet",
                            "quicksight:CreateIngestion",
                            "quicksight:CancelIngestion",
                            "quicksight:UpdateDataSetPermissions"
                        ]
                    }
                ],
                "FieldFolders": {},
                "ImportMode": "SPICE",
                "LogicalTableMap": {
                    "someguid-51d7-43c4-9f8c-c60a286b0507": {
                        "Alias": "transactions_rls",
                        "DataTransforms": [
                            {
                                "ProjectOperation": {
                                    "ProjectedColumns": [
                                        "groupname",
                                        "department"
                                    ]
                                }
                            }
                        ],
                        "Source": {
                            "PhysicalTableId": "someguid-51d7-43c4-9f8c-c60a286b0507"
                        }
                    }
                },
                "PhysicalTableMap": {
                    "someguid-51d7-43c4-9f8c-c60a286b0507": {
                        "RelationalTable": {
                            "DataSourceArn": {
                                "Ref": "DataSourceArn"
                            },
                            "Schema": "ledger",
                            "Name": "transactions_rls",
                            "InputColumns": [
                                {
                                    "Name": "groupname",
                                    "Type": "STRING"
                                },
                                {
                                    "Name": "department",
                                    "Type": "STRING"
                                }
                            ]
                        }
                    }
                }
            }
        }
    }
}
You can deploy this template directly into AWS via the CloudFormation console. You are required to provide the following parameters:
- DataSourceArn – A QuickSight dataset is a reference to a table or other database object. In order for this object to be accessed, we need to specify a QuickSight data source resource that facilitates the connection.
- QuickSightAdminPrincipal – The IAM principal allowing access to the data source resource via AWS API calls. You can exclude the IAM permissions from this script and template if your existing security policies automatically provide access to the appropriate users and groups.
- RestrictedUserGroupArn – The ARN of the QuickSight group that is granted access to the sensitive columns.
You can also deploy the template using the AWS CLI. Although it’s possible to pass in all the parameters directly via the command line, you may find it a bit clunky when entering long values. To simplify this, our script generates a params.json file structured to capture all the parameters required by the template:
{
    "Parameters": [
        {
            "ParameterKey": "DataSourceArn",
            "ParameterValue": "YOUR_DATA_SOURCE_ARN_HERE"
        },
        {
            "ParameterKey": "QuickSightAdminPrincipal",
            "ParameterValue": "YOUR_ADMIN_GROUP_PRINCIPAL_HERE"
        },
        {
            "ParameterKey": "RestrictedUserGroupArn",
            "ParameterValue": "YOUR_RESTRICTED_USER_GROUP_ARN_HERE"
        }
    ]
}
Use the following command to build the stack, with params.json as input:
aws cloudformation create-stack \
--stack-name SecuredDataSet \
--template-body file://dataset.json \
--cli-input-json file://params.json
You can use the AWS CloudFormation console to monitor the stack progress. When the creation is complete, you should see your new dataset in QuickSight!
Conclusion
Though the functionality is relatively new, I consider the API and AWS CloudFormation capabilities to be one of QuickSight’s biggest strengths. Automated validation and enforcement of security rules allows for scale and better security. Being able to manage dataset definitions using AWS CloudFormation provides repeatability, and all of this sets you up for automation. The API and AWS CloudFormation provide tooling to customize QuickSight to suit your workflow, bringing BI into your organization’s cloud management strategy.
If you are looking for related information about dashboard management and migration in QuickSight, refer to Migrate Amazon QuickSight across AWS accounts.
About the Author
 Jeremy Winters is an Architect in the AWS Data Lab, where he helps customers design and build data applications to meet their business needs. Prior to AWS, Jeremy built cloud and data applications for consulting customers across a variety of industries.


 Ashok Dasineni is a Solutions Architect for Amazon QuickSight. Before joining AWS, Ashok worked with clients and organizations in Banking and financial domain, focusing on fraud research and prevention. He designed and implemented innovative solutions to improve business process, reduce cost and increase revenue, enabling companies around the world to achieve their highest potential through data.
 Raji Sivasubramaniam is a Sr. Solutions Architect at AWS, focusing on Analytics. Raji is specialized in architecting end-to-end Enterprise Data Management, Business Intelligence and Analytics solutions for Fortune 500 and Fortune 100 companies across the globe. She has in-depth experience in integrated healthcare data and analytics with wide variety of healthcare datasets including managed market, physician targeting and patient analytics.
 Srikanth Baheti is a Specialized World Wide Sr. Solution Architect for Amazon QuickSight. He started his career as a consultant and worked for multiple private and government organizations. Later he worked for PerkinElmer Health and Sciences & eResearch Technology Inc, where he was responsible for designing and developing high traffic web applications, highly scalable and maintainable data pipelines for reporting platforms using AWS services and Serverless computing.


 Francesco Marelli is a principal solutions architect at Amazon Web Services. He is specialized in the design and implementation of analytics, data management, and big data systems. Francesco also has a strong experience in systems integration and design and implementation of applications. He is passionate about music, collecting vinyl records, and playing bass.


 Kareem Syed-Mohammed is a Product Manager at Amazon QuickSight. He focuses on embedded analytics, APIs, and developer experience. Prior to QuickSight he has been with AWS Marketplace and Amazon retail as a PM. Kareem started his career as a developer and then PM for call center technologies, Local Expert and Ads for Expedia. He worked as a consultant with McKinsey and Company for a short while.