Post Syndicated from Katie Collins original https://aws.amazon.com/blogs/security/a-sneak-peek-at-the-security-identity-and-compliance-sessions-for-reinvent-2022/
AWS re:Invent 2022 is fast approaching, and this post can help you plan your agenda with a look at the sessions in the security track. AWS re:Invent, your opportunity to catch up on the latest technologies in cloud computing, will take place in person in Las Vegas, NV, from November 28 – December 2, 2022.
This post provides abbreviated abstracts for all of the security, identity, and compliance sessions. For the full description, visit the AWS re:Invent session catalog. If you plan to attend AWS re:Invent 2022, and you’re interested in connecting with a security, identity, or compliance product team, reach out to your AWS Account Team. Don’t have a ticket yet? Join us in Las Vegas by registering for re:Invent 2022.
Leadership session
SEC214-L: What we can learn from customers: Accelerating innovation at AWS Security
CJ Moses, CISO at AWS, showcases part of the peculiar AWS culture of innovation—the working backwards process—and how new security products, services, and features are built with the customer in mind. AWS Security continuously innovates based directly on customer feedback so that organizations can accelerate their pace of innovation while integrating powerful security architecture into the heart of their business and operations.
Breakout sessions
Lecture-style presentations that cover topics at all levels (200-400) and are delivered by AWS experts, builders, customers, and partners.
SEC201: Proactive security: Considerations and approaches
Security is our top priority at AWS. Discover how the partnership between builder experience and security helps everyone ship securely. Hear about the tools, mechanisms, and programs that help AWS builders and security teams.
SEC203: Revitalize your security with the AWS Security Reference Architecture
As your team continually evolves its use of AWS services and features, it’s important to understand how AWS security services work together to improve your security posture. In this session, learn about the recently updated AWS Security Reference Architecture (AWS SRA), which provides prescriptive guidance for deploying the full complement of AWS security services in a multi-account environment.
SEC207: Simplify your existing workforce access with IAM Identity Center
In this session, learn how to simplify operations and improve efficiencies by scaling and securing your workforce access. You can easily connect AWS IAM Identity Center (successor to AWS Single Sign-On) to your existing identity source. IAM Identity Center integrated with AWS Managed Microsoft Active Directory provides a centralized and scalable access management solution for your workplace users across multiple AWS accounts while improving the overall security posture of your organization.
SEC210: AWS and privacy engineering: Explore the possibilities
Learn about the intersection of technology and governance, with an emphasis on solution building. With the privacy regulation landscape continuously changing, organizations need innovative technical solutions to help solve privacy compliance challenges. This session covers a series of unique customer challenges and explores how AWS services can be used as building blocks for privacy-enhancing solutions.
SEC212: AWS data protection: Using locks, keys, signatures, and certificates
AWS offers a broad array of cryptographic tools and PKI platforms to help you navigate your data protection and digital signing needs. Discover how to get this by default and how to build your own locks, keys, signatures, and certificates when needed for your next cloud application. Learn best practices for data protection, data residency, digital sovereignty, and scalable certificate management, and get a peek into future considerations around crypto agility and encryption by default.
SEC309: Threat detection and incident response using cloud-native services
Threat detection and incident response processes in the cloud have many similarities to on premises, but there are some fundamental differences. In this session, explore how cloud-native services can be used to support threat detection and incident response processes in AWS environments.
SEC310: Security alchemy: How AWS uses math to prove security
AWS helps you strengthen the power of your security by using mathematical logic to answer questions about your security controls. This is known as provable security. In this session, explore the math that proves security systems of the cloud.
SEC312: Deploying egress traffic controls in production environments
Private workloads that require access to resources outside of the VPC should be well monitored and managed. There are solutions that can make this easier, but selecting one requires evaluation of your security, reliability, and cost requirements. Learn how Robinhood evaluated, selected, and implemented AWS Network Firewall to shape network traffic, block threats, and detect anomalous activity on workloads that process sensitive financial data.
SEC313: Harness the power of IAM policies & rein in permissions with Access Analyzer
Explore the power of IAM policies and discover how to use IAM Access Analyzer to set, verify, and refine permissions. Learn advanced skills that empower builders to apply fine-grained permissions across AWS. This session dives deep into IAM policies and explains IAM policy evaluation, policy types and their use cases, and critical access controls.
SEC327: Zero-privilege operations: Running services without access to data
AWS works with organizations and regulators to host some of the most sensitive workloads in industry and government. Learn how AWS secures data, even from trusted AWS operators and services. Explore the AWS Nitro System and how it provides confidential computing and a trusted runtime environment, and dive deep into the cryptographic chains of custody that are built into AWS Identity and Access Management (IAM).
SEC329: AWS security services for container threat detection
Containers are a cornerstone of many AWS customers’ application modernization strategies. The increased dependence on containers in production environments requires threat detection that is designed for container workloads. To help meet the container security and visibility needs of security and DevOps teams, new container-specific security capabilities have recently been added to Amazon GuardDuty, Amazon Inspector, and Amazon Detective. The head of cloud security at HBO Max will share container security monitoring best practices.
SEC332: Build Securely on AWS: Insights from the C-Suite
Security shouldn’t be top of mind only when it’s a headline in the news. A strong security posture is a proactive one. In this panel session, hear how CISOs and CIOs are taking a proactive approach to security by building securely on AWS.
SEC403: Protecting secrets, keys, and data: Cryptography for the long term
This session covers the range of AWS cryptography services and solutions, including AWS KMS, AWS CloudHSM, the AWS Encryption SDK, AWS libcrypto (AWS-LC), post-quantum hybrid algorithms, AWS FIPS accreditations, configurable security policies for Application Load Balancer and Amazon CloudFront, and more.
SEC404: A day in the life of a billion requests
Every day, sites around the world authenticate their callers. That is, they verify cryptographically that the requests are actually coming from who they claim to come from. In this session, learn about unique AWS requirements for scale and security that have led to some interesting and innovative solutions to this need.
SEC405: Zero Trust: Enough talk, let’s build better security
Zero Trust is a powerful new security model that produces superior security outcomes compared to the traditional network perimeter model. However, endless competing definitions and debates about what, Zero Trust is have kept many organizations’ Zero Trust efforts at or near the starting line. Hear from Delphix about how they put Zero Trust into production and the results and benefits they’ve achieved.
Builders’ sessions
Small-group sessions led by an AWS expert who guides you as you build the service or product on your own laptop. Use your laptop to experiment and build along with the AWS expert.
SEC202: Vulnerability management with Amazon Inspector and AWS Systems Manager
Join this builders’ session to learn how to use Amazon Inspector and AWS Systems Manager Patch Manager to scan and patch software vulnerabilities on Amazon EC2 instances. Walk through how to understand, prioritize, suppress, and patch vulnerabilities using AWS security services.
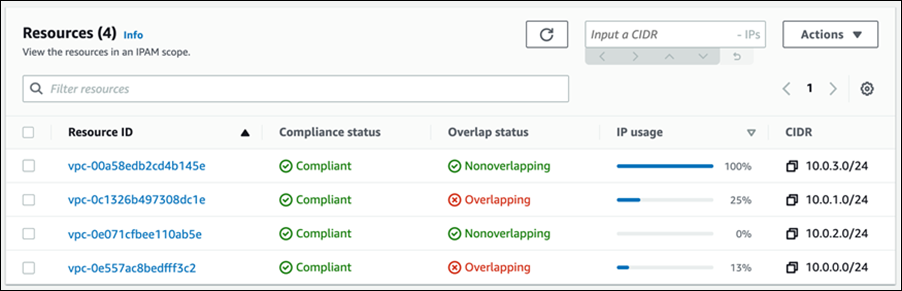
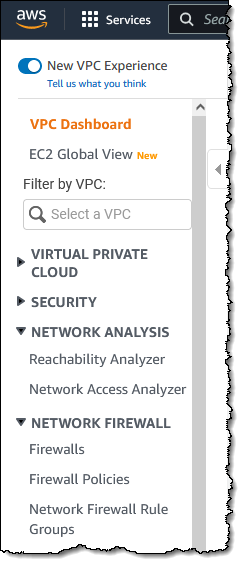
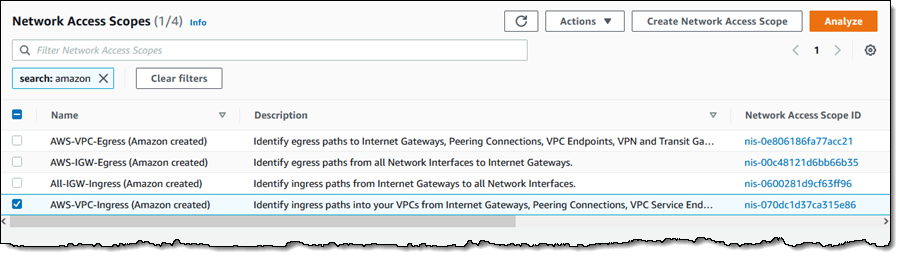
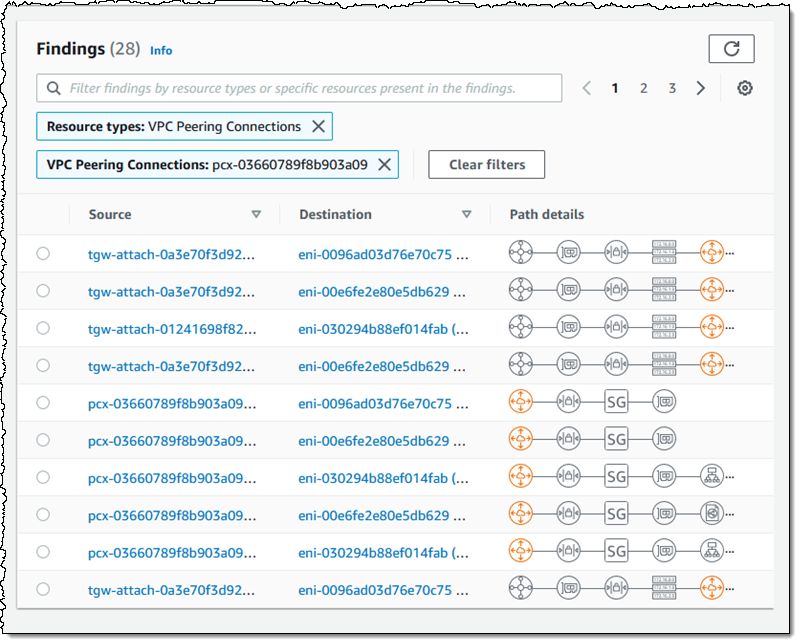
SEC204: Analyze your network using Amazon VPC Network Access Analyzer
In this builders’ session, review how the new Amazon VPC Network Access Analyzer can help you identify network configurations that might lead to unintended network access. Learn ways that you can improve your security posture while still allowing you and your organization to be agile and flexible.
SEC211: Disaster recovery and resiliency for AWS data protection services
Resiliency is a core consideration when architecting cloud workloads. Preparing and implementing disaster recovery (DR) strategies is an important step for ensuring the resiliency of your solution in the face of regional disasters. Gain hands-on experience with implementing backup-restore and active-active DR strategies when working with AWS database services like Amazon DynamoDB and Amazon Aurora and data protection services like AWS KMS, AWS Secrets Manager, and AWS Backup.
SEC303: AWS CIRT toolkit for automating incident response preparedness
When it comes to life in the cloud, there’s nothing more important than security. At AWS, the Customer Incident Response Team (CIRT) creates tools to support customers during active security events and to help them anticipate and respond to events using simulations. CIRT members demonstrate best practices for using these tools to enable service logs with Assisted Log Enabler for AWS, run a security event simulation using AWS CloudSaga, and analyze logs to respond to a security event with Amazon Athena.
SEC304: Machine-to-machine authentication on AWS
This session offers hands-on learning around the pros and cons of several methods of machine-to-machine authentication. Examine how to implement and use Amazon Cognito, AWS Identity and Access Management (IAM), and Amazon API Gateway to authenticate services to each other with various types of keys and certificates.
SEC305: Kubernetes threat detection and incident response automation
In this hands-on session, learn how to use Amazon GuardDuty and Amazon Detective to effectively analyze Kubernetes audit logs from Amazon EKS and alert on suspicious events or malicious access such as an increase in “403 Forbidden” or “401 Unauthorized” logs.
SEC308: Deploying repeatable, secure, and compliant Amazon EKS clusters
Learn how to deploy, manage, and scale containerized applications that run Kubernetes on AWS with AWS Service Catalog. Walk through how to deploy the Kubernetes control plane into a virtual private cloud, connect worker nodes to the cluster, and configure a bastion host for cluster administrative operations.
Chalk talks
Highly interactive sessions with a small audience. Experts lead you through problems and solutions on a digital whiteboard as the discussion unfolds.
SEC206: Security operations metrics that matter
Security tooling can produce thousands of security findings to act on. But what are the most important items and metrics to focus on? Learn about a framework you can use to develop and implement security operations metrics in order to prioritize the highest-risk issues across your AWS environment.
SEC209: Continuous innovation in AWS threat detection & monitoring services
AWS threat detection teams continue to innovate and improve foundational security services for proactive and early detection of security events and posture management. Learn about recent launches that address use cases like container threat detection, protection from malware, and sensitive data identification. Services covered in this session include Amazon GuardDuty, Amazon Detective, Amazon Inspector, Amazon Macie, and centralized cloud security posture assessment with AWS Security Hub.
SEC311: Securing serverless workloads on AWS
Walk through design patterns for building secure serverless applications on AWS. Learn how to handle secrets with AWS Lambda extensions and AWS Secrets Manager, detect vulnerabilities in code with Amazon CodeGuru, ensure security-approved libraries are used in the code with AWS CodeArtifact, provide security assurance in code with AWS Signer, and secure APIs on Amazon API Gateway.
SEC314: Automate security analysis and code reviews with machine learning
Join this chalk talk to learn how developers can use machine learning to embed security during the development phase and build guardrails to automatically flag common issues that deviate from best practices. This session is tailored to developers and security professionals who are involved in improving the security of applications during the development lifecycle.
SEC315: Security best practices for Amazon Cognito applications
Customer identity and access management (CIAM) is critical when building and deploying web and mobile applications for your business. To mitigate the risks of unauthorized access, you need to implement strong identity protections by using the right security measures, such as multi-factor authentication, activity monitoring and alerts, adaptive authentication, and web firewall integration.
SEC316: Establishing trust with cryptographically attested identity
Cryptographic attestation is a mechanism for systems to make provable claims of their identity and state. Dive deep on the use of cryptographic attestation on AWS, powered by technologies such as NitroTPM and AWS Nitro Enclaves to assure system integrity and establish trust between systems. Come prepared for a lively discussion as you explore various use cases, architectures, and approaches for utilizing attestation to raise the security bar for workloads on AWS.
SEC317: Implementing traffic inspection capabilities at scale on AWS
Learn about a broad range of security offerings that can help you integrate firewall services into your network, including AWS WAF, AWS Network Firewall, and partner appliances used in conjunction with a Gateway Load Balancer. Learn how to choose network architectures for these firewall options to protect inbound traffic to your internet-facing applications.
SEC318: Scaling the possible: Digitizing the audit experience
Do you want to increase the speed and scale of your audits? As companies expand to new industries and markets, so does the scale of regulatory compliance. AWS undergoes hundreds of audits in a year. In this chalk talk, AWS experts discuss how they digitize and automate the regulator and auditor experience. Learn about pre-audit educational training, self-service of control evidence and walkthrough information, live chats with audit control owners, and virtual data center tours.
SEC319: Prevent unintended access with AWS IAM Access Analyzer policy validation
In this chalk talk, walk through several approaches to building automated AWS Identity and Access Management (IAM) policy validation into your CI/CD pipeline. Consider some tools that can be used for policy validation, including AWS IAM Access Analyzer, and learn how mechanisms like AWS CloudFormation hooks and CI/CD pipeline controls can be used to incorporate these tools into your DevSecOps workflow.
SEC320: To Europe and beyond: Architecting for EU data protection regulation
Companies innovating on AWS are expanding to geographies with new data transfer and privacy challenges. Explore how to navigate compliance with EU data transfer requirements and discuss how the GDPR certification initiative can simplify GDPR compliance. Dive deep in a collaborative whiteboarding session to learn how to build GDPR-certifiable architectures.
SEC321: Building your forensics capabilities on AWS
You have a compromised resource on AWS. How do you acquire evidence and artifacts? Where do you transfer the data, and how do you store it? How do you analyze it safely within an isolated environment? Walk through building a forensics lab on AWS, methods for implementing effective data acquisition and analysis, and how to make sure you are getting the most out of your investigations.
SEC322: Transform builder velocity with security
Learn how AWS Support uses data to measure security and make informed decisions to grow the people side of security culture while embedding security expertise within development teams. This is empowering developers to deliver production-quality code with the highest security standards at the speed of business.
SEC324: Reimagine the security perimeter with Zero Trust
Zero Trust encompasses everything from the client to the cloud, so where do you start on your journey? In this chalk talk, learn how to look at your environment through a Zero Trust lens and consider architectural patterns that you can use to redefine your security perimeter.
SEC325: Beyond database password management: 5 use cases for AWS Secrets Manager
AWS Secrets Manager is integrated with AWS managed databases to make it easy for you to create, rotate, consume, and monitor database user names and passwords. This chalk talk explores how client applications use Secrets Manager to manage private keys, API keys, and generic credentials.
SEC326: Establishing a data perimeter on AWS, featuring Goldman Sachs
Organizations are storing an unprecedented and increasing amount of data on AWS for a range of use cases including data lakes, analytics, machine learning, and enterprise applications. They want to prevent intentional or unintentional transfers of sensitive non-public data for unauthorized use. Hear from Goldman Sachs about how they use data perimeter controls in their AWS environment to meet their security control objectives.
SEC328: Learn to create continuous detective security controls using AWS services
A risk owner needs to ensure that no matter what your organization is building in the cloud, certain security invariants are in place. While preventive controls are great, they are not always sufficient. Deploying detective controls to enable early identification of configuration issues or availability problems not only adds defense in depth, but can also help detect changes in security posture as your workloads evolve. Learn how to use services like AWS Security Hub, AWS Config, and Amazon CloudWatch Synthetics to deploy canaries and perform continuous checks.
SEC330: Harness the power of temporary credentials with IAM Roles Anywhere
Get an introduction to AWS Identity and Access Management (IAM) Roles Anywhere, and dive deep into how you can use IAM Roles Anywhere to access AWS services from outside of AWS. Learn how IAM Roles Anywhere securely delivers temporary AWS credentials to your workloads.
SEC331: Security at the industrial edge
Industrial organizations want to process data and take actions closer to their machines at the edge, and they need innovative and highly distributed patterns for keeping their critical information and cyber-physical systems safe. In modern industrial environments, the exponential growth of IoT and edge devices brings enormous benefits but also introduces new risks.
SEC333: Designing compliance as a code with AWS security services
Supporting regulatory compliance and mitigating security risks is imperative for most organizations. Addressing these challenges at scale requires automated solutions to identify compliance gaps and take continuous proactive measures. Hear about the architecture of compliance monitoring and remediation solutions, based on the example of the CPS 234 Information Security guidelines of the Australian Prudential Regulatory Authority (APRA), which are mandated for the financial services industry in Australia and New Zealand.
SEC334: Understanding the evolution of cloud-based PKI use cases
Since AWS Private Certificate Authority (CA) launched in 2018, the service has evolved based on user needs. This chalk talk starts with a primer on certificate use for securing network connections and information. Learn about the predominant ways AWS customers are using ACM Private CA, and explore new use cases, including identifying IoT devices, customer-managed Kubernetes, and on premises.
SEC402: The anatomy of a ransomware event targeting data residing in Amazon S3
Ransomware events can cost governments, nonprofits, and businesses billions of dollars and interrupt operations. Early detection and automated responses are important steps that can limit your organization’s exposure. Walk through the anatomy of a ransomware event that targets data residing in Amazon S3 and hear detailed best practices for detection, response, recovery, and protection.
Workshops
Interactive learning sessions where you work in small teams to solve problems using AWS Cloud security services. Come prepared with your laptop and a willingness to learn!
SEC208: Executive security simulation
This workshop features an executive security simulation, designed to take senior security management and IT or business executive teams through an experiential exercise that illuminates key decision points for a successful and secure cloud journey. During this team-based, game-like simulation, use an industry case study to make strategic security, risk, and compliance decisions and investments.
SEC301: Threat detection and response workshop
This workshop takes you through threat detection and response using Amazon GuardDuty, AWS Security Hub, and Amazon Inspector. The workshop simulates different threats to Amazon S3, AWS Identity and Access Management (IAM), Amazon EKS, and Amazon EC2 and illustrates both manual and automated responses with AWS Lambda. Learn how to operationalize security findings.
SEC302: AWS Network Firewall and DNS Firewall security in multi-VPC architectures
This workshop guides participants through configuring AWS Network Firewall and Amazon Route 53 Resolver DNS Firewall in an AWS multi-VPC environment. It demonstrates how VPCs can be interconnected with a centralized AWS Network Firewall and DNS Firewall configuration to ease the governance requirements of network security.
SEC306: Building a data perimeter to allow access to authorized users
In this workshop, learn how to create a data perimeter by building controls that allow access to data only from expected network locations and by trusted identities. The workshop consists of five modules, each designed to illustrate a different AWS Identity and Access Management (IAM) principle or network control.
SEC307: Ship securely: Automated security testing for developers
Learn how to build automated security testing into your CI/CD pipelines using AWS services and open-source tools. The workshop highlights how to identify and mitigate common risks early in the development cycle and also covers how to incorporate code review steps.
SEC323: Data discovery and classification on AWS
Learn how to use Amazon Macie to discover and classify data in your Amazon S3 buckets. Dive deep into best practices as you follow the process of setting up Macie. Also use AWS Security Hub custom actions to set up a manual remediation, and investigate how to perform automated remediation using Amazon EventBridge and AWS Lambda.
SEC401: AWS Identity and Access Management (IAM) policy evaluation in action
Dive deep into the logic of AWS Identity and Access Management (IAM) policy evaluation. Gain experience with hands-on labs that walk through IAM use cases and learn how different policies interact with each other.
Not able to attend AWS re:Invent 2022 in-person? Livestream keynotes and leadership sessions for free by registering for the virtual-only pass!
Want more AWS Security news? Follow us on Twitter.

 Faster is always better, and today I am thrilled to be able to tell you that your latency-sensitive EFS workloads can now run about twice as fast as before!


 Before the end of the current LTS period, you will be able to use your AWS account to complete the FreeRTOS EMP registration on the FreeRTOS console, review and agree to the associated terms and conditions, select the LTS version, and buy an annual subscription. You will then gain access to the private repository where you’ll receive .zip files containing a git repo with chosen libraries, patches, and related notifications.