Post Syndicated from Arturs Lontons original https://blog.zabbix.com/zabbix-proxy-performance-tuning-and-troubleshooting/14013/
Most Zabbix users use proxies, and those running medium to large instances might have encountered some performance issues. From this post and the video, you will learn more about the most common troubleshooting steps to resolve any proxy issues and to detect them as sometimes you might be unaware of an ongoing issue, as well as basic performance tuning to prevent such issues in the future.
Contents
I. Zabbix proxy (1:36)
II. Proxy performance issues (5:35)
III. Selecting and tuning the DB backend (13:27)
VI. General performance tuning (16:59)
V. Proxy network connectivity troubleshooting (20:43)
Zabbix proxy
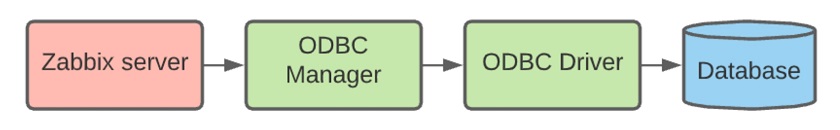
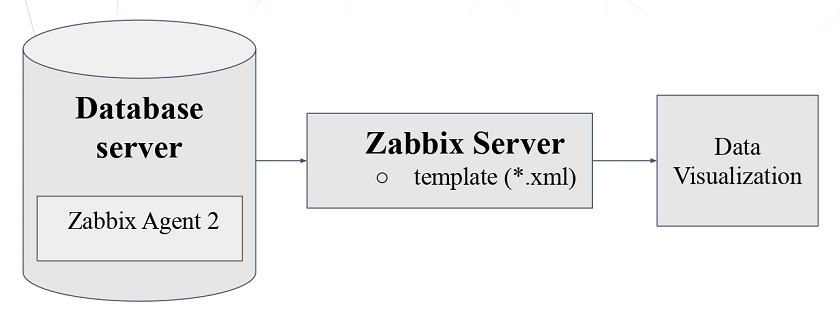
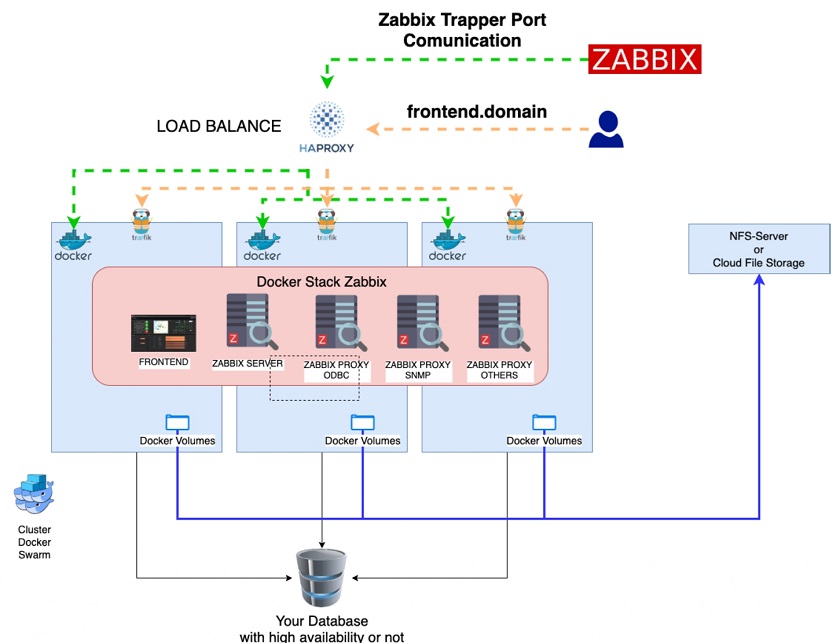
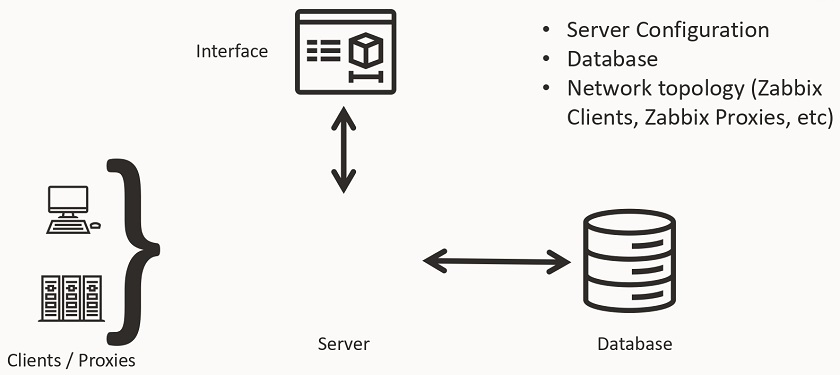
Zabbix proxy can be deployed and most of the time is used to monitor distributed IT infrastructures, for instance, on a remote location to prevent data loss in case of network outages as the proxy collects the data locally and it is then pushed/pulled to/from Zabbix server.
Zabbix proxy supports active and passive modes, so we can push the data to the Zabbix server or have the Zabbix server pull the data from the proxy. Even if we don’t have any remote locations and have a single data center, it is still a good practice to delegate most of your data collection to a proxy running next to your server, especially in medium-sized and large instances. This allows for offloading our data collection and preprocessing performance overhead from the server to the proxy.
Active vs. passive
Whether an active or a passive mode is better for your company at the end of the day will depend on your security policies. We can use passive mode with the server pulling the data from the proxy or active mode with the proxy establishing the connection to the Zabbix server and pushing the data.
- Active mode is the default configuration parameter as it is a bit more simple to configure — almost all of the configuration can be done only on the proxy side. Then, we need to add the proxy on the frontend and we’re good to go.
### Option: ProxyMode
#   Proxy operating mode.
#   0 - proxy in the active mode
#   1 - proxy in the passive mode
#
# Mandatory: no
# Default:
# ProxyMode=0
- In the case of a passive proxy, we have to make some changes in the Zabbix server configuration file, which would involve a restart of the Zabbix server and, as a consequence, downtime.
Finally, it is all going to boil down to our networking team and the network and security policies, for instance, allowing for passive or active mode only. If both modes are supported, then the active mode is a bit more elegant.
Proxy versions
Another common question is about the proxy version to install and the database backend to use.
- The main point here is that the major proxy version should match the major version of the Zabbix server, while minor versions can differ. For instance, Proxy 5.0.4 can be used with Server 5.0.3 and Web 5.0.9 (in this example, the first and the second number should match). Otherwise, the proxy won’t be able to send the data to the server and you will see some error messages in your log files about version mismatch and data formatting not fitting your server requirements.
- Proxies support: SQLite / MySQL/ PostgreSQL/ Oracle backends. To install the proxy, we need to select the proper package for either SQLite3, MySQL, PostgreSQL, or just compile proxy with Oracle database backend support.
— SQLite proxy package:
# yum install zabbix-proxy-sqlite3
— MySQL proxy package:
# yum install zabbix-proxy-mysql
— PostgreSQL proxy package:
# yum install zabbix-proxy-pgsql
For instance, if we do # yum install zabbix-proxy-sqlite3 or copy and paste the instructions from the Zabbix website for SQLite, we will later wonder why it is not working for MySQL as there are some unique dependencies for each of these packages.
NOTE. Don’t forget to select the proper package in relation to the proxy DB backend
Proxy performance issues
After we have installed everything and covered the basics of what needs to be done and how to set things up, we can start tuning or proxy and try to detect any potential performance issues.
Detecting proxy performance issues
How can we find out what the root cause of performance issues is or if we are having them at all?
- First, we need to make sure that we are actually monitoring our proxy. So, we need to:
- Create a host in Zabbix,
- Assign this host to be monitored by the proxy. If the host is monitored by the server, it will report the wrong metrics — the Zabbix server metrics, not the Zabbix proxy metrics.
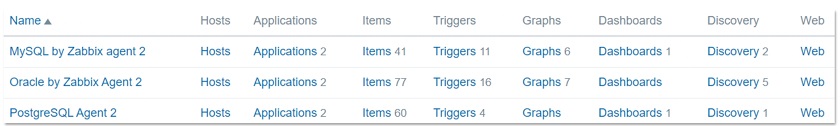
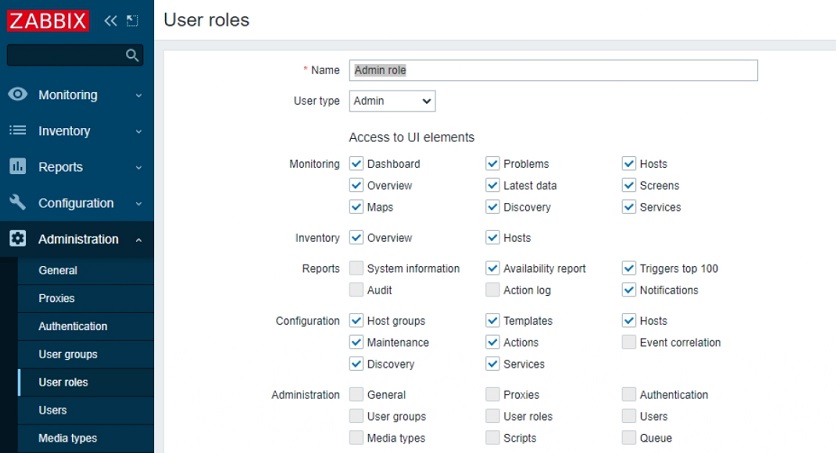
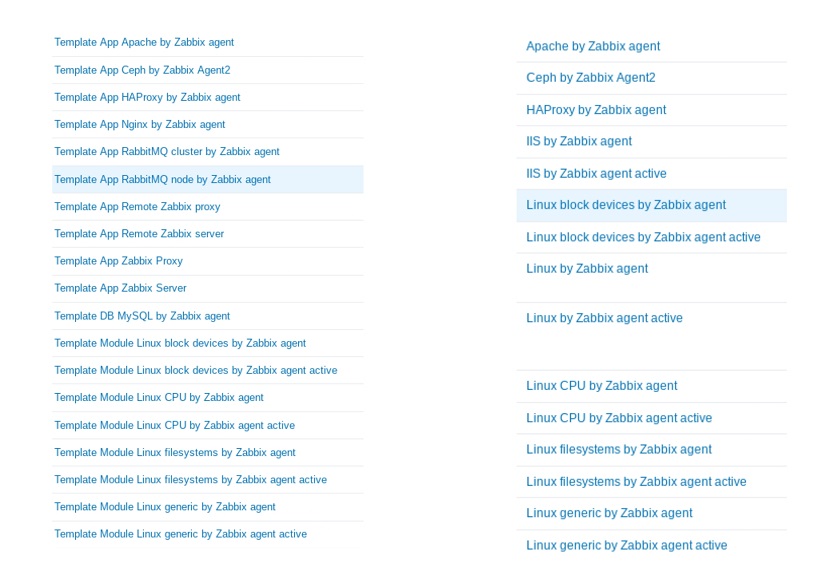
So, we need to create a host and configure it to be monitored by the proxy itself. Then we can use an out-of-the-box proxy monitoring template — Template Apps Zabbix Proxy.
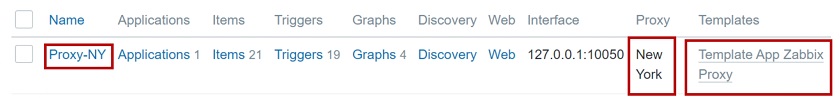
Template App Zabbix Proxy
NOTE. Template Apps Zabbix Proxy gets updated on the git.zabbix page, when we add new components to Zabbix, new internal processes, new gathering processes, and so on, to support these new components.
If you are running an older version of Zabbix, for example, all the way back from version 2.0, make sure that you download the newer template from our git page not to stay in the blind about the newer internal component performance.
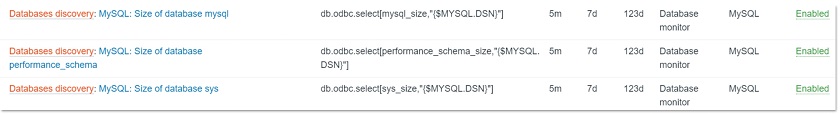
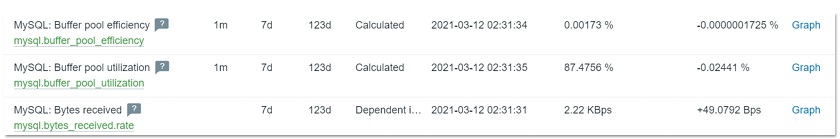
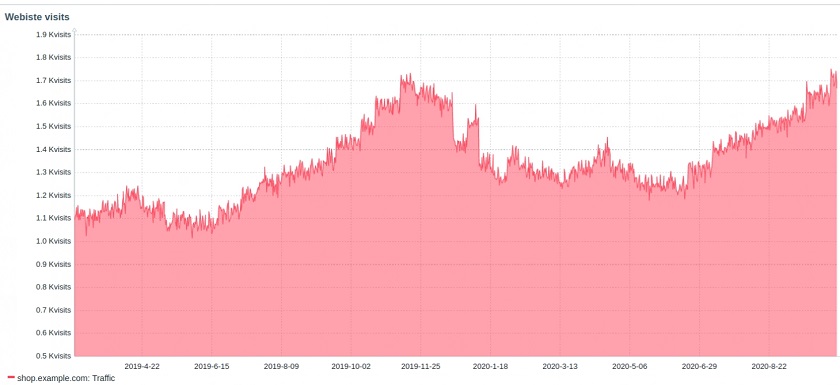
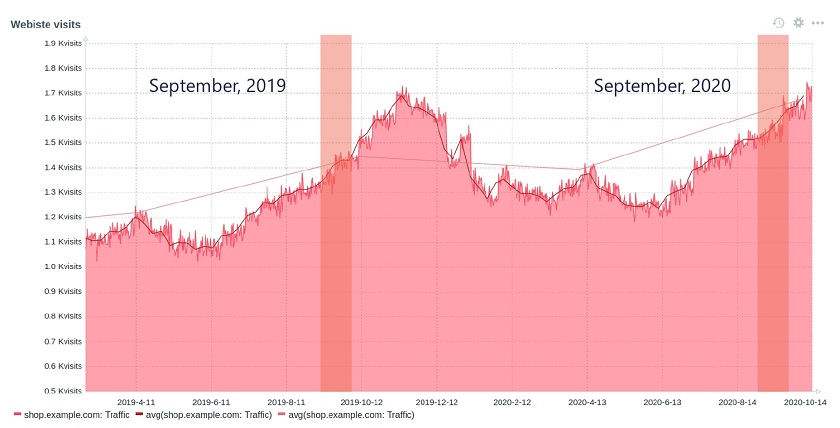
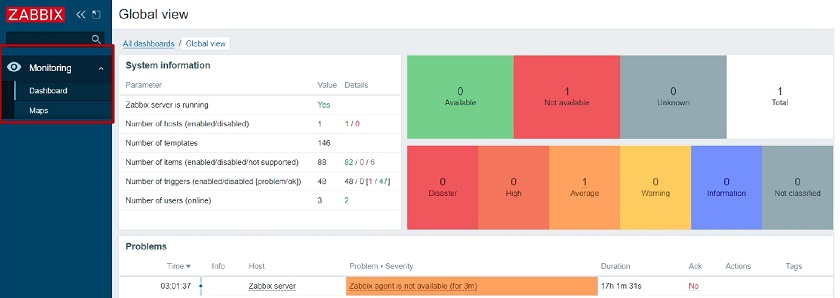
Once we have applied the template, we will see performance graphs with information about gathering processes, internal processes, cache usage, and proxy performance, and both the queue and the new values received per second. So, we can actually react to predefined triggers provided by the template, if there is an issue.
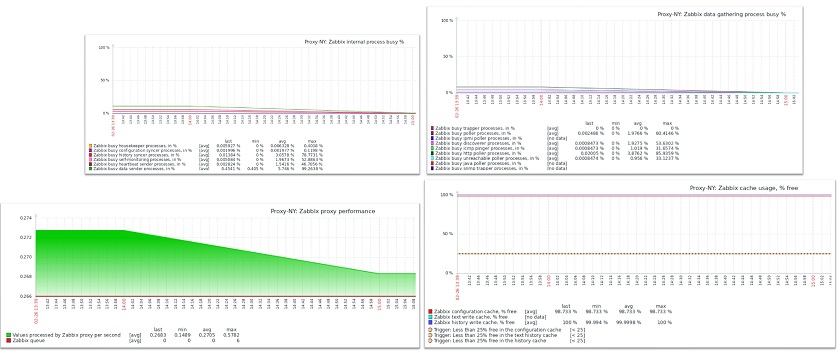
Performance graphs
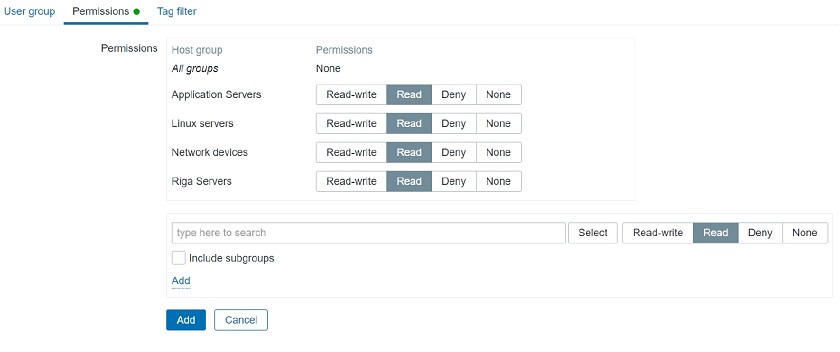
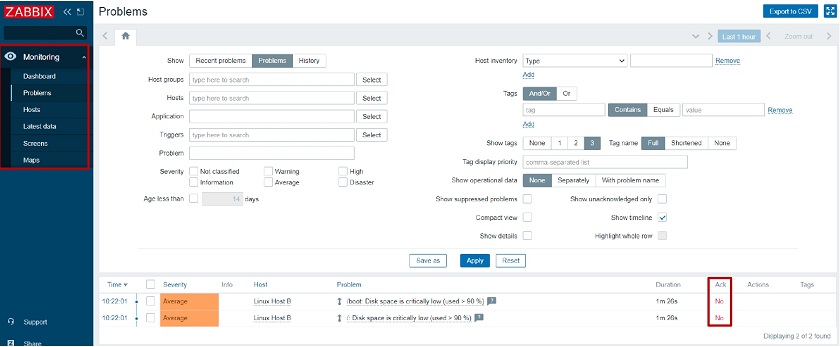
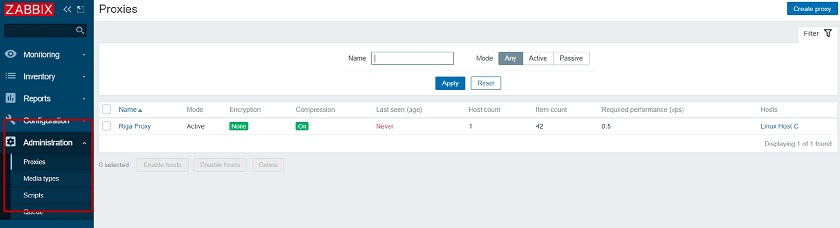
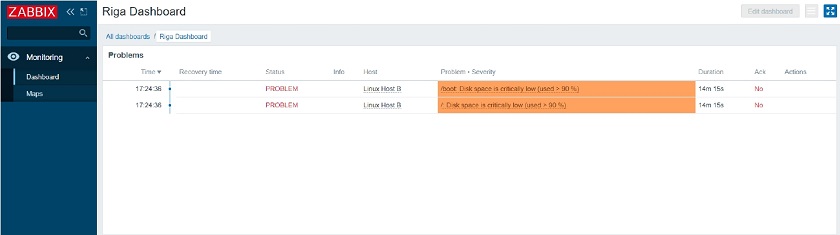
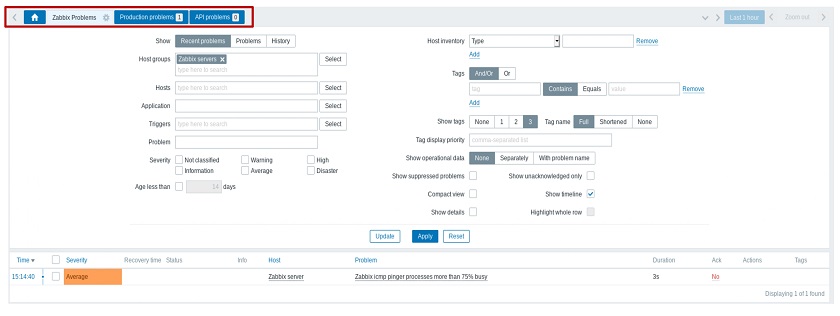
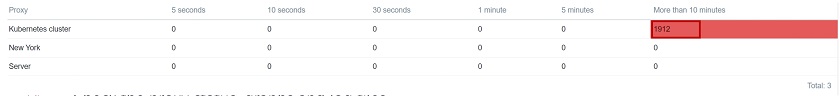
- Then, we need to have a look at the administration queue. A large or growing proxy-specific queue can be a sign of performance issues or a misconfiguration. We might have failed to allow our agents to communicate with our proxies or we might have some network issue on our proxy preventing us from collecting data from the proxy.
An issue on the proxy
In this case:
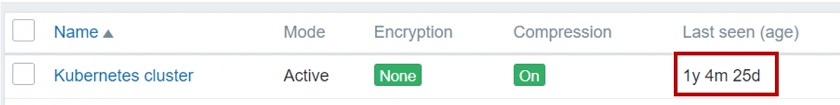
- Check the proxy status, graphs, and log files. In the example above, the proxy has been down for over a year, so it should be decommissioned and removed from the Zabbix environment.
- Check the agent logs for issues related to connecting to the proxy. For instance, the proxy might be trying to pull the data but have no rights to do so due to no permissions in the agent configuration file.
Lack of server resources
In some cases, we might simply try to monitor way too much on a really small server, for instance, an older version of a Raspberry Pi device. So, we should use tools such as sar or top to identify resource bottlenecks on the proxy server coming, for example, from the storage performance.
sar -wdp 3 5 > disk.perf.txt

sar is a part of a sysstat package, and this command can provide us with information about our storage performance, serialization, wait times, queues, input/output operations per second, and so on. sar can tell us when something might be overloaded especially if we have longer wait times.
NOTE. Don’t get confused by high %util, which is relevant on hard drives, but on an SSD or a RAID setup the utilization is normally very high. While hard drives can handle only one operation at a time, SSD disks or RAID setups support parallel operations. This can cause SSD or RAID util% to skyrocket, which might not necessarily be a sign of an issue.
Proxy queue
Another useful, though a bit hackish, indicator of the proxy performance is the proxy queue on the proxy database — the count of the metrics pending but not yet sent to the server.
- We can observe this in real-time by queueing the proxy DB.
- A constantly growing number means that we cannot catch up with our backlog — the network is down or there are some performance issues on the server or the proxy, so more data is getting backlogged than sent.
- The list of unsent metrics is stored in proxy_history table.
- The last sent metric is marked in the IDs table.
select count(*) from proxy_history where id>(select nextid from ids where
table_name="proxy_history");
This value will keep growing if the proxy is unable to send the data at all or due to performance issues. If the network is down, this is to be expected between the proxy and the server. However, if everything is working but the count still keeps growing, we need to investigate for any spamming items, thousands of log lines coming per second, or other performance issues with our storage and/or our database. There might be performance problems on the server due to the server being unable to ingest all of this data in time after a restart, a long downtime, etc. Such a problem should get resolved over time on its own. Otherwise, if there are no significant factors regarding the performance or any recent changes, we need to investigate deeper.

If this value is steadily decreasing, the proxy is actually catching up with the backlog and the incoming data, and is sending data to the server faster than it is collecting new metrics. So, this backlog will get resolved over time.
Configuration frequency
Don’t forget about the configuration frequency. Any configuration changes will be applied on the proxy after ConfigFrequency interval. By default, these changes get applied once an hour, so ConfigFrequency is 3600.
### Option: ConfigFrequency
#   How often proxy retrieves configuration data from Zabbix Server in seconds.
#   For a proxy in the passive mode this parameter will be ignored.
#
# Mandatory: no
# Range: 1-3600*24*7
# Default:
# ConfigFrequency=3600
On active proxies, we can force configuration cache reload by executing config_cache_reload for Zabbix proxy.
#zabbix_proxy -R config_cache_reload
#zabbix_proxy [1972]: command sent successfully
This is another good reason to use active proxies to pick up all of the configuration changes from the server. However, on passive proxies, the only thing we can do is a proxy restart to force a reload of the configuration changes, which is not a good idea. Otherwise, we have to wait for an hour or some other configuration interval until the changes are picked up by the proxy.
Selecting and tuning the DB backend
The next important step is a selection of the database.
SQLite
A common question, which has no clear answer is when to use SQLite and when should we switch to a more robust DB backend.
- SQLite is perfect for small instances as it supports embedded hardware. So, if I were to run a proxy on Raspberry or an older desktop machine, I might use SQLite. Even embedded hardware aside, on smaller instances with fewer than 1,000 new values per second, SQLite backend should feel quite comfortable, though a lot will depend on the underlying hardware.
### Option: ConfigFrequency
#   How often proxy retrieves configuration data from Zabbix Server in seconds.
#   For a proxy in the passive mode this parameter will be ignored.
#
# Mandatory: no
# Range: 1-3600*24*7
# Default:
# ConfigFrequency=3600
- So, in most cases, when proxies collect less than 1,000 NVPS per second, SQLite proxy DB backends are sufficient. With SQLite, you don’t need to additionally configure the database.
#zabbix_proxy -R config_cache_reload
#zabbix_proxy [1972]: command sent successfully
- With SQLite, there’s no need to have additional database configuration, preparation, or tuning. In the proxy configuration file, we just point at the location of the SQLite file.
- A single file is created at the proxy startup, which can be deleted if data cleanup is necessary.
### Option: DBName
#   Database name.
#   For SQLite3 path to database file must be provided. DBUser and DBPassword are ignored.
#   Warning: do not attempt to use the same database Zabbix server is using.
#
# Mandatory: yes
# Default:
# DBName=
DBName=/tmp/zabbix_proxy
All in all the SQLite backend comparatively easy to manage However, it comes with a set of negatives. If we need something more robust that we can tune and tweak, then SQLite won’t do. Essentially, if we reach over 1,000 new values per second, I would consider deploying something more robust — MySQL, PostgreSQL, or Oracle.
Other proxy DB backends
- Any of the supported DB backends can be used for a proxy. In addition, the Zabbix server and Zabbix proxy can use different DB backends. The DB configuration parameters are very similar in Zabbix server and Zabbix proxy configuration files, so users should feel right at home with configuring the proxy DB backend.
- DB and DB user should be created beforehand with the proper collation and permissions.
shell> mysql -uroot -p<password>
mysql> create database zabbix_proxy character set utf8 collate utf8_bin;
mysql> create user 'zabbix'@'localhost' identified by '<password>';
mysql> grant all privileges on zabbix_proxy.* to 'zabbix'@'localhost';
mysql> quit;
- DB schema import is also a prerequisite. The command for proxy schema import is very similar to the server import.
zcat /usr/share/doc/zabbix-proxy-mysql*/schema.sql.gz | mysql -uzabbix -p zabbix_proxy
DB Tuning
- Make sure to use the DB backend you are most familiar with.
- The same tuning rules apply to the Zabbix proxy DB as to the Zabbix server DB.
- Default configuration parameters of the backend will depend on the version of the backend used. For instance, different MySQL versions will have different default parameters, so we need to have a look at MySQL documentation, the default parameters, and the way to tune them.
- For PostgreSQL, it is possible to use the online tuner — PGTune. Though it is not an ideal instrument, it is a good starting point not to leave the proxy hanging without any tuning as we might encounter issues sooner rather than later. With tuning, the database will be more robust and will last longer before we will have to add any resources and rescale the database config.
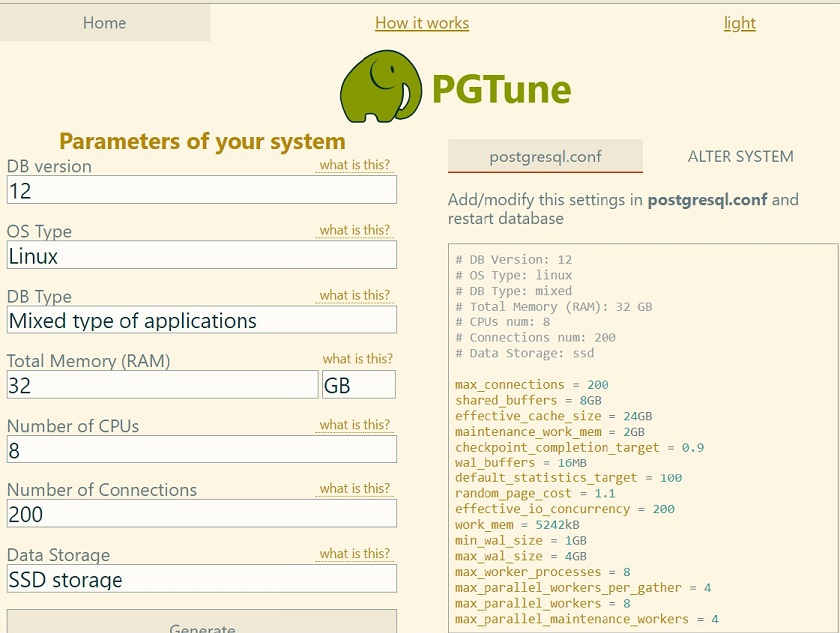 PGTune
General performance tuning
Proxy configuration tuning
Database aside, how we can tune the proxy itself?
Proxy configuration is similar to the configuration of the Zabbix server: we still need to take into account and tune our gathering processes, internal processes, such as preprocessors, and our cache sizes. So, we need to have a look at our gathering graphs, internal process graphs, and our cache graphs to see how busy the processes and how full the graphs are and adjust accordingly. This is a lot easier to do on the proxy than on the server since proxy restart is usually quicker and a lot less critical, and less impactful than the server downtime.
In addition, these will differ on each of the proxy servers depending on the proxy size and types of items. For instance, if on proxy A we are capturing SNMP traps, we need to enable the SNMP trapper process and configure our trap handler — Perl, snmptrapd, etc. If we are doing a lot of ICMP pings for another proxy, we’ll require many ICMP pingers. A really large proxy will need to have its History Syncers increased. So, each proxy will be different, and there is no one-fit-all configuration.
- Since most of the time proxies handle fewer values since they are distributed and scaled out, we will have a lesser number of History Syncers on proxies in comparison with Zabbix server. In the vast majority of cases, the default number of History Syncers is more than sufficient. Though sometimes we might need to change the count of History Syncers on the proxy.
### Option: StartDBSyncers
#             Number of pre-forked instances of DB Syncers.
#
# Mandatory: no
# Range: 1-100
# Default:
# StartDBSyncers=4
There are always exceptions to the rule. For instance, we might want to have a single large-scale and robust proxy collecting the data from some very critical or very large location with many data points – such an infrastructure layout will still be supported.
- If DB syncers do underperform on a seemingly small instance, chances are it is due to lack of hardware resources or, for SQLite, DB backend limitations
We need to monitor the resource usage via sar, or top, or any other tool to make sure that hardware resources aren’t overloaded.
Proxy data buffers
We also have the option to store the data on our proxies if the server is offline or store them even if the Zabbix server is reachable and the data has been sent to the server. we may want to keep our data in the proxy database and utilize it by other third-party tools or integrations.
On our proxies, we have a local buffer and an offline buffer, which determine for how long we can store the data. The size of Local and Offline buffers will affect the size and the performance of your database. The larger the time window for which we store the data, the larger the database is. So, the fewer resources we utilize, the better the performance is, the easier it is to scale up, etc.
- Local buffer
### Option: ProxyLocalBuffer
#   Proxy will keep data locally for N hours, even if the data have already been synced with the server.
#
# Mandatory: no
# Range: 0-720
# Default:
# ProxyLocalBuffer=0
- Offline buffer
### Option: ProxyOfflineBuffer
#   Proxy will keep data for N hours in case if no connectivity with Zabbix Server.
#   Older data will be lost.
#
# Mandatory: no
# Range: 1-720
# Default:
# ProxyOfflineBuffer=1
Proxy network connectivity troubleshooting
Detecting network issues
Sometimes we have network issues between proxies and the server: either the server cannot talk to proxies or proxies cannot talk to the server.
- A good first step would be to test telnet connectivity to/from a proxy.
time telnet 192.168.1.101 10051
- Another great method is to time your pings to see how long pinging takes or how long it takes to establish a telnet connection. This could point you towards network latency issues: slow networks, network outages, and so on.
- Log file can help you figure out proxy connectivity issues.
125209:20210214:073505.803 cannot send proxy data to server at "192.168.1.101": ZBX_TCP_WRITE() timed out
- Load balancers, Traffic inspectors, and other IDS/Firewall tools can hinder proxy traffic. Sometimes it can take hours troubleshooting an issue to find out that it boils down to a load balancer, a traffic inspector, or IDS/firewall tool.
Troubleshooting network issues
- A great way to troubleshoot this would be to deploy a test proxy with a different firewall/load balancing configuration. From time to time, network connectivity drops seemingly for no reason. We can bring up another proxy with no load balancers or no traffic inspectors, and ideally, in the same network as the problematic proxies. We need to find out if the new proxy is experiencing the same problems, or if the issue is resolved after we remove the load balancers, IDS/firewall tools. If the problem gets resolved, then this might be a case of misconfigured firewall/IDS.
- Another great approach of detecting networking issues due to transport problems, for instance, IDS/Firewalls cutting up our packets, is to perform a tcpdump on proxy and server to correlate network traffic with error messages in the log.
— tcpdump on the proxy:
tcpdump -ni any host -w /tmp/proxytoserver
— tcpdump on the server:
tcpdump -ni any host -w /tmp/servertoproxy
— Correlating retransmissions with errors in logs could signify a network issue.
![]() Many retransmissions may be a sign of network issues. If there are a few of them, if we open Wireshark to find just a couple of retransmits, it might not be the root cause. However, if the majority of our packet capture result is read with duplicate packets, retransmits, acknowledges without data packets being received, etc., that can be a sign of an ongoing network issue.
Many retransmissions may be a sign of network issues. If there are a few of them, if we open Wireshark to find just a couple of retransmits, it might not be the root cause. However, if the majority of our packet capture result is read with duplicate packets, retransmits, acknowledges without data packets being received, etc., that can be a sign of an ongoing network issue.
Ideally, we could take a look at this packet capture and correlate it with our proxy log file to figure out if these error messages in our proxy logfile or server logfile (depending on the type of communication — active or passive) correlate with packet capture issues. If so, we can be quite sure that the networking issue is at fault and then we need to figure out what is causing it — IDS, load balancers, a shoddy network, or anything else.