Tag Archives: conferences

Zabbix 6.0 LTS – The next great leap in monitoring by Alexei Vladishev / Zabbix Summit Online 2021

Post Syndicated from Alexei Vladishev original https://blog.zabbix.com/zabbix-6-0-lts-the-next-great-leap-in-monitoring-by-alexei-vladishev-zabbix-summit-online-2021/17683/

The Zabbix Summit Online 2021 keynote speech by Zabbix founder and CEO Alexei Vladishev focuses on the role of Zabbix in modern, dynamic IT infrastructures. The keynote speech also highlights the major milestones leading up to Zabbix 6.0 LTS and together we take a look at the future of Zabbix.

The full recording of the speech is available on the official Zabbix Youtube channel.

Digital transformation journey
Infrastructure monitoring challenges
Zabbix – Universal Open Source enterprise-level monitoring solution
Cost-Effectiveness
Deploy Anywhere
Monitor Anything
Monitoring of Kubernetes and Hybrid Clouds
Data collection and Aggregation
Security on all levels
Powerful Solution for MSPs
Scalability and High Availability
Machine learning and Statistical analysis
More value to users
New visualization capabilities
IoT monitoring
Infrastructure as a code
Tags for classification
What’s next?
Advanced event correlation engine
Multi DC Monitoring
Zabbix Release Schedule
Zabbix Roadmap
Questions

Digital transformation journey

First, let’s talk about how Zabbix plays a role as a part of the Digital Transformation journey for many companies.

As IT infrastructures evolve, there are many ongoing challenges. Most larger companies for example have a set of legacy systems that require to be integrated with more modern systems. This results in a mix of legacy and new technologies and protocols. This means that most management and monitoring tools need to support all of these technologies – Zabbix is no exception here.

Hybrid clouds, containers, and container orchestration systems such as K8S and OpenShift have also played an immense part in the digital transformation of enterprises. It has been a very major paradigm shift – from physical machines to virtual machines, to containers and hybrid parts. We certainly must provide the required set of technologies to monitor such environments and the monitoring endpoints unique to them.

The rapid increase in the complexity of IT infrastructures caused by the two previous points requires our tools to be a lot more scalable than before. We have many more moving parts, likely located in different locations that we need to stay aware of. This also means that any downtime is not acceptable – this is why the high availability of our tools is also vital to us.

Let’s not forget that with increased complexity, many new potential security attack vectors arise and our tools need to support features that can help us with minimizing the security risks.

But making our infrastructures more agile usually comes at a very real financial cost. We must not forget that most of the time we are working with a dedicated budget for our tools and procedures.

Infrastructure monitoring challenges

The increase in the complexity of IT infrastructures also poses multiple monitoring challenges that we have to strive to overcome:

  • Requirements for scalability and high availability for our tools
    • The growing number of devices and networks as well as the increased complexity of IT infrastructures
  • Increasingly complex infrastructures often force us to utilize multiple tools to obtain the required metrics
    • This leads to a requirement for a single pane of glass to enable centralized monitoring
  • Collecting values is often not enough – we need to be able to leverage the collected data to gain the most value out of it
  • We need a solution that can deliver centralized visualization and reporting based on the obtained data
  • Our tools need to be hand-picked so that they can deliver the best ROI in an already complex infrastructure

Zabbix – Universal Open Source enterprise-level monitoring solution

Zabbix is a Universal free and Open Source enterprise-level monitoring solution. The tool comes at absolutely no cost and is available for everyone to try out and use. Zabbix provides the monitoring of modern IT infrastructures on multiple levels.

Universal is the term that we are focusing on. Given the open-source nature of the product, Zabbix can be used in infrastructures of different sizes – from small and medium organizations to large, globe-spanning enterprises. Zabbix is also capable of delivering monitoring of the whole IT stack – from hardware and network monitoring to high-level monitoring such as Business Service monitoring and more.

Cost-Effectiveness

Zabbix delivers a large set of enterprise-grade features at no cost! Features such as 2FA, Single sign-on solutions, no restrictions when it comes to data collection methods, number of monitored devices and services, or database size.

  • Exceptionally low total cost of ownership
    • Free and Open Source solution with quality and security in mind
    • Backed by reliable vendors, a global partner network, and commercial services, such as the 24/7 support
    • No limitations regarding how you use the software
    • Free and readily available documentation, HOWTOs, community resources, videos, and more.
    • Zabbix engineers are easy to find and hire for your organization
    • Cost is fully under your control – Zabbix Commercial services are under fixed-price agreements

Deploy Anywhere

Our users always have the choice of where and how they wish to deploy Zabbix. With official packages for the most popular operating systems such as RHEL, Oracle Linux, Ubuntu, Raspberry Pi OS, and more. With official Helm charts, you can quickly also deploy Zabbix in a Kubernetes cluster or in your OpenShift instance. We also provide official Docker container images with pre-installed Zabbix components that you can deploy in your environment.

We also provide one-click deployment options for multiple cloud service providers, such as Amazon AWS, Microsoft Azure, Google Cloud, Openstack, and many other cloud service providers.

Monitor Anything

With Zabbix, you can monitor anything – from legacy solutions to modern systems. With a large selection of official solutions and substantial community backing our users can be sure that they can find a suitable approach to monitor their IT infrastructure components. There are hundreds of ready-to-use monitoring solutions by Zabbix.

Whenever you deploy a new IT solution in your enterprise, you will want to tie it together with the existing toolset. Zabbix provides many out of the box integrations for the most popular ticketing and alerting systems

Recently we have introduced advanced search capabilities for the Zabbix integrations page, which allows you to quickly lookup the integrations that currently exist on the market. If you visit the Zabbix integrations page and look up a specific vendor or tool, you will see a list of both the official solutions supported by Zabbix and also a long list of community solutions backed by our users, partners, and customers.

Monitoring of Kubernetes and Hybrid Clouds

Nowadays many existing companies are considering migrating their existing infrastructure to either solutions such as Kubernetes or OpenShift, or utilizing cloud service providers such as Amazon AWS or Microsoft Azure.

I am proud to announce, that with the release of Zabbix 6.0 LTS, Zabbix will officially support out-of-the-box monitoring of OpenShfit and Kubernetes clusters.

Data collection and Aggregation

Let’s cover a few recent features that improve the out-of-the-box flexibility of Zabbix by a large margin.

Synthetic monitoring is a feature that was introduced a year ago in Zabbix version 5.2 and it has already become quite popular with our user base. The feature enables monitoring of different devices and solutions over the HTTP protocol. By using synthetic monitoring Zabbix can connect to your HTTP endpoints, such as cloud APIs, Kubernetes, and OpenShift APIs, and other HTTP endpoints, collect the metrics and then process them to extract the required information. Synthetic monitoring is extremely transparent and flexible – it can be fine-tuned to communicate with any HTTP endpoints.

Another major feature introduced in Zabbix 5.4 is the new trigger syntax. This enables our users to define much more flexible trigger expressions, supporting many new problem detection use cases. In addition, we can use this syntax to perform flexible data aggregation operations. For example, now we can aggregate data filtered by wildcards, tags, and host groups, instead of specifying individual items. This is extremely valuable for monitoring complex infrastructures, such as Kubernetes or cloud environments. At the same time, the new syntax is a lot more simple to learn and understand when compared to the old trigger syntax.

Security on all levels

Many companies are concerned about security and data protection when it comes to the tools that they are using in their day-to-day tasks. I’m happy to tell you that Zabbix follows the highest security standards when it comes to the development and usage of the product.

Zabbix is secure by design. In the diagram below you can see all of the Zabbix components, all of which are interconnected, like Zabbix Agent, Server, Proxy, Database, and Frontend. All of the communication between different Zabbix components can be encrypted by using strong encryption protocols like TLS.

If you’re using Zabbix Agent, the agent does not require root privileges. You can run Zabbix Agent under a normal user with all of the necessary user level restrictions in place. Zabbix agent can also be restricted with metric allow and deny lists, so it has access only to the metrics which are permitted for collection by your company policies.

The connections between the Zabbix database backend and the Zabbix Frontend and Zabbix Server also support encryption as of version 5.0 LTS.

As for the frontend component – users can add an additional security layer for their Zabbix frontends by configuring 2FA and SSO logins. Zabbix 6.0 LTS also introduces flexible login password complexity requirements, which can reduce the security breach risk if your frontend is exposed to the internet. To ensure that Zabbix meets the highest standards of the company security compliance, the new Audit log, introduced in Zabbix 6.0 LTS, is capable of logging all of the Zabbix Frontend and Zabbix Server operations.

For an additional security layer – sensitive information like Usernames, Passwords, API keys can be stored in an external vault. Currently, Zabbix supports secret storage in the HashiCorp Vault. Support for the CyberArk vault will be added in the Zabbix 6.2 release.

Another Zabbix feature – the Zabbix API, is often used for the automation of day-to-day configuration workflows, as well as custom integrations and data migration tasks. Zabbix 5.4 added the ability to create API tokens for particular frontend users with pre-defined token expiration dates.

In Zabbix 5.2 we added another layer for the Zabbix Frontend user permissions – User Roles. Now it is possible to define granular user roles with different types of rights and privileges, assigned to specific types of users in your organization. With User Roles, we can define which parts of the Zabbix UI the specific user role has access to and which UI actions the members of this role can perform. This can be combined with API method restrictions which can also be defined for a particular role.

Powerful Solution for MSPs

When we combine all of these features, we can see how Zabbix becomes a powerful solution for MSP customers. MSPs can use Zabbix as an added value service. This way they can provide a monitoring service for their customers and get additional revenue out of it. It is possible to build a customer portal which is a combination of User Roles for read-only access to dashboards and customized UI, rebranding option – which was just introduced in Zabbix 6.0 LTS, and a combination of SLA reporting together with scheduled PDF reports, so the customers can receive reports on a weekly, daily or monthly basis.

Scalability and High Availability

With a growing number of devices and ever-increasing network complexity, Scalability and High availability are extremely important requirements.

Zabbix provides Load balancing options for Zabbix UI and Zabbix API. In order to scale the Zabbix Frontend and Zabbix API, we can simply deploy additional Zabbix Frontend nodes, thus introducing redundancy and high availability.

Zabbix 6.0 LTS comes with out-of-the-box support for the Zabbix Server High Availability cluster. If one of the Zabbix Server nodes goes down, Zabbix will automatically switch to one of the standby nodes. And the best thing about the Zabbix Server High Availability cluster – it takes only 5 minutes to get it up and running. the HA cluster is very easy to configure and use.

One of the features in our future roadmap is introducing support for the History API to work with different time-series DB backends for extra efficiency and scalability. Another feature that we would like to implement in the future is load balancing for Zabbix Servers and Zabbix Proxies. Combining all of these features would truly make Zabbix a cloud-native application with unlimited horizontal scalability.

Machine learning and Statistical analysis

Defining static trigger thresholds is a relatively simple task, but it doesn’t scale too well in dynamic environments. With Machine Learning and Statistical Analysis, we can analyze our data trends and perform anomaly detection. This has been greatly extended in Zabbix 6.0 LTS with Anomaly Detection and Baseline Monitoring functionality.

Zabbix 6.0 Adds an extended set of functions for trend analysis and trend prediction. These support multiple flexible parameters, such as the ability to define seasonality for your data analysis. This is another way how to get additional insights out of the data collected by Zabbix

More value to users

When I think about the direction that Zabbix is headed in, and look at the Zabbix roadmap, one of the main questions I ask is “How can we deliver more value to our enterprise users?”

In Zabbix 6.0 LTS we made some major steps to make Zabbix fit not only for infrastructure monitoring but also fit for Business Service monitoring – the monitoring of services that we provide for our end-users or internal company users. Zabbix 6.0 LTS comes with complex service level object definitions, real-time SLA reporting, multi-tenancy options, Business Service alerting options, and root cause and Impact analysis.

New visualization capabilities

It is important to present the collected data in a human-readable way. That’s why we invest a lot of time and effort in order to improve the native visualization capabilities. In Zabbix 6.0 LTS we have introduced Geographical Maps together with additional widgets for TOP N reporting and templated and multi-page dashboards.

The introduction of reports in Zabbix 5.2 allowed our users to leverage their Zabbix Dashboards to generate scheduled PDF reports with respect to user permissions. Our users can generate daily, weekly, monthly or yearly reports and send them to their infrastructure administrators or customers.

IoT monitoring

With the introduction of support for Modbus and MQTT protocols, Zabbix can be used to monitor IoT devices and obtain environmental information from different sensors such as temperature, humidity, and more. In addition, Zabbix can now be used to monitor factory equipment, building management systems, IoT gateways, and more.

Infrastructure as a code

With IT infrastructures growing in scale, automation is more important than ever. For this reason, many companies prefer preserving and deploying their infrastructure as code. With the support of YAML format for our templates, you can now keep them in a git repository and by utilizing CI/CD tools you can now deploy your templates automatically.

This enables our users to manage their templates in a central location – the git repository, which helps users to perform change management and versioning and then deploy the template to Zabbix by using CI/CD tools.

Tags for classification

Over the past few versions, we have made a major push to support tags for most Zabbix entities. The switch from applications to tags in Zabbix 5.4 made the tool much more flexible. Tags can now be used for the classification of items, triggers, hosts, business services. The tags that the users define can also be used in alerting, filtering, and reporting.

What’s next?

You’re probably wondering – what’s coming next? What are the main vectors for the future development of Zabbix?

First off – we will continue to invest in usability. While the tool is made by professionals for professionals, it is important for us to make using the tool as easy as possible. Improvements to the Zabbix Frontend, general usability, and UX can be expected very soon.

We plan to continue to invest in the visualization and reporting capabilities of Zabbix. We want all data collected by our monitoring tool to provide information in a single pane of glass. This way our users can see the full picture of their environment while also seeing the root cause analysis for the ongoing problems that we face. This way we can get most of the data that Zabbix collects.

Extending the scope of monitoring is an ongoing process for us. We would like to implement additional features for compliance monitoring. I think that we will be able to introduce a solution for application performance monitoring very soon. We’d like to make log monitoring more powerful and comprehensive. monitoring of public and private clouds is also very important for us, given the current IT paradigms.

We’d like to make sure that Zabbix is absolutely extendable on all levels. While we can already extend Zabbix with different types of plugins, webhooks, and UI modules there’s more to come in the near future.

The topic of high availability, scalability, and load balancing is extremely important to us. We will continue building on the existing foundations to make Zabbix a truly cloud-native solution.

Advanced event correlation engine

Advanced event processing is a really important topic. When we talk about a monitoring solution, we pay very much attention to the number of metrics that we are collecting. We mustn’t forget, that for large-scale environments the number of events that we generate based on those metrics is also extremely important. We need to keep control and manage the ever-growing number of different events coming from different sources. This is why we would like to focus on noise reduction, specifically – root cause analysis.

For this reason, we can expect Zabbix to introduce an advanced event correlation model in the future. This model should have the ability to filter and deduplicate the events as well as perform event enrichment, thus leading to a much better root cause analysis.

Multi DC Monitoring

Currently, Multi DC monitoring can be done with Zabbix by deploying a distributed Zabbix instance that utilizes Zabbix proxies. But there are use cases, where it would be more beneficial to have multiple Zabbix servers deployed across different datacenters – all reporting to a single location for centralized event processing, centralized visualization, and reporting as well as centralized dashboards. This is something that is coming soon to Zabbix.

Zabbix Release Schedule

Of course, the burning question is – when is Zabbix 6.0 LTS going to be released? And we are very close to finalizing the next LTS release. I would expect Zabbix 6.0 LTS to be officially released in January 2022.

As for Zabbix 6.2 and 6.4 – these releases are still planned for Q2 and Q4, 2022. The next LTS release – Zabbix 7.0 LTS is planned to be released in Q2, 2023.

Zabbix Roadmap

If you want to follow the development of Zabbix – we have a special page just for that – the Zabbix Roadmap. Here you can find up-to-date information about the development plans for Zabbix 6.2, 6.4, and 7.0 LTS. The Roadmap also represents the current development status of Zabbix 6.0 LTS.

Questions

Q: What would you say is the main benefit of why users should migrate from Zabbix 5.0/4.0 or older versions to 6.0 LTS?

A: I think that Zabbix 6.0 LTS is a very different product – even when you compare it with the relatively recent Zabbix 5.0 LTS. It comes with many improvements, some of which I mentioned here in my keynote. For example, Business Service monitoring provides huge added value to enterprise customers.

With the new trigger syntax and the new functions related to anomaly detection and baseline monitoring our users can get much more out of the data that they already have in their monitoring tool.

The new visualization options – multiple new widgets, geographical maps, scheduled PDF reporting provide a lot of added value to our end-users and to their customers as well.

Q: Any plans to make changes on the Zabbix DB backend level – make it more scaleable or completely redesign it?

A: Right now we keep all of our information in a relational database such as MySQL or PostgreSQL. We have added the support for TimescaleDB which brings some huge advantages to our users, thanks to improved data storage and performance efficiency.

But we still have users that wish to connect different storage engines to Zabbix – maybe specifically optimized to keep time-series data. Actually, this is already on our roadmap. Our plan is to introduce a unified API for historical data so that if you wish to attach your own storage, we just have to deploy a plugin that will communicate both with our historical API and also talk to the storage engine of your choosing. This feature is coming and is already on our Roadmap.

Q: What is your personal favorite feature? Something that you 100% wanted to see implemented in Zabbix 6.0 LTS?

A: I see Zabbix 6.0 LTS as a combination of Zabbix 5.2, 5.4, and finally the features introduced directly in Zabbix 6.0 LTS. Personally, I think that my favorite features in Zabbix 6.0 LTS are features that make up the latest implementation of Anomaly detection.

We could be at the very beginning of exploring more advanced machine learning and statistical analysis capabilities, but I’m pretty sure that with every new release of Zabbix there will be new features related to machine learning, anomaly detection, and trend prediction.

This could provide a way for Zabbix to generate and share insights with our users. Analysis of what’s happening with your system, with your metrics – how the metrics in your system behave.

Summary of Zabbix Summit Online 2021, Zabbix 6.0 LTS release date and Zabbix Workshops

Post Syndicated from Arturs Lontons original https://blog.zabbix.com/summary-of-zabbix-summit-online-2021-zabbix-6-0-lts-release-date-and-zabbix-workshops/17155/

Now that the Zabbix Summit Online 2021 has concluded, we are thrilled to report we hosted attendees from over 3000 organizations from more than 130 countries all across the globe.

This year, the main focus of the speeches was the upcoming Zabbix 6.0 LTS release, as well as speeches focused on automating Zabbix data collection and configuration, Integrating Zabbix within existing company infrastructures, and migrating from legacy tools to Zabbix. 21 speakers in total presented their use cases and talked about new Zabbix features during the Summit with over 8 hours of content.

In case you missed the Summit or wish to come back to some of the speeches – both the presentations (in PDF format) and the videos of the speeches are available on the Zabbix Summit Online 2021 Event page.

Zabbix 6.0 LTS release date

As for Zabbix 6.0 LTS – as per our statement during the event, you can expect Zabbix 6.0 LTS to release in early 2022. At the time of this post, the latest pre-release version is Zabbix 6.0 Alpha 7, with the first Beta version scheduled for release VERY soon. Feel free to deploy the latest pre-release version and take a look at features such as Geomaps, Business Service monitoring, improved Audit log, UX improvements, Anomaly detection with Machine Learning, and more! The list of the latest released Zabbix 6.0 versions as well as the improvements and fixes they contain is available in the Release notes section of our website.

Zabbix 6.0 LTS Workshops

The workshops will focus on particular Zabbix 6.0 LTS features and will be available once the Zabbix 6.0 LTS is released. The workshops will provide a unique chance to learn and practice the configuration of specific Zabbix 6.0 LTS features under the guidance of a certified Zabbix trainer at absolutely no cost! Some of the topics covered in the workshops will include – Deploying Zabbix server HA cluster, Creating triggers for Baseline monitoring and Anomaly detection, Displaying your infrastructure status on Geomaps, Deploying Business Service monitoring with root cause analysis, and more!

Upcoming events

But there’s more! On December 9 2021 Zabbix will host PostgreSQL Monitoring Day with Zabbix & Postgres Pro. The speeches will focus on monitoring PostgreSQL databases, running Zabbix on PostgreSQL DB backends with TimescaleDB, and securing your Zabbix + PostgreSQL instances. If you’re currently using PostgreSQL DB backends r plan to do so in the future – you definitely don’t want to miss out!

As for 2022 – you can expect multiple meetups regarding Zabbix 6.0 LTS features and use cases, as well as events focused on specific monitoring use cases. More information will be publicly available with the release of Zabbix 6.0 LTS.

Zabbix 6.0 LTS at Zabbix Summit Online 2021

Post Syndicated from Arturs Lontons original https://blog.zabbix.com/zabbix-6-0-lts-at-zabbix-summit-online-2021/16115/

With Zabbix Summit Online 2021 just around the corner, it’s time to have a quick overview of the 6.0 LTS features that we can expect to see featured during the event. The Zabbix 6.0 LTS release aims to deliver some of the long-awaited enterprise-level features while also improving the general user experience, performance, scalability, and many other aspects of Zabbix.

Native Zabbix server cluster

Many of you will be extremely happy to hear that Zabbix 6.0 LTS release comes with out-of-the-box High availability for Zabbix Server. This means that HA will now be supported natively, without having to use external tools to create Zabbix Server clusters.

The native Zabbix Server cluster will have a speech dedicated to it during the Zabbix Summit Online 2021. You can expect to learn both the inner workings of the HA solution, the configuration and of course the main benefits of using the native HA solution. You can also take a look at the in-development version of the native Zabbix server cluster in the latest Zabbix 6.0 LTS alpha release.

Business service monitoring and root cause analysis

Service monitoring is also about to go through a significant redesign, focusing on delivering additional value by providing robust Business service monitoring (BSM) features. This is achieved by delivering significant additions to the existing service status calculation logic. With features such as service weights, service status analysis based on child problem severities, ability to calculate service status based on the number or percentage of children in a problem state, users will be able to implement BSM on a whole new level. BSM will also support root cause analysis – users will be informed about the root cause problem of the service status change.

All of this and more, together with examples and use cases will be covered during a separate speech dedicated to BSM. In addition, some of the BSM features are available in the latest Zabbix 6.0 LTS alpha release – with more to come as we continue working on the Zabbix 6.0 release.

Audit log redesign

The Audit log is another existing feature that has received a complete redesign. With the ability to log each and every change performed both by the Zabbix Server and Zabbix Frontend, the Audit log will become an invaluable source of audit information. Of course, the redesign also takes performance into consideration – the redesign was developed with the least possible performance impact in mind.

The audit log is constantly in development and the current Zabbix 6.0 LTS alpha release offers you an early look at the feature. We will also be covering the technical details of the new audit log implementation during the Summit and will explain how we are able to achieve minimal performance impact with major improvements to Zabbix audit logging.

Geographical maps

With Geographical maps, our users can finally display their entities on a geographical map based on the coordinates of the entity. Geographical maps can be used with multiple geographical map providers and display your hosts with their most severe problems. In addition, geographical maps will react dynamically to Zoom levels and support filtering.

The latest Zabbix 6.0 Alpha release includes the Geomap widget – feel free to deploy it in your QA environment, check out the different map providers, filter options and other great features that come with this widget.

Machine learning

When it comes to problem detection, Zabbix 6.0 LTS will deliver multiple trend new functions. A specific set of functions provides machine learning functionality for Anomaly detection and Baseline monitoring.

The topic will be covered in-depth during the Zabbix Summit Online 2021. We will look at the configuration of the new functions and also take a deeper dive at the logic and algorithms used under the hood.

During the Zabbix Summit Online 2021, we will also cover many other new features, such as:

  • New Dashboard widgets
  • New items for Zabbix Agent
  • New templates and integrations
  • Zabbix login password complexity settings
  • Performance improvements for Zabbix Server, Zabbix Proxy, and Zabbix Frontend
  • UI and UX improvements
  • Zabbix login password complexity requirements
  • New history and trend functions
  • And more!

Not only will you get the chance to have an early look at many new features not yet available in the latest alpha release, but also you will have a great chance to learn the inner workings of the new features, the upgrade and migration process to Zabbix 6.0 LTS and much more!

We are extremely excited to share all of the new features with our community, so don’t miss out – take a look at the full Zabbix Summit online 2021 agenda and register for the event by visiting our Zabbix Summit page, and we will see you at the Zabbix Summit Online 2021 on November 25!

Interview with Zabbix Summit Online 2021 speaker: Brian van Baekel

Post Syndicated from Jekaterina Sizova original https://blog.zabbix.com/interview-with-zabbix-summit-online-2021-speaker-brian-van-baekel/16174/

We continue to introduce you to the speakers of Zabbix Summit Online 2021. Our next guest is Brian van Baekel – a known Zabbix evangelist and trainer who has educated hundreds of students on all the nuances of working with our monitoring system.

Hi Brian, you are often seen on Zabbix Blog – mainly as the author of technical posts. Tell us, where did you get so much practical experience in using Zabbix?

Well, I started with Zabbix in 2013 and have been working with it ever since. During those years I’ve seen so many different environments. Each with their own challenges. Every challenge forces you to find a new creative solution and if you come across it often enough, you gain experience! I started Opensource ICT Solutions in early 2018 and the only thing we do is Zabbix. Either consultancy, training, or support worldwide, as long as it is Zabbix related. So that is even more experience that’s growing day by day as we’re serving exciting customers around the globe!

Is it true that you started using Zabbix with version 1.8? In your opinion, what are the most significant changes in the Zabbix functionality when comparing Zabbix then and now?

Yes that’s true, the first Zabbix version I started with was 1.8 and at that point I was not impressed with it, to say at least. After a few weeks, I saw the potential and started to enjoy the product more and more. After some time, we upgraded to a newer version of Zabbix where Low-Level Discovery was introduced… and wow! That was (and still is) one of the most powerful things.

In general, it’s not just one significant change that impresses me most as there are countless small and major improvements. In my opinion, it’s better to look at the product as a whole and the most significant change is how mature the product became during those years. If you really want me to name some significant changes, I must think about 3:

  • Low-Level Discovery
  • Tags
  • Dashboards
At the Zabbix Summit 2021, we will be introducing version 6.0 to the community in detail. Have you checked out the roadmap yet? Please tell us, what improvements are you most excited about?

To be honest I am not only checking the roadmap on a weekly basis but following the development rather closely to make sure we can anticipate what’s going to be introduced so we know what to advise customers.

As our customers are mainly on the Long Term Support versions, I am extremely happy that what was introduced in 5.2 and 5.4 will be available in a Long Term Support release. Regarding the new features, I am really excited about BSM(Business Level Monitoring) which will give us a comprehensive look at services instead of hosts and their metrics. That’s extremely valuable. The second thing that seems promising is HA. Although we’re building HA setups ourselves on a weekly basis it’s nice to have something natively available in the product.

Can you tell us about the speech you are going to give at the Zabbix Summit 2021?

Yes of course! So, as I mentioned, working as a Zabbix consultant and trainer, I see a lot of different environments where we have to solve various challenges. One of those challenges I came across is SNMP monitoring where the devices that had to be monitored were totally not able to handle all the SNMP requests. Luckily, they are sending traps. The art is to receive the traps and utilize them in such a way that you know the status of that device within seconds without just relying on the received trap solely. If you’re creative enough, Zabbix allows you to cater for that. So I’m going to explain why you want SNMP polling combined with SNMP traps and how to react on those traps so that you know the complete status of that device. The higher-level message of this talk is “Zabbix is flexible enough. The product is not the limit, your creativity is! Think out of the box and the sky is the limit”


Revealing Zabbix Summit Online 2021 Agenda. Interview with Jacob Robinson

Post Syndicated from Jekaterina Sizova original https://blog.zabbix.com/revealing-zabbix-summit-online-2021-agenda-interview-with-jacob-robinson/15803/

This year’s Zabbix Summit 2021 will take place online on October 21. We decided to introduce you to the speakers and reveal some of the topics that will be covered during the event. Our first interviewee will be Jacob Robinson, who is speaking at this year’s Zabbix summit for the first time.

Hi Jacob, we are pleased to welcome you! We mentioned above that this year would be your debut speaking at our big event about monitoring. What was your primary motivation for giving the talk?

Hi, thank you, that is correct it is my first time speaking at any Zabbix event. My goal is to help let others know the unique way I am using Zabbix so they may benefit from it. I would really like to expand the system I have built and find others to use it and potentially contribute requests and development. I hope that the talk sparks some interest in the community, and I can connect with some people to discuss it more.

Would you like please to uncover your speech a bit? What should summit attendees expect?

Sure, my speech explains a project I developed that automatically detects, identifies, and creates hosts in Zabbix so that users never need to manually create any hosts. It also obtains MAC addresses, switch port configurations, and many other host details that are automatically entered into Zabbix even over large corporate networks.

Can you tell us about yourself and your experience with Zabbix? What exciting projects have you worked on?

I have been using Zabbix for around 3 years now to provide global monitoring of AV, Networking, and Security for WeWork. Everything I have done at WeWork has been very exciting, there have been integrations with several APIs, developing a custom Okta integration with Zabbix, controlling thousands of televisions and tracking electricity cost savings with Zabbix, and the challenges involved with monitoring WeWork’s network of over 150,000 active hosts. I also run a small blog, monitoreverything.net, where I try to write detailed documentation of things that I have done in Zabbix.

Can you tell us about your professional plans? In addition, should we wait for you at the Zabbix Summit in the following years with new and insightful cases (maybe even offline in Riga, who knows)?

My last job was working as an Audio-Visual engineer, and I transitioned into a Systems Infrastructure engineer so I’m not sure what I will do next. I have been enjoying developing and supporting Zabbix so I will likely continue to do that. I plan to be in-person at Zabbix Summit when it is possible!

Deploying and configuring Zabbix 5.4 in a multi-tenant environment

Post Syndicated from Arturs Lontons original https://blog.zabbix.com/deploying-and-configuring-zabbix-5-4-in-a-multi-tenant-environment/15109/

In this post and the video, we will discuss deploying and configuring Zabbix 5.4 in a multi-tenant environment and how Zabbix is finally ready for real multi-tenant use cases thanks to multiple features.

Contents

I. Monitoring requirements of multi-tenant environments (0:30)
II. Supported monitoring approaches (2:32)

III. Zabbix and multi-tenant environment (5:56)

IV. To-do list (21:36)
V. Questions & Answers (23:32)

Monitoring requirements of multi-tenant environments

Before talking Zabbix, let us first analyze the core requirements behind multi-tenant environments. Such environments can be quite complex with a particular set of prerequisites that we have to be sure we can satisfy before continuing further.

  • The core idea behind multi-tenancy is support for multiple customers. Therefore we need to support granular role/permission schema. The ability to define different roles for different customers and limit what they can access is key to success for such deployments.
  • Multiple customers means a lot of data. No matter if we’re talking about a single Zabbix instance or scaling by deploying multiple Zabbix instances (say, for different regions) we need to have the ability to process large amounts of data. 
  • On top of that, we must be able to scale upwards, ideally – both horizontally and vertically. More customers, different requirements, varying amounts of data to process – all of this needs to be accounted for in advance.
  • Redundancy is another key factor for us. As service providers, we absolutely cannot afford any downtime or data loss. While this may be acceptable in our own home labs or classrooms, this is not the case here. Unscheduled downtime could potentially result in a loss of a customer.

Supported monitoring approaches

Now that we have covered the architectural requirements, let’s focus on data collection. No matter the monitoring solution, the easiest approach in most cases would simply be to tell our customer to deploy an agent and be done with it. Unfortunately, this often doesn’t sit will with the end user and their security team. Let us also not forget that it is simply not possible to deploy an agent on some devices or environments – what then? Having a vast selection of monitoring methods is key for successful deployment of a multi-tenant monitoring service.

Let us take a look at this in the context of Zabbix.

Agent

  • With Zabbix agents we can obtain data in two ways – in passive (polling) and active modes (trapping). This is extremely useful while working with multiple customers, since each of them will have different internal network security policies. I have personally seen cases where only one of these approaches is supported, while the other is restricted by the security policies.
  • Agents also support deployment on different platforms (Windows, Unix, etc.), as well as execution of external third-party scripts either by way of User parameters or system.run item key.
  • Active agents are also capable of reading log files and event logs on Windows environments. This can be extremely useful, since many applications, even in-house ones, can provide a lot of monitoring data by logging it.

Agent-supported deployment on various platforms


Since we need to stay flexible, there are many other monitoring approaches supported by Zabbix that we can utilize:

  • SNMP, HTTP, IPMI and SSH agentless monitoring.
  • Simple checks (ICMP pings, port statuses).
  • Database and Java application monitoring.
  • External scripts (executed by the Zabbix server, Zabbix proxy or Zabbix agent).
  • Aggregations and calculations of existing data.
  • VMware monitoring and integration.
  • Web monitoring by creating web scenarios.
  • Synthetic monitoring for simulating real life user transactions.

Latest improvements

Why are we putting emphasis on multi tenancy just now? The reason is a couple of great features added in the last few releases. These features can finally allow us to utilize Zabbix in a truly multitenant environment:

Added in Zabbix 5.2:

  • Ability to create customizable user roles based on user types;
  • Secrets can now be stored in an, highly secure external vault;
  • Improvements in configuring frontend were also added. For example, each user can now select their time zone for frontend data display. This will be relevant for users in different geographical locations.

Added in Zabbix 5.4:

  • Users now have the ability to send scheduled reports. This is extremely useful for customers who may wish to receive scheduled reports about their environments. Now, instead of utilizing third-party scripts to export data and generate reports, you can use the native Zabbix functionality.
  • Major performance improvements have also been added, especially for really large instances with tens of thousands of new incoming values per second.

Zabbix and multi-tenant environment

How do we use Zabbix in a multi-tenant environment? Essentially, we provide Zabbix as a service. We use the Zabbix monitoring tool to monitor our clients (ABC and BCD in the image). We monitor their network traffic, their operating system statistics, application statistics, log files, etc. For each tenant, these monitoring requirements are going to be different.

Multi-tenant environment

Zabbix proxy

Multi-tenancy would not be possible without Zabbix proxies. With Zabbix proxies we can deploy them in customer offices, data centers, organization branches and collect data locally. Since proxies also perform preprocessing, we can even utilize them to transform and normalize metrics or even discard some of the collected metrics before forwarding them to the central Zabbix backend server.

  • Proxies are capable of performing preprocessing ever since Zabbix version 5.0. This allows us to normalize and transform data, for example – change our textual data to numeric data, use throttling and other pre-processing approaches. Even custom JavaScript is supported nowadays to format or normalize the data before we send it to our central Zabbix backend server. So, instead of the server being responsible for all of the preprocessing and having quite a large preprocessing overhead, now the proxy can do it and then forward the data to the server.
  • In addition, on the proxy, the data gets compressed before forwarding to the server thus saving some network traffic overhead.
  • The proxy still continues collecting data and storing it in its own database even in case of a network outage on the customer’s site.
  • Once we collect the data by the proxy, it gets sent to the server via a single connection, which is a lot more feasible from the network security perspective. In this case we need to create only a single firewall rule as opposed to a wide array of rules if we were to monitor the customer’s site directly from the central Zabbix backend server.
  • We can execute remote scripts on the proxy.
  • We can also deploy multiple proxies to improve scalability. If a single proxy cannot handle the amount of data that we are gathering or preprocessing, we can always deploy an extra proxy. They are easy to deploy, and can even use out-of-the-box SQLite databases.

Passive and active proxies

With proxies can also select the direction of the connection. We can deploy passive proxies, which get polled by the Zabbix backend server. In that case, the Zabbix server pulls the data from the proxy. In this scenario the Zabbix server is the one responsible for establishing the connection to the proxy. This adds a minor performance overhead to the Zabbix backend server. On the other hand, we can also deploy active proxies, where we remove that overhead from the server and proxy sends the data autonomously to the server.

At the end of the day, similar to how it goes with agent requirements, the proxy mode will depend on the security policies of the customer. Don’t forget that we aren’t restricted to a single type of proxy –  we can have both of these proxy types running at the same time.

Selecting the connection direction

Data preprocessing — throttling

Preprocessing can help us not only normalize our data, but we can also utilize it to save up on storage and performance overhead, which is vital in large environments.

When monitoring a service or an application state, we are going to be obtaining discrete values such as 1, 2, or 3, or any number. These numbers have a tendency to repeat – if our server stays up, we are going to continue receiving a number which represents “Up”. By using the preprocessing method called throttling, we can decrease the amount of these numbers stored by discarding repeating values. Only status changes are stored, therefore we can potentially save some database space and remove unneeded data processing overhead.

Discarding unchanged values


At this point in time, this feature sees more and more usage in many Zabbix environments, though it was severely underutilized initially when Zabbix 5.0 came out. So, if you aren’t using throttling yet and you’re running on 5.0 or newer, I definitely suggest trying to implement it to some extent. It is available in Preprocessing section of the item configuration.

Permissions

Robust permission design is essential to a multi-tenant environment. Even though permission logic has seen an addition of roles, the user group to host group relations haven’t been abandoned and still play vital role in overall permission schema.

With roles we still have to utilize the three user types – Users, Admin, and Super admins.

User role overview

Here you can see the user role and the UI elements the user has access to together with API restrictions and the actions the user can perform.

Roles grant the ability to configure access to specific UI elements, actions and restrict API calls in a granular fashion. So, when you’re configuring a role, you will see a screen similar to the one below:

Configuring user roles

User roles

Here you can select User type. The user type restrictions still apply. Users can get access only to Monitoring and Inventory, Admins can get access to except the Administration section, and Super admins can get access to every section, including Administration.

With roles we can further restrict these user types. You can have Super admins with some limitations, so that they could only do specific actions and access specific UI sections.

This option has two core benefits. The first one is security as we can limit what our customers can do and what they can access. The other benefit is in the UX, as we can simplify the UI for our users, especially people not experienced with Zabbix. We can restrict the visibility of the sections that the end users don’t have access to, so they will not be concerned with navigating through multiple sections and subsections that they are not familiar with.

User groups

We still have user groups and user groups to host groups relations, which we have to take into consideration. Access to hosts is defined on User groups. So, we have to define our user groups and assign Full/Read only/Deny permissions on particular host groups. This is how we limit what specific customers can access.

User groups

In addition, we can have host groups defined in a hierarchical manner. For instance, if you have two customers each of then having a “Network Devices” subgroup, we can select to include the root group and all of its subgroups when assigning user group to host group permissions. This is a really elegant and quick way to give a User or an Admin on the customer’s side access to all of their hosts or limit a specific organizational unit to only access what they need, e.g.: only permit access to network devices for network administrators.

Using group hierarchy

High availability

The next important decision is the HA implementation. Going without some sort of HA solution is simply too risky and therefore is not an option with such environments.

  • HA can be used to minimize downtime and add redundancy.
  • Zabbix supporst Linux HA tools – PCS, Corosync, Pacemaker, which are used to enable HA. You are also welcome to try and use other third-party tools for HA.
  • Out-of-the-box HA is planned for Zabbix 6.0.

HA setup

To achieve a quorum in our HA environment, we will require an odd number of nodes. For Zabbix backend HA it is very much recommended to have at least three nodes. Does that mean that you have to deploy 3 Zabbix servers? Not really – our third node is going to be a really small arbitration node, which is simply going to be checking connections to the two other Zabbix nodes and giving a vote to achieve quorum in case of issues with one of the nodes.

In the end we will have three nodes:  Zabbix server A, Zabbix server B, and the Arbiter node

  • An odd number of nodes is recommended to achieve quorum.
  • Only Active/Passive cluster architecture is supported.
  • We cannot have two Zabbix nodes active running at the same time and talking to the same database. It is important to use some ‘shoot the other node in the head’ mechanism — STONITH to avoid such split-brain scenarios.

Failure to abide by these requirements can result in issues with database consistency, issues with underlying queries and cleaning up or inserting data. This can cause unexpected Zabbix backend server crashes down the line.

In addition, it is very common to have a requirement for proxies to be deployed with HA. Before implementing HA for proxies, we need to decide if we really do need it. HA adds a significant configuration management overhead. We can have hundreds if not thousands of proxies, and managing HA for each of those can add a significant overhead. Of course, the more comfortable you feel with the HA tools, the easier the deployment and the management of the environment.

Another approach for  Zabbix proxy HA can also be implemented by using Zabbix API scripts. We can essentially have two proxies running without the need to have the HA suite. In this case, if proxy A is down, we can use Zabbix API to move a host from proxy A to proxy B.

Using Zabbix API script to change the proxy

Here, host.massupdate is used to change the proxy on the hosts. Combine this with a robust scripting logic and you end up with a very viable approach to move your hosts between proxies in failover scenarios.

Database replication

We have covered the HA for Zabbix server backend and let’s remember that with frontend servers, we can simply bring up additional frontends, for instance, by utilizing Docker containers. But what about the DB redundancy?

  • Database replication can be used as a form of redundancy for the Zabbix DB. No matter the DB backend – Postgres, MySQL, Oracle, we can deploy multiple DB nodes and utilize the native DB replication or use third-party tools for replication, for instance, Galera Cluster.
  • I personally prefer using native replication tools as it is a bit more simple and you don’t have to concern yourself with another configuration and management layer that could potentially fail and be a bother to troubleshoot. But this will depend on your requirements, design and skillset.

Let’s look at an example with MySQL replication. You can set it up in many different ways as multiple replication approaches are supported: master/slave, master/master, or even have multiple masters replicating to one another. It is completely up to you how to implement replication, especially if you are already experienced with such deployments.

Which approach is best? At the end of the day it will all depend on your company policies, database backend and a compromise between simplicty and extra redundancy. I definitely suggest delving deeper and studying use cases and articles for the DB backend of your choice, before you decide to go with any particular approach.

Database replication

Database performance tuning

Database tuning is vital for the long term stability of your Zabbix instance. The database defaults might be sufficient for your home office, but for large multi-tenant environments with tens of thousands new values per second they will not suffice. The database defaults depend on the database backend and the database version used, but ideally, these should be tuned and tested, preferably during the design stage, before you have deployed your Zabbix instance in production.

After installing the database backend we need to take a look at the hardware resources available. Ideally, you have already estimated the hardware resources required for your instance and ensured that DB hosts have sufficient memory, CPU resources and storage has been selected according to the I/O requirements. Now, you can move on to tuning your database backend.

As an example with Postgres I used PGTune — an online database tuning tool. This is a simple estimate that should still provide you with a somewhat adequate configuration. Though ideally, you should have a DBA on board that is aware of what kind of data loads you will be dealing with to help you with an optimal database configuration.

Database performance tuning

History table partitioning

In such large environments, you will most likely see that housekeeper cannot keep up with the amount of data stored, unable to clean it up in a timely fashion with the housekeeper processes utilization reaching reaching 100 percent for 20-30 minutes at a time. This will have a negative effect on the overall database performance for the duration of housekeeping.

At this point, it is recommended to implement partitioning for history/trend tables. We can use Postgres with TimescaleDB plugin for this. Partitioning is supported out of the box, and you can configure it in Administration > General > Housekeeping.

For MySQL and Oracle backends we would have to rely on custom partitioning scripts or procedures. In addition, community-provided partitioning scripts are publicly available.

As always – don’t forget to test 3rd party scripts in a test environment before deploying it in production!

Community partitioning solution for MySQL

You can always create your own partitioning script, but you should be aware of what you’re doing and how things should be partitioned. We should always be partitioning only history and trend tables.

History table partitioning with TimescaleDB

  • TimescaleDB plugin for PostgreSQL DB backends supports out-of-the-box partitioning. You don’t have to rely on community scripts.
  • On TimescaleDB, we need to specify the chunk_time_interval parameter, which will define the partition chunk size.
  • In addition, we can also add compression of history/trends, which helps to reduce the history table size by 60-80 percent. Again, in such scenarios, your database is going to be huge — terabytes in size with hundreds of customers, each having thousands of metrics per second. So, compression is a really valuable asset.
  • The only thing we have to take into account is that compressed data is read-only and cannot be changed post-compression. So, no more changes or inserts are possible for the compressed chunks.

History and trends compression

To-do list

  • Deploy the latest available Zabbix version. Ideally stick with an LTS version.
  • Deploy proxy servers, define and configure HA/Replication on Zabbix proxies, as well as on Zabbix servers and databases.
  • Implement partitioning to improve database performance.
  • Implement throttling to reduce the volume of the incoming data.
  • Tune your database! Either use online guides or consult with your DBA.

With our to-do list completed, we can have our Zabbix environment with deployed with redundancy in mind, providing monitoring as a service for hundreds of customers, multiple proxies running for each of the customers, HA in place, and Zabbix performing up to our expectations.

Questions & Answers

Question. Will Zabbix have its native HA solution? Will it be the whole package or does it involve installing individual components and maintaining them?

Answer. It’s planned on the roadmap to have a native HA solution in Zabbix 6.0. You should be able to get your hands on it when the 6.0 beta version gets released. Hopefully, you’ll be able to get your hands on it, test it out yourselves and give us feedback. From the looks of it it should be very much plug-and-play and will remove a lot of management overhead when comparing it with current HA implementation. Right now this is being developed only for the Zabbix backend server. As for the frontend – nothing is stopping you from having multiple frontends pointed at the same DB/Zabbix backend server. 

Question. Can I run Zabbix on a single server and sell monitoring service to several customers with fully isolated environments, not just GUI, but also items, triggers, etc.

Answer. Yes, you can. You can have a single Zabbix instance and multiple customers being monitored by this instance. The only extra step that might be required is deploying proxies on the customer’s side. By using permission restrictions, proxy servers, roles, etc., we can then monitor multiple customers from a single Zabbix instance.

Question. When we change proxy, the agent configuration has to be updated. What about HA configuration on the proxy?

Answer. That really depends on the approach. If the agent is getting pointed at the virtual IP address and HA is managed by PCS, Corosync, or Pacemaker, then it should be fine as is and the VIP should just be on the currently active host. So, you’ll be essentially rerouted. With the HA by way of API approach, you can simply allow your agent to accept connections from both proxies. With ServerActive we can also specify multiple endpoints, so agents can actually be prepared for such an environment.

Question. How to merge two different instances into a single monitoring instance?

Answer. This is a complex task. First off, both instances need to have the same major Zabbix backend version. You might simply migrate the history from one instance to another, but then you will have some problems with underlying element IDs. So, in one instance you have your own set of items, triggers, users, etc. with your own set of IDs. These will most likely conflict with the set of IDs on the other instance.

You can do partial migration or use the export function to export your templates, hosts, value maps, network maps. I would try to export as much as I can as migration on SQL level will be a real pain. It is possible if you’re stubborn enough, but it can end up being a really complex task that can take days if not weeks to fully implement and test.

Question. Do subgroups relate to templates as well?

Answer. Subgroups relate to templates in a way where we can also define permissions to reading and modifying templates. For templates, you can also create per-customer templates and assign them to host groups. Users that have access to these host groups can then read or modify the templates.

Scheduled report generation in Zabbix 5.4

Post Syndicated from Arturs Lontons original https://blog.zabbix.com/scheduled-report-generation-in-zabbix-5-4/14776/

The release of version 5.4 grants Zabbix users the ability to receive scheduled PDF reports in their mailbox, which is a very sought-after feature. This post and the video will cover all-new report-related configuration parameters and walk you through setting up scheduled report generation.

Contents

I. Reporting in Zabbix 5.4 (0:45)
II. Scheduled reports (2:26)

III. Questions & Answers (13:28)

Reporting in Zabbix 5.4

Zabbix 5.4 is our first big step in bringing out-of-the-box reporting for our end users. With this feature, we now have a foundation to build upon in the future and make reporting more robust and versatile over time. Since reports are 100% based on dashboard widgets, it’s only a matter of time until more report-focused widgets get released, thus enabling not only better dashboards, but also improving the reporting functionality.

  • We have implemented a new web service component responsible for generating reports — of course, you can install this server in a quick and easy fashion by using the provided packages.
  • Reporting works out of the box without the need to deploy or develop any custom scripts.
  • The initial configuration is easy to understand and implement.
  • Reporting will use the existing Email media types to send out these reports.
  • The reports do respect your permissions, as well as roles introduced in Zabbix 5.2.
  • You will be able to test the report before implementing it as per our schedules just by clicking the Test button.

Scheduled reports

We have added a new  Scheduled report section, where the list of reports is available, displaying the report Name, their Owner, Repeats (daily, weekly, etc.), the Period for which the report is generated, and the Last sent date.

Scheduled reports

NOTE. When you configure new reports, and they have not been sent out yet, the Last sent date will be set to ‘Never.’

Creating a report

When you create a report, you will also have to fill in a couple of fields:

  • Owner,
  • Name of the report,
  • Dashboard, the report will be based on,
  • Period — if you send the report for the Previous day, Previous week, Previous month, of Previous year,
  • Cycle — how often you send the report Daily/Weekly/Monthly/ Yearly,
  • Start time (Zabbix server time is used here),
  • Start date and end date.

Creating reports

Receiving a report

When you receive a PDF report to your mailbox, you can also use the {TIME} macro to display server time both in the subject and the body of the message.

Receiving a report

In the PDF report, you can display any information from the included dashboard – Graphs, Problems, Latest data, and much more. Thanks to all of the available widgets, we will be able to customize our reports in a very granular fashion.

Receiving a report example

The report does respect user permissions. So, in the example above, the report shows only the data to which the user (either the recipient or the report creator) has access.

Permissions

After upgrading to Zabbix 5.4, you will see two new options in the User roles section:

  • Scheduled reports UI element. Under the UI elements, you can grant or deny access to the Scheduled reports section. This is accessible only to Super admin and Admin user Types.

Permissions

If the Scheduled reports UI element is unchecked for the role, the user won’t be able to access the Scheduled report section and will see an error message. The same behavior is true if you use a URL to access the Scheduled reports.

Access to scheduled reports denied message for the users of a user role

You can also manage scheduled report permissions in the Access to actions section by checking the Manage scheduled reports box. This action permission grants or denies the ability to create or edit scheduled reports and is also accessible to Admin and Super admin user types.

Manage scheduled reports

If this check box is unchecked, the users won’t be able to create new or edit existing reports, though they will be able to access the UI section and see the list of reports and how they are configured.

Access to Manage scheduled reports restricted

Recipients of scheduled reports

When you are defining a new report, you can select the recipient. Report subscription can contain a user or a user group.

  • When selecting a user, you can specify to include or exclude the user from the subscription.
  • User group to host group permissions still apply.
  • You can specify which user is going to be generating the report – recipient or the creator of the report.:

Report recipients

For example, if we need to send some extra information to our NOC team that might not be directly available to them, you can select Current user, and the report will be generated with the permissions of the report creator. Since it is the admin that is creating the report, you can add some extra information that wouldn’t be visible to your NOC team or other regular users. They still won’t be able to access it in Zabbix, but they’ll receive it in their mailbox if you configure the report for them.

Report prerequisites

Diving a bit deeper into the technical side of things, we need to set up two additional packages to enable the reports:

  • zabbix-web-service — the additional reporting service by default listening to port 10053. The service needs to be reachable from the Zabbix server and can be deployed on the same machine as our frontend or our server. We also have the option to deploy it on a completely separate machine. The zabbix-web-service package should be available if you have added the Zabbix repository.
#yum install zabbix-web-service
  • Google Chrome is required. However, on some distributions, Chromium is reported to also work, though this is not 100% tested. Note that Google Chrome packages are not included in Zabbix. The Google Chrome packages can simply be downloaded from the Google Chrome website and then installed on the zabbix-web-service host.
#wget https://dl.google.com/linux/direct/google-chrome-stable_current_x86_64.rpm

#yum install google-chrome-stable_current_x86_64.rpm

Configuring reports — Web service

We have a whole new configuration file for the web service. Web service supports many different configuration options:

  • Logging — similar to that for server and for proxy. You can set up debug levels, select the log types, rotations, and so on.
### Option: LogType –system (syslog), file, console (standard output)
### Option: LogFile–Log file location
### Option: LogFileSize -Size in MB before rotation
### Option: DebugLevel –0 -5
  • List of allowed server addresses that can access this web service.
### Option: AllowedIP List of comma delimited IP addresses, optionally in CIDR notation, or DNS names of Zabbix servers
  • Timeout settings
### Option: Timeout -Spend no more than Timeout seconds on processing (Default –3)
  • Listen port
### Option: ListenPort -Service will listen on this port for connections from the server
(Default -ListenPort=10053)
  • Encryption settings by using certificates. This way the communication with the web service can be secured.
### Option: TLSAccept –unencrypted or cert
### Option: TLSCAFile–pathname of a file containing top level CA(s) certificates
### Option: TLSCertFile–pathname of a file containing the service certificate
### Option: TLSKeyFile–pathname of a file containing the service private key

Configuring reports — Server

In addition, the server settings now contain report-related parameters:

  • The number of report writer instances.
### Option: StartReportWriters -Number of pre-forked report writer instances.
(Default –0)

NOTE. You need to have at least one StartReportWriter

NOTE. The number of the necessary report writers will depend on the number of reports and how often you generate them.

  • Zabbix Web Service URL (to be passed on to the server)
### Option: WebServiceURL -URL to Zabbix web service, used to perform web-related tasks. (No default value)
#Example: http://192.168.1.156:10053/report

You need to make sure that we can communicate with the Zabbix Web Service URL and permit the incoming traffic through this port to the web service.

Configuring reports — Frontend

As the last step, you need to enable communication between the frontend and the web service.

In Administration > General > Other, we have a new configuration parameter where you need to specify your frontend URL that will be reachable by the web service.

Frontend URL

Once this is done, we can create a report.

Reports — testing

After you have created the report, you can test it. You can click the Test button and send out your test report to see if it works. The users to which we’re sending the report need to have an Email media assigned to them in the User settings.

NOTE. Currently, {TIME} macros are resolved only with the scheduled generation and are not available in test reports, though this might change in the future.

Testing reports

Common issues

Some parameters can certainly be misconfigured, so let’s look at the most common issues:

  • Make sure that you have a properly configured Email media assigned to the user that should be receiving the report. Otherwise, they will fail to receive it.

— Make sure that the Email media type settings are properly configured.
— Once you define the media type, if you’re creating it from scratch, make sure that you test the media type and generate a test report.

Media configuration failed

NOTE. Sending out the report failed in this example siince no media is configured for the report recipients.

  • Make sure that the correct Web service address is configured on the Zabbix server in the WebServiceURL parameter.

— Confirm that the Zabbix server can connect to the Zabbix web service and that so that we can connect to the specified port/IP address.
— Check your firewall settings if the web service is running on a dedicated machine.
— Make sure that third-party security software, such as SELinux or firewalls don’t block the communication.

Wrong WebServiceURL parameter

Otherwise, you will receive an error message on the Frontend. The error messages should be sufficient enough to point you in the right direction.

  • Make sure that the Web service URL is configured without any typos. Otherwise, you will reach the web service, but the report page will output an error — ‘404 page not found’.
WebServiceURL=http://192.168.1.156:10053/reportwrong

Typos in configuration error message

NOTE. If you see this error message, check for typos in the Zabbix server configuration file for WebServiceURL.

  • Don’t forget to assign the Frontend URL in Administration > General > Other.

— If a URL is misconfigured, you might start receiving empty reports.
— If the URL syntax is wrong, you will receive an error message about the malformed URL.

Malformed URL error message

Frontend URL configuration parameter

  • Google Chrome is not pre-packaged with Zabbix,

— You need to have Google Chrome package installed separately. You can download Google Chrome from the official Google Chrome website, for instance, by using wget.

— Make sure that Google Chrome is available via $PATH environmental variable. If you don’t have it configured, you will receive the error message, so you will need to modify the path variable and make sure the executable is available there.

$PATH environmental variable error

Questions & Answers

Question. What are the possibilities to customize the page size like A4, A3?

Answer. It will be based on how you customize your Dashboard. Currently, you cannot customize the page and select portrait or landscape, for instance.


Triggers, calculated and aggregated items in Zabbix 5.4

Post Syndicated from Aigars Kadiķis original https://blog.zabbix.com/triggers-calculated-and-aggregated-items-in-zabbix-5-4/14880/

In earlier Zabbix versions, we had three categories of things we could manage inside the instance — triggers, calculated items, and aggregated items. Each of them had its own syntax, so we could not be sure what syntax to use in a certain case. That’s why we introduced the unified syntax for every category inside the monitoring tool that will ease up the documentation task and the configuration process. To appreciate the innovation, we need to recap these three categories in Zabbix.

Contents

I. What’s different in Zabbix 5.4? (1:52)
II. Examples (9:20)
III. Aggregated checks (14:09)
IV. Questions & Answers (19:08)

The trigger is a logic implying calculating some formula. If it is true, it will generate an event, a so-called problem. At the same time, calculated items are doing calculations as well, but at the end, they store a value inside the database. This value will be either an integer or a floating number. So, both these things are doing calculations, but before Zabbix 5.4 the syntax was different.

What’s different in Zabbix 5.4?

Each item has a tag:tagvalue

It all starts almost with the item as it is how we collect the metrics. Previously, it was always an application type of thing. Whenever we designed an item, it could be a memory-type of thing, a network, CPU, etc. Now, we have these column tags.

TAG:TAGVALUE

As you can see in this example, the tag value is ‘Application’. This really lets us have a flawless upgrade operation. The ‘Application’ field is completely gone, and now we have only tags on this item level.

Period and time shift is one argument now

Previously, whenever we were dealing with trigger functions, most of the time, the first argument was the interval to be used as an input. We had two arguments: we could analyze metrics for the specified period with <period> and, to go back in time and use <time shift> after comma — <period>,<time shift>.

We have decided to use one argument — <period:time shift>.

If you want to analyze data for yesterday, or last week, or last year, you can now use one argument:

  • <1h> — during the last one hour,
  • <1h:now-1d> — during the same hour one day ago,
  • <1d:now/d> — yesterday during the day.

STR(), REGEX(), IREGEX() => FIND()

Another big change — the functions searching for the data containing a string will now be converted into one function — find().

So, the string function — STR(), which was less CPU-intensive, could search for a string. If we needed a more complex pattern, we used REGEX() or, in case-sensitive cases, the regular expression function — IREGEX(). Now, we can use a single function covering all the needs, including case-sensitive search, — find().

It contains more arguments, which specify a string way to search, and consumes less CPU power. Or we might really need to utilize the regular expression thing.

New syntax

So, in the earlier Zabbix version, the trigger had a curly parenthesis at the beginning and at the end, the key in the middle, and the trigger function mathematical calculations with the dot in the middle: {host:key.max(15m)}.

The unified syntax will always start with the function. This lets us use recursions — as some functions support multiple arguments, we can put a function inside the function thus eliminating the previous limitations: max(/host/key,15m).

This syntax is very similar to that used in the Linux file system — it starts with the forward slash, then comes the host name, and the item key with the interval (including shifting) after the first comma.

Now, the same syntax is used for triggers and calculated items. In addition, previously, we did have the aggregated items. Now, if you want to do some aggregation, you’ll have to use calculated items inside the interface.

Examples

Now, there are many things you can accomplish, which were not possible before.

Absolute time periods

We might need to know what has happened today, for instance, whether the workstation is on at 10 a.m. We can do it by summing up the agent.ping items. So, if the agent.ping is zero, then it is still offline and no one has turned the workstation on. Otherwise, the agent.ping will be 1.

sum(/host/key, 1d:now/d+1d) = 0 and time() > 100000

  • We might need to find out the maximum workstation uptime yesterday. If the uptime is bigger than 10 hours, a person might have been working at the computer for too long and might need a reminder that there’s life outside.

trendmax(/host/key, 1d:now/d)>10h

  • When analyzing user sessions, we might search for the maximum peak last week. To do that, here we compare the last week’s peak with yesterday’s peak and find out that it has doubled. So, it’s a problem and we can get an event.

trendmax(/host/key, 1d:now/d) > trendmax(/host/key, 1d:now/w) / 2

  • We can also analyze activity, for instance, the stock module memory utilization per Windows machine for the previous month. So, we are looking at the maximum memory used during the previous month per server, not the workstation, and then compare the used memory with the memory available.

trendmax(/host/key1, 1M:now/M) < last(/host/key2) / 2

Here, the server is not utilizing half of the available memory, so we will get notified.

The beauty of this trigger is that the stock template already contains all those 12 items — a collection per-used memory, a collection per-total memory. All we need to do is go to the Trigger section, install this trigger, and as soon as one single metric comes in, it will generate the event about the last month as all the data is stored inside the database.

Compare string between two hosts

Now, we can compare text strings. We can use a different type of input, for instance, different servers (say, node 1, node 2), and compare the agent versions. If the version is different or the same, you can decide what the problem is. It will fire up an event, and we can indicate what the difference between those versions is in the event title.

last(/node1/agent.version) <> last(/node2/agent.version)

Aggregated checks

Aggregation on current host (foreach)

You might need to calculate something and store the data in the database.

In this example, if we have a website. we will have a template containing a web scenario, which consists of multiple steps, such as checking for pages. It will provide the Latest data page and the response time per page.

In the Templates, we can select this calculated item, and, for instance, aggregate all those built-in response time metrics.

Average web page response time: avg(last_foreach(//web.test.time[check performance,*,resp]))

The ‘*’, the wildcard, will tell Zabbix to aggregate all the items reflecting the response time, and the double forward slash means aggregation for the current host. ‘foreach’ will now be all over the place whenever we do the aggregation. This command is the same as used in the Windows PowerShell used to go through the different types of elements: either through the hosts, either through the items.

We might use a different type of aggregation using the same approach. For instance, when monitoring the disk space, we are capturing the used space by the Linux or Windows machine that can have different drives or different modes. Using one calculated item, we can aggregate the total used space per all the mounts or all the drives on the server. This might be useful, for instance, to estimate how much disk space you need if it’s time to purchase an SSD drive.

Total used space on all drives: sum(last_foreach(//vfs.fs.size[*,used]))

Aggregation by host group

Another type of functionality — aggregation by the host group.

You might have a group, for instance, ‘MySQL servers’ with the official solution looking for the queries per second. It will aggregate all the queries per second in one single item. If there is a pool of MySQL servers, then you will end up seeing the total number of these queries and afterward linking a trigger on this item.

MySQL queries per second: sum(last_foreach(/*/mysql.queries.rate?[group=”MySQL servers”]))

Aggregation by tag:value

You can do the aggregation not only by host group but also by utilizing the item Tags (tag name and tag value). It does not need to be a tag on the item level. You can mark your host element with the role on the host level. So, you create this item inside the template, and it will search for all these items, which belong to a specific host with this tag and tag value, and do the aggregation. You will end up with an item, which has used space metrics (domain controllers in this example).

Used space on domain controllers: sum(last_foreach(/*/vfs.fs.size[*,used]?[tag=”Role:Domain Controller”]))

Questions & Answers

Question. After the upgrade, what will happen with the trigger item syntax? Do we have to rebuild everything?

Answer. It gets upgraded automatically. However, as per the results of my testing in the test environment, some items have to be checked. I would highly suggest extracting the configuration and testing the upgrade process beforehand to learn how those items will affect the system (just to be on the safe side).

Question. Are there any changes or improvements in the predictive trigger syntax?

Answer. You should definitely take a look at the roadmap for the exact information.

Question. When we’re doing an aggregation, is it always going to be on a single host or can we specify a host group or a tag?

Answer. Surely. Aggregation by host group is possible as it was before. Still, it’s more flexible now. We need to specify a host, a wildcard for the host item, and then we can add additional value by using the host group or by specifying what kind of tag the item should have. Then your parameters will be respected. We can combine all those things, that is, filter by host group and by the tag name and tag value.

In addition, when we’re doing the upgrade, the prototype items and triggers for the low-level discovery rules are also going to be automatically switched over.


What’s new in Zabbix 5.4

Post Syndicated from Alexei Vladishev original https://blog.zabbix.com/whats-new-in-zabbix-5-4/14603/

Zabbix 5.4.0 released on May 17, 2021 — a non-LTS release that will be supported only for 7-8 months, has already received a lot of attention from our users, our community, and our customers due to a number of very significant and long-anticipated improvements. Zabbix 5.4.0 release comes with scheduled PDF report generation, robust problem detection, advanced data aggregation, and other significant improvements.

Contents

I. Reporting and visualization (1:22)
II. More powerful and simple (9:04)
III. Breaking changes (37:59)
IV. Upgrade notes (40:12)
V. Questions & Answers (44:01)

Reporting and visualization

Unification of screens

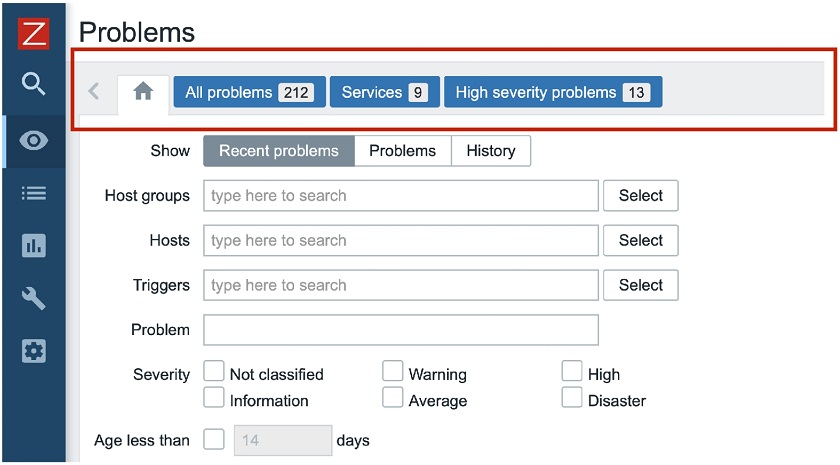
In Zabbix 5.2, we introduced pre-defined views for Problems. By accessing Monitoring > Problems, you may create different views based on different filtering options, allowing you to filter problems by certain criteria, and then save this filter as a separate view. You can easily switch between views with one click, for instance, between ‘All problems‘, ‘Services‘ (i.e. service-related problems), or ‘High severity problems‘ in this example.

Pre-defined views for Monitoring > Problems

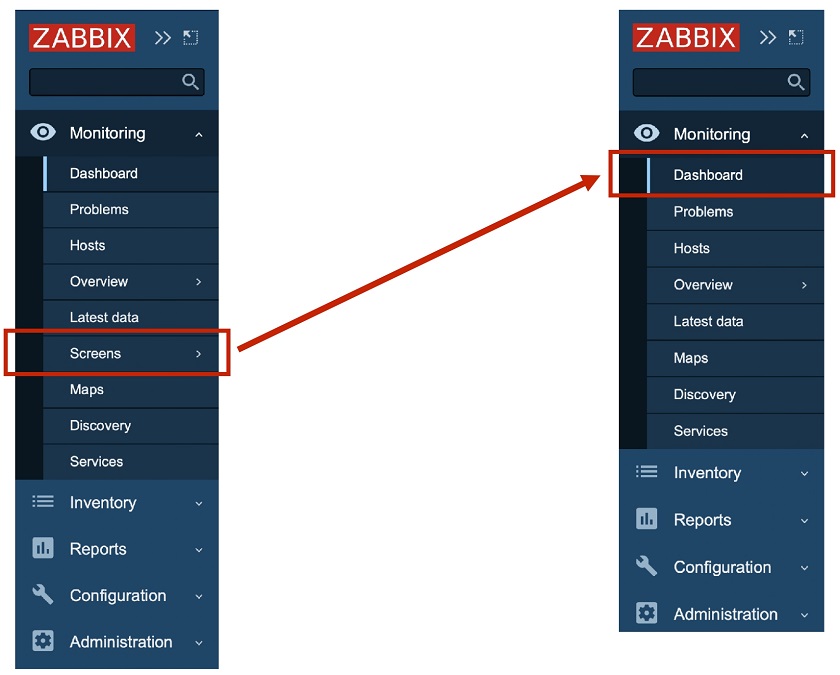
In Zabbix 5.4, we implemented the unification of screens and dashboards. This means that screens are not supported anymore. In Zabbix 5.2, we had Dashboard and Screens on the menu. In Zabbix 5.4, the Screens functionality was moved to Dashboards, where all screens and all dashboards are available, which makes the workflow much more simple and user-friendly.

New Dashboard menu time

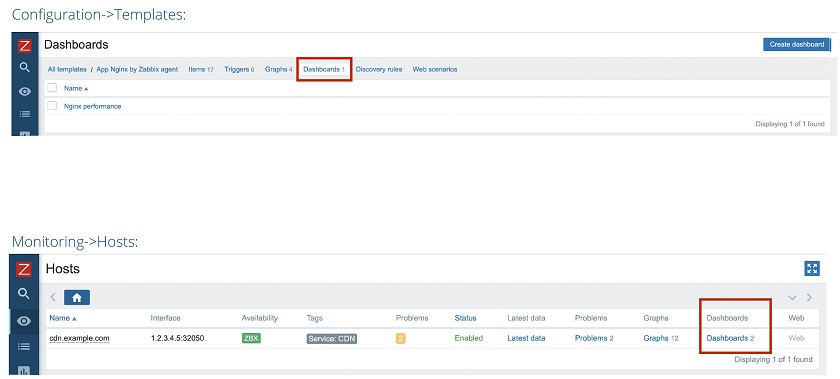
This change affected global screens, as well as local screens, which we always had on a template level. Now, we have introduced the dashboards for templates in Configuration > Templates.

For instance, we have the template for Nginx performance monitoring, so in Configuration > Templates, we have a dashboard ‘Nginx performance’. In Monitoring > Hosts, we have two dashboards for the host (cdn.example.com in this example) — ‘Nginx performance’ and the second template that may have come from some other template.

Templates for Dashboards

By clicking Dashboards for this specific host, you can go to the Dashboards view of this host.

Dashboards view for a specific host

Here, you can quickly switch between templates available for the host at the moment, such as ‘Nginx performance’ and ‘System performance’ in this example to see some Linux OS-specific metrics, such as CPU load, Disk I/O, and so on.

Multi-page dashboards

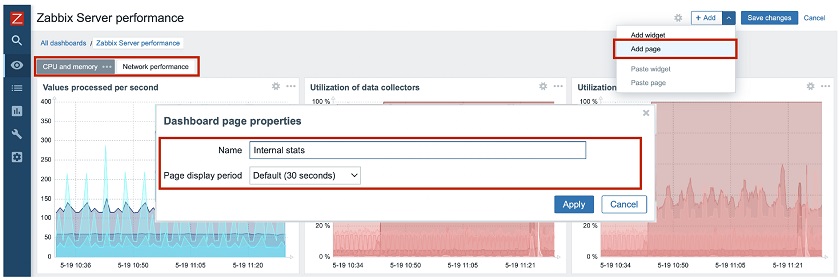
Previously, we had a very nice feature in Zabbix — slideshows or screen slideshows. Since we have moved everything to Dashboards, we spent much time thinking about how to fit it into the Dashboard functionality and found a very good solution. We introduced Multi-page Dashboards – dashboards containing several pages.

Multi-page Dashboards

In this example, in the Zabbix ‘Server performance‘ dashboard, you can see CPU memory metrics, matrix or graphs related to network performance, or any other page that can be created by clicking Add page and defining the Dashboard page properties. Then you’ll see all the pages available on the top of the Dashboard and switch easily between them. You can run the slideshow with the slideshow controls available in the full-screen mode.

Slideshow mode

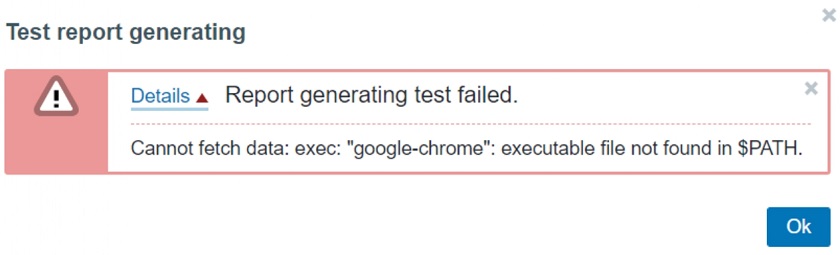
Scheduled PDF reports

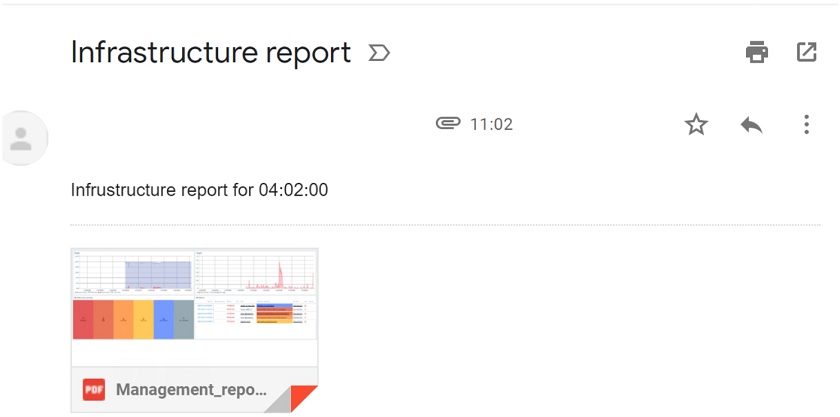
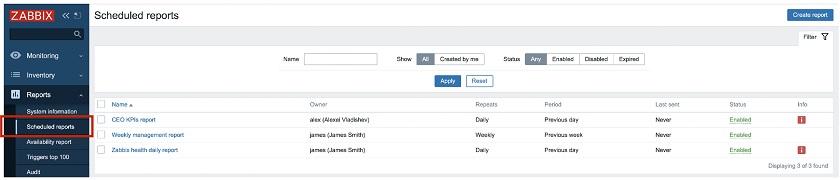
Scheduled reporting was highly anticipated by our community members, our customers, and our users. In Zabbix 5.4, we introduced scheduled PDF reporting allowing you to define, generate, and send PDF reports straight to your inbox.

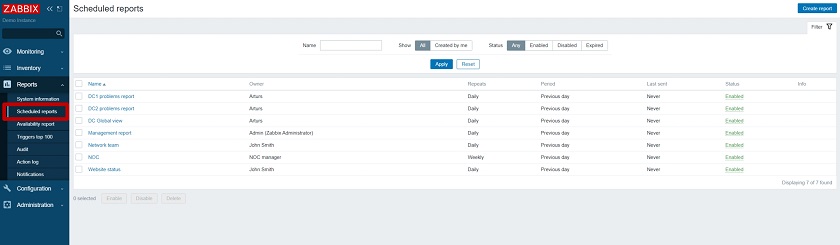
Scheduled PDF reporting

This new functionality provides some nice features, for instance:

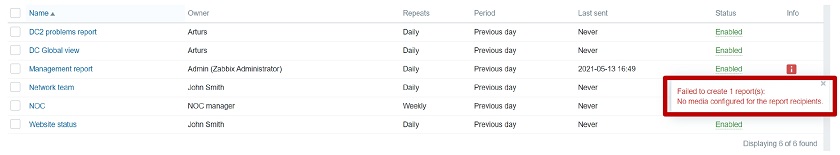
  • Centralized management of reports, so that super admins can see what reports are generated by Zabbix and sent to different users.
  • Any dashboard can be converted to a PDF report and sent to your email box.
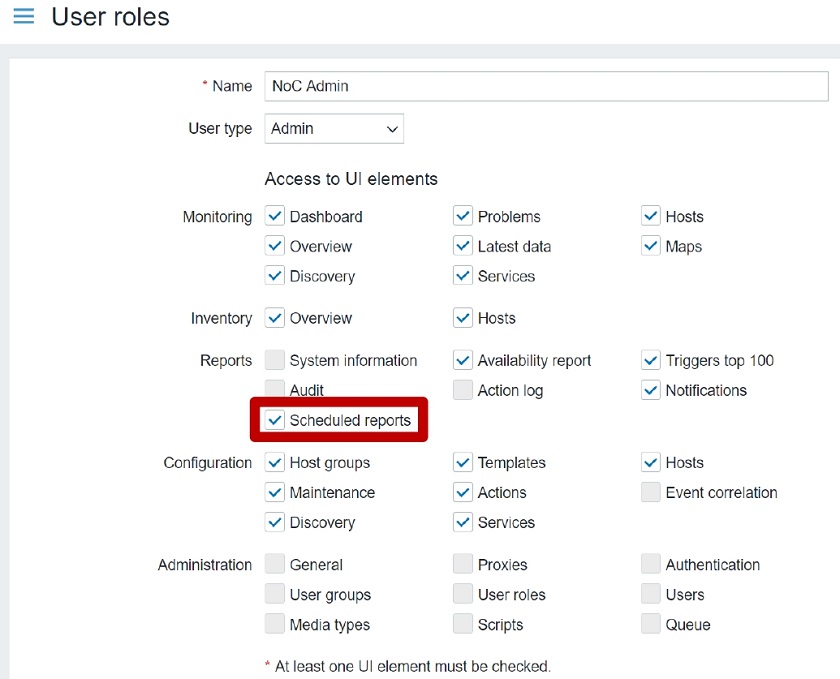
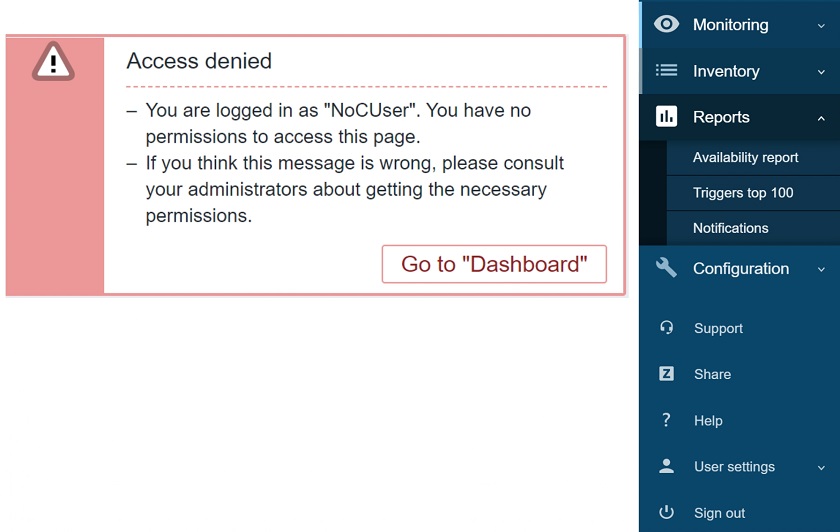
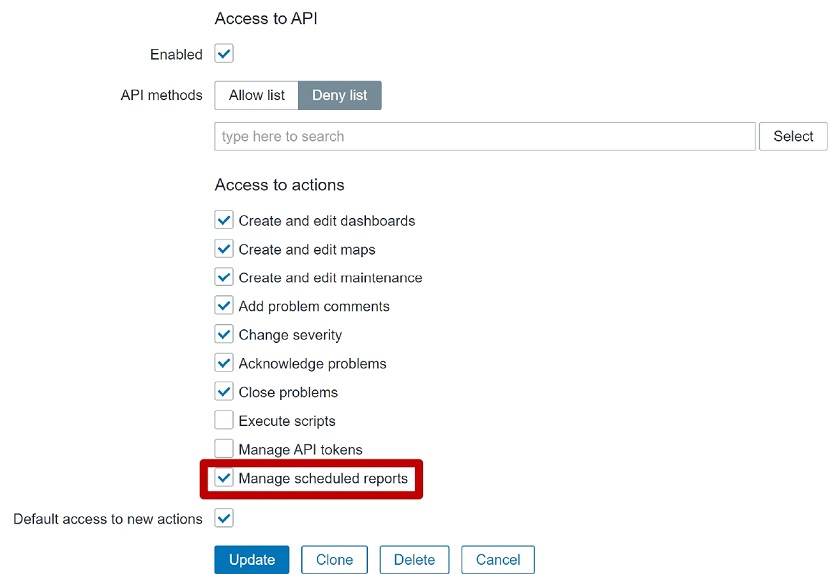
  • This functionality is accessible to all users though can be restricted by a new user role.

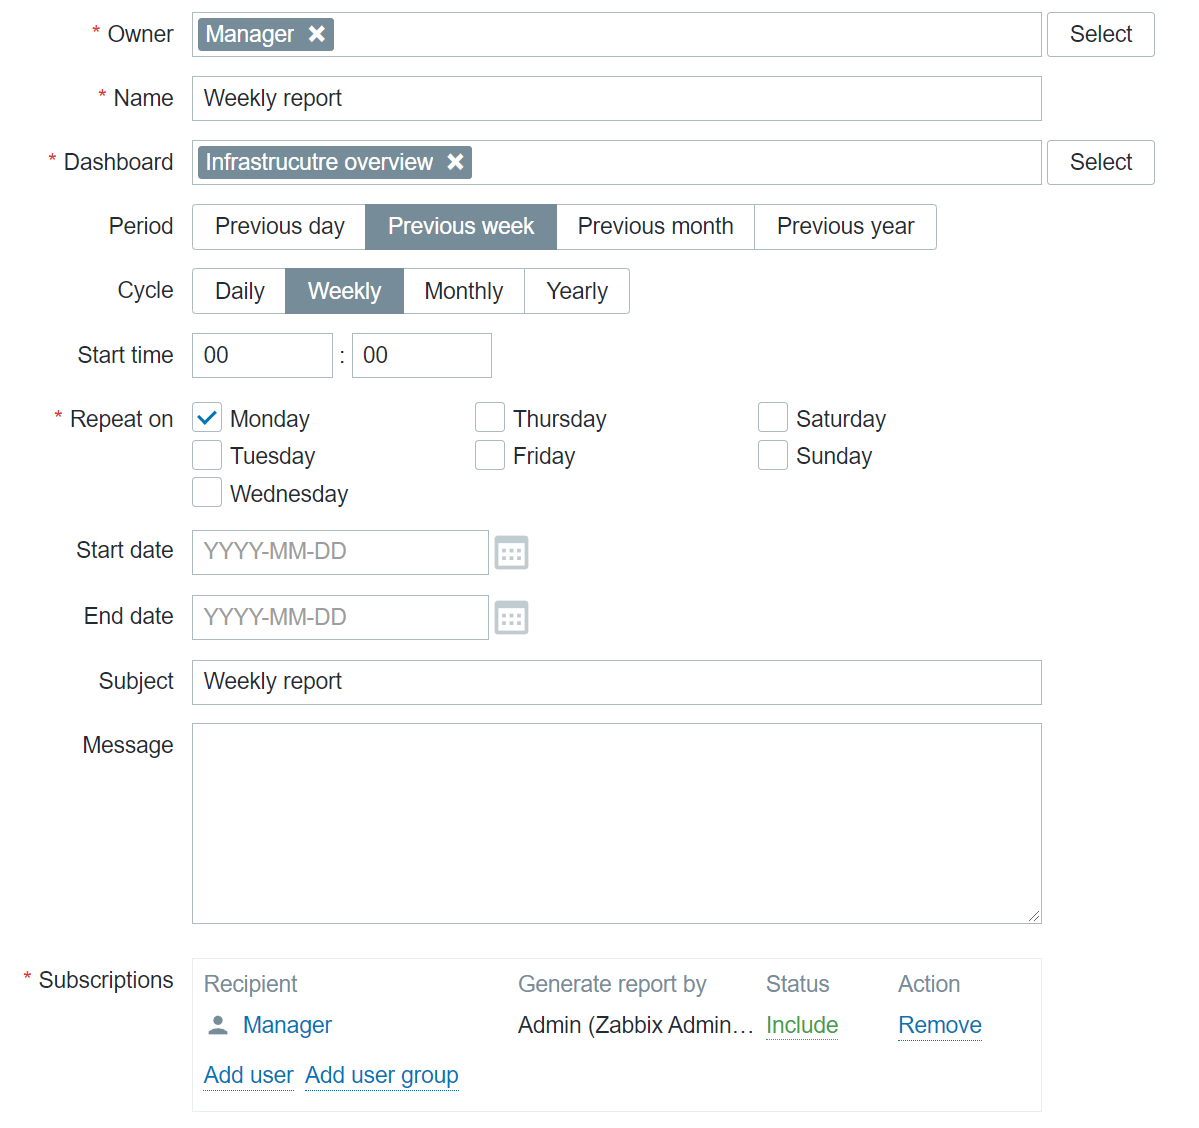
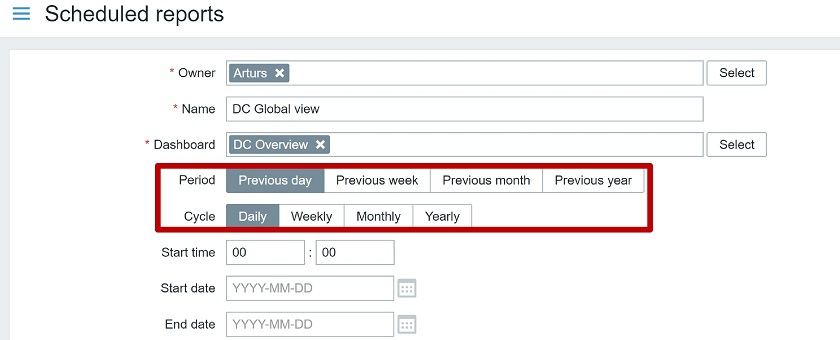
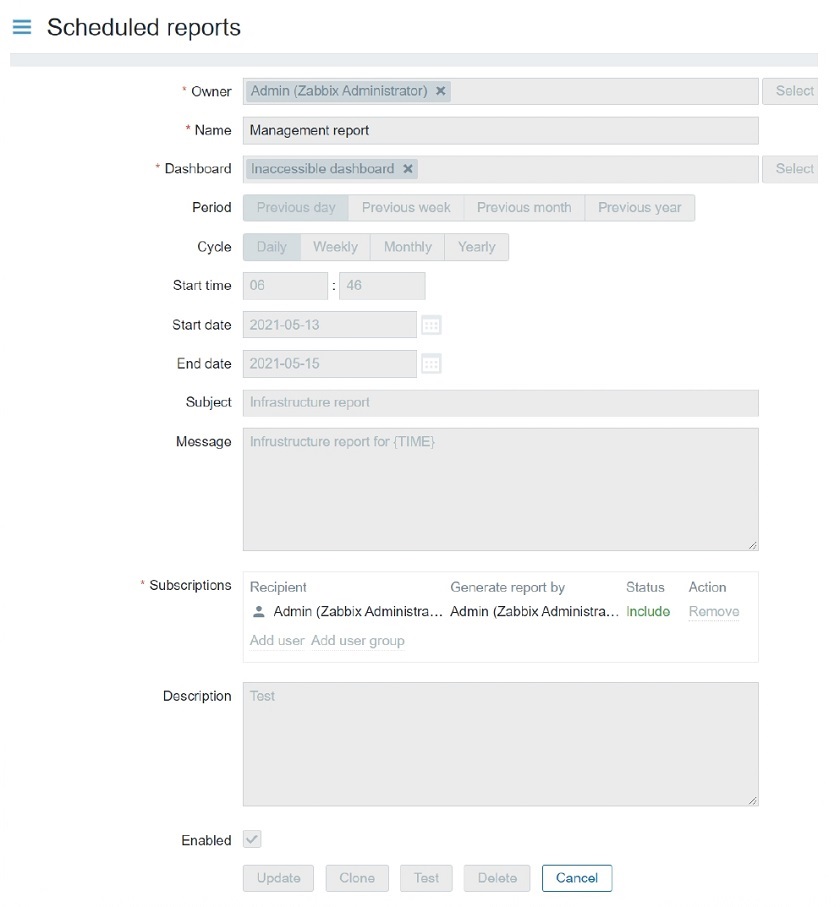
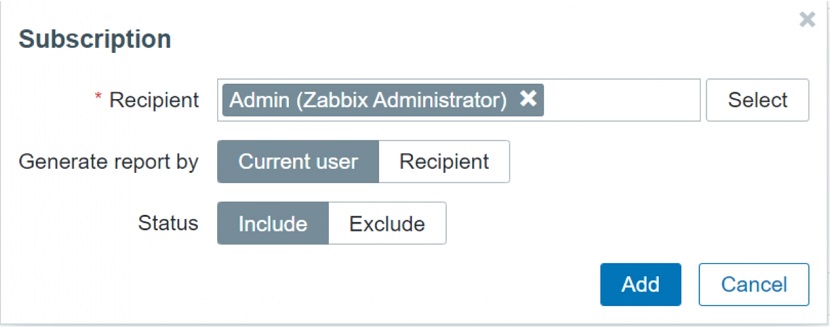
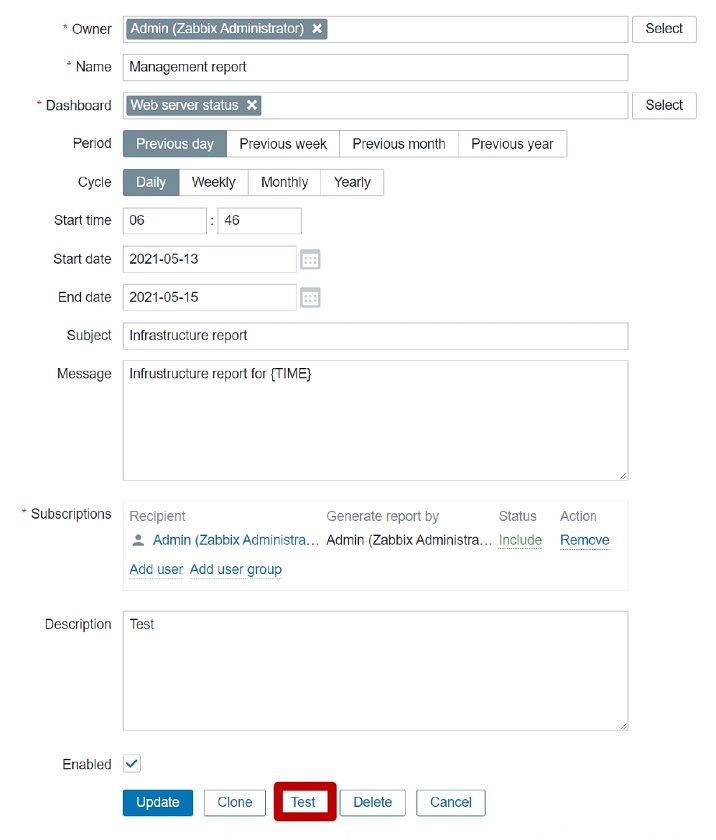
In addition, now you can determine that you need a report, for instance, with the previous week’s data every Monday at 7.00 am. All you need is to select the period for the report, and Zabbix will generate and email it to you or any other user. You can also select to receive reports daily, monthly, or yearly.

PDF reports can be scheduled daily, weekly, monthly, or yearly

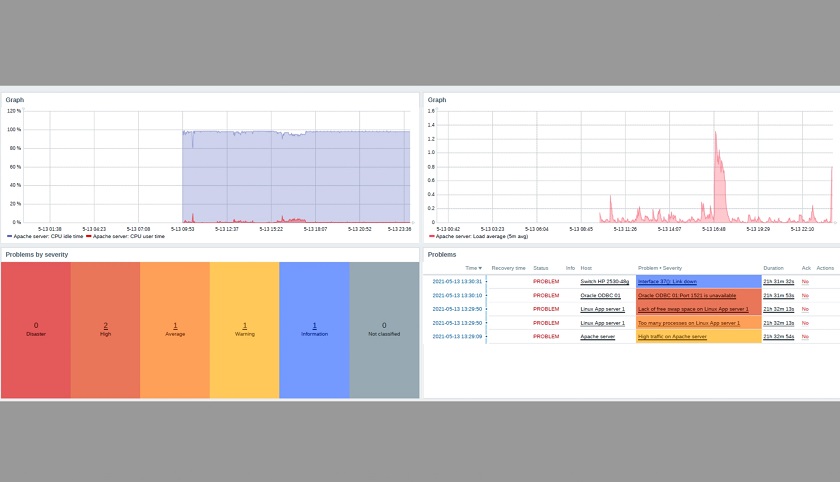
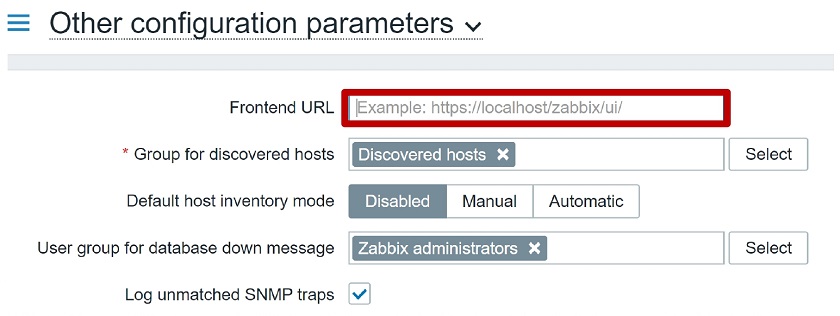
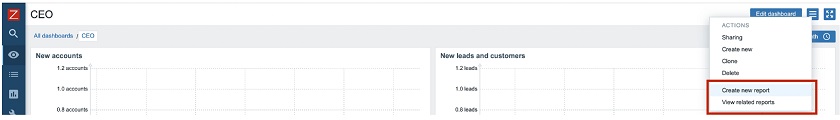
There are many other configuration parameters for PDF reports. Still, the most important advantage of PDF reporting is that this functionality is accessible from Dashboards. You just click Dashboard in Monitoring > Dashboards and select the period for PDF reporting.

PDF reporting accessible from Dashboards


More powerful and simple

When we think about what features need to be implemented in Zabbix and in what direction we would like Zabbix to go, we always consider different functionalities and improvements aimed at improving Zabbix usability and making Zabbix a simpler monitoring solution, and on the other hand, more powerful and much more flexible. Zabbix 5.4 is not an exception. We have introduced a number of very significant improvements, which simplify monitoring and make Zabbix even more flexible.

Tags for items

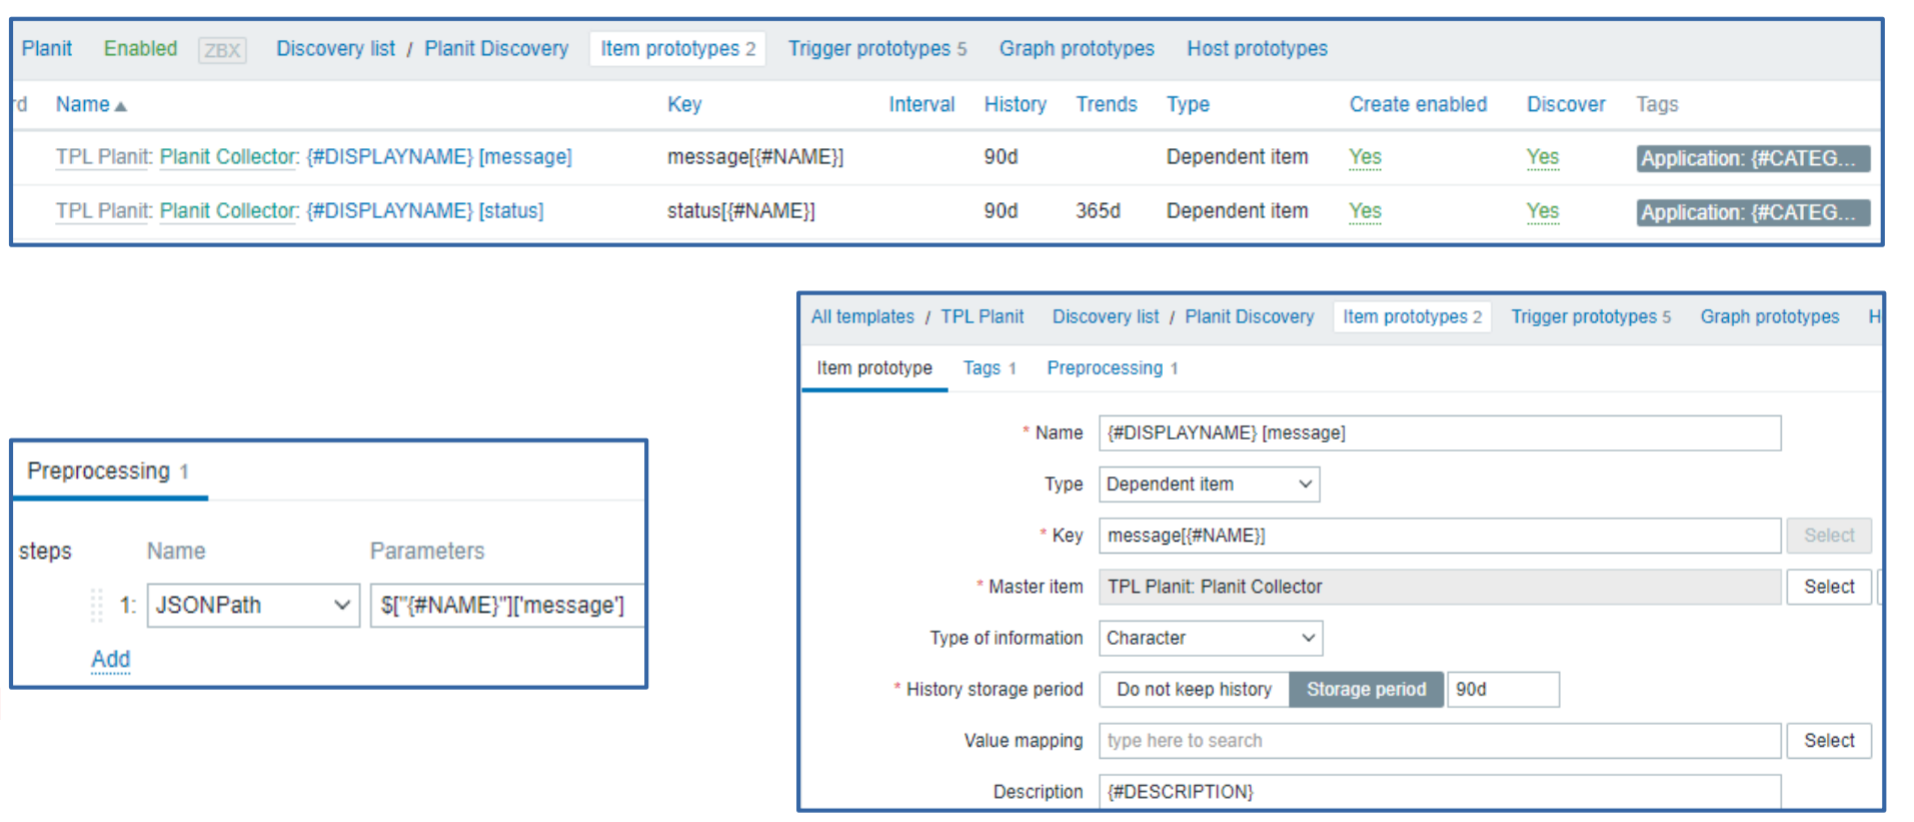
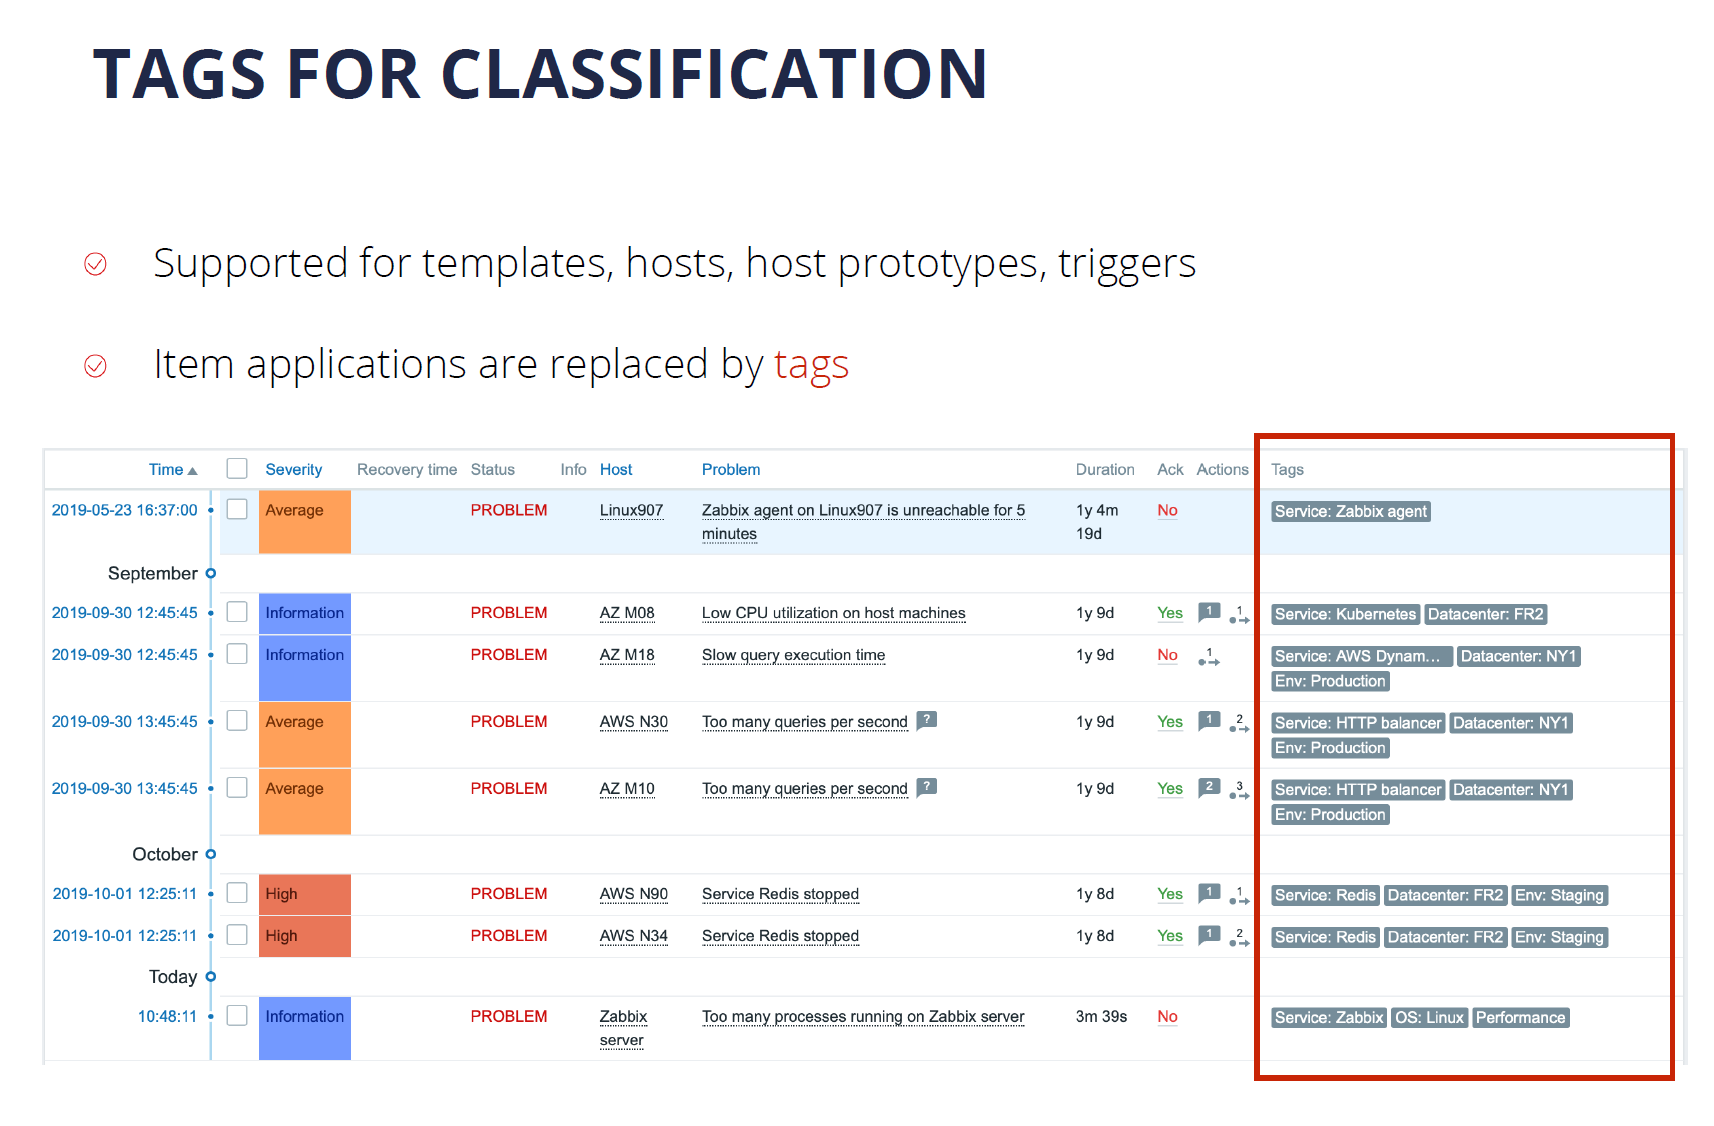
Zabbix already supports tags for almost all essential objects, such as triggers, hosts, host prototypes, and templates. Tags are everywhere. In Zabbix 5.4, we introduced tags for items (metrics).

The item-level applications have now been replaced with tags, so applications are not supported anymore. We now use a much more flexible concept of named tags. This way you can have tags providing information and values while having as many tags as you want, which is much more flexible comparing to applications.

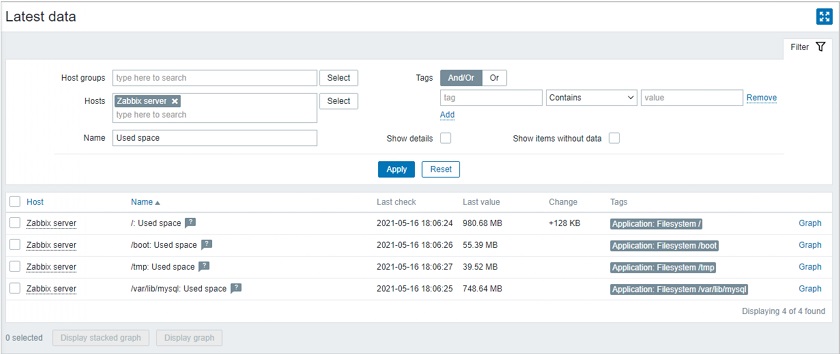
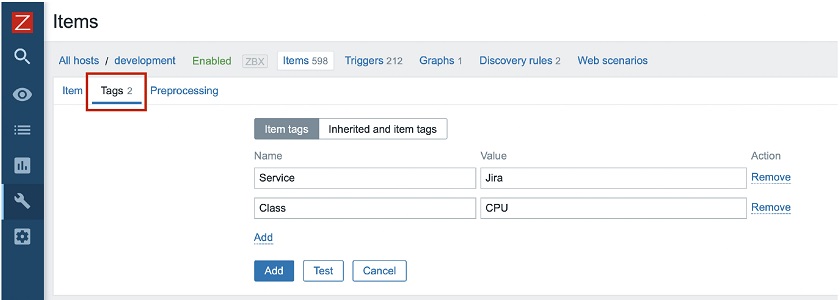
You will notice that in the configuration view of your item you now have an additional tab — Tags where you can see the defined tags, as well as their values.

Tags instead of applications

You don’t have to worry about your applications though. Your applications will be automatically converted to the tag “Application: <app name>” during the upgrade. For instance, the application ‘CPU’ will be converted to the tag “Application: <CPU>”. All information will be preserved during the upgrade.

Syntax

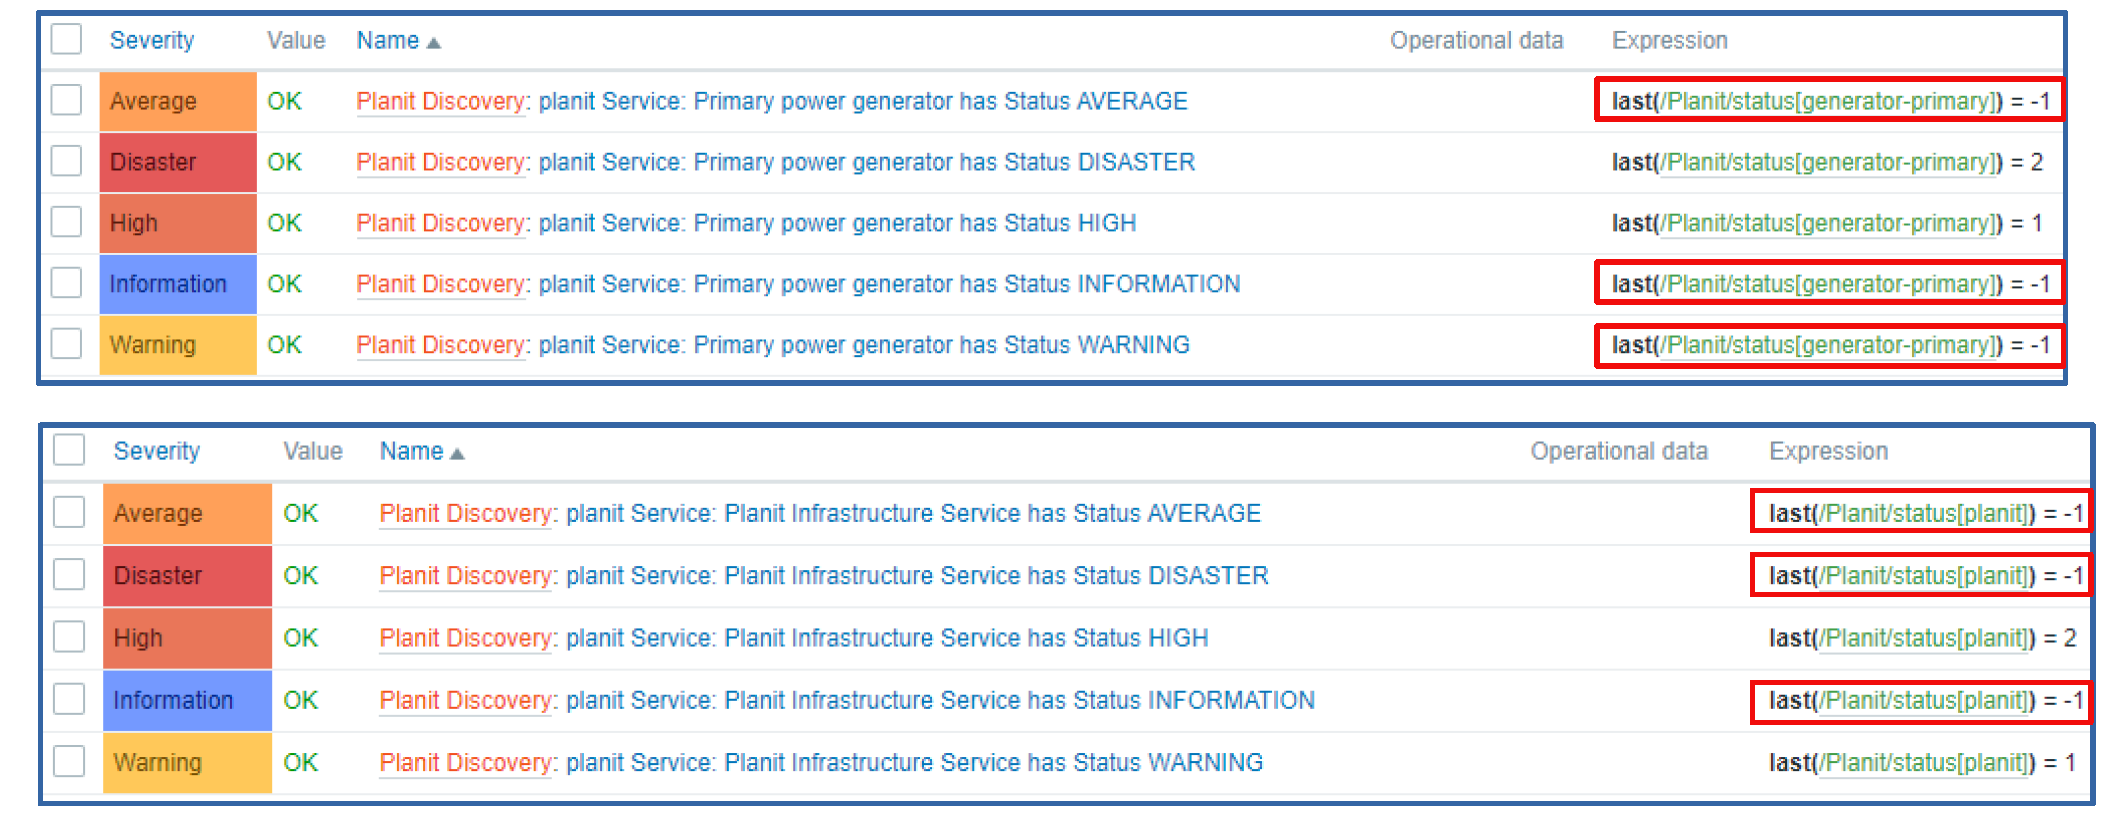
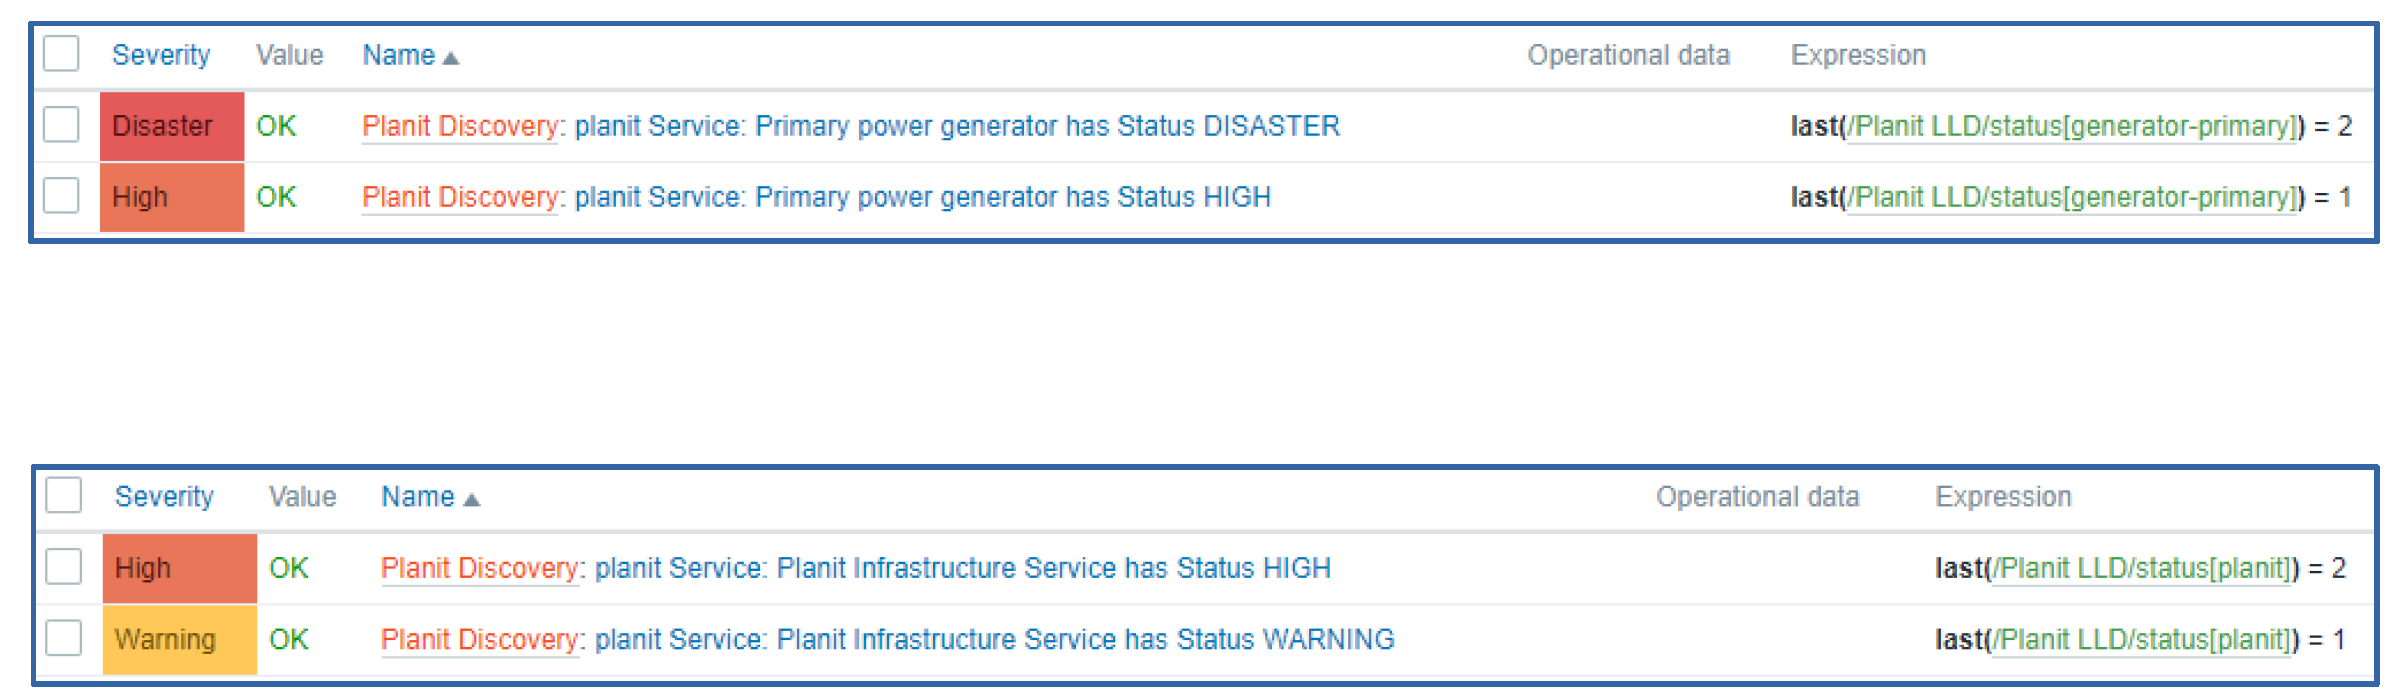
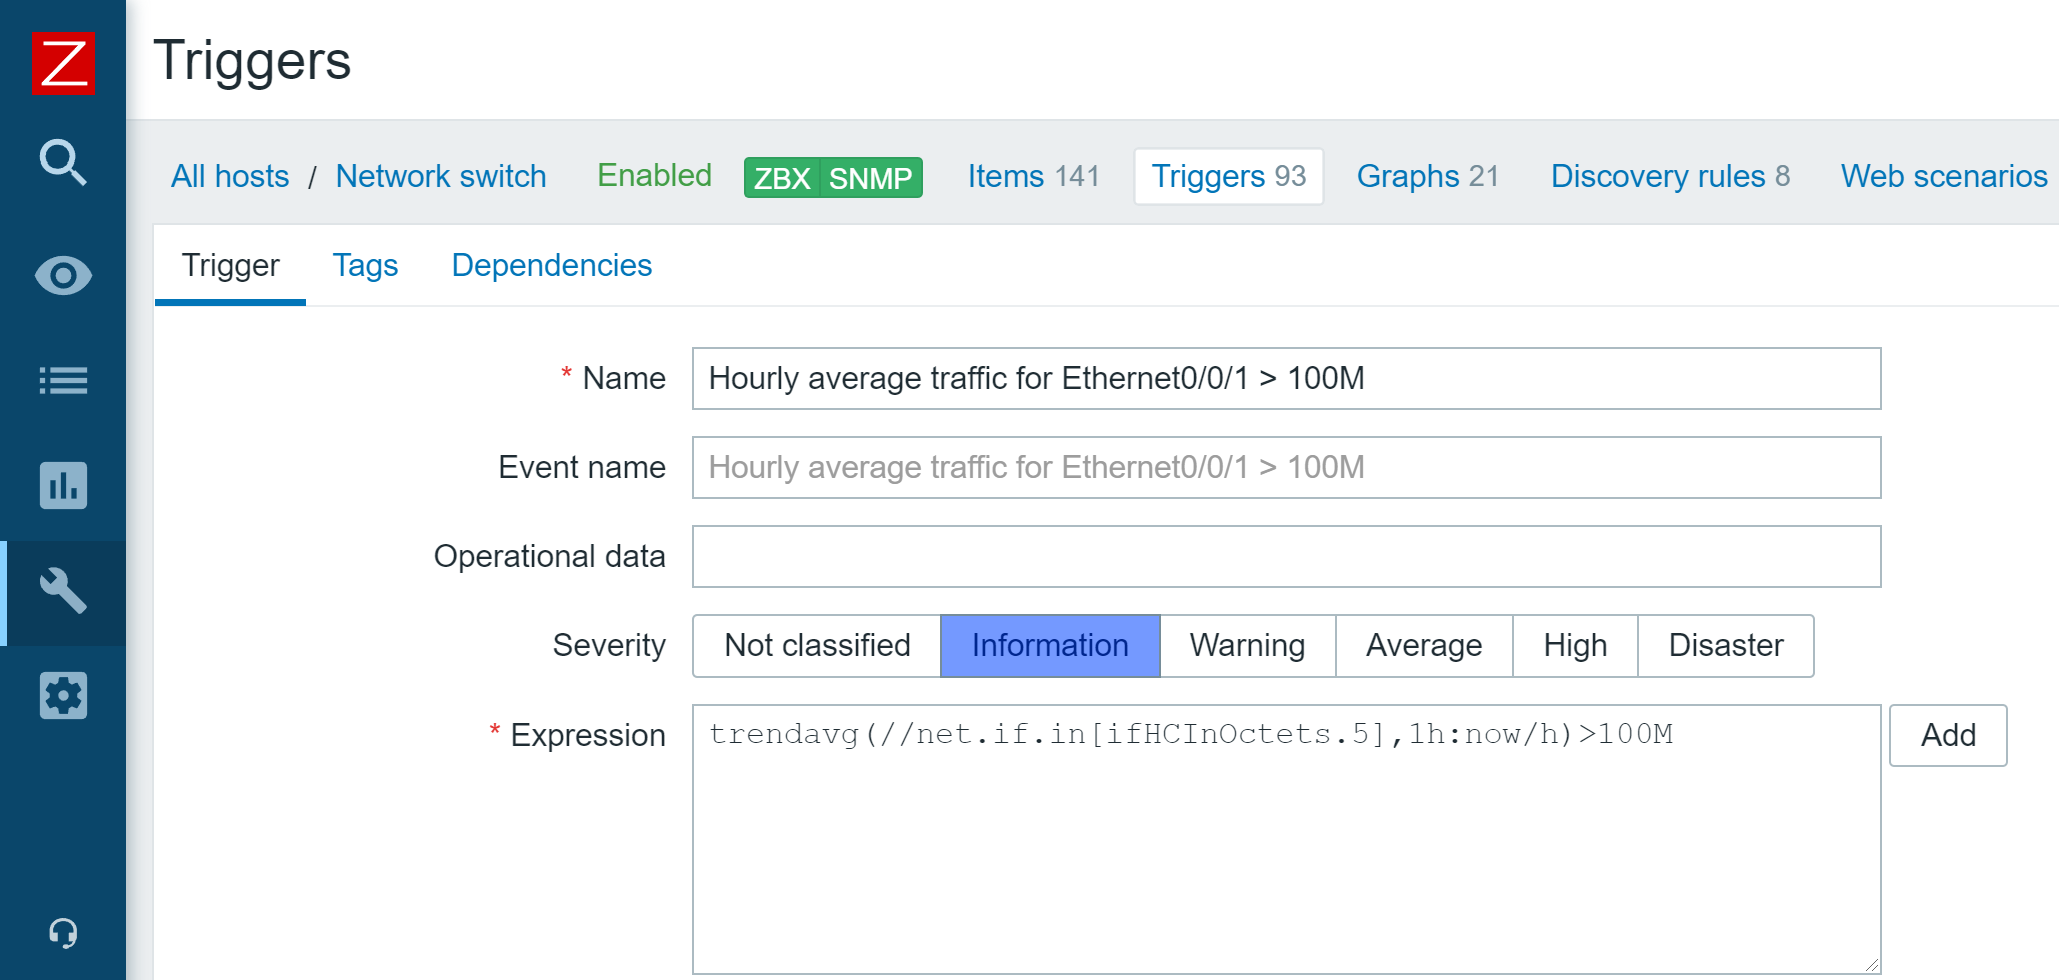
Another very interesting functionality, about which we have been thinking for several years, is a new syntax for trigger expressions. We now have unified syntax for everything in Zabbix. Let’s talk about why this is an important step forward.

In previous versions we used a special syntax for triggers, some functional syntax for calculated items, and a different syntax for aggregated items:

  • TRIGGERS: {host:key.func(params)}>0
  • CALCULATED: 100*last(“vfs.fs.size[/,free]/last(“vfs.fs.size[/,total]”)
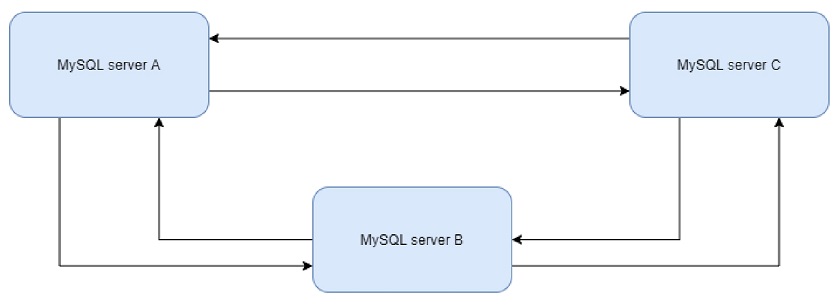
  • AGGREGATE: grpsum[“MySQL Servers”,”vfs.fs.size[/,total]”,last]

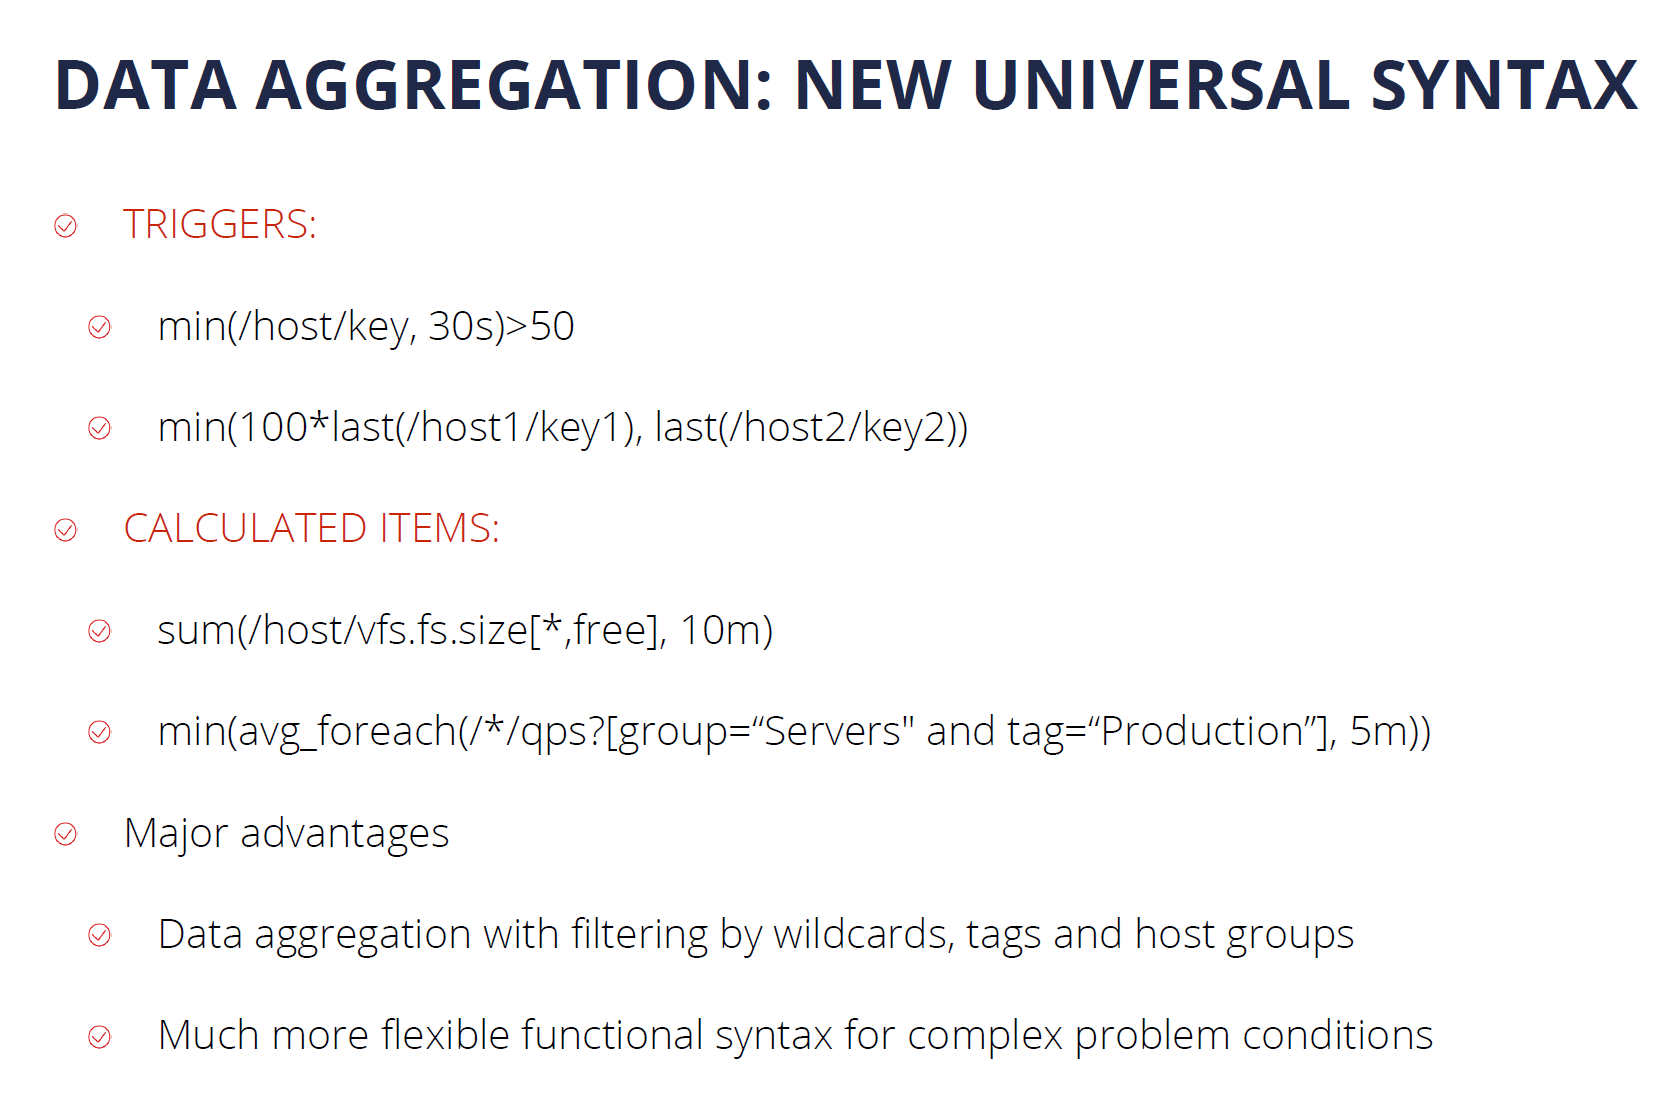
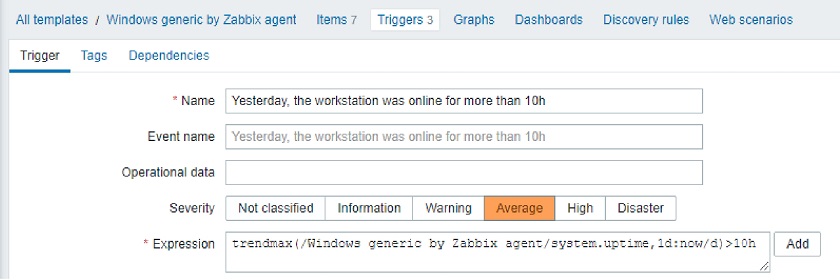
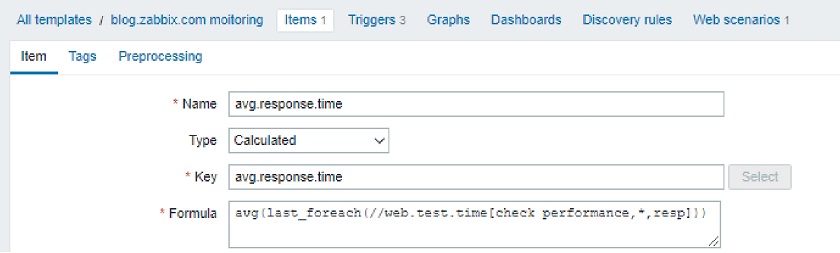
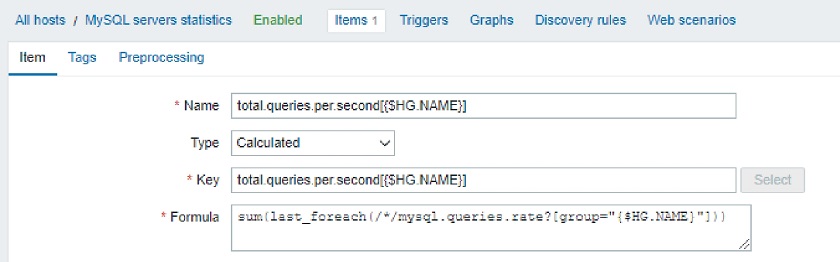
This was quite confusing, and users had to remember the syntax or consult the documentation. In Zabbix 5.4, we introduced a new and, most importantly, unified syntax. Now we use exactly the same syntax for triggers, calculated items, and aggregated items. In addition, this new syntax is more functional, while the old one was more object-oriented.

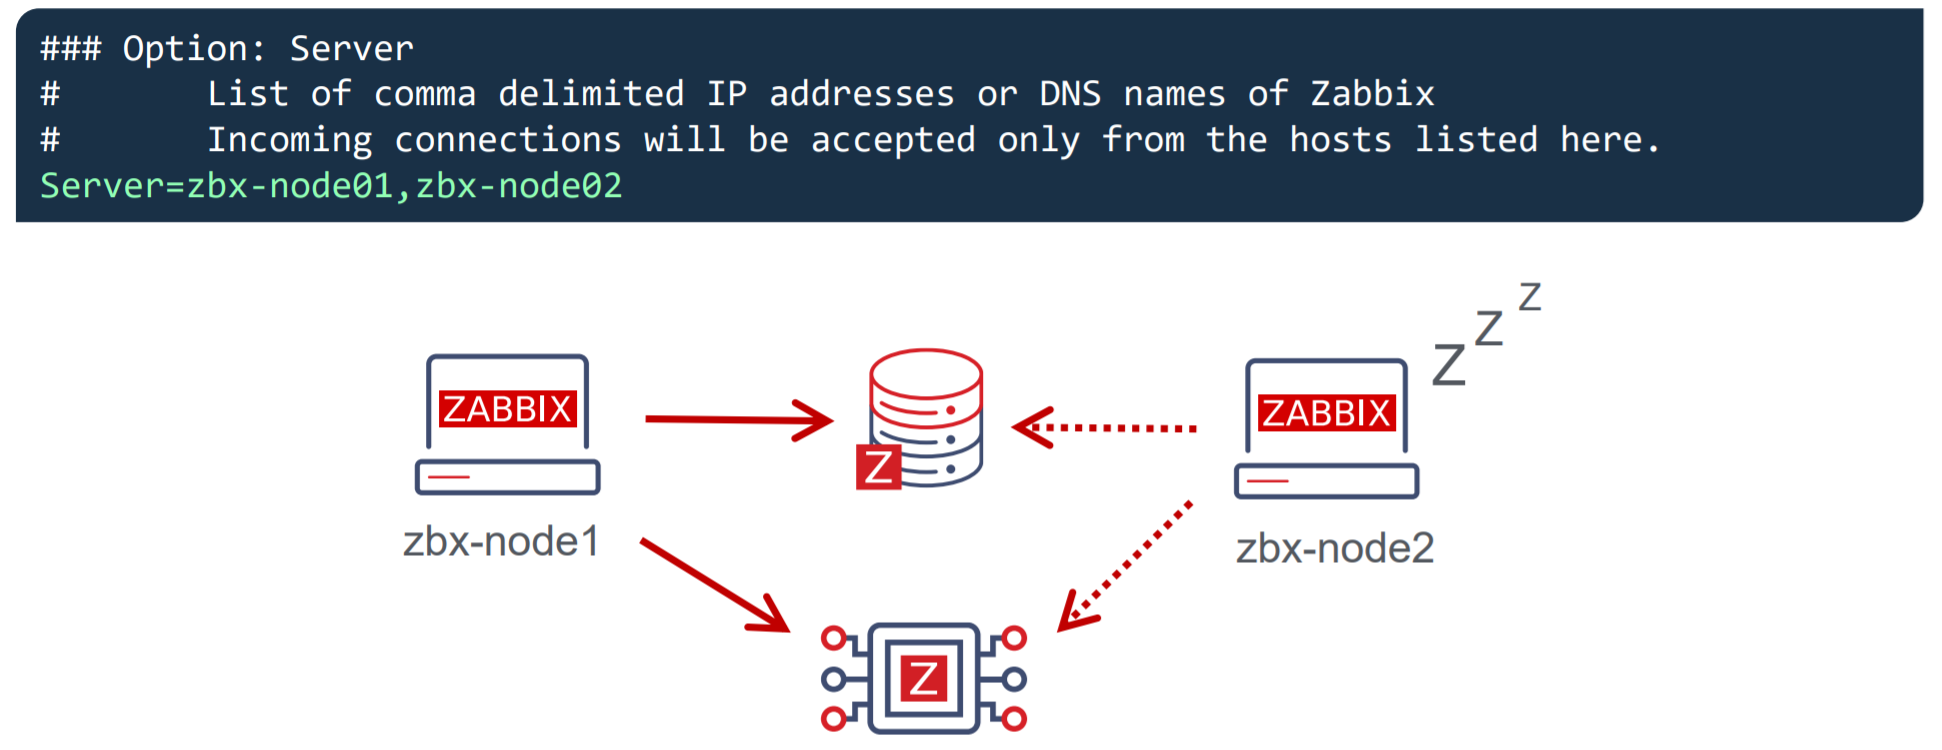
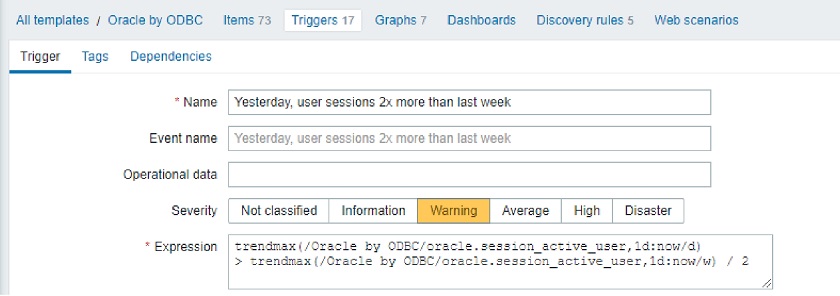
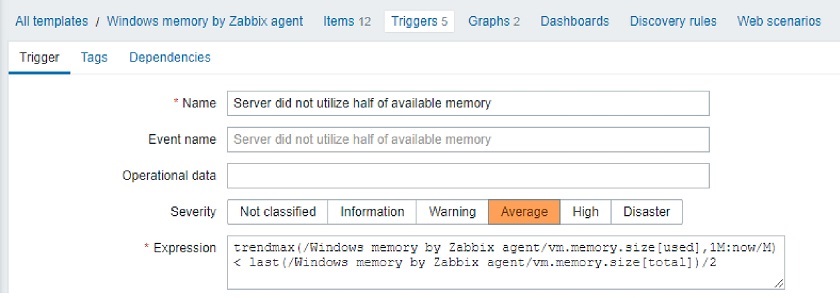
  • TRIGGERS: func(/host/key, params)>0
  • CALCULATED: sum(/host/vfs.fs.size[*,free], 10m)
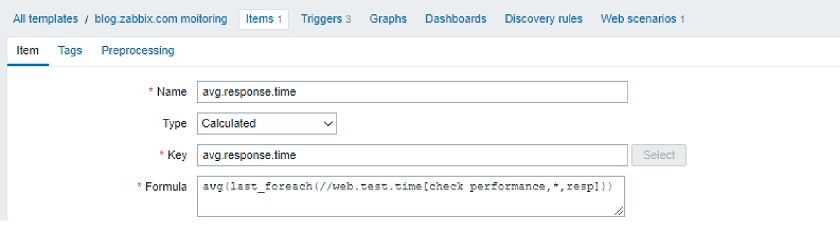
  • AGGREGATE: min(avg_foreach(/*/qps?[group=“PostgreSQL” and tag=“Env:Production”], 5m))

The new syntax has a number of advantages. The new unified syntax:

  • is much simpler and unified for everything: triggers, calculated and aggregated items;
  • supports absolute time periods, such as last day, previous hour, etc. So, now, it’s easy to calculate, for instance, the minimum for the previous hour or an average value for the previous or the current day;
  • is free from any limitations of the old syntax;
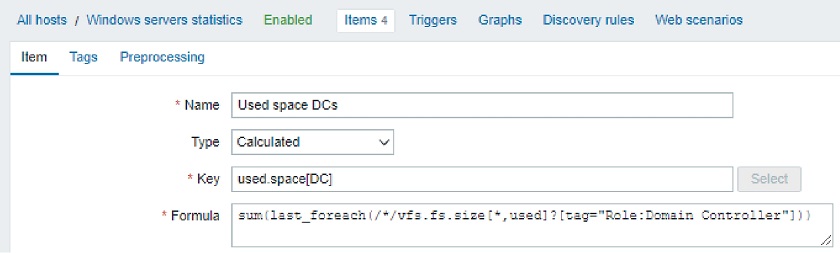
  • allows for powerful aggregations and selection of items by tags utilizing wildcards, etc.;
  • allows for a function to be applied to results of other functions: func1(func2(item));
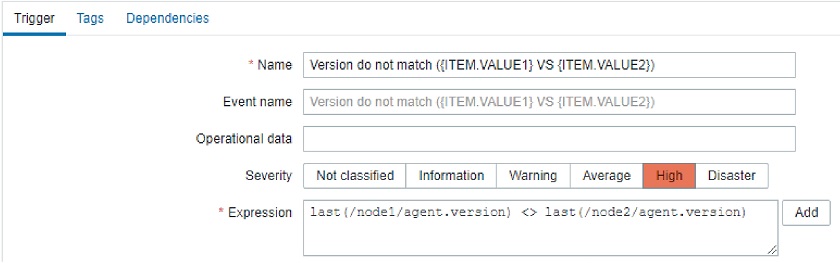
  • allows for multiple items as function arguments: min(item1, item2);
  • supports calculated metrics for everything working around the old limitations.

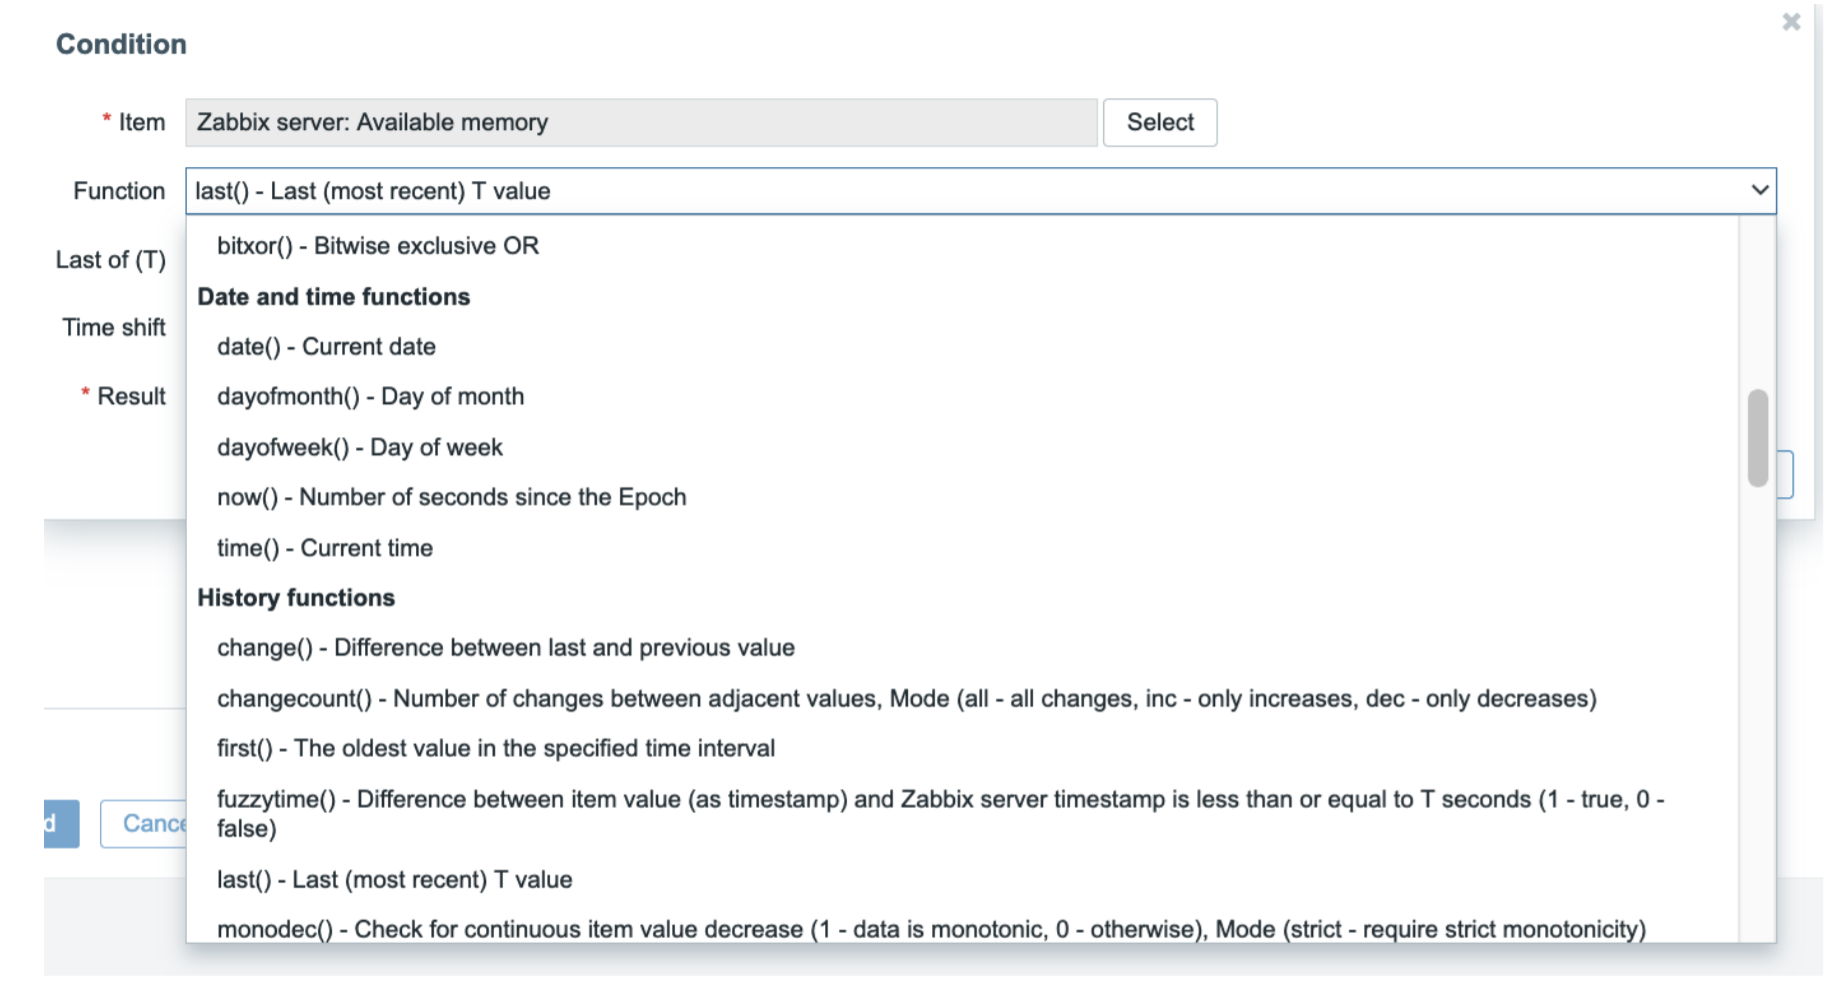
New set of functions

We have also introduced new sets of functions:

https://www.zabbix.com/documentation/current/manual/appendix/functions

NOTE. If you think that something is missing or you’re not able to represent a problem condition using the new syntax or a new function, just let us know. 

API tokens

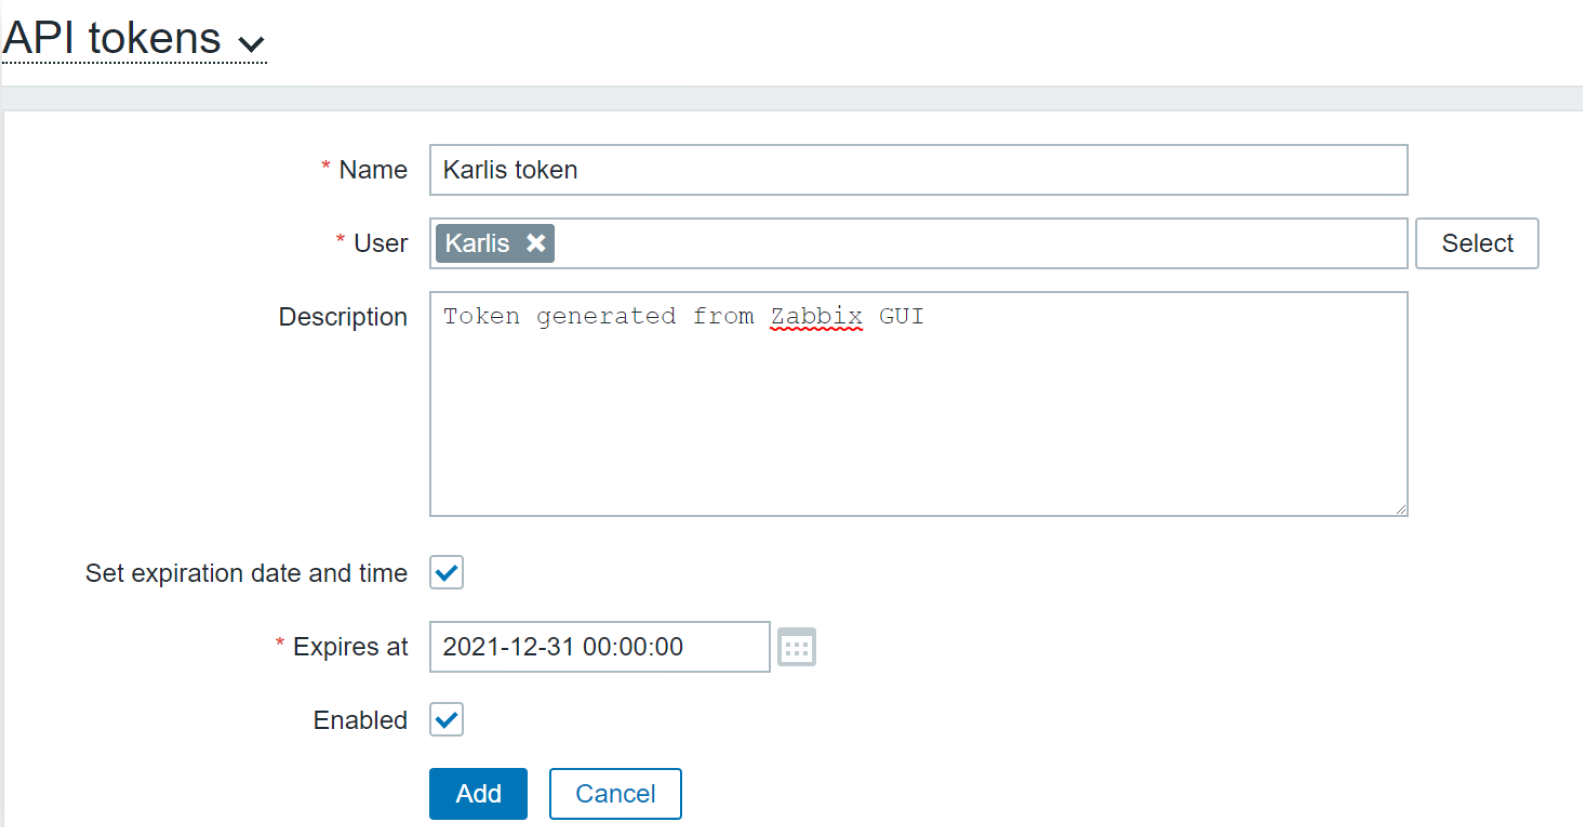
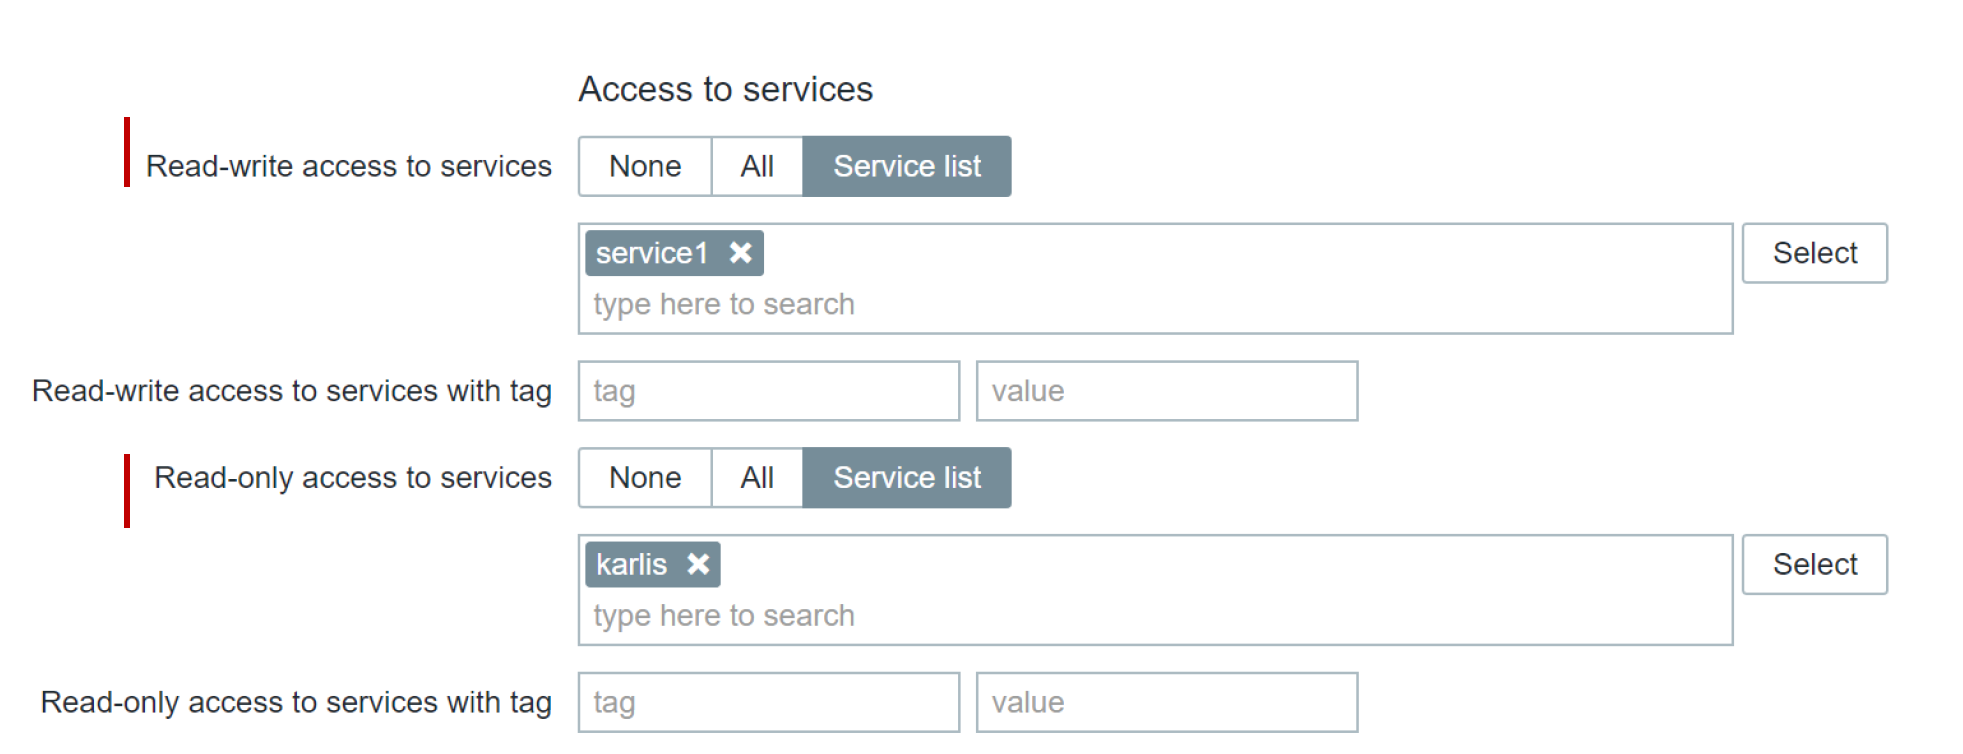
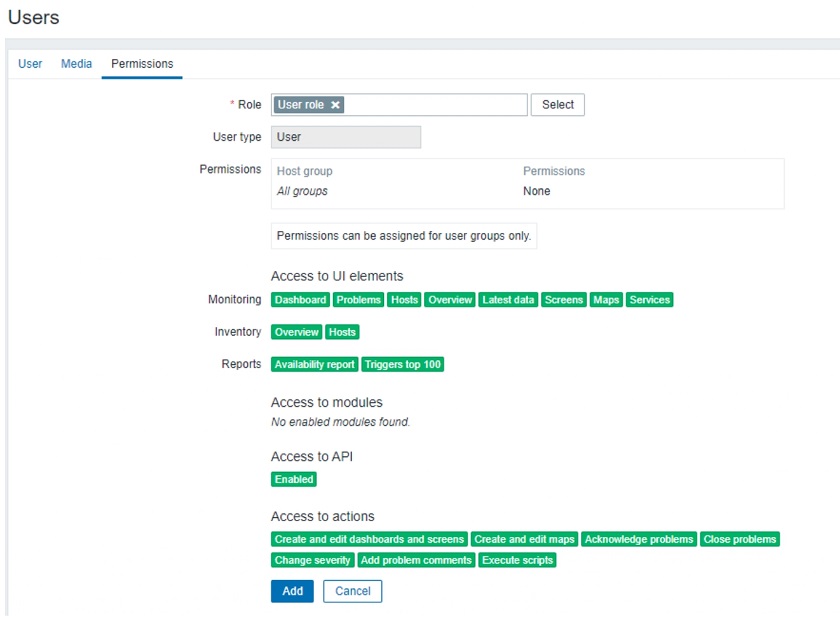
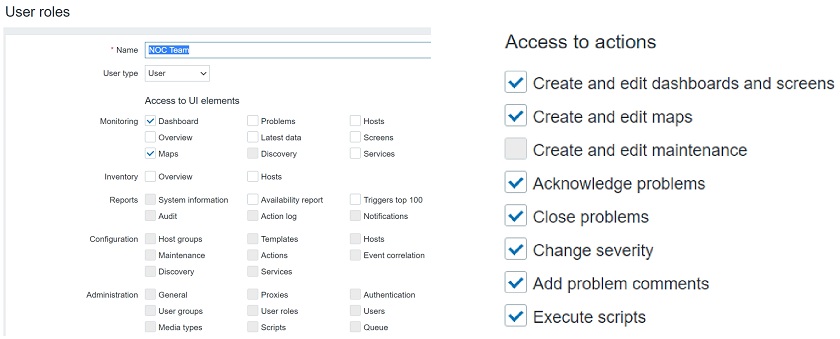
Finally, we have added the support of per-user named API tokens with expiry dates. We have introduced the new user role — access to API tokens, and now any user can generate a private API token in Zabbix for some specific use. All tokens can be managed globally by super admins with appropriate permissions. Now we have a very understandable way to define which users have permissions to operate with API tokens and which users don’t.

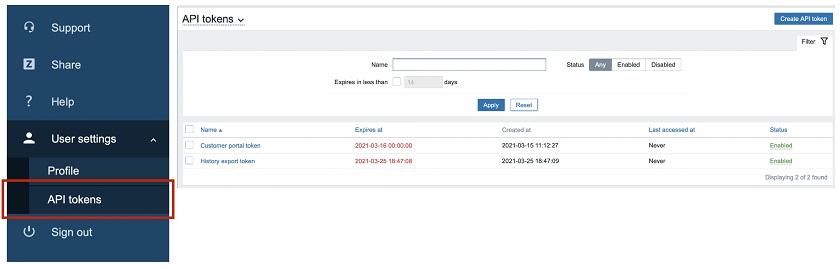
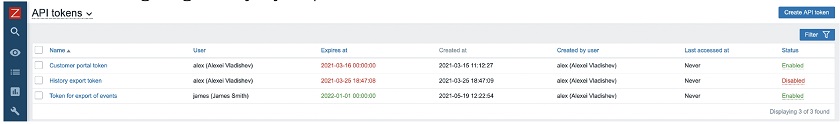
So, if you are an ordinary user, you may go to User settings, click API tokens, and you will see your tokens with the Name, optional expiry date, the time it was last accessed, and the status — Any, Enabled, or Disabled.

API token properties

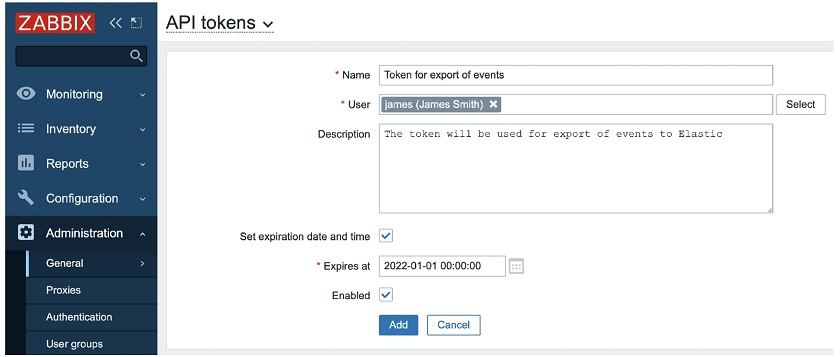
API tokens can be created by any user with appropriate permissions. Super admins can select the user.

API tokens created by any user with permissions

NOTE. You can use the tokens for any integrations from the Zabbix API. You are not forced to use the username and password to start using the API, you just need to generate a token — copy the token to the clipboard (it will not be visible later), store it in a secure location, and then reuse it.

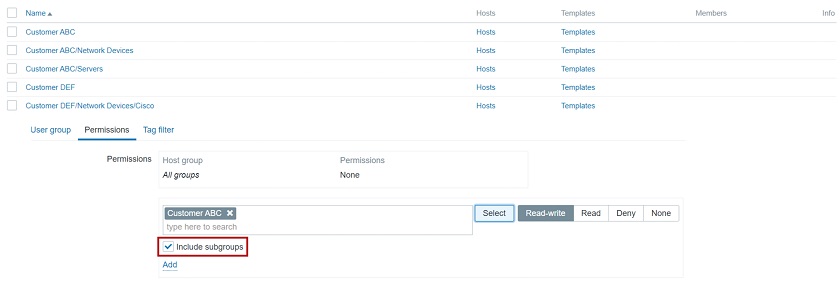
All tokens generated by different users can be managed by super admins with sufficient permissions to review the tokens.

API tokens managed globally by super admins

Easy-to-manage templates

In Zabbix, it is not that simple  to update templates. When you make some adjustments, for instance, create new items, new triggers, or add any other entity, and it is not  easy to make an update as you don’t quite understand the final impact of the changes.

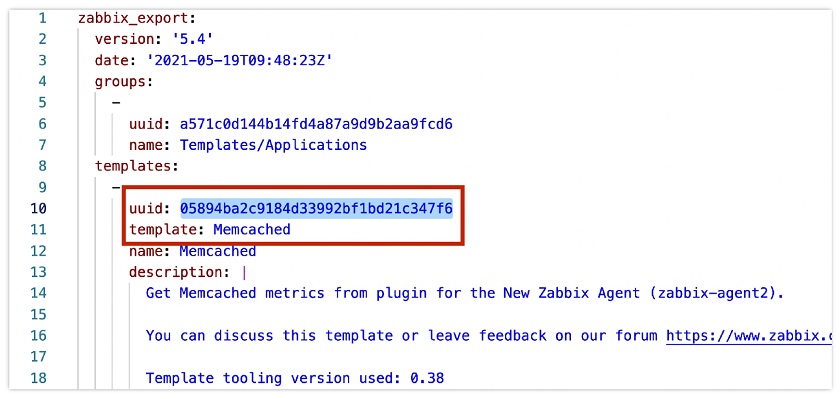
In Zabbix 5.4, we introduced unique universal IDs for each template element, such as items, triggers, graphs, and so on, which help to perform template updates in a safe way.

Universal template IDs

In the example above, these universal IDs are contained in the templates in YAML format to monitor Memcached elements. The IDs are unique, and they are used to match an item, a trigger, etc. These IDs serve as the uniqueness criteria. Zabbix can easily understand what item we are trying to update, which items no longer exists, whether it is a new item or we are making an adjustment to an existing item.

The IDs also simplify working with templates. Now you can actually keep all your templates in a Git repository, for instance, in JSON or YAML format, and then push them to Zabbix by CI/CD pipeline using Zabbix API. So, as soon as you have made some adjustments in your template, your CI/CD system takes the latest version of the template, and using Zabbix API applies it in Zabbix. Such an approach really helps to look at your infrastructure as a code.

Better import

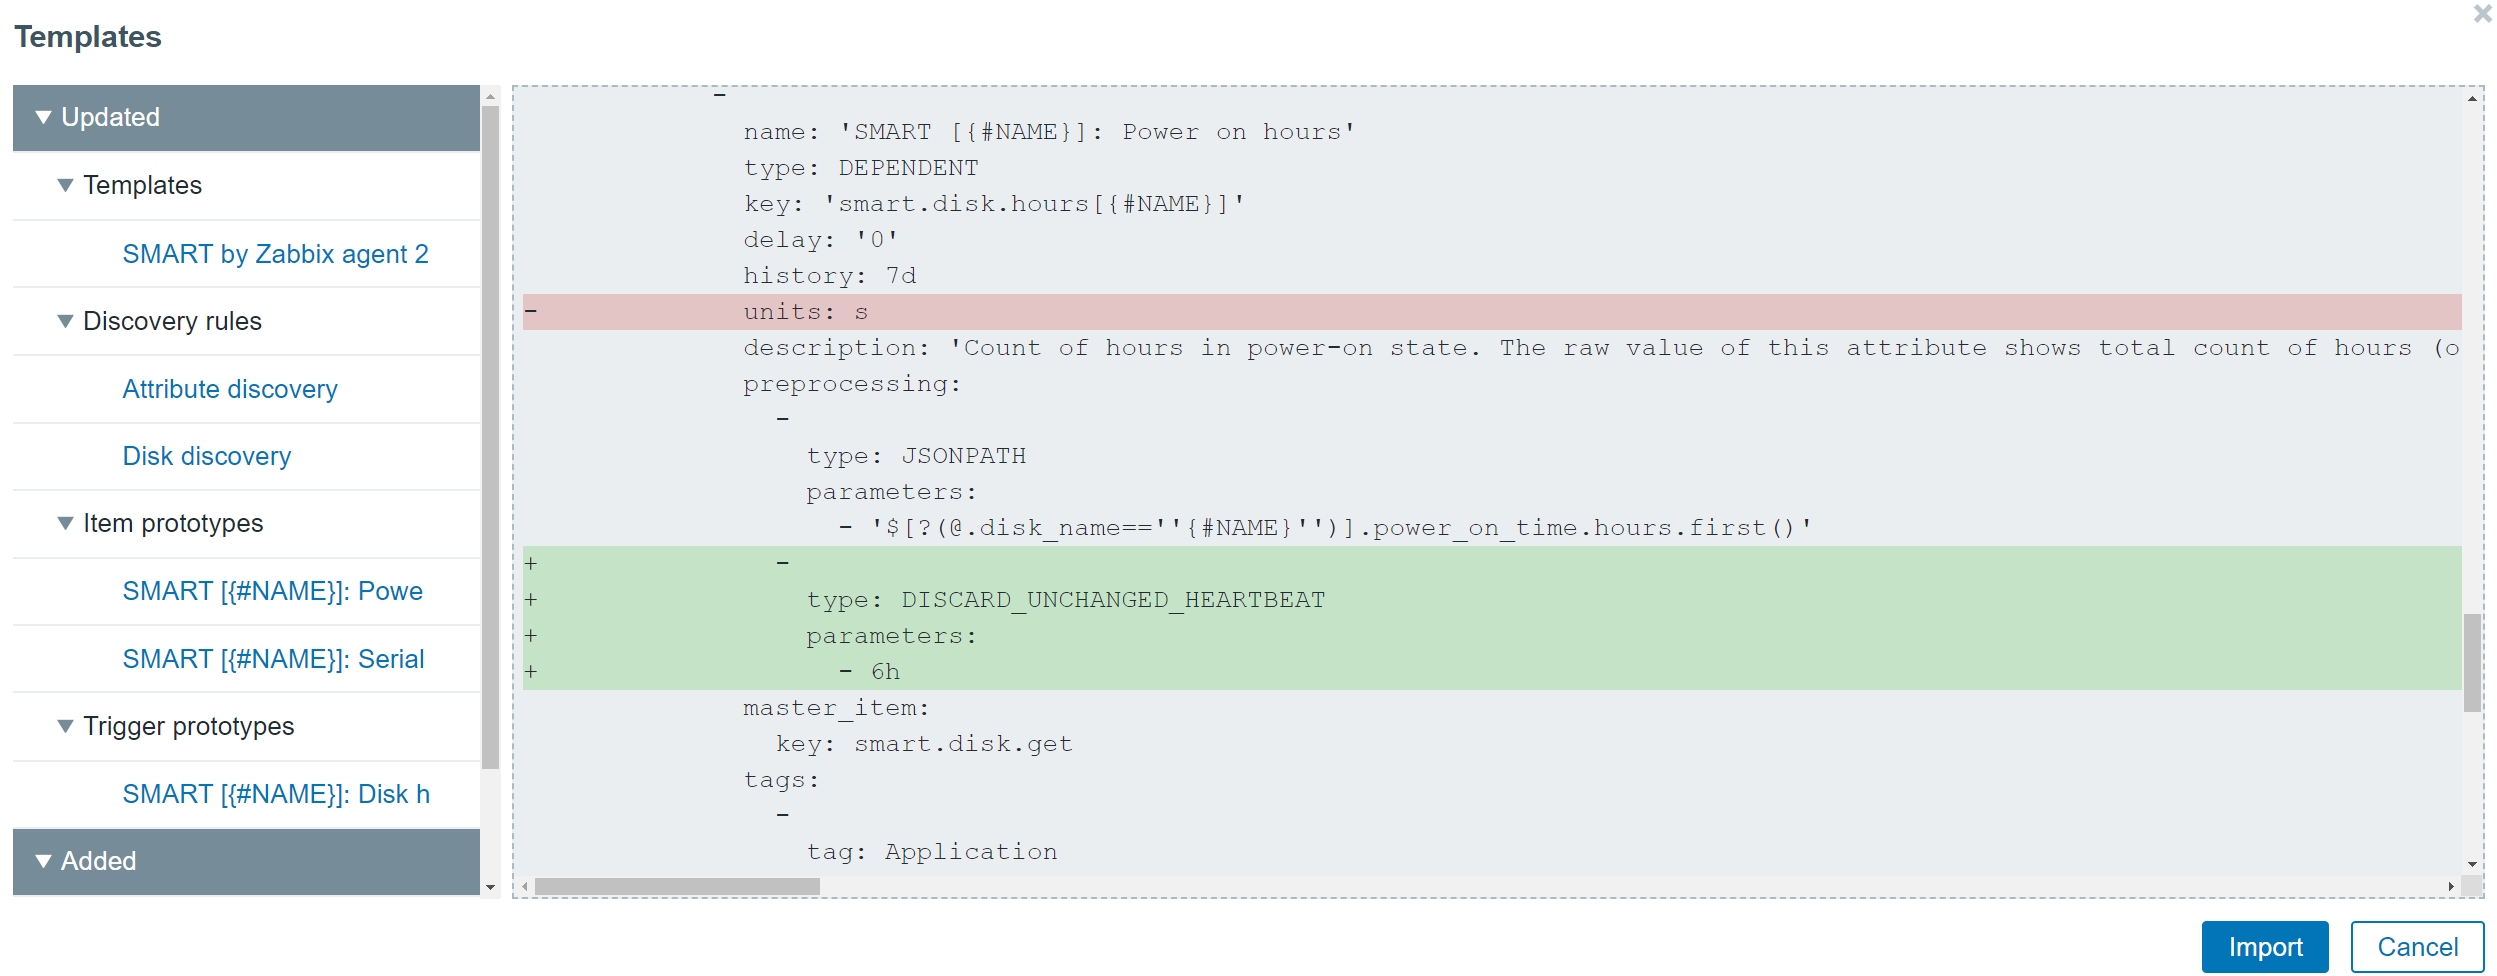
When importing a new template or a new version of the template, Zabbix now will show you any differences when comparing it to an existing template, as well as the changes that are going to be made in Zabbix.

Comparing existing and new templates

In this example, I have a new version of the Memcached template. I removed one tag – Application, and replaced it with two tags— Service (Memcached) and Class (Infrastructure). During import, I can see the difference between my existing template in Zabbix and the new template, so that I can easily review all of the changes. After pressing Import, these changes are applied to the configuration.

Scalability improvements

We have also introduced a few scalability improvements:

  • Zabbix Server and Proxy poller processes do not require database connection anymore.
  • In-memory cache for trend data, significant speedup for trend-related functions has been introduced.
  • Better parallel data processing on the Zabbix Server side for heavy loads. For instance, environments with 10,000 – 50 000 and more new values per second will benefit from the improved performance.
  • Graceful startup of Zabbix Server, which is very useful especially for instances with thousands or tens of thousands of proxies.

NOTE. When the server goes down, for instance, for maintenance or for an upgrade from one minor version to another, you have a down time in range of 30 seconds to a few minutes. When the Zabbix Server is back again, all proxies start pushing large amounts of data at the same time. So, it’s really important to maintain the stability and good health of the Zabbix Server at this moment. That’s why we have implemented a graceful startup for the Zabbix Server.

Universal global scripts

Another nice improvement simplifying the Zabbix setup — universal global scripts.

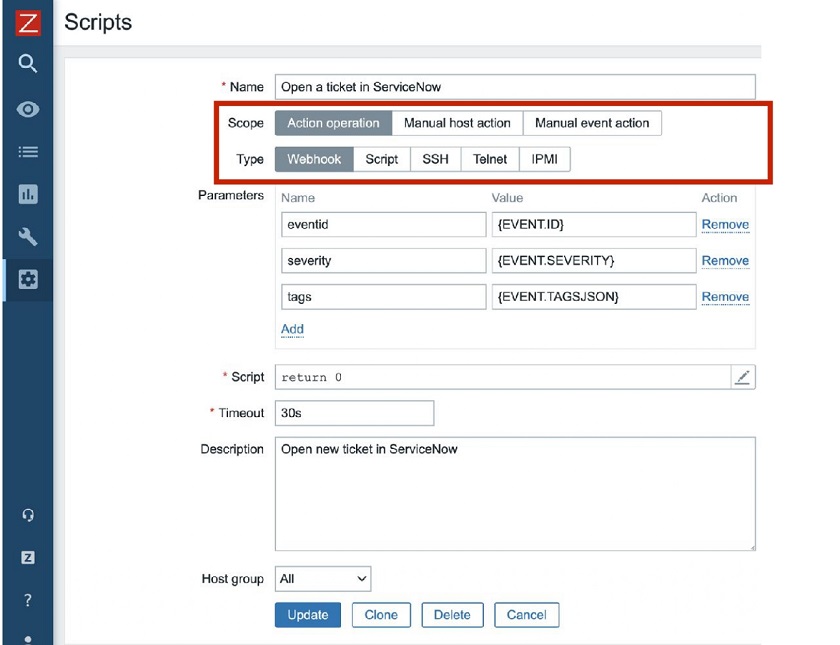
First, we introduced JavaScript Webhooks for global scripts for easy integration with third-party alerting and ticketing systems. Zabbix uses Webhooks for many different purposes — preprocessing, integration, data collection, etc. Now you can use it for global scripts.

Global scripts now can be used for everything — auto-remediation, alerting, integrations, and the manual execution on hosts from the Zabbix UI. Now, when you define a global script, you can also define that the script should be used, for instance, only for Action operations.

Universal global scripts’ parameters

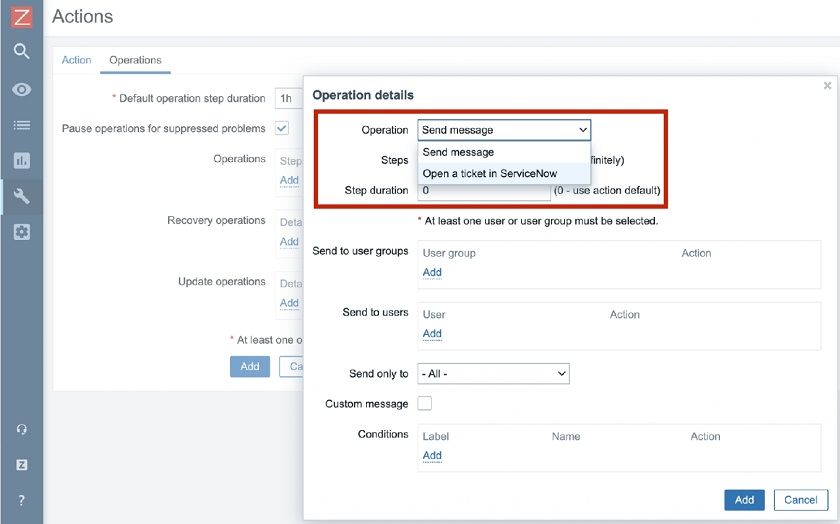
In this example, this particular script will be based on a Webhook, it will accept parameters such as event ID, event severity, and the tags in the JSON format. This global script will open a ticket in ServiceNow. After the script has been defined you need to navigatte to Actions and define what operations should be executed. You can send a message to admins or just open a ticket in the service desk.

Defining Actions

It is a very simple, easy-to-use, and easy-to-understand feature simplifying configuration of actions.

Powerful value maps

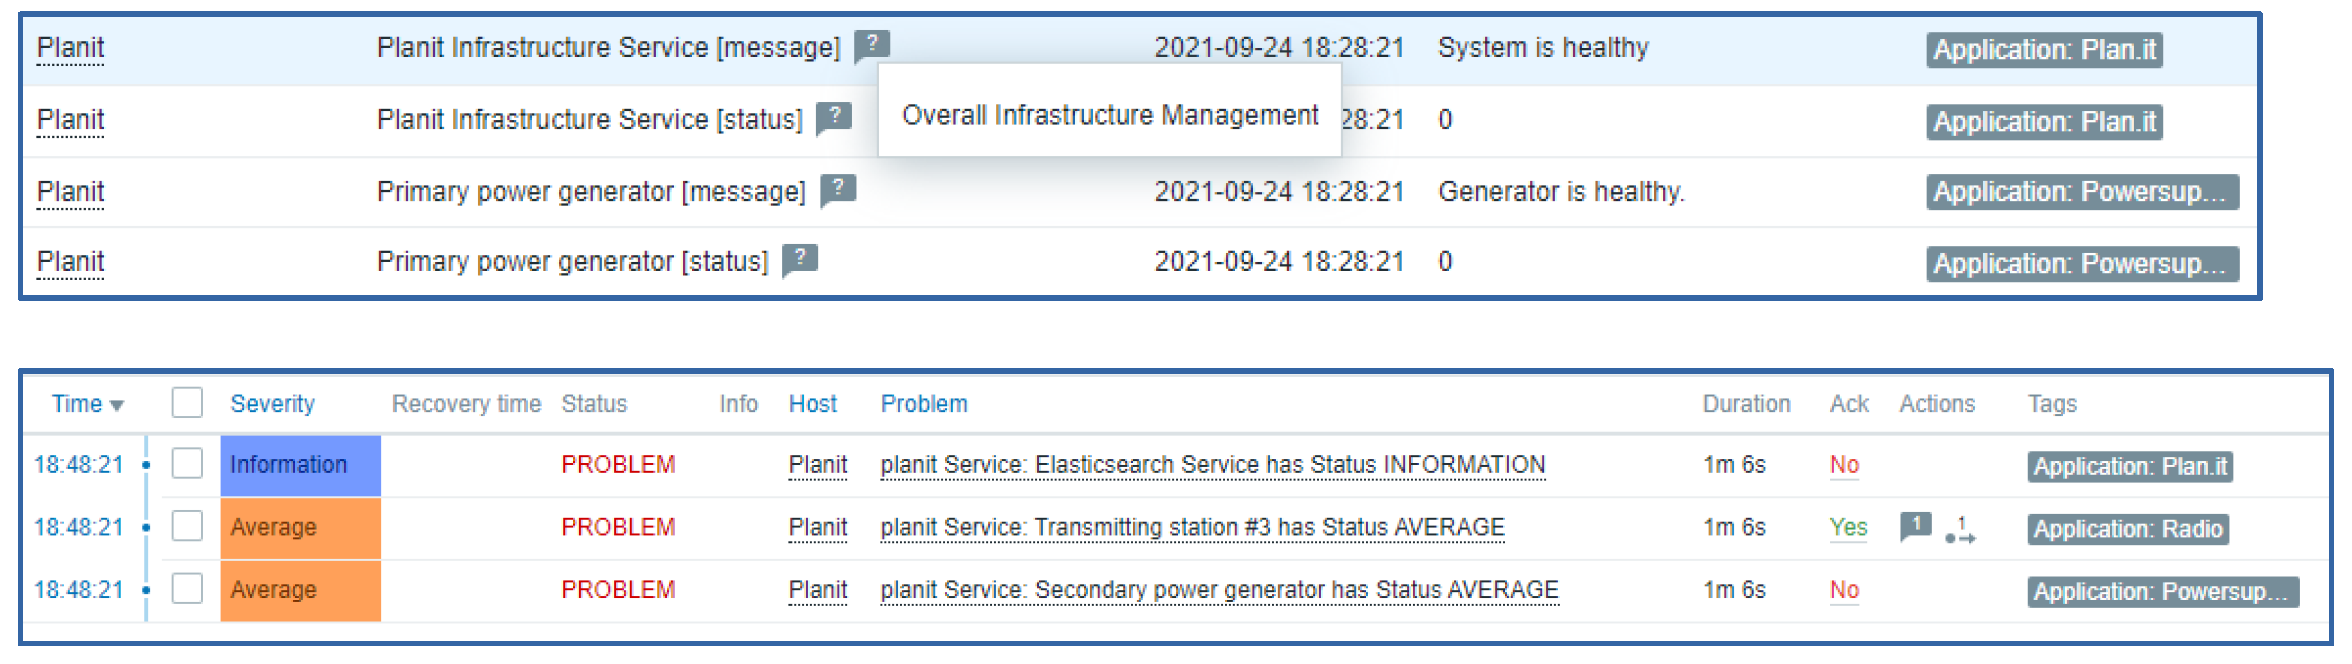
In Zabbix 5.4, we have introduced some changes related to value maps. The value map is a simple way to convert, for instance, numeric values collected by Zabbix, into human-readable values.

A common example would be monitoring the state of a service, which returns the numbers zero or one, with zero meaning ‘Down‘ or one meaning ‘Up‘. In this case we can define a value map based on the exact value match. This is the current behavior.

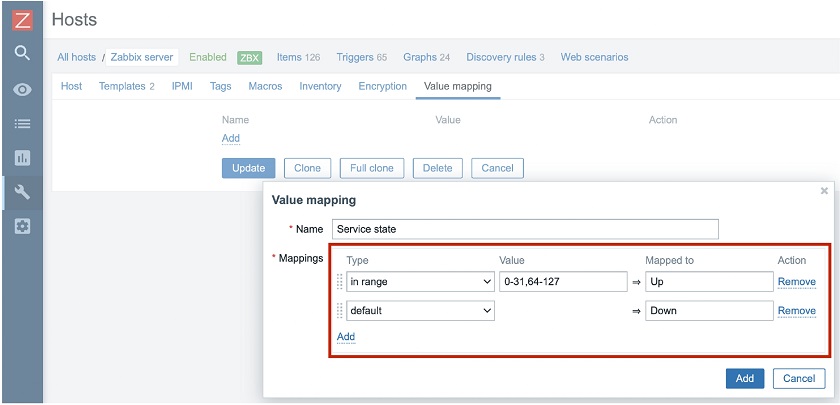
In Zabbix 5.4, we extended it to support matching by ranges. So, you can define that if you receive the status between 0 and 127, you consider the service to be ‘Down‘ and if any other value — ‘Up‘, or vice versa.

We have also introduced matching by regular expression. Now, when you define value mapping, you just like a service state in my case you may specify if the value is in the range between 0 and 31 or 64 and 127, then it will be mapped to ‘Up‘ and any other value — ‘Down‘.

Value mapping by range

Value  maps for templates and hosts

We have introduced value on the template level and on the host level. This means that we do not support global value maps anymore.

Value maps were easy to maintain on the global level, but only for smaller installations. As soon as you have multiple templates and different teams working with a different set of templates, value maps become a nightmare to maintain on a global level. In addition, global value mapping hinders multi-tenancy support for any object that is linked to a value map.

Advantages of value maps on the template level:

  • Now we can deliver self-contained templates without any references to global objects. A template contains all information needed for monitoring: a set of items, set of triggers, graphs, template-level dashboards, and value maps. That means we don’t have any references to any global objects now, and templates have become truly independent. You can go to zabbix.com/integrations, download the template to monitor, for instance, for a Cisco device, and we can be absolutely sure that this template will work perfectly on the system as it isn’t linked to any global elements.
  • This new feature enables better support for multi-tenant environments.
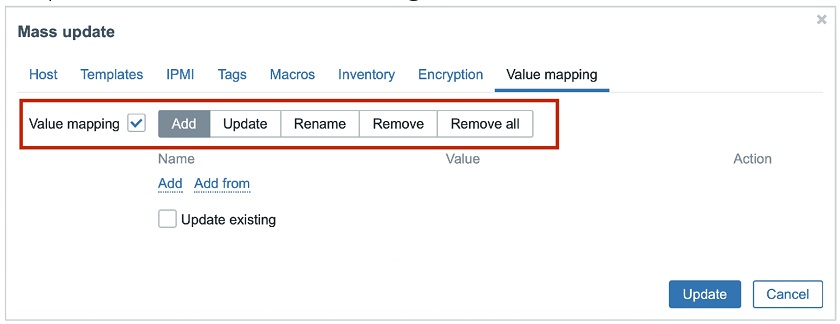
  • We have also introduced new mass actions — mass-update operations for easier management of value maps on a template level.

You can Add, Update, Rename, Remove, or Remove all value maps.

Mass-update operations

Usability improvements

  • In Zabbix 5.4, we have introduced a number of usability improvements. The one visible straight away — the third-level menu for better navigation. The hidden features in Administration > GeneralAutoregistration, Housekeeping, Images, Icon mapping, Regular expressions, etc. were difficult to spot. The third level menu provides better visibility for these submenus.

Third-level menu

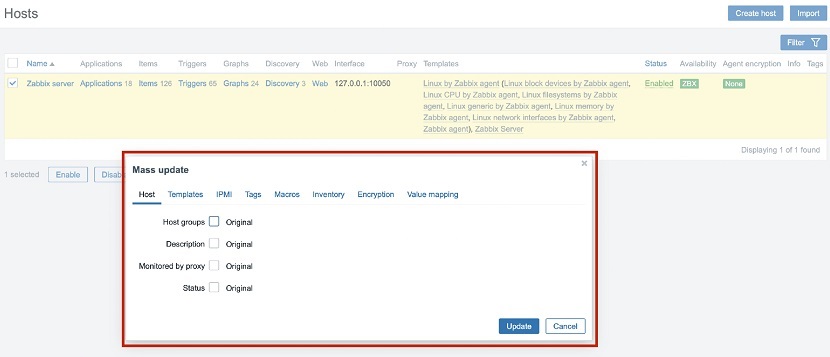
  • In Zabbix, there are some usability problems that sometimes you have to jump from one page to another, for instance, from a graph to Latest data, from Latest data to a host, etc. We have been thinking about improving usability to keep users focused on what they do. So, we have introduced modal windows for mass-update and import forms. It is a small, though important step in improving overall performance as when you select the list of hosts to do some mass-update operation, you are staying on this list and don’t have to go to a separate page.

Modal windows for mass-update and import forms

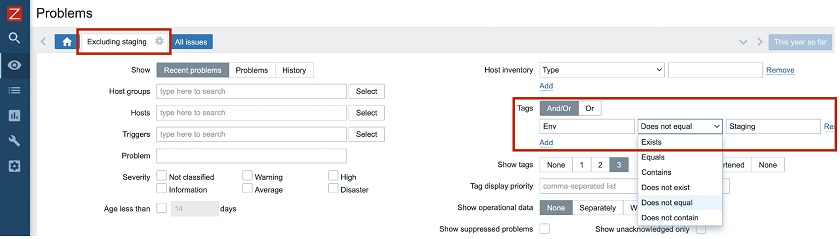
  • Another small, but useful feature — negated filtering for tags. Now, in Monitoring > Problems, you can, for instance, display all problems, which are not from your staging environment. You can define a condition, for instance, TagsEnv Does not equal Staging‘, and save it as a new view ‘Excluding staging‘.

Negated filtering by tags

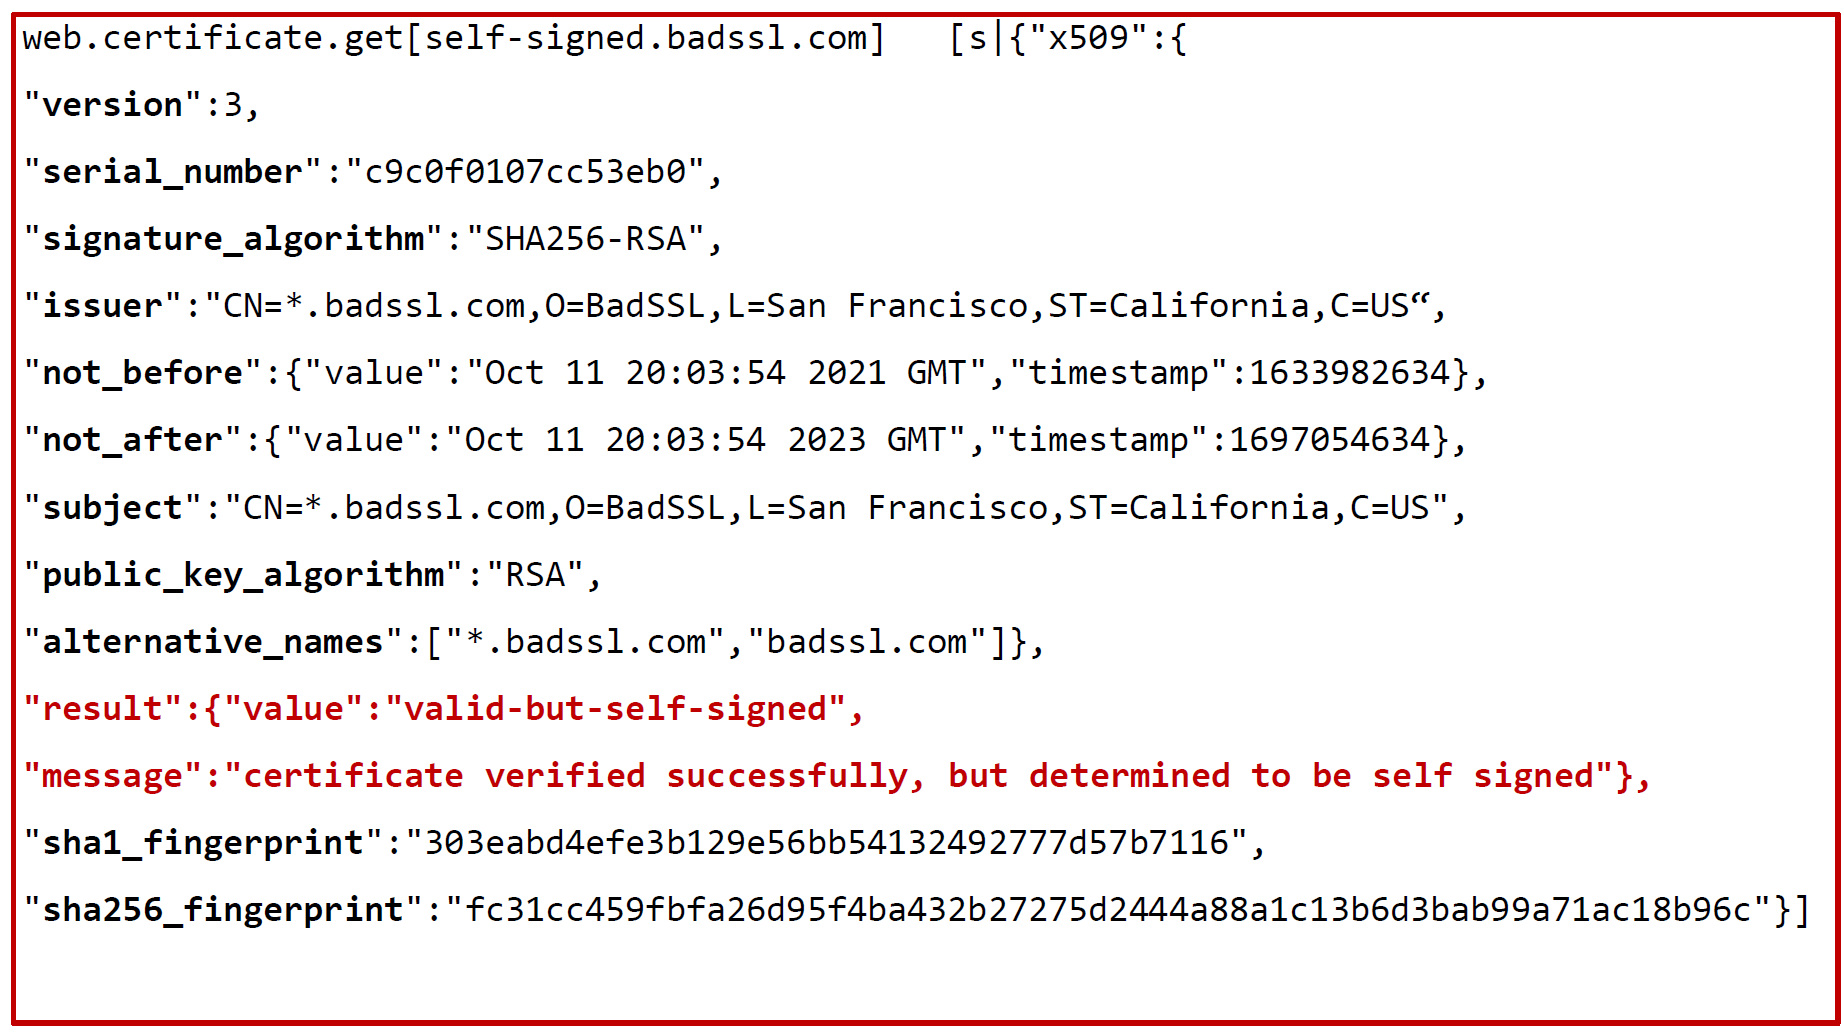
Better support of XML preprocessing

Zabbix has been supporting XML XPath for four years. Now we decided to introduce another conversion — a native conversion from XML to JSON format.

Since most of the operations in Zabbix are JSON-based, it is a nice way to work with XML data — you convert your XML document to JSON as, for instance, the first preprocessing step, and then you work with this data as with any JSON document.

Better XML preprocessing

More improvements

There are also security-related changes and other changes related to real-time export.
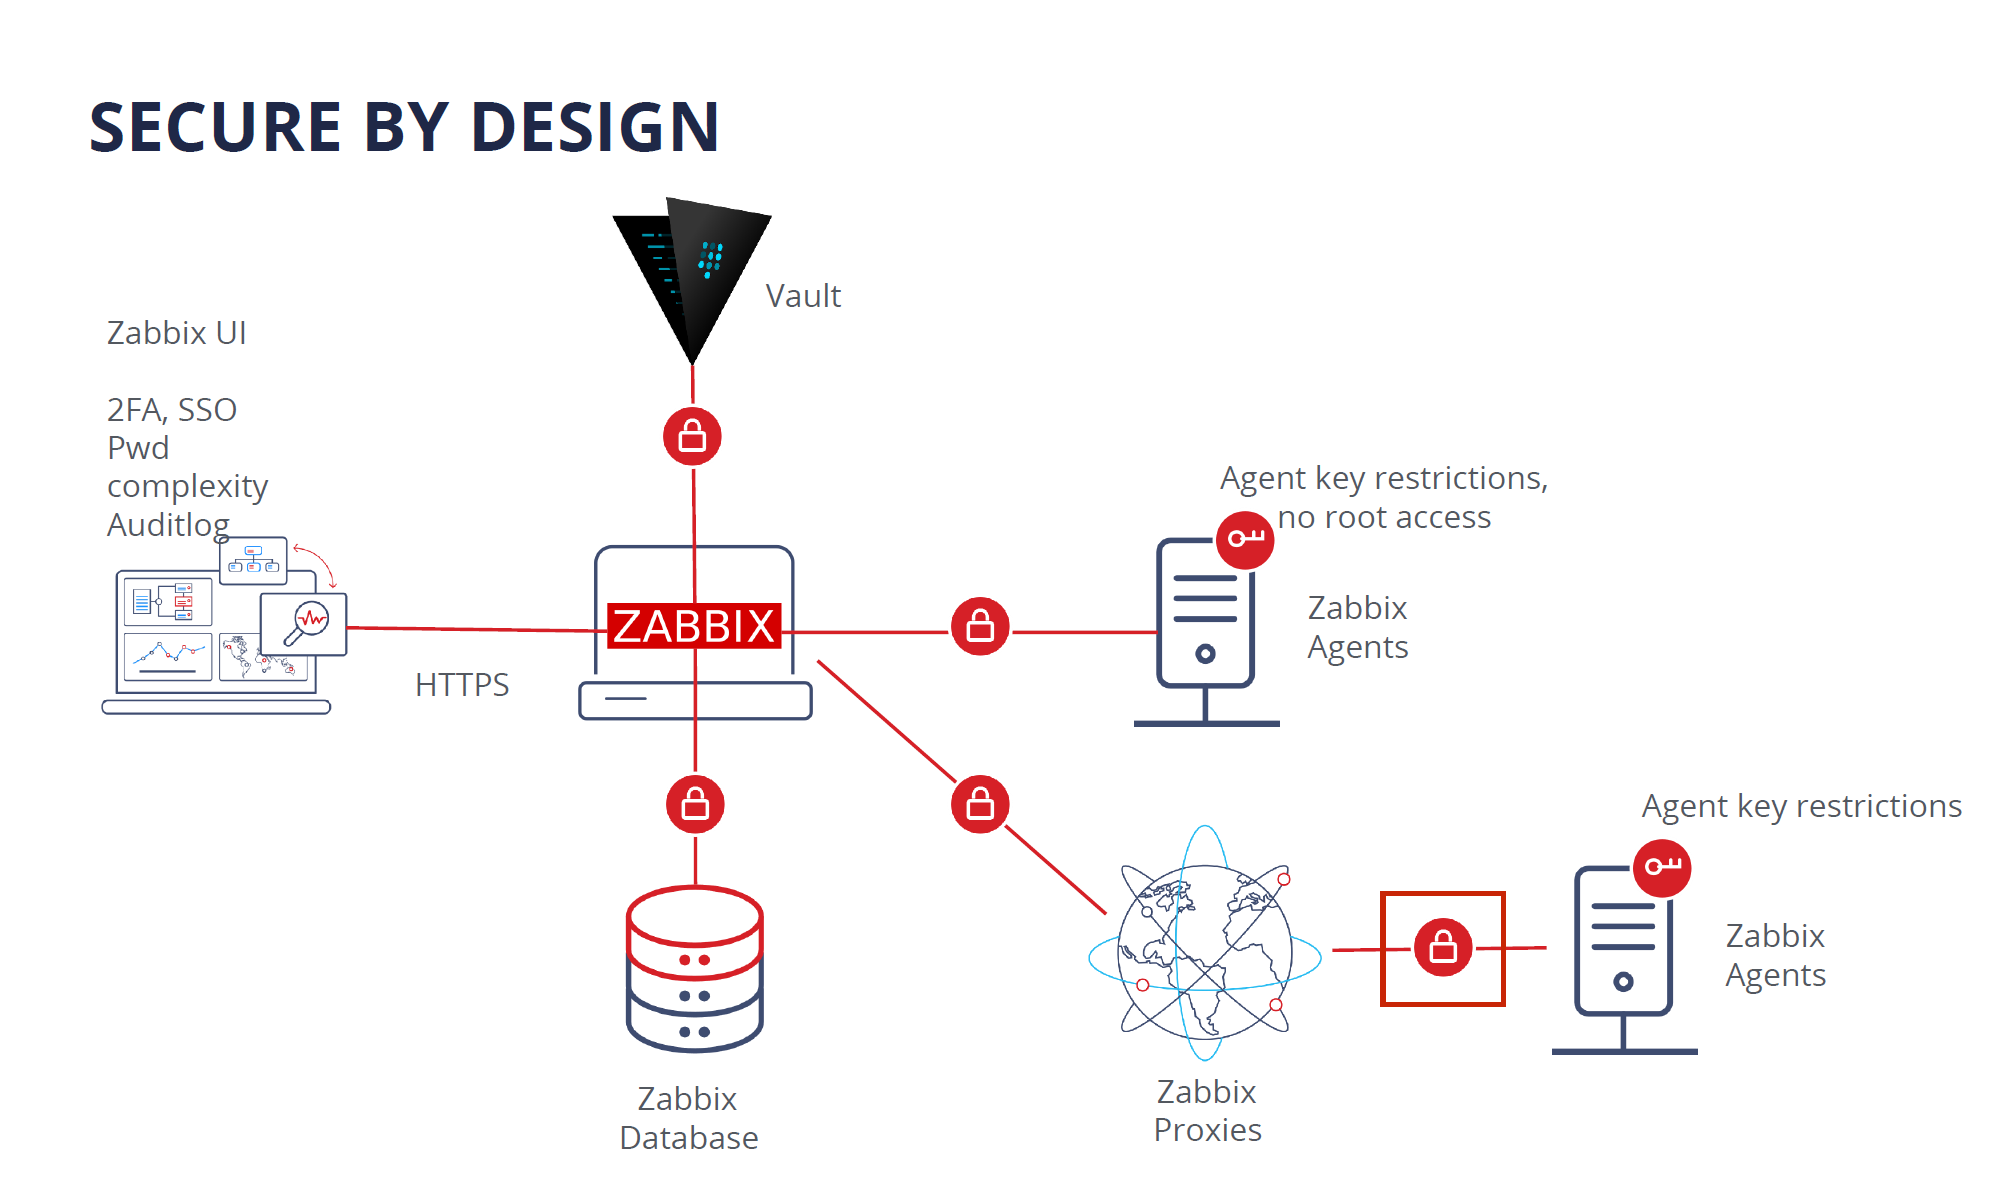
  • Security-related:
    — Support of all SNMPv3 encryption protocols.
    — Unified error messages in case of unsuccessful login.
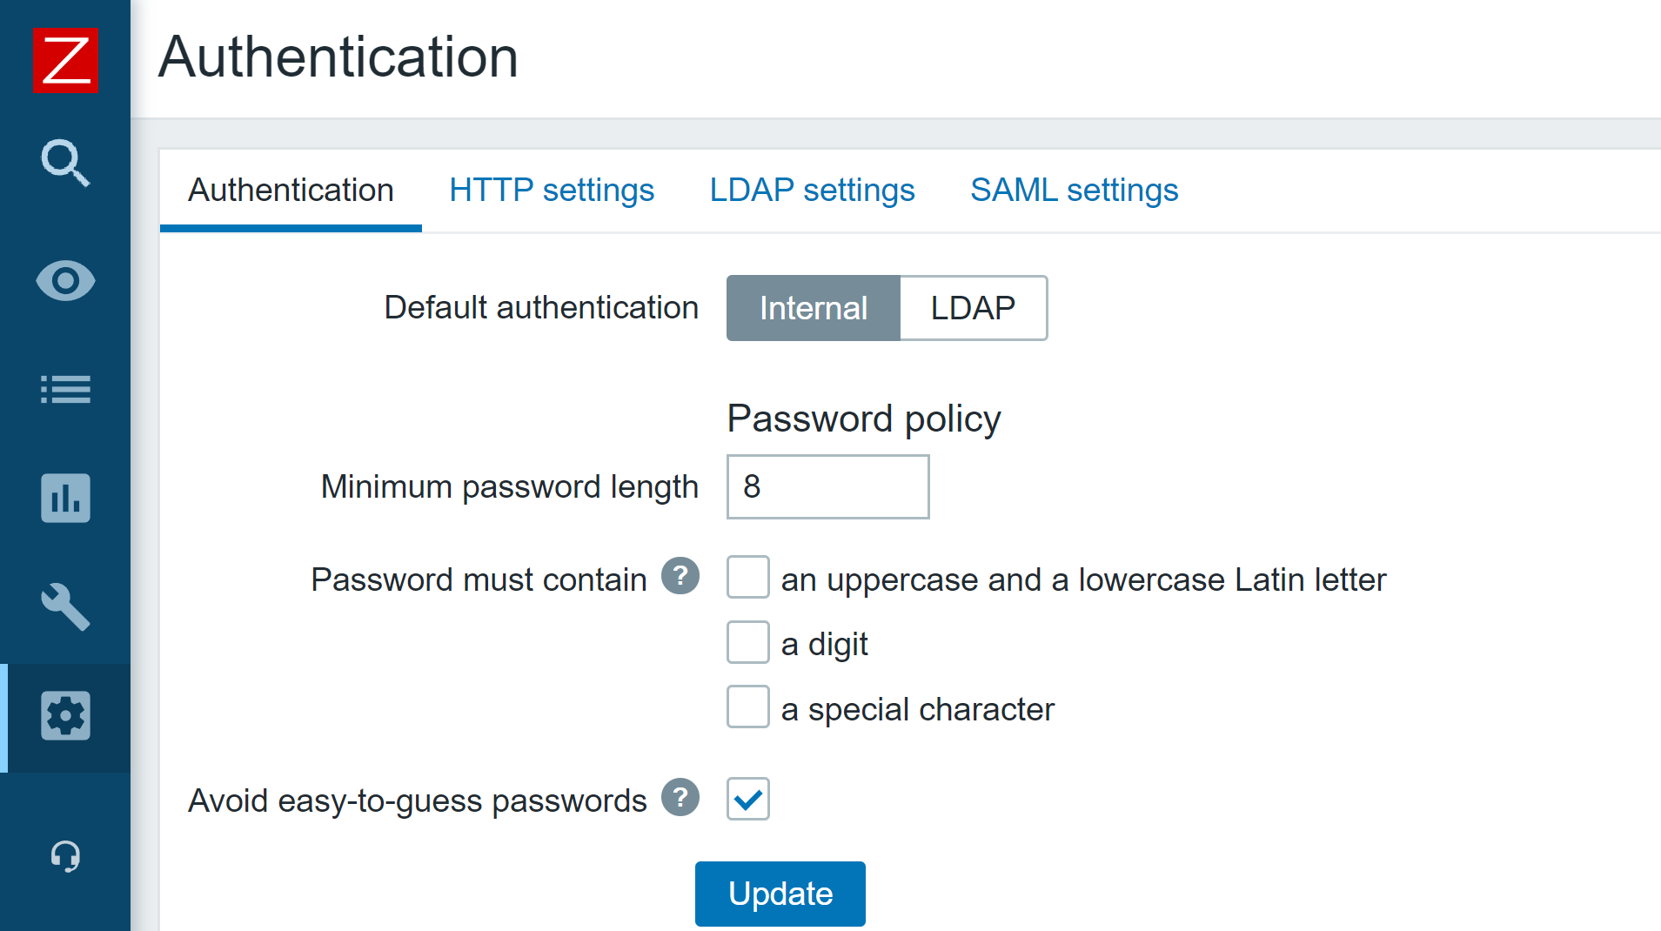
    — Disabled autocomplete for password fields in Zabbix UI.
  • Real-time export:
    — Information about event severity is included in real-time export files.
    — More granular configuration of information exported in real-time.
  • Also:
    — Support of VMWare cluster monitoring.
    — Support of filtering by the presence of LLD macro for low-level discovery.
    — Support of macro {ITEM.VALUETYPE} for notifications.
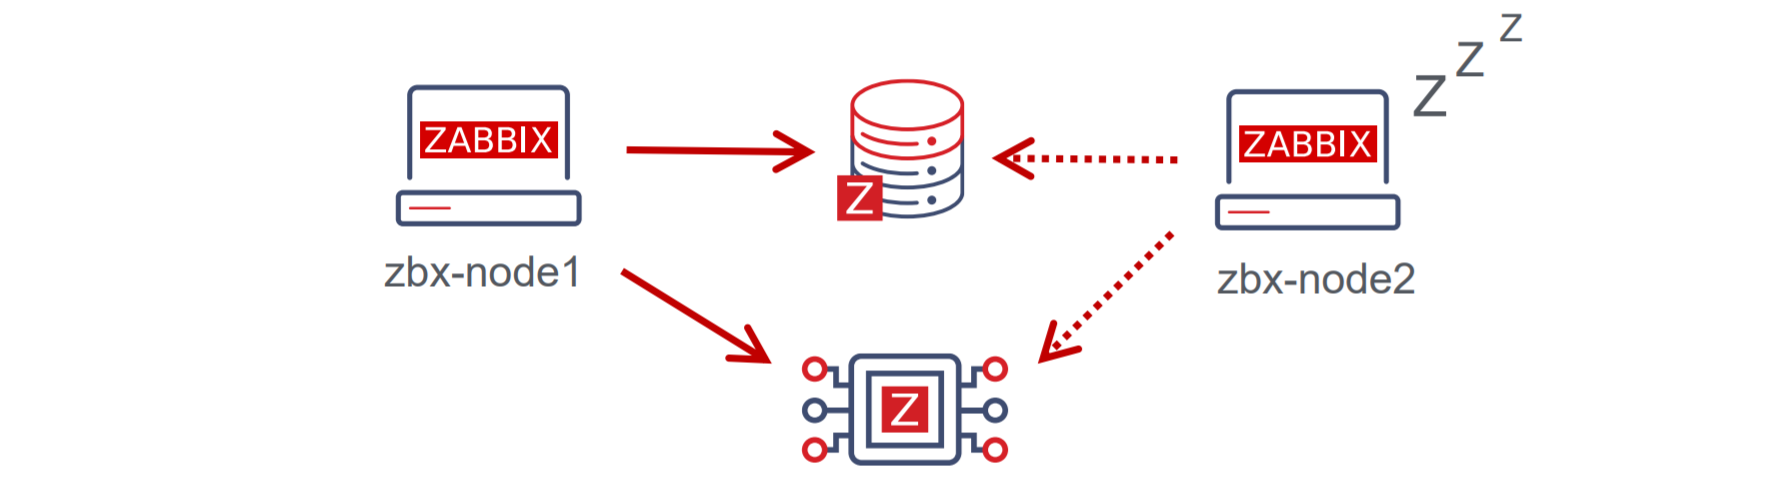
    — Support of service name lookup for Oracle for HA setups, so that Zabbix can switch from one node to another.
    — Support of NTLM authentication for JavaScript Webhooks.
    — Support of multiple JMX metrics having the same key on one host.
    — Increased size of memory available to JavaScript Webhooks and preprocessing.
    — CurlHttpRequest renamed to HttpRequest in Webhooks.
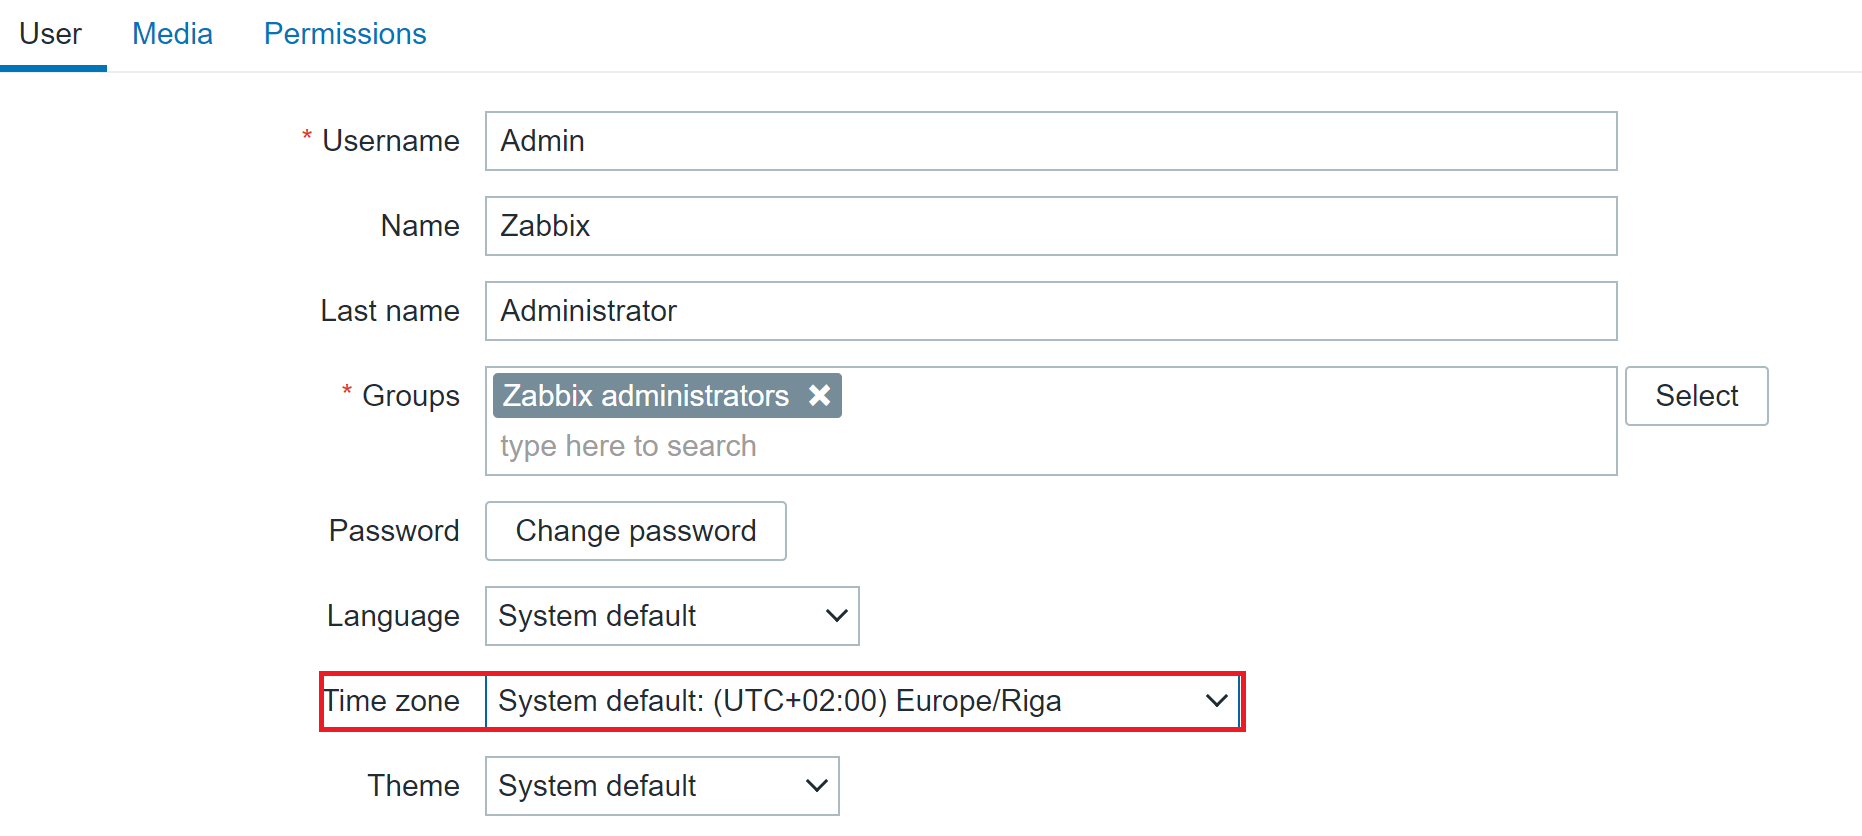
    — ‘Alias‘ renamed to ‘Username‘ in user configuration.
    — American English is a default language of Zabbix UI and also Zabbix documentation.

New integrations and templates

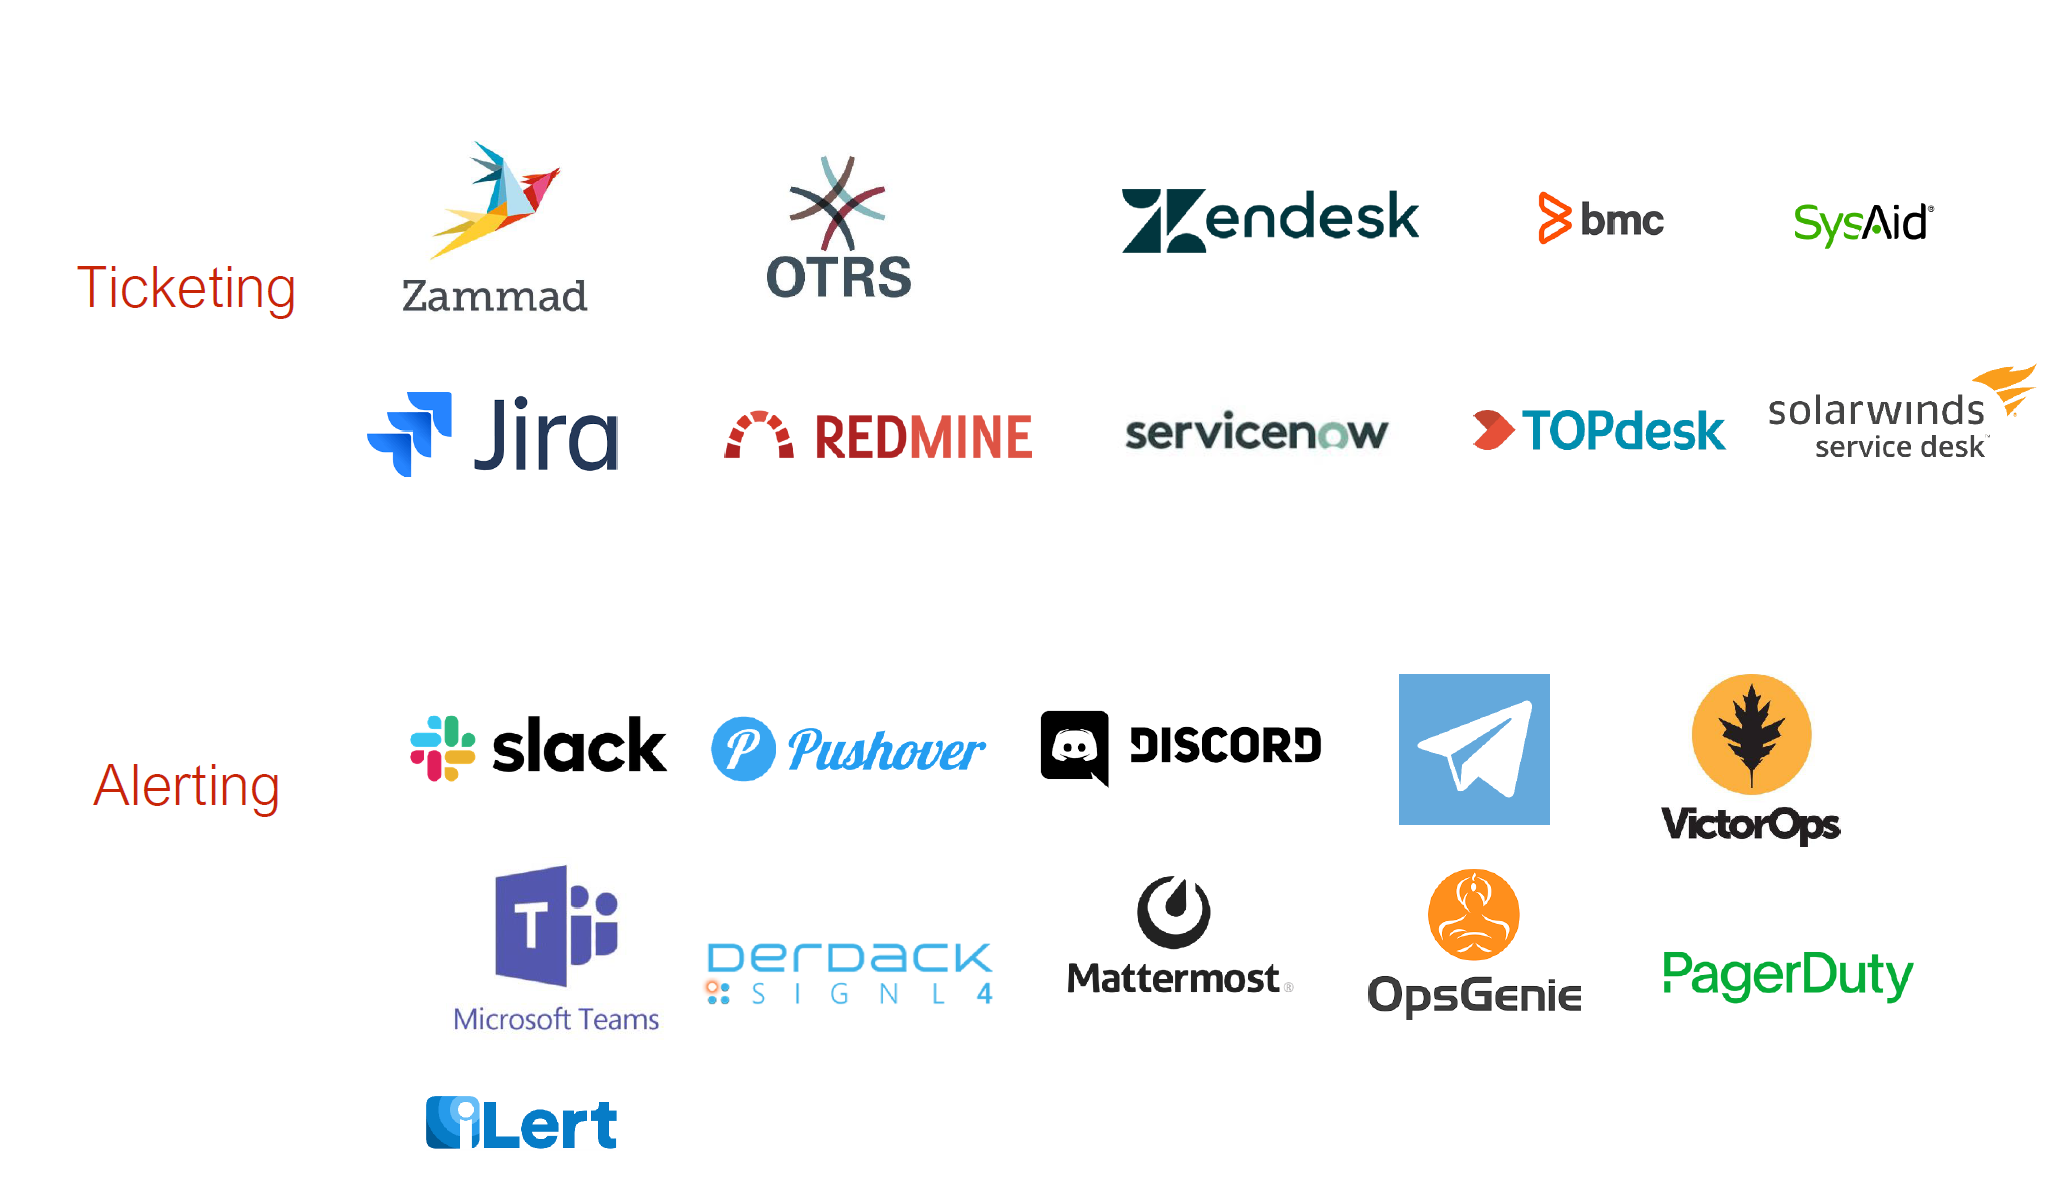
  • With any new Zabbix major version, we have new integrations and templates. Zabbix 5.4 is not an exception, and it comes with the new integrations with iTOP, VictorOps,  Rocket.Chat, Signal, Express.ms, and other solutions.
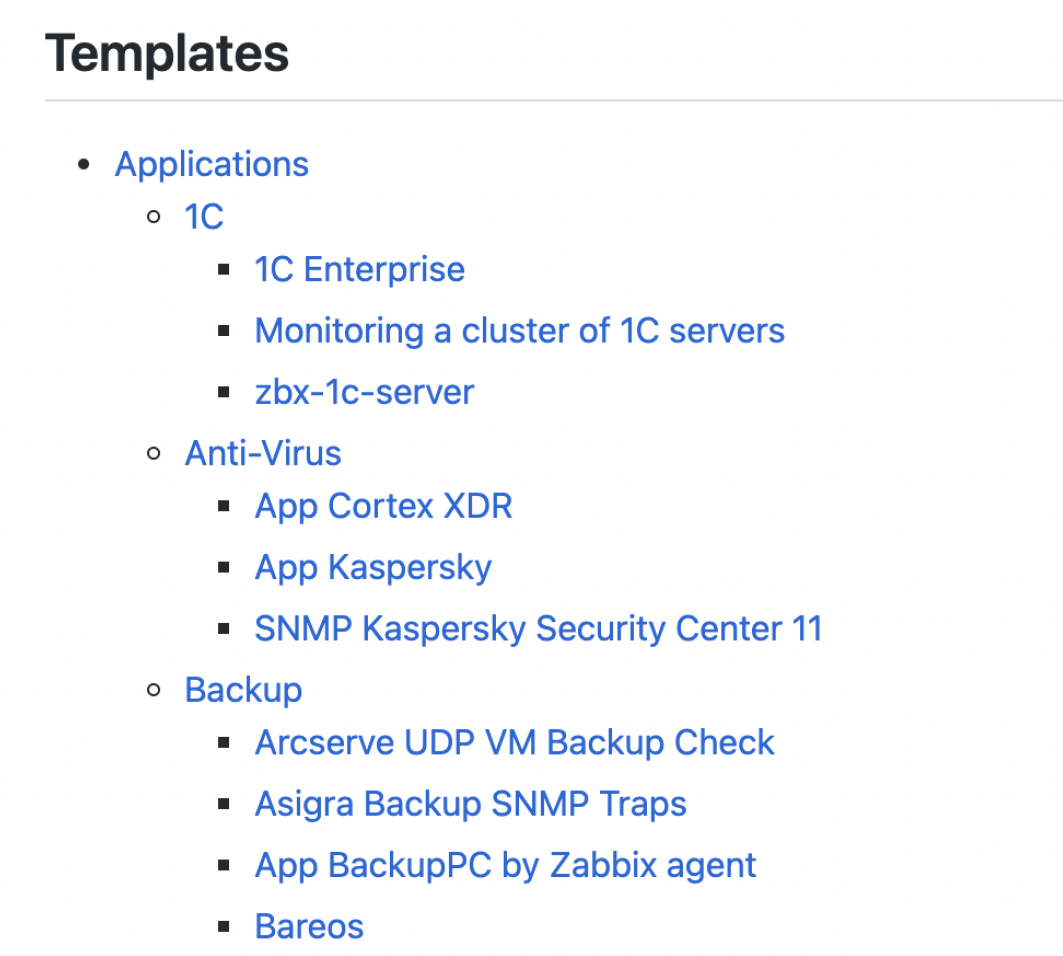
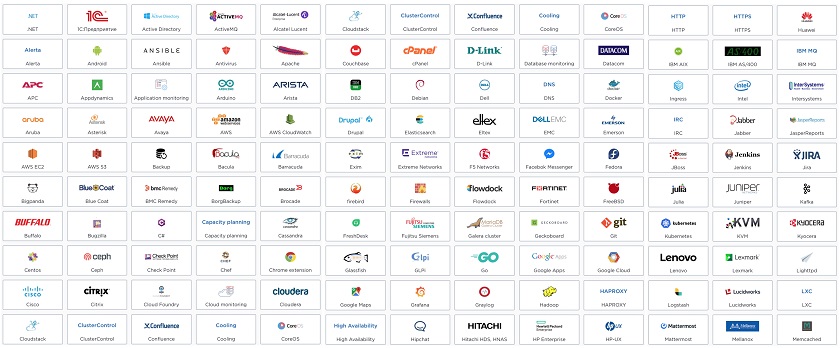
  • We have also introduced a new set of official templates for monitoring of APC UPS hardware, Hikvision cameras, etcd, Hadoop, Zookeeper, Kafka, AMQ, HashiCorp Vault, MS Sharepoint, MS Exchange, smartclt, Gitlab, Jenkins, Apache Ignite, and more applications and services.

New integrations and templates

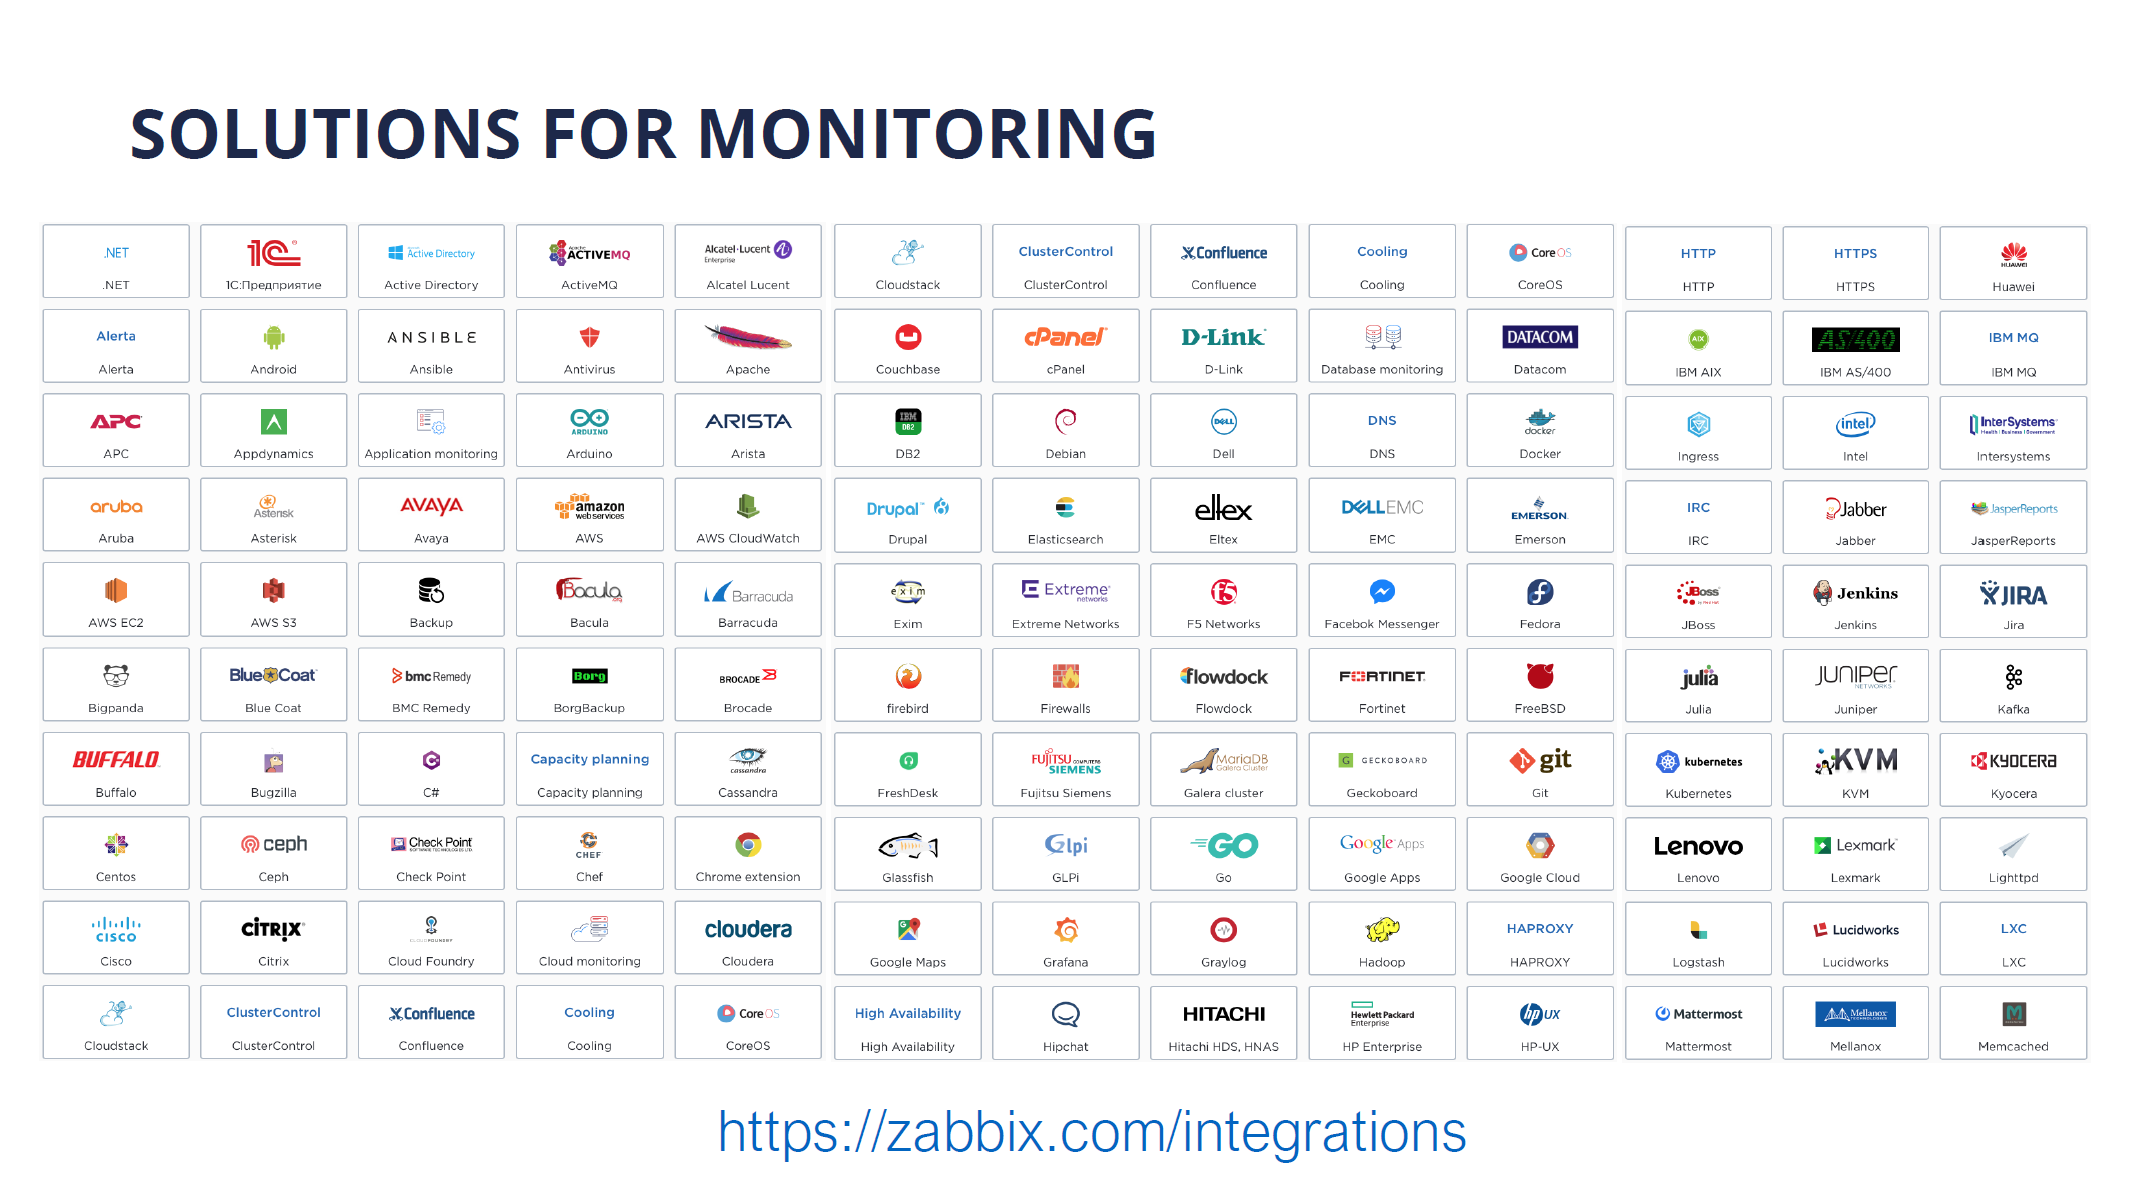
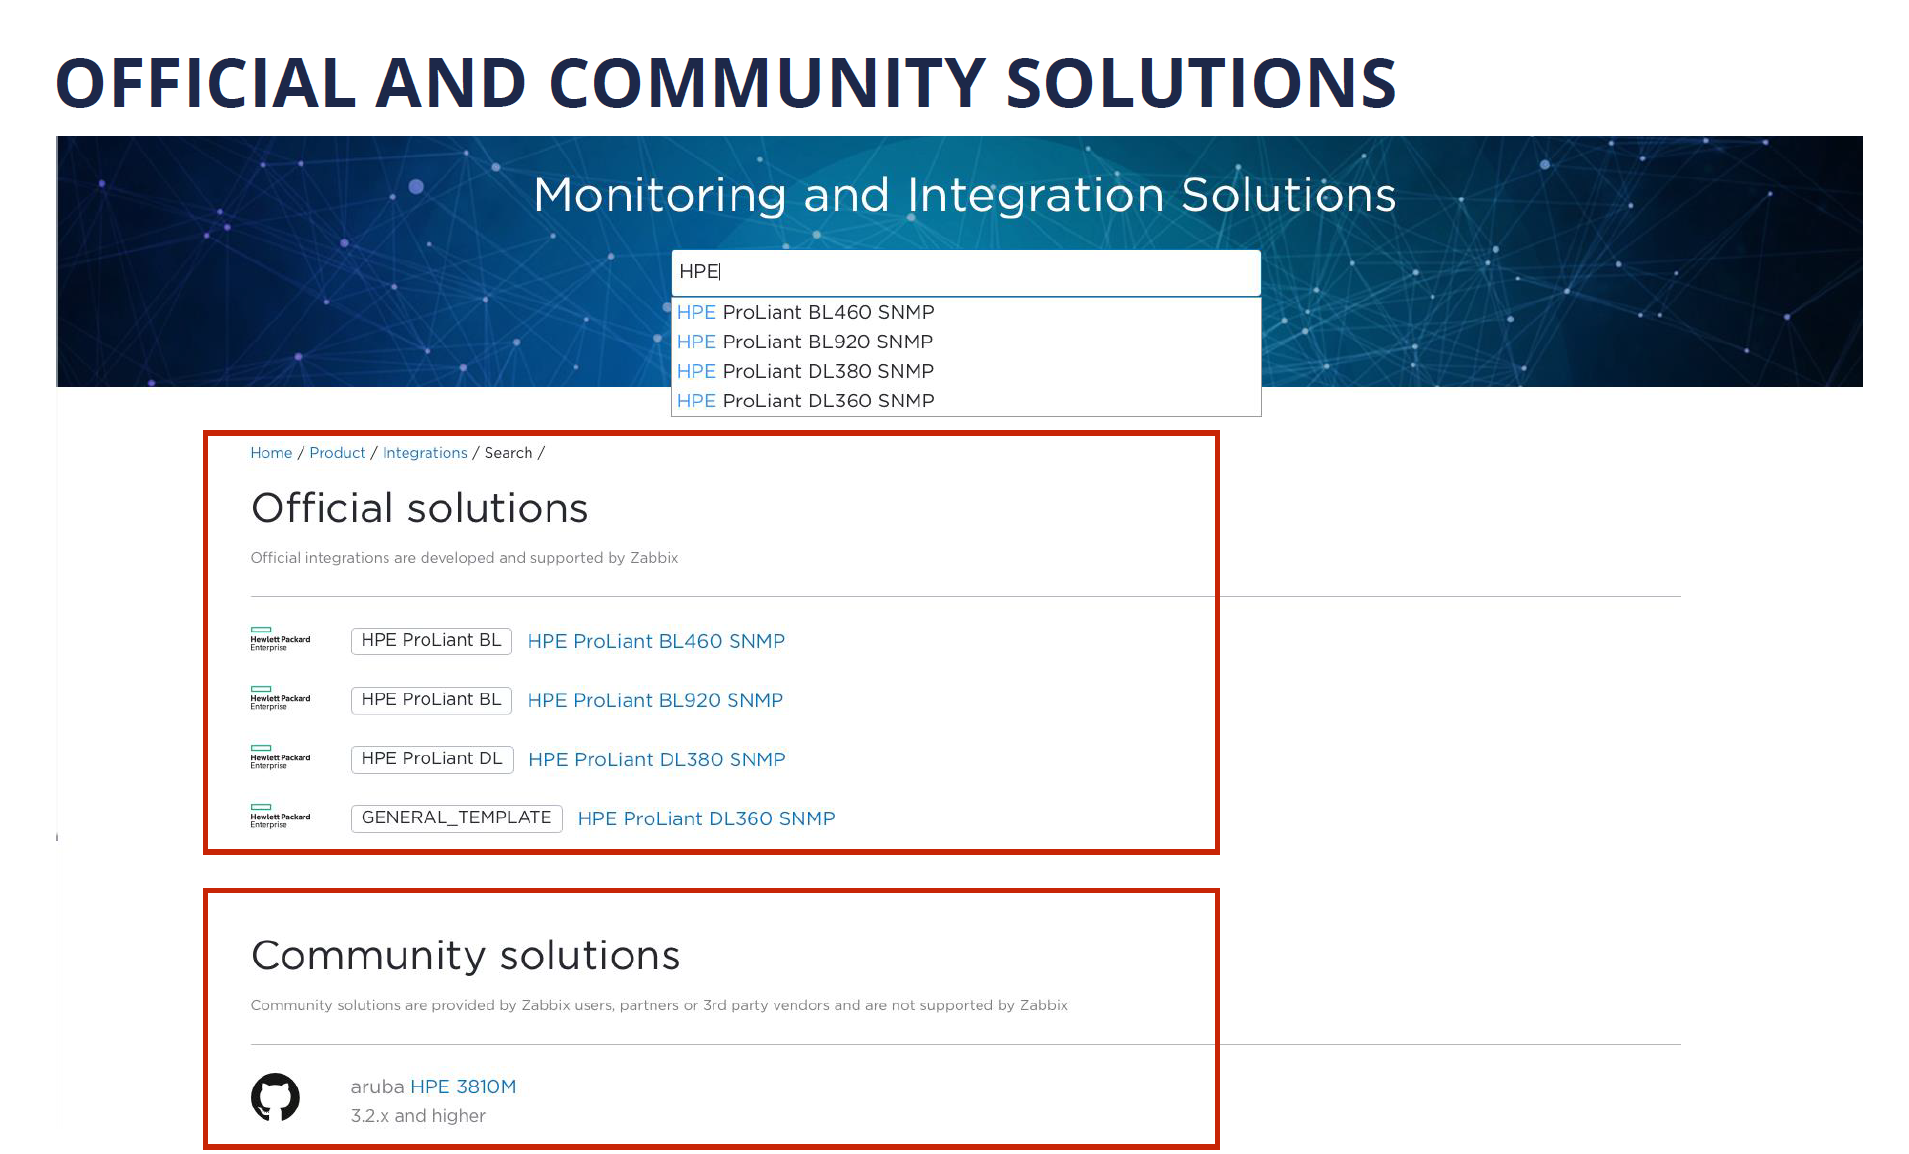
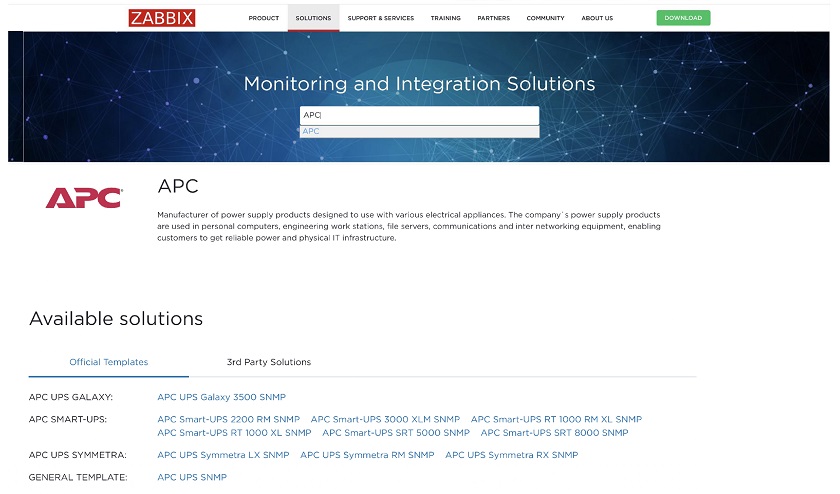
To find out what Zabbix is capable of monitoring and what integrations are available with the third-party systems, you are welcome to visit zabbix.com/integrations, as the solution you want to monitor or a system you’d like to integrate Zabbix with might be already supported or exist as a community-supported solution.

Official solutions for monitoring and alerting

Recently, we introduced device-specific templates on our integration page, where you can see what devices are currently supported. For instance, we started with APC devices. Here, if you click the required device, you will go to the page with the template for the specific device.

Templates for hardware vendor devices

We are planning to increase the number of out-of-the-box supported vendor devices, and we’ll have a look at the Cisco, Juniper, F5, and some other vendors very soon.

NOTE. Zabbix is a free and open-source solution. We don’t have any closed source components. We are just as free as Linux and use exactly the same GPLv2 license. You can download Zabbix from zabbix.com/download and deploy it anywhere you want.

Deploy Zabbix on-premise

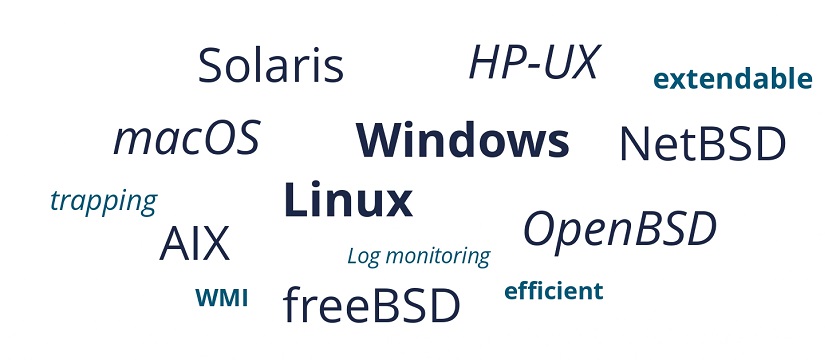
We support a range of the most popular operating systems. So, you may deploy Zabbix on MAC OS, Windows, Docker Containers, Docker environment, Cloud AWS, Azure, OpenStack, Digital Ocean, Google Cloud. Recently, we have introduced support of Linode.

Deploy in the cloud

To have your Zabbix instance running in a cloud, you don’t need to spend a lot. You can use Digital Ocean or Linode, and for about $5 per month, you may have Zabbix Server up and running with Zabbix UI, which will be capable of monitoring thousands of devices.

Breaking changes

  • Applications and screens are not supported and many related API methods are affected.
  • We don’t support global value maps anymore, so we have to switch mentally from supporting value maps globally to supporting value maps on a template level (preferred) or on a host level.
  • New syntax for trigger expressions and calculated metrics, which is easier to understand and use.
    —  Aggregate metrics are merged into calculated metrics.

Integration with Grafana

Following the release of Zabbix 5.4, our users quickly realized that our integration with Grafana was broken as we have introduced the aforementioned API changes. Since we do not support applications anymore, all API changes were documented just a few days before the official release of Zabbix 5.4.

Thanks to the swift reaction of Alexander Zobnin, maintainer of the Grafana plugin for Zabbix, this broken integration was fixed very quickly, and you now can easily and safely use Grafana with Zabbix 5.4.

Upgrade notes

  • Upgrade to Zabbix 5.4 from your existing 5.0, or 5.2, or 4.4, or 4.2 is easy as usual. You need to install new binaries for Zabbix Server and Zabbix Proxies, upgrade Zabbix UI, start the Zabbix Server, and the Zabbix Server will upgrade the structure of your database automatically.
  • All trigger expressions, calculated and aggregate metrics will be automatically converted to the new syntax.
  • All applications will be automatically converted to tags. For instance, “CPU” will be converted to the tag “Application:CPU”.
  • Global values maps will be moved to template and host level.
  • All screens will be automatically converted to Dashboards.

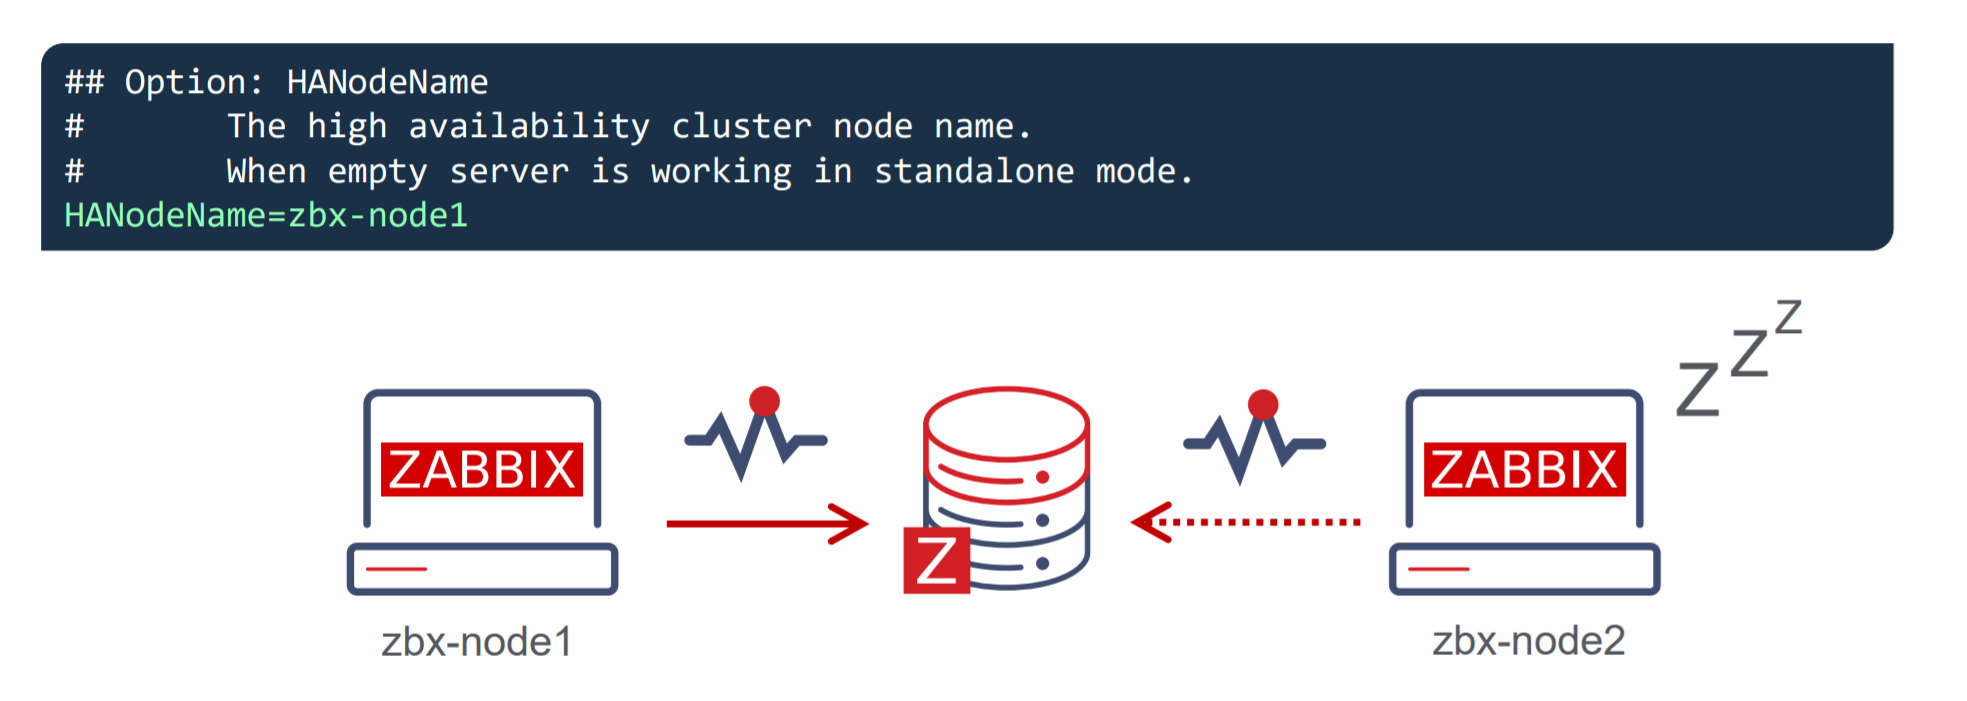
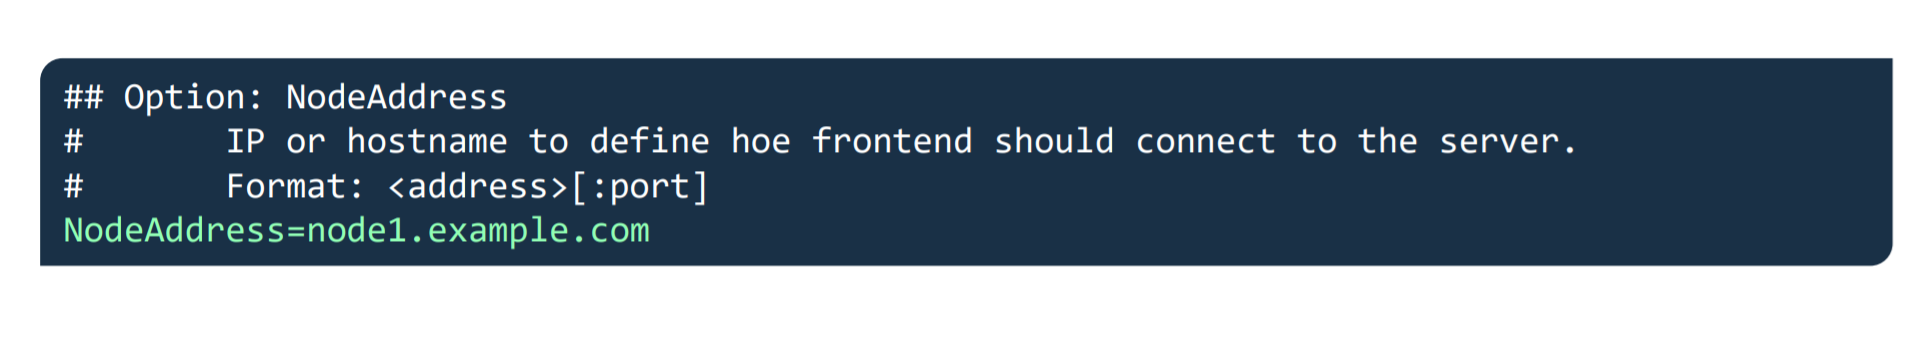
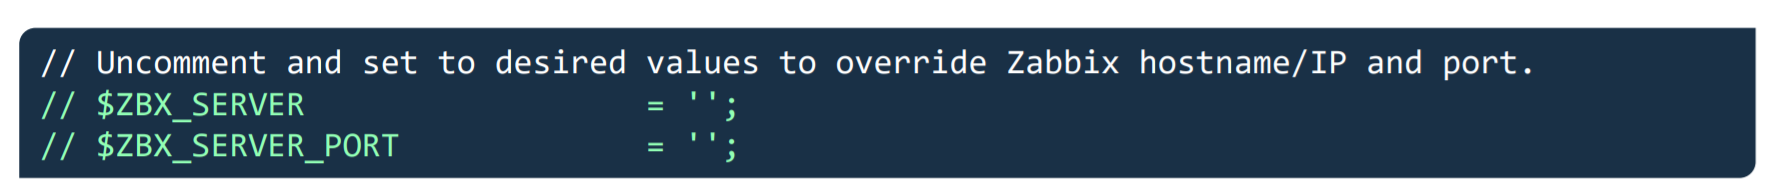
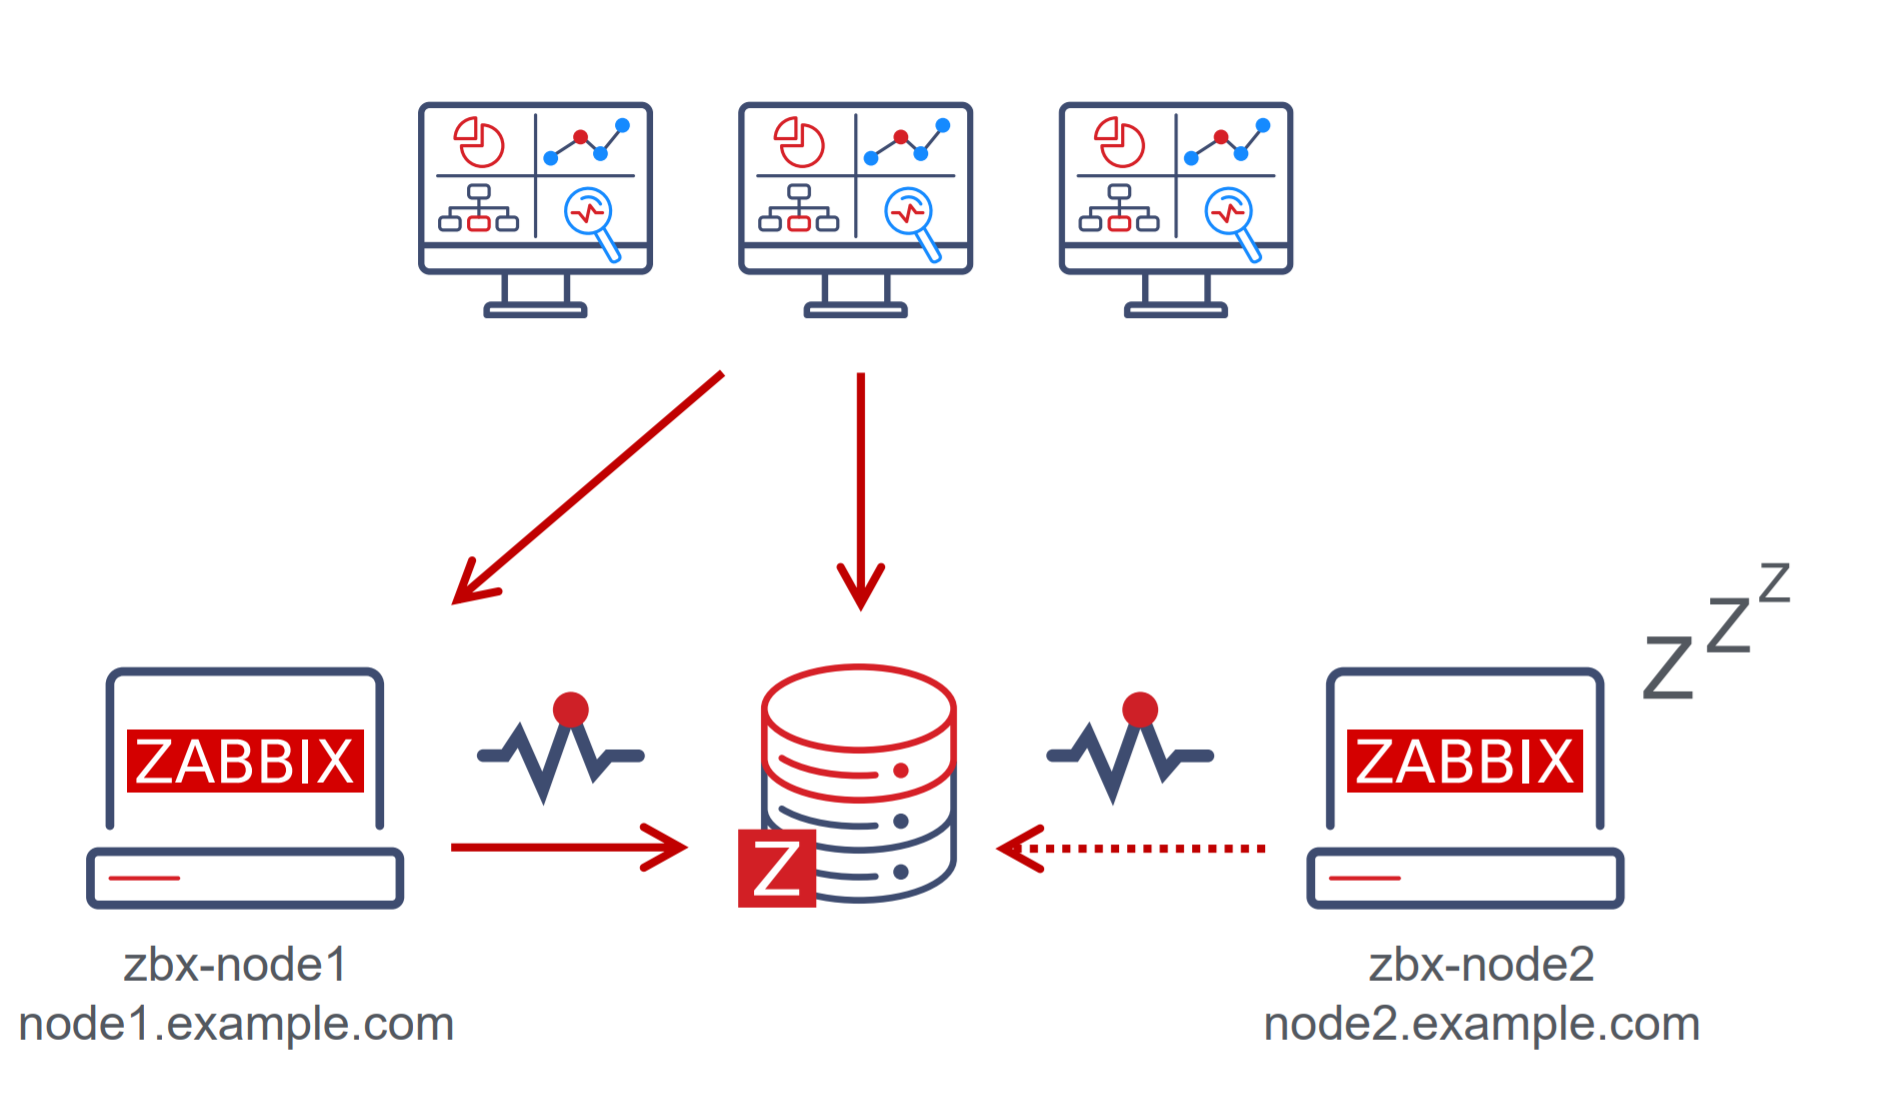
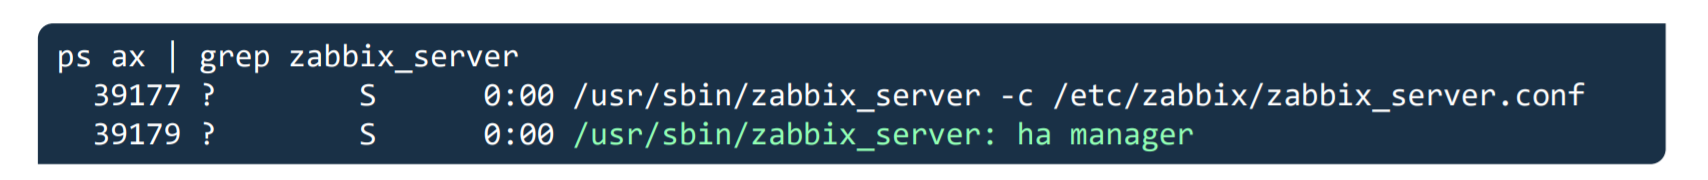
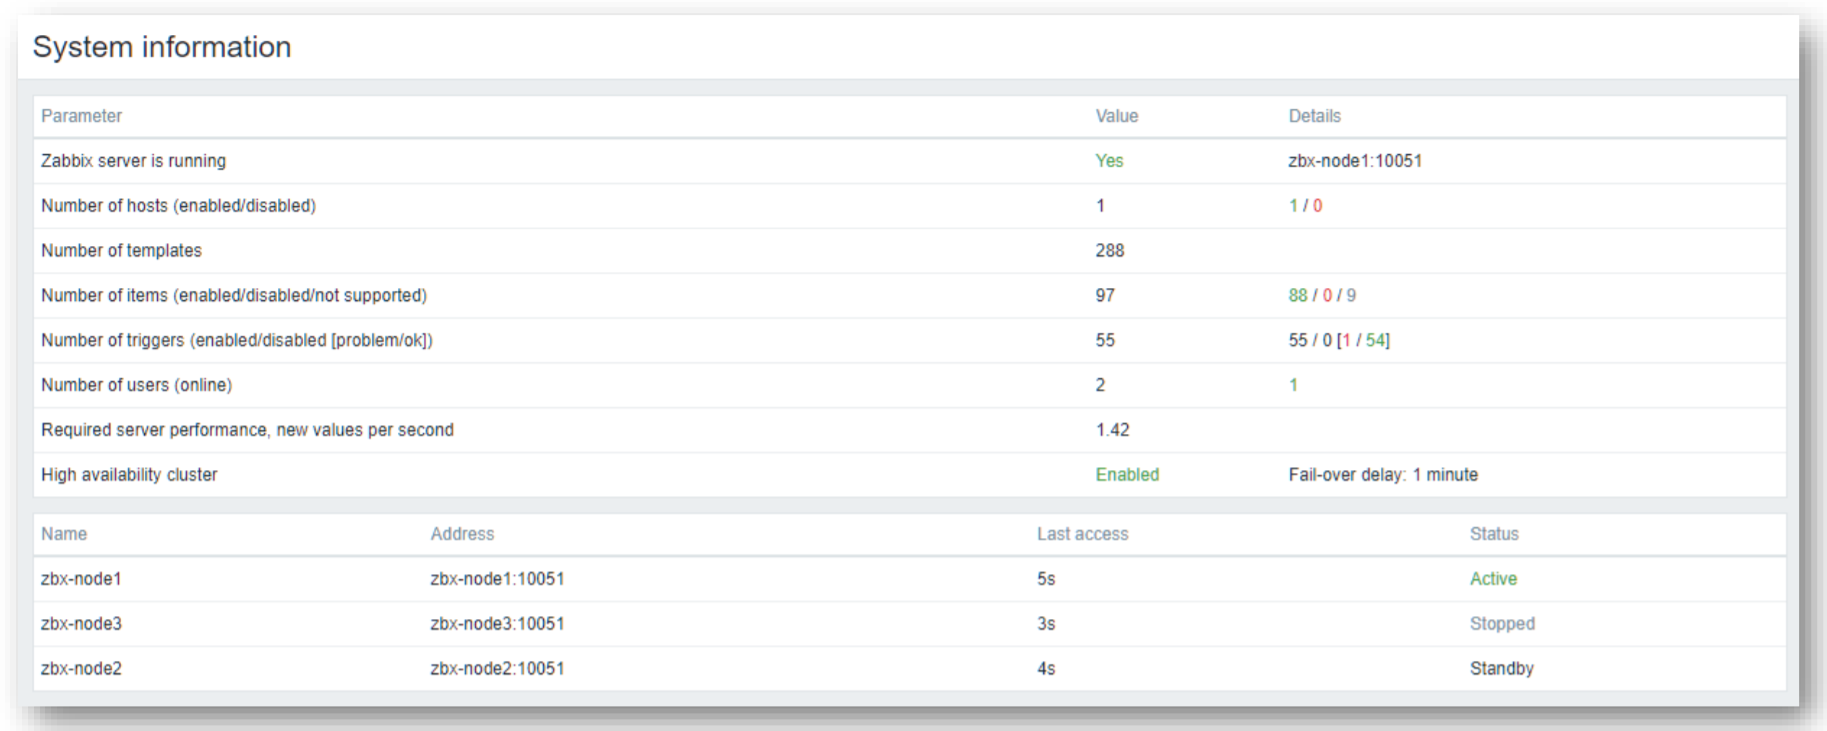
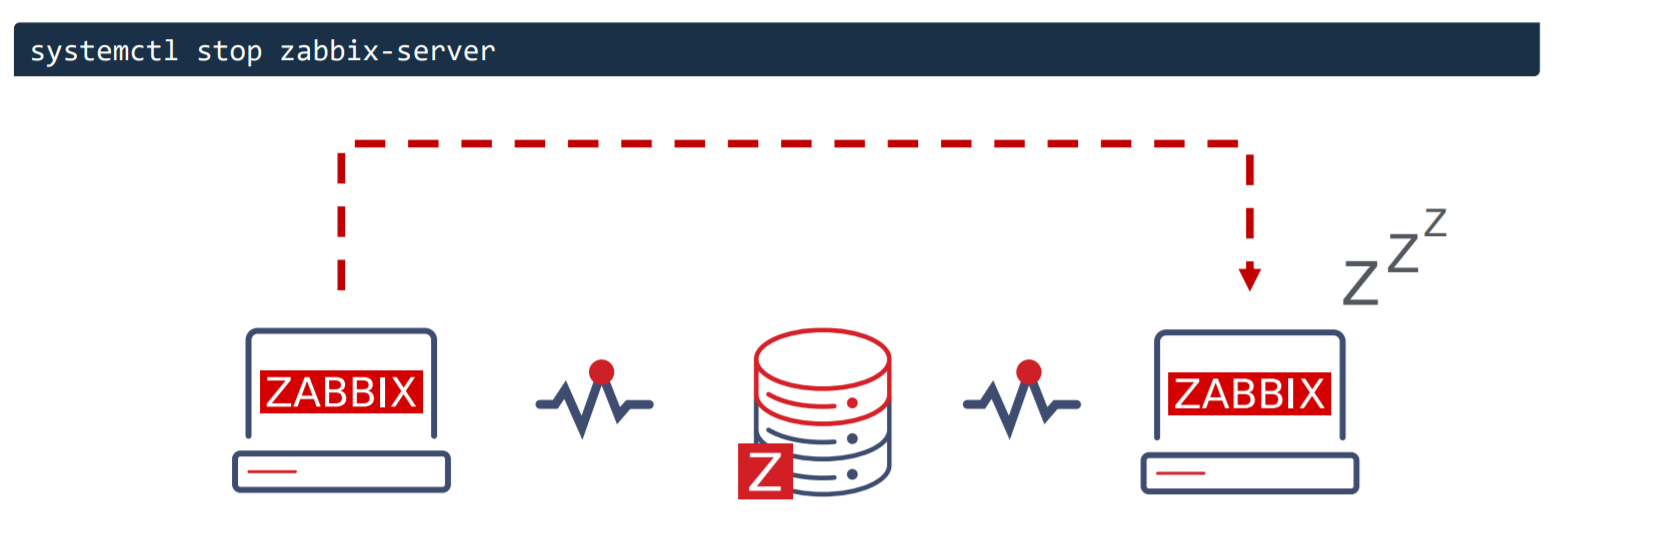
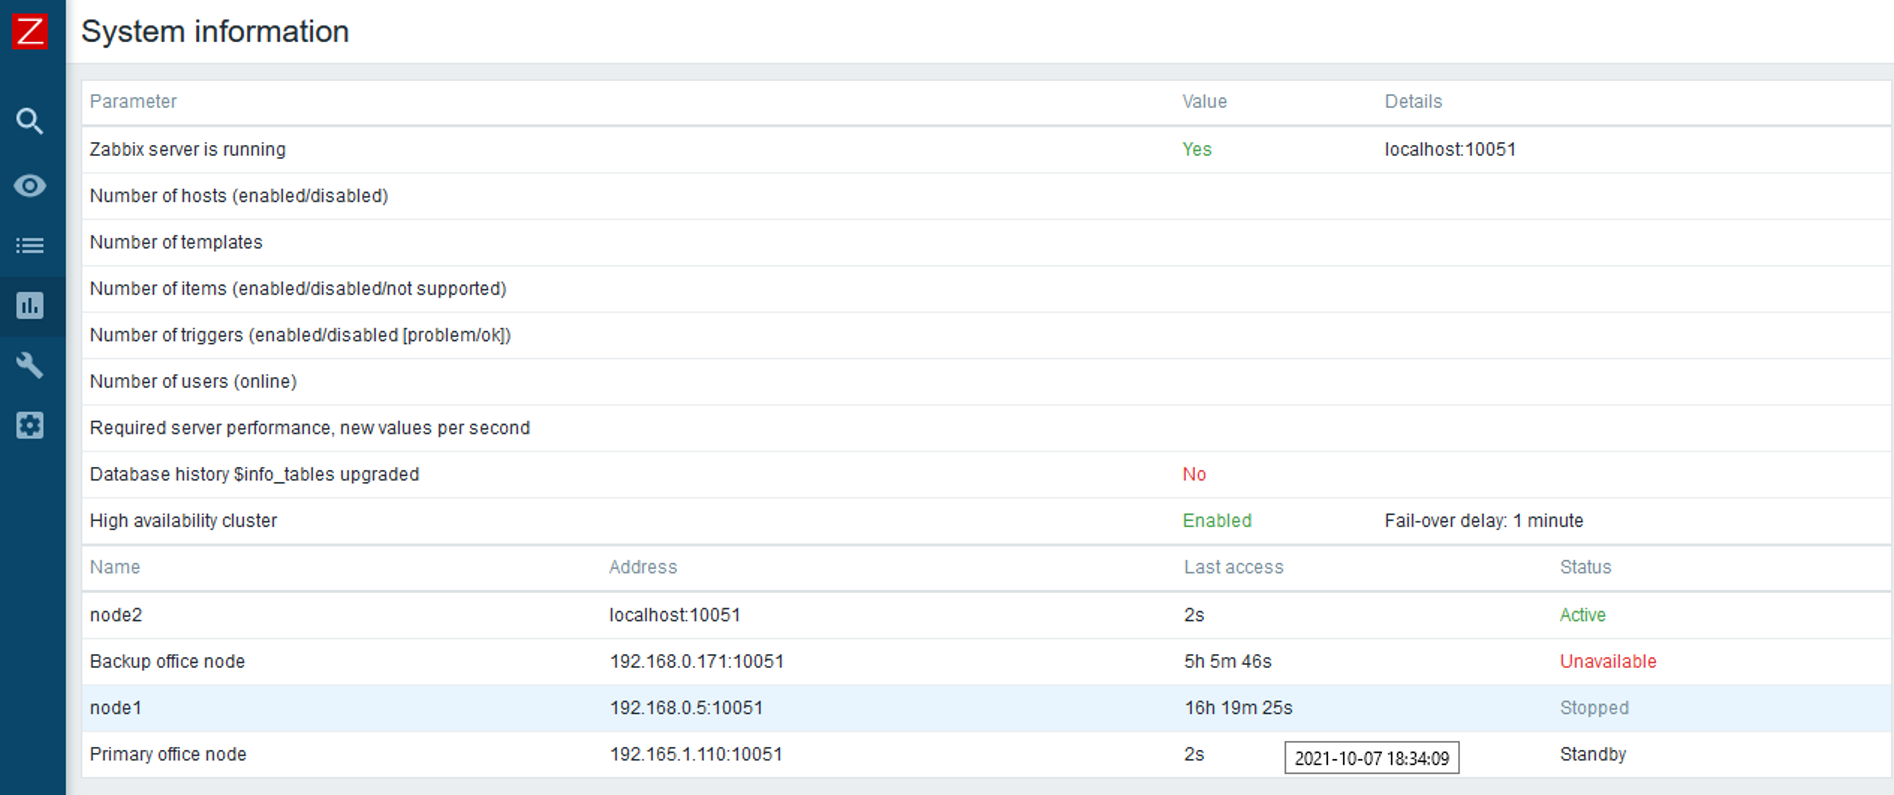
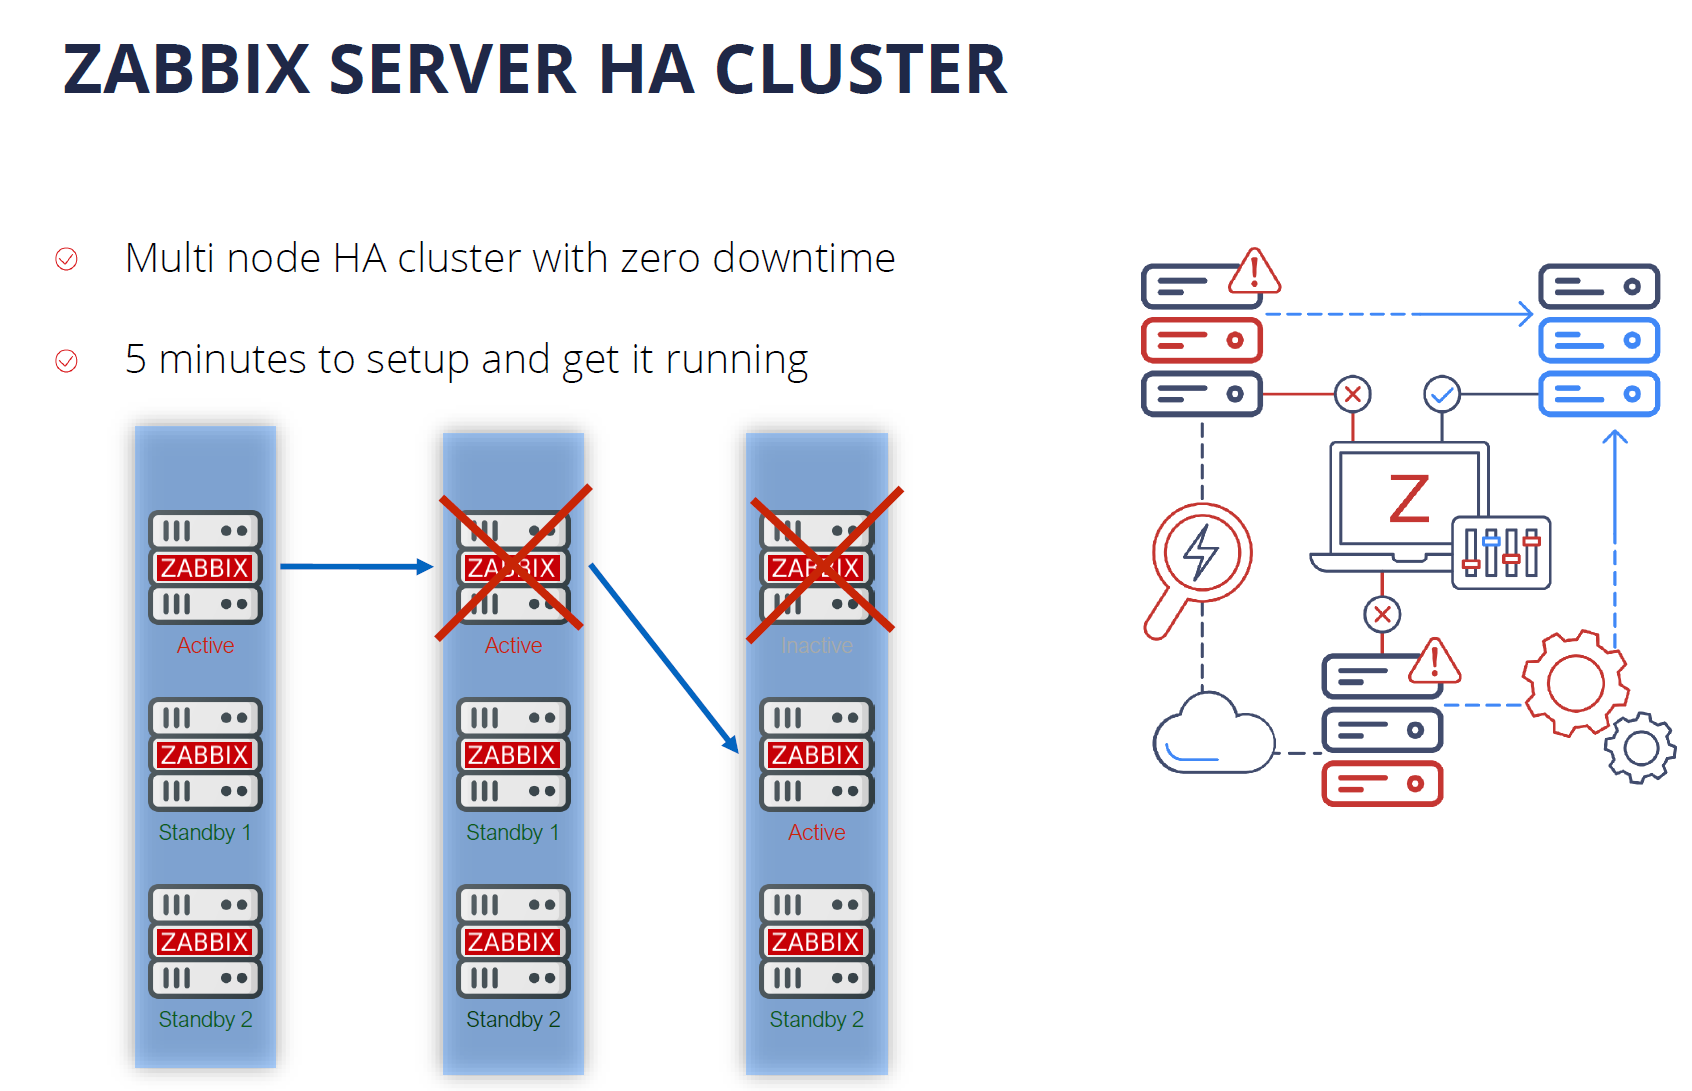
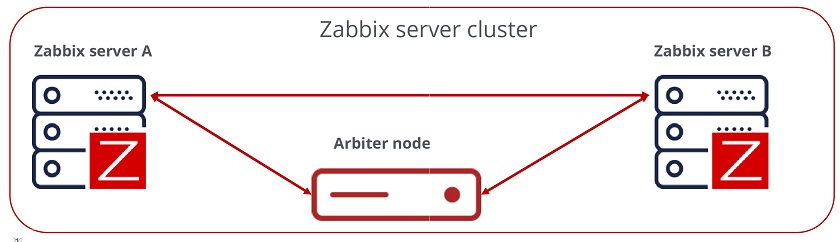
NOTE. The next LTS release, Zabbix 6.0, is expected by the end of 2021. Our development team is working on High Availability for the Zabbix Server, which will be available out of the box so that you could install the Zabbix Server and you run it in a high-availability cluster mode.

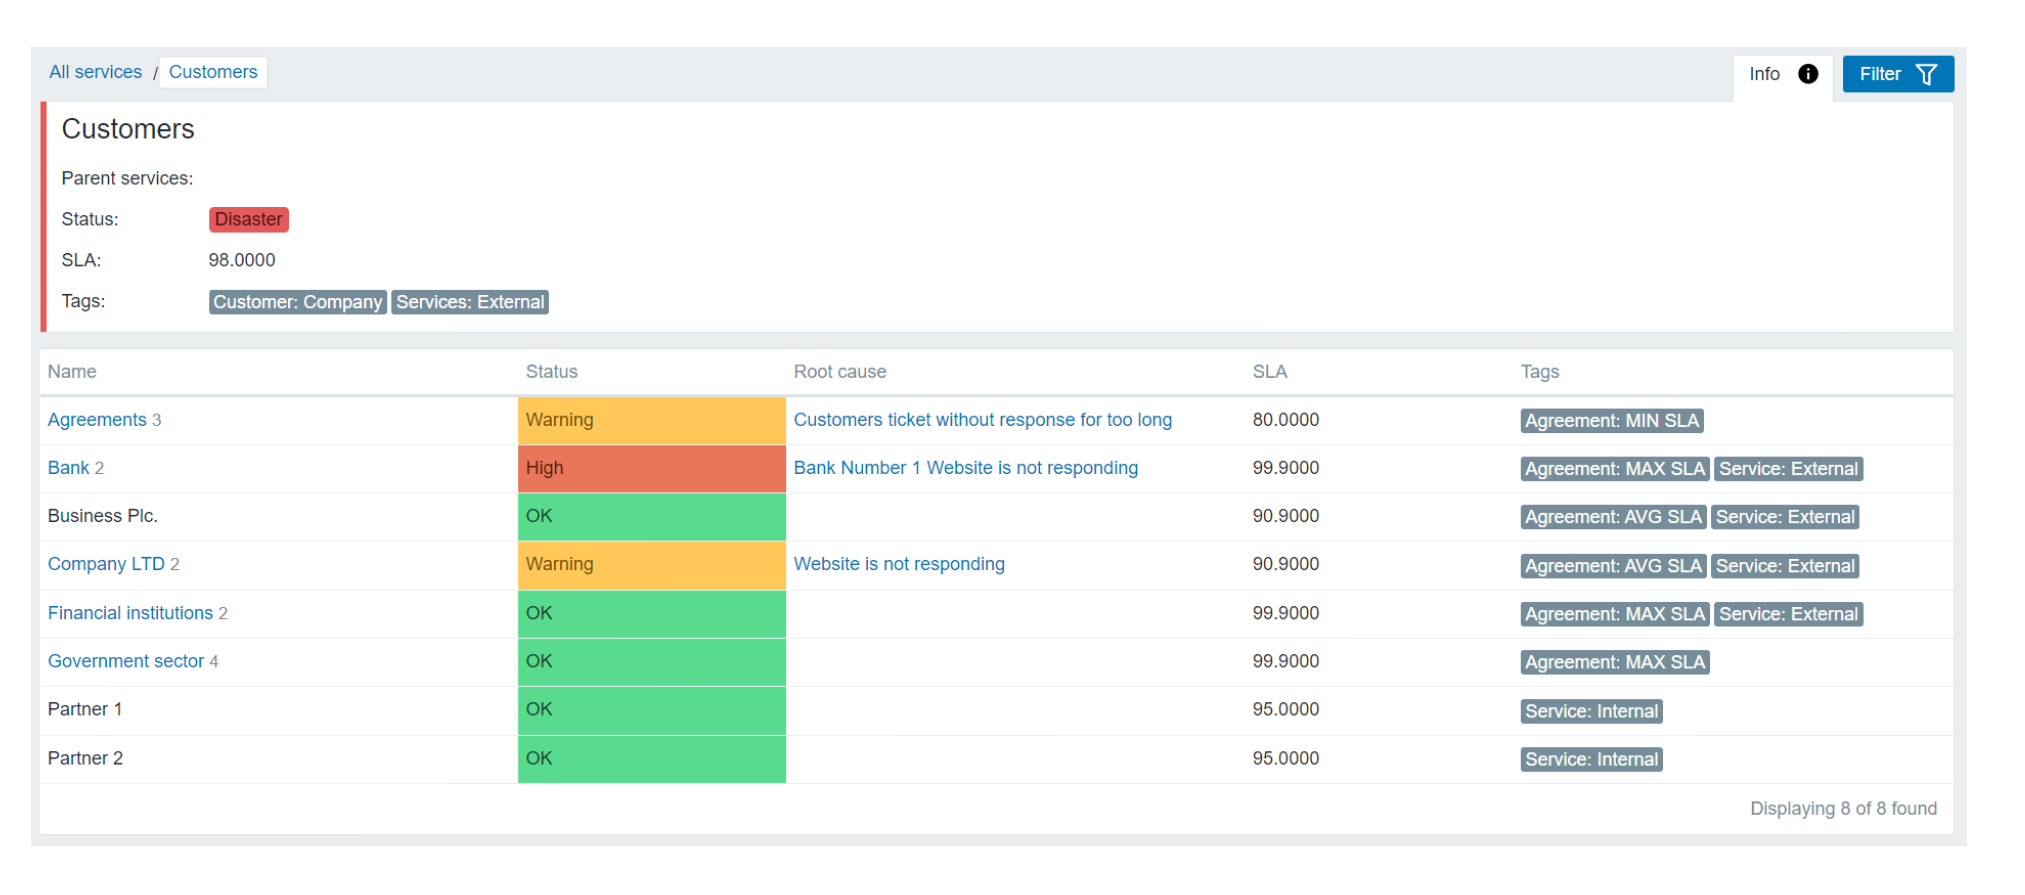
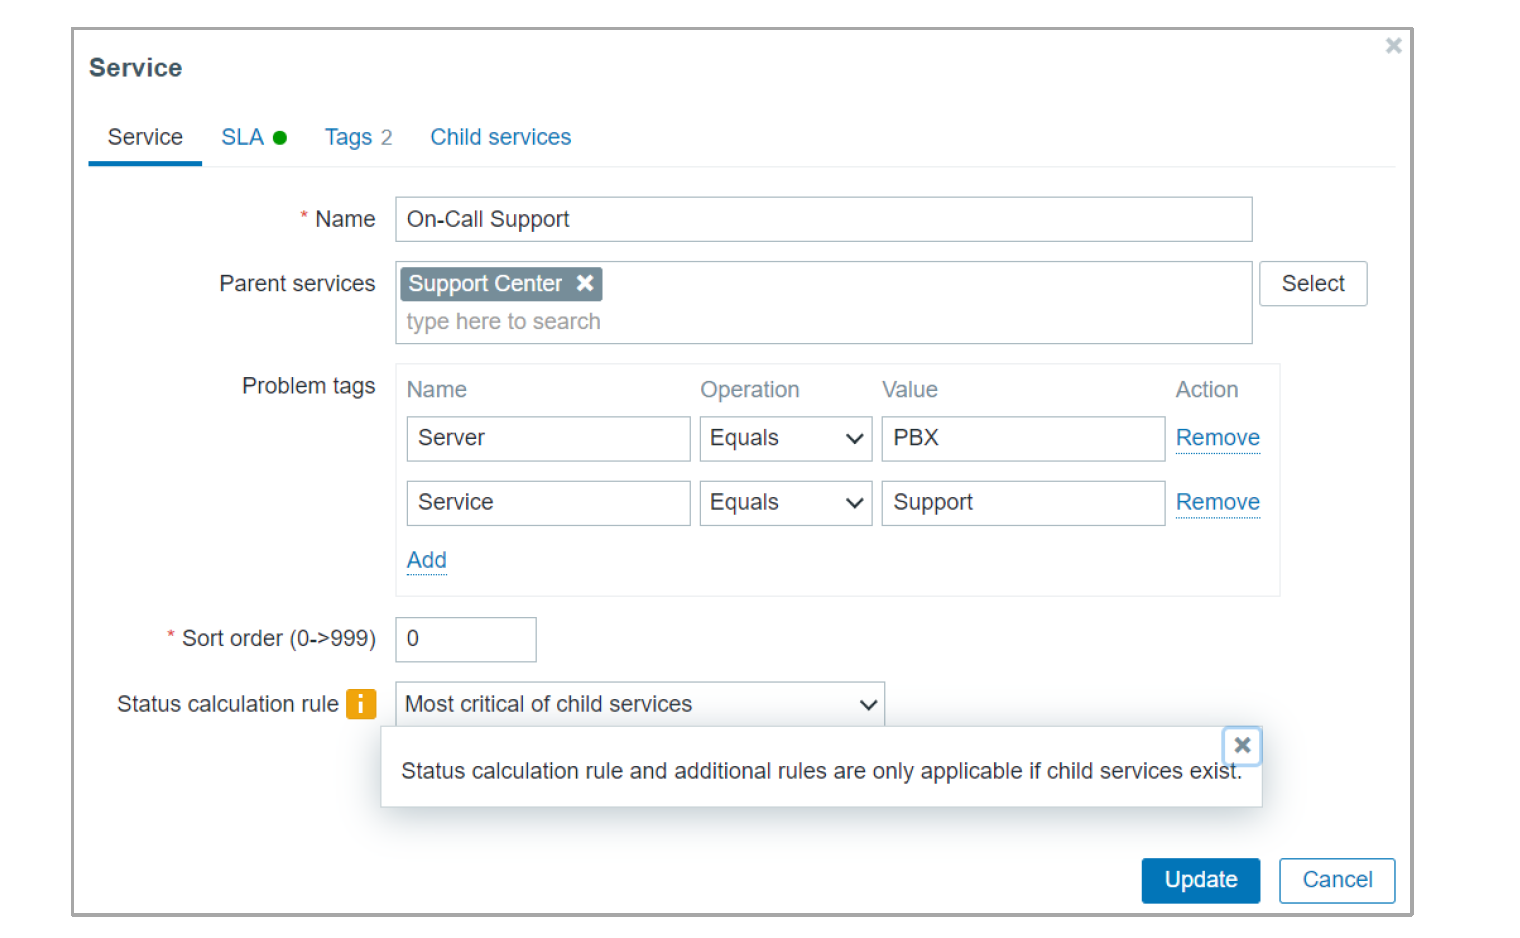
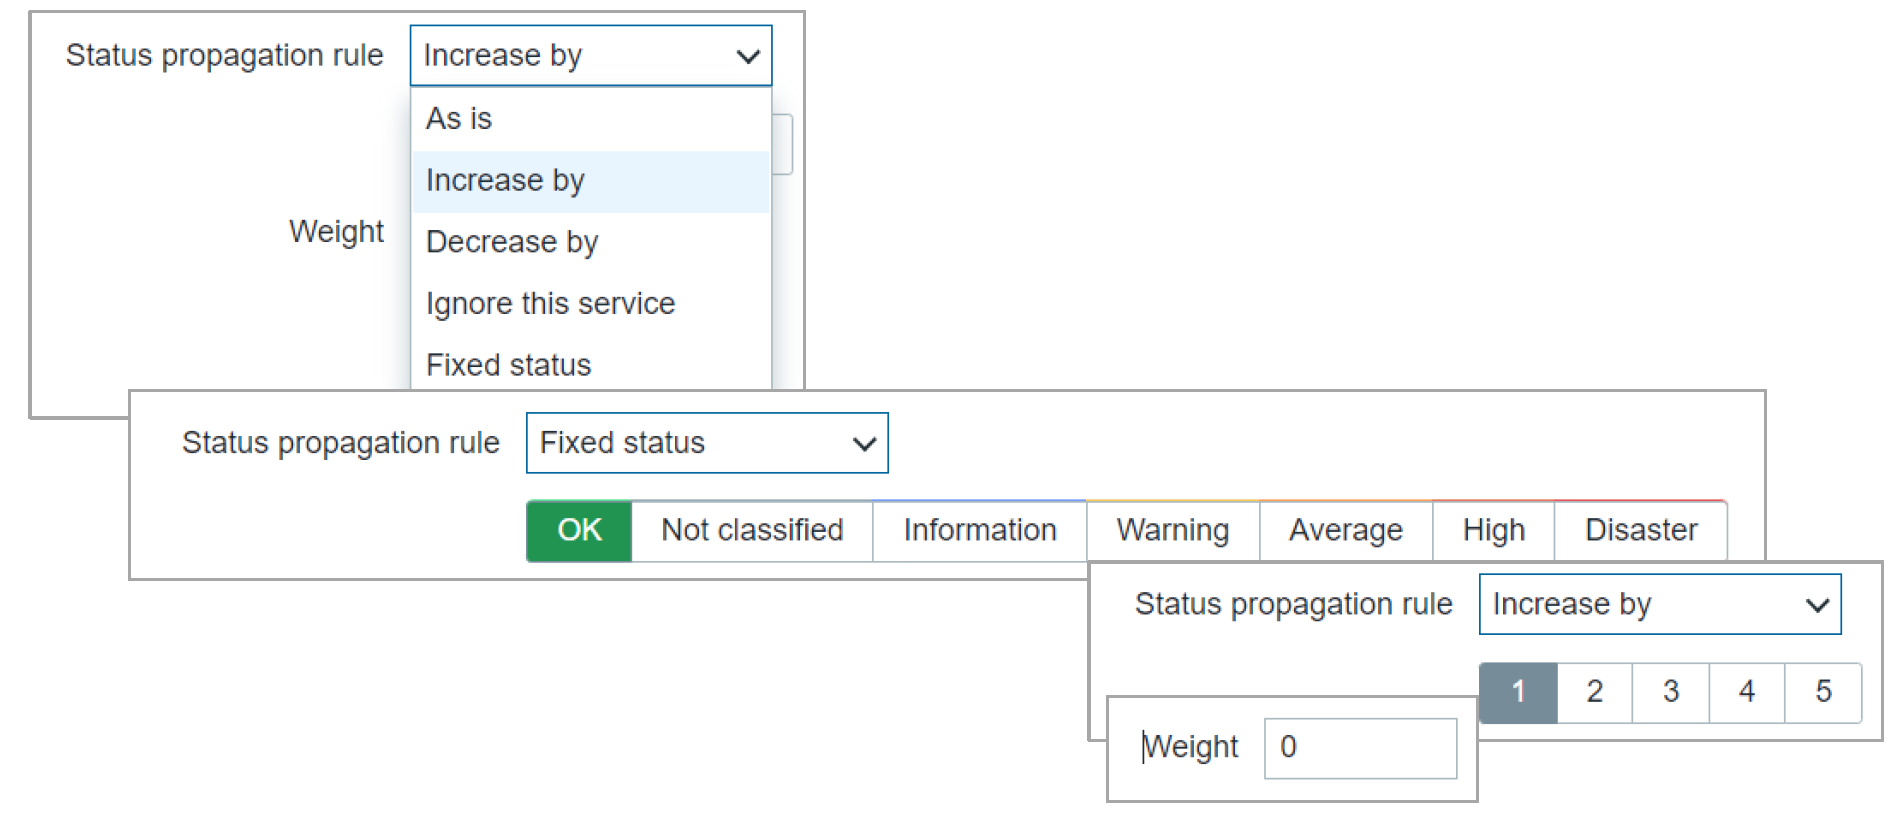
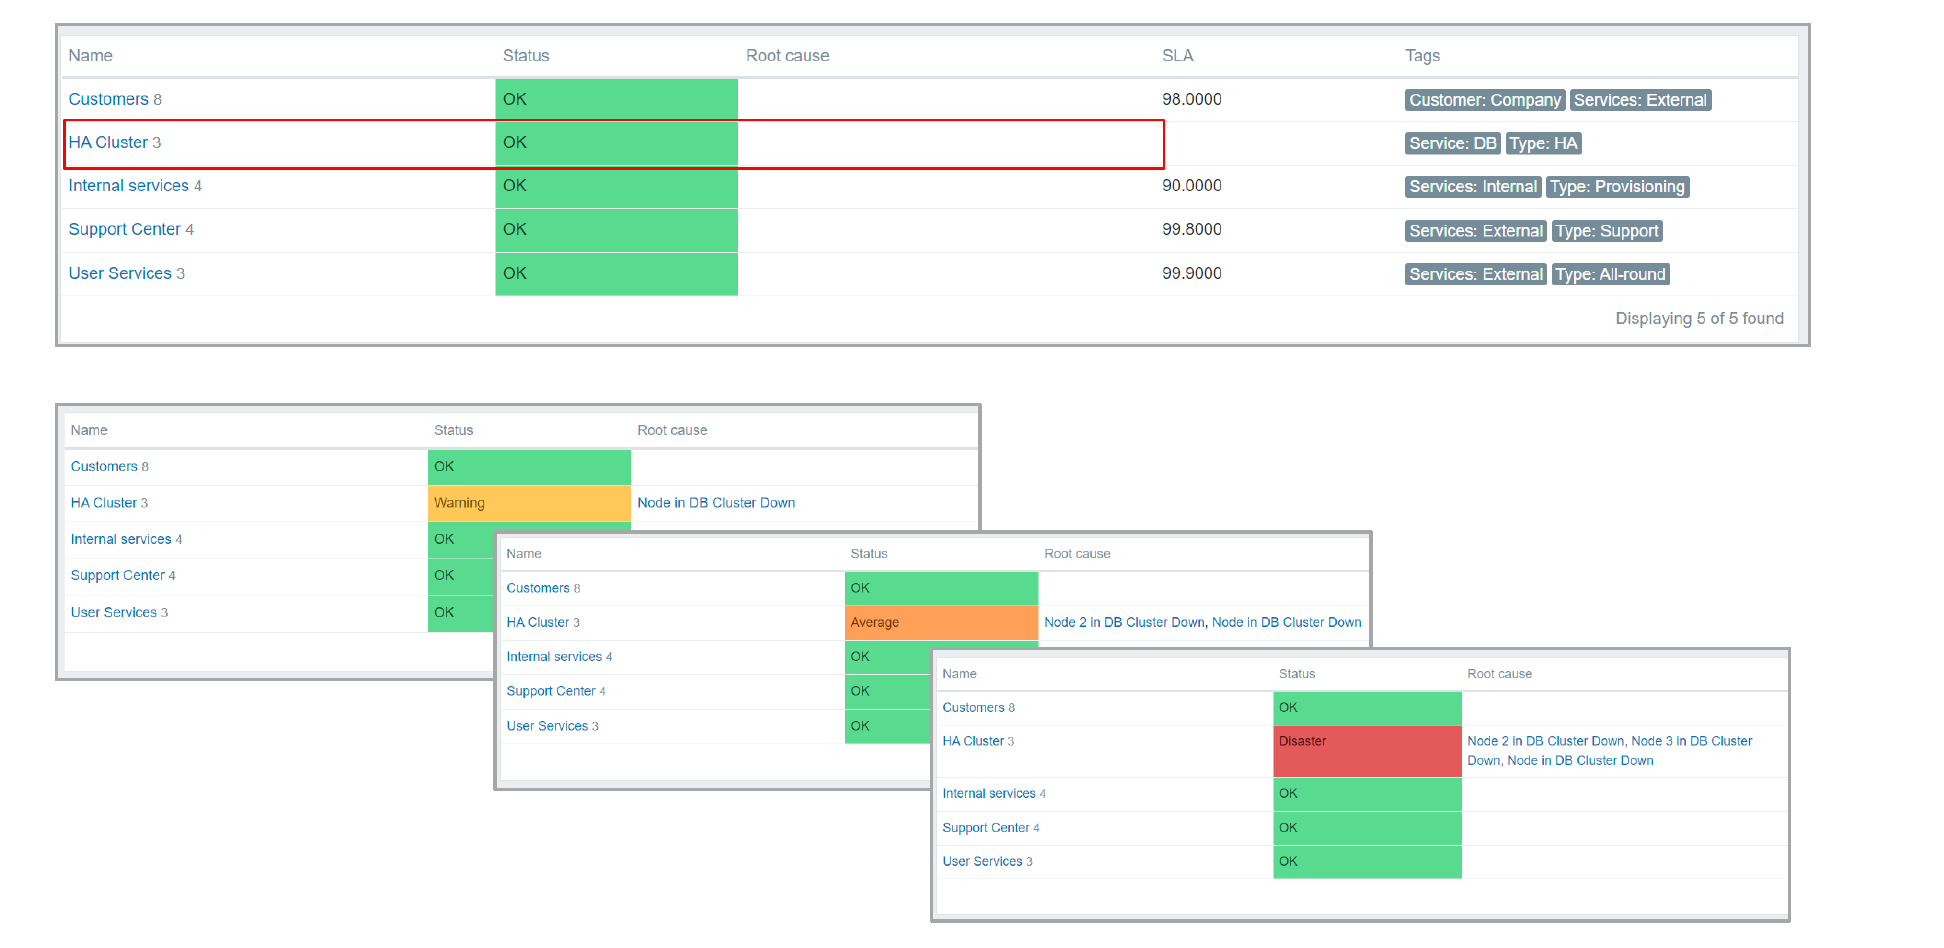
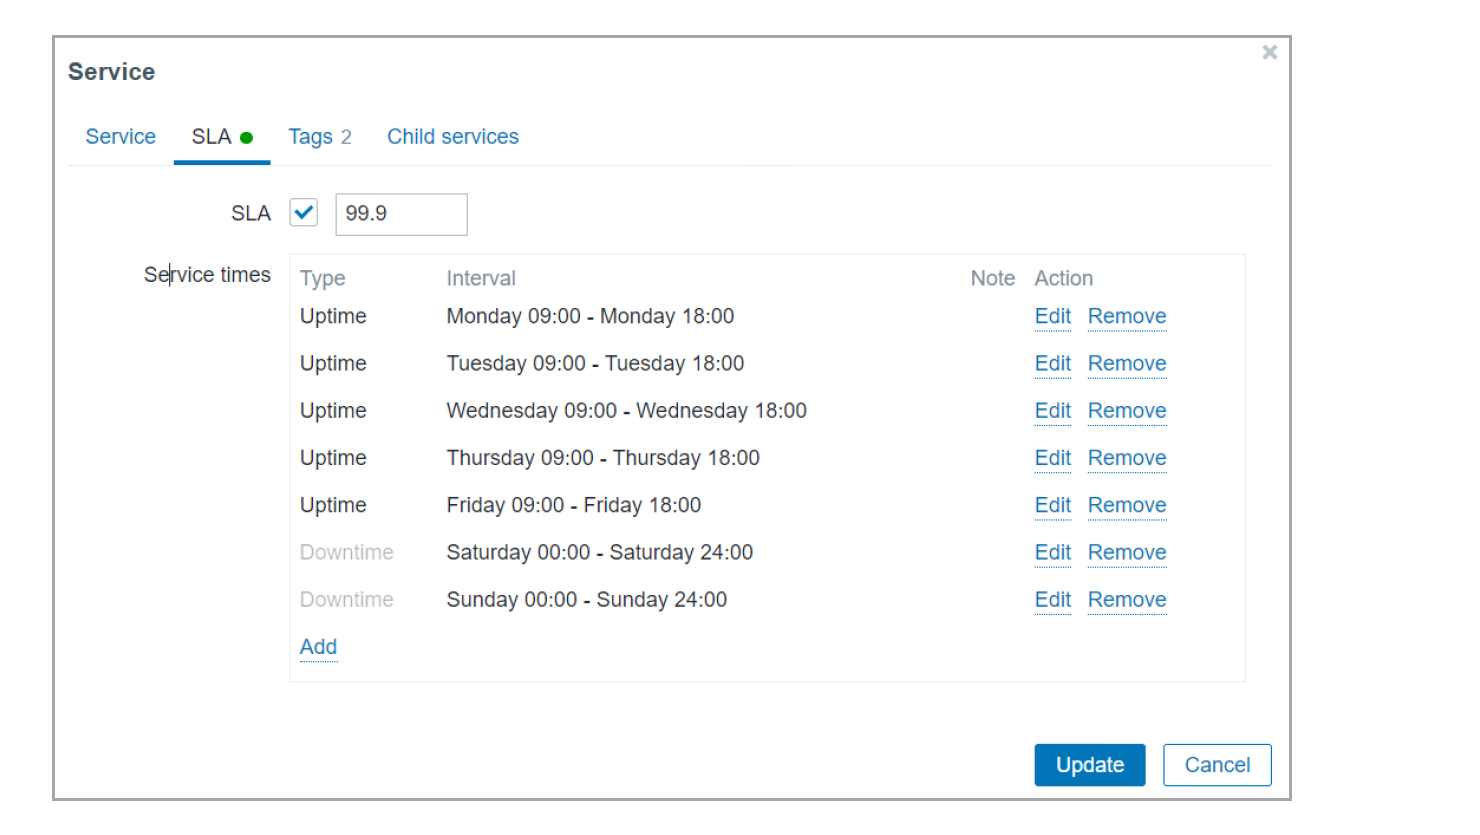
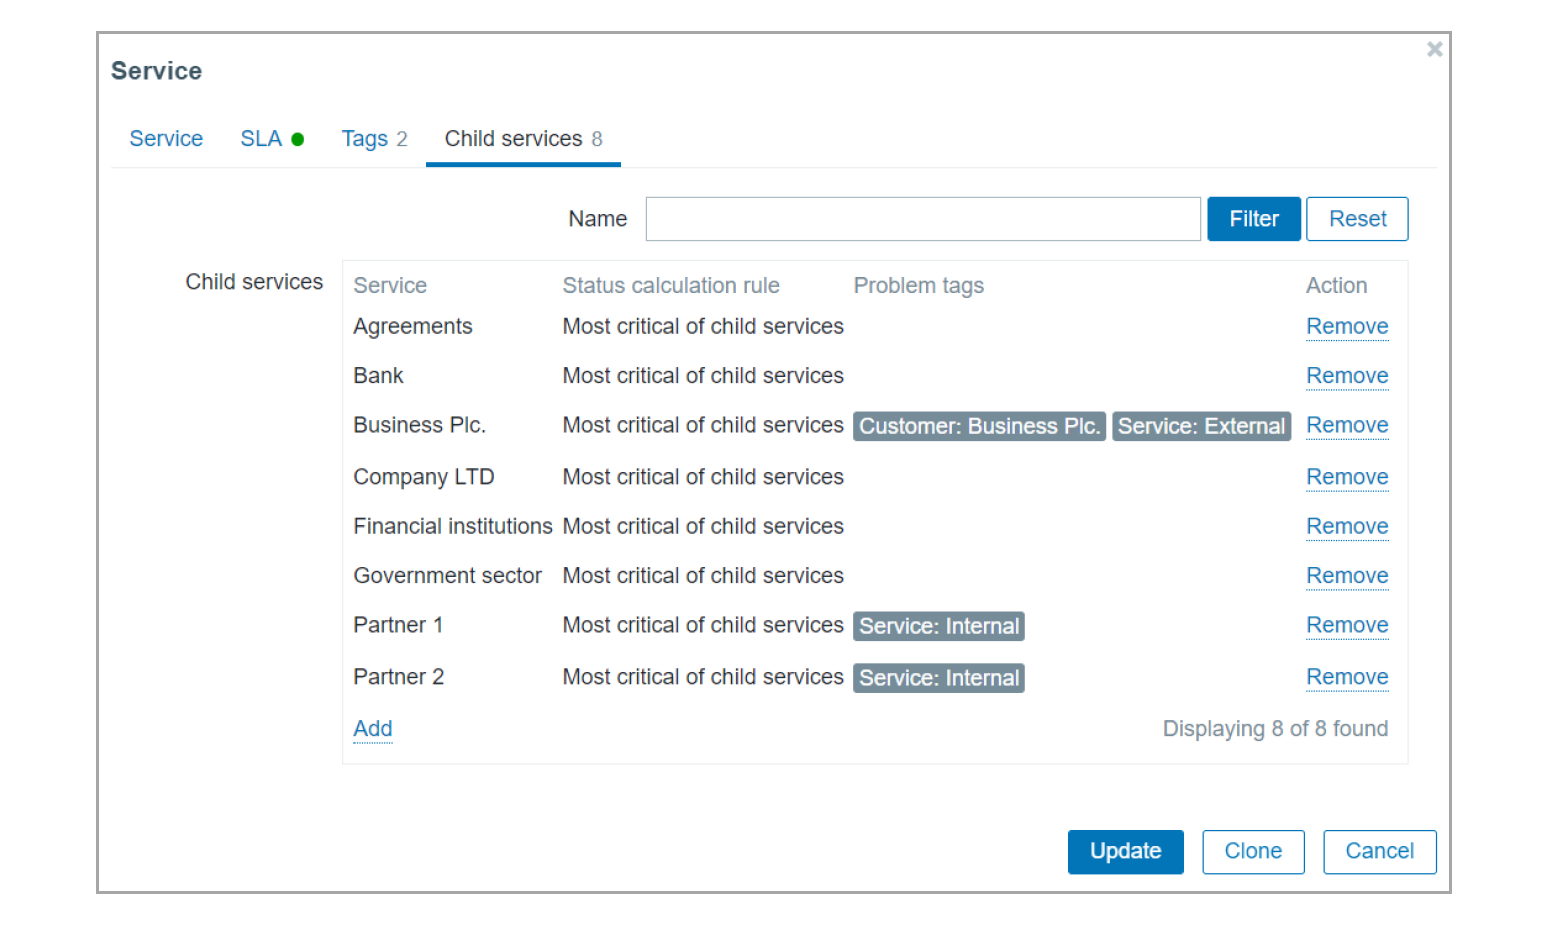
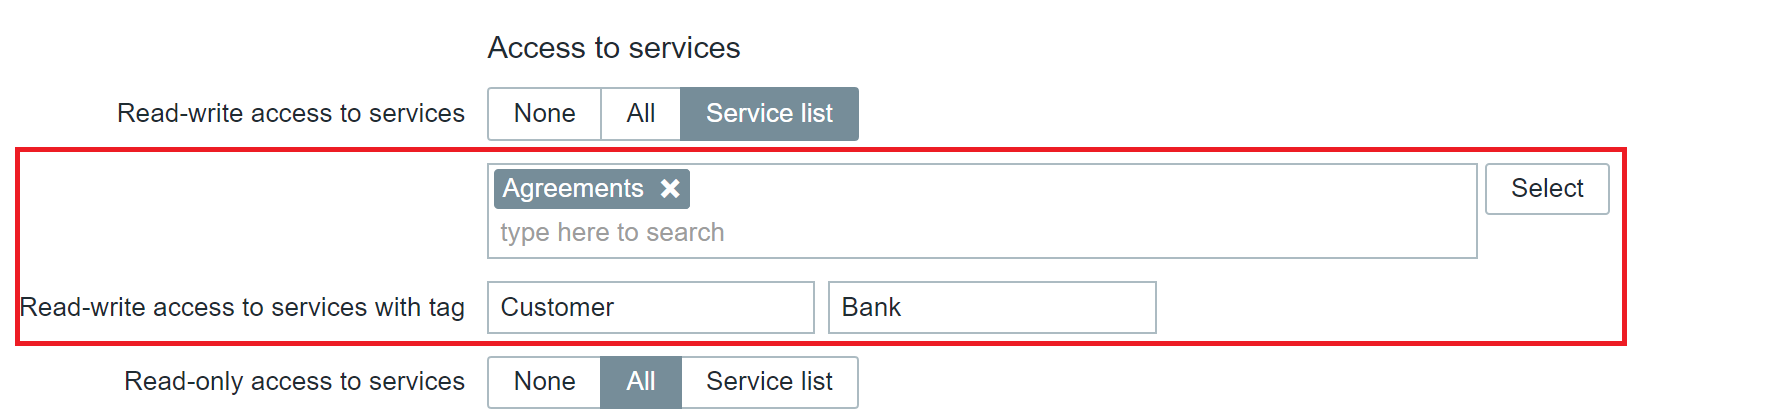
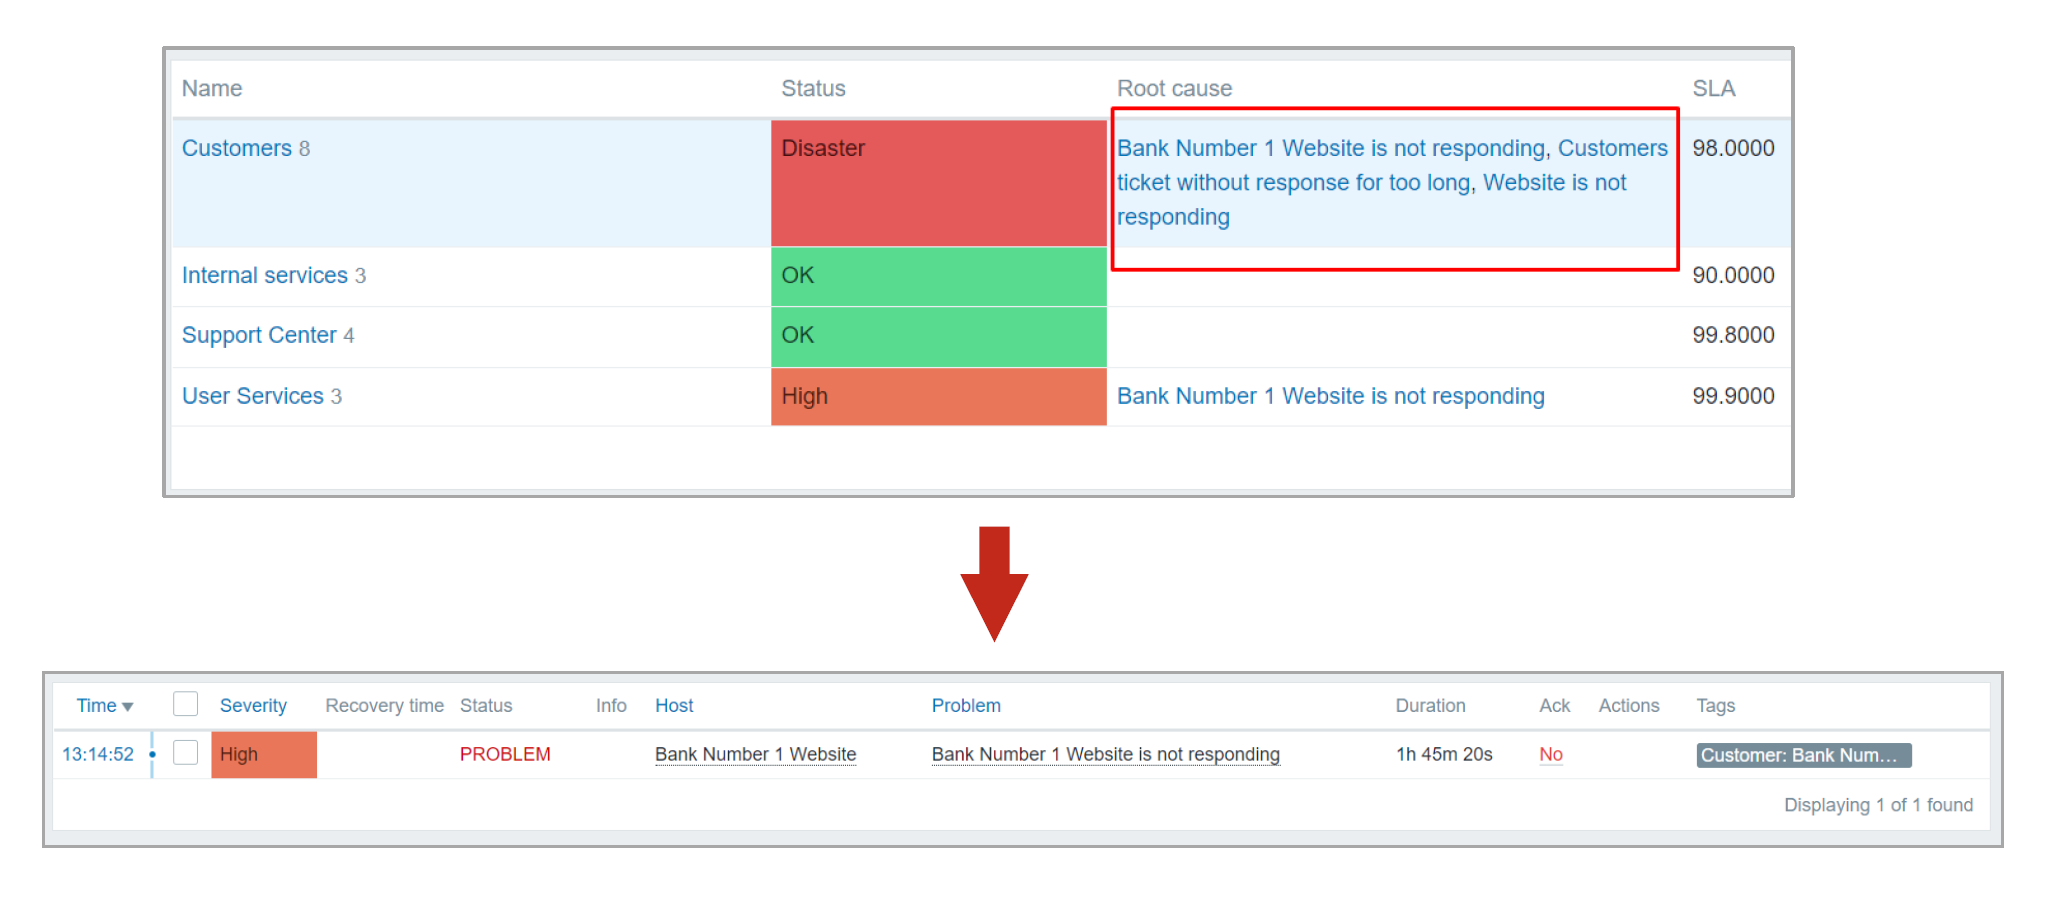
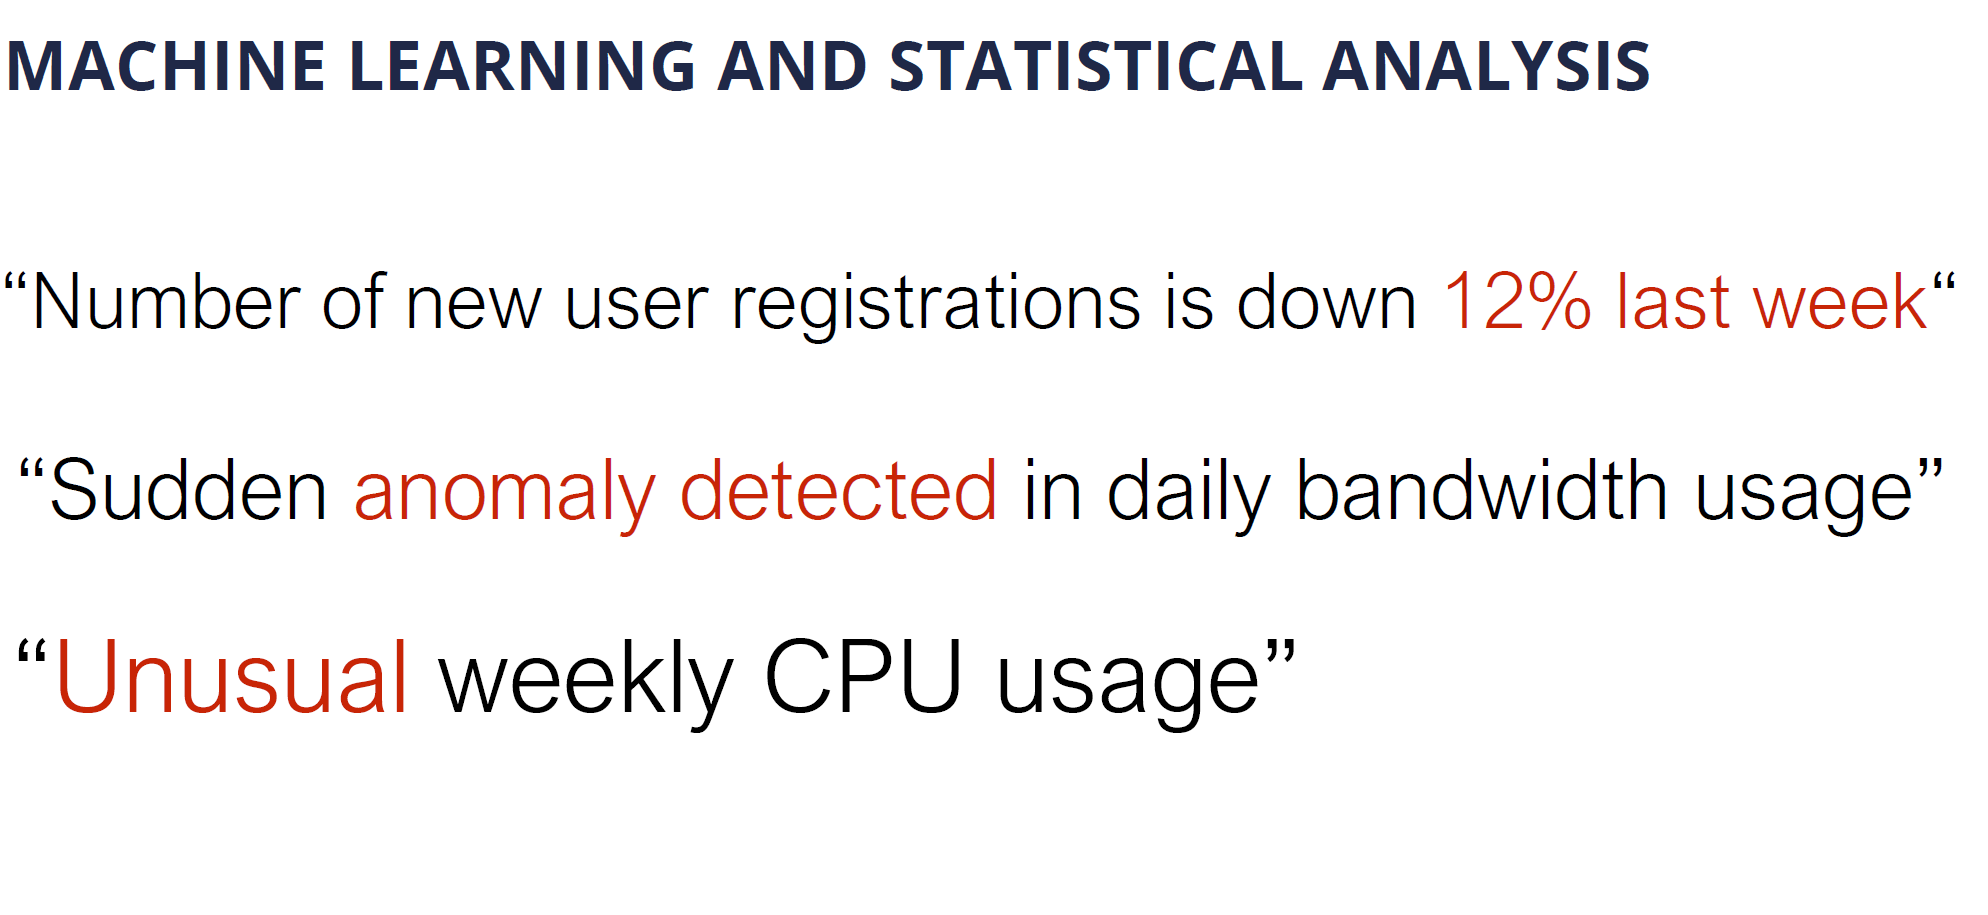
We also invest much time to improve the Business Service Monitoring (BSM) in Zabbix, which is related to the service tree and dependencies between services, business service monitoring SLA, and SLA reporting.

Zabbix roadmap

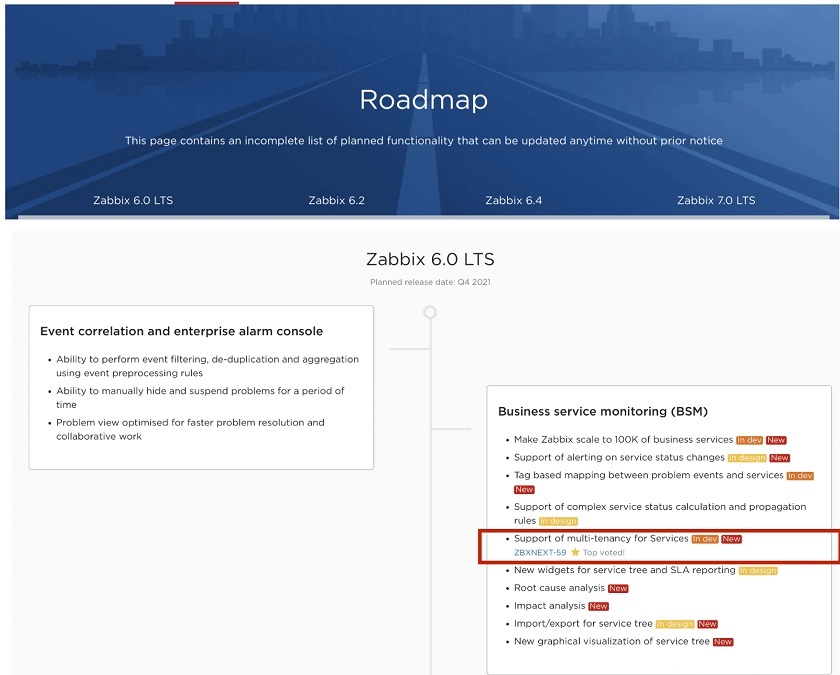
More information about the expected features is available at zabbix.com/roadmap. Here, you may click the version you’re interested in, for instance, 6.0, 6.2, 6.4, or 7.0 LTS. We are now keeping a dashboard of improvement, so you will immediately see any progress down the road of our 2.5-year plan.

Zabbix roadmap

Now, we maintain a dynamic dashboard for our roadmap displaying the progress of development of any feature. For instance, ‘Support of multi-tenancy for Services’ is marked with ‘In dev’, as it is under development and has been added to the roadmap recently.

In addition, this feature has a reference to the ZNXNEXT-59 issue, where more detailed information on the feature is available. ‘Top voted’ mark here means that the feature has been voted for by many Zabbix users and community members.

Questions & Answers

Question. Is migration from screens to dashboards automatic? How does that work?

Answer. All screens — global screens and template-level screens will be automatically converted to global dashboards and template-level dashboards. You don’t need to worry about that, all information will be preserved.

Question. Now you have dashboards delivered as reports. Do you plan to natively send these dashboards to some third-party integration, for instance, put it in some frame in a company’s  website?

Answer. If we have such plans, they should be on the roadmap. You can do it right now using some sort of fixed-frame technology, though it is an ugly way to integrate one solution with another. I am looking forward to adding the ability to include a widget or a dashboard into a third-party HTML page. I think it will be implemented in Zabbix sooner or later.

Question. Do you have any plans to have reports based on some other sections of Zabbix, such as inventory reports, or availability reports, and so on?

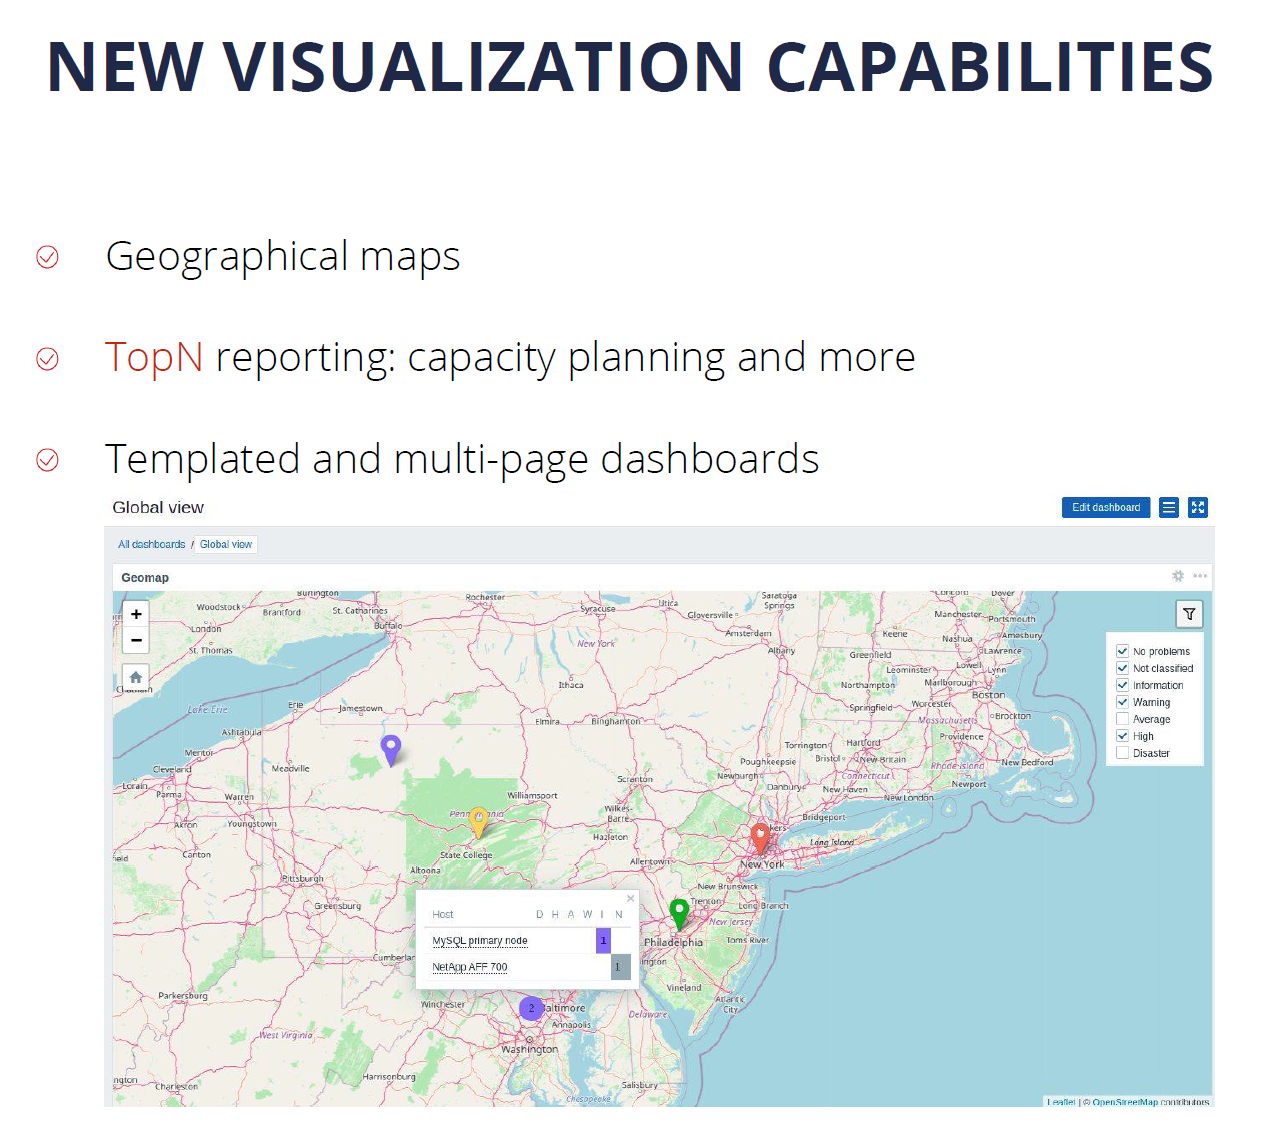
Answer. This functionality can evolve as a result of improving the visualization capabilities of Zabbix dashboards or more specifically by introducing additional widgets for different purposes, such as geographical maps, data table widgets, which are already planned for Zabbix 6.0, capacity planning, and widgets for all possible use cases. So, as soon as we have a rich set of widgets for dashboards, it will automatically put these values into PDF reports.

Some changes planned for Zabbix 6.0 are related to business service monitoring and as part of this development, we will also introduce new widgets made specifically for SLA reporting. So, we are developing in this direction — we are going to have more widgets, more widget flexibility, and maybe more visually appealing widgets in the future.

Question. Why did we implement the value maps in the way that we did? Why didn’t we implement it on three levels just as user macros global template host?

Answer. If we implemented it in three levels, the global value maps would still be there, and it would be very hard to manage value maps in this case. Suppose you have a global map defined, such as a service state. What should Zabbix do after you import a new template with the same value map service state, which is defined on a different level? Should it keep the value map service state on a template level or should it upgrade the global service state without creating the service state on the template level? This would introduce a new set of different problems and confusion in the end. So, we really need to keep templates independent to prevent those hidden dependencies on global objects such as value maps, especially for larger Zabbix deployments. Even one hundred templates in your setup might become a huge problem from the maintenance point of view.

Question. Why do we release so many intermediate versions? Why don’t we support versions 5.2 and 5.4 for two or three years?

Answer. The reason is very simple. We maintain backward and forward compatibility within one major release, and we guarantee that the database structure remains intact. So, if you install 5.4.0, everything within 5.4 (5.4.10, 5.4.2, 5.4.0) remains backward and forward compatible and the database structure remains the same. If we start introducing new features in minor releases, we will have to modify and extend the structure of the database, then minor versions of a major release will not be compatible anymore. I don’t think it is a good approach, and you will have no possibility to downgrade if a newer version of Zabbix doesn’t work the way you want. This approach is described in the document release cycle on our website and is has proved its feasibility over time.

We support 5.2 and 5.4 only for several months not to put additional load on our support team. We have two different types of releases — LTS releases with five-year support and non-LTS releases. If we started supporting everything, then at every given moment there will be 10 major Zabbix versions supported by our team. If a customer reports a problem to our support team, we have to fix this problem, for instance, create a patch, follow the QA procedure, test the solution very carefully, etc. Even Microsoft doesn’t maintain 10 major versions. So, we support just a few LTS releases at a time.

Question. Will you continue support of Red Hat 7 or CentOS 7 when Zabbix 6.0 is released? What about RHEL 7?

Answer. We dropped support of CentOS 7 for a good reason. We discovered that in the version of the software we need, some things, for instance, TLS encryption, are outdated in CentOS 7.0. There are also other unsupported dependencies, for example PHP and so on. In addition, we realized that in Zabbix 6.0 we will not support CentOS 7.0 anymore as Zabbix 6.0 will be supported for five years and we just won’t be able to support CentOS 7.0 for extra five years starting from the end of 2021. So, we could drop support of CentOS 7.0 starting from Zabbix 5.2 or keep it supported in Zabbix 5.2 or Zabbix 5.4 and drop it starting from Zabbix 6.0. We decided to drop support of CentOS 7.0 for Zabbix Server, Zabbix Proxy, and Zabbix UI immediately starting from Zabbix 5.2. In addition, we would have to rely on a third party repository to get the particular versions of software dependencies that Zabbix requires.

Zabbix proxy performance tuning and troubleshooting

Post Syndicated from Arturs Lontons original https://blog.zabbix.com/zabbix-proxy-performance-tuning-and-troubleshooting/14013/

Most Zabbix users use proxies, and those running medium to large instances might have encountered some performance issues. From this post and the video, you will learn more about the most common troubleshooting steps to resolve any proxy issues and to detect them as sometimes you might be unaware of an ongoing issue, as well as basic performance tuning to prevent such issues in the future.

Contents

I. Zabbix proxy (1:36)
II. Proxy performance issues (5:35)
III. Selecting and tuning the DB backend (13:27)
VI. General performance tuning (16:59)
V. Proxy network connectivity troubleshooting (20:43)

Zabbix proxy

Zabbix proxy can be deployed and most of the time is used to monitor distributed IT infrastructures, for instance, on a remote location to prevent data loss in case of network outages as the proxy collects the data locally and it is then pushed/pulled to/from Zabbix server.

Zabbix proxy supports active and passive modes, so we can push the data to the Zabbix server or have the Zabbix server pull the data from the proxy. Even if we don’t have any remote locations and have a single data center, it is still a good practice to delegate most of your data collection to a proxy running next to your server, especially in medium-sized and large instances. This allows for offloading our data collection and preprocessing performance overhead from the server to the proxy.

Active vs. passive

Whether an active or a passive mode is better for your company at the end of the day will depend on your security policies. We can use passive mode with the server pulling the data from the proxy or active mode with the proxy establishing the connection to the Zabbix server and pushing the data.

  • Active mode is the default configuration parameter as it is a bit more simple to configure — almost all of the configuration can be done only on the proxy side. Then, we need to add the proxy on the frontend and we’re good to go.
### Option: ProxyMode
#   Proxy operating mode.
#   0 - proxy in the active mode
#   1 - proxy in the passive mode
#
# Mandatory: no
# Default:
# ProxyMode=0
  • In the case of a passive proxy, we have to make some changes in the Zabbix server configuration file, which would involve a restart of the Zabbix server and, as a consequence, downtime.

Finally, it is all going to boil down to our networking team and the network and security policies, for instance, allowing for passive or active mode only. If both modes are supported, then the active mode is a bit more elegant.

Proxy versions

Another common question is about the proxy version to install and the database backend to use.

  • The main point here is that the major proxy version  should match the major version of the Zabbix server, while minor versions can differ. For instance, Proxy 5.0.4 can be used with Server 5.0.3 and Web 5.0.9 (in this example, the first and the second number should match). Otherwise, the proxy won’t be able to send the data to the server and you will see some error messages in your log files about version mismatch and data formatting not fitting your server requirements.
  • Proxies support: SQLite / MySQL/ PostgreSQL/ Oracle backends. To install the proxy, we need to select the proper package for either SQLite3, MySQL, PostgreSQL, or just compile proxy with Oracle database backend support.

— SQLite proxy package:

# yum install zabbix-proxy-sqlite3

— MySQL proxy package:

# yum install zabbix-proxy-mysql

— PostgreSQL proxy package:

# yum install zabbix-proxy-pgsql

For instance, if we do # yum install zabbix-proxy-sqlite3 or copy and paste the instructions from the Zabbix website for SQLite, we will later wonder why it is not working for MySQL as there are some unique dependencies for each of these packages.

NOTE. Don’t forget to select the proper package in relation to the proxy DB backend

Proxy performance issues

After we have installed everything and covered the basics of what needs to be done and how to set things up, we can start tuning or proxy and try to detect any potential  performance issues.

Detecting proxy performance issues

How can we find out what the root cause of performance issues is or if we are having them at all?

  1. First, we need to make sure that we are actually monitoring our proxy. So, we need to:
  • Create a host in Zabbix,
  • Assign this host to be monitored by the proxy. If the host is monitored by the server, it will report the wrong metrics — the Zabbix server metrics, not the Zabbix proxy metrics.

So, we need to create a host and configure it to be monitored by the proxy itself. Then we can use an out-of-the-box proxy monitoring template — Template Apps Zabbix Proxy.

Template App Zabbix Proxy

NOTE. Template Apps Zabbix Proxy gets updated on the git.zabbix page, when we add new components to Zabbix, new internal processes, new gathering processes, and so on, to support these new components.

If you are running an older version of Zabbix, for example, all the way back from version 2.0, make sure that you download the newer template from our git page not to stay in the blind about the newer internal component performance.

Once we have applied the template, we will see performance graphs with information about gathering processes, internal processes, cache usage, and proxy performance, and both the queue and the new values received per second. So, we can actually react to predefined triggers provided by the template, if there is an issue.

Performance graphs

  1. Then, we need to have a look at the administration queue. A large or growing proxy-specific queue can be a sign of performance issues or a misconfiguration. We might have failed to allow our agents to communicate with our proxies or we might have some network issue on our proxy preventing us from collecting data from the proxy.

An issue on the proxy

In this case:

  • Check the proxy status, graphs, and log files. In the example above, the proxy has been down for over a year, so it should be decommissioned and removed from the Zabbix environment.
  • Check the agent logs for issues related to connecting to the proxy. For instance, the proxy might be trying to pull the data but have no rights to do so due to no permissions in the agent configuration file.

Lack of server resources

In some cases, we might simply try to monitor way too much on a really small server, for instance, an older version of a Raspberry Pi device. So, we should use tools such as sar or top to identify resource bottlenecks on the proxy server  coming, for example, from the storage performance.

sar -wdp 3 5 > disk.perf.txt

sar is a part of a sysstat package, and this command can provide us with information about our storage performance, serialization, wait times, queues, input/output operations per second, and so on. sar can tell us when something might be overloaded especially if we have longer wait times.

NOTE. Don’t get confused by high %util, which is relevant on hard drives, but on an SSD or a RAID setup the utilization is normally very high. While hard drives can handle only one operation at a time, SSD disks or RAID setups support parallel operations. This can cause SSD or RAID util% to skyrocket, which might not necessarily be a sign of an issue.

Proxy queue

Another useful, though a bit hackish, indicator of the proxy performance is the proxy queue on the proxy database — the count of the metrics pending but not yet sent to the server.

  • We can observe this in real-time by queueing the proxy DB.
  • A constantly growing number means that we cannot catch up with our backlog — the network is down or there are some performance issues on the server or the proxy, so more data is getting backlogged than sent.
  • The list of unsent metrics is stored in proxy_history table.
  • The last sent metric is marked in the IDs table.
select count(*) from proxy_history where id>(select nextid from ids where
table_name="proxy_history");

This value will keep growing if the proxy is unable to send the data at all or due to performance issues. If the network is down, this is to be expected between the proxy and the server. However, if everything is working but the count still keeps growing, we need to investigate for any spamming items, thousands of log lines coming per second, or other performance issues with our storage and/or our database. There might be performance problems on the server due to the server being unable to ingest all of this data in time after a restart, a long downtime, etc. Such a problem should get resolved over time on its own. Otherwise, if there are no significant factors regarding the performance or any recent changes, we need to investigate deeper.

If this value is steadily decreasing, the proxy is actually catching up with the backlog and the incoming data, and is sending data to the server faster than it is collecting new metrics. So, this backlog will get resolved over time.

Configuration frequency

Don’t forget about the configuration frequency. Any configuration changes will be applied on the proxy after ConfigFrequency interval. By default, these changes get applied once an hour, so ConfigFrequency is 3600.

### Option: ConfigFrequency
#   How often proxy retrieves configuration data from Zabbix Server in seconds.
#   For a proxy in the passive mode this parameter will be ignored.
#
# Mandatory: no
# Range: 1-3600*24*7
# Default:
# ConfigFrequency=3600

On active proxies, we can force configuration cache reload by executing config_cache_reload for Zabbix proxy.

#zabbix_proxy -R config_cache_reload
#zabbix_proxy [1972]: command sent successfully

This is another good reason to use active proxies to pick up all of the configuration changes from the server. However, on passive proxies, the only thing we can do is a proxy restart to force a reload of the configuration changes, which is not a good idea. Otherwise, we have to wait for an hour or some other configuration interval until the changes are picked up by the proxy.

Selecting and tuning the DB backend

The next important step is a selection of the database.

SQLite

A common question, which has no clear answer is when to use SQLite and when should we switch to a more robust DB backend.

  • SQLite is perfect for small instances as it supports embedded hardware. So, if I were to run a proxy on Raspberry or an older desktop machine, I might use SQLite. Even embedded hardware aside, on smaller instances with fewer than 1,000 new values per second, SQLite backend should feel quite comfortable, though a lot will depend on the underlying hardware.
### Option: ConfigFrequency
#   How often proxy retrieves configuration data from Zabbix Server in seconds.
#   For a proxy in the passive mode this parameter will be ignored.
#
# Mandatory: no
# Range: 1-3600*24*7
# Default:
# ConfigFrequency=3600
  • So, in most cases, when proxies collect less than 1,000 NVPS per second, SQLite proxy DB backends are sufficient. With SQLite, you don’t need to additionally configure the database.
#zabbix_proxy -R config_cache_reload
#zabbix_proxy [1972]: command sent successfully
  • With SQLite, there’s no need to have additional database configuration, preparation, or tuning. In the proxy configuration file, we just point at the location of the SQLite file.
  • A single file is created at the proxy startup, which can be deleted if data cleanup is necessary.
### Option: DBName
#   Database name.
#   For SQLite3 path to database file must be provided. DBUser and DBPassword are ignored.
#   Warning: do not attempt to use the same database Zabbix server is using.
#
# Mandatory: yes
# Default:
# DBName=
DBName=/tmp/zabbix_proxy

All in all the SQLite backend comparatively easy to manage However, it comes with a set of negatives. If we need something more robust that we can tune and tweak, then SQLite won’t do. Essentially, if we reach over 1,000 new values per second, I would consider deploying something more robust — MySQL, PostgreSQL, or Oracle.

Other proxy DB backends

  • Any of the supported DB backends can be used for a proxy. In addition, the Zabbix server and Zabbix proxy can use different DB backends. The DB configuration parameters are very similar in Zabbix server and Zabbix proxy configuration files, so users should feel right at home with configuring the proxy DB backend.
  • DB and DB user should be created beforehand with the proper collation and permissions.
shell> mysql -uroot -p<password>
mysql> create database zabbix_proxy character set utf8 collate utf8_bin; 
mysql> create user 'zabbix'@'localhost' identified by '<password>'; 
mysql> grant all privileges on zabbix_proxy.* to 'zabbix'@'localhost'; 
mysql> quit;
  • DB schema import is also a prerequisite. The command for proxy schema import is very similar to the server import.
zcat /usr/share/doc/zabbix-proxy-mysql*/schema.sql.gz | mysql -uzabbix -p zabbix_proxy

DB Tuning

  • Make sure to use the DB backend you are most familiar with.
  • The same tuning rules apply to the Zabbix proxy DB as to the Zabbix server DB.
  • Default configuration parameters of the backend will depend on the version of the backend used. For instance, different MySQL versions will have different default parameters, so we need to have a look at MySQL documentation, the default parameters, and the way to tune them.
  • For PostgreSQL, it is possible to use the online tuner — PGTune. Though it is not an ideal instrument, it is a good starting point not to leave the proxy hanging without any tuning as we might encounter issues sooner rather than later. With tuning, the database will be more robust and will last longer before we will have to add any resources and rescale the database config.

PGTune

General performance tuning

Proxy configuration tuning

Database aside, how we can tune the proxy itself?

Proxy configuration is similar to the configuration of the Zabbix server: we still need to take into account and tune our gathering processes, internal processes, such as preprocessors, and our cache sizes. So, we need to have a look at our gathering graphs, internal process graphs, and our cache graphs to see how busy the processes and how full the graphs are and adjust accordingly. This is a lot easier to do on the proxy than on the server since proxy restart is usually quicker and a lot less critical, and less impactful than the server downtime.

In addition, these will differ on each of the proxy servers depending on the proxy size and types of items. For instance, if on proxy A we are capturing SNMP traps, we need to enable the SNMP trapper process and configure our trap handler — Perl, snmptrapd, etc.  If we are doing a lot of ICMP pings for another proxy, we’ll require many ICMP pingers. A really large proxy will need to have its History Syncers increased. So, each proxy will be different, and there is no one-fit-all configuration.

  • Since most of the time proxies handle fewer values since they are distributed and scaled out, we will have a lesser number of History Syncers on proxies in comparison with Zabbix server. In the vast majority of cases, the default number of History Syncers is more than sufficient. Though sometimes we might need to change the count of History Syncers on the proxy.
### Option: StartDBSyncers
#             Number of pre-forked instances of DB Syncers.
#
# Mandatory: no
# Range: 1-100
# Default:
# StartDBSyncers=4

There are always exceptions to the rule. For instance, we might want to have a single large-scale and robust proxy collecting the data from some very critical or very large location with many data points – such an infrastructure layout will still be supported.

  • If DB syncers do underperform on a seemingly small instance, chances are it is due to lack of hardware resources or, for SQLite, DB backend limitations

We need to monitor the resource usage via sar, or top, or any other tool to make sure that hardware resources aren’t overloaded.

Proxy data buffers

We also have the option to store the data on our proxies if the server is offline or store them even if the Zabbix server is reachable and the data has been sent to the server. we may want to keep our data in the proxy database and utilize it by other third-party tools or integrations.

On our proxies, we have a local buffer and an offline buffer, which determine for how long we can store the data. The size of Local and Offline buffers will affect the size and the performance of your database. The larger the time window for which we store the data, the larger the database is. So, the fewer resources we utilize, the better the performance is, the easier it is to scale up, etc.

  • Local buffer
### Option: ProxyLocalBuffer
#   Proxy will keep data locally for N hours, even if the data have already been synced with the server.
#
# Mandatory: no
# Range: 0-720
# Default:
# ProxyLocalBuffer=0
  • Offline buffer
### Option: ProxyOfflineBuffer
#   Proxy will keep data for N hours in case if no connectivity with Zabbix Server.
#   Older data will be lost.
#
# Mandatory: no
# Range: 1-720
# Default:
# ProxyOfflineBuffer=1

Proxy network connectivity troubleshooting

Detecting network issues

Sometimes we have network issues between proxies and the server: either the server cannot talk to proxies or proxies cannot talk to the server.

  • A good first step would be to test telnet connectivity to/from a proxy.
time telnet 192.168.1.101 10051
  • Another great method is to time your pings to see how long pinging takes or how long it takes to establish a telnet connection. This could point you towards network latency issues: slow networks, network outages, and so on.
  • Log file can help you figure out proxy connectivity issues.
125209:20210214:073505.803 cannot send proxy data to server at "192.168.1.101": ZBX_TCP_WRITE() timed out
  • Load balancers, Traffic inspectors, and other IDS/Firewall tools can hinder proxy traffic. Sometimes it can take hours troubleshooting an issue to find out that it boils down to a load balancer, a traffic inspector, or IDS/firewall tool.

Troubleshooting network issues

  • A great way to troubleshoot this would be to deploy a test proxy with a different firewall/load balancing configuration. From time to time, network connectivity drops seemingly for no reason. We can bring up another proxy with no load balancers or no traffic inspectors, and ideally, in the same network as the problematic proxies. We need to find out if the new proxy is experiencing the same problems, or if the issue is resolved after we remove the load balancers, IDS/firewall tools. If the problem gets resolved, then this might be a case of misconfigured firewall/IDS.
  • Another great approach of detecting networking issues due to transport problems, for instance, IDS/Firewalls cutting up our packets, is to perform a tcpdump on proxy and server to correlate network traffic with error messages in the log.

tcpdump on the proxy:

tcpdump -ni any host -w /tmp/proxytoserver

tcpdump on the server:

tcpdump -ni any host -w /tmp/servertoproxy

— Correlating retransmissions with errors in logs could signify a network issue.

Many retransmissions may be a sign of network issues. If there are a few of them, if we open Wireshark to find just a couple of retransmits, it might not be the root cause. However, if the majority of our packet capture result is read with duplicate packets, retransmits, acknowledges without data packets being received, etc., that can be a sign of an ongoing network issue.

Ideally, we could take a look at this packet capture and correlate it with our proxy log file to figure out if these error messages in our proxy logfile or server logfile (depending on the type of communication — active or passive) correlate with packet capture issues. If so, we can be quite sure that the networking issue is at fault and then we need to figure out what is causing it — IDS, load balancers, a shoddy network, or anything else.

Out-of-the-box database monitoring

Post Syndicated from Renats Valiahmetovs original https://blog.zabbix.com/out-of-the-box-database-monitoring/13957/

From this post and the video, you’ll learn about the possibilities of database monitoring using out-of-the-box Zabbix functionality without having to install additional tools, additional applications, or additional software that might not be allowed by your company.

Contents

I. Classic ODBC monitoring (0:22)

II. Synthetic MySQL monitoring (11:13)
III. DB monitoring with Zabbix Agent 2 (13:48)

IV. LLD for DB monitoring (17:03)

V. Questions & Answers (21:09)

Classic ODBC monitoring

What is ODBC?

ODBC stands for open database connectivity. There are a couple of ODBC drivers available for different database management systems (DBMS):

    • Oracle,
    • PostgreSQL,
    • MySQL,
    • Microsoft SQL Server,
    • Sybase ASE,
    • SAP HANA,
    • DB2.

All of these databases have different ODBCs specifically tailored for them. They offer slightly different functionality. So, even if you have set up the database monitoring for one database it might not necessarily work just as good for the other, as the functionality used to monitor one database might not exist for the other. In addition, as different technologies have different capabilities, most ODBC drivers do not implement all functionality defined in the ODBC standard.

What to monitor?

When we are planning to use ODBC for monitoring, what kind of data we can expect to receive? The answer ultimately depends on your own preferences, needs, or your proficiency in a specific database. You can monitor any possible database performance metrics and incidents using Zabbix templates.

Generally, monitoring of the following areas is of interest:

    • database performance
    • engine availability
    • configuration changes that you need to be aware of

To make the process easier, we provide ready-to-use templates, which can be applied to a host where your database is deployed. You can browse a full list of available metrics in these templates’ descriptions. So, you don’t have to perform configuration completely from scratch, which is good news.

How does it work?

Without diving too deep into the transport layer and all of the technical details, the ODBC driver accesses the database over the network using the database API. So, there is no direct connection between Zabbix and the database. Zabbix only creates a query passed to the ODBC manager for processing, which then moves the request over to the ODBC driver that connects to the database management system and then executes the query. Here, Zabbix does not limit the query execution timeout, and the timeout parameter is used as the ODBC login timeout.

Chain of processes

ODBC configuration is based on two files:

  • odbc.ini — holds a list of installed ODBC database drivers, which are used for specific communication.
  • odbcinst.ini — holds the definitions of data sources so that we know to which database we are going to connect.

Where to start?

What do we need to do in order to start using this ODBC monitoring approach?

  1. First, we will need to install the ODBC driver relevant to the database we are going to monitor. A simple yum command will suffice if we’re working with CentOS.
# yum -y install unixODBC unixODBC-devel
  1. Then we need to specify the package (driver) we want to install and modify the ODBC driver files.
  • odbc.ini:
[root@localhost ~]# cat /etc/odbc.ini
[MySQL]
Description=NewDatabase
Driver=MariaDB
Server=localhost
User=root
Password=VerySecurePassword
Port=3306
Database=DatabaseName
  • odbcinst.ini:
[root@localhost ~]# cat /etc/odbcinst.ini
[MySQL]
Description=ODBC for MySQL
Driver=/usr/lib/libmyodbc5.so
Setup=/usr/lib/libodbcmyS.so
Driver64=/usr/lib64/libmyodbc8a.so
Setup64=/usr/lib64/libmyodbc8a.so
FileUsage=1

Then we need to populate them with the necessary information. So, in this case, DSN (data source name) is used to call a specific connection. We need to get this part correctly, otherwise, the connection will not work out, for instance, in case of a typo.

  1. After we have installed the ODBC driver and configured the configuration files, we don’t really need to go ahead into Zabbix to create a new item and see if it works. We can test the ODBC configuration using isql to connect or at least attempt to connect to a particular database using the specified configuration.

Using isql to test ODBC configuration

If we receive an output that you have been connected then the communication is correct. You can also execute a sort of query, for instance, select some information from the database. If you get the result, then you do have the necessary permissions to access that data, and the connection, that is the ODBC driver, is working fine. Then you can proceed to the frontend.

  1. In the frontend, we will need to create an item of the ‘Database monitor’ type on a particular host or a template and specify one of the two keys available for ODBC monitoring: db.odbc.select or db.odbc.get.

Creating ‘Database monitor’ item

The difference between these item keys is pretty simple — select will return only one value and get will return values in bulk. So, get is more efficient and allows for reducing the load on the database if we are working with a lot of data. Within the key parameters, we need to specify the same DSN that we have defined in our odbc.ini file.

We need to make sure that the first parameter is unique so that this particular item key is unique and does not duplicate anything else, and the second parameter is the DSN.

  1. After we have specified everything, we specify the query, which is a part of the item configuration.
  2. We test the item using the test form in the Zabbix frontend. If the test form returns a value or does not return an error message, then everything is fine and we can proceed with this item or create more items.

Testing the item

ODBC templates

  1. There are a couple of built-in templates. If the metrics obtained through these templates are sufficient, we obviously don’t need to create these items from scratch or configure them. We can simply assign the templates we need to the host, on which we are monitoring the database. All we need to do is to tweak a little, if necessary, modify the macro related to the DSN, and then start monitoring.

Assigning a template

NOTE. The easiest way to get the templates is to upgrade to the latest Zabbix with our official templates already built in. If you don’t have the needed templates for any reason, you can download them from Zabbix official repository or Zabbix integrations. If you still need a specific template, you can definitely check out the community-created templates.

  1. Finally, we can execute discovery rules:

and check the Latest data:

Synthetic MySQL monitoring

Synthetic MySQL monitoring approach is using capabilities of the Zabbix Agent. Though that is not something that Zabbix Agent is doing out of the box, still we don’t need to install anything or perform some super difficult manipulations to make it work as it is a part of Zabbix functionality.

As you might already know, the Zabbix Agent functionality can be extended using custom UserParameters and then used for database monitoring.

  1. So, we can create new UserParameters, which invoke native MySQL administration client commands providing output, which can then be used to calculate performance metrics.
UserParameter=mysql.ping[*], mysqladmin -h"$1" -P"$2" ping
UserParameter=mysql.get_status_variables[*], mysql -h"$1" -P"$2" -sNX -e "show
global status"
UserParameter=mysql.version[*], mysqladmin -s -h"$1" -P"$2" version
UserParameter=mysql.db.discovery[*], mysql -h"$1" -P"$2" -sN -e "show
databases"
  1. It is a good practice to test the commands themselves to make sure that they work and to test the UserParameter keys, for instance using the zabbix_get utility.
  2. Then you might want to use our official MySQL monitoring template by creating an additional file .my.cnf under /var/lib/zabbix (default location) as follows:
[client] 
user='zbx_monitor' 
password='<password>'
  1. Then we need to provide credentials for the user to confirm that the user has the necessary permissions to access the database.
  2. If everything is working, assign MySQL by Zabbix agent template.

In this case, we are not actually logging in to the database. We execute commands from the terminal by using Zabbix Agent and extending the functionality beyond the built-in functions.

DB monitoring with Zabbix Agent 2

Why Zabbix Agent 2?

What are the benefits of Zabbix Agent 2 in relation to database monitoring?

  • Zabbix Agent 2 is the improved version of our original Zabbix Agent, which is now written in Go.
  • Zabbix Agent 2 is more efficient and supports some new functions that Zabbix Agent 1 does not, for instance, custom intervals with active checks as Zabbix Agent 2 is using the Scheduler plugin and is capable of keeping track of time when certain checks need to be executed;
  • Older configuration is also supported. So, if we switch from Zabbix Agent 1 to Zabbix Agent 2, we do not need to rewrite the whole configuration file in order for Zabbix Agent 2 to work.
  • Zabbix Agent 2 is installed simply with one-line command just like Zabbix Agent 1, we need just to specify a different package.
# yum -y install zabbix-agent2
  • Zabbix Agent 2 is based on plugins, so you do not need to install it with ODBC drivers, as plugins do the work, or anything extra as Zabbix Agent 2 has out-of-the-box database-specific plugins to monitor your database, including MySQL, Oracle, and PostgreSQL.
  • Plugins are also written in Go.
  • We have created Zabbix Agent 2-specific templates, which we can assign to the host. So, if you decide to use Zabbix Agent 2, you need to perform even fewer manipulations in order to get your database monitored by Zabbix.

Built-in Zabbix Agent 2 templates

Configuration

The configuration is very simple. We need to decide whether we specify the necessary parameters within the item keys or, if we prefer named sessions, we edit the configuration file of Zabbix Agent 2 to define those and use the session name as the first parameter of the key.

  1. So, we specify the key according to the documentation page. In the first case, we can specify essentially the location of our database and provide the credentials.

In the second case, we simply need to provide the DSN in order to connect to the database using Zabbix Agent 2 built-in plugins.

Plugins.Mysql.Sessions.Prod.Uri=tcp://192.168.1.1:3306

Plugins.Mysql.Sessions.Prod.User=<UserForProd>

Plugins.Mysql.Sessions.Prod.Password=<PasswordForProd>
  1. After we have created these items or applied a template, we can definitely test them out and see whether they are working fine.

NOTE. Check available MySQL-related item keys documentation page.

LLD for DB monitoring

Why LLD?

Finally, you can definitely use low-level discovery for database monitoring. LLD is a very efficient and powerful tool within Zabbix. You can definitely use either built-in discovery keys, which utilize Zabbix Agent, or other sources such as custom scripts to pass the payload to your low-level discovery rule.

LLD:

    • Automatically creates items, triggers, and graphs from different entities on a host.
    • Parses data received in Zabbix-specific JSON format.
    • Different sources for LLD can be used, such as:
      • Built-in discovery keys,
      • Dependent on a built-in item key,
      • Dependent on a custom script/custom UserParameter.

Here we have a script providing our JSON-formatted payload, which is sent by the Data sender Zabbix utility to the Master trapper item within our Zabbix instance, while our LLD rule depends on this particular Master trapper item.

So, we just populate this trapper item with the JSON payload, LLD rule creates new entities based on the prototypes, and then the items created by those prototypes are collecting the data from that master trapper item each time a new payload comes in.

How to configure custom LLD?

In general, to create LLD from scratch:

  1. First, you will need to decide on the actual payload delivery method (Zabbix Agent, script, Zabbix sender, or UserParameter).
  2. Make sure that your payload is in JSON that is structurally sound so that Zabbix can accept and parse it.
[{"{#DATABASE}":"information_schema"},{"{#DATABASE}":"mysql"},{"{#DATABASE}":"p erformance_schema"},{"{#DATABASE}":"sys"},{"{#DATABASE}":"zabbix"}]
  1. Create LLD rule with type according to delivery method.
  2. Test the rule (if available for passive checks) to see JSON you receive.
  3. Create filters or overrides, if necessary.
  4. Create prototypes, based on which your entities will be created.

If we don’t want to create LLD rules from scratch, we can definitely modify the built-in templates without wasting time creating custom LLD rules:

    • Modify/create new entities;
    • Clone the templates;
    • Refer to templated discovery rule configuration.

Modifying LLD rules of official templates

Questions & Answers

Question. Can we monitor the database using active checks or passive checks?

Answer. As I have mentioned, everything depends on your preferences and, ultimately, on the way you want to pass this output to Zabbix Server. If we’re talking about active checks, you can utilize Zabbix sender, for instance. So, it will be a trapper item on the Zabbix Server side waiting for data. In case of passive checks, we can use Zabbix Agent. So, we can use both types of checks for database monitoring.

Question. Can we establish a secure connection between the ODBC gateway and the database, which is somewhere on a distant machine?

Answer. Yes, this can be done though it does require a little bit of finesse. It is an extensive topic, and the security of the connection is highly dependent on the driver, which should support a secure connection. Some older databases might not have this functionality.

Question. Are ODBC checks influencing the performance of the master server?

Answer. It depends on what kind of data you are collecting. If you have a lot of items utilizing db.odbc.get item key, which retrieves just one value from the database, this might impact your database performance. You might not notice this impact if your hardware is powerful enough. However, it is advisable to use the odbc.select key in order to collect this information in bulk. Otherwise, you might be locking up some entries within your database that could potentially lead to problems.

Question. So, we provide two solutions with one of them using ODBC agentless checks ODBC. In addition, we have the agent tool. Will you briefly describe the advantages of ODBC and Agent checks?

Answer. If we’re talking about the ODBC database monitoring method, the most obvious difference is that you don’t need to install an agent. From the data collection perspective, there is not much difference. Everything depends on your specific needs.


Zabbix professional services

Post Syndicated from Maria Truskovskaya original https://blog.zabbix.com/zabbix-professional-services/13865/

Zabbix offers professional services that can be booked directly with the Zabbix team, so that you can receive assistance at any stage of your Zabbix journey.

Contents

I. Zabbix journey (0:22)
II. Zabbix professional services (4:12)

  1. Technical support (4:34)
  2. Training (7:03)
  3. Turnkey solutions (9:01)
  4. Consultancy (9:43)

III. Conclusion (10:30)
IV. Questions & Answers (11:03)

Zabbix journey

The Zabbix project started in 1998, and the actual company was established in 2005 with headquarters in Riga, Latvia. Over the years we have expanded quite significantly and now we have offices in different corners of the world, such as Tokyo, New York, Moscow, and Porto Alegre in Brazil, which was added to the Zabbix universe in 2020.

Zabbix offices

Over the past 10 years we have reached 50% year-on-year growth, and we are trying to improve even further on a day-to-day basis.

Currently Zabbix is a team of more than 80 professionals — developers, QA specialists, technical support engineers, certified trainers, sales, partner and marketing managers, and many more. We are all working together as one big team making sure that Zabbix is the best monitoring tool in the market.

Why monitor?

We all know how important monitoring can be. According to Gartner, 98 percent of all companies have confirmed that they have experienced downtime. The average cost of IT downtime is $5,600 per minute, which is quite a lot. Modern businesses cannot afford for it to happen and want to react to disasters quicker and be more proactive.

That is where Zabbix comes in to help you minimize risks, save money, and make sure that your services are continuously up and running.

Competitive advantage

How does Zabbix stand out from the competition?

  • We are fully open source (GPLv2), so you will need zero investment (TCO) to start using Zabbix. We don’t hide features behind corporate or enterprise versions, and everything available in the tool is available for free.
  • Zabbix is easily scalable and customizable, so customers can integrate it with various systems and get a comfortable single-pane-of-glass view of their infrastructure.
  • Finally, Zabbix as a software tool is backed by a wide range of professional services, be it Zabbix deployment, support, troubleshooting, training, upgrade and so on.

Zabbix is widely used by global brands, including companies from the Fortune 500 List.

We always encourage our customers to leave their feedback using our community resources and channels, as we value their opinion and always use it as a way to improve.

Zabbix partner network

We are partners with more than 160 IT companies worldwide.

Zabbix partner network

Our partner program was designed to advertise Zabbix services locally. Our partners can expand their portfolio, receive margin for selling Zabbix services and discounts for internal use.

We have introduced several partner tiers, so you can choose the one that fits your business model best of all. You can be a Reseller and sell Zabbix services or become a Certified Partner and actually provide those services to your clients. A distinctive status — Zabbix Premium Partner — is assigned to partners that have met a special benchmark in our cooperation.

NOTE. If you would like to join our partner program, feel free to contact our team.

Zabbix professional services

So how exactly can Zabbix help you? Our professional services team can guide you through every stage of your Zabbix journey, from deployment and configuration to troubleshooting and technical support, including training courses for your staff, to make sure that your business can respond to your monitoring needs.

Zabbix professional services

Technical support

Technical support is our most popular service, and its high demand can be explained by a wide range of benefits it offers.

With your individual login to the Zabbix support system you can open tickets at any time within your support level and receive hands-on assistance directly from the Zabbix engineers. We also provide a guaranteed response time, meaning you can always rely on us.

Currently we have five technical support levels available. You can choose any level based on how critical your monitored workloads are.

Zabbix partner tiers

For instance, support can be available during business hours only or it can be 24/7, so that you can open tickets at any time, including holidays and weekends.

An important thing here is that we offer a simple and transparent pricing model per Zabbix server and proxy, but the number of devices you can monitor always stays unlimited. It doesn’t matter how many switches, routers or servers you monitor – all devices are already covered, as the price depends solely on the number of Zabbix servers and proxies in your infrastructure.

More and more customers realize a great value of our Enterprise tier, as it covers an unlimited number of Zabbix servers and proxies. For example, one of our client’s infrastructure grew to over 2,000 proxies, which was still covered by one Enterprise contract. The Global 1 tier is ideal for big international corporations with multiple branch offices that would like to benefit from our support services. Overall, if you already have a large Zabbix infrastructure and are planning to expand even more, these two support tiers are a perfect solution.

NOTE. For more details on any particular tier or for an actual quote from Zabbix, feel free to contact the Zabbix sales team and we will be happy to help you.

Training

Currently our training courses are delivered online, and you can attend them from the comfort of your own home or office. We offer two training options:

  • public training where various companies are present; or
  • private sessions just for your team.

Core training courses

There are four certification levels available:

Certification training courses

  • You can start with Zabbix Certified User — a one-day overview of the system — an ideal way to get familiar with the Zabbix Frontend, its menu and main features;
  • Zabbix Certified Specialist and Zabbix Certified Professional courses are more technically advanced and cover the actual process of the software installation and configuration, including the use of Zabbix in distributed environments. These courses may be beneficial, if you are dealing with Zabbix on a daily basis and are tasked with the deployment of the product.
  • Zabbix Certified Expert is a course for those striving for a real challenge. This training is designed for experienced Zabbix professionals and teaches you how to build highly efficient and loaded setups with Zabbix.

Extra training courses

Recently we have enriched our training program with four one-day extra courses. Technically, each one of them represents a deep dive into a specific topic.

Extra training courses

NOTE. For a schedule of Zabbix certification and extra courses, please visit our website, select the course you need, and book a date that suits you. Our sales team will get back to you and provide all the necessary details.

Turn-Key solutions

If you need our help with the actual installation and configuration of Zabbix, for instance, after you complete your POC, we encourage you to take a look at out Turn-Key Solution service. It covers the Zabbix deployment from scratch, as well as migration from a legacy tool. This service has a fixed daily rate of €1,250/$1,500, but the total cost is calculated based on the complexity and size of your environment, as well as any additional requirements you might have, such as specific templates, integrations with third-party tools or an HA setup.

Consultancy

If you already have Zabbix up and running, but you need professional advice from our engineers, our consulting services are a really good option.

We offer professional assistance on any Zabbix-related topic, including Q&A sessions with the Zabbix engineers, performance tuning, environment review, or discussions about our best practices – everything to keep your Zabbix installation healthy.

Consulting services are available as packages of 10, 20, 40, 80 or more hours. The minimum purchase is 10 hours.

NOTE. If you need an official quote for this service, feel free to contact us at [email protected].

Conclusion

Should you choose our professional services, the benefits you receive are:

  • A perfectly tuned and deployed Zabbix system and our best practices;
  • Strategic advice directly from the Zabbix engineers;
  • Full and thorough explanation of the problem and its resolution; and
  • Full documentation package, so you can have it at hand and get back to it when you need to.

Questions & Answers

Question. So, you assert that technical support is the most requested professional service?

Answer. That is correct. We see more and more clients requesting a quote for technical support or some additional details to compare different technical support levels. This service gives our customers peace of mind, as they can always contact our engineers and receive the necessary assistance and guidance. Our clients can choose support during business days and business hours within their time zone in Silver and Gold levels, or 24/7 technical support starting from the Platinum level.

Question. If a customer decides to buy 10 hours of consulting services to fix a certain performance problem, but it takes, for instance, five hours, what happens to the remaining five hours?

Answer. These hours don’t expire or get lost. If a customer purchases a certain number of hours and we only use some of them to fix a specific issue (that has been discussed and agreed on), the remaining hours are still assigned to the client’s account and сan be used later for any other tasks, such as troubleshooting, tuning, environment review, additional template creation etc. 


Managing complexity in Zabbix installations with Splunk

Post Syndicated from Christian Anton original https://blog.zabbix.com/managing-complexity-in-zabbix-installations-with-splunk/13053/

A big data analytics engine can be used to optimize large and complex Zabbix installations: keeping track of the amount and kind of problems over time, top alert producers, and much more. You can employ Splunk to optimize and analyze vital Zabbix runtime parameters, such as ‘unsupported items,’ repeatedly happening host availability issues, misconfigured agents, and Zabbix Queue entries.

Contents

I. Complexity (1:15)
II. Zabbix entity inventory (8:28)
III. Use cases (15:16)
IV. Conclusion (20:09)
V. Questions & Answers (21:41)

secadm GmbH is a service provider located in the south of Germany. The company with a strong background in monitoring and automation, network infrastructure, and security software development supports customers of all sizes to manage their IT infrastructures. secadm GmbH is a Zabbix partner and also a Zabbix training partner.

Complexity

Operating a Zabbix deployment of a specific size comes with some challenges:

  • A huge number of hosts, templates, items, host groups, macros, and configuration elements inside your Zabbix instance.
  • LLD rules/unsupported items — items that are unable to fetch information, for example, a wrong password or a wrong path, in an external check. It is often hard to get a hold of how many of those you have and in which of the various error states. Therefore, it’s also difficult to fix them.
  • Host availability/network issues — errors that you see only in the logs — things going up and down, losing their connectivity, but getting back in time before issuing an alert.
  • Queue entries. In larger Zabbix installations, you might have ten thousand or even more items in this service queue. Zabbix actually tells you that some items do not receive their data in time. Zabbix shows that something is really wrong, though it doesn’t give a hint about what is wrong.
  • Zabbix as a monitoring tool is there to actually generate problems and alerts out of these problems. Many problems often cause ‘alert fatigue’ when people start ignoring monitoring results because of too many alerts.

Therefore, we receive a lot of questions from our customers, such as:

  • Where do all these problems come from?
  • What are the hosts generating most of the problems, at what times, and generated by what templates?
  • Did the latest change/upgrade have any negative impact on our monitoring?
  • Can you get rid of unsupported items?
  • How many hosts have specific problems (for instance, caused by a known bug in an old version of an agent that behaves strangely with a specific version of the Zabbix server), and what would be the effect if we fixed those problems?
  • Where do all these queue entries come from?

Zabbix is a transparent and predictable monitoring tool that offers great ways to organize the monitored elements with templates and macros. Zabbix also offers excellent visualization capabilities. However, Zabbix is not an analytical utility offering a flexible query language to gather the required information in the required format, having on-demand statistical functions, and allowing you to enrich and correlate data with the data from arbitrary sources. So, extra tools will have to do the extra work.

Secadm GmbH being the partner of Zabbix and Splunk, has concluded that it’s obvious to use Splunk for such extra work. Splunk is offering many possibilities to onboard data in the platform far beyond the simple indexing of log data, looking up the Key-Value store, implementing scripts and programs inside the Splunk platform to fetch data in real-time and on-demand out of other systems without having to store and to index any kind of information, as well as performing custom search commands.

Zabbix entity inventory

The most important Zabbix data used for analysis — the inventory of all elements inside Zabbix that do not often change, such as:

  • Hosts,
  • Items,
  • Proxies,
  • Templates,
  • Triggers,
  • Discovery rules (LLD),
  • Item Prototypes, and
  • Trigger Prototypes.

As this data is not changing constantly, we fetch this data from Splunk with the scheduled search and custom search command directly from the API endpoints in Zabbix. Then we can store this information inside the Splunk KV Store, which is, in fact, the MongoDB allowing us to perform searches in milliseconds without having to index any data and quickly get the results.

Zabbix entity inventory

So, you can get statistics on status and state to drill down on the unsupported items for a list of all of the items. You can further identify the correlation for the hostnames instead of host IDs, which are not human-readable. The hostnames are available at the KV Store, which stores the hosts with their metadata. You can also identify how many unsupported items there are on each host.

You can also get information on the hostnames, hosts, item names, item types, and errors. You can categorize the problems as SNMP problems, shell problems such as wrong paths, and see how often certain problems happen and what hosts are assigned to what templates and host groups, and so on. This information may also be aggregated or correlated with information from UCMDB.

More data

More fun than having data within a data analytics platform has more data.

  • Indexing the Zabbix Server / Proxy Logs logs, categorizing events to identify availability issues, item problems, preprocessing problems, housekeepers statistics, etc.

  • A module to fetch information from Zabbix (item, host, trigger) in real-time.

  • Gathering metrics (History / Trends data) directly from Zabbix in real-time without the need to store these metrics in any place other than the Zabbix database. We can still use the data for graphing, correlations, calculations, etc.

  • Onboarding the Zabbix problems into Splunk by using the new custom Media types — Webhook.

Custom Media type

  • Correlation of the alert logs, which are new and available through the API since Zabbix 5.0.
  • Working on the queue items to solve these questions.

Use cases

Zabbix queue

Zabbix queue may be a real headache as you can wait for a Zabbix installation with 20,000-50,000 items for 5 or 10 minutes or even longer.

In this dashboard, the same view is displayed in Zabbix: items are categorized by overtime, item type, proxy, etc. Splunk here offers what Zabbix fails — the history so that you can see the spikes when things have changed dramatically. For instance, when more significant network changes happen, the network slows down, and the queues grow dramatically. You can see whether these queues have gone back down or remained up. This information is complicated to analyze in Zabbix.

You can also drill down to see the items correlated with their actual status and the host’s status inside Zabbix. So, you can clearly see, for instance, that an item is on the host that is down or in the queue as it’s not supported and doesn’t get any data.

Here, there is also an Ignore list. So you can get statistics for the remaining items and group them, for instance, by Item type. You can go further and analyze and fix the problems.

Zabbix problems analytics

Zabbix problems dashboard

In this dashboard, Zabbix problems are displayed by system categories. For instance, we can see that over the last 24 hours, Windows caused most of the problems.

Here, we can also drill down to see, for instance, if there are many similar problems. You can go further to identify a single issue that has caused many alerts or problems. You can see that one host is creating almost all of the problems. So, if you switch this one host off, you would have fewer problems.

Zabbix data for management visibility

We can use Zabbix data for greater management visibility, such as:

  • Correlation of data to generate meaningful dashboards:

— Zabbix (metrics, status, problems, etc.),
— application logs,
— other data sources,
— inventory (CMDB, …)

  • Business-level visualization.

Conclusion

Splunk is open-source software and is distributed for free. We are currently in the process of integrating Splunk with Zabbix.

If you are interested in Splunk, you can send a request to [email protected]  or look for Christian Anton on LinkedIn or Instagram.

Questions & Answers

Question. If we use this kind of integration, are there any performance issues caused by Splunk or some misconfiguration?

Answer. We have been using Splunk for installations with several tens of thousands of monitored hosts and from hundreds of thousands up to millions of items and have not seen any performance implications.

Question. How does this connector work under the hood? Does it use the API or direct queries to the database?

Answer. We rely on the API. Besides, we can fetch the data directly from the database.


Setting up Zabbix Agent 2 for PostgreSQL monitoring and revealing how it works

Post Syndicated from Daria Vilkova original https://blog.zabbix.com/setting-up-zabbix-agent-2-for-postgresql-monitoring-and-revealing-how-it-works/13208/

This article will recall the most important theses about the plugin for PostgreSQL monitoring for Zabbix Agent 2. Here you’ll find the explanation of how the plugin works under the hood illustrated with a simple example. You will also get familiar with a new mechanism of custom queries that let you collect metrics from separate SQL files on PC.

Contents

I.Zabbix Agent plugin (2:40)

    1. Implementation (3:10)
    2. Basic features (4:24)
    3. How to get a simple metric? (11:07)

II. Custom metrics (14:05)
III. Conclusion (17:58)
IV. Questions & Answers (19:20)


Zabbix Agent plugin

As a rule, Zabbix Agent is installed on the Zabbix Server machine. It gathers data, which is lately collected by the Zabbix Server. The user can have full access to it via the web interface.

Implementation

  • The plugin uses github.com/jackc/pgx — PG driver and toolkit for Go to connect to Postgres. The plugin supports the database/sql interface, which is a universal interface in Golang for SQL-like databases. Connections in the upcoming version of these databases are made via this database/sql interface.
  • The handler is the basic unit of the plugin, and all queries are executed in separate handlers and then sent to the Zabbix Server. We have made an effort to create an efficient connection to, and to optimize operations of the database.
  • Some metrics are generated in JSON and grouped as dependency items and discovery rules.

Basic features

  • Zabbix Agent 2 allows for keeping a permanent connection to the PostgreSQL database. In earlier versions, to connect to PostgreSQL, we had to make psql calls affecting the server load.
  • Zabbix Agent 2 provides for flexible polling intervals, which can be customized in templates.
  • The plugin is compatible with PostgreSQL 10+ and Zabbix Server version 4.4+ and Zabbix Agent.
  • In the latest plugin release, a new feature is introduced to allow for monitoring several PostgreSQL instances by one Agent using sessions.

Plugin connection parameters

There are three levels of the plugin connection parameters:

  • Global (global for all Zabbix Agent plugins).
  • Macros.
  • Sessions.

Macros and Sessions parameters are used to define a connection to the database.

Macros level

Macros should be familiar to all users of the first Zabbix Agent. In the template, we can define macros for the user, database, etc.

Filling in the template

Then we need to fill in the Key definition as a parameter.

Key definition as a parameter

Here, the sequence is important — URI, USER, and PASSWORD. The first two parameters are mandatory. If no password is given, an empty string is used as a password. If there is no database name, the default database name is used — ‘Postgres

NOTE. There may be parameters No. 5, 6, 7, etc., which can be used as parameters for dynamic queries in the handler.

This way to connect to the database is considered as default. In the official template for PostgreSQL monitoring on the Zabbix website, macros and keys are already specified, so the setup can be done in no time.

Sessions level

Each session has its own connection parameters. So, by creating multiple sessions, we can create multiple connections to several databases.

Sessions are defined in the Zabbix Agent configuration file — zabbix_agent2.conf.

Defining four parameters for session ‘Test’

  • To define the session ‘Test’, in the configuration file, you need to go to:
# Plugins.Postgres.Sessions.
  • Then, you fill in the name of the session:
# Plugins.Postgres.Sessions.Test.Uri=tcp://localhost:5432
  • Then, you do the same for the other three parameters and define macros for the session in the template:

Defining connection parameters and the name of the session in {$PG.SESSION}.

  • You need to fill in the session Name as the only parameter for the Key:

Now the agent will automatically pick up the connection parameters for this session name from the configuration file and start running.

Metrics monitored by the plugin

In the upcoming release, the plugin will be able to gather more than 98 metrics covering almost all the important parameters in the database, including:

  • number of connections,
  • database size,
  • info about archive files,
  • number of ‘bloating’ tables,
  • replication status,
  • background writer processes activity, etc.

Some of these metrics are not very informative without the operating system parameters. However, Zabbix Agent 2 can already gather all these metrics using the operational system plugin. In zabbix.connect, we have all the needed templates to get a full picture of the database health.


How to get a simple metric?

1. Create a handler (file) to get a new metric, for instance, the uptime metric: — zabbix/src/go/plugins/postgres/handler_uptime.go.

NOTE. The handler definitions for the current and the upcoming version are available in the article on the PostgreSQL monitoring plugin.

2. Import package to work with Postgres and specify the unique key for the new metric:

package postgres
const (
keyPostgresUptime = "pgsql.uptime"
)

3. Find the handler with the following query:

func uptimeHandler(ctx context.Context, conn PostgresClient, _ string, _
map[string]string, _ ...string) (interface{}, error) {
var uptime float64
query := `SELECT date_part('epoch', now() - pg_postmaster_start_time());

4. Define the variable, which will hold the result.

NOTE. The matching between the Golang variables and the Postgres variables can be found on the pgx documentation page.

5. Define the query for the new metric:

row, err := conn.QueryRow(ctx, query)
if err != nil {
...
}
err = row.Scan(&uptime)
if err != nil {
...
}
return uptime, nil

Here, we:

  • perform the query,
  • check if there are any errors,
  • scan the results for the Golang variable,
  • scan for errors again, and
  • finally, return the results.

6. Register the key of your new metric in metrics.go:

var metrics = metric.MetricSet{
....,
keyPostgresUptime: metric.New("Returns uptime.",
[]*metric.Param{paramURI, paramUsername,
paramPassword,paramDatabase}, false),
}

In the metrics variable, all the metrics in the plugin are defined. Here, we need to add the description of the new metric.

Now, we need to recompile the agent and start it running as we’ll have all the new metrics on board.

Custom metrics

In the upcoming version, the agent will be able to execute queries in separate sql files located on your local machine and return the result to the Zabbix Server alongside the default metrics. To create the sql file with the query:

  • in zabbix_agent2.conf, specify the path to the directory with the sql files named Plugins.Postgres.CustomQueriesPath.
  • in the template, provide the name for the sql file as the 5th parameter for the new key — pgsql.query.custom and specify the additional parameters for this query if needed.

Custom metric example

1. Let’s consider a simple table containing three rows.

  • # CREATE table example (phrase text, year int );
  • # SELECT * FROM example;

2. I have created two files retrieving data from this table:

  • $touch custom2.sql.
    — $echo “SELECT * FROM example;” > custom2.sql.
  • $touch custom1.sql.
    — $echo “SELECT phrase FROM example WHERE year=$1;” > custom1.sql.

In the first file, no parameters are required, while the ‘WHERE’ statements is specified in the second file, so we’ll need one additional parameter.

3. I have added the path to the sql files in zabbix_agent2.conf:

Plugins.Postgres.CustomQueriesPath=/path/to/file

4. In the templates, I need to create the key — pgsql.query.custom. Here, the first four parameters are connection parameters, and the name of the file containing the query is defined as the parameter (in this case, custom2).

Then, it is necessary to do the same for the second file. However, the second query requires some additional parameters. These parameters are specified as parameter 6. Here, for the custom1 file, the ‘2021’ parameter will be used for the query.

After these two keys are created, Zabbix Agent will automatically find them, execute them, and soon the results will appear in the Latest data.

The result for each query appears in text format

As the first one starts in 2020 and the second one — in 2021, the parameter has been used for the second key.

Conclusion

The new version of the plugin with custom metrics will hopefully become available with the next Zabbix Server release.

Questions & Answers

Question. What is the point of specifying the database name in that key? Are any metrics stored there? Should we create a separate database for Zabbix?

Answer. You can use the Postgres default database, but it is recommended to create a separate database as it is more secure to get monitoring metrics from a separate database. 

Question. Does the Zabbix user both in the OS and in the database need any special permissions to get this going? 

Answer. Two permissions should be defined. These permissions are specified in the instruction for the PostrgeSQL monitoring plugin for Zabbix. 

Question. Will Zabbix work independently of the pg_stat_statements module? 

Answer. It gathers some data from the pg_stat_statements module. Without this module installed, we will not be able to get some crucial metrics from it, though the module itself will be running.

Question. Can the plugin work in the passive mode or in the active mode only?

Answer. The plugin is working similar to the Zabbix Agent — it pushes the data.

Question. Does this Postgres plugin work automatically against the Zabbix backend if we use Postgres as Zabbix backend?

Answer. If you use Agent 2 with this plugin, then it will work out of the box though you’ll have to apply templates and create items, etc. Otherwise, you’ll have to update it.

Question. What is the advantage of using the plugin over Zabbix user parameters, which are custom scripts that the agent can execute?

Answer. If you use user parameters, connections to Postgres are established through psql calls. This can create additional server load. The plugin establishes a permanent connection entailing fewer overheads.

Supercharge Zabbix with powerful insights

Post Syndicated from alexk original https://blog.zabbix.com/supercharge-zabbix-with-powerful-insights/12841/

A new set of trigger functions for long-term analysis of trend data will allow Zabbix to analyze historical data and generate alerts on detected anomalies.

Contents

I. Types of monitoring (0:39)

II. Zabbix 5.2 new functions (5:34)

III. In a nutshell (13:28)
IV. Questions & Answers (14:17)

Types of monitoring

Let’s start with a philosophical observation. In many cases, configuring monitoring entities is a pretty straightforward exercise. For instance, we know that computers should have some free disk space as applications won’t work otherwise; that CPU should not run at 100oC; that user-facing application should respond in less than a couple of seconds, otherwise, users will notice and complain. To be alerted when any of these expectations fail, we need to use triggers. A trigger can be as simple as {Host:cpu.temp.avg(5m)} > 100.

However, in some situations, it is difficult to decide right from wrong. Some cases can’t be evaluated without a proper context. For instance, is it OK if RAM is 70% full?  The answer is our favorite ‘it depends’. If RAM was just 20% full a week ago, chances are big that some application is leaking and your memory usage will continue growing. But if your RAM usage stays at 70% for three years in a row, there are even better chances that it stays so for another three years.

Another it-depends example is web traffic monitoring. Intuitively, we know that it’s perfectly normal to have uneven traffic distribution across days of week or months. But every website has its usage patterns, so even when we figure out what is normal and what’s not for one specific website, it’s difficult to scale this knowledge to other websites.

Web traffic monitoring

So, in the grand scheme of things, it all boils down to finding a good baseline for parameters we want to monitor. And baselines are usually defined by previous knowledge.

So, in such cases, instead of figuring out a fixed threshold (some fixed value or percentage), we need to figure out data points in the past that we want to compare to our current data points.

  • Compare values to known thresholds.
{Host:cpu.temp.avg(5m)} > 100
  • Baseline — compare to unknown thresholds.

Finding the right points in the past (or rather, finding a good interval to look back to) is still something that the user must supply manually, even though we are also working on automating this in the future. But Zabbix 5.2 gives you some tools to make comparisons to baseline way easier.

Web traffic monitoring example

Let’s consider a history of website visits for an imaginary commerce site — shop.example.com.

Commercial site web traffic monitoring

The numbers are different at any given point in time, yet all these are normal in a certain context. Overall, we see a growing trend in 2020 as compared to 2019. But there are seasonal traffic spikes. The biggest ones are around Christmas.

Site administrators like to be informed of any traffic anomalies (such as fraud traffic, for example), but hate false positives caused by seasonal spikes.

If we want to detect anomalies here, we can get an average for some period and compare it to an average for the same period a year before.

If we know that our organic year-to-year growth is not likely to exceed, for instance, 15 %, then it’s seemingly easy to do this in virtually any version of Zabbix: we take the average traffic over 30 days and check if it exceeds the same period a year ago by more than 15 %.

However, there are a few problems with this trigger expression.

1. First, we look 1 year back in history. But if we look into Zabbix 5.0 documentation about triggers, we see this:

This means that we need to keep a full and detailed history for at least 1 year (13 months, in this specific case). It is a passable solution if we ingest the traffic data daily. But what if we do it every minute? What if we do it every minute for a thousand websites?

2. In Zabbix, we specify time as 30d and 365d. As you may know, in Zabbix, this is just a fancy way to specify 187,200 and 68,328,000 seconds. Zabbix 5.0 doesn’t have the time suffix for a month and a year just because this cannot be simply translated to the number of seconds. Even though 30d is very close to 28d and 31d, it’s still not the same.

3. The result of avg() function with or without the second time shift parameter always depends on the specific time of the calculation. This is because Zabbix calculates time shifts by subtracting the interval from the current time. This makes it impossible to calculate aggregates between, for instance, the first and the last day of a week, a month, or a year.

Zabbix 5.2 new functions

That is why we introduce new trigger functions, which address all the specified issues. We also added few other trigger features, which improve event presentation. These functions are similar to the non-trend counterparts but are optimized for baseline monitoring use cases.

trendavg(period, period_shift)
trendcount(period, period_shift)
trenddelta(period, period_shift)
trendmax(period, period_shift)
trendmin(period, period_shift)
  • The new functions use trends tables instead of history (do not forget to set proper trend storage period):

  • period and period_shift parameters use the Gregorian calendar instead of the number of seconds.

h (hour), d (day), w (week), M (month), and y (year).

  • These functions are easy on system resources because they do calculations only when a period ends.

In addition to the new trigger functions, we also added the ability to set customized event name.

The customized event name lets you fine-tune how the event looks in the Zabbix UI (in screens like problems and problem widget) and include trigger expression calculation results.

This field is optional, you can continue using the trigger Name field instead.

There is also a new macro {? … }. It can be used for expressions inside the event name.

Triggers

Let’s reconfigure our trigger in the Zabbix 5.2 style.

Zabbix 5.2-style triggers

Let’s see what are the arguments for trendavg() function: 1M and now/M.

  • The first argument means that we use calendar month as an aggregation period. So, depending on the month’s trendavg() will be doing calculations for, it will pick up the first and the last date of the month. The same goes for other possible interval suffixes — h for hour, d for day, w for week, and y for year.
  • The second parameter, as in regular aggregate functions, means a time shift. But to distinguish between old and new types of shifts, we call them period shifts. The period shift denotes the last point in the timeline for our aggregation.

For instance, for October 13, 2020, trendavg(1M) will calculate the value for the period from September 1, 2020, to September 30, 2020, and trendavg(1M, 1M-1y) will calculate the value for the period from September 1, 2019, to September 30, 2019.

Event name field

In Zabbix 5.2, you can continue using the Name field with the content copied to the Event name field. But if you specify the Event name, it will be used for all corresponding events instead.

The Event name supports the new macro {?…}, so you can put another trigger expression inside this macro to show some related calculations. We call it the expression macro. For instance, the Event name will be displayed on the Problem screen as follows:

Formatting functions

This trigger generates problems like this:

It’s already very useful, but this percentage will look better if we could round it up. It wouldn’t hurt to show what month we compare our traffic against. To do that, we have added two formatting functions:

  • fmtnum(digits)

— applicable to ITEM.VALUE, ITEM.LASTVALUE, and expression macros.
fmtnum(2) gives 14.85 instead of 14.8512345.

  • fmttime(format, time_shift)

— applicable to {TIME}.
— uses strftime format codes.
— formats time, for instance, {TIME}.fmttime(“%B,%Y”) gives October,2020.

Let’s see how we can improve our Event name with new formatting functions:

It looks somewhat scary on the trigger configuration screen, but Zabbix will reward us by generating events like this:

But the new functions are not limited to a single use case of comparing some data from a recent period to some past period.

Cloud budget monitoring example

Let’s consider another real-world example. Imagine that your IT department runs some very important services in the Cloud. And, of course, your finance department sends a monthly budget you don’t want to overrun. You receive cloud usage records from one or more cloud providers and ingest this data periodically into monitoring.

You could set up a trigger with a trendsum() by one month to check whether you exceeded your fixed budget in the previous months or not. But you want to know about the budget overrun ASAP. If you exceed your monthly budget in the middle of a month, your quick reaction might save the company money.

In the chart, we see the even distribution of cloud usage costs up to the last dates of September. Then the usage starts going up. When should you start worrying?

Again, the new trend functions come to the rescue.

The solution is to use the period_shift parameter, just not in the past, but rather in the future. For instance, if today’s date is October 22, this expression will calculate the sum() from October 1 to October 31.

  • trendsum(1M,now/M+1M)

There is one problem, though. To save precious computing resources, Zabbix evaluates these functions in triggers only when the period is over. However, these functions are also available in calculated items, and we can use arbitrary calculation intervals there.

So, the solution is to set up a calculated item, use trendsum() in the formula, and specify some reasonable update interval (for instance, one hour or one day).

Here, on the right-hand side of the chart, we see the current period, which is not over yet. Let’s take a look at the item definition.

This is the formula to calculate the current calendar period. Then, we can add a simple trigger referencing this calculated item:

Formula to calculate the current calendar period

You can also use the new expression macro in this trigger. You don’t need to have trend functions anywhere in the formula for this.


Once the trigger fires, you will see the following problem on the Problem screen — a nice and clean message containing all the information we need.

Use cases

There are many more possible applications for the new functions besides the examples above. Generally, these trend functions can be applied not only to IT metrics but also to many other real-world KPIs, for example:

— Business performance (to calculate annual revenue, profitability, etc.).
— Sales and marketing (for instance, monthly average, customer acquisition costs, sales target rate).
— Warehousing (such as weekly shipments, return rates, etc.).
— Human resources (for instance, annual training costs, overtime hours, etc.).
— Customer support (such as average response time or the number of issues per month).

We expect these functions to pave the way for Zabbix to new territories, which have been previously occupied by CRMs and other business analytics systems.

In a nutshell

  • Zabbix trend functions — a new way to analyze history without storing historical data.
  • Zabbix trend functions support calendar hours, days, weeks, months, and years.
  • New trigger field Event name – lets us display events with context.
  • New formatting functions let us present numbers and dates in a flexible manner.
  • Long-term data analysis just got easier and better with the new Zabbix 5.2.

Questions & Answers

Question. What’s the maximum time period for these new trigger functions? For how long can we analyze the data?

Answer. The maximum time period is not limited by any hardcoded values. The only limit you should keep in mind is just the size of your trend data history. But there are no limitations in the code whatsoever that would limit this use. You also should keep in mind that the longer is the period the bigger the database load is. That’s also a factor to consider.

Question. Is this trend data that we’re analyzing also going to be stored in the value cache or some other place?

Answer. it’s not stored in the value cache at the moment. These trigger functions recalculate their values only after the period is over. So it’s not of much use for value cache. But if this is required by some demanding applications, we’ll add this in the later versions.

Zabbix migration in a mid-sized bank environment

Post Syndicated from Angelo Porta original https://blog.zabbix.com/zabbix-migration-in-a-mid-sized-bank-environment/13040/

A real CheckMK/LibreNMS to Zabbix migration for a mid-sized Italian bank (1,700 branches, many thousands of servers and switches). The customer needed a very robust architecture and ancillary services around the Zabbix engine to manage a robust and error-free configuration.

Content

I. Bank monitoring landscape (1:45)
II. Zabbix monitoring project (h2)
III. Questions & Answers (19:40)

Bank monitoring landscape

The bank is one of the 25 largest European banks for market capitalization and one of the 10 largest banks in Italy for:

  • branch network,
  • loans to customers,
  • direct funding from customers,
  • total assets,

At the end of 2019, at least 20 various monitoring tools were used by the bank:

  • LibreNMS for networking,
  • CheckMK for servers besides Microsoft,
  • Zabbix for some limited areas inside DCs,
  • Oracle Enterprise Monitor,
  • Microsoft SCCM,
  • custom monitoring tools (periodic plain counters, direct HTML page access, complex dashboards, etc.)

For each alert, hundreds of emails were sent to different people, which made it impossible to really monitor the environment. There was no central monitoring and monitoring efforts were distributed.

The bank requirements:

  • Single pane of glass for two Data Centers and branches.
  • Increased monitoring capabilities.
  • Secured environment (end-to-end encryption).
  • More automation and audit features.
  • Separate monitoring of two DCs and branches.
  • No direct monitoring: all traffic via Zabbix Proxy.
  • Revised and improved alerting schema/escalation.
  • Parallel with CheckMK and LibreNMS for a certain period of time.

Why Zabbix?

The bank has chosen Zabbix among its competitors for many reasons:

  • better cross feature on the network/server/software environment;
  • opportunity to integrate with other internal bank software;
  • continuous enhancements on every Zabbix release;
  • the best integration with automation software (Ansible); and
  • personnel previous experience and skills.

Zabbix central infrastructure — DCs

First, we had to design one infrastructure able to monitor many thousands of devices in two data centers and the branches, and many items and thousands of values per second, respectively.

The architecture is now based on two database servers clusterized using Patroni and Etcd, as well as many Zabbix proxies (one for each environment — preproduction, production, test, and so on). Two Zabbix servers, one for DCs and another for the branches. We also suggested deploying a third Zabbix server to monitor the two main Zabbix servers. The DC database is replicated on the branches DB server, while the branches DB is replicated on the server handling the DCs using Patroni, so two copies of each database are available at any point in time. The two data centers are located more than 50 kilometers apart from each other. In this picture, the focus is on DC monitoring:

Zabbix central infrastructure — DCs

Zabbix central infrastructure — branches

In this picture the focus is on branches.

Before starting the project, we projected one proxy for each branch, that is, more or less 1,500 proxies. We changed this initial choice during implementation by reducing branch proxies to four.

Zabbix central infrastructure — branches

Zabbix monitoring project

New infrastructure

Hardware

  • Two nodes bare metal Cluster for PostgreSQL DB.
  • Two bare Zabbix Engines — each with 2 Intel Xeon Gold 5120 2.2G, 14C/28T processors, 4 NVMe disks, 256GB RAM.
  • A single VM for Zabbix MoM.
  • Another bare server for databases backup

Software

  • OS RHEL 7.
  • PostgreSQL 12 with TimeScaleDB 1.6 extension.
  • Patroni Cluster 1.6.5 for managing Postgres/TimeScaleDB.
  • Zabbix Server 5.0.
  • Proxy for metrics collection (5 for each DC and 4 for branches).

Zabbix templates customization

We started using Zabbix 5.0 official templates. We deleted many metrics and made changes to templates keeping in mind a large number of servers and devices to monitor. We have:

  • added throttling and keepalive tuning for massive monitoring;
  • relaxed some triggers and related recovery to have no false positives and false negatives;
  • developed a new Custom templates module for Linux Multipath monitoring;
  • developed a new Custom template for NFS/CIFS monitoring (ZBXNEXT 6257);
  • developed a new custom Webhook for event ingestion on third-party software (CMS/Ticketing).

Zabbix configuration and provisioning

  • An essential part of the project was Zabbix configuration and provisioning, which was handled using Ansible tasks and playbook. This allowed us to distribute and automate agent installation and associate the templates with the hosts according to their role in the environment and with the host groups using the CMDB.
  • We have also developed some custom scripts, for instance, to have user alignment with the Active Directory.
  • We developed the single sign-on functionality using the Active Directory Federation Service and Zabbix SAML2.0 in order to interface with the Microsoft Active Directory functionality.


Issues found and solved

During the implementation, we found and solved many issues.

  • Dedicated proxy for each of 1,500 branches turned out too expensive to provide maintenance and support. So, it was decided to deploy fewer proxies and managed to connect all the devices in the branches using only four proxies.
  • Following deployment of all the metrics and the templates associated with over 10,000 devices, the Data Center database exceeded 3.5TB. To decrease the size of the database, we worked on throttling and on keep-alive and had to increase the keep-alive from 15 to 60 minutes and lower the sample interval to 5 minutes.
  • There is no official Zabbix Agent for Solaris 10 operating system. So, we needed to recompile and test this agent extensively.
  • The preprocessing step is not available for NFS stale status (ZBXNEXT-6257).
  • We needed to increase the maximum length of user macro to 2,048 characters on the server-side (ZBXNEXT-2603).
  • We needed to ask for JavaScript preprocessing user macros support (ZBXNEXT-5185).

Project deliverables

  • The project was started in April 2020, and massive deployment followed in July/August.
  • At the moment, we have over 5,000 monitored servers in two data centers and over 8,000 monitored devices in branches — servers, ATMs, switches, etc.
  • Currently, the data center database is less than 3.5TB each, and the branches’ database is about 0.5 TB.
  • We monitor two data centers with over 3,800 NPVS (new values per second).
  • Decommissioning of LibreNMS and CheckML is planned for the end of 2020.

Next steps

  • To complete the data center monitoring for other devices — to expand monitoring to networking equipment.
  • To complete branch monitoring for switches and Wi-Fi AP.
  • To implement Custom Periodic reporting.
  • To integrate with C-level dashboard.
  • To tune alerting and escalation to send the right messages to the right people so that messages will not be discarded.

Questions & Answers

Question. Have you considered upgrading to Zabbix 5.0 and using TimeScaleDB compression? What TimeScaleDB features are you interested in the most — partitioning or compression?

Answer. We plan to upgrade to Zabbix 5.0 later. First, we need to hold our infrastructure stress testing. So, we might wait for some minor release and then activate compression.

We use Postgres solutions for database, backup, and cluster management (Patroni), and TimeScaleDB is important to manage all this data efficiently.

Question. What is the expected NVPS for this environment?

Answer. Nearly 4,000 for the main DC and about 500 for the branches — a medium-large instance.

Question. What methods did you use to migrate from your numerous different solutions to Zabbix?

Answer. We used the easy method — installed everything from scratch as it was a complex task to migrate from too many different solutions. Most of the time, we used all monitoring solutions to check if Zabbix can collect the same monitoring information.

Scaling Zabbix with containers

Post Syndicated from Robert Silva original https://blog.zabbix.com/scaling-zabbix-with-containers/13155/

In this post, a new approach with Zabbix in High Availability is explained, as well as discussed challenges when implementing Zabbix using Docker Swarm with CI / CD and such technologies as Containers, Docker Swarm, Gitlab, and CI/CD.

Contents

I. Zabbix project requirements (0:33)
II. New approach (3:06)

III. Compose file and Deploy (8:08)
IV. Notes (16:32)
V. Gitlab CI/CD (20:34)
VI. Benefits of the architecture (24:57)
VII. Questions & Answers (25:53)

Zabbix project requirements

The first time using Docker was a challenge. The Zabbix environment needed to meet the following requirements:

  • to monitor more than 3,000 NVPS;
  • to be fault-tolerant;
  • to be resilient;
  • to scale the environment horizontally.

There are five ways to install Zabbix — using packages, compiling, Docker, cloud, or appliance.

We used virtual machines or physical servers to install Zabbix directly on the operation system. In this scenario, it is necessary to install the operating system and update it to improve performance. Then you need to install Zabbix, configure the backup of the configuration files and the database.

However, with such an installation, when the services are unavailable as Zabbix Server or Zabbix frontend is down, the usual solution is a human intervention to restart the service or the server, create a new instance, or restore the backup.

Still, we don’t need to assign a specialist to manually solve such issues. The services must be able to restore themselves.

To create a more intelligent environment, we can use some standard solutions — Corosync and Pacemaker. However, there are better solutions for High Availability.

New approach

Zabbix can be deployed using advanced technologies, such as:

  • Docker,
  • Docker Swarm,
  • Reverse Proxy,
  • GIT,
  • CI/CD.

Initially, the instance was divided into various components.

Initial architecture

HAProxy

HAProxy is responsible for receiving incoming connections and directing them to the nodes of the Docker Swarm cluster. So, with each attempt to access the Zabbix frontend, the request is sent to the HAProxy. And it will detect where there is the service listening to HAProxy and redirect the request.

Accessing the frontend.domain

We are sending the request to the HAProxy address to check which nodes are available. If a node is unavailable, the HAProxy will not send the requests to these nodes anymore.

HAProxy configuration file (haproxy.cfg)

When you configure load balancing using HAProxy, two types of nodes need to be defined: frontend and backend. Here, the traefik service is used as an example.

HAProxy listens for connections by the frontend node. In the frontend, we configure the port to receive communications and associate the backend to it.

frontend traefik
mode http
bind 0.0.0.0:80
option forwardfor
monitor-uri /health
default_backend backend_traefik

HAProxy can forward requests by the backend nodes. In the backend we define, which services are using the traefik service, the check mode, the servers running the application, and the port to listen to. 

backend backend_traefik
mode http
cookie Zabbix prefix
server DOCKERHOST1 10.250.6.52:8080 cookie DOCKERHOST1 check
server DOCKERHOST2 10.250.6.53:8080 cookie DOCKERHOST2 check
server DOCKERHOST3 10.250.6.54:8080 cookie DOCKERHOST3 check
stats admin if TRUE
option tcp-check

We also can define where the Zabbix Server can run. Here, we have only one Zabbix Server container running.

frontend zabbix_server
mode tcp
bind 0.0.0.0:10051
default_backend backend_zabbix_server
backend backend_zabbix_server
mode tcp
server DOCKERHOST1 10.250.6.52:10051 check
server DOCKERHOST2 10.250.6.53:10051 check
server DOCKERHOST3 10.250.6.54:10051 check
stats admin if TRUE
option tcp-check

NFS Server

NFS Server is responsible for storing the mapped files in the containers.

NFS Server

After installing the packages, you need to run the following commands to configure the NFS Server and NFS Client:

NFS Server

mkdir /data/data-docker
vim /etc/exports
/data/data-docker/ *(rw,sync,no_root_squash,no_subtree_check)

NFS Client

vim /etc/fstab :/data/data-docker /mnt/data-docker nfs defaults 0 0

Hosts Docker and Docker Swarm

Hosts Docker and Docker Swarm are responsible for running and orchestrating the containers.

Swarm consists of one or more nodes. The cluster can be of two types:

  • Managers that are responsible for managing the cluster and can perform workloads.
  • Workers that are responsible for performing the services or the loads.

Reverse Proxy

Reverse Proxy, another essential component of this architecture, is responsible for receiving an HTTP and HTTPS connections, identifying destinations, and redirecting to the responsible containers.

Reverse Proxy can be executed using nginx and traefik.

In this example, we have three containers running traefik. After receiving the connection from HAProxy, it will search for a destination container and send the package to it.

Compose file and Deploy

The Compose file — ./docker-compose.yml — a YAML file defining services, networks, and volumes. In this file, we determine what image of Zabbix Server is used, what network the container is going to connect to, what are the service names, and other necessary service settings.

Reverse Proxy

Here is the example of configuring Reverse Proxy using traefik.

traefik:
image: traefik:v2.2.8
deploy:
placement:
constraints:
- node.role == manager
replicas: 1
restart_policy:
condition: on-failure
labels:
# Dashboard traefik
- "traefik.enable=true"
- "traefik.http.services.justAdummyService.loadbalancer.server.port=1337"
- "traefik.http.routers.traefik.tls=true"
- "traefik.http.routers.traefik.rule=Host(`zabbix-traefik.mydomain`)"
- "traefik.http.routers.traefik.service=api@internal"

where:

traefik: — the name of the service (in the first line).
image: — here, we can define which image we can use.
deploy: — rules for creating the deploy.
constraints: — a place of deployment.
replicas: — how many replicas we can create for this service.
restart_policy: — which policy to use if the service has a problem.
labels: — defining labels for traefik, including the rules for calling the service.

Then we can define how to configure authentication for the dashboard and how to redirect all HTTP connections to HTTPS.

# Auth Dashboard - "traefik.http.routers.traefik.middlewares=traefik-auth" - "traefik.http.middlewares.traefik-auth.basicauth.users=admin:" 
# Redirect all HTTP to HTTPS permanently - "traefik.http.routers.http_catchall.rule=HostRegexp(`{any:.+}`)" - "traefik.http.routers.http_catchall.entrypoints=web" - "traefik.http.routers.http_catchall.middlewares=https_redirect" - "traefik.http.middlewares.https_redirect.redirectscheme.scheme=https" - "traefik.http.middlewares.https_redirect.redirectscheme.permanent=true"

Finally, we define the command to be executed after the container is started.

command:
- "--api=true"
- "--log.level=INFO"
- "--providers.docker.endpoint=unix:///var/run/docker.sock"
- "--providers.docker.swarmMode=true"
- "--providers.docker.exposedbydefault=false"
- "--providers.file.directory=/etc/traefik/dynamic"
- "--entrypoints.web.address=:80"
- "--entrypoints.websecure.address=:443"

Zabbix Server

Zabbix Server configuration can be defined in this environment — the name of the Zabbix Server, image, OS, etc.

zabbix-server:
image: zabbix/zabbix-server-mysql:centos-5.0-latest
env_file:
- ./envs/zabbix-server/common.env
networks:
- "monitoring-network"
volumes:
- /mnt/data-docker/zabbix-server/externalscripts:/usr/lib/zabbix/externalscripts:ro
- /mnt/data-docker/zabbix-server/alertscripts:/usr/lib/zabbix/alertscripts:ro
ports:
- "10051:10051"
deploy:
<<: *template-deploy
labels:
- "traefik.enable=false"

In this case, we can use environment 5.0. Here, we can define, for instance, database address, database username, number of pollers we will start, the path for external and alert scripts, and other options.

In this example, we use two volumes — for external scripts and for alert scripts that must be stored in the NFS Server.

For this Zabbix, Server traefik is not enabled.

Frontend

For the frontend, we have another option, for instance, using the Zabbix image.

zabbix-frontend:
image: zabbix/zabbix-web-nginx-mysql:alpine-5.0.1
env_file:
- ./envs/zabbix-frontend/common.env
networks:
- "monitoring-network"
deploy:
<<: *template-deploy
replicas: 5
labels:
- "traefik.enable=true"
- "traefik.http.routers.zabbix-frontend.tls=true"
- "traefik.http.routers.zabbix-frontend.rule=Host(`frontend.domain`)"
- "traefik.http.routers.zabbix-frontend.entrypoints=web"
- "traefik.http.routers.zabbix-frontend.entrypoints=websecure"
- "traefik.http.services.zabbix-frontend.loadbalancer.server.port=8080"

Here, 5 replicas mean that we can start 5 Zabbix frontends. This can be used for more extensive environments, which also means that we have 5 containers and 5 connections.

Here, to access the frontend, we can use the ‘frontend.domain‘ name. If we use a different name, access to the frontend will not be available.

The load balancer server port defines to which port the container is listening and where the official Zabbix frontend image is stored.

Deploy

Up to now, deployment has been done manually. You needed to connect to one of the services with the Docker Swarm Manager function, enter the NFS directory, and deploy the service:

# docker stack deploy -c docker-compose.yaml zabbix

where -c defines the compose file’s name and ‘zabbix‘ — the name of the stack.

Notes

Docker Image

Typically, Docker official images from Zabbix are used. However, for the Zabbix Server and Zabbix Proxy is not enough. In production environments, additional patches are needed — scripts, ODBC drivers to monitor the database. You should learn to work with Docker and to create custom images.

Networks

When creating environments using Docker, you should be careful. The Docker environment has some internal networks, which can be in conflict with the physical network. So, it is necessary to change the default networks — Docker network overlay and Docker bridge.

Custom image

Example of customizing the Zabbix image to install ODBC drive.

ARG ZABBIX_BASE=centos 
ARG ZABBIX_VERSION=5.0.3 
FROM zabbix/zabbix-proxy-sqlite3:${ZABBIX_BASE}-${ZABBIX_VERSION}
ENV ORACLE_HOME=/usr/lib/oracle/12.2/client64
ENV LD_LIBRARY_PATH=$LD_LIBRARY_PATH:/usr/lib/oracle/12.2/client64/lib
ENV PATH=$PATH:/usr/lib/oracle/12.2/client64/lib

Then we install ODBC drivers. This script allows for using ODBC drivers for Oracle, MySQL, etc.

# Install ODBC 
COPY ./drivers-oracle-12.2.0.1.0 /root/ 
COPY odbc.sh /root 
RUN chmod +x /root/odbc.sh && \ 
/root/odbc.sh

Then we install Python packages.

# Install Python3 
COPY requirements.txt /requirements.txt
WORKDIR /
RUN yum install -y epel-release && \ 
yum search python3 && \ 
yum install -y python36 python36-pip && \ 
python3 -m pip install -r requirements.txt
# Install SNMP 
RUN yum install -y net-snmp-utils net-snmp wget vim telnet traceroute

With this image, we can monitor databases, network devices, HTTP connections, etc.

To complete the image customization, we need to:

  1. build the image,
  2. push to the registry,
  3. deploy the services.

This process is performed manually and should be automated.

Gitlab CI/CD

With CI/CD, you don’t need to run the process manually to create the image and deploy the services.

1. Create a repository for each component.

  • Zabbix Server
  • Frontend
  • Zabbix Proxy

2. Enable pipelines.
3. Create .gitlab-ci.yml.

Creating .gitlab-ci.yml file

Benefits of the architecture

  • If any Zabbix component stops, Docker Swarm will automatically start a new service/container.
  • We don’t need to connect to the terminal to start the environment.
  • Simple deployment.
  • Simple administration.

Questions & Answers

Question. Can such a Docker approach be used in extremely large environments?

Answer. Docker Swarm is already used to monitor extremely large environments with over 90,000 and over 50 proxies.

Question. Do you think it’s possible to set up a similar environment with Kubernetes?

Answer. I think it is possible, though scaling Zabbix with Kubernetes is more complex than with Docker Swarm. 

User roles for the enterprise

Post Syndicated from Arturs Lontons original https://blog.zabbix.com/user-roles-for-the-enterprise/12887/

In this post, we’ll talk about granular user roles introduced in Zabbix 5.2 and some scenarios where user roles should be used and where they give a great benefit to these specific environments.

Contents

I. Permissions granularity (0:40)
II. User Roles in 5.2 (5:16)
III. Example use cases (16:16)
IV. Questions &amp; Answers (h2)

Permissions granularity

Permissions granularity

Let’s consider two roles: the NOC Team role and the Network Administrator role. These are quite different roles requiring different permission levels. Let’s not also forget that the people working in these roles usually have different skill sets, therefore the user experience is quite important for both of these roles: NOC Team probably wants to see only the most important, the most vital data, while the Network Administrators usually require permissions to view data in more detail and have access to more detailed and granular information overviews of what’s going on in your environment.

For our example, let’s first define the requirements for these roles.

NOC Team role:

  • They will definitely require access to dashboards and maps.
  • We will want to restrict unnecessary UI elements for them just to improve the UX. In this case – less is more. Removing the unused UI elements will make the day-to-day workflow easier for the NOC team members who aren’t as proficient with Zabbix as our Monitoring team members.
  • For security reasons we need to restrict API access because NOC team members will either use API very rarely or not at all. With roles we can restrict the API access either partially or completely.
  • The ability to modify the existing  configuration will be restricted, as the NOC team will not be responsible for changing  the Zabbix configuration.
  • The ability to close problems manually will be restricted, since the network admin team will be responsible for that.

Network Administrator role:

  • Similar to the NOC team, the Network Administrators also require access to dashboards and maps. what’s going on in your environment, the health of the environment.
  • They need to have access to configuration, since members of this team are responsible for making configuration changes.
  • Most likely, instead of disabling the API access for our network administrator role, we would want to restrict API access in some way. They might still need access to get or create methods, while access to everything else should be restricted.
  • For each of our roles we will be implementing a UI cleanup by restricting UI elements – we will hide the functionality that we have opted out of using.

Roles and multi-tenancy

Granular permissions are one of the key factors in multi-tenant environments. We could use permissions to segregate our environment per tenant, but in 5.2 that’s not the end of it:

  • Imagine multiple tenants where each has different monitoring requirements. Some want to use the services function for SLA calculation, others want to use inventory, or need the maps and the dashboards.
  • Restricting access to elements and actions per tenant is important. So, for example, some tenants wish to be able to close problems manually, others need to have restrictions on map or dashboard creations for a specific user group..
  • Permissions are still used to enable isolation between tenants on host group level

User Roles in 5.2

With Zabbix 5.2 these use cases, which require additional permission granularity, are now fully supported.

So, let’s take a look at how the User Role feature looks in a real environment.

User role

User roles in Zabbix 5.2 are something completely new. Each user will have a role assigned to them on top of their User Type:

User permissions

We end up having our User types being  linked to User roles, and User roles linked to Users. This means that User types are linked to Users indirectly through the User roles.

User types

The User, Admin, and Super admin types are still in use. The role will be linked to one of these 3 user types.

User roles

Note that User type restrictions still apply.

  • Super admin has access to every section: Administration, Configuration, Reports, Inventory, and Monitoring.
  • Admin has access to Configuration, Reports, Inventory, and Monitoring.
  • User has access to Reports, Inventory, and Monitoring.

Frontend sections restricted by User type

Default User roles

Once we upgrade to 5.2 or install a fresh 5.2 instance, we will have a set of default user roles. The 4 pre-configured user roles are available under Administration > User roles:

  • Super admin,
  • Admin,
  • User, and
  • Guest.

Super admin role

  • The default Super admin role is static. It is set up by default once you upgrade or install a fresh instance. Users cannot modify this role.

All of the other default roles can be modified. In the Zabbix environment, we must have at least a single user with this Super admin role that has access to all of Zabbix functionality. This is similar to the root user in the Linux OS.

Newly created roles of either  Super admin, Admin, or User types can be modified. For example, we can create another Super admin role, change the permissions. For instance, we can have a Super admin that doesn’t have access to Administration > General, but has access to everything else.

User role section

Once we open the User roles section, we will see a list of features and functions that we can restrict per user role.

When we create a new role or open a pre-created role they will have the maximum allowed permissions depending on the User type that is used for the role.

Each of the default roles contains the maximum allowed permissions per user type

UI element restriction

We can restrict access to UI elements for each role. If we wish to create a NOC role we can restrict them to have access only to Dashboards and maps. When we open the User up and go to Permissions we will see the available sections highlighted in green.

NOC user role that has access only to Dashboards and maps

Once we open up the Dashboards or the Monitoring section, we will  see only the UI sections in our navigation menu that have been permitted for this specific user.

Global view: NOC user role that has access only to Dashboards and maps

Host group permissions

Note, that User Group access to Host Groups still has to be properly assigned. For instance, when we open the Dashboard, we still have to check if this user belongs to a user group, which has access to a specific host group. Then we will either display or hide the corresponding data.

User Group access to Host Group

Access to API

API access can also be restricted for each role. Depending on the Access to API “Enabled” checkbox the corresponding user of this specific role will be permitted or denied to access the API.

Used when creating API specific user roles

In addition to that, we can allow or restrict the execution of specific API methods. For this we can use an Allow or Deny list. For instance, we could create a user that has access only to get methods: they can read the data, but they cannot modify the data.

Restricting API method

Let’s use host.create method as an example. If I don’t have permission to do so, I will see an error message ‘no permissions to call’ and then the name of the call — host.create in this case.

Access to actions

Each role can have a specific list of actions that it can perform with respect to the role User type.

In this context, ‘Actions’ mean what this user can do within the UI: Do we wish for the user to be able to close problems, acknowledge them, create or edit maps.

Defining access to actions

NOTE. For the role of type ‘User’, the ‘Create and edit maintenance’ will be grayed out because the User type by default doesn’t have access to the Maintenance section. You cannot enable it for the role of User type, but you can enable or disable it for the Admin type role.

Restricting Actions example

Let’s restrict the role for acknowledging and closing problems. Once we define the restriction the acknowledgment and closing of problems will be grayed out in the frontend.

If we enable it (the checkboxes are editable), we can acknowledge and close problems.

Restricted role

Unrestricted role

Default access

We can also modify the Default access section. We can define that a role has default access to new actions, modules, and UI elements. For instance, if we are importing a new frontend module or upgrading our version 5.2 to version 6.0 in the future –  if any new UI elements, modules or action types appear, do we want for this specific role to have access to it by default once it is created or should this role by default have restricted access to all of these new elements that we are creating?

This allows to give access to any new UI elements for our Super Admin users while disabling the for any other User roles.

Default access for new elements of different types can be enabled or disabled for user roles

If Default access is enabled, whenever a new element is added, the user belonging to this role will automatically have access to it.

Role assignment post-upgrade

How are these roles going to be assigned after migration to 5.2? I have my users of a specific User type, but what’s going to happen with roles? Will I have to assign them manually?

When you upgrade to 5.2 from, for example, 5.0, the users will have the pre-created default roles for Admin, User, and Super admin assigned for them based on their types.

Pre-created roles after migration

This allows us to keep things as they were before 5.2 or go ahead with creating new User roles.

Example use cases

The following example use cases will give you an idea of how you can implement this in your environment.

Read-only role

ANOC Team User role, with no ability to create or modify any elements:

  • read-only access to dashboards,
  • no access to problems,
  • no access to API, and
  • no permissions to execute frontend scripts.

When we are defining this new role, we will mark the corresponding checkboxes in the Monitoring section. The User type for this role is going to be ‘User’ because they don’t need to have access to Administration or Configuration.

User type and sections the role has access to

We will also restrict access to actions, the API, and decide on the new UI element and module permission logic. Default access to new actions and modules will be restricted. Read up on Zabbix release notes to see if any new UI elements have been added in future releases!

Read-only role

When we log in with this user and go to Dashboards, we will see that this user has no option to create or edit a dashboard because we have restricted such an action. The access is still granted based on the Dashboard permissions — depending on whether it is a public or a private dashboard. When they open it up, the data that they will see will depend on the User group to Host group relationship.

When this user opens up the frontend, he will see that access to the unnecessary UI elements is restricted (the restricted UI elements are hidden). Even though he has access to the Problem widget on the dashboard, they are unable to acknowledge or close the problem as we have restricted those actions.

Restricted UI elements hidden and ‘Acknowledge’ button unclickable for this Role

Restrict access to Administration section

Another very interesting use case — restricting access to Administration sections. Administration sections are available only for our Super admins, but, in this case, we want to have a separate role of type Super admin that has some restrictions.

Our Super admin type role that has no access to User сonfiguration and General Zabbix settings will need to be able to:

  • create and manage proxies,
  • define media types and frontend scripts, and
  • access the queue to check the health of our Zabbix instance.

But they won’t be able to create new User groups, Users, and so on.

So, we are opening our Administration > User roles section, creating a new role of type Super admin, and restricting all of the user-related sections, and also restricting access to Administration > General.

User type – Super admin. General and User sections are restricted for this role

When we log in, we can see that there is no access to Administration > General section because we have restricted the ability to change housekeeper settings,  trigger severities, and other settings that are available in Administration > General.

But the Monitoring Super admin user still has the ability to create new Proxies, Media Types, Scripts and has access to the Queue section. This is a nice way to create different types of Super admins which was not possible before 5.2.

Access to Administration section elements

Roles for multi-tenant environment

Zabbix Dashboards and maps are used by multiple tenants to provide monitoring data.

In our example, we will imagine a customer portal that different tenants can access. They log in to Zabbix and based on their roles and permissions can access different elements. One of our Tenant requires a NOC role :

  • read-only access to dashboards,
  • read-only access to maps,
  • no access to API,
  • no access to configuration,
  • isolation per tenant so we won’t be able to see the host status of other tenants.

We will create a new role in Administration > User roles — new role of type User. We will restrict access only to the UI elements that need to be visible for the users belonging to this role.

User type role with very limited access to UI

Since we need to have isolation, we will also be using tag-based permissions to isolate our Hosts per tenant. We’ll go to Permissions section, add read-only or write permissions on a User group to a specific Host group. Then we will also define the tag-based permissions so that these users have access only to problems that are tagged with a specific tag.

Tag-based permissions to isolate our Hosts per tenant

Don’t forget to actually tag those problems and define these tags either on the trigger level or on the host level.

Tagging on the host level

Once we have implemented this, if we open up the UI, we go to Monitoring > Dashboards. We can see that:

  • The UI is restricted only to the required monitoring sections.
  • Tag-based permission ensure that we are seeing problems related to our specific tenant.

Isolation and role restriction have been implemented, and we can successfully have our multi-tenant environment.

Roles for multi-tenant environments

What’s next?

How would you proceed with upgrading to Zabbix 5.2 and implementing this? At the design stage, you need to understand that User roles can help you with a couple of things and you need to estimate and assign value to these things if you want to implement them in your environment.

  1. User roles can improve auditing. Since you have restricted roles per each user it’s easier to audit who did what in your environment.
  2. Restricting API access. We can not only enable or disable API access, but we can also restrict our users to specific methods. From the security and auditing perspective, this adds a lot of flexibility.
  3. Restricting configuration. We can restrict users to specific actions or limit their access to specific Configuration sections as in the example with the custom Super admin role. This allows us to have multiple tiers of admins in our environment
  4. Removing unwanted UI elements. By restricting access to only the necessary UI elements we can give Zabbix a much cleaner look and improve the UX of your users.

Thank you! I hope I gave you some insight into how roles can be used and how they will be implemented in Zabbix 5.2. I hope you aren’t too afraid to play around with this new set of features and implement them in your environment.

Questions & Answers

Question. Can we have a limited read-only user that will have access to all the hosts that are already in Zabbix and will be added in the future?

Answer. Yes, we can have access to all of the existing Host groups. But when you add a new Host Group, you will have to go to your Permissions section and assign User Group to Host Group permissions for the newly added group.

Question. So that means that now we can have a fully customizable multi-tenant environment?

Answer. Definitely. Fully customizable based both on our User group to Host group permissions and roles to make the actions and different UI sections available as per the requirements of our tenants.

Question. I want to create a user with only API access. Is that possible in 5.0 or 5.2?

Answer. It’s been possible for a while now.  You can just disable the frontend access and leave the user with the respective permissions on specific Host groups. But with 5.2 you can make the API limitations more granular. So, you can say that this API-only user has access only to specific API methods

Question. Can we make a user who can see but cannot edit the configuration?

Answer. Partially. For read-only users, read-only access still works for the Monitoring section. But if we go to Configuration, if we want to see anything in the Configuration section, we need write access.You can use Monitoring > Hosts section, where you can see partial configuration. Configuration section unfortunately still is not available for read-only access.


Data solution for solar energy application

Post Syndicated from Brad Berwald original https://blog.zabbix.com/data-solution-for-solar-energy-application/13005/

Morningstar, the world’s leading supplier of solar controllers for remote solar power systems, has partnered with Zabbix to provide pre-configured integration of their data-enabled solar power products with the Zabbix network monitoring solution. Now, both power system data and network performance metrics integrate seamlessly to allow remote solar systems to be monitored and managed from a single software platform on the premise or in the cloud, using solutions from Zabbix.

Contents

I. About Morningstar (1:43)
II. Products and technology (6:01)

III. Data solution for solar application (10:28)

IV. Zabbix solution (15:09)

V. Conclusion (21:40)
VI. Questions and Answers (23:09)


In this post, an overview of Morningstar’s diverse product line is presented and the industry applications they support, as well as of how the Zabbix network monitor can be used to manage and log time-series data using SNMP and MODBUS protocols for powerful and scalable system oversight and trend analysis.

Morningstar has been working in partnership with Zabbix to provide integration for the Morningstar products, including easy-to-use templates and pre-formatted data sets in order to speed up getting these products online, so that customers can monitor both their network data and solar power system data at remote sites.

About Morningstar

Morningstar is the leading supplier of charge controllers and inverters generally used in remote power systems around the world.

Morningstar, located in Newtown, Pennsylvania, USA, has sold over 4 million products deployed into the field since the company’s inception in 1993. Morningstar currently works in over 100 countries and provides reliable remote power for mission-critical applications.

We’d like to think of ourselves as the ‘charging experts’ because of our focus on battery life and many years of charging innovation.  We have a diverse product line and many models designed for application specific needs, such as solar lighting and telecommunications. Morningstar has one of the lowest hardware failure rates in the industry.

Some of these mission-critical applications include:

— Residential and rural electrification.

— Commercial systems.

— Industrial products, including telecommunications, oil and gas, security applications.

— Mobile and marine application, which generally includes boats, RVs, and caravans, agricultural applications, etc.

Overview of Morningstar solar applications


— Railroad industry where remote signaling and track management is often remotely powered by solar applications because of its critical nature and absence of a readily available electric grid.

— Traffic applications, early warning systems, signaling messaging systems, traffic, and speed monitoring equipment also can be easily powered for mobile deployment with a battery-based system.

— Oil and gas industry is a specific and notable market for Morningstar, because oil field automation measurement of the gas flow and pressure (RTUs), as well as methane injection points used to keep the gas flowing and avoid well freeze-ups, can be powered by solar power with a very modest amount of power for data monitoring. Since the pipelines often traverse very remote regions, this is highly advantageous to get power where it’s needed.

— In telecommunications, cellular base stations and backhaul links to provide the data for the sites, lane mobile radio applications, and satellite-based infrastructure benefit from remote solar power. In these applications, the loads can be modest or they can be quite significant. In that case, several controllers can be combined together to charge a very large battery bank often with a hybrid diesel gen-set in conjunction with other renewable energy sources to provide a hybrid power system. This increases reliability, provides diversity during inclement weather, and maintains the high integrity of the site link.

— In the cases of rural electrification, small amounts of DC power can be provided in remote locations with no grid access in the countries with a large populace and huge needs for lighting and cell phone charging.

Recently, we did a notable project in Peru, where nearly 1 million Peruvians were provided remote power access using 200,000 DC energy boxes. They provided basic 12V DC power, USB charging, and were distributed over the country in some of the most remote locations.  These home systems easily met the needs for lighting, device charging and other small equipment power needs. In addition, 3,000 integrated power systems for community centers were also deployed to provide 230V AC power for more critical loads, including more substantial lighting, communication and, in some cases, health equipment for the benefit of the local population.

So, we’re very proud to have deployed probably one of the largest and most ambitious rural electrification projects in the history of the off-grid industry. The project was completed last year with our partner Tozzi Green of Italy.

Products and technology

Morningstar has a diverse product set covering all power levels  — anywhere from modest 50W needs up to models that handle 3.2kW per device and that can be paralleled for even greater capacity. We also provide inverter systems in both our SureSine and coming MultiWave, which will be coming to market in the near future.  These inverters provide AC power and enable hybrid system charging (combining both solar and AC sources together).  These meet more demanding load needs and add robust high current charging capabilities from the grid or from diesel generators.

Morningstar products and technologies

So, together all these product lines make up a diverse set of products that really fulfill the variety of needs in an off-grid remote power system. In many cases, each of our products includes open communication protocols, which can be used for remote management.

Charge controllers

A charge controller is installed between the PV modules and the battery. It monitors various system power and voltage readings and temperatures, The charge controlled is also intended for managing the batteries in order to provide long-life adequate charging, take the batteries through their various charging stages, and to manage the DC loads connected to the device. They can, of course, extend the battery life significantly if the battery’s setpoints are configured correctly and the right choice for the battery model is made. That depends a lot on the battery chemistry, the temperatures it will experience, and how deeply it will be cycled or discharged each day while providing power to the system.

We have products in both the PWM and MPPT in our line of charge controller topologies.


MPPT controllers are able to convert DC power from the PV array to the proper battery voltage. So, it has an integrated DC-to-DC converter and controls the charge of the battery preventing overcharging and extending the life.


It is also used with one of our inverter products in order to provide small AC loads, such as equipment that requires 120 or 230-volt power remotely in the field.

Our product line covers a variety of PWM charge controllers.

PWM charge controllers

  • Pulse width modulation products are more cost-effective, simpler in design (from a complexity standpoint), and provide direct charging from an equally sized nominal solar array.
  • The MPPT charge controller line ensures the maximum power point is tracked (MPPT), therefore optimizing power harvest. The modules can be of a much wider range of voltages, much higher voltage, and will actually be monitored and tracked by the controller to provide the optimal operating point for the system.
  • The SunSaver and ProStar MPPT lines are used extensively in smaller systems under a thousand watts.
  • Our TriStar family is used for 3kW or greater and is able to be paralleled. A notable product is our 600V controller, which allows the PV modules to be wired in series for very high voltage input providing advantages in efficiency and PV array distance from the controller. All the MPPT controllers will take the input voltage and conver to the proper output voltage. They will convert it to the expected output to support 12V, 24V, or 48V battery systems.
  • Morningstar inverter line includes the SureSine and MultiWave inverter chargers. We also have a very extensive line of accessories used with each of these controllers. These generally provide protocol conversion hardware, interface adapters, and other items that can control relays to support system control or actuate additional components in remote off-grid systems.

EMC-1 Morningstar’s Ethernet MeterBus converter

EMC-1 is a simple serial 2 Ethernet converter that also supports a real-time operating system and a variety of protocols. So, Morningstar products can be connected to industry-specific applications using those standard protocols — Modbus over IP, or SNMP. It can display a simple HTML web GUI to allow direct connection and a one-to-one basis with the product for simple status monitoring using any type of device, including mobile devices, such as phones or tablets.

Data solution for solar application

Challenges to remote monitoring of solar power sources

Power for wireless ISP infrastructure is a common off-grid application requiring network traffic and power to be monitored together. Customers’ access in the field using Wi-Fi or LTE communications should also be enabled.

When these devices are deployed, clearly they have to have their network equipment monitored with the network management system or NMS. These network monitors can now be enabled with EMS and using SNMP, and Zabbix to make this far easier to integrate the power systems into the same monitoring system. So, you have a single point of software and data collection, and both power and network bandwidth and status can be monitored at the same time.

What this monitoring can help achieve:

  • Measurement of the true load consumption in the field. The power levels will vary depending on the type, amount of usage, and the technology and frequencies used. So, the load in the field throughout the day, during peak and off-peak hours can be directly monitored in real time.
  • Detection and root cause of network outages. We need to minimize network outages and to ensure that the site is reliable and the network is on at all times to avoid customer dissatisfaction and frustration by the operating carrier. The ability to monitor both power and network allows the root cause of network outages to be determined, whether it’s a system configuration, bandwidth restrictions, or something that has caused difficulty with the power system itself, such as a depleted battery, insufficient solar, even electrical faults, or possibly tampering with the system.
  • Ensuring sufficient power at the site to prevent deep battery discharge. It also ensures that you have adequate PV to cycle the battery properly. So, when the battery is depleted each day from powering the loads, it can be fully recharged the next day when PV power is available again. This balance is difficult to manage because you have to always ensure power for the battery, protect the loads, but you may or may not have adequate sun each day. So, reserve power is often provided in the system to ensure that the site will remain up during lower than average or uneven periods of PV supply.

Measurement of the current system status, as well as historical data. Measurement of all this data is ensured by the network monitoring software. Sometimes, with a high level of granularity, so that you can see what is happening in the system on a minute-by-minute or hour-by-hour basis.  This helps detect system faults otherwise missed.

Ensuring system resiliency during low periods of production. In peak times, you usually have more than adequate power. However, off-grid systems may be system-sized in order to handle a worst-case scenario, for instance, for the winter months or the off-peak months with the less amount of sun hours and lower levels of solar insulation that can provide as much power as you expected during the summer. So, during these worst-case periods of the year,  monitoring can be really critical because it’s when you’re most likely to experience an outage due to inadequate solar.

  • When long-term data is available, you can compare, for instance, month-to-month or season-to-season power output, as well as look at trends and analyze the system lifetime of operation to detect anomalies and negative trends during operation to indicate pending battery failure.

With a lot of lead-acid batteries, a minimum of five years is generally acceptable. With newer lithium technologies, battery life is extended to 10 or more years when adequately sized. So, the batteries can have a robust life as long as they are sized correctly and given adequate power.

But monitoring the end stage of a battery, which most likely will occur at some time in the system, is really critical. Many remote sites that are deployed for an extended period of time can go through one or two battery replacement cycles. So, a downward trend with the power declining over time and the batteries beginning to show signs that their health is no longer adequate to support the system can be detected with this long-term data analysis.

Zabbix solution

Remote monitoring of a Morningstar EMC-1 adapter’s IP connection through Zabbix monitoring platform

A typical system in this diagram shows one of the ProStar MPPT controllers connected to a solar array and a battery storage system. Loads can be typical among many of the applications. EMC-1 can be connected to the device in order to provide IP connectivity. That’s something that can be connected to a variety of services:

  • Modbus protocol to connect to SCADA or other HMI Data viewing solutions, which are common in automation and oil and gas.
  • Simple HTTP or HTML web pages to get a simple look at a dashboard to understand what’s going on in the system.
  • SNMP can be used alongside the network monitoring software, and the Zabbix network monitoring software can be enabled to monitor the entire site with just one tool.

Being cloud-based or server-based can have great applications for energy storage, data logging, notifications, and alarms. Native or external databases in the cloud can be used to archive the large amounts of data that will be accumulated. The sites can grow to hundreds or even thousands of deployed systems. So, the software tool and the server must be scalable so that they can grow in time and keep up with the needs of the data.

Advantages:

  • The benefits of an IP-based solution involve its compatibility with any network transport layer. In addition, there’s a variety of wireless applications in the field, including point-to-point, licensed, unlicensed, Wi-Fi, proprietary, wireless protocols,and cellular.
  • Recently, notable gains in the satellite industry have provided lower latency and higher bandwidth. With satellite, you can often reach almost any part of the world, which gives it great benefits for solar power applications.
  • SNMP — a very lightweight protocol. On a metered and wireless connection, especially in these hard-to-reach locations, low overhead UDP packets and minimal infrastructure for monitoring can make sure that you have minimal impact on the system itself in terms of overhead.

Zabbix dashboards for Morningstar solar systems

  • Native Morningstar SNMP support is provided by these tools. We work to review use cases, system needs for solar applications, as well as data sets. The MIB files are already being imported and device templates are being pre-configured for a variety of Morningstar product solutions that support the EMC-1.
  • Dedicated templates allow you to easily connect the hardware to an existing system and go about monitoring Morningstar’s tools using your existing Zabbix instance.
  • Performance visibility of solar-powered systems is available:

— on a very high level to see if there are any systems that have needs or are in a fault state, or

— in greater detail to analyze the time series data and to allow you to correlate that data with other aspects of the system, to determine what is the root cause of the system and how that data is trending. Time series data correlation provides for accelerated troubleshooting.

  • At a glance dashboard management tool makes it easy to monitor the status of all Morningstar devices on the network and to scale to hundreds of sites.
  • Active advanced and custom alerts sent out by the Zabbix system and triggered by the power system events ensure proactive notification of when there is a pending issue at the site, hopefully, before critical loads drop. If you can be notified, then using the bi-directional nature of some of the other protocols, system changes, corrections, extended runtimes, or even auxiliary charging systems, such as generators, can be activated to prevent an outage. Such proactive monitoring can only take place when you’re working at scale using a tool such as Zabbix.

Advantages of monitoring with Zabbix

  • Morningstar provides some simple PC-based utilities that run on Windows software and can provide direct Modbus capability for communication, very simple data logging on a very small number of devices. Morningstar MSView functional utility allows configuration files for the products to be uploaded and deployed to the controllers in the field, as well as basic troubleshooting.
  • Morningstar Live View is our built-in web dashboard that also runs on the EMC. It allows a simple web page with everything displayed in HTML so that it can be viewed on any device regardless of the operating system.

These two products are meant for troubleshooting, site deployment, and configuration of small-scale systems. They’re not set to be scaled.

  • With Zabbix, an almost unlimited number of devices can be connected depending on your computing resources and power.
  • Zabbix supports SNMP and Modbus, which is beneficial for both telecom and industrial automation or smart city applications.
  • Zabbix gives you a real-time data display, as well as custom alerts and notifications. You can set up custom log intervals, downloading of extensive amounts of log data, etc. Reports can be generated based on custom filtering, as well as long-term historical data, which becomes more critical to understanding the site’s longevity.
  • There are cloud-based systems where APIs are available, cloud-to-cloud integrations can be utilized and advanced data management analysis or intelligence can be added onto existing servers by using additional third-party tools.

So, it’s really the only way to manage data of this scale and size.

Conclusion

Zabbix adds a great deal of value and capabilities to Morningstar products when used in the field. If additional access is provided via satellite, cellular, or fixed wireless technologies, then the charge controllers can perform their duty of providing remote power for these systems but easily integrating using the existing protocols to monitor across the entire system deployment.

As solar equipment is often used to provide power for remote network infrastructure. Integrating data from the network components and power systems into a centralized NMS provides an essential management tool to optimize system health and increase uptime. Zabbix also adds configuration options and valuable data analytics to ensure full system visibility. More information on the Zabbix network monitoring tools or Morningstar data-enabled remote power products is available at https://www.zabbix.com and www.morningstarcorp.com or can be requested from [email protected] and [email protected], respectively.

Questions and Answers

Question. Are Morningstar templates shared somewhere? Are they available to the public?

Answer. A part of the partnership with Zabbix is to get all this integrated. We’re putting the finishing touches on how that will be available and easily downloadable as part of our SNMP support documentation. In addition, we can do some cross-referring, so that we can help our products get online. Hopefully, you can get them plugged into the major network monitoring access. All that will be available probably within the next month.

Question.  Zabbix starting from 5.2 natively supports Modbus and MQTT. Do you plan on using that in your environment?

Answer.  Yes, MQTT has come up quite recently and is an indeal solution where IP addressing challenges exist and pub/sub style data reporting is preferred from session initiated within the network. Currently, we support Modbus and SNMP, though we are considering other protocols. Modbus has been used within the solar industry for a long time for automation and control. We also have extenive market in the oil gas industry, where they utilize Modbus both for polling of the data, as well as real-time control by actually making configuration changes to the product remotely.

SNMP is a more recent development and it helps to get on the bandwagon with telecommunications and IT-related markets. So, it’s an easy transition using a protocol that customers are already familiar with.

Question. How do you use report generation? How do you enable it and implement it in Zabbix?

Answer. A lot of our customers are looking for trending data over a certain period of time. So, they would set up regular intervals for the data to be collected and reported because the long-term trending data is about looking at the same site during different periods of time or looking at the same site next to its peers to see how the power system may be varying from what is expected. So, regular report intervals can be executed and filtered based on certain conditions.

There are really a few key parameters of a solar site to look at to understand the health of the system. You need to focus on the battery levels, the maximum power of the solar panel, and a quick diagnostic check to find out if the controller shows any faults or alarms. So, if you have a simple report you can quickly be sure that hundreds of sites are in good shape. If one of them isn’t, you could drill down into more detail on just that specific site.