Post Syndicated from James Beswick original https://aws.amazon.com/blogs/compute/icymi-serverless-q1-2022/
Welcome to the 16th edition of the AWS Serverless ICYMI (in case you missed it) quarterly recap. Every quarter, we share all the most recent product launches, feature enhancements, blog posts, webinars, Twitch live streams, and other interesting things that you might have missed!
In case you missed our last ICYMI, check out what happened last quarter here.
AWS Lambda
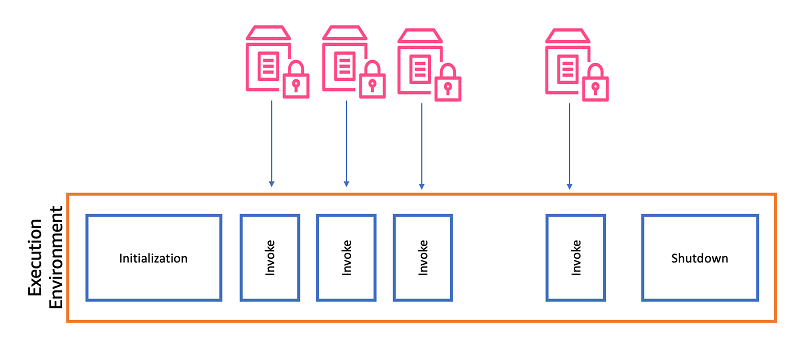
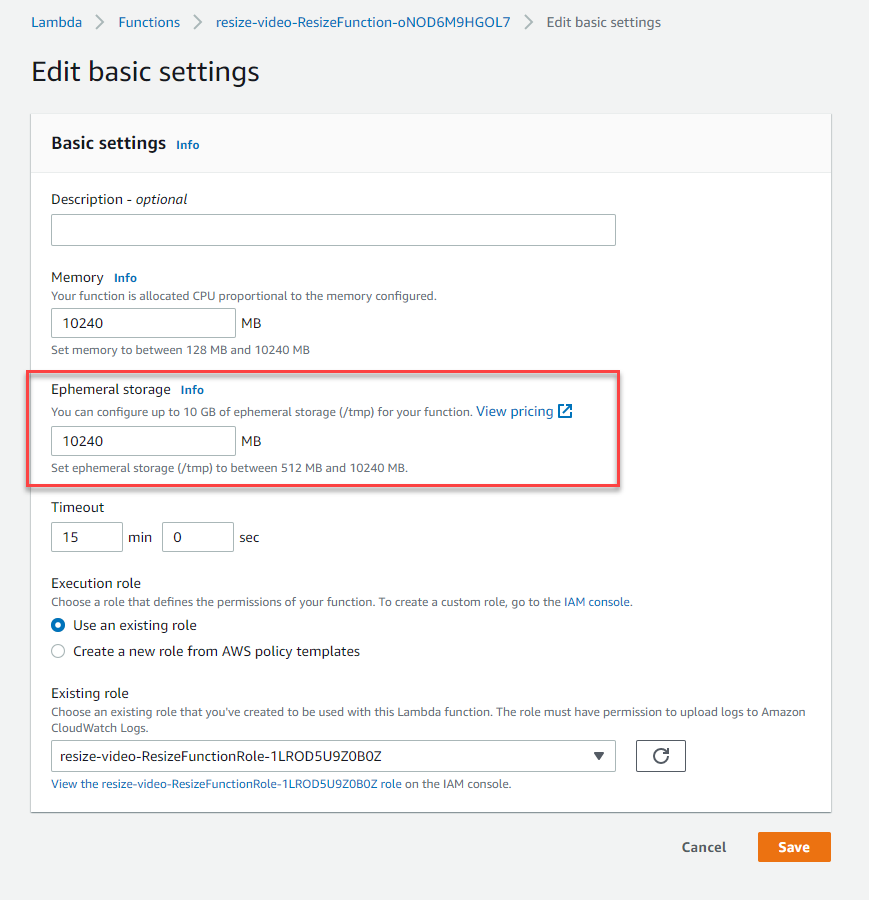
Lambda now offers larger ephemeral storage for functions, up to 10 GB. Previously, the storage was set to 512 MB. There are several common use-cases that can benefit from expanded temporary storage, including extract-transform load (ETL) jobs, machine learning inference, and data processing workloads. To see how to configure the amount of /tmp storage in AWS SAM, deploy this Serverless Land Pattern.
For Node.js developers, Lambda now supports ES Modules and top-level await for Node.js 14. This enables developers to use a wider range of JavaScript packages in functions. With top-level await, when used with Provisioned Concurrency, this can improve cold-start performance when using asynchronous initialization.
For .NET developers, Lambda now supports .NET 6 as both a managed runtime and container base image. You can now use new features of the runtime such as improved logging, simplified function definitions using top-level statements, and improved performance using source generators.
The Lambda console now allows you to share test events with other developers in your team, using granular IAM permissions. Previously, test events were only visible to the builder who created them. To learn about creating sharable test events, read this documentation.
Amazon EventBridge
Amazon EventBridge Schema Registry helps you create code bindings from event schemas for use directly in your preferred IDE. You can generate these code bindings for a schema by using the EventBridge console, APIs, or AWS SDK toolkits for Jetbrains (Intellij, PyCharm, Webstorm, Rider) and VS Code. This feature now supports Go, in addition to Java, Python, and TypeScript, and is available at no additional cost.
AWS Step Functions
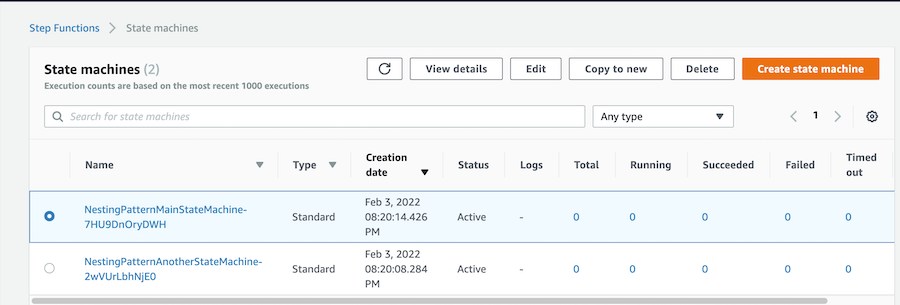
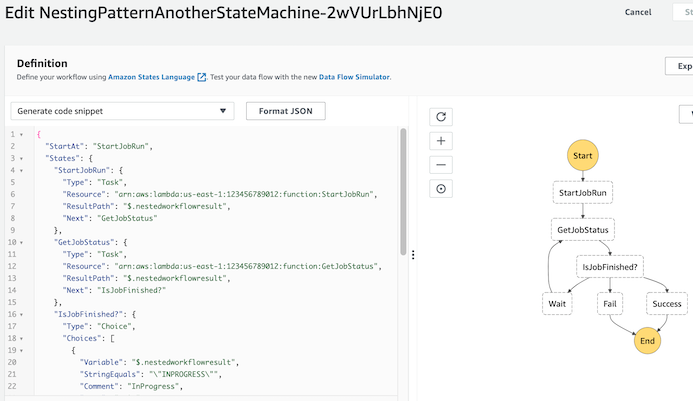
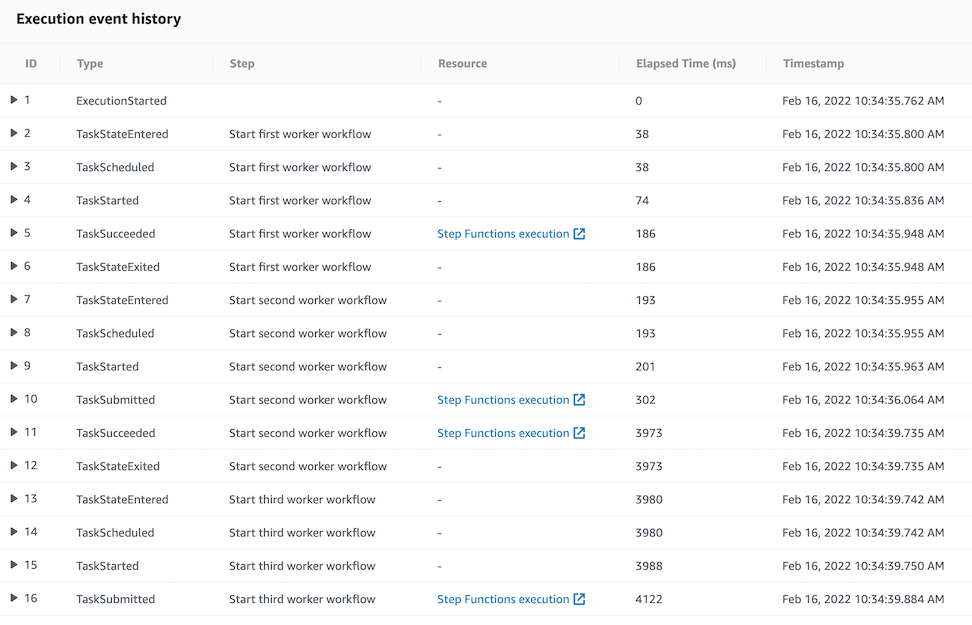
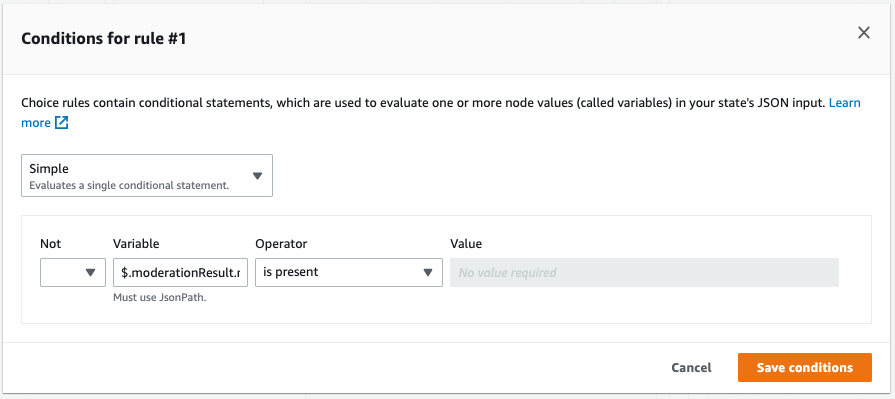
Developers can test state machines locally using Step Functions Local, and the service recently announced mocked service integrations for local testing. This allows you to define sample output from AWS service integrations and combine them into test cases to validate workflow control. This new feature introduces a robust way to state machines in isolation.
Amazon DynamoDB
Amazon DynamoDB now supports limiting the number of items processed in PartiQL operation, using an optional parameter on each request. The service also increased default Service Quotas, which can help simplify the use of large numbers of tables. The per-account, per-Region quota increased from 256 to 2,500 tables.
AWS AppSync
AWS AppSync added support for custom response headers, allowing you to define additional headers to send to clients in response to an API call. You can now use the new resolver utility $util.http.addResponseHeaders() to configure additional headers in the response for a GraphQL API operation.
Serverless blog posts
January
Jan 6 – Using Node.js ES modules and top-level await in AWS Lambda
Jan 6 – Validating addresses with AWS Lambda and the Amazon Location Service
Jan 20 – Introducing AWS Lambda batching controls for message broker services
Jan 24 – Migrating AWS Lambda functions to Arm-based AWS Graviton2 processors
Jan 31 – Using the circuit breaker pattern with AWS Step Functions and Amazon DynamoDB
Jan 31 – Mocking service integrations with AWS Step Functions Local
February
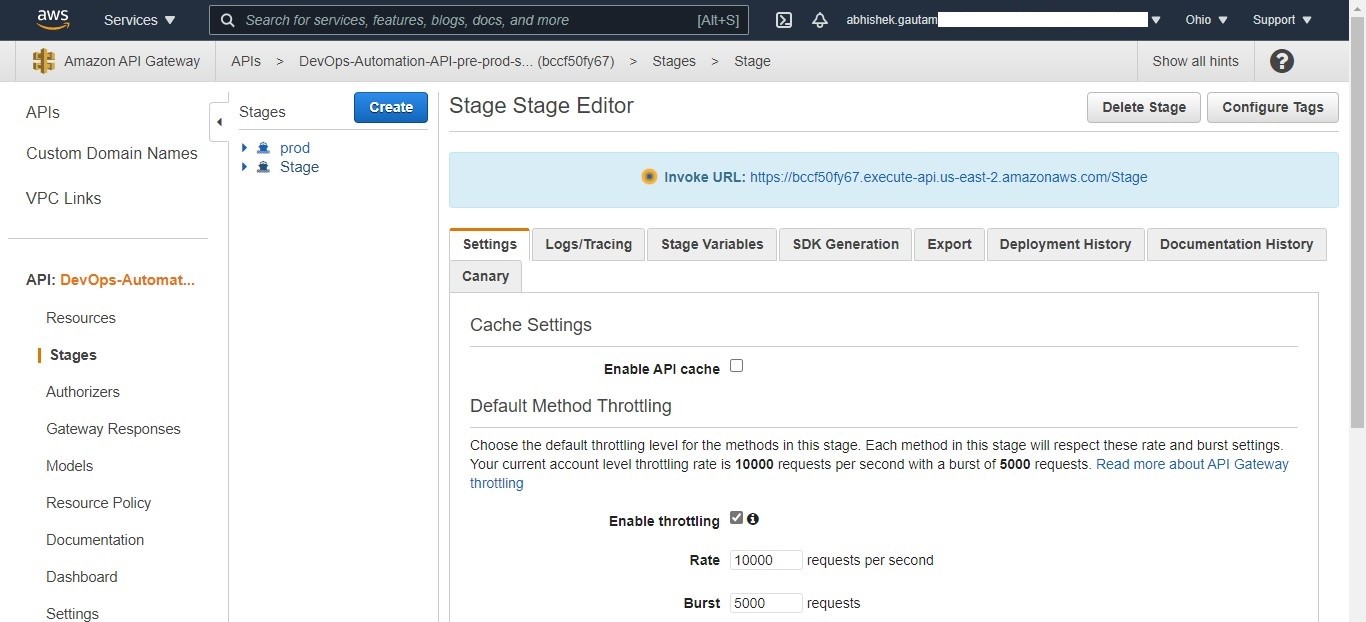
Feb 8 – Capturing client events using Amazon API Gateway and Amazon EventBridge
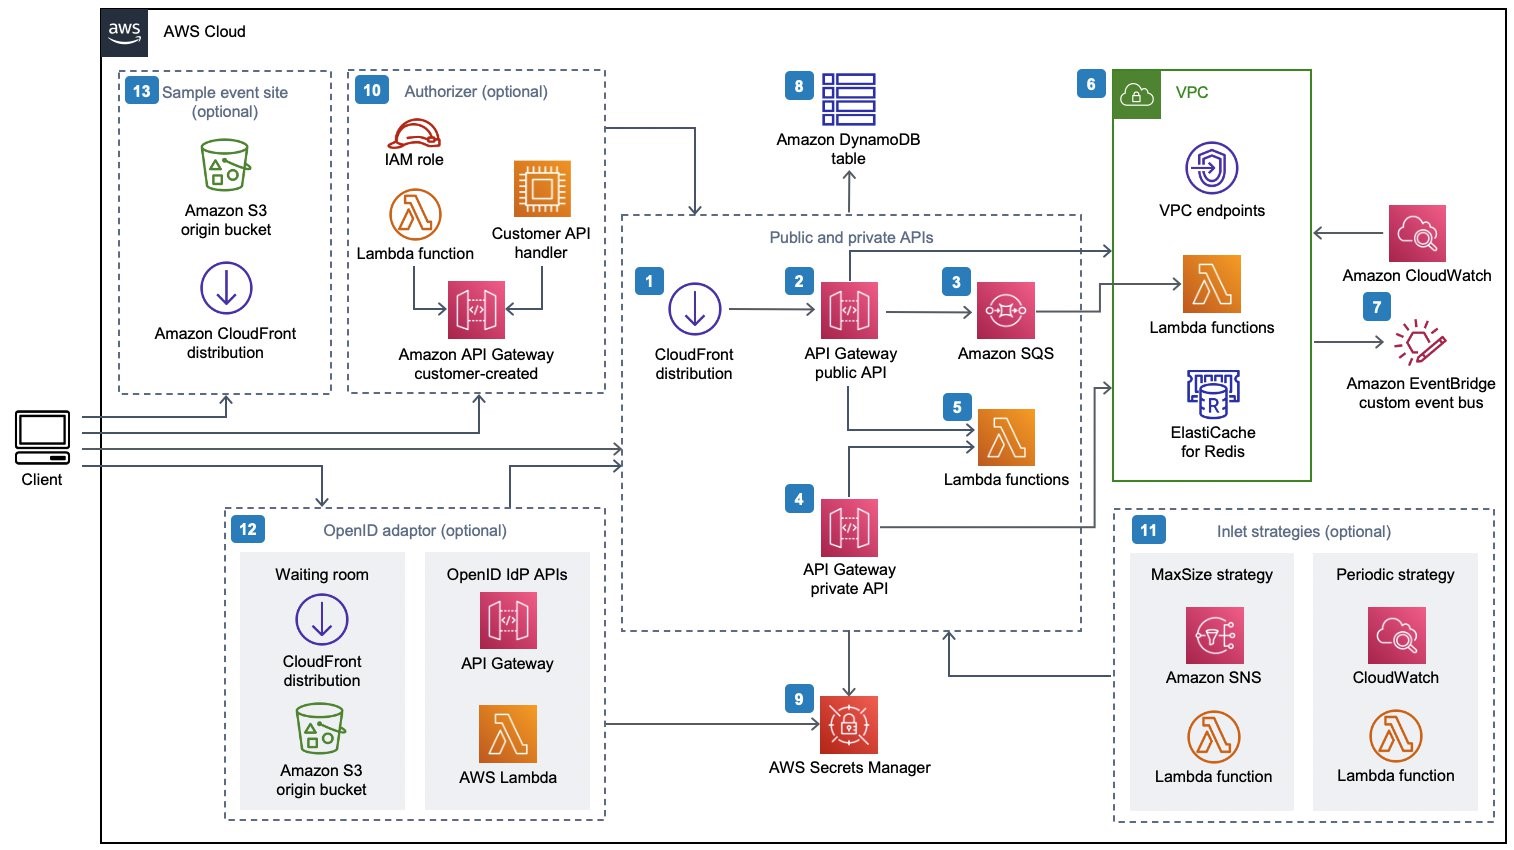
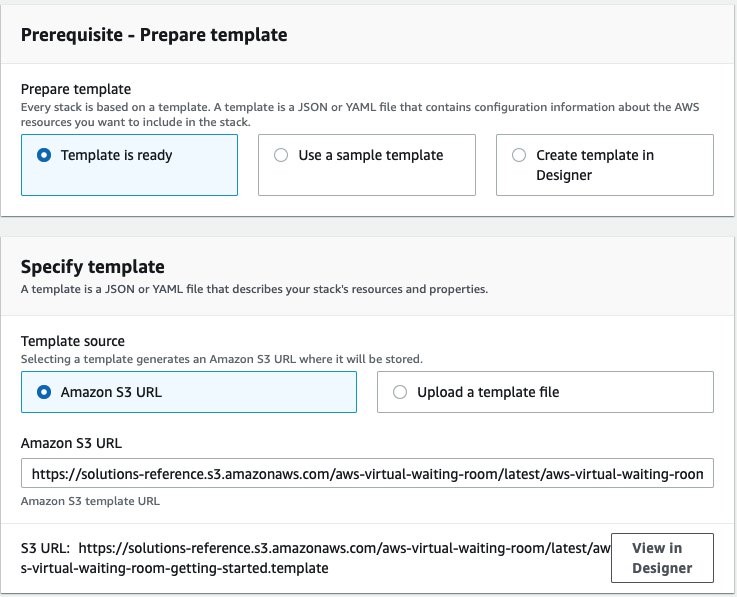
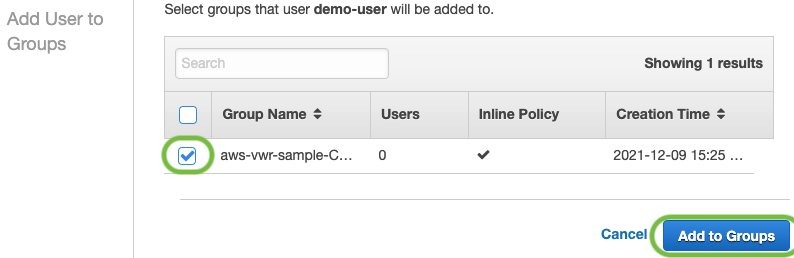
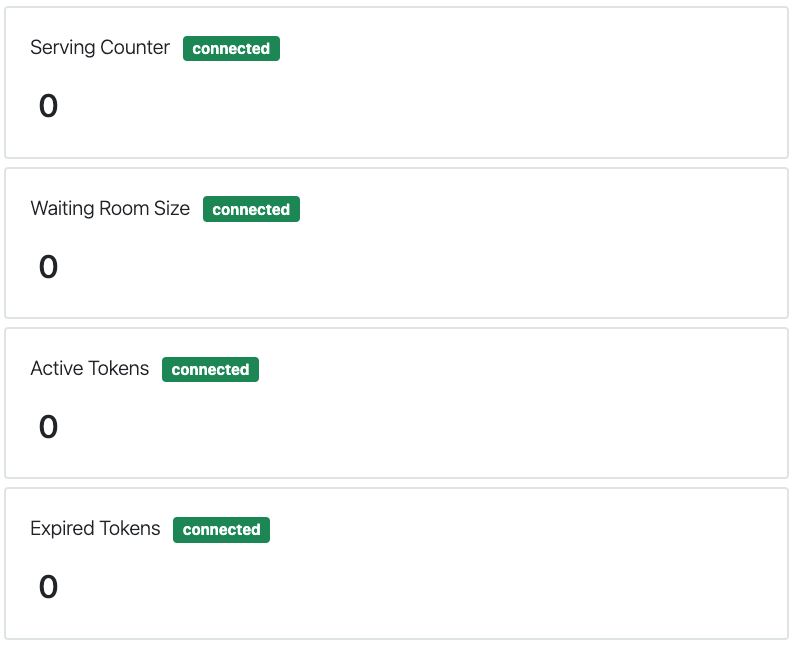
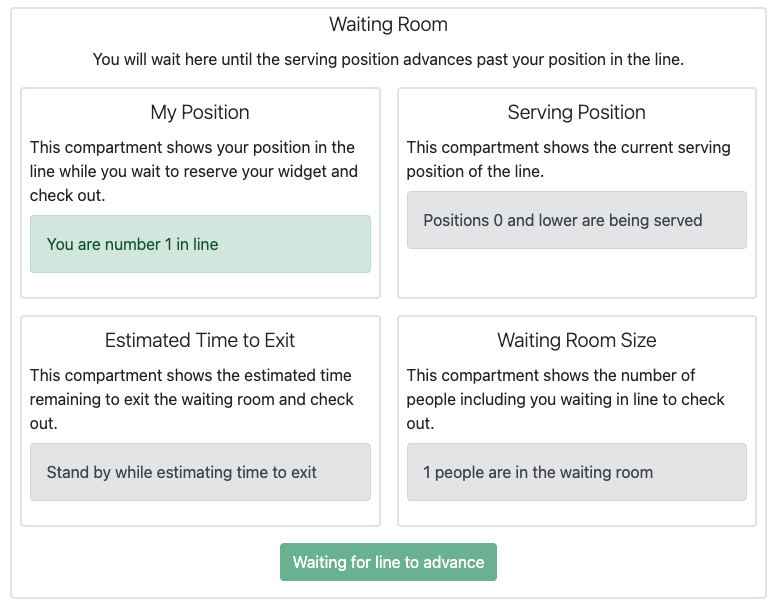
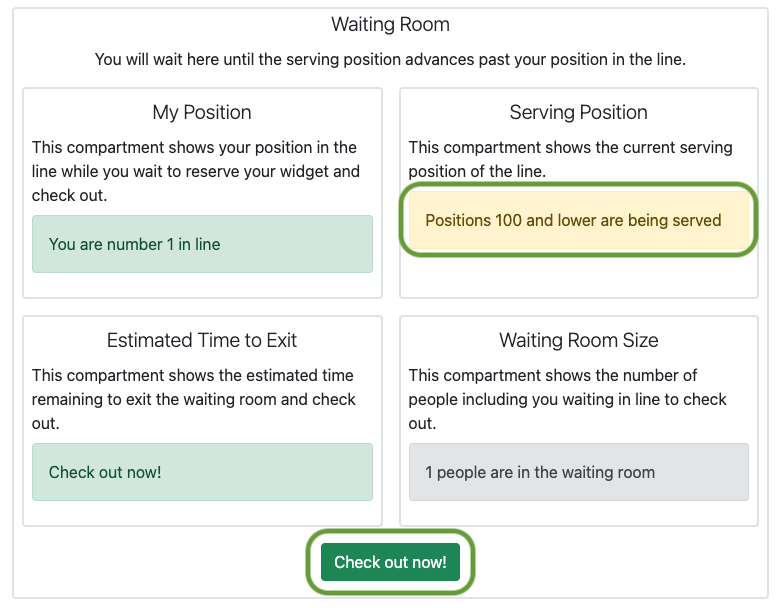
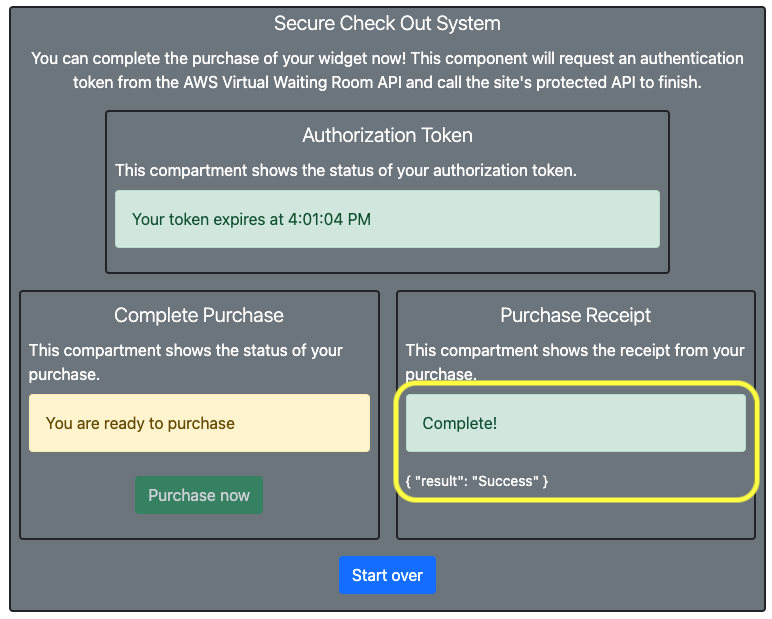
Feb 10 – Introducing AWS Virtual Waiting Room
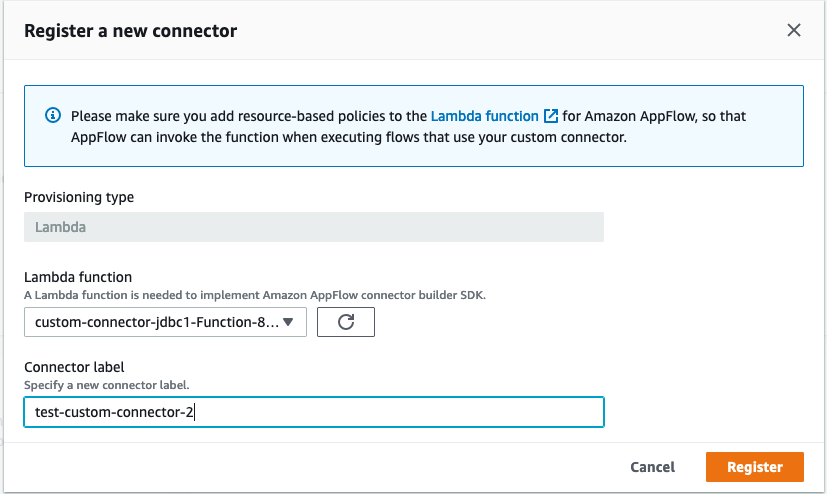
Feb 14 – Building custom connectors using the Amazon AppFlow Custom Connector SDK
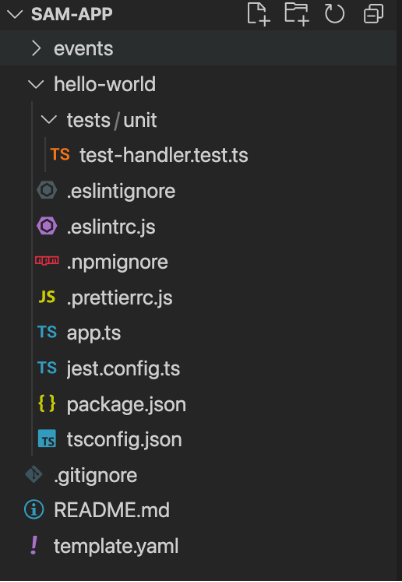
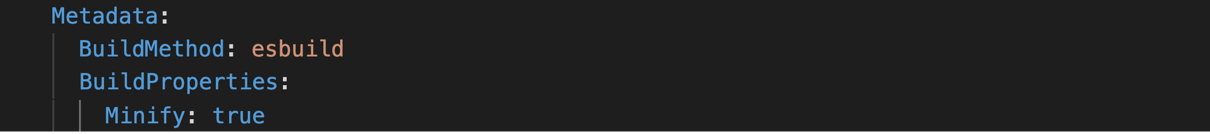
Feb 22 – Building TypeScript projects with AWS SAM CLI
Feb 24 – Introducing the .NET 6 runtime for AWS Lambda
March
Mar 6 – Migrating a monolithic .NET REST API to AWS Lambda
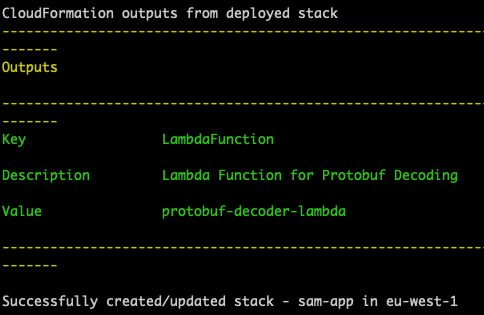
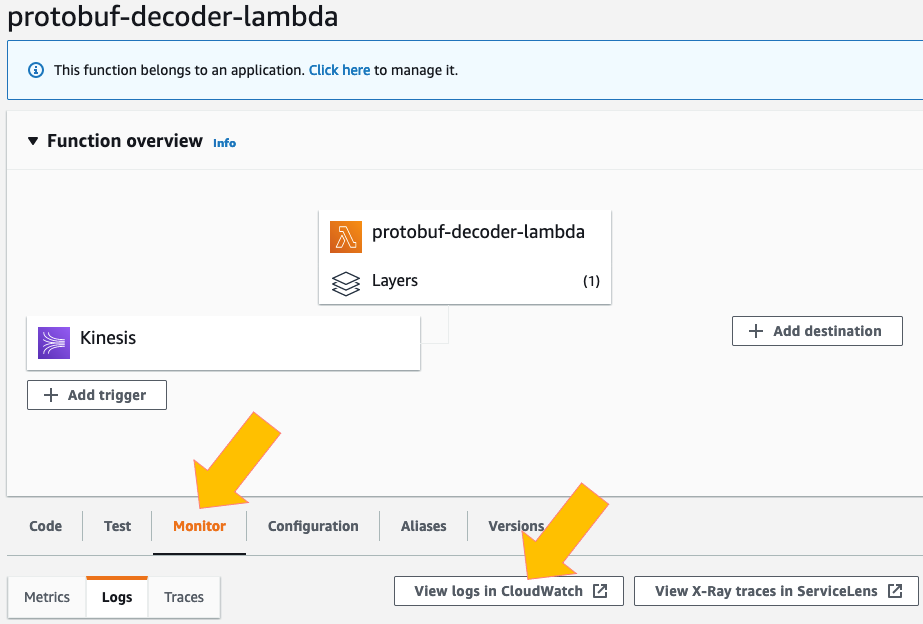
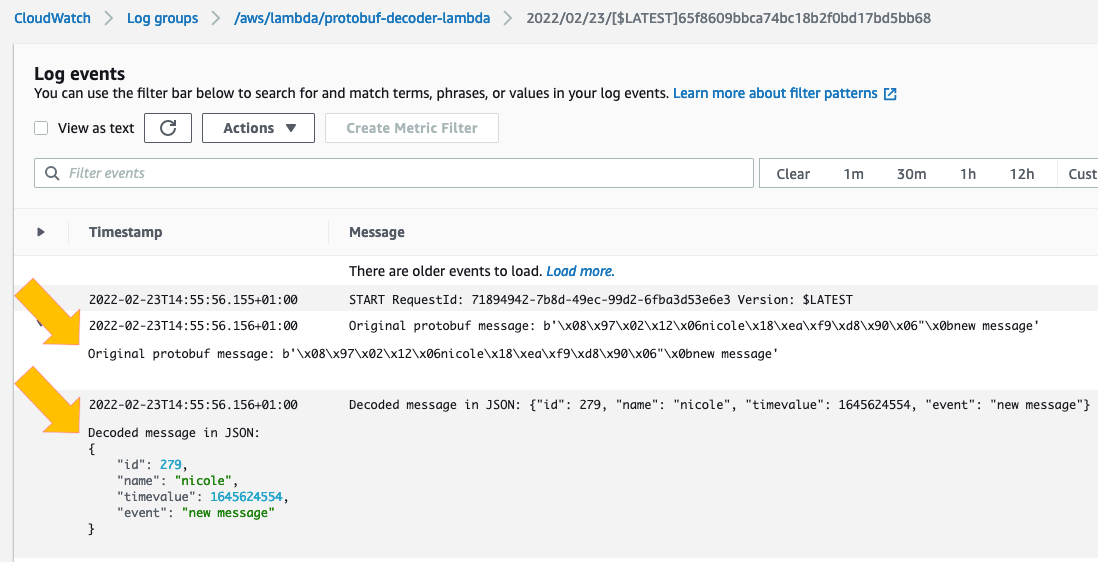
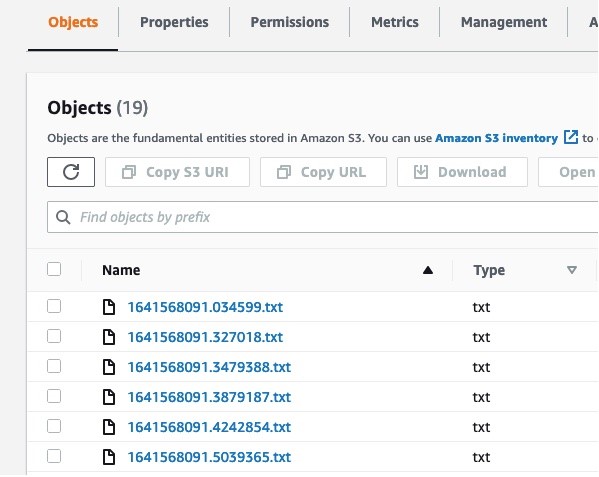
Mar 7 – Decoding protobuf messages using AWS Lambda
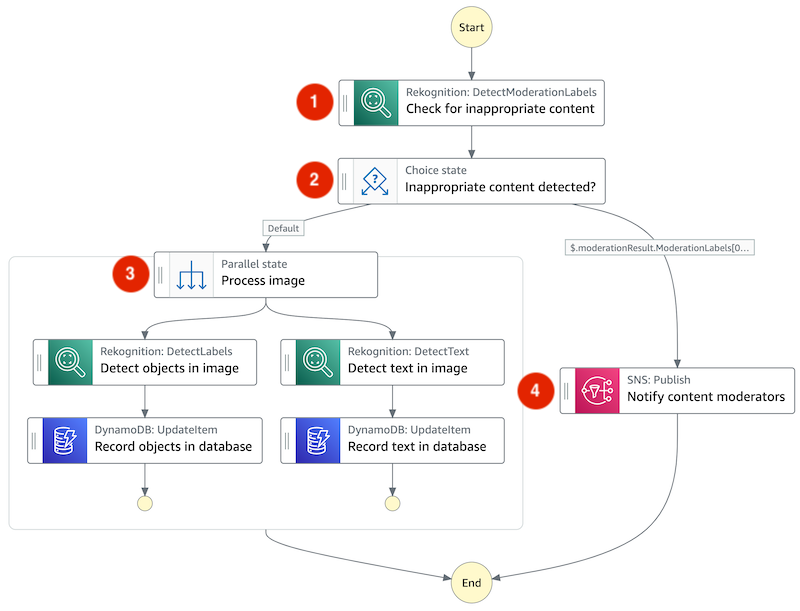
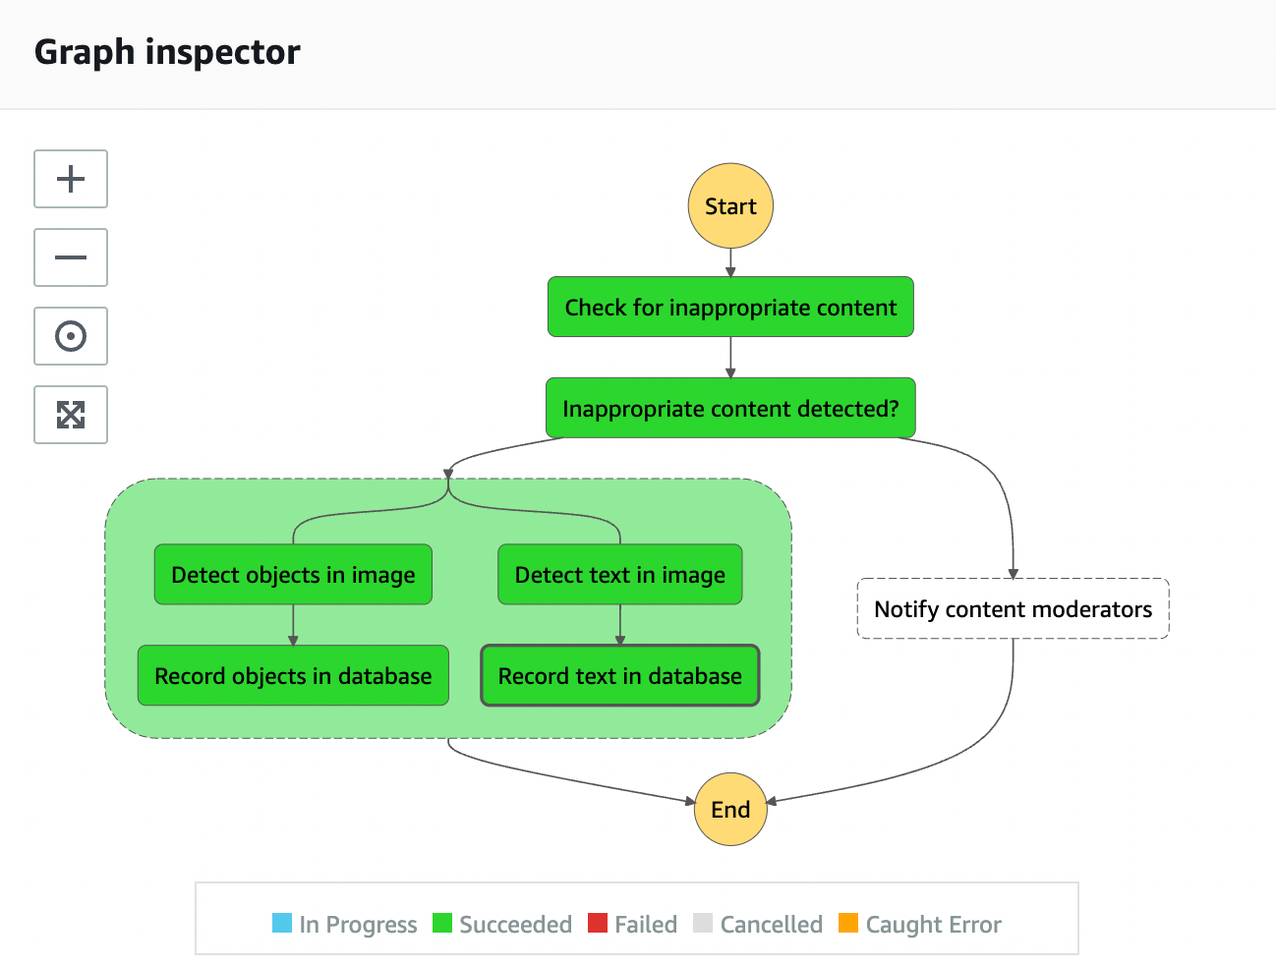
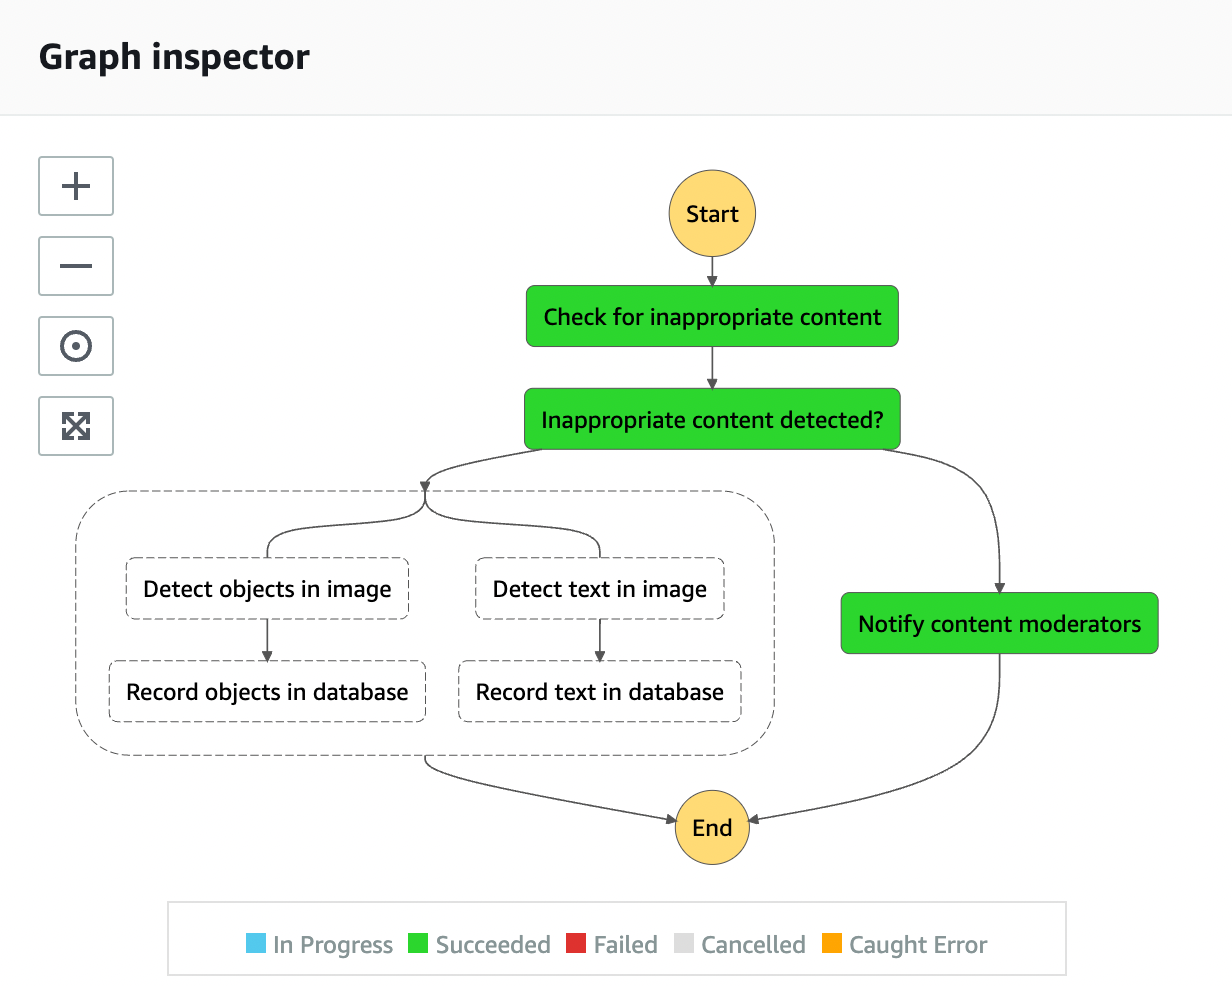
Mar 8 – Building a serverless image catalog with AWS Step Functions Workflow Studio
Mar 9 – Composing AWS Step Functions to abstract polling of asynchronous services
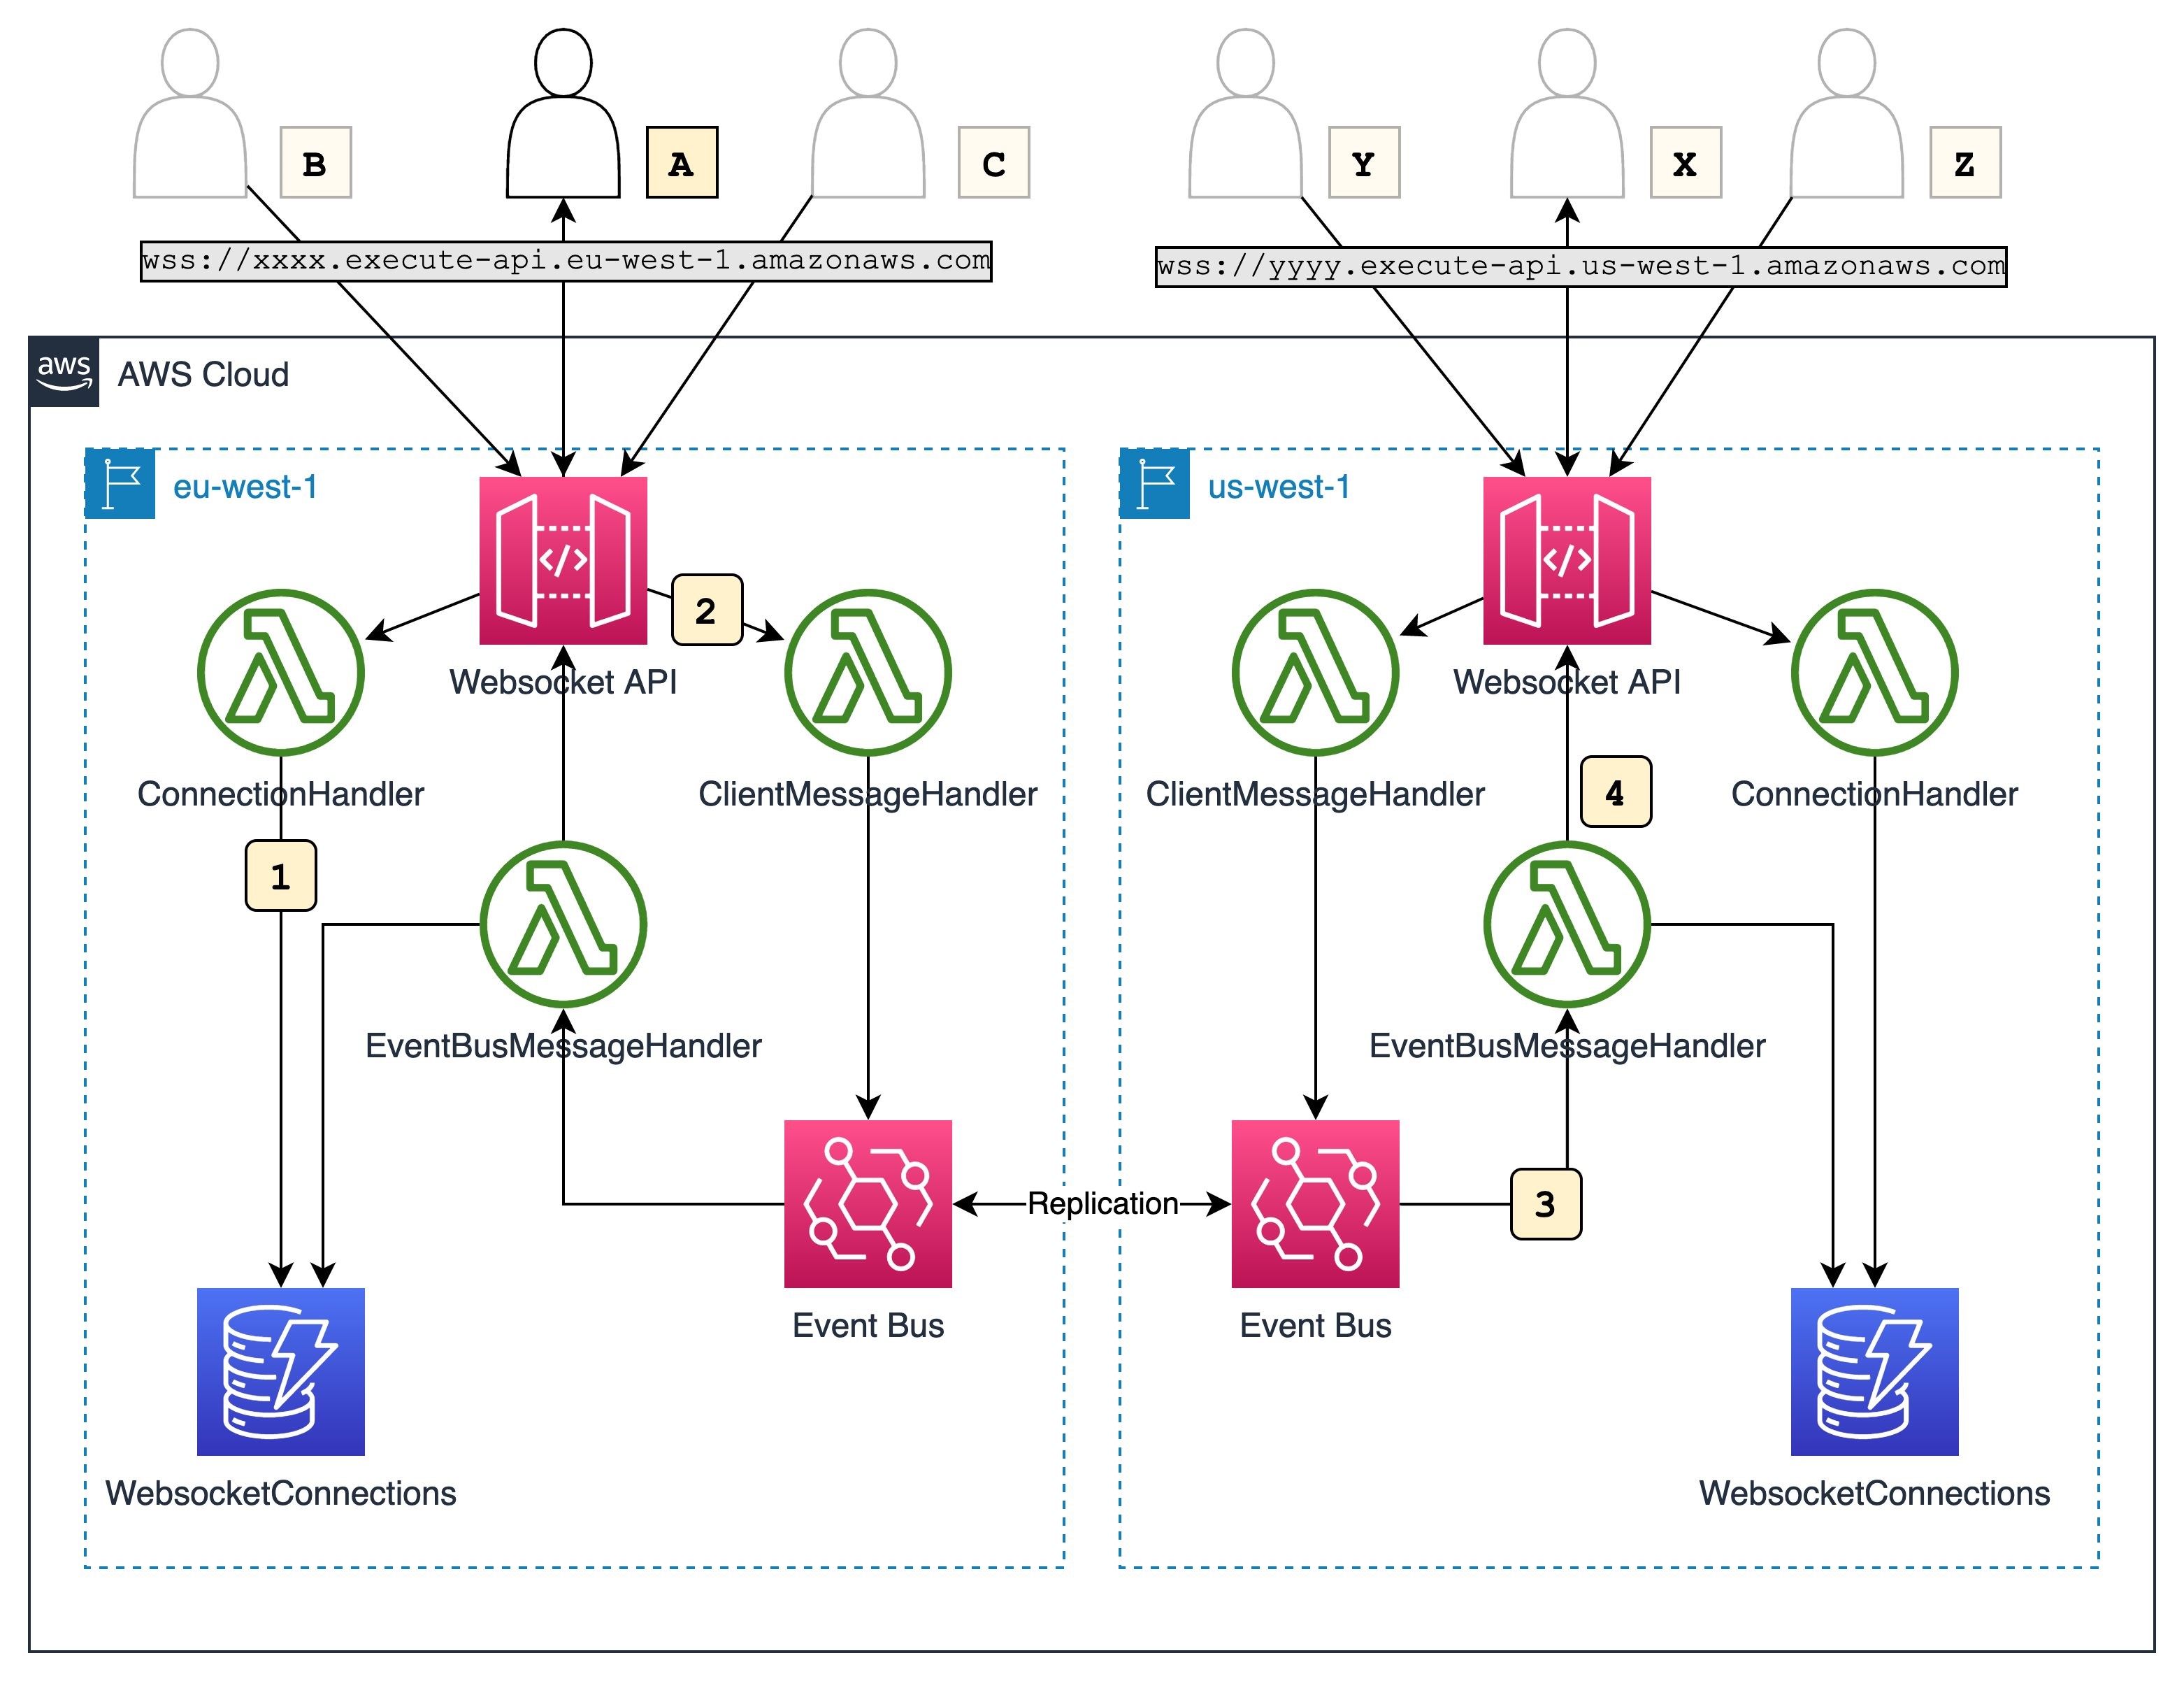
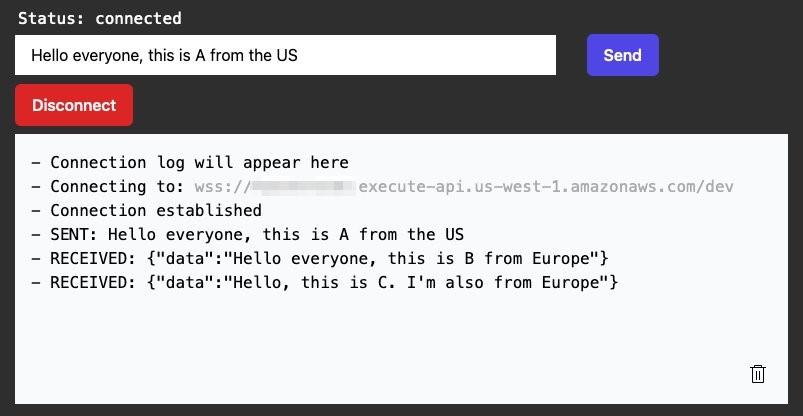
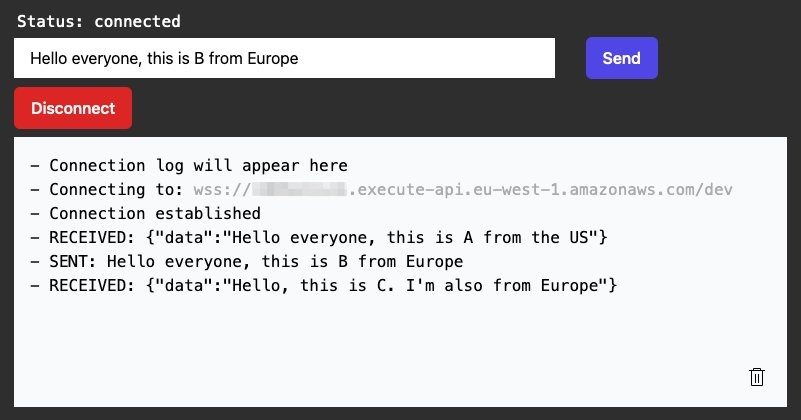
Mar 10 – Building serverless multi-Region WebSocket APIs
Mar 15 – Using organization IDs as principals in Lambda resource policies
Mar 16 – Implementing mutual TLS for Java-based AWS Lambda functions
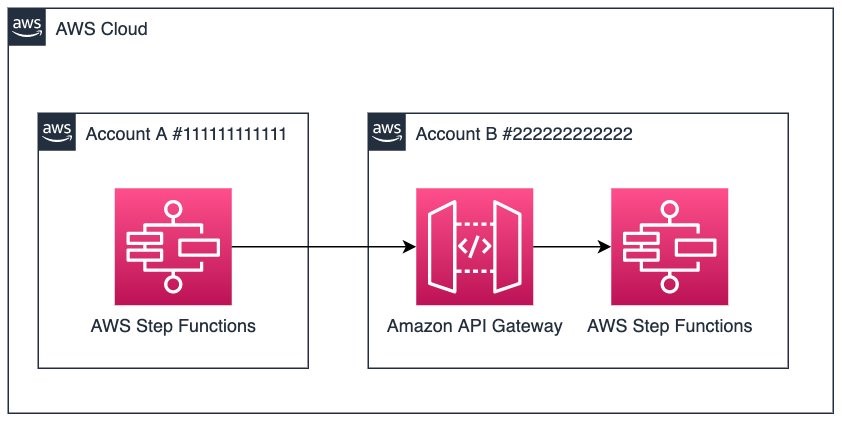
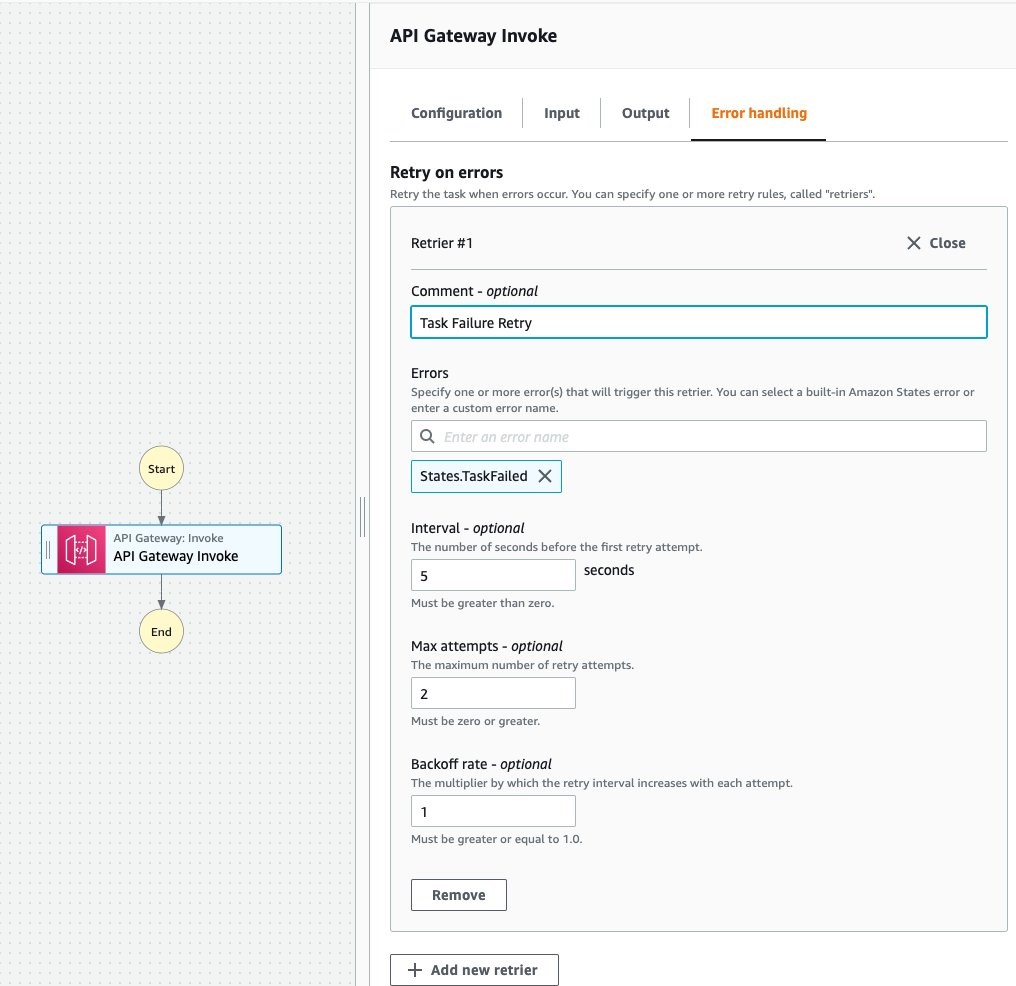
Mar 21 – Running cross-account workflows with AWS Step Functions and Amazon API Gateway
Mar 22 – Sending events to Amazon EventBridge from AWS Organizations accounts
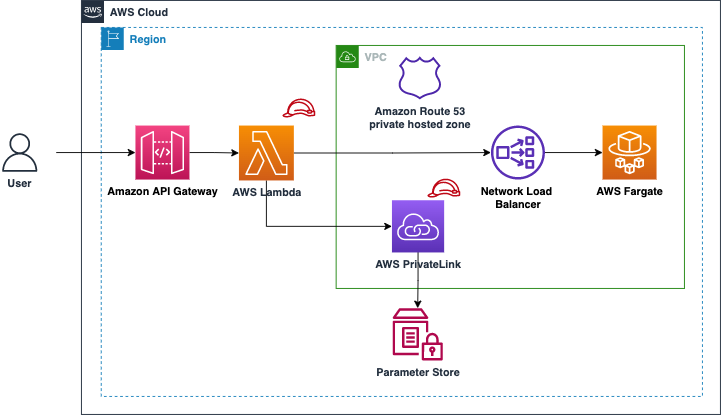
Mar 23 – Choosing the right solution for AWS Lambda external parameters
Mar 28 – Using larger ephemeral storage for AWS Lambda
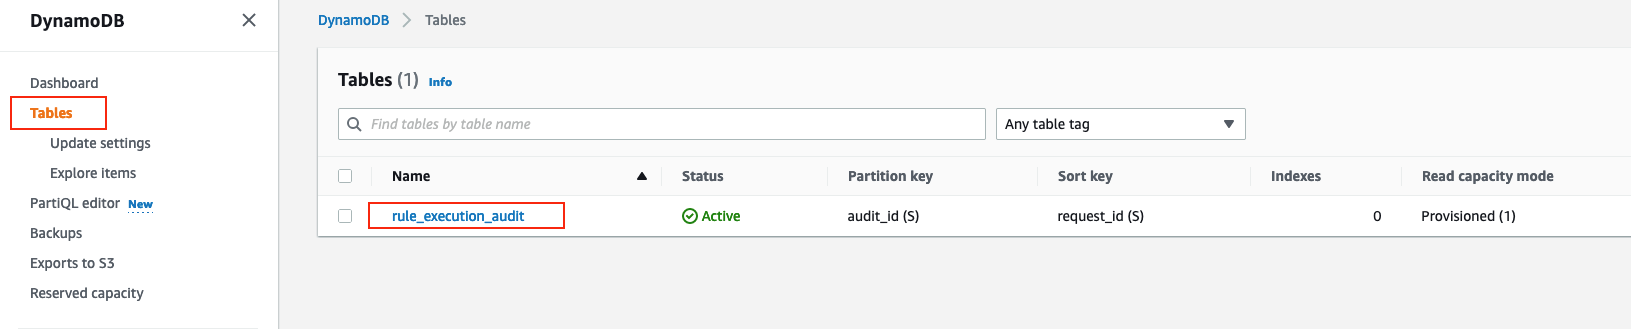
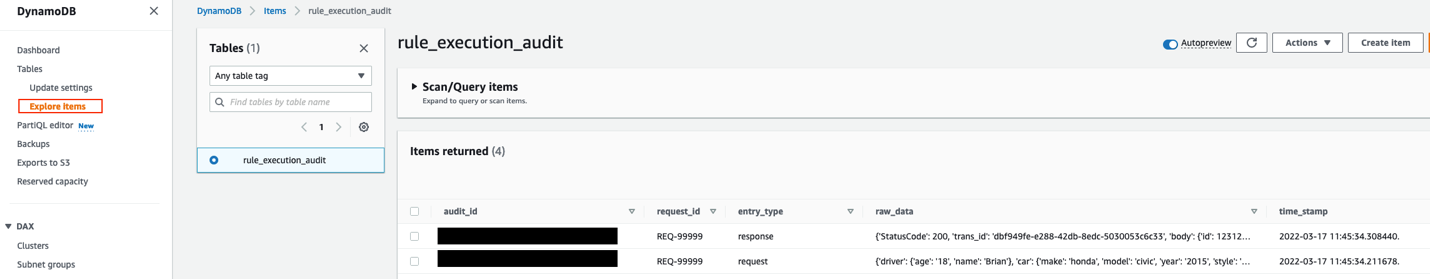
Mar 29 – Using AWS Step Functions and Amazon DynamoDB for business rules orchestration
Mar 31 – Optimizing AWS Lambda function performance for Java
First anniversary of Serverless Land Patterns

The DA team launched the Serverless Patterns Collection in March 2021 as a repository of serverless examples that demonstrate integrating two or more AWS services. Each pattern uses an infrastructure as code (IaC) framework to automate the deployment. These can simplify the creation and configuration of the services used in your applications.
The Serverless Patterns Collection is both an educational resource to help developers understand how to join different services, and an aid for developers that are getting started with building serverless applications.
The collection has just celebrated its first anniversary. It now contains 239 patterns for CDK, AWS SAM, Serverless Framework, and Terraform, covering 30 AWS services. We have expanded example runtimes to include .NET, Java, Rust, Python, Node.js and TypeScript. We’ve served tens of thousands of developers in the first year and we’re just getting started.
Many thanks to our contributors and community. You can also contribute your own patterns.
Videos
Serverless Office Hours – Tues 10 AM PT
Weekly live virtual office hours. In each session we talk about a specific topic or technology related to serverless and open it up to helping you with your real serverless challenges and issues. Ask us anything you want about serverless technologies and applications.
YouTube: youtube.com/serverlessland
Twitch: twitch.tv/aws
January
- Jan 4 – Serverless Office Hours: The re:Invent serverless re:Cap
- Jan 11 – Serverless Office Hours: AWS Lambda – Lambda Powertools
- Jan 18 – Serverless Office Hours: AWS Lambda – Event source filtering
- Jan 25 – Serverless Office Hours: AWS AppSync – New features!
February
- Feb 1 – Serverless Office Hours: Amazon EventBridge – Tooling!
- Feb 8 – Serverless Office Hours: AWS Step Functions Local mocking service integrations
- Feb 15 – Amazon AppFlow custom connector SDK
- Feb 22 – Serverless Office Hours | Getting started with Amazon DynamoDB and AWS Lambda
March
- Mar 1 – Serverless Office Hours | Using the new .NET 6.0 runtime in AWS Lambda
- Mar 8 – Serverless Office Hours | Introducing AWS Amplify Studio
- Mar 15 – Serverless Office Hours | TypeScript and AWS SAM
- Mar 22 – Serverless Office Hours | Serverless security best practices
- Mar 29 – Serverless Office Hours | AWS Lambda larger ephemeral storage
FooBar Serverless YouTube channel
The Developer Advocate team is delighted to welcome Marcia Villalba onboard. Marcia was an AWS Serverless Hero before joining AWS over two years ago, and she has created one of the most popular serverless YouTube channels. You can view all of Marcia’s videos at https://www.youtube.com/c/FooBar_codes.
January
- Jan 6 – KINESIS DATA STREAM ON-DEMAND – Now your Kinesis streams are totally serverless!
- Jan 13 – AWS Amplify Studio – Supports Importing Figma Designs and Converting them to REACT!
- Jan 20 – Filtering events before the LAMBDA function starts! SAVE time and money
- Jan 27 – DynamoDB new table class! And a nice demo with TTLs and Streams
February
- Feb 3 – What to DO when a MESSAGE FAILS PROCESSING? SQS Dead Letter Queues and SQS DLQ redrive
- Feb 10 – UNIT TEST your Step Functions with the Mocked Service Integrations
- Feb 17 – Serverlesspresso – A demo using EventBridge, Step Functions and more!
- Feb 24 – MUST HAVE Visual Studio Code Extensions as a SERVERLESS developer!
March
- Mar 3 – How to DESIGN EVENT-DRIVEN applications! The best method for production applications!
- Mar 10 – Centralize all your EVENTS of your EVENT-DRIVEN applications – Amazon EventBridge
- Mar 17 – Feature Flags for Lambda, using AWS AppConfig
- Mar 24 – Innovation and leadership at AWS – Customer obsession and simplicity
- Mar 31 – Managing dependencies using AWS Lambda Layers with Node.js and AWS SAM
AWS Summits
AWS Global Summits are free events that bring the cloud computing community together to connect, collaborate, and learn about AWS. This year, we have restarted in-person Summits at major cities around the world.
The next 4 Summits planned are Paris (April 12), San Francisco (April 20-21), London (April 27), and Madrid (May 4-5). To find and register for your nearest AWS Summit, visit the AWS Summits homepage.
Still looking for more?
The Serverless landing page has more information. The Lambda resources page contains case studies, webinars, whitepapers, customer stories, reference architectures, and even more Getting Started tutorials.
You can also follow the Serverless Developer Advocacy team on Twitter to see the latest news, follow conversations, and interact with the team.
- Eric Johnson: @edjgeek
- James Beswick: @jbesw
- Ben Smith: @benjamin_l_s
- Julian Wood: @julian_wood
- Talia Nassi: @talia_nassi
- Marcia Villalba: @mavi888uy