AWS Lambda is an on-demand compute service that powers many serverless applications. Lambda functions are ephemeral, with execution environments only existing for a brief time when the function is invoked. Many compute operations need access to external data for a variety of purposes. This includes importing third-party libraries, accessing machine learning models, or exporting the output of the compute operation.
Lambda provides a comprehensive range of storage options to meet the needs of web application developers. These include other AWS services such as Amazon S3 and Amazon EFS. There are also native storage options available, such as temporary storage or Lambda layers. In this blog post, I explain the differences between these options, and discuss common use-cases to help you choose for your own applications.
Amazon S3 is an object storage service that scales elastically. It offers high availability and 11 9’s of durability. The service is ideal for storing unstructured data. This includes binary data, such as images or media, log files and sensor data.
There are certain characteristics of S3 object storage that are important to remember. While S3 objects can be versioned, you cannot append data as you could in a file system. You have to store an entirely new version of an object. S3 also has a flat storage hierarchy that’s different to a file system. Instead of directories, you use folders to logically organize objects, by prefixing ‘foldername/’ in the key name.
S3 has important event integrations for serverless developers. It has a native integration with Lambda, which allows you to invoke a function in response to an S3 event. This can provide a scalable way to trigger application workflows when objects are created or deleted in S3. In the Happy Path application, the image-processing workflows are initiated by this event integration. To learn more about using S3 to trigger automated serverless workflows, visit the learning path.
S3 is often an important repository for an organization’s data lake. If your application writes data to S3 buckets, this can be a useful staging area for downstream processing. For analytics workloads, you can use AWS Glue to perform extract, transform, and loan (ETL) operations. To create ad hoc visualizations and business analysis reports, Amazon QuickSight can connect to your S3 buckets and produce interactive dashboards. To learn how to build business intelligence dashboards for your web application, visit the Innovator Island workshop.
S3 also provides object lifecycle management. This allows you to automatically change storage classes when certain conditions are met. For example, an application for uploading expenses could automatically archive PDFs after 1 year to Amazon S3 Glacier to reduce storage costs. In the Happy Path application, the original high-resolution uploads are stored in a separate bucket from the optimized distribution assets. To reduce storage costs, lifecycle management could be configured to automatically delete these original photo assets after 30 days.
Temporary storage with /tmp
The Lambda execution environment provides a file system for your code to use at /tmp. This space has a fixed size of 512 MB. The same Lambda execution environment may be reused by multiple Lambda invocations to optimize performance. The /tmp area is preserved for the lifetime of the execution environment and provides a transient cache for data between invocations. Each time a new execution environment is created, this area is deleted.
Consequently, this is intended as an ephemeral storage area. While functions may cache data here between invocations, it should be used only for data needed by code in a single invocation. It’s not a place to store data permanently, and is better-used to support operations required by your code.
Operationally, working with files in /tmp is the same as your local hard disk, and offers fast I/O throughput. For example, to unzip a file into this space in Python, use:
import os, zipfile
os.chdir('/tmp')
with zipfile.ZipFile(myzipfile, 'r') as zip:
zip.extractall()
Lambda layers
Your Lambda functions may use additional libraries as part of the deployment package. You can bundle these in the deployment archive or optionally move to a layer instead. A Lambda function can have up to five layers, and is subject to the maximum deployment size of 50 MB (zipped). Packages in layers are available in the /opt directory during invocations. While layers are private to you by default, you can also share layers with other AWS accounts, or make layers public.
There are many benefits to using layers throughout the functions in your serverless application. It’s best practice to include the AWS SDK instead of depending on the version bundled with the Lambda service. This enables you to pin the version of the SDK. By using a layer, you don’t need to bundle the package with each function, which can increase your deployment package size and slow down deployments. You can create an AWS SDK layer and then include a reference to the layer in each function.
Layers can be an effective way to bundle large dependencies, or share compiled libraries with binaries that vary by operating system. For example, the Happy Path application uses the Sharp npm graphics library to process images. Similarly, the Innovator Island workshop uses the OpenCV library to perform image manipulation, and this is imported using a shared layer.
Layers are static once they are deployed. You can only change the contents of a layer by deploying a new version. Any Lambda function using the layer binds to a specific version and must be updated to change layer versions. To learn more, see using Lambda layers to simplify your development process.
Amazon EFS for Lambda
Amazon EFS is a fully managed, elastic, shared file system that integrates with other AWS services. It is durable storage option that offers high availability. You can now mount EFS volumes in Lambda functions, which makes it simpler to share data across invocations. The file system grows and shrinks as you add or delete data, so you do not need to manage storage limits.
The Lambda service mounts EFS file systems when the execution environment is prepared. This happens in parallel with other initialization operations so typically does not impact cold start latency. If the execution environment is warm from previous invocations, the mount is already prepared. To use EFS, your Lambda function must be in the same VPC as the file system.
EFS enables new capabilities for serverless applications. The file system is a dynamic binding for Lambda functions, unlike layers. This makes it useful for deploying code libraries where you want to always use the latest version. You configure the mount path when integrating the file system with your function, and then include packages from this location. Additionally, you can use this to include packages that exceed the limits of layers.
Due to its speed and support of standard file operations, EFS is also useful for ingesting or writing large numbers files durably. This can be helpful for zipping or unzipping large archives, for example. For appending to existing files, EFS is also a preferred option to using S3.
Lambda is a flexible, on-demand compute service for serverless application. It supports a wide variety of workloads by providing a number of different data storage options.
In this post, I compare the capabilities and use-cases of S3, EFS, Lambda layers, and temporary storage for Lambda functions. There are benefits to each approach, as each type has different behaviors and characteristics. For web application developers, these storage types support different operations depending upon the needs of your serverless backend.
As the newest integration with Lambda, EFS now enables new workloads and capabilities. This includes sharing large code packages with Lambda, or durably operating on large numbers of files. It also opens up new possibilities for developers working on deep learning inference models.
This post is courtesy of Christian Mueller, Principal Solutions Architect.
Developers increasingly adopt event-driven architectures to decouple their distributed applications. Often, these events must be propagated in a strictly ordered manner to all subscribed applications. Using Amazon SNS FIFO topics and Amazon SQS FIFO queues, you can address use cases that require end-to-end message ordering, deduplication, filtering, and encryption.
In this blog post, I introduce a sample event-driven architecture. I walk through an implementation based on Amazon SNS FIFO topics and Amazon SQS FIFO queues.
Common requirements in event-driven-architectures
In event-driven architectures, data consistency is a common business requirement. This is often translated into technical requirements such as zero message loss and strict message ordering. For example, if you update your domain object rapidly, you want to be sure that all events are received by each subscriber in exactly the order they occurred. This way, the current domain object state is what each subscriber received as the latest update event. Similarly, all update events should be received after the initial create event.
Before Amazon SNS FIFO, architects had to design applications to check if messages are received out of order before processing.
Another common challenge is preventing message duplicates when sending events to the messaging service. If an event publisher receives an error, such as a network timeout, the publisher does not know if the messaging service could receive and successfully process the message or not.
The client may retry, as this is the default behavior for some HTTP response codes in AWS SDKs. This can cause duplicate messages.
Before Amazon SNS FIFO, developers had to design receivers to be idempotent. In some cases, where the event cannot be idempotent, this requires the receiver to be implemented in an idempotent way. Often, this is done by adding a key-value store like Amazon DynamoDB or Amazon ElastiCache for Redis to the service. Using this approach, the receiver can track if the event has been seen before.
Exploring the recruiting agency example
This sample application models a recruitment agency with a job listings website. The application is composed of multiple services. I explain 3 of them in more detail.
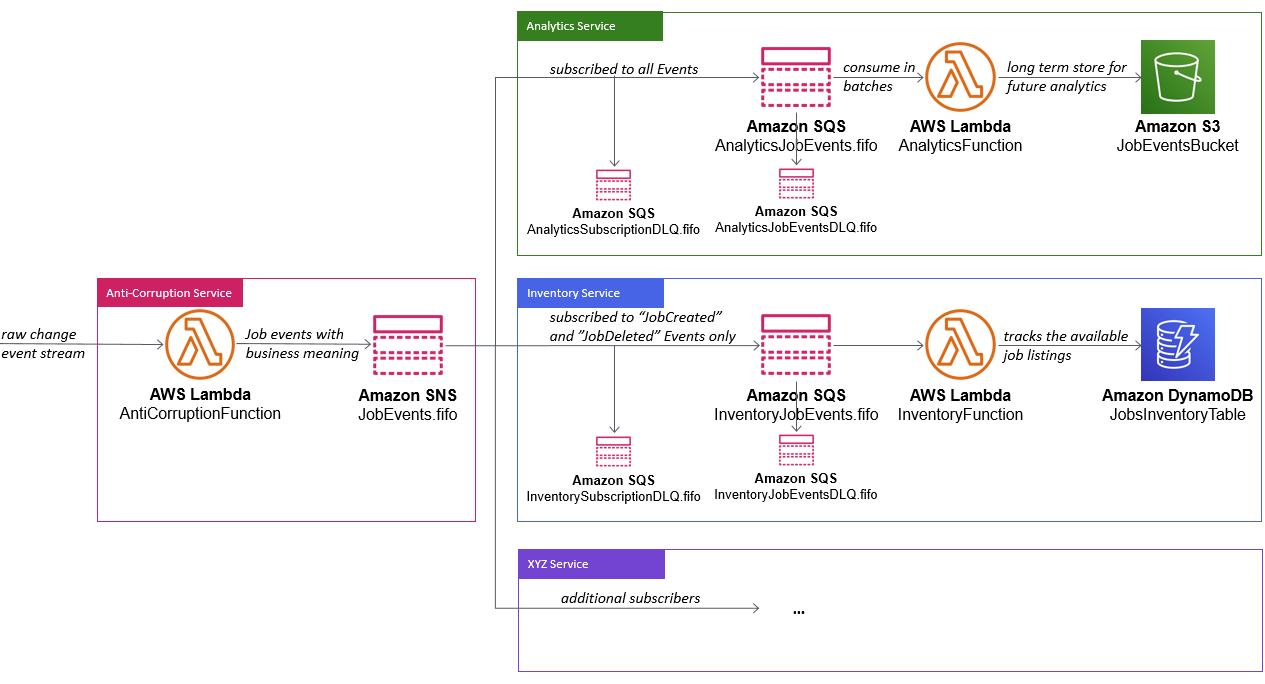
A custom service, the anti-corruption service, receives a change data capture (CDC) event stream of changes from a relational database. This service translates the low-level technical database events into meaningful business events for the domain services for easy consumption. These business events are sent to the SNS FIFO “JobEvents.fifo“ topic. Here, interested services subscribe to these events and process them asynchronously.
In this domain, the analytics service is interested in all events. It has an SQS FIFO “AnalyticsJobEvents.fifo” queue subscribed to the SNS FIFO “JobEvents.fifo“ topic. It uses SQS FIFO as event source for AWS Lambda, which processes and stores these events in Amazon S3. S3 is object storage service with high scalability, data availability, durability, security, and performance. This allows you to use services like Amazon EMR, AWS Glue or Amazon Athena to get insights into your data to extract value.
The inventory service owns an SQS FIFO “InventoryJobEvents.fifo” queue, which is subscribed to the SNS FIFO “JobEvents.fifo“ topic. It is only interested in “JobCreated” and “JobDeleted” events, as it only tracks which jobs are currently available and stores this information in a DynamoDB table. Therefore, it uses an SNS filter policy to only receive these events, instead of receiving all events.
This sample application focuses on the SNS FIFO capabilities, so I do not explore other services subscribed to the SNS FIFO topic. This sample follows the SQS best practices and SNS redrive policy recommendations and configures dead-letter queues (DLQ). This is useful in case SNS cannot deliver an event to the subscribed SQS queue. It also helps if the function fails to process an event from the corresponding SQS FIFO queue multiple times. As a requirement in both cases, the attached SQS DLQ must be an SQS FIFO queue.
To get started, clone the “event-driven-architecture-with-sns-fifo” repository, from here. Alternatively, download the repository as a ZIP file from here and extract it to a directory of your choice.
As a prerequisite, you must have SAM CLI, Python 3, and PIP installed. You must also have the AWS CLI configured properly.
Navigate to the root directory of this project and build the application with SAM. SAM downloads required dependencies and stores them locally. Execute the following commands in your terminal:
git clone https://github.com/aws-samples/event-driven-architecture-with-amazon-sns-fifo.git
cd event-driven-architecture-with-amazon-sns-fifo
sam build
You see the following output:
Now, deploy the application:
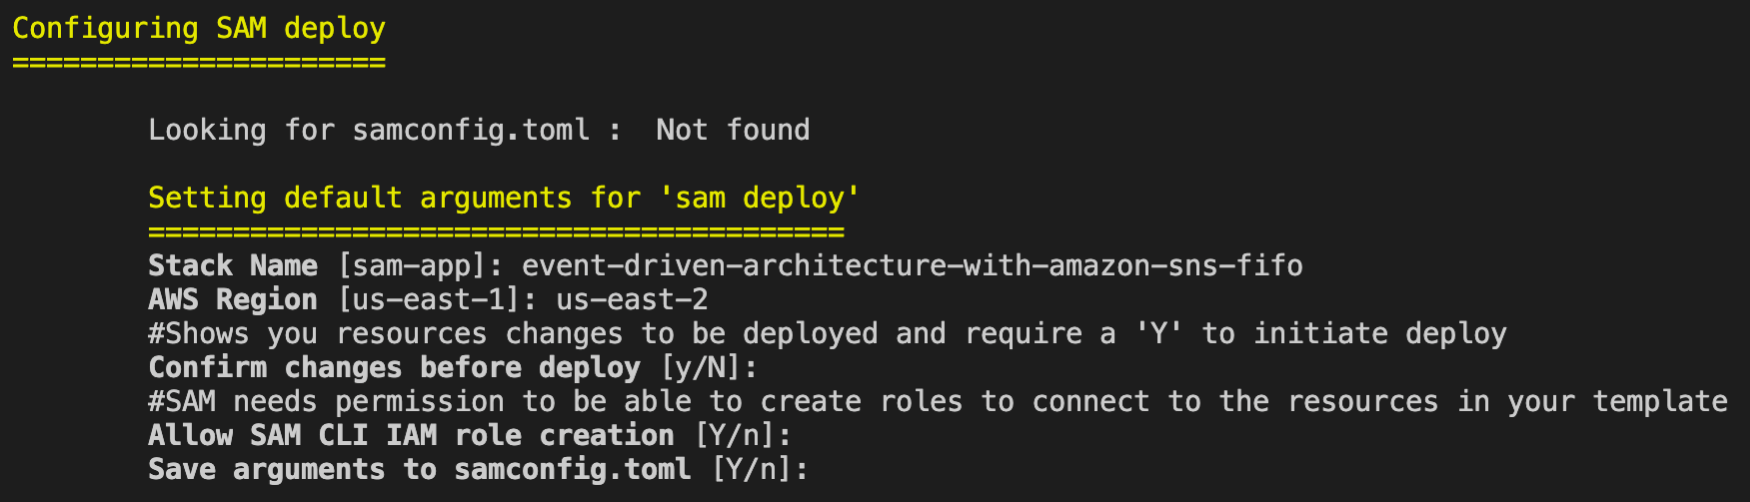
sam deploy --guided
Provide arguments for the deployments, such as the stack name and preferred AWS Region:
After a successful deployment, you see the following output:
Learning more about the implementation
I explore the three services forming this sample application, and how they use the features of SNS FIFO.
Anti-corruption service
The anti-corruption service owns the SNS FIFO “JobEvents.fifo” topic, where it publishes business events related to job postings. It uses an SNS FIFO topic, as end-to-end ordering per job ID is required. SNS FIFO is configured not to perform content-based deduplication, as I require a unique message deduplication ID for each event for deduplication. The corresponding definition in the SAM template looks like this:
For simplicity, the anti-corruption function in the sample application doesn’t consume an external database CDC stream. It uses Amazon CloudWatch Events as an event source to trigger the function every minute.
I provide the SNS FIFO topic Amazon Resource Name (ARN) as an environment variable in the function. This makes this function more portable to deploy in different environments and stages. The function’s AWS Identity and Access Management (IAM) policy grants permissions to publish messages to only this SNS topic:
The anti-corruption function uses features in the SNS publish API, which allows you to define a “MessageDeduplicationId” and a “MessageGroupId”. The “MessageDeduplicationId” is used to filter out duplicate messages, which are sent to SNS FIFO within in 5-minute deduplication interval. The “MessageGroupId” is required, as SNS FIFO processes all job events for the same message group in a strictly ordered manner, isolated from other message groups processed through the same topic.
Another important aspect in this implementation is the use of “MessageAttributes”. We define a message attribute with the name “eventType” and values like “JobCreated”, “JobSalaryUpdated”, and “JobDeleted”. This allows subscribers to define SNS filter policies to only receive certain events they are interested in:
The analytics service owns an SQS FIFO “AnalyticsJobEvents.fifo” queue which is subscribed to the SNS FIFO “JobEvents.fifo” topic. Following best practices, I define redrive policies for the SQS FIFO queue and the SNS FIFO subscription in the template:
The analytics function uses SQS FIFO as an event source for Lambda. The S3 bucket name is an environment variable for the function, which increases the code portability across environments and stages. The IAM policy for this function only grants permissions write objects to this S3 bucket:
View the function implementation at the GitHub repo.
Inventory service
The inventory service also owns an SQS FIFO “InventoryJobEvents.fifo” queue which is subscribed to the SNS FIFO “JobEvents.fifo” topic. It uses redrive policies for the SQS FIFO queue and the SNS FIFO subscription as well. This service is only interested in certain events, so uses an SNS filter policy to specify these events:
The inventory function also uses SQS FIFO as event source for Lambda. The DynamoDB table name is set as an environment variable, so the function can look up the name during initialization. The IAM policy grants read/write permissions for only this table:
View the function implementation at the GitHub repo.
Conclusion
Amazon SNS FIFO topics can simplify the design of event-driven architectures and reduce custom code in building such applications.
By using the native integration with Amazon SQS FIFO queues, you can also build architectures that fan out to thousands of subscribers. This pattern helps achieve data consistency, deduplication, filtering, and encryption in near real time, using managed services.
Web application backends are one of the most frequent types of serverless use-case for customers. The pay-for-value model can make it cost-efficient to build web applications using serverless tools.
While serverless cost is generally correlated with level of usage, there are architectural decisions that impact cost efficiency. The impact of these choices is more significant as your traffic grows, so it’s important to consider the cost-effectiveness of different designs and patterns.
This blog post reviews some common areas in web applications where you may be able to optimize cost. It uses the Happy Path web application as a reference example, which you can read about in the introductory blog post.
Serverless web applications generally use a combination of the services in the following diagram. I cover each of these areas to highlight common areas for cost optimization.
The API management layer: Selecting the right API type
Most serverless web applications use an API between the frontend client and the backend architecture. Amazon API Gateway is a common choice since it is a fully managed service that scales automatically. There are three types of API offered by the service – REST APIs, WebSocket APIs, and the more recent HTTP APIs.
HTTP APIs offer many of the features in the REST APIs service, but the cost is often around 70% less. It supports Lambda service integration, JWT authorization, CORS, and custom domain names. It also has a simpler deployment model than REST APIs. This feature set tends to work well for web applications, many of which mainly use these capabilities. Additionally, HTTP APIs will gain feature parity with REST APIs over time.
The Happy Path application is designed for 100,000 monthly active users. It uses HTTP APIs, and you can inspect the backend/template.yaml to see how to define these in the AWS Serverless Application Model (AWS SAM). If you have existing AWS SAM templates that are using REST APIs, in many cases you can change these easily:
Content distribution layer: Optimizing assets
Amazon CloudFront is a content delivery network (CDN). It enables you to distribute content globally across 216 Points of Presence without deploying or managing any infrastructure. It reduces latency for users who are geographically dispersed and can also reduce load on other parts of your service.
A typical web application uses CDNs in a couple of different ways. First, there is the distribution of the application itself. For single-page application frameworks like React or Vue.js, the build processes create static assets that are ideal for serving over a CDN.
However, these builds may not be optimized and can be larger than necessary. Many frameworks offer optimization plugins, and the JavaScript community frequently uses Webpack to bundle modules and shrink deployment packages. Similarly, any media assets used in the application build should be optimized. You can use tools like Lighthouse to analyze your web apps to find images that can be resized or compressed.
The second common CDN use-case for web apps is for user-generated content (UGC). Many apps allow users to upload images, which are then shared with other users. A typical photo from a 12-megapixel smartphone is 3–9 MB in size. This high resolution is not necessary when photos are rendered within web apps. Displaying the high-resolution asset results in slower download performance and higher data transfer costs.
The Happy Path application uses a Resizer Lambda function to optimize these uploaded assets. This process creates two different optimized images depending upon which component loads the asset.
The upload S3 bucket shows the original size of the upload from the smartphone:
The distribution S3 bucket contains the two optimized images at different sizes:
The distribution file sizes are 98–99% smaller. For a busy web application, using optimized image assets can make a significant difference to data transfer and CloudFront costs.
Additionally, you can convert to highly optimized file formats such as WebP to reduce file size even further. Not all browsers support this format, but you can use CSS on the frontend to fall back to other types if needed:
AWS offers many different database and storage options that can be useful for web applications. Billing models vary by service and Region. By understanding the data access and storage requirements of your app, you can make informed decisions about the right service to use.
Generally, it’s more cost-effective to store binary data in S3 than a database. First, when the data is uploaded, you can upload directly to S3 with presigned URLs instead of proxying data via API Gateway or another service.
If you are using Amazon DynamoDB, it’s best practice to store larger items in S3 and include a reference token in a table item. Part of DynamoDB pricing is based on read capacity units (RCUs). For binary items such as images, it is usually more cost-efficient to use S3 for storage.
Many web developers who are new to serverless are familiar with using a relational database, so choose Amazon RDS for their database needs. Depending upon your use-case and data access patterns, it may be more cost effective to use DynamoDB instead. RDS is not a serverless service so there are monthly charges for the underlying compute instance. DynamoDB pricing is based upon usage and storage, so for many web apps may be a lower-cost choice.
Integration layer
This layer includes services like Amazon SQS, Amazon SNS, and Amazon EventBridge, which are essential for decoupling serverless applications. Each of these have a request-based pricing component, where 64 KB of a payload is billed as one request. For example, a single SQS message with a 256 KB payload is billed as four requests. There are two optimization methods common for web applications.
1. Combine messages
Many messages sent to these services are much smaller than 64 KB. In some applications, the publishing service can combine multiple messages to reduce the total number of publish actions to SNS. Additionally, by either eliminating unused attributes in the message or compressing the message, you can store more data in a single request.
For example, a publishing service may be able to combine multiple messages together in a single publish action to an SNS topic:
Before optimization, a publishing service sends 100,000,000 1KB-messages to an SNS topic. This is charged as 100 million messages for a total cost of $50.00.
After optimization, the publishing service combines messages to send 1,562,500 64KB-messages to an SNS topic. This is charged as 1,562,500 messages for a total cost of $0.78.
2. Filter messages
In many applications, not every message is useful for a consuming service. For example, an SNS topic may publish to a Lambda function, which checks the content and discards the message based on some criteria. In this case, it’s more cost effective to use the native filtering capabilities of SNS. The service can filter messages and only invoke the Lambda function if the criteria is met. This lowers the compute cost by only invoking Lambda when necessary.
For example, an SNS topic receives messages about customer orders and forwards these to a Lambda function subscriber. The function is only interested in canceled orders and discards all other messages:
Before optimization, the SNS topic sends all messages to a Lambda function. It evaluates the message for the presence of an order canceled attribute. On average, only 25% of the messages are processed further. While SNS does not charge for delivery to Lambda functions, you are charged each time the Lambda service is invoked, for 100% of the messages.
After optimization, using an SNS subscription filter policy, the SNS subscription filters for canceled orders and only forwards matching messages. Since the Lambda function is only invoked for 25% of the messages, this may reduce the total compute cost by up to 75%.
3. Choose a different messaging service
For complex filtering options based upon matching patterns, you can use EventBridge. The service can filter messages based upon prefix matching, numeric matching, and other patterns, combining several rules into a single filter. You can create branching logic within the EventBridge rule to invoke downstream targets.
EventBridge offers a broader range of targets than SNS destinations. In cases where you publish from an SNS topic to a Lambda function to invoke an EventBridge target, you could use EventBridge instead and eliminate the Lambda invocation. For example, instead of routing from SNS to Lambda to AWS Step Functions, instead create an EventBridge rule that routes events directly to a state machine.
Business logic layer
Step Functions allows you to orchestrate complex workflows in serverless applications while eliminating common boilerplate code. The Standard Workflow service charges per state transition. Express Workflows were introduced in December 2019, with pricing based on requests and duration, instead of transitions.
For workloads that are processing large numbers of events in shorter durations, Express Workflows can be more cost-effective. This is designed for high-volume event workloads, such as streaming data processing or IoT data ingestion. For these cases, compare the cost of the two workflow types to see if you can reduce cost by switching across.
Lambda is the on-demand compute layer in serverless applications, which is billed by requests and GB-seconds. GB-seconds is calculated by multiplying duration in seconds by memory allocated to the function. For a function with a 1-second duration, invoked 1 million times, here is how memory allocation affects the total cost in the US East (N. Virginia) Region:
Memory (MB)
GB/S
Compute cost
Total cost
128
125,000
$ 2.08
$ 2.28
512
500,000
$ 8.34
$ 8.54
1024
1,000,000
$ 16.67
$ 16.87
1536
1,500,000
$ 25.01
$ 25.21
2048
2,000,000
$ 33.34
$ 33.54
3008
2,937,500
$ 48.97
$ 49.17
There are many ways to optimize Lambda functions, but one of the most important choices is memory allocation. You can choose between 128 MB and 3008 MB, but this also impacts the amount of virtual CPU as memory increases. Since total cost is a combination of memory and duration, choosing more memory can often reduce duration and lower overall cost.
Instead of manually setting the memory for a Lambda function and running executions to compare duration, you can use the AWS Lambda Power Tuning tool. This uses Step Functions to run your function against varying memory configurations. It can produce a visualization to find the optimal memory setting, based upon cost or execution time.
Conclusion
Web application backends are one of the most popular workload types for serverless applications. The pay-per-value model works well for this type of workload. As traffic grows, it’s important to consider the design choices and service configurations used to optimize your cost.
Serverless web applications generally use a common range of services, which you can logically split into different layers. This post examines each layer and suggests common cost optimizations helpful for web app developers.
Welcome to the 11th edition of the AWS Serverless ICYMI (in case you missed it) quarterly recap. Every quarter, we share all of the most recent product launches, feature enhancements, blog posts, webinars, Twitch live streams, and other interesting things that you might have missed!
In case you missed our last ICYMI, checkout what happened last quarter here.
AWS Lambda
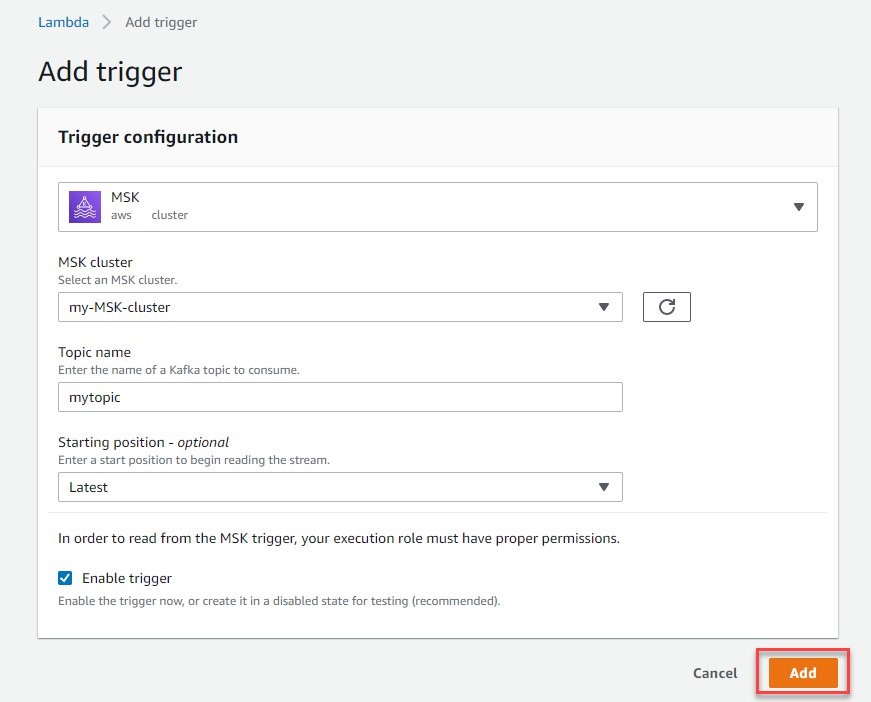
In August, we launched support for using Amazon Managed Streaming for Apache Kafka (Amazon MSK) as an event source for Lambda functions. Lambda has existing support for processing streams from Kinesis and DynamoDB. Now you can process data streams from Amazon MSK and easily integrate with downstream serverless workflows. This integration allows you to process batches of records, one per partition at a time, and scale concurrency by increasing the number of partitions in a topic.
We also announced support for Java 8 (Corretto) in Lambda, and you can now use Amazon Linux 2 for custom runtimes. Amazon Linux 2 is the latest generation of Amazon Linux and provides an application environment with access to the latest innovations in the Linux ecosystem.
Amazon API Gateway
API Gateway continued to launch new features for HTTP APIs, including new integrations for five AWS services. HTTP APIs can now route requests to AWS AppConfig, Amazon EventBridge, Amazon Kinesis Data Streams, Amazon SQS, and AWS Step Functions. This makes it easy to create webhooks for business logic hosted in these services. The service also expanded the authorization capabilities, adding Lambda and IAM authorizers, and enabled wildcards in custom domain names. Over time, we will continue to improve and migrate features from REST APIs to HTTP APIs.
In September, we launched mutual TLS for both regional REST APIs and HTTP APIs. This is a new method for client-to-server authentication to enhance the security of your API. It can protect your data from exploits such as client spoofing or man-in-the-middle. This enforces two-way TLS (or mTLS) which enables certificate-based authentication both ways from client-to-server and server-to-client.
Enhanced observability variables now make it easier to troubleshoot each phase of an API request. Each phase from AWS WAF through to integration adds latency to a request, returns a status code, or raises an error. Developers can use these variables to identify the cause of latency within the API request. You can configure these variables in AWS SAM templates – see the demo application to see how you can use these variables in your own application.
AWS Step Functions
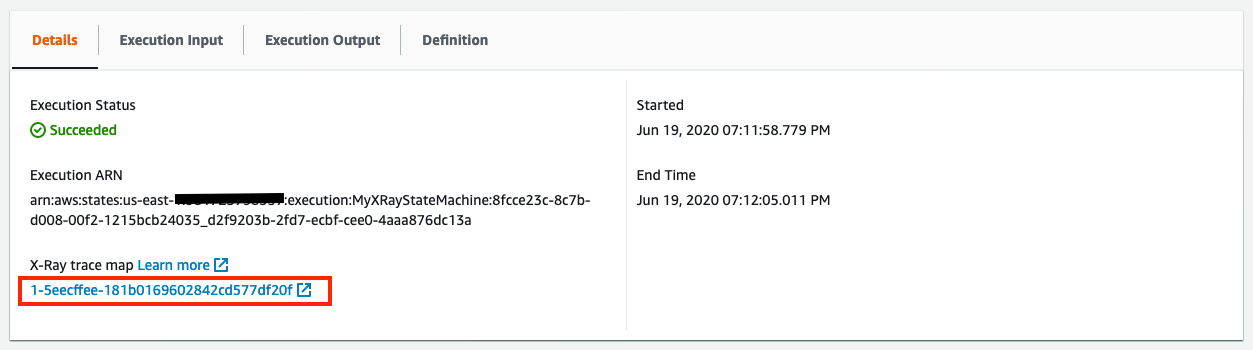
We added X-Ray tracing support for Step Functions workflows, giving you full visibility across state machine executions, making it easier to analyze and debug distributed applications. Using the service map view, you can visually identify errors in resources and view error rates across workflow executions. You can then drill into the root cause of an error. You can enable X-Ray in existing workflows by a single-click in the console. Additionally, you can now also visualize Step Functions workflows directly in the Lambda console. To see this new feature, open the Step Functions state machines page in the Lambda console.
Step Functions also increased the payload size to 256 KB and added support for string manipulation, new comparison operators, and improved output processing. These updates were made to the Amazon States Languages (ASL), which is a JSON-based language for defining state machines. The new operators include comparison operators, detecting the existence of a field, wildcarding, and comparing two input fields.
AWS Serverless Application Model (AWS SAM)
AWS SAM is an open source framework for building serverless applications that converts a shorthand syntax into CloudFormation resources.
In July, the AWS SAM CLI became generally available (GA). This tool operates on SAM templates and provides developers with local tooling for building serverless applications. The AWS SAM CLI offers a rich set of tools that enable developers to build serverless applications quickly.
AWS X-Ray
X-Ray launched a public preview of X-Ray Insights, which can help produce actionable insights for anomalies within your applications. Designed to make it easier to analyze and debug distributed applications, it can proactively identify issues caused by increases in faults. Using the incident timeline, you can visualize when the issue started and how it developed. The service identifies a probable root cause along with any anomalous services. There is no additional instrumentation needed to use X-Ray Insights – you can enable this feature within X-Ray Groups.
Amazon Kinesis
In July, Kinesis announced support for data delivery to generic HTTP endpoints, and service providers like Datadog, New Relic, MongoDB, and Splunk. Use the Amazon Kinesis console to configure your data producers to send data to Amazon Kinesis Data Firehose and specify one of these new delivery targets. Additionally, Amazon Kinesis Data Firehose is now available in the Europe (Milan) and Africa (Cape Town) AWS Regions.
Serverless Posts
Our team is always working to build and write content to help our customers better understand all our serverless offerings. Here is a list of the latest posts published to the AWS Compute Blog this quarter.
We hold several AWS Online Tech Talks covering serverless tech talks throughout the year, so look out for them in the Serverless section of the AWS Online Tech Talks page. We also regularly deliver talks at conferences and events around the globe, regularly join in on podcasts, and record short videos you can find to learn in quick byte sized chunks.
Ask Around Me is an example web app that shows how to build authenticaton, geohashing and real-time messaging into your serverless applications. This learning path includes videos and learning resources to help walk you through the application.
This five-video learning path walks you through the Innovator Island workshop, and provides learning resources for building realtime serverless web applications.
We’re pleased to welcome Angela Timofte, Luca Bianchi, Matthieu Napoli, Peter Hanssens, Sheen Brisals, and Tom McLaughlin to the growing list of AWS Serverless Heroes.
The AWS Hero program is a selection of worldwide experts that have been recognized for their positive impact within the community. They share helpful knowledge and organize events and user groups. They’re also contributors to numerous open-source projects in and around serverless technologies.
New! The Serverless Land website
To help developers find serverless learning resources, we have curated a list of serverless blogs, videos, events and training programs at a new site, Serverless Land. This is regularly updated with new information – you can subscribe to the RSS feed for automatic updates, follow the LinkedIn page or subscribe to the YouTube channel.
Still looking for more?
The Serverless landing page has lots of information. The Lambda resources page contains case studies, webinars, whitepapers, customer stories, reference architectures, and even more Getting Started tutorials.
You can also follow all of us on Twitter to see the latest news, follow conversations, and interact with the team.
Earlier this year, I went into the studio with Opher Dubrovsky from Nielsen Marketing Cloud (a data management platform) to record an episode of This is My Architecture about Big Data architecture.
In preparation for the recording and during my initial conversations with Opher, I realized that there is an amazing story here that can help a lot of developers and architects who are building, or thinking of building, serverless architecture.
Many of these builders aren’t sure if serverless can withstand the load they need, how the costs is going to look like, or how complicated and different it is from what they are familiar with, and they have countless more questions. Nielsen’s story is a great example of how you can take this technology, which I like so much, to the extreme.
Serverless Big Data?
There are many use cases for serverless architecture, such as web systems, use of IoT, connection to microservices via API, automation, and more. Using serverless for data processing is one of the earliest architectures, and serverless Big Data, whether it is for processing large-volume data streams or file processing, is a very common practice.
What surprised me about Nielsen’s story was the size and complexity of the solution. Nielsen’s system, called “DataOut,” is processing 250 billion events-per-day, which translates to 55 terabytes (TB) of data. The system can automatically scale up and down, thanks to the capabilities of serverless architecture, processing from 1TB to 6TB of data per hour, and costing “only” $1,000 per day. (If this sounds like a lot to you, think again about how much computing power it takes to process this amount of data and how much workforce time the system saves.)
What did we learn?
More and more organizations (small and large) are adopting serverless architecture-based solutions for their core systems. The technology has the ability to scale up (and down), reach a very large scale, and provide flexibility at a reasonable price. This is what makes this architecture, even in the world of Big Data, something worth considering when planning a new system or improving an existing one.
True, there are still challenges to be solved and knowledge to be gained as more and more developers use these solutions, but Nielsen’s story is just one of a series of solutions built for better scalability and mostly simpler to operate and maintain.
Spend 10 minutes with Opher and me in the below video to learn how Nielsen built a data processing machine without machines (kind of).
Today we’re announcing two new capabilities for Amazon EventBridge – dead letter queues and custom retry policies. Both of these give you greater flexibility in how to handle any failures in the processing of events with EventBridge. You can easily enable them on a per target basis and configure them uniquely for each.
Dead letter queues (DLQs) are a common capability in queuing and messaging systems that allow you to handle failures in event or message receiving systems. They provide a way for failed events or messages to be captured and sent to another system, which can store them for future processing. With DLQs, you can have greater resiliency and improved recovery from any failure that happens.
You can also now configure a custom retry policy that can be set on your event bus targets. Today, there are two attributes that can control how events are retried: maximum number of retries and maximum event age. With these two settings, you could send events to a DLQ sooner and reduce the retries attempted.
For example, this could allow you to recover more quickly if an event bus target is overwhelmed by the number of events received, causing throttling to occur. The events are placed in a DLQ and then processed later.
Failures in event processing
Currently, EventBridge can fail to deliver an event to a target in certain scenarios. Events that fail to be delivered to a target due to client-side errors are dropped immediately. Examples of this are when EventBridge does not have permission to a target AWS service or if the target no longer exists. This can happen if the target resource is misconfigured or is deleted by the resource owner.
For service-side issues, EventBridge retries delivery of events for up to 24 hours. This can happen if the target service is unavailable or the target resource is not provisioned to handle the incoming event traffic and the target service is throttling the requests.
EventBridge failures
Previously, when all attempts to deliver an event to the target were exhausted, EventBridge published a CloudWatch metric indicating a failed target invocation. However, this provides no visibility into which events failed to be delivered and there was no way to recover the event that failed.
Dead letter queues
EventBridge’s DLQs are made possible today with Amazon Simple Queue Service (SQS) standard queues. With SQS, you get all of the benefits of a fully serverless queuing service: no servers to manage, automatic scalability, pay for what you consume, and high availability and security built in. You can configure the DLQs for your EventBridge bus and pay nothing until it is used, if and when a target experiences an issue. This makes it a great practice to follow and standardize on, and provides you with a safety net that’s active only when needed.
Optionally, you could later configure an AWS Lambda function to consume from that DLQ. The function is only invoked when messages exist in the queue, allowing you to maintain a serverless stack to recover from a potential failure.
DLQ configured per target
With DLQ configured, the queue receives the event that failed in the message with important metadata that you can use to troubleshoot the issue. This can include: Error Code, Error Message, Exhausted Retry Condition, Retry Attempts, Rule ARN, and the Target ARN.
You can use this data to more easily troubleshoot what went wrong with the original delivery attempt and take action to resolve or prevent such failures in the future. You could also use the information such as Exhausted Retry Condition and Retry Attempts to further tweak your custom retry policy.
You can configure a DLQ when creating or updating rules via the AWS Management Console and AWS Command Line Interface (AWS CLI). You can also use infrastructure as code (IaC) tools such as AWS CloudFormation.
In the console, select the queue to be used for your DLQ configuration from the drop-down as shown here:
DLQ configuration
When configured via API, AWS CLI, or IaC tools, you must specify the ARN of the queue:
When you configure a DLQ, the target SQS queue requires a resource-based policy that grants EventBridge access. One is created and applied automatically via the console when you create or update an EventBridge rule with a DLQ that exists in your own account.
For any queues created in other accounts, or via API, AWS CLI, or IaC tools, you must add a policy that allows SQS’s SendMessage permission to the EventBridge rule ARN, as shown below:
Once configured, you can monitor CloudWatch metrics for the DLQ queue. This shows both the successful delivery of messages via the InvocationsSentToDLQ metric, in addition to any failures via the InvocationsFailedToBeSentToDLQ. Note that these metrics do not exist if your queue is not considered “active”.
Retry policies
By default, EventBridge retries delivery of an event to a target so long as it does not receive a client-side error as described earlier. Retries occur with a back-off, for up to 185 attempts or for up to 24 hours, after which the event is dropped or sent to a DLQ, if configured. Due to the jitter of the back-off and retry process you may reach the 24-hour limit before reaching 185 retries.
For many workloads, this provides an acceptable way to handle momentary service issues or throttling that might occur. For some however, this model of back-off and retry can cause increased and on-going traffic to an already overloaded target system.
For example, consider an Amazon API Gateway target that has a resource constrained backend service behind it.
Constrained target service
Under a consistently high load, the bus could end up generating too many API requests, tripping the API Gateway’s throttling configuration. This would cause API Gateway to respond with throttling errors back to EventBridge.
Throttled API reply
You may decide that allowing the failed events to retry for 24 hours puts too much load into this system and it may not properly recover from the load. This could lead to potential data loss unless a DLQ was configured.
Added DLQ
With a DLQ, you could choose to process these events later, once the overwhelmed target service has recovered.
DLQ drained back to API
Or the events in question may no longer have the same value as they did previously. This can occur in systems where data loss is tolerated but the timeliness of data processing matters. In these situations, the DLQ would have less value and dropping the message is acceptable.
For either of these situations, configuring the maximum number of retries or the maximum age of the event could be useful.
Now with retry policies, you can configure per target the following two attributes:
MaximumEventAgeInSeconds: between 60 and 86400 seconds (86400, or 24 hours the default)
MaximumRetryAttempts: between 0 and 185 (185 is the default)
When either condition is met, the event fails. It’s then either dropped, which generates an increase to the FailedInvocations CloudWatch metric, or sent to a configured DLQ.
You can configure retry policy attributes when creating or updating rules via the AWS Management Console and AWS Command Line Interface (AWS CLI). You can also use infrastructure as code (IaC) tools such as AWS CloudFormation.
Retry policy
There is no additional cost for configuring either of these new capabilities. You only pay for the usage of the SQS standard queue configured as the dead letter queue during a failure and any application that handles the failed events. SQS pricing can be found here.
Conclusion
With dead letter queues and custom retry policies, you have improved handling and control over failure in distributed systems built with EventBridge. With DLQs you can capture failed events and then process them later, potentially saving yourself from data loss. With custom retry policies, you gain the improved ability to control the number of retries and for how long they can be retried.
I encourage you to explore how both of these new capabilities can help make your applications more resilient to failures, and to standardize on using them both in your infrastructure.
AWS Lambda is announcing a preview of Lambda Extensions, a new way to easily integrate Lambda with your favorite monitoring, observability, security, and governance tools. Extensions enable tools to integrate deeply into the Lambda execution environment to control and participate in Lambda’s lifecycle. This simplified experience makes it easier for you to use your preferred tools across your application portfolio today.
In this post I explain how Lambda extensions work, the changes to the Lambda lifecycle, and how to build an extension. To learn how to use extensions with your functions, see the companion blog post “Introducing AWS Lambda extensions”.
Extensions are built using the new Lambda Extensions API, which provides a way for tools to get greater control during function initialization, invocation, and shut down. This API builds on the existing Lambda Runtime API, which enables you to bring custom runtimes to Lambda.
You can use extensions from AWS, AWS Lambda Ready Partners, and open source projects for use-cases such as application performance monitoring, secrets management, configuration management, and vulnerability detection. You can also build your own extensions to integrate your own tooling using the Extensions API.
There are extensions available today for AppDynamics, Check Point, Datadog, Dynatrace, Epsagon, HashiCorp, Lumigo, New Relic, Thundra, Splunk, AWS AppConfig, and Amazon CloudWatch Lambda Insights. For more details on these, see “Introducing AWS Lambda extensions”.
The Lambda execution environment
Lambda functions run in a sandboxed environment called an execution environment. This isolates them from other functions and provides the resources, such as memory, specified in the function configuration.
Lambda automatically manages the lifecycle of compute resources so that you pay for value. Between function invocations, the Lambda service freezes the execution environment. It is thawed if the Lambda service needs the execution environment for subsequent invocations.
Previously, only the runtime process could influence the lifecycle of the execution environment. It would communicate with the Runtime API, which provides an HTTP API endpoint within the execution environment to communicate with the Lambda service.
Lambda and Runtime API
The runtime uses the API to request invocation events from Lambda and deliver them to the function code. It then informs the Lambda service when it has completed processing an event. The Lambda service then freezes the execution environment.
The runtime process previously exposed two distinct phases in the lifecycle of the Lambda execution environment: Init and Invoke.
1. Init: During the Init phase, the Lambda service initializes the runtime, and then runs the function initialization code (the code outside the main handler). The Init phase happens either during the first invocation, or in advance if Provisioned Concurrency is enabled.
2. Invoke: During the invoke phase, the runtime requests an invocation event from the Lambda service via the Runtime API, and invokes the function handler. It then returns the function response to the Runtime API.
After the function runs, the Lambda service freezes the execution environment and maintains it for some time in anticipation of another function invocation.
If the Lambda function does not receive any invokes for a period of time, the Lambda service shuts down and removes the environment.
Previous Lambda lifecycle
With the addition of the Extensions API, extensions can now influence, control, and participate in the lifecycle of the execution environment. They can use the Extensions API to influence when the Lambda service freezes the execution environment.
AWS Lambda execution environment with the Extensions API
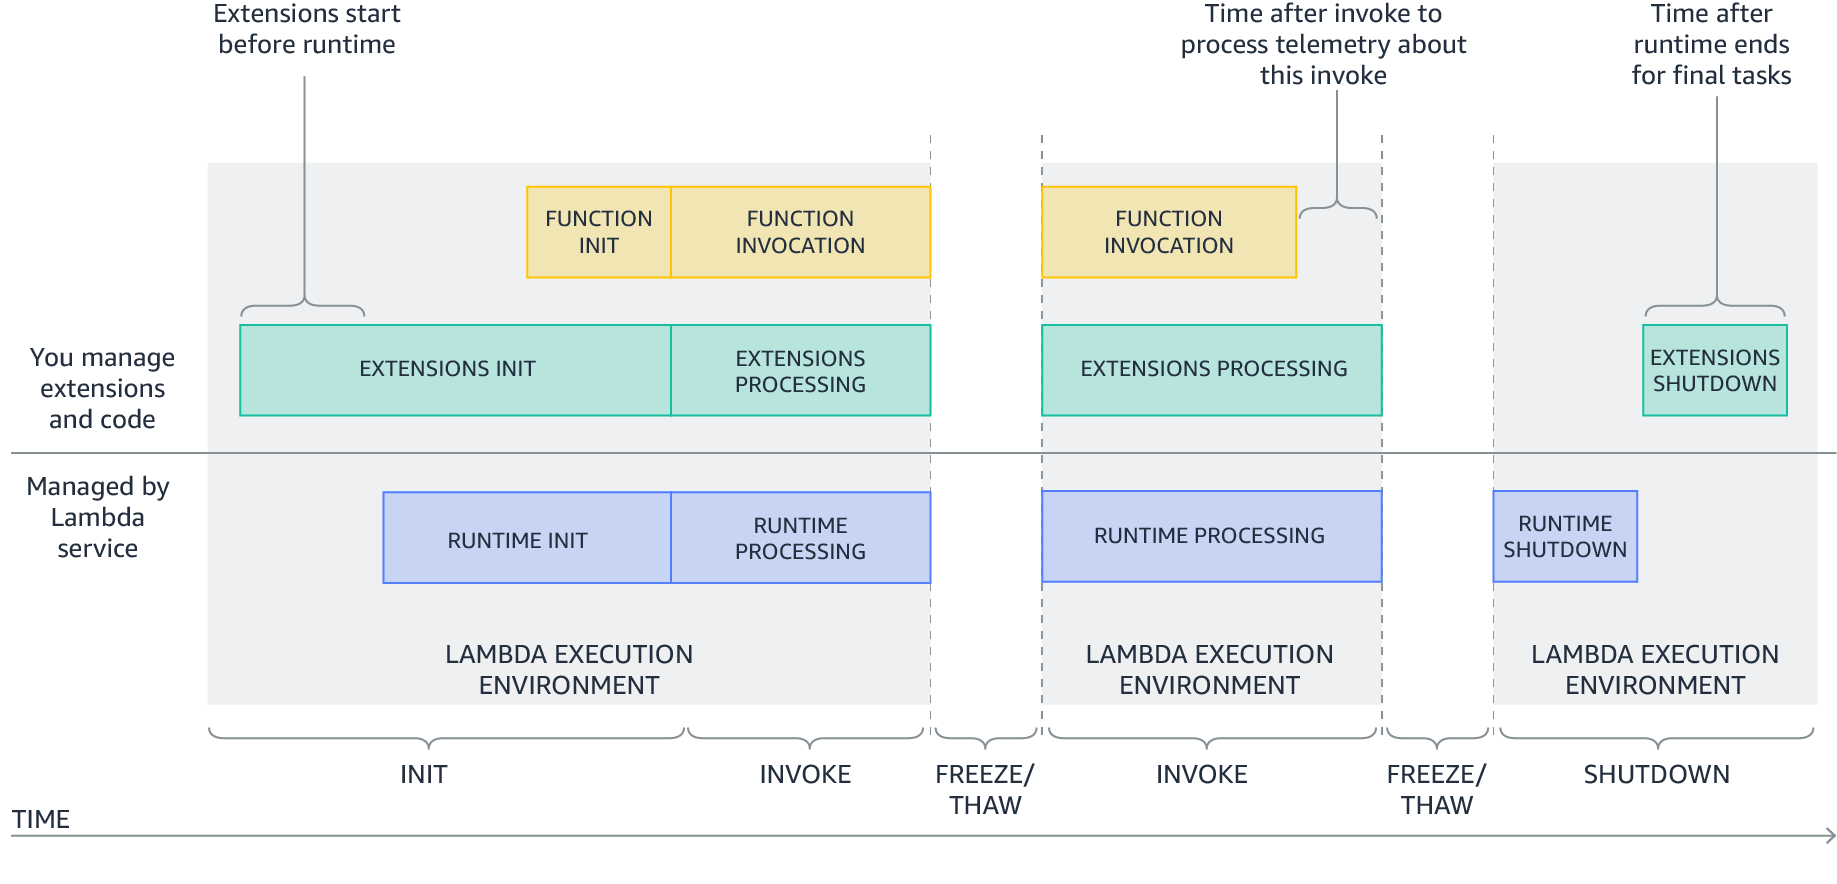
Extensions are initialized before the runtime and the function. They then continue to run in parallel with the function, get greater control during function invocation, and can run logic during shut down.
Extensions allow integrations with the Lambda service by introducing the following changes to the Lambda lifecycle:
An updated Init phase. There are now three discrete Init tasks: extensions Init, runtime Init, and function Init. This creates an order where extensions and the runtime can perform setup tasks before the function code runs.
Greater control during invocation. During the invoke phase, as before, the runtime requests the invocation event and invokes the function handler. In addition, extensions can now request lifecycle events from the Lambda service. They can run logic in response to these lifecycle events, and respond to the Lambda service when they are done. The Lambda service freezes the execution environment when it hears back from the runtime and all extensions. In this way, extensions can influence the freeze/thaw behavior.
Shutdown phase: we are now exposing the shutdown phase to let extensions stop cleanly when the execution environment shuts down. The Lambda service sends a shut down event, which tells the runtime and extensions that the environment is about to be shut down.
New Lambda lifecycle with extensions
Each Lambda lifecycle phase starts with an event from the Lambda service to the runtime and all registered extensions. The runtime and extensions signal that they have completed by requesting the Next invocation event from the Runtime and Extensions APIs. Lambda freezes the execution environment and all extensions when there are no pending events.
Lambda lifecycle for execution environment, runtime, extensions, and function.png
For more information on the lifecycle phases and the Extensions API, see the documentation.
How are extensions delivered and run?
You deploy extensions as Lambda layers, which are ZIP archives containing shared libraries or other dependencies.
When the Lambda service starts the function execution environment, it extracts the extension files from the Lambda layer into the /opt directory. Lambda then looks for any extensions in the /opt/extensions directory and starts initializing them. Extensions need to be executable as binaries or scripts. As the function code directory is read-only, extensions cannot modify function code.
Extensions can run in either of two modes, internal and external.
Internal extensions run as part of the runtime process, in-process with your code. They are not separate processes. Internal extensions allow you to modify the startup of the runtime process using language-specific environment variables and wrapper scripts. You can use language-specific environment variables to add options and tools to the runtime for Java Correto 8 and 11, Node.js 10 and 12, and .NET Core 3.1. Wrapper scripts allow you to delegate the runtime startup to your script to customize the runtime startup behavior. You can use wrapper scripts with Node.js 10 and 12, Python 3.8, Ruby 2.7, Java 8 and 11, and .NET Core 3.1. For more information, see “Modifying-the-runtime-environment”.
External extensions allow you to run separate processes from the runtime but still within the same execution environment as the Lambda function. External extensions can start before the runtime process, and can continue after the runtime shuts down. External extensions work with Node.js 10 and 12, Python 3.7 and 3.8, Ruby 2.5 and 2.7, Java Corretto 8 and 11, .NET Core 3.1, and custom runtimes.
External extensions can be written in a different language to the function. We recommend implementing external extensions using a compiled language as a self-contained binary. This makes the extension compatible with all of the supported runtimes. If you use a non-compiled language, ensure that you include a compatible runtime in the extension.
Extensions run in the same execution environment as the function, so share resources such as CPU, memory, and disk storage with the function. They also share environment variables, in addition to permissions, using the same AWS Identity and Access Management (IAM) role as the function.
For more details on resources, security, and performance with extensions, see the companion blog post “Introducing AWS Lambda extensions”.
For example extensions and wrapper scripts to help you build your own extensions, see the GitHub repository.
Showing extensions in action
The demo shows how external extensions integrate deeply with functions and the Lambda runtime. The demo creates an example Lambda function with a single extension using either the AWS CLI, or AWS SAM.
The example shows how an external extension can start before the runtime, run during the Lambda function invocation, and shut down after the runtime shuts down.
To set up the example, visit the GitHub repo, and follow the instructions in the README.md file.
The example Lambda function uses the custom provided.al2 runtime based on Amazon Linux 2. Using the custom runtime helps illustrate in more detail how the Lambda service, Runtime API, and the function communicate. The extension is delivered using a Lambda layer.
The runtime, function, and extension, log their status events to Amazon CloudWatch Logs. The extension initializes as a separate process and waits to receive the function invocation event from the Extensions API. It then sleeps for 5 seconds before calling the API again to register to receive the next event. The extension sleep simulates the processing of a parallel process. This could, for example, collect telemetry data to send to an external observability service.
When the Lambda function is invoked, the extension, runtime and function perform the following steps. I walk through the steps using the log output.
1. The Lambda service adds the configured extension Lambda layer. It then searches the /opt/extensions folder, and finds an extension called extension1.sh. The extension executable launches before the runtime initializes. It registers with the Extensions API to receive INVOKE and SHUTDOWN events using the following API call.
Runtime and extension call APIs to get the next event
4. The Lambda service receives an invocation event. It sends the event payload to the runtime using the Runtime API. It sends an event to the extension informing it about the invocation, using the Extensions API.
Runtime and extension receive event
5. The runtime invokes the function handler. The function receives the event payload.
Runtime invokes handler
6. The function runs the handler code. The Lambda runtime receives back the function response and sends it back to the Runtime API with the following API call.
curl -sS -X POST "http://${AWS_LAMBDA_RUNTIME_API}/2018-06-01/runtime/invocation/$REQUEST_ID/response" -d "$RESPONSE" > $TMPFILE
Runtime receives function response and sends to Runtime API
7. The Lambda runtime then waits for the next invocation event (warm start).
Runtime waits for next event
8. The extension continues processing for 5 seconds, simulating the processing of a companion process. The extension finishes, and uses the Extensions API to register again to wait for the next event.
Extension processing
9. The function invocation report is logged.
Function invocation report
10. When Lambda is about to shut down the execution environment, it sends the Runtime API a shut down event.
Lambda runtime shut down event
11. Lambda then sends a shut down event to the extensions. The extension finishes processing and then shuts down after the runtime.
Lambda extension shut down event
The demo shows the steps the runtime, function, and extensions take during the Lambda lifecycle.
An external extension registers and starts before the runtime. When Lambda receives an invocation event, it sends it to the runtime. It then sends an event to the extension informing it about the invocation. The runtime invokes the function handler, and the extension does its own processing of the event. The extension continues processing after the function invocation completes. When Lambda is about to shut down the execution environment, it sends a shut down event to the runtime. It then sends one to the extension, so it can finish processing.
Extensions share the same billing model as Lambda functions. When using Lambda functions with extensions, you pay for requests served and the combined compute time used to run your code and all extensions, in 100 ms increments. To learn more about the billing for extensions, visit the Lambda FAQs page.
Conclusion
Lambda extensions enable you to extend Lambda’s execution environment to more easily integrate with your favorite tools for monitoring, observability, security, and governance.
Extensions can run additional code; before, during, and after a function invocation. There are extensions available today from AWS Lambda Ready Partners. These cover use-cases such as application performance monitoring, secrets management, configuration management, and vulnerability detection. Extensions make it easier to use your existing tools with your serverless applications. For more information on the available extensions, see the companion post “Introducing Lambda Extensions – In preview“.
You can also build your own extensions to integrate your own tooling using the new Extensions API. For example extensions and wrapper scripts, see the GitHub repository.
Extensions are now available in preview in the following Regions: us-east-1, us-east-2, us-west-1, us-west-2, ca-central-1, eu-west-1, eu-west-2, eu-west-3, eu-central-1, eu-north-1, eu-south-1, sa-east-1, me-south-1, ap-northeast-1, ap-northeast-2, ap-northeast-3, ap-southeast-1, ap-southeast-2, ap-south-1, and ap-east-1.
AWS Lambda is announcing a preview of Lambda Extensions, a new way to easily integrate Lambda with your favorite monitoring, observability, security, and governance tools. In this post I explain how Lambda extensions work, how you can begin using them, and the extensions from AWS Lambda Ready Partners that are available today.
Extensions help solve a common request from customers to make it easier to integrate their existing tools with Lambda. Previously, customers told us that integrating Lambda with their preferred tools required additional operational and configuration tasks. In addition, tools such as log agents, which are long-running processes, could not easily run on Lambda.
Extensions are a new way for tools to integrate deeply into the Lambda environment. There is no complex installation or configuration, and this simplified experience makes it easier for you to use your preferred tools across your application portfolio today. You can use extensions for use-cases such as:
capturing diagnostic information before, during, and after function invocation
automatically instrumenting your code without needing code changes
fetching configuration settings or secrets before the function invocation
detecting and alerting on function activity through hardened security agents, which can run as separate processes from the function
You can use extensions from AWS, AWS Lambda Ready Partners, and open source projects. There are extensions available today for AppDynamics, Check Point, Datadog, Dynatrace, Epsagon, HashiCorp, Lumigo, New Relic, Thundra, Splunk SignalFX, AWS AppConfig, and Amazon CloudWatch Lambda Insights.
There are two components to the Lambda Extensions capability: the Extensions API and extensions themselves. Extensions are built using the new Lambda Extensions API which provides a way for tools to get greater control during function initialization, invocation, and shut down. This API builds on the existing Lambda Runtime API, which enables you to bring custom runtimes to Lambda.
AWS Lambda execution environment with the Extensions API
Most customers will use extensions without needing to know about the capabilities of the Extensions API that enables them. You can just consume capabilities of an extension by configuring the options in your Lambda functions. Developers who build extensions use the Extensions API to register for function and execution environment lifecycle events.
Extensions can run in either of two modes – internal and external.
Internal extensions run as part of the runtime process, in-process with your code. They allow you to modify the startup of the runtime process using language-specific environment variables and wrapper scripts. Internal extensions enable use cases such as automatically instrumenting code.
External extensions allow you to run separate processes from the runtime but still within the same execution environment as the Lambda function. External extensions can start before the runtime process, and can continue after the runtime shuts down. External extensions enable use cases such as fetching secrets before the invocation, or sending telemetry to a custom destination outside of the function invocation. These extensions run as companion processes to Lambda functions.
AWS Lambda Ready Partners extensions available at launch
Today, you can use extensions with the following AWS and AWS Lambda Ready Partner’s tools, and there are more to come:
AppDynamics provides end-to-end transaction tracing for AWS Lambda. With the AppDynamics extension, it is no longer mandatory for developers to include the AppDynamics tracer as a dependency in their function code, making tracing transactions across hybrid architectures even simpler.
The Datadog extension brings comprehensive, real-time visibility to your serverless applications. Combined with Datadog’s existing AWS integration, you get metrics, traces, and logs to help you monitor, detect, and resolve issues at any scale. The Datadog extension makes it easier than ever to get telemetry from your serverless workloads.
The Dynatrace extension makes it even easier to bring AWS Lambda metrics and traces into the Dynatrace platform for intelligent observability and automatic root cause detection. Get comprehensive, end-to-end observability with the flip of a switch and no code changes.
Epsagon helps you monitor, troubleshoot, and lower the cost for your Lambda functions. Epsagon’s extension reduces the overhead of sending traces to the Epsagon service, with minimal performance impact to your function.
HashiCorp Vault allows you to secure, store, and tightly control access to your application’s secrets and sensitive data. With the Vault extension, you can now authenticate and securely retrieve dynamic secrets before your Lambda function invokes.
Lumigo provides a monitoring and observability platform for serverless and microservices applications. The Lumigo extension enables the new Lumigo Lambda Profiler to see a breakdown of function resources, including CPU, memory, and network metrics. Receive actionable insights to reduce Lambda runtime duration and cost, fix bottlenecks, and increase efficiency.
Check Point CloudGuard provides full lifecycle security for serverless applications. The CloudGuard extension enables Function Self Protection data aggregation as an out-of-process extension, providing detection and alerting on application layer attacks.
New Relic provides a unified observability experience for your entire software stack. The New Relic extension uses a simpler companion process to report function telemetry data. This also requires fewer AWS permissions to add New Relic to your application.
Thundra provides an application debugging, observability and security platform for serverless, container and virtual machine (VM) workloads. The Thundra extension adds asynchronous telemetry reporting functionality to the Thundra agents, getting rid of network latency.
Splunk offers an enterprise-grade cloud monitoring solution for real-time full-stack visibility at scale. The Splunk extension provides a simplified runtime-independent interface to collect high-resolution observability data with minimal overhead. Monitor, manage, and optimize the performance and cost of your serverless applications with Splunk Observability solutions.
AWS AppConfig helps you manage, store, and safely deploy application configurations to your hosts at runtime. The AWS AppConfig extension integrates Lambda and AWS AppConfig seamlessly. Lambda functions have simple access to external configuration settings quickly and easily. Developers can now dynamically change their Lambda function’s configuration safely using robust validation features.
Amazon CloudWatch Lambda Insights enables you to efficiently monitor, troubleshoot, and optimize Lambda functions. The Lambda Insights extension simplifies the collection, visualization, and investigation of detailed compute performance metrics, errors, and logs. You can more easily isolate and correlate performance problems to optimize your Lambda environments.
You can also build and use your own extensions to integrate your organization’s tooling. For instance, the Cloud Foundations team at Square has built their own extension. They say:
The Cloud Foundations team at Square works to make the cloud accessible and secure. We partnered with the Security Infrastructure team, who builds infrastructure to secure Square’s sensitive data, to enable serverless applications at Square, and provide mTLS identities to Lambda.
Since beginning work on Lambda, we have focused on creating a streamlined developer experience. Teams adopting Lambda need to learn a lot about AWS, and we see extensions as a way to abstract away common use cases. For our initial exploration, we wanted to make accessing secrets easy, as with our current tools each Lambda function usually pulls 3-5 secrets.
The extension we built and open source fetches secrets on cold starts, before the Lambda function is invoked. Each function includes a configuration file that specifies which secrets to pull. We knew this configuration was key, as Lambda functions should only be doing work they need to do. The secrets are cached in the local /tmp directory, which the function reads when it needs the secret data. This makes Lambda functions not only faster, but reduces the amount of code for accessing secrets.
Showing extensions in action with AWS AppConfig
This demo shows an example of using the AWS AppConfig with a Lambda function. AWS AppConfig is a capability of AWS Systems Manager to create, manage, and quickly deploy application configurations. It lets you dynamically deploy external configuration without having to redeploy your applications. As AWS AppConfig has robust validation features, all configuration changes can be tested safely before rolling out to your applications.
AWS AppConfig has an available extension which gives Lambda functions access to external configuration settings quickly and easily. The extension runs a separate local process to retrieve and cache configuration data from the AWS AppConfig service. The function code can then fetch configuration data faster using a local call rather than over the network.
To set up the example, visit the GitHub repo and follow the instructions in the README.md file.
The example creates an AWS AppConfig application, environment, and configuration profile. It stores a loglevel value, initially set to normal.
AWS AppConfig application, environment, and configuration profile
An AWS AppConfig deployment runs to roll out the initial configuration.
AWS AppConfig deployment
The example contains two Lambda functions that include the AWS AppConfig extension. For a list of the layers that have the AppConfig extension, see the blog post “AWS AppConfig Lambda Extension”.
The functions use the extension to retrieve the loglevel value from AWS AppConfig, returning the value as a response. In a production application, this value could be used within function code to determine what level of information to send to CloudWatch Logs. For example, to troubleshoot an application issue, you can change the loglevel value centrally. Subsequent function invocations for both functions use the updated value.
Both Lambda functions are configured with an environment variable that specifies which AWS AppConfig configuration profile and value to use.
Create a new AWS Config hosted configuration profile version setting the loglevel value to verbose. Run a new AWS AppConfig deployment to update the value. The extension for both functions retrieves the new value. The function configuration itself is not changed.
Running another test invocation for both functions returns the updated value still without a cold start.
AWS AppConfig has worked seamlessly with Lambda to update a dynamic external configuration setting for multiple Lambda functions without having to redeploy the function configuration.
The only function configuration required is to add the layer which contains the AWS AppConfig extension.
Pricing
Extensions share the same billing model as Lambda functions. When using Lambda functions with extensions, you pay for requests served and the combined compute time used to run your code and all extensions, in 100 ms increments. To learn more about the billing for extensions, visit the Lambda FAQs page.
Resources, security, and performance with extensions
Extensions run in the same execution environment as the function code. Therefore, they share resources with the function, such as CPU, memory, disk storage, and environment variables. They also share permissions, using the same AWS Identity and Access Management (IAM) role as the function.
You can configure up to 10 extensions per function, using up to five layers at a time. Multiple extensions can be included in a single layer.
The size of the extensions counts towards the deployment package limit. This cannot exceed the unzipped deployment package size limit of 250 MB.
External extensions are initialized before the runtime is started so can increase the delay before the function is invoked. Today, the function invocation response is returned after all extensions have completed. An extension that takes time to complete can increase the delay before the function response is returned. If an extension performs compute-intensive operations, function execution duration may increase. To measure the additional time the extension runs after the function invocation, use the new PostRuntimeExtensionsDuration CloudWatch metric to measure the extra time the extension takes after the function execution. To understand the impact of a specific extension, you can use the Duration and MaxMemoryUsed CloudWatch metrics, and run different versions of your function with and without the extension. Adding more memory to a function also proportionally increases CPU and network throughput.
The function and all extensions must complete within the function’s configured timeout setting which applies to the entire invoke phase.
Conclusion
Lambda extensions enable you to extend the Lambda service to more easily integrate with your favorite tools for monitoring, observability, security, and governance.
Today, you can install a number of available extensions from AWS Lambda Ready Partners. These cover use-cases such as application performance monitoring, secrets management, configuration management, and vulnerability detection. Extensions make it easier to use your existing tools with your serverless applications.
Extensions are now available in preview in the following Regions: us-east-1, us-east-2, us-west-1, us-west-2, ca-central-1, eu-west-1, eu-west-2, eu-west-3, eu-central-1, eu-north-1, eu-south-1, sa-east-1, me-south-1, ap-northeast-1, ap-northeast-2, ap-northeast-3, ap-southeast-1, ap-southeast-2, ap-south-1, and ap-east-1.
A traditional LAMP stack often implements the Model-View-Controller (MVC) architecture. This is a well-established way of separating application logic into three parts: the model, the view, and the controller.
Model: This part is responsible for managing the data of the application. Its role is to retrieve raw information from the database or receive user input from the controller.
View: This component focuses on the display. Data received from the model is presented to the user. Any response from the user is also recognized and sent to the controller component.
Controller: This part is responsible for the application logic. It responds to the user input and performs interactions on the data model objects.
The MVC principal of decoupling data, logic, and presentation layers means that changes in one layer have minimal impact on the others. This speeds the development process and makes it easier to update layouts, change business rules, and add new features. Components are more adaptable for reuse and refactoring, and allow for a degree of simultaneous development.
The serverless LAMP stack
The preceding serverless LAMP stack architecture is first discussed in this post. A web application is split in to two components. A single AWS Lambda function contains the application’s MVC framework. Each response is synchronously returned via Amazon API Gateway. This architecture addresses the scalability challenge that is often seen in traditional LAMP stack applications. It scales automatically with a managed infrastructure and a pay-per-use billing model. However, the serverless paradigm makes it possible to apply the MVC principles of decoupling and reusability to an even greater degree.
The “Lambda-lith”
The preceding architecture represents a serverless monolith or “Lambda-lith”. A single Lambda function contains the entire business logic within an MVC framework. This implementation can be used to “lift and shift” from a legacy MVC to a serverless application. Simple applications often start this way too, but as the application grows more complex over time new challenges can occur.
Lambda Day 1 to day 100
A Lambda-lith is often maintained in a single repository that contains the entire application logic. This is sometimes referred to as a mono-repo.
Lamba-lith monorepo
A mono-repo makes it harder to separate responsibility of ownership between development teams. Consequently, projects in a mono-repo are prone to depend on each other, creating tight coupling. The tightly coupled code base with all of its interconnected modules be challenging to maintain a regular release cadence. Any small fix can require updates to other parts of the code base, making maintenance challenging without fracturing the whole application. Onboarding can be slow as new developers take time to learn and understand the code base and all of the interdependencies.
By applying the following principles, Lambda-lith MVC applications can be refactored into decoupled serverless microservices.
Divide into independent Lambda functions with finite business logic
The following example illustrates a Lambda-lith with all business and routing logic stored in a single Lambda function. Every request is routed to this function from API Gateway. The function code base contains a `router.php` file to direct requests to the correct model, view, or controller.
This is similar to a traditional LAMP stack implementation in which a web server such as Apache or NGINX routes all requests to a single index.php function. However, it’s often more practical to split applications into multiple functions or services.
Lambda as a web server
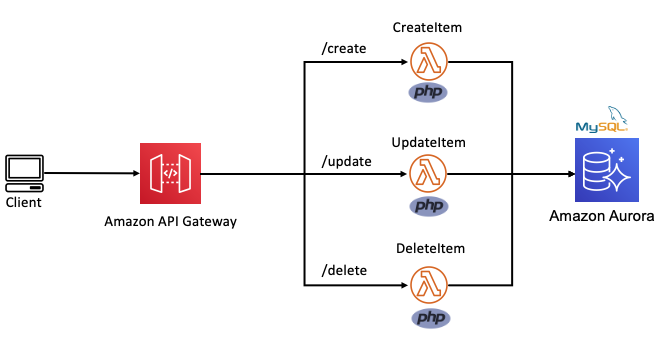
In the following example, this Lambda function is split into multiple functions based on each CRUD operation. The internal routing logic is now decoupled from the business logic. The API Gateway service uses rules to route requests to the correct Lambda function. This allows each function to scale independently and updates can be made to one function without impacting another.
Routing decoupled from business logic
Build micro-perimeters to enforce strict verification of every person or service.
Traditional MVC applications often use a castle-and-moat security model. This provides security by placing a perimeter around the entire application to protect it from malicious actors. This perimeter guards the application or network by verifying requests and user identities at the point of entry or exit.
This is typically achieved with firewalls, proxy servers, honeypots, and other intrusion prevention tools. It assumes that activity inside the perimeter is safe. However, a network vulnerability may provide access to everything inside.
Microservice-based applications allow developers to apply a “zero trust” security model. This enables developers to build micro-perimeters around each resource. This is sometimes referred to as the principle of least privilege. It ensures that each request, service, or user can access only the data or resource that is necessary for its legitimate purpose. Even with a vulnerability, the blast radius is limited only to the service within that micro-perimeter.
Castle-and-moat vs zero trust security model
Use AWS Identity and Access Management (IAM) resource policies and execution roles to decouple business logic from security posture. Lambda resource policies define the events and services that are authorized to invoke the function. Lambda execution roles place constraints the resource or service the Lambda function has access to. When defining resource policies and execution roles, start with a minimum set of permissions and grant additional permissions as necessary.
Create building blocks based on common functionality
Each component is a single building block that makes up an application together with other blocks. These blocks form microservices that deliver a set of capabilities on a specific domain. This makes is easy to change, upgrade, and replace with no impact on the remaining microservice components. This creates natural ownership boundaries to help organize repositories.
Development teams can then easily be assigned ownership to individual microservice repositories. Use the AWS Serverless Application Model (AWS SAM) to organize microservices into multiple code repositories, as explained in this blog post.
Use messages to connect and communicate between microservices.
In traditional MVC applications, one part of the application uses method calls to communicate with the other parts. With serverless microservices, the code base is spread across short-lived stateless functions and services. Communication between these services is achieved using asynchronous messages or synchronous HTTP requests.
Synchronous communication
In this method, a service calls an API and waits for a response from the receiving service before proceeding. Use API Gateway to create a front door to your backend microservices. API Gateway is a fully managed service for creating and managing RESTful and WebSocket APIs.
Using API Gateway to transport data addresses common concerns such as authorization, API tokens, access control and rate limiting from your code, and helps to reduce code complexity. API Gateway can also be used for synchronous internal microservice communications where the services have clear separation, strict authentication requirements, or have been deployed across accounts.
The following architecture demonstrates an application that is deployed across two accounts. The Booking microservice, invokes a loyalty booking function via API Gateway that exists in the Loyalty points account.
Synchronous internal microservice communications
Asynchronous communication
In this pattern, a service sends a message without waiting for a response, and one or more services process the message asynchronously. Here, the services involved do not directly communicate with each other. Instead, services publish messages to a broker such as Amazon Simple Queue Service (SQS) or Amazon EventBridge. Other services can choose to subscribe to the topic in the broker that they care about. This enables further decoupling of business logic from data transportation and reduces your code complexity.
Use services instead of code, where possible
A service-first mindset is an important part of serverless application development. Each line of code you write may limit your project’s responsiveness to change and adds cognitive overhead for new developers. Using an appropriate AWS service for each domain (messaging, storage, orchestration) helps to build faster. Embracing this mind-set allows developers to focus on solving those unique challenges that add the most value to their customers.
By applying these principles to refactor an MVC Lambda-lith, I build the following CRUD API microservice. This application can be deployed from this GitHub repository. It uses an AWS Serverless Application Model (AWS SAM) template to define an HTTP API, 5 Lambda functions, an Amazon DynamoDB table and all the IAM roles required.
All routing logic and authentication is managed by Amazon API Gateway. Each Lambda function has limited scope and minimal business logic. It uses a lightweight custom-built PHP runtime, explained in this post. Each Lambda function uses the AWS PHP SDK to interact with the DynamoDB table. This architecture is suitable as a serverless microservice for a website backend.
A serverless API microservice with PHP
Conclusion
In this post, I show how to move from using a single Lambda function as a scalable web host with an MVC framework, to a decoupled microservice model. I explain the principles that can be applied to help transition an MCV application into a collection of microservices and show the benefits of doing so. I provide code examples for a serverless PHP CRUD microservice with a deployable AWS SAM template.
PHP development teams can transition from Lambda-lith MVC applications to a decoupled microservice model. This allows them to focus on shipping code to delight their customers without managing infrastructure.
Find more resources for building serverless PHP applications at ServerlessLand.com.
This is a guest post by Cristhian Motoche of Stack Builders.
At Stack Builders, we believe that Haskell’s system of expressive static types offers many benefits to the software industry and the world-wide community that depends on our services. In order to fully realize these benefits, it is necessary to have proper training and access to an ecosystem that allows for reliable deployment of services. In exploring the tools that help us run our systems based on Haskell, our developer Cristhian Motoche has created a tutorial that shows how to compile Haskell to WebAssembly using Asterius for deployment on Cloudflare.
What is a Cloudflare Worker?
Cloudflare Workers is a serverless platform that allows us to run our code on the edge of the Cloudflare infrastructure. It’s built on Google V8, so it’s possible to write functionalities in JavaScript or any other language that targets WebAssembly.
WebAssembly is a portable binary instruction format that can be executed fast in a memory-safe sandboxed environment. For this reason, it’s especially useful for tasks that need to perform resource-demanding and self-contained operations.
Why use Haskell to target WebAssembly?
Haskell is a pure functional languages that can target WebAssembly. As such, It helps developers break down complex tasks into small functions that can later be composed to do complex tasks. Additionally, it’s statically typed and has type inference, so it will complain if there are type errors at compile time. Because of that and much more, Haskell is a good source language for targeting WebAssembly.
From Haskell to WebAssembly
We’ll use Asterius to target WebAssembly from Haskell. It’s a well documented tool that is updated often and supports a lot of Haskell features.
First, as suggested in the documentation, we’ll use podman to pull the Asterius prebuilt container from Docker hub. In this tutorial, we will use Asterius version 200617, which works with GHC 8.8.
podman run -it --rm -v $(pwd):/workspace -w /workspace terrorjack/asterius:200617
Now we’ll create a Haskell module called fact.hs file that will export a pure function:
module Factorial (fact) where
fact :: Int -> Int
fact n = go n 1
where
go 0 acc = acc
go n acc = go (n - 1) (n*acc)
foreign export javascript "fact" fact :: Int -> Int
In this module, we define a pure function called fact, optimized with tail recursion and exported using the Asterius JavaScript FFI, so that it can be called when a WebAssembly module is instantiated in JavaScript.
Next, we’ll create a JavaScript file called fact_node.mjs that contains the following code:
import * as rts from "./rts.mjs";
import module from "./fact.wasm.mjs";
import req from "./fact.req.mjs";
async function handleModule(m) {
const i = await rts.newAsteriusInstance(Object.assign(req, {module: m}));
const result = await i.exports.fact(5);
console.log(result);
}
module.then(handleModule);
This code imports rts.mjs (common runtime), WebAssembly loaders, and the required parameters for the Asterius instance. It creates a new Asterius instance, it calls the exported function fact with the input 5, and prints out the result.
You probably have noted that fact is done asynchronously. This happens with any exported function by Asterius, even if it’s a pure function.
Next, we’ll compile this code using the Asterius command line interface (CLI) ahc-link, and we’ll run the JavaScript code in Node:
This command takes fact.hs as a Haskell input file, specifies that no main function is exported, and exports the fact function. Additionally, it takes fact_node.mjs as the entry JavaScript file that replaces the generated file by default, and it places the generated code in a directory called node.
Running the ahc-link command from above will print the following output in the console:
[INFO] Compiling fact.hs to WebAssembly
...
[INFO] Running node/fact.mjs
120
As you can see, the result is executed in node and it prints out the result of fact in the console.
Push your code to Cloudflare Workers
Now we’ll set everything up for deploying our code to Cloudflare Workers.
First, let’s add a metadata.json file with the following content:
This file is needed to specify the wasm_module binding. The name value corresponds to the global variable to access the WebAssembly module from your Worker code. In our example, it’s going to have the name WASM.
Our next step is to define the main point of the Workers script.
import * as rts from "./rts.mjs";
import fact from "./fact.req.mjs";
async function handleFact(param) {
const i = await rts.newAsteriusInstance(Object.assign(fact, { module: WASM }));
return await i.exports.fact(param);
}
async function handleRequest(req) {
if (req.method == "POST") {
const data = await req.formData();
const param = parseInt(data.get("param"));
if (param) {
const resp = await handleFact(param);
return new Response(resp, {status: 200});
} else {
return new Response(
"Expecting 'param' in request to be an integer",
{status: 400},
);
}
}
return new Response("Method not allowed", {status: 405});
}
addEventListener("fetch", event => {
event.respondWith(handleRequest(event.request))
})
There are a few interesting things to point out in this code:
We import rts.mjs and fact.req.mjs to load the exported functions from our WebAssembly module.
handleFact is an asynchronous function that creates an instance of Asterius with the global WASM module, as a Workers global variable, and calls the exported function fact with some input.
handleRequest handles the request of the Worker. It expects a POST request, with a parameter called param in the request body. If param is a number, it calls handleFact to respond with the result of fact.
Using the Service Workers API, we listen to the fetch event that will respond with the result of handleRequest.
We need to build and bundle our code in a single JavaScript file, because Workers only accepts one script per worker. Fortunately, Asterius comes with Parcel.js, which will bundle all the necessary code in a single JavaScript file.
ahc-link will generate some files inside a directory called worker. For our Workers, we’re only interested in the JavaScript file (fact.js) and the WebAssembly module (fact.wasm). Now, it’s time to submit both of them to Workers. We can do this with the provided REST API.
Make sure you have an account id ($CF_ACCOUNT_ID), a name for your script ($SCRIPT_NAME), and an API Token ($CF_API_TOKEN):
Now, visit the Workers UI, where you can use the editor to view, edit, and test the script. Also, you can enable it to on a workers.dev subdomain ($CFW_SUBDOMAIN); in that case, you could then simply:
So far, we’ve created a WebAssembly module that exports a pure Haskell function we ran in Workers. However, we can also create and build a Cabal project using Asterius ahc-cabal CLI, and then use ahc-dist to compile it to WebAssembly.
First, let’s create the project:
ahc-cabal init -m -p cabal-cfw-example
Then, let’s add some dependencies to our cabal project. The cabal file will look like this:
It’s a simple cabal file, except for the -optl--export-function=handleReq ghc flag. This is necessary when exporting a function from a cabal project.
In this example, we’ll define a simple User record, and we’ll define its instance automatically using Template Haskell!
{-# LANGUAGE OverloadedStrings #-}
{-# LANGUAGE TemplateHaskell #-}
module Main where
import Asterius.Types
import Control.Monad
import Data.Aeson hiding (Object)
import qualified Data.Aeson as A
import Data.Aeson.TH
import qualified Data.ByteString.Lazy.Char8 as B8
import Data.Text
main :: IO ()
main = putStrLn "CFW Cabal"
data User =
User
{ name :: Text
, age :: Int
}
$(deriveJSON defaultOptions 'User)
NOTE: It’s not necessary to create a Cabal project for this example, because the prebuilt container comes with a lot of prebuilt packages (aesona included). Nevertheless, it will help us show the potential of ahc-cabal and ahc-dist.
Next, we’ll define handleReq, which we’ll export using JavaScript FFI just like we did before.
handleReq :: JSString -> JSString -> IO JSObject
handleReq method rawBody =
case fromJSString method of
"POST" ->
let eitherUser :: Either String User
eitherUser = eitherDecode (B8.pack $ fromJSString rawBody)
in case eitherUser of
Right _ -> js_new_response (toJSString "Success!") 200
Left err -> js_new_response (toJSString err) 400
_ -> js_new_response (toJSString "Not a valid method") 405
foreign export javascript "handleReq" handleReq :: JSString -> JSString -> IO JSObject
foreign import javascript "new Response($1, {\"status\": $2})"
js_new_response :: JSString -> Int -> IO JSObject
This time, we define js_new_response, a Haskell function that creates a JavaScript object, to create a Response. handleReq takes two string parameters from JavaScript and it uses them to prepare a response.
Now let’s build and install the binary in the current directory:
cabal_cfw_example.mjs contains the following code:
import * as rts from "./rts.mjs";
import cabal_cfw_example from "./cabal_cfw_example.req.mjs";
async function handleRequest(req) {
const i = await rts.newAsteriusInstance(Object.assign(cabal_cfw_example, { module: WASM }));
const body = await req.text();
return await i.exports.handleReq(req.method, body);
}
addEventListener("fetch", event => {
event.respondWith(handleRequest(event.request))
});
Finally, we can deploy our code to Workers by defining a metadata.json file and uploading the script and the WebAssembly module using Workers API as we did before.
Caveats
Workers limits your JavaScript and WebAssembly in file size. Therefore, you need to be careful with any dependencies you add.
Conclusion
Stack Builders builds better software for better living through technologies like expressive static types. We used Asterius to compile Haskell to WebAssembly and deployed it to Cloudflare Workers using the Workers API. Asterius supports a lot of Haskell features (e.g. Template Haskell) and it provides an easy-to-use JavaScript FFI to interact with JavaScript. Additionally, it provides prebuilt containers that contain a lot of Haskell packages, so you can start writing a script right away.
Following this approach, we can write functional type-safe code in Haskell, target it to WebAssembly, and publish it to Workers, which runs on the edge of the Cloudflare infrastructure.
However, you can also combine these services to solve specific challenges in distributed architectures. By doing this, you can use specific features of each service to build sophisticated patterns with little code. These combinations can make your applications more resilient and scalable, and reduce the amount of custom logic and architecture in your workload.
In this blog post, I highlight several important patterns for serverless developers. I also show how you use and deploy these integrations with the AWS Serverless Application Model (AWS SAM).
Examples in this post refer to code that can be downloaded from this GitHub repo. The README.md file explains how to deploy and run each example.
SNS to SQS: Adding resilience and throttling to message throughput
SNS has a robust retry policy that results in up to 100,010 delivery attempts over 23 days. If a downstream service is unavailable, it may be overwhelmed by retries when it comes back online. You can solve this issue by adding an SQS queue.
Adding an SQS queue between the SNS topic and its subscriber has two benefits. First, it adds resilience to message delivery, since the messages are durably stored in a queue. Second, it throttles the rate of messages to the consumer, helping smooth out traffic bursts caused by the service catching up with missed messages.
To build this in an AWS SAM template, you first define the two resources, and the SNS subscription:
Another usage of this pattern is when you want to filter messages in architectures using an SQS queue. By placing the SNS topic in front of the queue, you can use the message filtering capabilities of SNS. This ensures that only the messages you need are published to the queue. To use message filtering in AWS SAM, use the AWS:SNS:Subcription resource:
EventBridge to SNS: combining features of both services
Both SNS and EventBridge have different characteristics in terms of targets, and integration with broader features. This table compares the major differences between the two services:
Amazon SNS
Amazon EventBridge
Number of targets
10 million (soft)
5
Limits
100,000 topics. 12,500,000 subscriptions per topic.
The default bus already exists in every AWS account, so there is no need to declare it. For the event bus to publish matching events to the SNS topic, you define permissions using the AWS::SNS::TopicPolicy resource:
EventBridge has a limit of five targets per rule. In cases where you must send events to hundreds or thousands of targets, publishing to SNS first and then subscribing those targets to the topic works around this limit. Both services have different targets, and this pattern allows you to deliver EventBridge events to SMS, HTTP(s), email and SNS mobile push.
You can transform and filter the message using these services, often without needing an AWS Lambda function. SNS does not support input transformation but you can do this in an EventBridge rule. Message filtering is possible in both services but EventBridge provides richer content filtering capabilities.
AWS CloudTrail can log and monitor activity across services in your AWS account. It can be a useful source for events, allowing you to respond dynamically to objects in Amazon S3 or react to changes in your environment, for example. This natively integrates with EventBridge, allowing you to ingest events at scale from dozens of services.
Using EventBridge enables you to source events from outside your AWS account, offering integrations with a list of software as a service (SaaS) providers. This capability allows you to receive events from your accounts with SaaS providers like Zendesk, PagerDuty, and Auth0. These events are delivered to a partner event bus in your account, and can then be filtered and routed to an SNS topic.
Additionally, this pattern allows you to deliver events to Lambda functions in other AWS accounts and in other AWS Regions. You can invoke Lambda from SNS topics in other Regions and accounts. It’s also possible to make SNS topics publicly read-only, making them extensible endpoints that other third parties can consume from. SNS has comprehensive access control, which you can incorporate into this pattern.
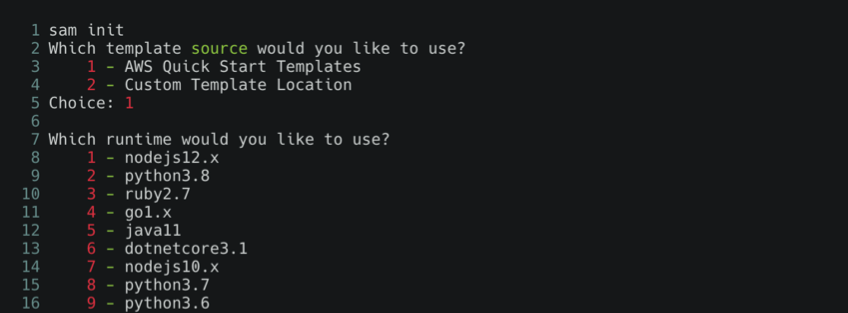
EventBridge to SQS: Building fault-tolerant microservices
EventBridge can route events to targets such as microservices. In the case of downstream failures, the service retries events for up to 24 hours. For workloads where you need a longer period of time to store and retry messages, you can deliver the events to an SQS queue in each microservice. This durably stores those events until the downstream service recovers. Additionally, this pattern protects the microservice from large bursts of traffic by throttling the delivery of messages.
The resources declared in the AWS SAM template are similar to the previous examples, but it uses the AWS::SQS::QueuePolicy resource to grant the appropriate permission to EventBridge:
You can combine these services in your architectures to implement patterns that solve complex challenges, often with little code required. This blog post shows three examples that implement message throttling and queueing, integrating SNS and EventBridge, and building fault tolerant microservices.
This post explains how we implemented the Automatic Platform Optimization for WordPress. In doing so, we have defined a new place to run WordPress plugins, at the edge written with Cloudflare Workers. We provide the feature as a Cloudflare service but what’s exciting is that anyone could build this using the Workers platform.
The service is an evolution of the ideas explained in an earlier zero-config edge caching of HTML blog post. The post will explain how Automatic Platform Optimization combines the best qualities of the regular Cloudflare cache with Workers KV to improve cache cold starts globally.
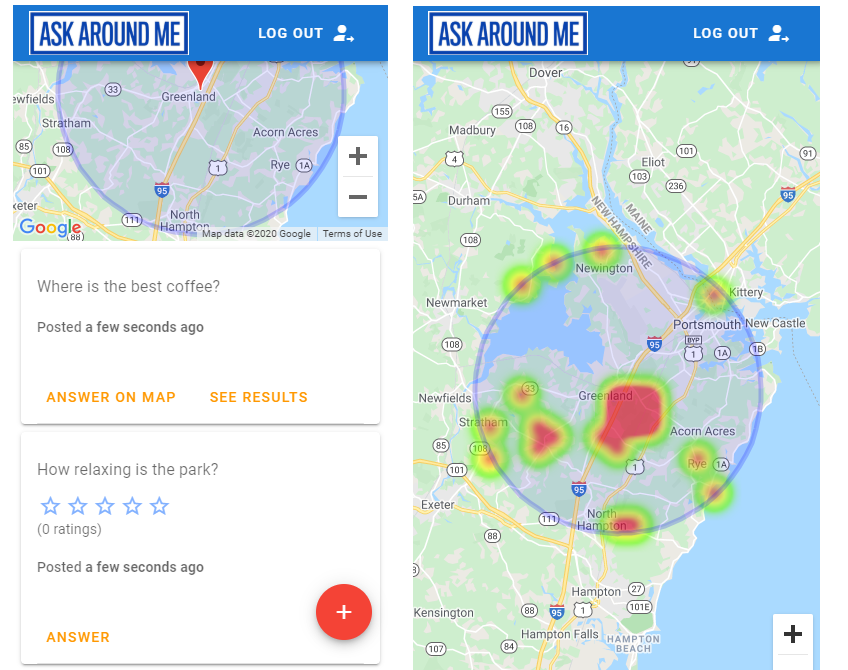
The optimization will work both with and without the Cloudflare for WordPress plugin integration. Not only have we provided a zero config edge HTML caching solution but by using the Workers platform we were also able to improve the performance of Google font loading for all pages.
We are launching the feature first for WordPress specifically but the concept can be applied to any website and/or content management system (CMS).
A new place to run WordPress plugins?
There are many individual WordPress plugins for performance that use similar optimizations to existing Cloudflare services. Automatic Platform Optimization is bringing them all together into one easy to use solution, deployed at the edge.
Traditionally you have to maintain server plugins with your WordPress installation. This comes with maintenance costs and can require a deep understanding of how to fine tune performance and security for each and every plugin. Providing the optimizations on the client side can also lead to performance problems due to the costs of JavaScript execution. In contrast most of the optimizations could be built-in in Cloudflare’s edge rather than running on the server or the client. Automatic Platform Optimization will be always up to date with the latest performance and security best practices.
How to optimize for WordPress
By default Cloudflare CDN caches assets based on file extension and doesn’t cache HTML content. It is possible to configure HTML caching with a Cache Everything Page rule but it is a manual process and often requires additional features only available on the Business and Enterprise plans. So for the majority of the WordPress websites even with a CDN in front them, HTML content is not cached. Requests for a HTML document have to go all the way to the origin.
Even if a CDN optimizes the connection between the closest edge and the website’s origin, the origin could be located far away and also be slow to respond, especially under load.
Move content closer to the user
One of the primary recommendations for speeding up websites is to move content closer to the end-user. This reduces the amount of time it takes for packets to travel between the end-user and the web server – the round-trip time (RTT). This improves the speed of establishing a connection as well as serving content from a closer location.
We have previously blogged about the benefits of edge caching HTML. Caching and serving from HTML from the Cloudflare edge will greatly improve the time to first byte (TTFB) by optimizing DNS, connection setup, SSL negotiation, and removing the origin server response time.If your origin is slow in generating HTML and/or your user is far from the origin server then all your performance metrics will be affected.
Most HTML isn’t really dynamic. It needs to be able to change relatively quickly when the site is updated but for a huge portion of the web, the content is static for months or years at a time. There are special cases like when a user is logged-in (as the admin or otherwise) where the content needs to differ but the vast majority of visits are of anonymous users.
Zero config edge caching revisited
The goal is to make updating content to the edge happen automatically. The edge will cache and serve the previous version content until there is new content available. This is usually achieved by triggering a cache purge to remove existing content. In fact using a combination of our WordPress plugin and Cloudflare cache purge API, we already support Automatic Cache Purge on Website Updates. This feature has been in use for many years.
Building automatic HTML edge caching is more nuanced than caching traditional static content like images, styles or scripts. It requires defining rules on what to cache and when to update the content. To help with that task we introduced a custom header to communicate caching rules between Cloudflare edge and origin servers.
The Cloudflare Worker runs from every edge data center, the serverless platform will take care of scaling to our needs. Based on the request type it will return HTML content from Cloudflare Cache using Worker’s Cache API or serve a response directly from the origin. Specifically designed custom header provides information from the origin on how the script should handle the response. For example worker script will never cache responses for authenticated users.
HTML Caching rules
With or without Cloudflare for WordPress plugin, HTML edge caching requires all of the following conditions to be met:
Origin responds with 200 status
Origin responds with "text/html" content type
Request method is GET.
Request path doesn’t contain query strings
Request doesn’t contain any WordPress specific cookies: "wp-*", "wordpress*", "comment_*", "woocommerce_*" unless it’s "wordpress_eli" or "wordpress_test_cookie".
Request doesn’t contain any of the following headers:
"Cache-Control: no-cache"
"Cache-Control: private"
"Pragma:no-cache"
"Vary: *"
Note that the caching is bypassed if the devtools are open and the “Disable cache” option is active.
Bypass HTML caching based on presence of WordPress specific cookies
Decrease load on origin servers. If a request is fetched from Cloudflare CDN Cache we skip the request to the origin server.
How is this implemented?
When an eyeball requests a page from a website and Cloudflare doesn’t have a copy of the content it will be fetched from the origin. As the response is sent from the origin and goes through Cloudflare’s edge, Cloudflare for WordPress plugin adds a custom header: cf-edge-cache. It allows an origin to configure caching rules applied on responses.
Based on the X-HTML-Edge-Cache proposal the plugin adds a cf-edge-cache header to every origin response. There are 2 possible values:
cf-edge-cache: no-cache
The page contains private information that shouldn’t be cached by the edge. For example, an active session exists on the server.
cf-edge-cache: cache, platform=wordpress
This combination of cache and platform will ensure that the HTML page is cached. In addition, we ran a number of checks against the presence of WordPress specific cookies to make sure we either bypass or allow caching on the Edge.
If the header isn’t present we assume that the Cloudflare for WordPress plugin is not installed or up-to-date. In this case the feature operates without a plugin support.
Edge caching without plugin
Using the Automatic Platform Optimization feature in combination with Cloudflare for WordPress plugin is our recommended solution. It provides the best feature set together with almost instant cache invalidation. Still, we wanted to provide performance improvements without the need for any installation on the origin server.
We provide the following features set when the plugin is not activated:
HTML edge caching with 30 days TTL
Cache invalidation may take up to 30 minutes. A manual cache purge could be triggered to speed up cache invalidation
Bypass HTML caching based on presence of WordPress specific cookies
No decreased load on origin servers. If a request is fetched from Cloudflare CDN Cache we still require an origin response to apply cache invalidation logic.
Without Cloudflare for WordPress plugin we still cache HTML on the edge and serve the content from the cache when possible. The logic of cache revalidation happens after serving the response to the eyeball. Worker’s waitUntil() callback allows the user to run code without affecting the response to the eyeball and is run in background.
We rely on the following headers to detect whether the content is stale and requires cache update:
ETag. If the cached version and origin response both include ETag and they are different we replace cached version with origin response. The behavior is the same for strong and weak ETag values.
Last-Modified. If the cached version and origin response both include Last-Modified and origin has a later Last-Modified date we replace cached version with origin response.
Date. If no ETag or Last-Modified header is available we compare cached version and origin response Date values. If there was more than a 30 minutes difference we replace cached version with origin response.
Getting content everywhere
Cloudflare Cache works great for the frequently requested content. Regular requests to the site make sure the content stays in cache. For a typical personal blog, it will be more common that the content stays in cache only in some parts of our vast edge network. With the Automatic Platform Optimization release we wanted to improve loading time for cache cold start from any location in the world. We explored different approaches and decided to use Workers KV to improve Edge Caching.
In addition to Cloudflare’s CDN cache we put the content into Workers KV. It only requires a single request to the page to cache it and within a minute it is made available to be read back from KV from any Cloudflare data center.
Updating content
After an update has been made to the WordPress website the plugin makes a request to Cloudflare’s API which both purges cache and marks content as stale in KV. The next request for the asset will trigger revalidation of the content. If the plugin is not enabled cache revalidation logic is triggered as detailed previously.
We serve the stale copy of the content still present in KV and asynchronously fetch new content from the origin, apply possible optimizations and then cache it (both regular local CDN cache and globally in KV).
To store the content in KV we use a single namespace. It’s keyed with a combination of a zone identifier and the URL. For instance:
For marking content as stale in KV we write a new key which will be read from the edge. If the key is present we will revalidate the content.
stale:1:example.com/blog-post-1.html => ""
Once the content was revalidated the stale marker key is deleted.
Moving optimizations to the edge
On top of caching HTML at the edge, we can pre-process and transform the HTML to make the loading of websites even faster for the user. Moving the development of this feature to our Cloudflare Workers environment makes it easy to add performance features such as improving Google Font loading. Using Google Fonts can cause significant performance issues as to load a font requires loading the HTML page; then loading a CSS file and finally loading the font. All of these steps are using different domains.
The solution is for the worker to inline the CSS and serve the font directly from the edge minimizing the number of connections required.
If you read through the previous blog post’s implementation it required a lot of manual work to provide streaming HTML processing support and character encodings. As the set of worker APIs have improved over time it is now much simpler to implement. Specifically the addition of a streaming HTML rewriter/parser with CSS-selector based API and the ability to suspend the parsing to asynchronously fetch a resource has reduced the code required to implement this from ~600 lines of source code to under 200.
The HTML transformation doesn’t block the response to the user. It’s running as a background task which when complete will update kv and replace the global cached version.
Making edge publishing generic
We are launching the feature for WordPress specifically but the concept can be applied to any website and content management system (CMS).
This post is courtesy of Eitan Sela, Senior Startup Solutions Architect.
Many customers want to deploy machine learning models for real-time inference, and pay only for what they use. Using Amazon EC2 instances for real-time inference may not be cost effective to support sporadic inference requests throughout the day.
AWS Lambda is a serverless compute service with pay-per-use billing. However, ML frameworks like XGBoost are too large to fit into the 250 MB application artifact size limit, or the 512 MB /tmp space limit. While you can store the packages in Amazon S3 and download to Lambda (up to 3 GB), this can increase the cost.
With this new capability, it’s now easier to use Python packages in Lambda that require storage space to load models and other dependencies.
In this blog post, I walk through how to:
Create an EFS file system and an Access Point as an application-specific entry point.
Provision an EC2 instance, mount EFS using the Access Point, and train a breast cancer XGBoost ML model. XGBoost, Python packages, and the model are saved on the EFS file system.
Create a Lambda function that loads the Python packages and model from EFS, and performs the prediction based on a test event.
Create an Amazon EFS file system with an Access Point
It can take up to 10 minutes for the CloudFormation stack to create the resources. After the resource creation is complete, navigate to the EFS console to see the new file system.
Navigate to the Access Points panel to see a new Access Point with the File system ID from the previous page.
Note the Access Point ID and File System ID for the following sections.
Launch an Amazon EC2 instance to train a breast cancer model
In this section, you install Python packages on the EFS file system, after mounting it to EC2. You then train the breast cancer model, and save the model in the EFS file system used by the Lambda function.
The machine learning framework you use for this function is XGBoost. This is an optimized distributed gradient boosting library designed to be highly efficient, flexible, and portable. XGBoost is one of the most popular machine learning algorithms.
Navigate to the EC2 console to see the new EC2 instance created from the CloudFormation stack. This is an Amazon Linux 2 c5.large EC2 instance named ‘xgboost-for-serverless-inference-cfn-ec2’. In the instance details, you see that the security group is configured to allow inbound SSH access (for connecting to the instance).
Mount the EFS file system on the EC2
Connect to the instance using SSH and mount the EFS file system previously created by using the Access Point:
Verify the installation: python3 --version pip3 --version
Create a requirements.txt file containing the dependencies: xgboost==1.1.1 pandas sklearn joblib
Install the Python packages using the requirements file: pip3 install -t efs/lib/ -r requirements.txt
Note: using bursting throughput mode with EFS File system, this action can take up to 10 minutes.
Set the Python path to refer to the installed packages directory of EFS file system: export PYTHONPATH=/home/ec2-user/efs/lib/
Train the breast cancer model
The breast cancer model predicts whether the breast mass is a malignant tumor or benign by looking at features computed from a digitized image of a fine needle aspirate of a breast mass.
The data used to train the model consists of the diagnosis in addition to the 10 real-valued features that are computed for each cell nucleus. Such features include radius, texture, perimeter, area, smoothness, compactness, concavity, concave points, symmetry, and fractal dimension. The prediction returned by the model is either “B” for benign or “M” for malignant. This sample project uses the public Breast Cancer Wisconsin (Diagnostic) dataset.
After installing the required Python packages, train a XGBoost model on the breast cancer dataset:
Create a bc_xgboost_train.py file containing the Python code needed to train a breast cancer XGBoost model. Download the code here.
Start the training of the model:python3 bc_xgboost_train.pyYou see the following message:The model file bc-xgboost-model is created in the root directory.
Create a new directory on the EFS file system and copy the XGBoost breast cancer model: mkdir efs/model cp bc-xgboost-model efs/model/
Check you have the required Python packages and the model on the EFS file system: ls efs/model/ efs/lib/
You see all the Python packages installed previously in the lib directory, and the model file in the model directory.
Review the total size of lib Python packages directory: du -sh efs/lib/
You can see that the total size of lib directory is 534 MB. This is a larger package size than was allowed before EFS for Lambda.
Building a serverless machine learning inference using Lambda
In this section, you use the EFS file system previously configured for the Lambda function to import the required libraries and load the model.
Using EFS with Lambda
The AWS SAM template creates the Lambda function, mount the EFS Access Point created earlier, and both IAM roles required.
It takes several minutes for the AWS SAM CLI to create the Lambda function. After, navigate to the Lambda console to see the created Lambda function.
In the Lambda function configuration, you see the environment variables, and basic settings, such as runtime, memory, and timeout.
Further down, you see that the Lambda function has the VPC access configured, and the file system is mounted.
Test your Lambda function
In the Lambda console, select Configure test events from the Test events dropdown.
For Event Name, enter InferenceTestEvent.
Copy the event JSON from here and paste in the dialog box.
Choose Create. After saving, you see InferenceTestEvent in the Test list. Now choose Test.
You see the Lambda function inference result, log output, and duration:
Conclusion
In this blog post, you train an XGBoost breast cancer model using Python packages installed on an Amazon EFS file system. You create an AWS Lambda function that loads the Python packages and the model from EFS file system, and perform the predictions.
Now you know how to call a machine learning model inference using a Lambda function. To learn more about other real-world examples, see:
This post is courtesy of Prateek Mehrotra, Software Development Engineer.
AWS Lambda integrates natively with Amazon Kinesis as a consumer to process data ingested through a data stream. The polling, checkpointing, and error handling complexities are abstracted when you use this native integration. This allows the Lambda function code to focus on business logic processing.
This blog post describes how to operate and optimize this integration at high throughput with low system overhead time and processing latencies.
To learn more about Kinesis concepts and terminology, visit the documentation page.
Overview
You can attach a Lambda function to a Kinesis stream to process data. Multiple Lambda functions can consume from a single Kinesis stream for different kinds of processing independently. These can be used alongside other consumers such as Amazon Kinesis Data Firehose.
If a Kinesis stream has ‘n’ shards, then at least ‘n’ concurrency is required for a consuming Lambda function to process data without any induced delay. Less than ‘n’ available concurrency results in elevated iterator age in the Kinesis stream and elevated iterator age in the Lambda consumer. In a multi-consumer paradigm, if the Kinesis iterator age spikes then at least one of the stream consumers also reports a corresponding iterator age spike.
When the parallelization factor is greater than 1 for a Lambda consumer, the record processor polls up-to ‘parallelization-factor’ partition keys at a time while processing from a single shard. To learn more, read about handling traffic with a parallelization factor.
Kinesis shard level metrics
When using Kinesis streams, it’s best practice to enable enhanced shard level metrics. These metrics can help in detecting if the data distribution is happening uniformly within the shards of the stream, or not.
In a single-source, multiple-consumer use case, enhanced shard level metrics can help identify the cause of elevated iterator age. This could be due to a single shard receiving data too quickly, or at least one of the consumers failing to process the data.
To learn more about Kinesis monitoring, visit the documentation page. If per-partition processing is not a requirement, distribute data uniformly across shards. To learn more about Kinesis partition keys, visit the documentation page.
Processing delay caused by consumer misconfiguration
Kinesis reports an iterator age metric. If this value spikes, data processing from the stream is delayed. The metric value is set by the earliest record read from the stream measured over the specified time period.
This delay slows the data processing of the pipeline. This happens when a single shard is receiving data faster than the consumer can process it or the consumer is failing to complete processing due to errors.
In a single-source, multiple-consumer use case, at least one of the consumers shows a corresponding iterator age spike. If there are multiple Lambda consumers of the same data stream, then each Lambda consumer will report its own iterator age metric. This helps identify the problematic consumer for further analysis.
Tuning the configuration to optimize for iterator age
There are several tuning options available when the iterator age is increasing for the consumer Lambda function.
1. Increase the batch size
If the Lambda function operates at a low maximum duration, a single invocation may process less than a maximum batch size. Increase the batch size (up to a maximum of 10,000) to read more records from a shard in a single batch. This can help normalize the iterator age.
2. Change the parallelization factor
Increasing the parallelization factor in the Lambda function allows concurrent invocations to read a single shard. Multiple batches of records are created in the shard based on partition keys, resulting in faster data consumption.
Iterator age can spike when the batch size is set to 10,000 and the parallelization factor is set to 10. This can happen when data is produced faster than the consumer can process it, backing up the per-shard/per-partition queues. To mitigate this, subdivide the partition into multiple keys. This helps distribute the data for that partition key more evenly across shards.
3. Reduce the batch window
If data is distributed unequally across shards, or there is low write volume from producers, the Lambda poller may wait for an entire batch. You can reduce this wait time by reducing the batch window, which results in faster processing.
To learn more about Lambda poller batch window for Kinesis, visit the documentation page.
4. De-scale the Kinesis stream if overprovisioned
If the Kinesis stream metrics indicate that the stream is over-provisioned, de-scaling the stream helps increase data compaction within shards. This results in better throughput per Lambda invocation.
After reducing stream size, reduce the Lambda concurrency to maintain a 1:1 ratio of shard count to Lambda concurrency mapping. As load increases, increase the parallelization factor the keep the shard size constant. With this increase, the Lambda concurrency should be at least shard count * parallelization factor.
Enhanced fan-out allows developers to scale up the number of stream consumers by offering each stream consumer its own read throughput.
To learn more about Kinesis enhanced fan-out, visit the documentation page.
Conclusion
This blog post shows some of the best practices when using Lambda with Kinesis. It covers operational levers for high-throughput, low latency, single source data processing pipelines.
The enhanced Amazon Kinesis shard level metrics help monitor the maximum overhead processing delay per shard. When correlated with the Lambda consumer’s iterator age metrics, this shows each consumer’s performance. The effective combination of batch size, parallelization factor, batch window, and partition key can lead to more efficient stream processing.
Most serverless application architectures use a combination of different AWS services, microservices, and AWS Lambda functions. Messaging services are important in allowing distributed applications to communicate with each other, and are fundamental to most production serverless workloads.
Messaging services can improve the resilience, availability, and scalability of applications, when used appropriately. They can also enable your applications to communicate beyond your workload or even the AWS Cloud, and provide extensibility for future service features and versions.
In this blog post, I compare the primary messaging services offered by AWS and how you can use these in your serverless application architectures. I also show how you use and deploy these integrations with the AWS Serverless Application Model (AWS SAM).
Examples in this post refer to code that can be downloaded from this GitHub repository. The README.md file explains how to deploy and run each example.
Overview
Three of the most useful messaging patterns for serverless developers are queues, publish/subscribe, and event buses. In AWS, these are provided by Amazon SQS, Amazon SNS, and Amazon EventBridge respectively. All of these services are fully managed and highly available, so there is no infrastructure to manage. All three integrate with Lambda, allowing you to publish messages via the AWS SDK and invoke functions as targets. Each of these services has an important role to play in serverless architectures.
SNS enables you to send messages reliably between parts of your infrastructure. It uses a robust retry mechanism for when downstream targets are unavailable. When the delivery policy is exhausted, it can optionally send those messages to a dead-letter queue for further processing. SNS uses topics to logically separate messages into channels, and your Lambda functions interact with these topics.
SQS provides queues for your serverless applications. You can use a queue to send, store, and receive messages between different services in your workload. Queues are an important mechanism for providing fault tolerance in distributed systems, and help decouple different parts of your application. SQS scales elastically, and there is no limit to the number of messages per queue. The service durably persists messages until they are processed by a downstream consumer.
EventBridge is a serverless event bus service, simplifying routing events between AWS services, software as a service (SaaS) providers, and your own applications. It logically separates routing using event buses, and you implement the routing logic using rules. You can filter and transform incoming messages at the service level, and route events to multiple targets, including Lambda functions.
Integrating an SQS queue with AWS SAM
The first example shows an AWS SAM template defining a serverless application with two Lambda functions and an SQS queue:
You can declare an SQS queue in an AWS SAM template with the AWS::SQS::Queue resource:
MySqsQueue:
Type: AWS::SQS::Queue
To publish to the queue, the publisher function must have permission to send messages. Using an AWS SAM policy template, you can apply policy that enables send messaging to one specific queue:
The AWS SAM template passes the queue name into the Lambda function as an environment variable. The function uses the sendMessage method of the AWS.SQS class to publish the message:
const AWS = require('aws-sdk')
AWS.config.region = process.env.AWS_REGION
const sqs = new AWS.SQS({apiVersion: '2012-11-05'})
// The Lambda handler
exports.handler = async (event) => {
// Params object for SQS
const params = {
MessageBody: `Message at ${Date()}`,
QueueUrl: process.env.SQSqueueName
}
// Send to SQS
const result = await sqs.sendMessage(params).promise()
console.log(result)
}
When the SQS queue receives the message, it publishes to the consuming Lambda function. To configure this integration in AWS SAM, the consumer function is granted the SQSPollerPolicy policy. The function’s event source is set to receive messages from the queue in batches of 10:
The payload for the consumer function is the message from SQS. This is an array of messages up to the batch size, containing a body attribute with the publishing function’s MessageBody. You can see this in the CloudWatch log for the function:
Integrating an SNS topic with AWS SAM
The second example shows an AWS SAM template defining a serverless application with three Lambda functions and an SNS topic:
You declare an SNS topic and the subscribing Lambda functions with the AWS::SNS:Topic resource:
The SNSPublishMessagePolicy policy template grants permission to the publishing function to send messages to the topic. In the function, the publish method of the AWS.SNS class handles publishing:
const AWS = require('aws-sdk')
AWS.config.region = process.env.AWS_REGION
const sns = new AWS.SNS({apiVersion: '2012-11-05'})
// The Lambda handler
exports.handler = async (event) => {
// Params object for SNS
const params = {
Message: `Message at ${Date()}`,
Subject: 'New message from publisher',
TopicArn: process.env.SNStopic
}
// Send to SQS
const result = await sns.publish(params).promise()
console.log(result)
}
The payload for the consumer functions is the message from SNS. This is an array of messages, containing subject and message attributes from the publishing function. You can see this in the CloudWatch log for the function:
Differences between SQS and SNS configurations
SQS queues and SNS topics offer different functionality, though both can publish to downstream Lambda functions.
An SQS message is stored on the queue for up to 14 days until it is successfully processed by a subscriber. SNS does not retain messages so if there are no subscribers for a topic, the message is discarded.
SNS topics may broadcast to multiple targets. This behavior is called fan-out. It can be used to parallelize work across Lambda functions or send messages to multiple environments (such as test or development). An SNS topic can have up to 12,500,000 subscribers, providing highly scalable fan-out capabilities. The targets may include HTTP/S endpoints, SMS text messaging, SNS mobile push, email, SQS, and Lambda functions.
In AWS SAM templates, you can retrieve properties such as ARNs and names of queues and topics, using the following intrinsic functions:
Amazon SQS
Amazon SNS
Channel type
Queue
Topic
Get ARN
!GetAtt MySqsQueue.Arn
!Ref MySnsTopic
Get name
!GetAtt MySqsQueue.QueueName
!GetAtt MySnsTopic.TopicName
Integrating with EventBridge in AWS SAM
The third example shows the AWS SAM template defining a serverless application with two Lambda functions and an EventBridge rule:
The default event bus already exists in every AWS account. You declare a rule that filters events in the event bus using the AWS::Events::Rule resource:
The rule describes an event pattern specifying matching JSON attributes. Events that match this pattern are routed to the list of targets. You provide the EventBridge service with permission to invoke the Lambda functions in the target list:
The publishing function then uses the putEvents method of the AWS.EventBridge class, which returns after the events have been durably stored in EventBridge:
The payload for the consumer function is the message from EventBridge. This is an array of messages, containing subject and message attributes from the publishing function. You can see this in the CloudWatch log for the function:
Comparing SNS with EventBridge
SNS and EventBridge have many similarities. Both can be used to decouple publishers and subscribers, filter messages or events, and provide fan-in or fan-out capabilities. However, there are differences in the list of targets and features for each service, and your choice of service depends on the needs of your use-case.
EventBridge offers two newer capabilities that are not available in SNS. The first is software as a service (SaaS) integration. This enables you to authorize supported SaaS providers to send events directly from their EventBridge event bus to partner event buses in your account. This replaces the need for polling or webhook configuration, and creates a highly scalable way to ingest SaaS events directly into your AWS account.
The second feature is the Schema Registry, which makes it easier to discover and manage OpenAPI schemas for events. EventBridge can infer schemas based on events routed through an event bus by using schema discovery. This can be used to generate code bindings directly to your IDE for type-safe languages like Python, Java, and TypeScript. This can help accelerate development by automating the generation of classes and code directly from events.
This table compares the major features of both services:
You can subscribe your AWS Lambda functions to an Amazon SNS topic in any Region.
Targets must be in the same Region. You can publish across Regions to another event bus.
Retry policy
For SQS/Lambda, exponential backoff over 23 days.
For SMTP, SMS and Mobile push, exponential backoff over 6 hours.
At-least-once event delivery to targets, including retry with exponential backoff for up to 24 hours.
Conclusion
Messaging is an important part of serverless applications and AWS services provide queues, publish/subscribe, and event routing capabilities. This post reviews the main features of SNS, SQS, and EventBridge and how they provide different capabilities for your workloads.
I show three example applications that publish and consume events from the three services. I walk through AWS SAM syntax for deploying these resources in your applications. Finally, I compare differences between the services.
Today the Cloudflare Workers team is thrilled to announce the launch of Cron Triggers. Before now, Workers were triggered purely by incoming HTTP requests but starting today you’ll be able to set a scheduler to run your Worker on a timed interval. This was a highly requested feature that we know a lot of developers will find useful, and we’ve heard your feedback after Serverless Week.
We are excited to offer this feature at no additional cost, and it will be available on both the Workers free tier and the paid tier, now called Workers Bundled. Since it doesn’t matter which city a Cron Trigger routes the Worker through, we are able to maximize Cloudflare’s distributed system and send scheduled jobs to underutilized machinery. Running jobs on these quiet machines is both efficient and cost effective, and we are able to pass those cost savings down to you.
What is a Cron Trigger and how might I use such a feature?
In case you’re not familiar with Unix systems, the cron pattern allows you to schedule jobs to run periodically at fixed intervals or at scheduled times. Cron Triggers in the context of Workers allow users to set time-based invocations for the job. These Workers happen on a recurring schedule, and differ from traditional Workers in that they do not fire on HTTP requests.
Most developers are familiar with the cron pattern and its usefulness across a wide range of applications. Pulling the latest data from APIs or running regular integration tests on a preset schedule are common examples of this.
“We’re excited about Cron Triggers. Workers is crucial to our stack, so using this feature for live integration tests will boost the developer experience.” – Brian Marks, Software Engineer at Bazaarvoice
How much does it cost to use Cron Triggers?
Triggers are included at no additional cost! Scheduled Workers count towards your request cap for both the free tier and Workers Bundled, but rest assured that there will be no hidden or extra fees. Our competitors charge extra for cron events, or in some cases offer a very limited free tier. We want to make this feature widely accessible and have decided not to charge on a per-trigger basis. While there are no limits for the number of triggers you can have across an account, note that there is a limit of 3 triggers per Worker script for this feature. You can read more about limits on Workers plans in this documentation.
How are you able to offer this feature at no additional cost?
Cloudflare supports a massive distributed system that spans the globe with 200+ cities. Our nodes are named for the IATA airport code that they are closest to. Most of the time we run Workers close to the request origin for performance reasons (ie SFO if you are in the Bay Area, or CDG if you are lucky enough to be in Paris 🥐🍷🧀). In a typical HTTP Worker, we do this because we know that performance is of material importance when someone is waiting for the response.
In the case of Cron Triggers, where the user is running a task on a timed basis, those performance needs are different. A few milliseconds of extra latency do not matter as much when the user isn’t actively waiting for the response. The nature of the feature gives us much more flexibility on where to run the job, since it doesn’t have to necessarily be in a city close to the end user.
Cron Triggers are run on underutilized machines to make the best use of our capacity and route traffic efficiently. For example, a job scheduled from San Francisco at 7pm Pacific Time might be sent to Paris because it’s 4am there and traffic across Europe is low. Sending traffic to these machines during quiet hours is very efficient, and we are more than happy to pass those cost savings down to you. Aside from this scheduling optimization, Workers that are called by Cron Triggers behave similarly to and have all of the same performance and security benefits as typical HTTP Workers.
What’s happening below the hood?
At a high level, schedules created through our API create records in our database. These records contain the information necessary to execute the Worker on the given cron schedule. These records are then picked up by another service which continuously evaluates the state of our edge and distributes the schedules among cities. Once the schedules have been distributed to the edge, a service running in the node polls for changes to the schedules and makes sure they get sent to our runtime at the appropriate time.
If you want to know more details about how we implemented this feature, please refer to the technical blog.
What’s coming next?
With this feature, we’ve expanded what’s possible to build with Workers, and further simplified the developer experience. While Workers previously only ran on web requests, we believe the future of edge computing isn’t strictly tied to HTTP requests and responses. We want to introduce more types of Workers in the future.
We plan to expand out triggers to include different types, such as data or event-based triggers. Our goal is to give users more flexibility and control over when their Workers run. Cron Triggers are our first step in this direction. In addition, we plan to keep iterating on Cron Triggers to make edge infrastructure selection even more sophisticated and optimized — for example, we might even consider triggers that allow our users to run in the most energy-efficient data centers.
How to try Cron Triggers
Cron triggers are live today! You can try it in the Workers dashboard by creating a new Worker and setting up a Cron Trigger.
Today, we are excited to launch Cron Triggers to the Cloudflare Workers serverless compute platform. We’ve heard the developer feedback, and we want to give our users the ability to run a given Worker on a scheduled basis. In case you’re not familiar with Unix systems, the cron pattern allows developers to schedule jobs to run at fixed intervals. This pattern is ideal for running any types of periodic jobs like maintenance or calling third party APIs to get up-to-date data. Cron Triggers has been a highly requested feature even inside Cloudflare and we hope that you will find this feature as useful as we have!
Where are Cron Triggers going to be run?
Cron Triggers are executed from the edge. At Cloudflare, we believe strongly in edge computing and wanted our new feature to get all of the performance and reliability benefits of running on our edge. Thus, we wrote a service in core that is responsible for distributing schedules to a new edge service through Quicksilver which will then trigger the Workers themselves.
What’s happening under the hood?
At a high level, schedules created through our API create records in our database with the information necessary to execute the Worker and the given cron schedule. These records are then picked up by another service which continuously evaluates the state of our edge and distributes the schedules between cities.
Once the schedules have been distributed to the edge, a service running in the edge node polls for changes to the schedules and makes sure they get sent to our runtime at the appropriate time.
New Event Type
Cron Triggers gave us the opportunity to finally recognize a new Worker ‘type’ in our API. While Workers currently only run on web requests, we have lots of ideas for the future of edge computing that aren’t strictly tied to HTTP requests and responses. Expect to see even more new handlers in the future for other non-HTTP events like log information from your Worker (think custom wrangler tail!) or even TCP Workers.
Where event has the following interface in Typescript:
interface ScheduledEvent {
type: 'scheduled';
scheduledTime: int; // milliseconds since the Unix epoch
}
As long as your Worker has a handler for this new event type, you’ll be able to give it a schedule.
New APIs
PUT /client/v4/accounts/:account_identifier/workers/scripts/:name
The script upload API remains the same, but during script validation we now detect and return the registered event handlers.
PUT /client/v4/accounts/:account_identifier/workers/scripts/:name/schedules
Body
[
{"cron": "* * * * *"},
...
]
This will create or modify all schedules for a script, removing all schedules not in the list. For now, there’s a limit of 3 distinct cron schedules. Schedules can be set to run as often as one minute and don’t accept schedules with years in them (sorry, you’ll have to run your Y3K migration script another way).
GET /client/v4/accounts/:account_identifier/workers/scripts/:name/schedules
The Scheduler service is responsible for reading the schedules from Postgres and generating per-node schedules to place into Quicksilver. For now, the service simply avoids trying to execute your Worker on an edge node that may be disabled for some reason, but such an approach also gives us a lot of flexibility in deciding where your Worker executes.
In addition to edge node availability, we could optimize for compute cost, bandwidth, or even latency in the future!
What’s actually executing these schedules?
To consume the schedules and actually trigger the Worker, we built a new service in Rust and deployed to our edge using HashiCorp Nomad. Nomad ensures that the schedule runner remains running in the edge node and can move it between machines as necessary. Rust was the best choice for this service since it needed to be fast with high availability and Cap’n Proto RPC support for calling into the runtime. With Tokio, Anyhow, Clap, and Serde, it was easy to quickly get the service up and running without having to really worry about async, error handling, or configuration.
On top of that, due to our specific needs for cron parsing, we built a specialized cron parser using nom that allowed us to quickly parse and compile expressions into values that check against a given time to determine if we should run a schedule.
Once the schedule runner has the schedules, it checks the time and selects the Workers that need to be run. To let the runtime know it’s time to run, we send a Cap’n Proto RPC message. The runtime then does its thing, calling the new ‘scheduled’ event handler instead of ‘fetch’.
How can I try this?
As of today, the Cron Triggers feature is live! Please try it out by creating a Worker and finding the Triggers tab – we’re excited to see what you build with it!
We launched Cloudflare Workers® in 2017 with a radical vision: code running at the network edge could not only improve performance, but also be easier to deploy and cheaper to run than code running in a single datacenter. That vision means Workers is about more than just edge compute — we’re rethinking how applications are built.
Using a “serverless” approach has allowed us to make deploys dead simple, and using isolate technology has allowed us to deliver serverless more cheaply and without the lengthy cold starts that hold back other providers. We added easy-to-use eventually-consistent edge storage to the platform with Workers KV.
But up until today, it hasn’t been possible to manage state with strong consistency, or to coordinate in real time between multiple clients, entirely on the edge. Thus, these parts of your application still had to be hosted elsewhere.
Durable Objects provide a truly serverless approach to storage and state: consistent, low-latency, distributed, yet effortless to maintain and scale. They also provide an easy way to coordinate between clients, whether it be users in a particular chat room, editors of a particular document, or IoT devices in a particular smart home. Durable Objects are the missing piece in the Workers stack that makes it possible for whole applications to run entirely on the edge, with no centralized “origin” server at all.
Today we are beginning a closed beta of Durable Objects.
I’m going to be honest: naming this product was hard, because it’s not quite like any other cloud technology that is widely-used today. This proverbial bike shed has many layers of paint, but ultimately we settled on “Unique Durable Objects”, or “Durable Objects” for short. Let me explain what they are by breaking that down:
Objects: Durable Objects are objects in the sense of Object-Oriented Programming. A Durable Object is an instance of a class — literally, a class definition written in JavaScript (or your language of choice). The class has methods which define its public interface. An object is an instance of this class, combining the code with some private state.
Unique: Each object has a globally-unique identifier. That object exists in only one location in the whole world at a time. Any Worker running anywhere in the world that knows the object’s ID can send messages to it. All those messages end up delivered to the same place.
Durable: Unlike a normal object in JavaScript, Durable Objects can have persistent state stored on disk. Each object’s durable state is private to it, which means not only that access to storage is fast, but the object can even safely maintain a consistent copy of the state in memory and operate on it with zero latency. The in-memory object will be shut down when idle and recreated later on-demand.
What can they do?
Durable Objects have two primary abilities:
Storage: Each object has attached durable storage. Because this storage is private to a specific object, the storage is always co-located with the object. This means the storage can be very fast while providing strong, transactional consistency. Durable Objects apply the serverless philosophy to storage, splitting the traditional large monolithic databases up into many small, logical units. In doing so, we get the advantages you’ve come to expect from serverless: effortless scaling with zero maintenance burden.
Coordination: Historically, with Workers, each request would be randomly load-balanced to a Worker instance. Since there was no way to control which instance received a request, there was no way to force two clients to talk to the same Worker, and therefore no way for clients to coordinate through Workers. Durable Objects change that: requests related to the same topic can be forwarded to the same object, which can then coordinate between them, without any need to touch storage. For example, this can be used to facilitate real-time chat, collaborative editing, video conferencing, pub/sub message queues, game sessions, and much more.
The astute reader may notice that many coordination use cases call for WebSockets — and indeed, conversely, most WebSocket use cases require coordination. Because of this complementary relationship, along with the Durable Objects beta, we’ve also added WebSocket support to Workers. For more on this, see the Q&A below.
Region: Earth
When using Durable Objects, Cloudflare automatically determines the Cloudflare datacenter that each object will live in, and can transparently migrate objects between locations as needed.
Traditional databases and stateful infrastructure usually require you to think about geographical “regions”, so that you can be sure to store data close to where it is used. Thinking about regions can often be an unnatural burden, especially for applications that are not inherently geographical.
With Durable Objects, you instead design your storage model to match your application’s logical data model. For example, a document editor would have an object for each document, while a chat app would have an object for each chat. There is no problem creating millions or billions of objects, as each object has minimal overhead.
Let’s say you have a spreadsheet editor application — or, really, any kind of app where users edit a complex document. It works great for one user, but now you want multiple users to be able to edit it at the same time. How do you accomplish this?
For the standard web application stack, this is a hard problem. Traditional databases simply aren’t designed to be real-time. When Alice and Bob are editing the same spreadsheet, you want every one of Alice’s keystrokes to appear immediately on Bob’s screen, and vice versa. But if you merely store the keystrokes to a database, and have the users repeatedly poll the database for new updates, at best your application will have poor latency, and at worst you may find database transactions repeatedly fail as users on opposite sides of the world fight over editing the same content.
The secret to solving this problem is to have a live coordination point. Alice and Bob connect to the same coordinator, typically using WebSockets. The coordinator then forwards Alice’s keystrokes to Bob and Bob’s keystrokes to Alice, without having to go through a storage layer. When Alice and Bob edit the same content at the same time, the coordinator resolves conflicts instantly. The coordinator can then take responsibility for updating the document in storage — but because the coordinator keeps a live copy of the document in-memory, writing back to storage can happen asynchronously.
Every big-name real-time collaborative document editor works this way. But for many web developers, especially those building on serverless infrastructure, this kind of solution has long been out-of-reach. Standard serverless infrastructure — and even cloud infrastructure more generally — just does not make it easy to assign these coordination points and direct users to talk to the same instance of your server.
Durable Objects make this easy. Not only do they make it easy to assign a coordination point, but Cloudflare will automatically create the coordinator close to the users using it and migrate it as needed, minimizing latency. The availability of local, durable storage means that changes to the document can be saved reliably in an instant, even if the eventual long-term storage is slower. Or, you can even store the entire document on the edge and abandon your database altogether.
With Durable Objects lowering the barrier, we hope to see real-time collaboration become the norm across the web. There’s no longer any reason to make users refresh for updates.
Example: An atomic counter
Here’s a very simple example of a Durable Object which can be incremented, decremented, and read over HTTP. This counter is consistent even when receiving simultaneous requests from multiple clients — none of the increments or decrements will be lost. At the same time, reads are served entirely from memory, no disk access needed.
export class Counter {
// Constructor called by the system when the object is needed to
// handle requests.
constructor(controller, env) {
// `controller.storage` is an interface to access the object's
// on-disk durable storage.
this.storage = controller.storage
}
// Private helper method called from fetch(), below.
async initialize() {
let stored = await this.storage.get("value");
this.value = stored || 0;
}
// Handle HTTP requests from clients.
//
// The system calls this method when an HTTP request is sent to
// the object. Note that these requests strictly come from other
// parts of your Worker, not from the public internet.
async fetch(request) {
// Make sure we're fully initialized from storage.
if (!this.initializePromise) {
this.initializePromise = this.initialize();
}
await this.initializePromise;
// Apply requested action.
let url = new URL(request.url);
switch (url.pathname) {
case "/increment":
++this.value;
await this.storage.put("value", this.value);
break;
case "/decrement":
--this.value;
await this.storage.put("value", this.value);
break;
case "/":
// Just serve the current value. No storage calls needed!
break;
default:
return new Response("Not found", {status: 404});
}
// Return current value.
return new Response(this.value);
}
}
Once the class has been bound to a Durable Object namespace, a particular instance of Counter can be accessed from anywhere in the world using code like:
// Derive the ID for the counter object named "my-counter".
// This name is associated with exactly one instance in the
// whole world.
let id = COUNTER_NAMESPACE.idFromName("my-counter");
// Send a request to it.
let response = await COUNTER_NAMESPACE.get(id).fetch(request);
Demo: Chat
Chat is arguably real-time collaboration in its purest form. And to that end, we have built a demo open source chat app that runs entirely at the edge using Durable Objects.
This chat app uses a Durable Object to control each chat room. Users connect to the object using WebSockets. Messages from one user are broadcast to all the other users. The chat history is also stored in durable storage, but this is only for history. Real-time messages are relayed directly from one user to others without going through the storage layer.
Additionally, this demo uses Durable Objects for a second purpose: Applying a rate limit to messages from any particular IP. Each IP is assigned a Durable Object that tracks recent request frequency, so that users who send too many messages can be temporarily blocked — even across multiple chat rooms. Interestingly, these objects don’t actually store any durable state at all, because they only care about very recent history, and it’s not a big deal if a rate limiter randomly resets on occasion. So, these rate limiter objects are an example of a pure coordination object with no storage.
This chat app is only a few hundred lines of code. The deployment configuration is only a few lines. Yet, it will scale seamlessly to any number of chat rooms, limited only by Cloudflare’s available resources. Of course, any individual chat room’s scalability has a limit, since each object is single-threaded. But, that limit is far beyond what a human participant could keep up with anyway.
Other use cases
Durable Objects have infinite uses. Here are just a few ideas, beyond the ones described above:
Shopping cart: An online storefront could track a user’s shopping cart in an object. The rest of the storefront could be served as a fully static web site. Cloudflare will automatically host the cart object close to the end user, minimizing latency.
Game server: A multiplayer game could track the state of a match in an object, hosted on the edge close to the players.
IoT coordination: Devices within a family’s house could coordinate through an object, avoiding the need to talk to distant servers.
Social feeds: Each user could have a Durable Object that aggregates their subscriptions.
Comment/chat widgets: A web site that is otherwise static content can add a comment widget or even a live chat widget on individual articles. Each article would use a separate Durable Object to coordinate. This way the origin server can focus on static content only.
The Future: True Edge Databases
We see Durable Objects as a low-level primitive for building distributed systems. Some applications, like those mentioned above, can use objects directly to implement a coordination layer, or maybe even as their sole storage layer.
However, Durable Objects today are not a complete database solution. Each object can see only its own data. To perform a query or transaction across multiple objects, the application needs to do some extra work.
That said, every big distributed database – whether it be relational, document, graph, etc. – is, at some low level, composed of “chunks” or “shards” that store one piece of the overall data. The job of a distributed database is to coordinate between chunks.
We see a future of edge databases that store each “chunk” as a Durable Object. By doing so, it will be possible to build databases that operate entirely at the edge, fully distributed with no regions or home location. These databases need not be built by us; anyone can potentially build them on top of Durable Objects. Durable Objects are only the first step in the edge storage journey.
Join the Beta
Storing data is a big responsibility which we do not take lightly. Because of the critical importance of getting it right, we are being careful. We will be making Durable Objects available gradually over the next several months.
As with any beta, this product is a work in progress, and some of what is described in this post is not fully enabled yet. Full details of beta limitations can be found in the documentation.
If you’d like to try out Durable Objects now, tell us about your use case. We’ll be selecting the most interesting use cases for early access.
As part of the Durable Objects beta, we’ve made it possible for Workers to act as WebSocket endpoints — including as a client or as a server. Before now, Workers could proxy WebSocket connections on to a back-end server, but could not speak the protocol directly.
While technically any Worker can speak WebSocket in this way, WebSockets are most useful when combined with Durable Objects. When a client connects to your application using a WebSocket, you need a way for server-generated events to be sent back to the existing socket connection. Without Durable Objects, there’s no way to send an event to the specific Worker holding a WebSocket. With Durable Objects, you can now forward the WebSocket to an Object. Messages can then be addressed to that Object by its unique ID, and the Object can then forward those messages down the WebSocket to the client.
Two years ago, we introduced Workers KV, a global key-value data store. KV is a fairly minimalist global data store that serves certain purposes well, but is not for everyone. KV is eventually consistent, which means that writes made in one location may not be visible in other locations immediately. Moreover, it implements “last write wins” semantics, which means that if a single key is being modified from multiple locations in the world at once, it’s easy for those writes to overwrite each other. KV is designed this way to support low-latency reads for data that doesn’t frequently change. However, these design decisions make KV inappropriate for state that changes frequently, or when changes need to be immediately visible worldwide.
Durable Objects, in contrast, are not primarily a storage product at all — many use cases for them do not actually utilize durable storage. To the extent that they do provide storage, Durable Objects sit at the opposite end of the storage spectrum from KV. They are extremely well-suited to workloads requiring transactional guarantees and immediate consistency. However, since transactions inherently must be coordinated in a single location, and clients on the opposite side of the world from that location will experience moderate latency due to the inherent limitations of the speed of light. Durable Objects will combat this problem by auto-migrating to live close to where they are used.
In short, Workers KV remains the best way to serve static content, configuration, and other rarely-changing data around the world, while Durable Objects are better for managing dynamic state and coordination.
Going forward, we plan to utilize Durable Objects in the implementation of Workers KV itself, in order to deliver even better performance.
Why not use CRDTs?
You can build CRDT-based storage on top of Durable Objects, but Durable Objects do not require you to use CRDTs.
Conflict-free Replicated Data Types (CRDTs), or their cousins, Operational Transforms (OTs), are a technology that allows data to be edited from multiple places in the world simultaneously without synchronization, and without data loss. For example, these technologies are commonly used in the implementation of real-time collaborative document editors, so that a user’s keypresses can show up in their local copy of the document in real time, without waiting to see if anyone else edited another part of the document first. Without getting into details, you can think of these techniques like a real time version of “git fork” and “git merge”, where all merge conflicts are resolved automatically in a deterministic way, so that everyone ends up with the same state in the end.
CRDTs are a powerful technology, but applying them correctly can be challenging. Only certain kinds of data structures lend themselves to automatic conflict resolution in a way that doesn’t lead to easy data loss. Any developer familiar with git can see the problem: arbitrary conflict resolution is hard, and any automated algorithm for it will likely get things wrong sometimes. It’s all the more difficult if the algorithm has to handle merges in arbitrary order and still get the same answer.
We feel that, for most applications, CRDTs are overly complex and not worth the effort. Worse, the set of data structures that can be represented as a CRDT is too limited for many applications. It’s usually much easier to assign a single authoritative coordination point for each document, which is exactly what Durable Objects accomplish.
With that said, CRDTs can be used on top of Durable Objects. If an object’s state lends itself to CRDT treatment, then an application could replicate that object into several objects serving different regions, which then synchronize their states via CRDT. This would make sense for applications to implement as an optimization if and when they find it is worth the effort.
Last thoughts: What does it mean for state to be “serverless”?
Traditionally, serverless has focused on stateless compute. In serverless architectures, the logical unit of compute is reduced to something fine-grained: a single event, such as an HTTP request. This works especially well because events just happened to be the logical unit of work that we think about when designing server applications. No one thinks about their business logic in units of “servers” or “containers” or “processes” — we think about events. It is exactly because of this semantic alignment that serverless succeeds in shifting so much of the logistical burden of maintaining servers away from the developer and towards the cloud provider.
However, serverless architecture has traditionally been stateless. Each event executes in isolation. If you wanted to store data, you had to connect to a traditional database. If you wanted to coordinate between requests, you had to connect to some other service that provides that ability. These external services have tended to re-introduce the operational concerns that serverless was intended to avoid. Developers and service operators have to worry not just about scaling their databases to handle increasing load, but also about how to split their database into “regions” to effectively handle global traffic. The latter concern can be especially cumbersome.
So how can we apply the serverless philosophy to state? Just like serverless compute is about splitting compute into fine-grained pieces, serverless state is about splitting state into fine-grained pieces. Again, we seek to find a unit of state that corresponds to logical units in our application. The logical unit of state in an application is not a “table” or a “collection” or a “graph”. Instead, it depends on the application. The logical unit of state in a chat app is a chat room. The logical unit of state in an online spreadsheet editor is a spreadsheet. The logical unit of state in an online storefront is a shopping cart. By making the physical unit of storage provided by the storage layer match the logical unit of state inherent in the application, we can allow the underlying storage provider (Cloudflare) to take responsibility for a wide array of logistical concerns that previously fell on the developer, including scalability and regionality.
Amazon API Gateway HTTP APIs enable you to create RESTful APIs with lower latency and lower cost than API Gateway REST APIs.
The API Gateway team is continuing work to improve and migrate popular REST API features to HTTP APIs. We are adding two of the most requested features, AWS Identity and Access Management (IAM) authorizers and AWS Lambda authorizers.
AWS IAM roles and policies offer flexible, robust, and fully managed access controls, without writing any code. You can use IAM roles and policies to control who can create and manage your APIs, in addition to who can invoke them. IAM authorization for HTTP API routes is the best choice for internal or private APIs called by other AWS services like AWS Lambda.
IAM authorization for HTTP API APIs is similar to that for REST APIs. IAM access is determined by identity policies, which are attached to IAM users, groups, or roles. These policies define what identity can access which HTTP APIs routes. See “AWS Services That Work with IAM.”
Lambda authorization
A Lambda authorizer is a Lambda function which API Gateway calls for an authorization check when a client makes a request to an HTTP API route. You can use Lambda authorizers to implement custom authorization schemes to comply with your security requirements.
New authorizer features
HTTP API Lambda authorizers have some new features compared to REST APIs. There is a new payload and response format, including a simple Boolean authorization option.
New payload versions and response format
Lambda authorizers for HTTP APIs introduce a new payload format, version 2.0. If you need compatibility to use the same Lambda authorizers for both REST and HTTP APIs, you can continue to use version 1.0.
The payload format version also determines the request format and response structure that you must send to and return from your Lambda authorizer function. The version 2.0 payload context now allows non-string values. With version 1.0, your Lambda authorizer must return an IAM policy that allows or denies access to your API route. This is the same existing functionality as REST APIs. You can use standard IAM policy syntax in the policy. For examples of IAM policies, see “Control access for invoking an API.”
If you choose the new 2.0 format version when configuring the authorizer, you can now return either a Boolean value, or an IAM policy. The Boolean value enables simple responses from the authorizer without having to construct an IAM policy, and is in the format:
The context object is optional. You can pass context properties on to Lambda integrations or access logs by using $context.authorizer.property. To learn more, see “Customizing HTTP API access logs.”
Caching authorizer responses
You can enable caching for a Lambda authorizer for up to one hour. To enable caching, your authorizer must have at least one identity source. API Gateway calls the Lambda authorizer function only when all of the specified identity sources are present. API Gateway uses the identity sources as the cache key. If a client specifies the same identity source parameters within the cache TTL, API Gateway uses the cached authorizer result. The Lambda authorizer function is not invoked.
Caching is enabled at the API Gateway level per authorizer. It is important to understand the effect of caching, particularly with simple responses and multiple routes. When using a simple response, the authorizer fully allows or denies all API requests that match the cached identity source values.
For example, you have two different routes using the same Lambda authorizer with a simple response. Both routes have different access requirements. The first route allows access to GET /list-users with an Authorization header with the value SecretTokenUsers. The second route denies access using the same header to GET /list-admins.
The Lambda authorizer has a single identity source, $request.header.Authorization, with the following code:
As both routes share the same identity source parameter, a cache result from successfully accessing /list-users with the Authorization header could allow access to /list-admins which is not intended. To cache responses differently per route, add $context.routeKey as an additional identity source. This creates a cache key that is unique for each route.
If more granular permissions are required, disable simple responses and return an IAM policy instead.
Testing Lambda authorizers
You have an existing Lambda function behind an HTTP API and want to add a Lambda authorizer using the new Boolean simple response. Create a new Lambda authorizer function with the following code.
The authorizer returns true if a header called Authorization has the value secretToken.
To create an authorizer, browse to the API Gateway console. Navigate to your HTTP API, choose Authorization under Develop, select the Attach authorizers to routes tab, and choose Create and attach an authorizer.
Create and attach HTTP API authorizer
Create the Lambda authorizer, pointing to your Lambda authorizer function. Select Payload format version2.0 with a Simple response.
Create Lambda simple authorizer settings
Enable caching and add two identity sources, $request.header.Authorization and $context.routeKey, to ensure that your cache key is unique when adding multiple routes.
Add caching and identity sources to Lambda authorizer
Choose Create and attach. The route is now using a Lambda authorizer.
HTTP API route includes Lambda authorizer
The following examples to test the API authentication use Postman but you can use any HTTP client.
Send a GET request to the HTTP APIs URL without specifying any authorization header.
Postman unauthorized GET request
API Gateway returns a 401 Unauthorized response, as expected. The required $request.header.Authorization identity source is not provided, so the Lambda authorizer is not called.
Enter a valid Authorization header key, but an invalid value.
Postman Forbidden GET request
API Gateway returns a 403 Forbidden response as the request is now passed to the Lambda authorizer, which has evaluated the value, and returned "isAuthorized": false.
Supply a valid Authorization header key and value.
Postman successful authorized GET request
API Gateway authorizes the request using the Lambda authorizer and sends the request to the Lambda function integration which returns a successful 200 response.
Lambda authorizers for HTTP APIs are configured as AWS::ApiGatewayV2::AuthorizerCloudFormation resources. Today, they are imported into AWS Serverless Application Model (AWS SAM) applications as native CloudFormation resources.
IAM and Lambda authorizers are two of the most requested features for Amazon API Gateway HTTP APIs. You can now use IAM authorization in a similar way to API Gateway REST APIs. Lambda authorizers for HTTP APIs offer the option of a simpler Boolean response with the new version 2.0 payload and response format. You configure identity sources to specify the location of data that’s required to authorize a request, which are also used as the cache key.
These authorizers are generally available in all AWS Regions where API Gateway is available. To learn more about options for protecting your APIs, you can read the documentation. For more information about Amazon API Gateway, visit the product page.
When you want to optimize your Java application on AWS Lambda for performance and cost the general steps are: Build, measure, then optimize! To accomplish this, you need a solid monitoring mechanism. Amazon CloudWatch and AWS X-Ray are well suited for this task since they already provide lots of data about your AWS Lambda function. This includes overall memory consumption, initialization time, and duration of your invocations. To examine the Java Virtual Machine (JVM) memory you require garbage collection logs from your functions. Instances of an AWS Lambda function have a short lifecycle compared to a long-running Java application server. It can be challenging to process the logs from tens or hundreds of these instances.
In this post, you learn how to emit and collect data to monitor the JVM garbage collector activity. Having this data, you can visualize out-of-memory situations of your applications in a Kibana dashboard like in the following screenshot. You gain actionable insights into your application’s memory consumption on AWS Lambda for troubleshooting and optimization.
The lifecycle of a JVM application on AWS Lambda
Let’s first revisit the lifecycle of the AWS Lambda Java runtime and its JVM:
AWS Lambda launches an execution context. This is a temporary runtime environment based on the configuration settings you provide, like permissions, memory size, and environment variables.
AWS Lambda creates a new log stream in Amazon CloudWatch Logs for each instance of the execution context.
The execution context initializes the JVM and your handler’s code.
You typically see the initialization of a fresh execution context when a Lambda function is invoked for the first time, after it has been updated, or it scales up in response to more incoming events.
AWS Lambda maintains the execution context for some time in anticipation of another Lambda function invocation. In effect, the service freezes the execution context after a Lambda function completes. It thaws the execution context when the Lambda function is invoked again if AWS Lambda chooses to reuse it.
During invocations, the JVM also maintains garbage collection as usual. Outside of invocations, the JVM and its maintenance processes like garbage collection are also frozen.
Garbage collection and indicators for your application’s health
The purpose of JVM garbage collection is to clean up objects in the JVM heap, which is the space for an application’s objects. It finds objects which are unreachable and deletes them. This frees heap space for other objects.
You can make the JVM log garbage collection activities to get insights into the health of your application. One example for this is the free heap after each garbage collection. If this metric keeps shrinking, it is an indicator for a memory leak – eventually turning into an OutOfMemoryError. If there is not enough of free heap, the JVM might be too busy with garbage collection instead of running your application code. Otherwise, a heap that is too big does indicate that there’s potential to decrease the memory configuration of your AWS Lambda function. This keeps garbage collection pauses low and provides a consistent response time.
The garbage collection logging can be configured via an environment variable as part of the AWS Lambda function configuration. The environment variable JAVA_TOOL_OPTIONS is considered by both the Java 8 and 11 JVMs. You use it to pass options that you would usually add to the command line when launching the JVM. The options to configure garbage collection logging and the output is specific to the Java version.
Java 11 uses the Unified Logging System (JEP 158 and JEP 271) which has been introduced in Java 9. Logging can be configured with the environment variable:
Independent of the Java version, the garbage collection activities are logged to standard out (stdout) or standard error (stderr). Logs appear in the AWS Lambda function’s log stream of Amazon CloudWatch Logs. The log contains the size of memory used for:
Visualizing the logs in Amazon Elasticsearch Service
It is hard to fully understand the garbage collection log by just reading it in Amazon CloudWatch Logs. You must visualize it to gain more insight. This section describes the solution to achieve this.
Solution Overview
Amazon CloudWatch Logs have a feature to stream CloudWatch Logs data to Amazon Elasticsearch Service via an AWS Lambda function. The AWS Lambda function for log transformation is subscribed to the log group of your application’s AWS Lambda function. The subscription filters for a pattern that matches the one of the garbage collection log entries. The log transformation function processes the log messages and puts it to a search cluster. To make the data easy to digest for the search cluster, you add code to transform and convert the messages to JSON. Having the data in a search cluster, you can visualize it with Kibana dashboards.
Get Started
To start, launch the solution architecture described above as a prepackaged application from the AWS Serverless Application Repository. It contains all resources ready to visualize the garbage collection logs for your Java 11 AWS Lambda functions in a Kibana dashboard. The search cluster consists of a single t2.small.elasticsearch instance with 10GB of EBS storage. It is protected with Amazon Cognito User Pools so you only need to add your user(s). The T2 instance types do not support encryption of data at rest.
1. Spin up the application from the AWS Serverless Application Repository:
2. As soon as the application is deployed completely, the outputs of the AWS CloudFormation stack provide the links for the next steps. You will find two URLs in the AWS CloudFormation console called createUserUrl and kibanaUrl.
3. Use the createUserUrl link from the outputs, or navigate to the Amazon Cognito user pool in the console to create a new user in the pool.
a. Enter an email address as username and email. Enter a temporary password of your choice with at least 8 characters.
b. Leave the phone number empty and uncheck the checkbox to mark the phone number as verified.
c. If necessary, you can check the checkboxes to send an invitation to the new user or to make the user verify the email address.
d. Choose Create user.
4. Access the Kibana dashboard with the kibanaUrl link from the AWS CloudFormation stack outputs, or navigate to the Kibana link displayed in the Amazon Elasticsearch Service console.
a. In Kibana, choose the Dashboard icon in the left menu bar
b. Open the Lambda GC Activity dashboard.
You can test that new events appear by using the Kibana Developer Console:
5. When you go to the Lambda GC Activity dashboard you can see the new event. You must select the right timeframe with the Show dates link.
The dashboard consists of six tiles:
In the Filters you optionally select the log group and filter for a specific AWS Lambda function execution context by the name of its log stream.
In the GC Activity Count by Execution Context you see a heatmap of all filtered execution contexts by garbage collection activity count.
The GC Activity Metrics display a graph for the metrics for all filtered execution contexts.
The GC Activity Count shows the amount of garbage collection activities that are currently displayed.
The GC Duration show the sum of the duration of all displayed garbage collection activities.
The GC Activity Raw Data at the bottom displays the raw items as ingested into the search cluster for a further drill down.
Configure your AWS Lambda function for garbage collection logging
1. The application that you want to monitor needs to log garbage collection activities. Currently the solution supports logs from Java 11. Add the following environment variable to your AWS Lambda function to activate the logging.
JAVA_TOOL_OPTIONS=-Xlog:gc:stderr:time,tags
The environment variables must reflect this parameter like the following screenshot:
2. Go to the streamLogs function in the AWS Lambda console that has been created by the stack, and subscribe it to the log group of the function you want to monitor.
3. Select Add Trigger.
4. Select CloudWatch Logs as Trigger Configuration.
5. Input a Filter name of your choice.
6. Input "[gc" (including quotes) as the Filter pattern to match all garbage collection log entries.
7. Select the Log Group of the function you want to monitor. The following screenshot subscribes to the logs of the application’s function resize-lambda-ResizeFn-[...].
8. Select Add.
9. Execute the AWS Lambda function you want to monitor.
10. Refresh the dashboard in Amazon Elasticsearch Service and see the datapoint added manually before appearing in the graph.
Troubleshooting examples
Let’s look at an example function and draw some useful insights from the Java garbage collection log. The following diagrams show the Sample Amazon S3 function code for Java from the AWS Lambda documentation running in a Java 11 function with 512 MB of memory.
An S3 event from a new uploaded image triggers this function.
The function loads the image from S3, resizes it, and puts the resized version to S3.
The file size of the example image is close to 2.8MB.
The application is called 100 times with a pause of 1 second.
Memory leak
For the demonstration of a memory leak, the function has been changed to keep all source images in memory as a class variable. Hence the memory of the function keeps growing when processing more images:
In the diagram, the heap size drops to zero at timestamp 12:34:00. The Amazon CloudWatch Logs of the function reveal an error before the next call to your code in the same AWS Lambda execution context with a fresh JVM:
Java heap space: java.lang.OutOfMemoryError
java.lang.OutOfMemoryError: Java heap space
at java.desktop/java.awt.image.DataBufferByte.<init>(Unknown Source)
[...]
The JVM crashed and was restarted because of the error. You leverage primarily the Amazon CloudWatch Logs of your function to detect errors. The garbage collection log and its visualization provide additional information for root cause analysis:
Did the JVM run out of memory because a single image to resize was too large?
Or was the memory issue growing over time?
The latter could be an indication that you have a memory leak in your code.
The Heap size is too small
For the demonstration of a heap that was chosen too small, the memory leak from the preceding image has been resolved, but the function was configured to 128MB of memory. From the baseline of the heap to the maximum heap size, there are only approximately 5 MB used.
This will result in a high management overhead of your JVM. You should experiment with a higher memory configuration to find the optimal performance also taking cost into account. Check out AWS Lambda power tuning open source tool to do this in an automated fashion.
Finetuning the initial heap size
If you review the development of the heap size at the start of an execution context, this indicates that the heap size is continuously increased. Each heap size change is an expensive operation consuming time of your function. Over time, the heap size is changed as well. The garbage collector logs 502 activities, which take almost 17 seconds overall.
This on-demand scaling is useful on a local workstation where the physical memory is shared with other applications. On AWS Lambda, the configured memory is dedicated to your function, so you can use it to its full extent.
You can do so by setting the minimum and maximum heap size to a fixed value by appending the -Xms and -Xmx parameters to the environment variable we introduced before.
The heap is not the only part of the JVM that consumes memory, so you must experiment with this setting and closely monitor the performance.
Start with the heap size that you observe to be working from the garbage collection log. If you set the heap size too large, your function will not initialize at all or break unexpectedly. Remember that the ability to tweak JVM parameters might change with future service features.
Let’s set 400 MB of the 512 MB memory and examine the results:
The preceding dashboard shows that the overall garbage collection duration was reduced by about 95%. The garbage collector had 80% fewer activities.
The garbage collection log entries displayed in the dashboard reveal that exclusively minor garbage collection (Pause Young) activities were triggered instead of major garbage collections (Pause Full). This is expected as the images are immediately discarded after the download, resize, upload operation. The effect on the overall function durations of 100 invocations, is a 5% decrease on average in this specific case.
Cost estimation and clean up
Cost for the processing and transformation of your function’s Amazon CloudWatch Logs incurs when your function is called. This cost depends on your application and how often garbage collection activities are triggered. Read an estimate of the monthly cost for the search cluster. If you do not need the garbage collection monitoring anymore, delete the subscription filter from the log group of your AWS Lambda function(s). Also, delete the stack of the solution above in the AWS CloudFormation console to clean up resources.
Conclusion
In this post, we examined further sources of data to gain insights about the health of your Java application. We also demonstrated a pipeline to ingest, transform, and visualize this information continuously in a Kibana dashboard. As a next step, launch the application from the AWS Serverless Application Repository and subscribe it to your applications’ logs. Feel free to submit enhancements to the application in the aws-samples repository or provide feedback in the comments.
Field Notes provides hands-on technical guidance from AWS Solutions Architects, consultants, and technical account managers, based on their experiences in the field solving real-world business problems for customers.
The collective thoughts of the interwebz
Manage Consent
To provide the best experiences, we use technologies like cookies to store and/or access device information. Consenting to these technologies will allow us to process data such as browsing behavior or unique IDs on this site. Not consenting or withdrawing consent, may adversely affect certain features and functions.
Functional
Always active
The technical storage or access is strictly necessary for the legitimate purpose of enabling the use of a specific service explicitly requested by the subscriber or user, or for the sole purpose of carrying out the transmission of a communication over an electronic communications network.
Preferences
The technical storage or access is necessary for the legitimate purpose of storing preferences that are not requested by the subscriber or user.
Statistics
The technical storage or access that is used exclusively for statistical purposes.The technical storage or access that is used exclusively for anonymous statistical purposes. Without a subpoena, voluntary compliance on the part of your Internet Service Provider, or additional records from a third party, information stored or retrieved for this purpose alone cannot usually be used to identify you.
Marketing
The technical storage or access is required to create user profiles to send advertising, or to track the user on a website or across several websites for similar marketing purposes.