Post Syndicated from turnoff.us original http://turnoff.us/geek/tar.gz/

Post Syndicated from turnoff.us original http://turnoff.us/geek/tar.gz/
Post Syndicated from corbet original https://lwn.net/Articles/966869/
Radicle is a new, peer-to-peer,
MIT/Apache-licensed collaboration platform written in Rust and built on top
of Git. It adds support for issues and pull requests (which Radicle calls
“patches”) on top of core Git, which are stored in the Git repository
itself. Unlike GitHub, GitLab, and similar forges, Radicle is distributed;
it doesn’t rely on having everyone use the same server. Instead, Radicle
instances form a network that synchronizes changes between nodes.
Post Syndicated from LGR original https://www.youtube.com/watch?v=aRisQETt3dY
Post Syndicated from daroc original https://lwn.net/Articles/967134/
Security updates have been issued by Debian (chromium), Fedora (apache-commons-configuration, chromium, csmock, ofono, onnx, php-tcpdf, and podman-tui), Mageia (curl), Oracle (libreoffice), Slackware (coreutils, seamonkey, and util), SUSE (minidlna, PackageKit, and podman), and Ubuntu (linux-azure-6.5 and linux-intel-iotg, linux-intel-iotg-5.15).
Post Syndicated from Monika Singh original https://blog.cloudflare.com/alerts-observability

Many people have probably come across the ‘this is fine’ meme or the original comic. This is what a typical day for a lot of on-call personnel looks like. On-calls get a lot of alerts, and dealing with too many alerts can result in alert fatigue – a feeling of exhaustion caused by responding to alerts that lack priority or clear actions. Ensuring the alerts are actionable and accurate, not false positives, is crucial because repeated false alarms can desensitize on-call personnel. To this end, within Cloudflare, numerous teams conduct periodic alert analysis, with each team developing its own dashboards for reporting. As members of the Observability team, we’ve encountered situations where teams reported inaccuracies in alerts or instances where alerts failed to trigger, as well as provided assistance in dealing with noisy/flapping alerts.
Observability aims to enhance insight into the technology stack by gathering and analyzing a broader spectrum of data. In this blog post, we delve into alert observability, discussing its importance and Cloudflare’s approach to achieving it. We’ll also explore how we overcome shortcomings in alert reporting within our architecture to simplify troubleshooting using open-source tools and best practices. Join us to understand how we use alerts effectively and use simple tools and practices to enhance our alerts observability, resilience, and on-call personnel health.

Being on-call can disrupt sleep patterns, impact social life, and hinder leisure activities, potentially leading to burnout. While burnout can be caused by several factors, one contributing factor can be excessively noisy alerts or receiving alerts that are neither important nor actionable. Analyzing alerts can help mitigate the risk of such burnout by reducing unnecessary interruptions and improving the overall efficiency of the on-call process. It involves periodic review and feedback to the system for improving alert quality. Unfortunately, only some companies or teams do alert analysis, even though it is essential information that every on-call or manager should have access to.
Alert analysis is useful for on-call personnel, enabling them to easily see which alerts have fired during their shift to help draft handover notes and not miss anything important. In addition, managers can generate reports from these stats to see the improvements over time, as well as helping assess on-call vulnerability to burnout. Alert analysis also helps with writing incident reports, to see if alerts were fired, or to determine when an incident started.
Let’s first understand the alerting stack and how we used open-source tools to gain greater visibility into it, which allowed us to analyze and optimize its effectiveness.
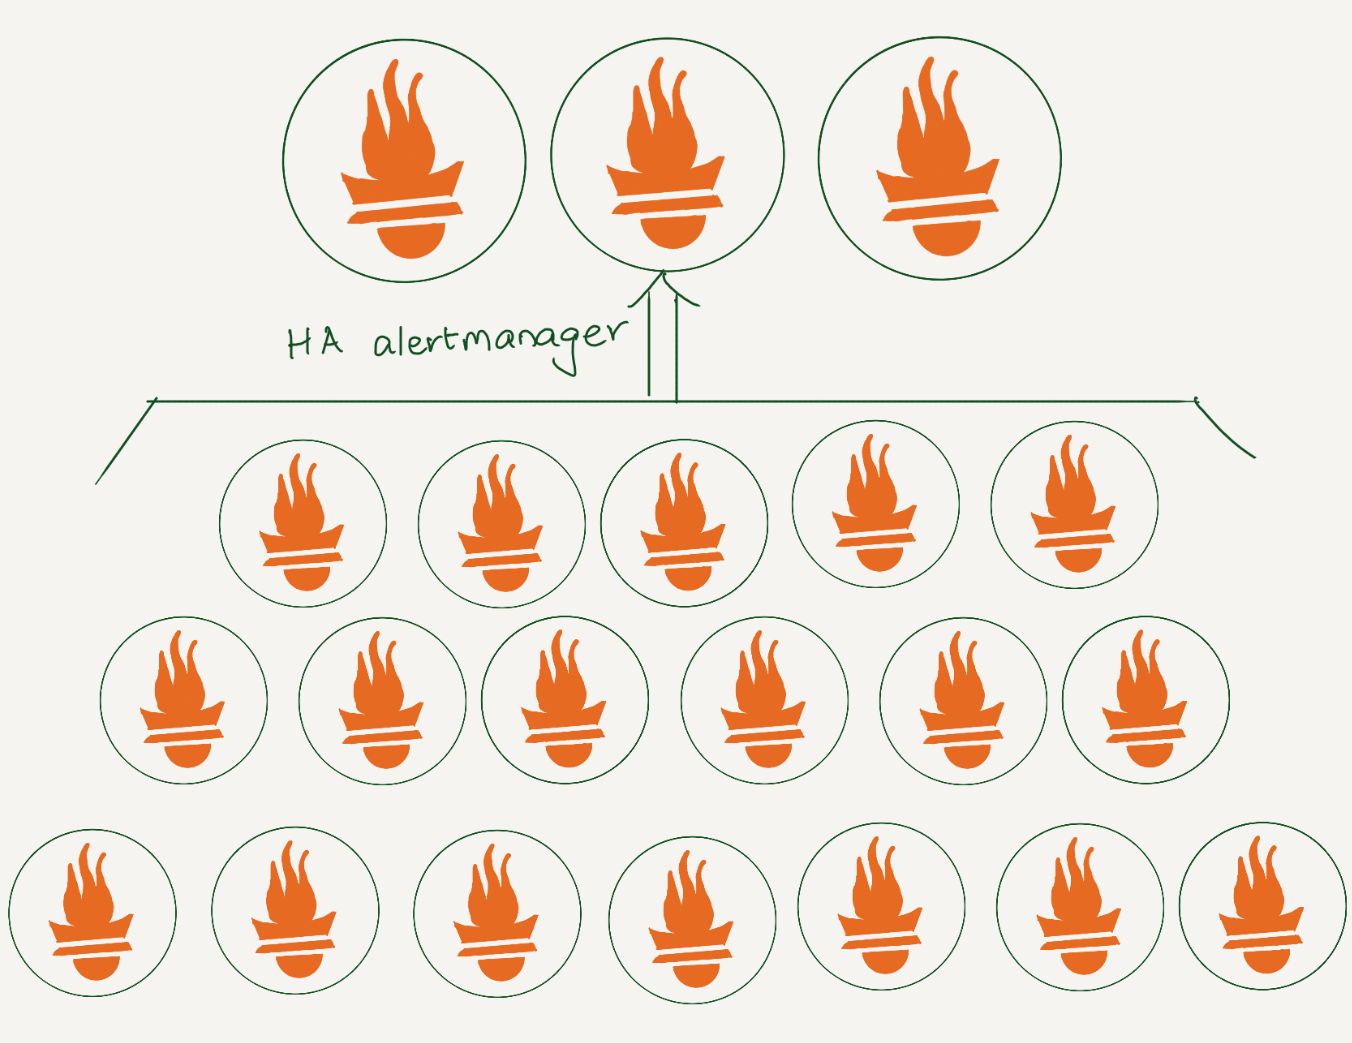
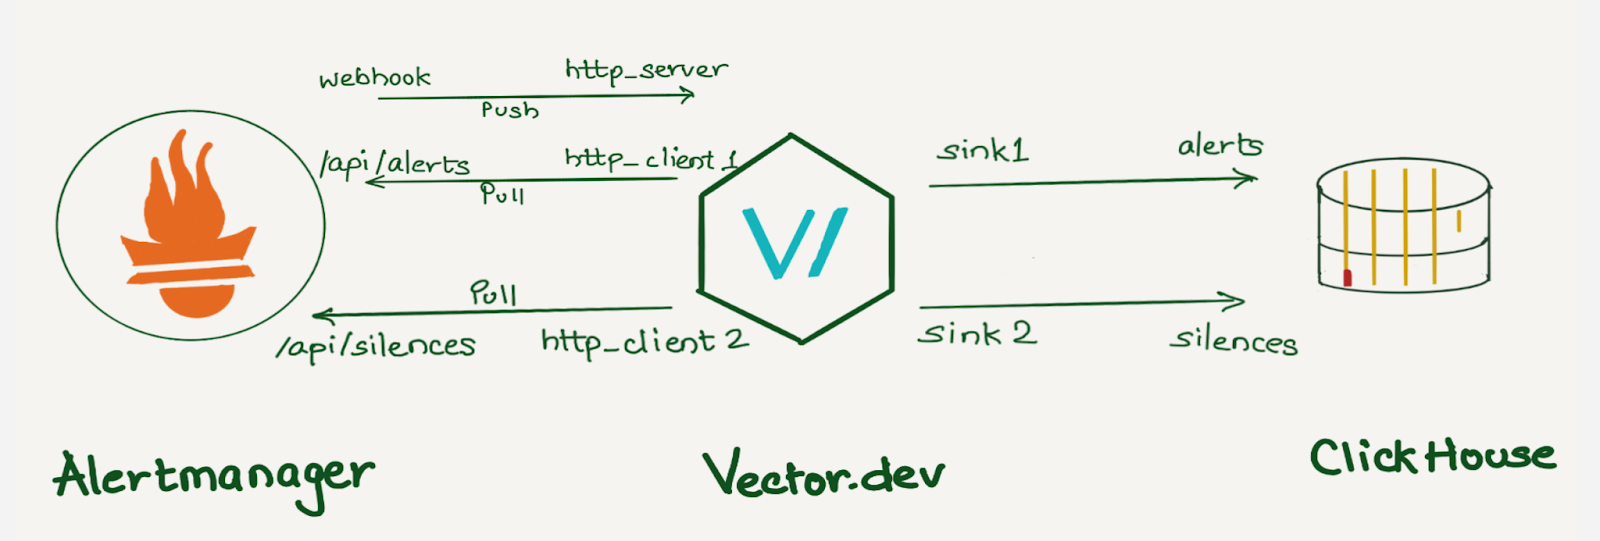
At Cloudflare, we rely heavily on Prometheus for monitoring. We have data centers in more than 310 cities, and each has several Prometheis. In total, we have over 1100 Prometheus servers. All alerts are sent to a central Alertmanager, where we have various integrations to route them. Additionally, using an alertmanager webhook, we store all alerts in a datastore for analysis.
Prometheus collects metrics from configured targets at given intervals, evaluates rule expressions, displays the results, and can trigger alerts when the alerting conditions are met. Once an alert goes into firing state, it will be sent to the alertmanager.
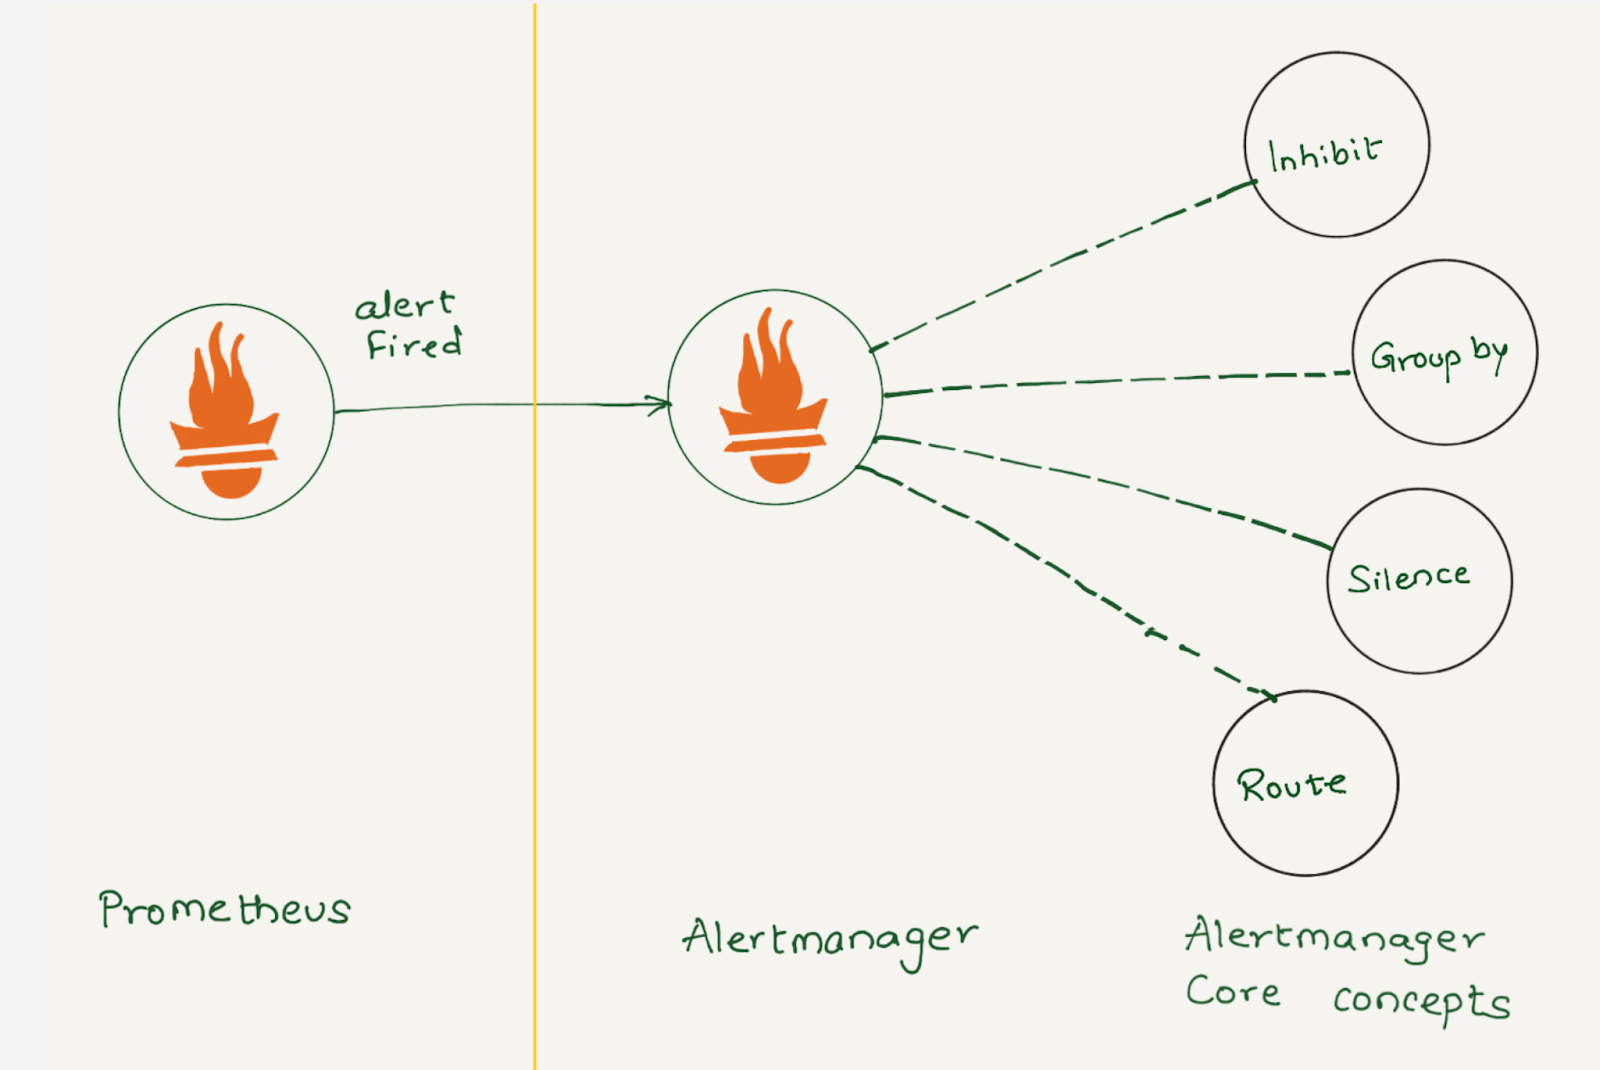
Depending on the configuration, once Alertmanager receives an alert, it can inhibit, group, silence, or route the alerts to the correct receiver integration, such as chat, PagerDuty, or ticketing system. When configured properly, Alertmanager can mitigate a lot of alert noise. Unfortunately, that is not the case all the time, as not all alerts are optimally configured.
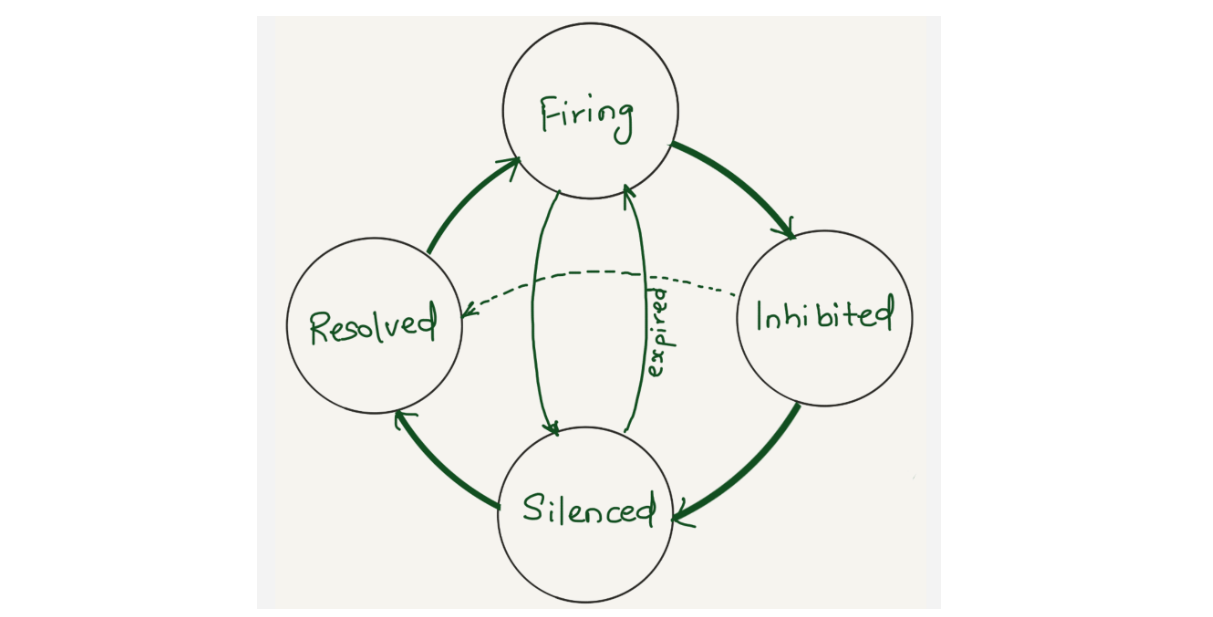
Alertmanager sends notifications for firing and resolved alert events via webhook integration. We were using alertmanager2es, which receives webhook alert notifications from Alertmanager and inserts them into an Elasticsearch index for searching and analysis. Alertmanager2es has been a reliable tool for us over the years, offering ways to monitor alerting volume, noisy alerts and do some kind of alert reporting. However, it had its limitations. The absence of silenced and inhibited alert states made troubleshooting issues challenging. We often found ourselves guessing why an alert didn’t trigger – was it silenced by another alert or perhaps inhibited by one? Without concrete data, we lacked the means to confirm what was truly happening.
Since the Alertmanager doesn’t provide notifications for silenced or inhibited alert events via webhook integration, the alert reporting we were doing was somewhat lacking or incomplete. However, the Alertmanager API provides querying capabilities and by querying the /api/alerts alertmanager endpoint, we can get the silenced and inhibited alert states. Having all four states in a datastore will enhance our ability to improve alert reporting and troubleshoot Alertmanager issues.
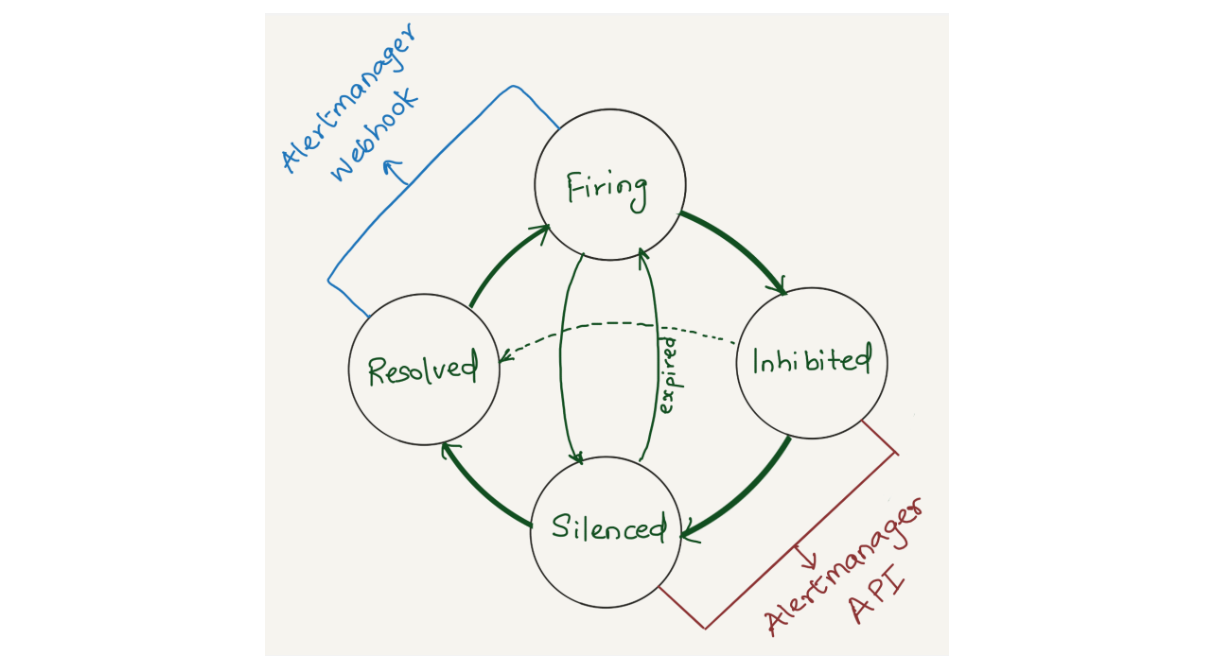
We opted to aggregate all states of the alerts (firing, silenced, inhibited, and resolved) into a datastore. Given that we’re gathering data from two distinct sources (the webhook and API) each in varying formats and potentially representing different events, we correlate alerts from both sources using the fingerprint field. The fingerprint is a unique hash of the alert’s label set which enables us to match alerts across responses from the Alertmanager webhook and API.
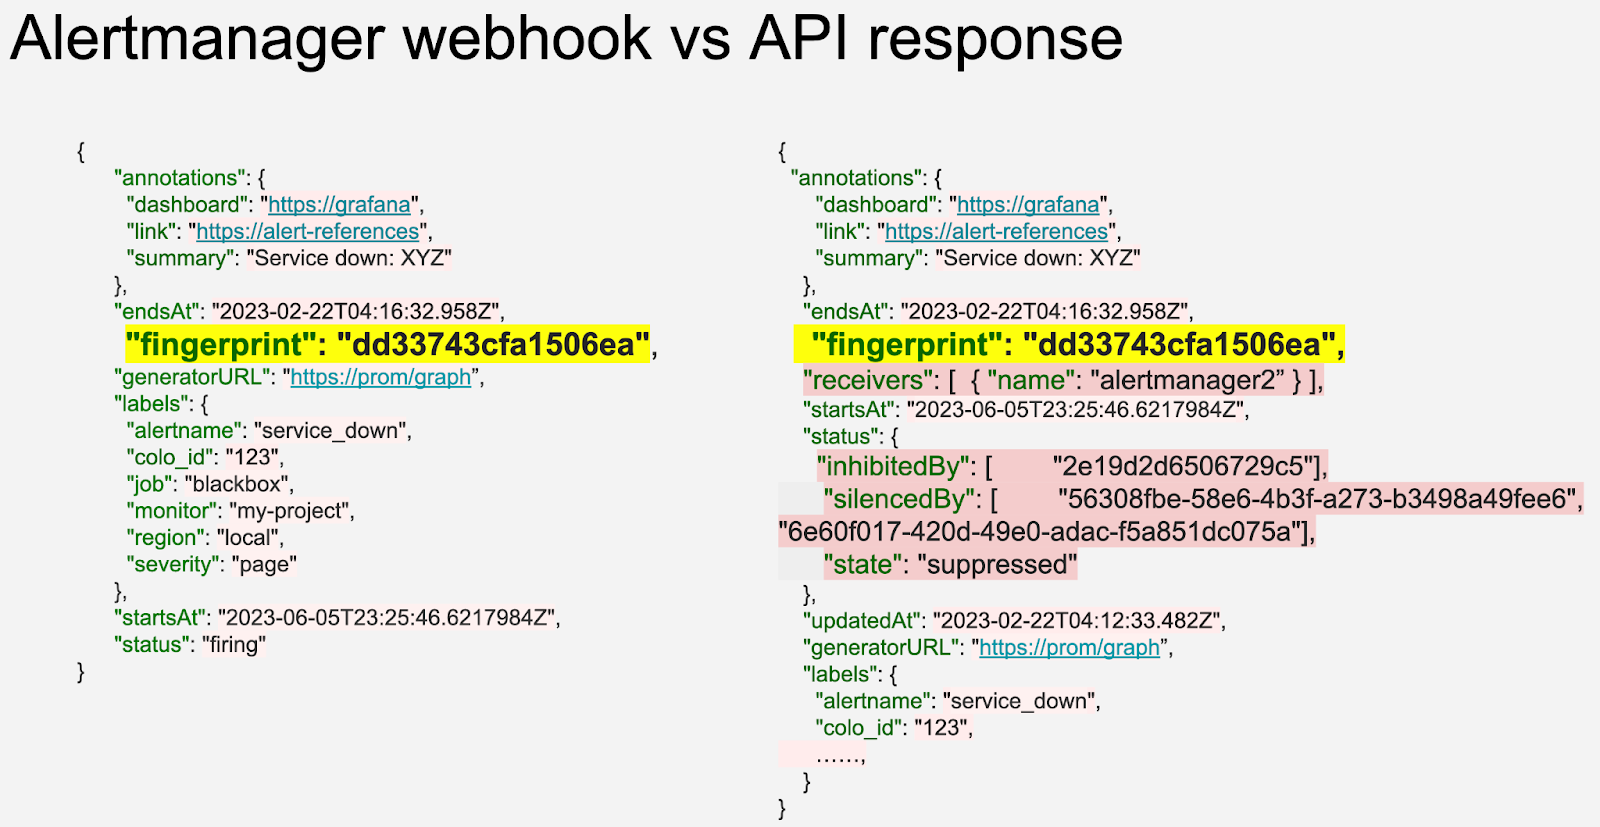
The Alertmanager API offers additional fields compared to the webhook (highlighted in pastel red on the right), such as silencedBy and inhibitedBy IDs, which aid in identifying silenced and inhibited alerts. We store both webhook and API responses in the datastore as separate rows. While querying, we match the alerts using the fingerprint field.
We decided to use a vector.dev instance to transform the data as necessary, and store it in a data store. Vector.dev (acquired by Datadog) is an open-source, high-performance, observability data pipeline that supports a vast range of sources to read data from and supports a lot of sinks for writing data to, as well as a variety of data transformation operations.
Although we use ClickHouse to store this data, any other database can be used here. ClickHouse was chosen as a data store because it provides various data manipulation options. It allows aggregating data during insertion using Materialized Views, reduces duplicates with the replacingMergeTree table engine, and supports JOIN statements.
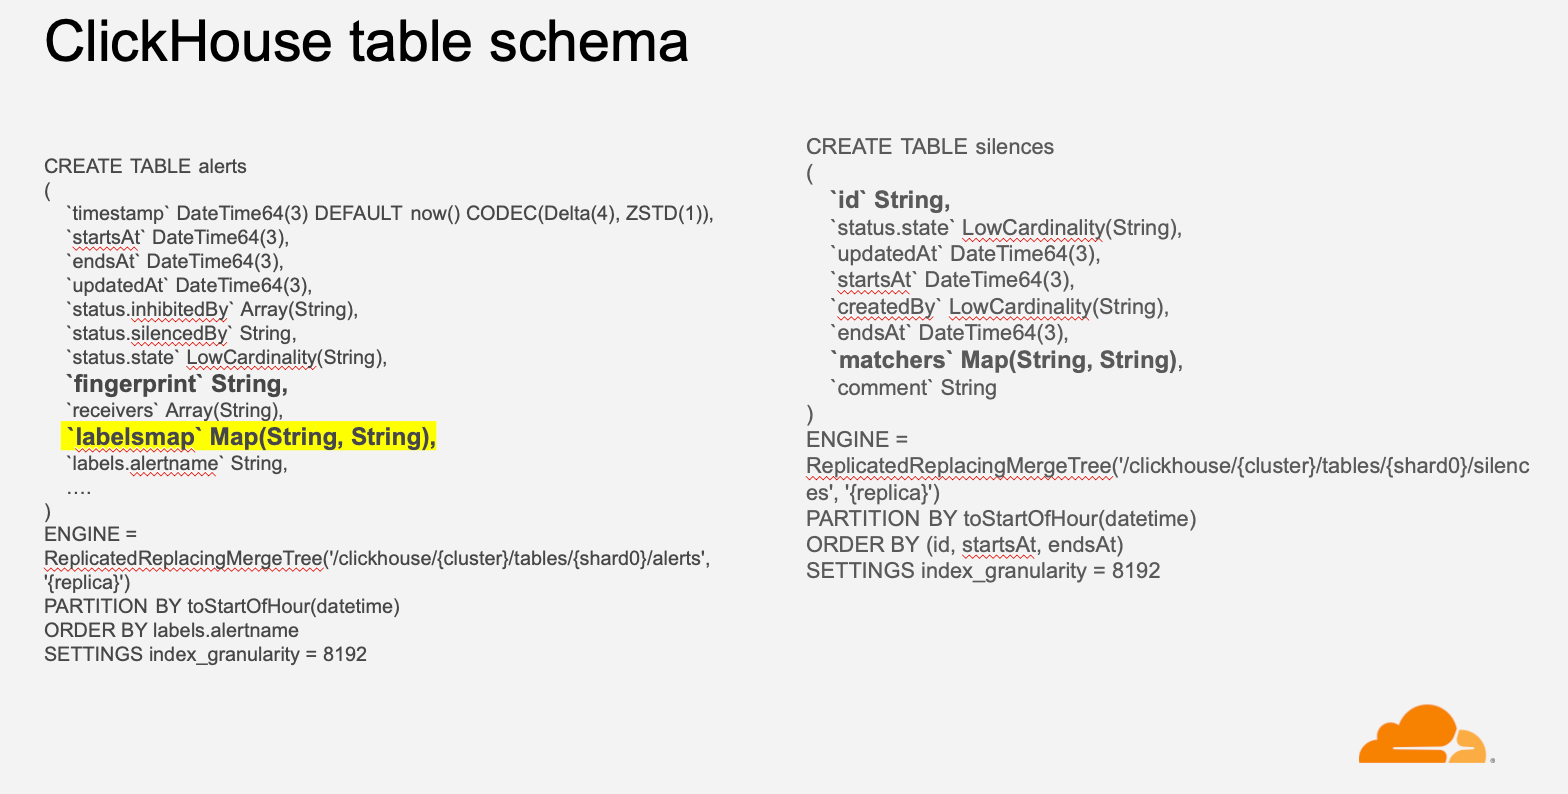
If we were to create individual columns for all the alert labels, the number of columns would grow exponentially with the addition of new alerts and unique labels. Instead, we decided to create individual columns for a few common labels like alert priority, instance, dashboard, alert-ref, alertname, etc., which helps us analyze the data in general and keep all other labels in a column of type Map(String, String). This was done because we wanted to keep all the labels in the datastore with minimal resource usage and allow users to query specific labels or filter alerts based on particular labels. For example, we can select all Prometheus alerts using labelsmap[‘service’’] = ‘Prometheus’.

We built multiple dashboards on top of this data:
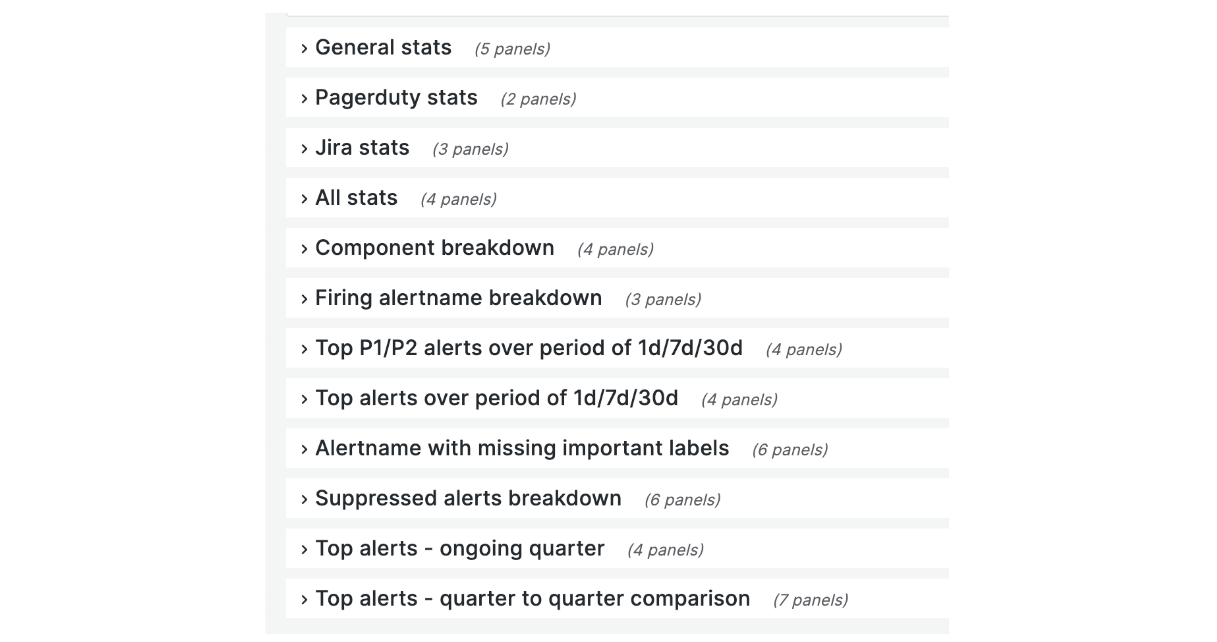
The image is a screenshot of the collapsed alerts overview dashboard by receiver. This dashboard comprises general stats, components, services, and alertname breakdown. The dashboard also highlights the number of P1 / P2 alerts in the last one day / seven days / thirty days, top alerts for the current quarter, and quarter-to-quarter comparison.
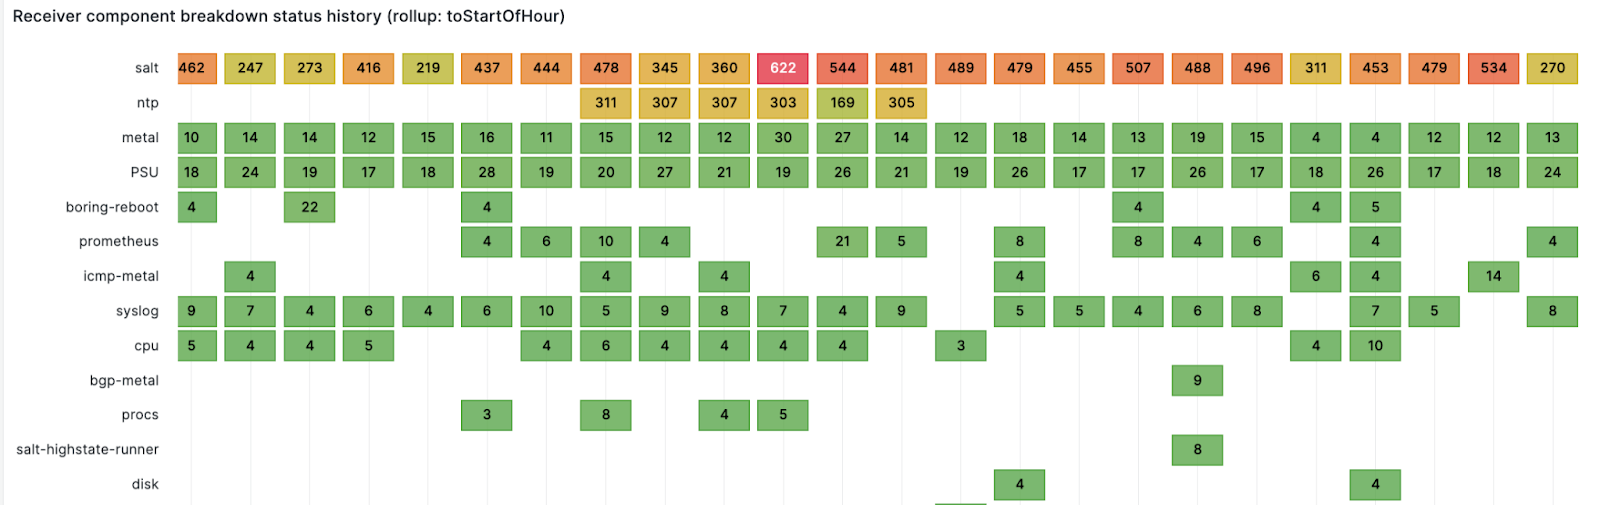
We route alerts to teams and a team can have multiple services or components. This panel shows firing alerts component counts over time for a receiver. For example, the alerts are sent to the observability team, which owns multiple components like logging, metrics, traces, and errors. This panel gives an alerting component count over time, and provides a good idea about which component is noisy and at what time at a glance.
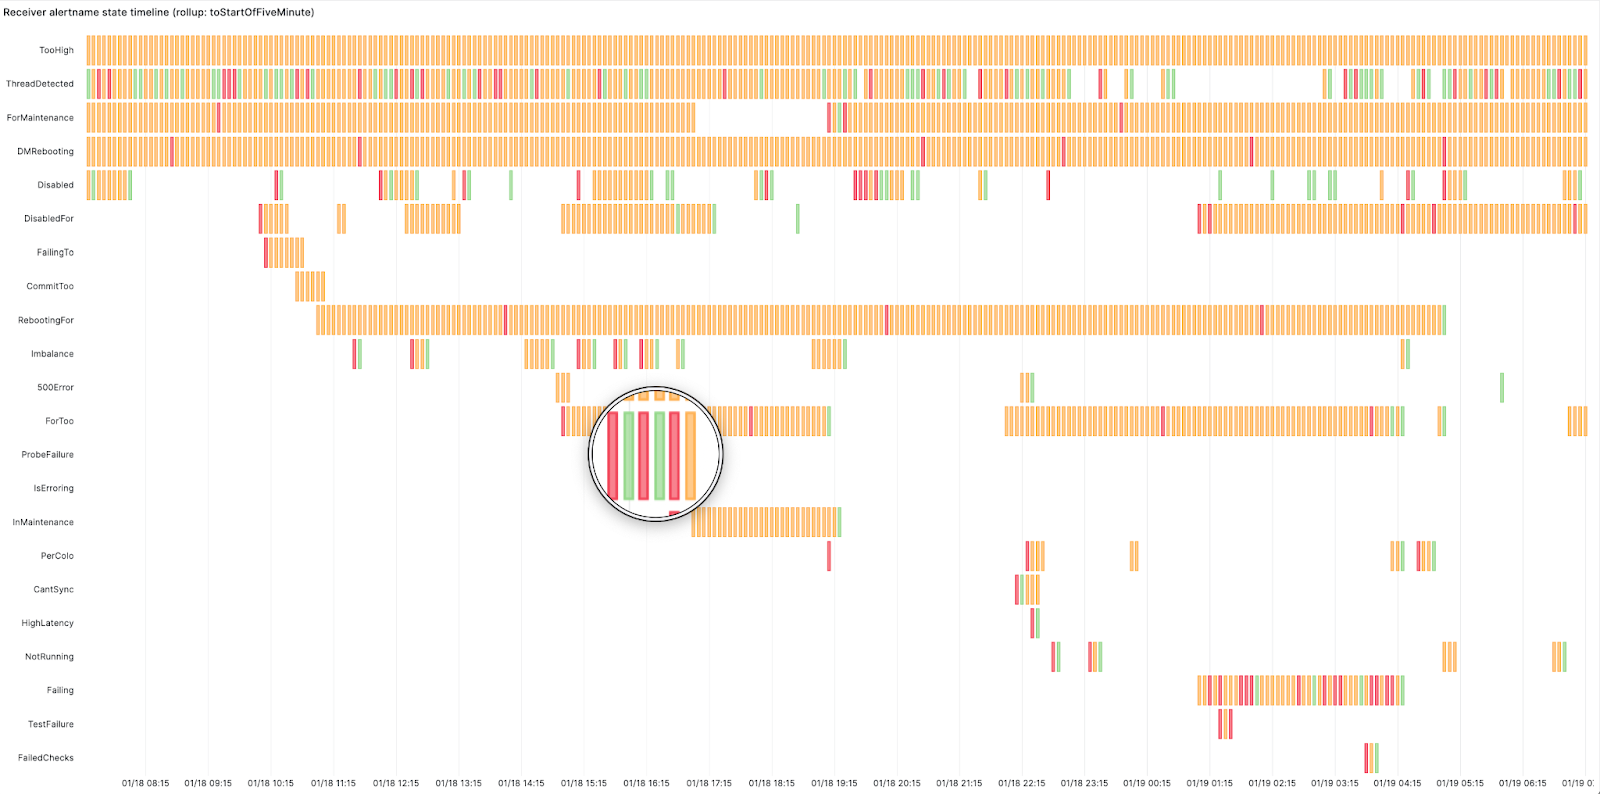
We created this swimlane view using Grafana’s state timeline panel for the receivers. The panel shows how busy the on-call was and at what point. Red here means the alert started firing, orange represents the alert is active and green means it has resolved. It displays the start time, active duration, and resolution of an alert. This highlighted alert is changing state too frequently from firing to resolved – this looks like a flapping alert. Flapping occurs when an alert changes state too frequently. This can happen when alerts are not configured properly and need tweaking, such as adjusting the alert threshold or increasing the for duration period in the alerting rule. The for duration field in the alerting rules adds time tolerance before an alert starts firing. In other words, the alert won’t fire unless the condition is met for ‘X’ minutes.
There were a few interesting findings within our analysis. We found a few alerts that were firing and did not have a notify label set, which means the alerts were firing but were not being sent or routed to any team, creating unnecessary load on the Alertmanager. We also found a few components generating a lot of alerts, and when we dug in, we found that they were for a cluster that was decommissioned where the alerts were not removed. These dashboards gave us excellent visibility and cleanup opportunities.
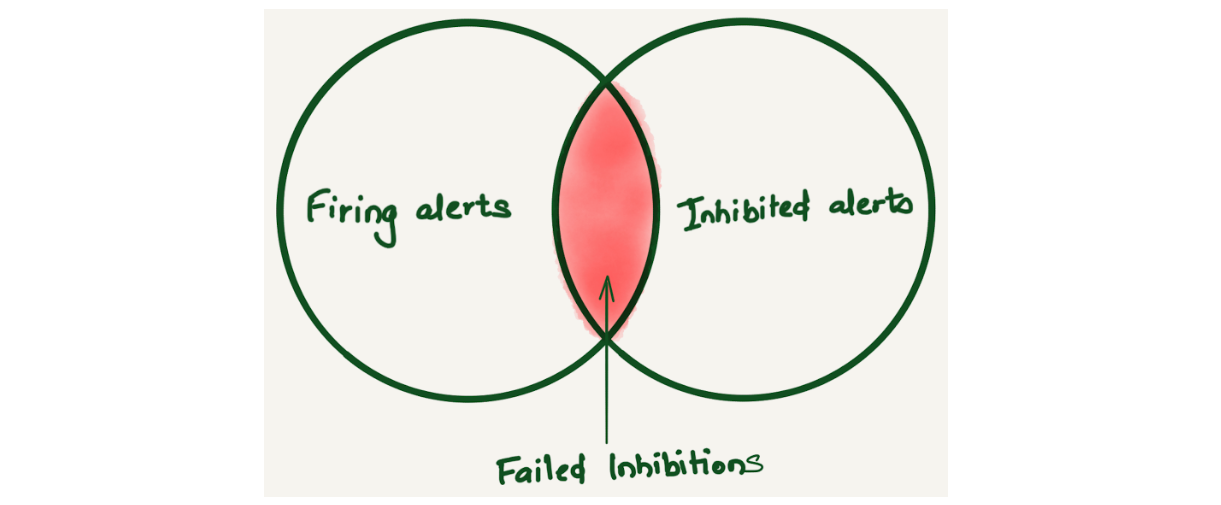
Alertmanager inhibition allows suppressing a set of alerts or notifications based on the presence of another set of alerts. We found that Alertmanager inhibitions were not working sometimes. Since there was no way to know about this, we only learned about it when a user reported getting alerted for inhibited alerts. Imagine a Venn diagram of firing and inhibited alerts to understand failed inhibitions. Ideally, there should be no overlap because the inhibited alerts shouldn’t be firing. But if there is an overlap, that means inhibited alerts are firing, and this overlap is considered a failed inhibition alert.
After storing alert notifications in ClickHouse, we were able to come up with a query to find the fingerprint of the `alertnames` where the inhibitions were failing using the following query:
SELECT $rollup(timestamp) as t, count() as count
FROM
(
    SELECT
        fingerprint, timestamp
    FROM alerts
    WHERE
        $timeFilter
        AND status.state = 'firing'
    GROUP BY
        fingerprint, timestamp
) AS firing
ANY INNER JOIN
(
    SELECT
        fingerprint, timestamp
    FROM alerts
    WHERE
        $timeFilter
        AND status.state = 'suppressed' AND notEmpty(status.inhibitedBy)
    GROUP BY
        fingerprint, timestamp
) AS suppressed USING (fingerprint)
GROUP BY t
The first panel in the image below is the total number of firing alerts, the second panel is the number of failed inhibitions.
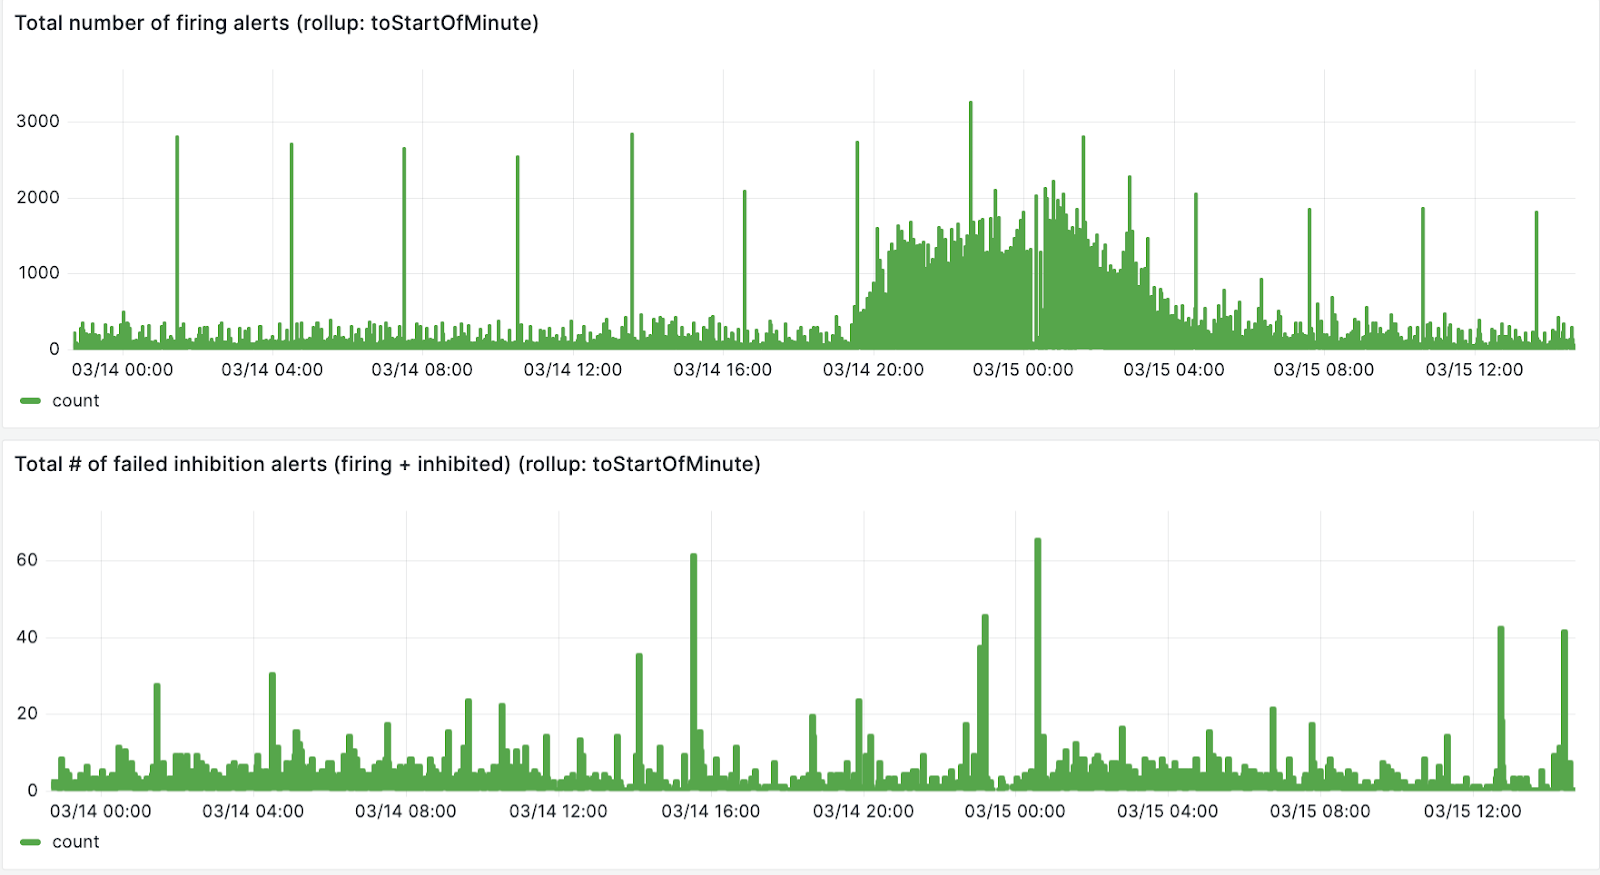
We can also create breakdown for each failed inhibited alert
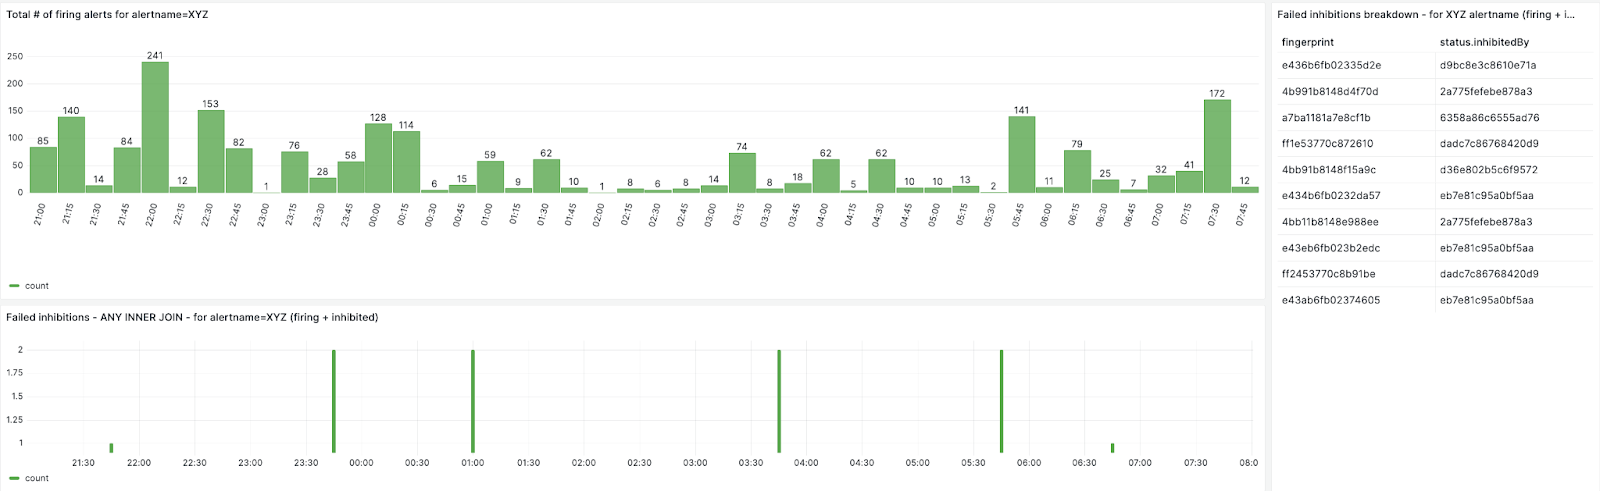
By looking up the fingerprint from the database, we could map the alert inhibitions and found that the failed inhibited alerts have an inhibition loop. For example, alert Service_XYZ_down is inhibited by alert server_OOR, alert server_OOR is inhibited by alert server_down, and server_down is inhibited by alert server_OOR.
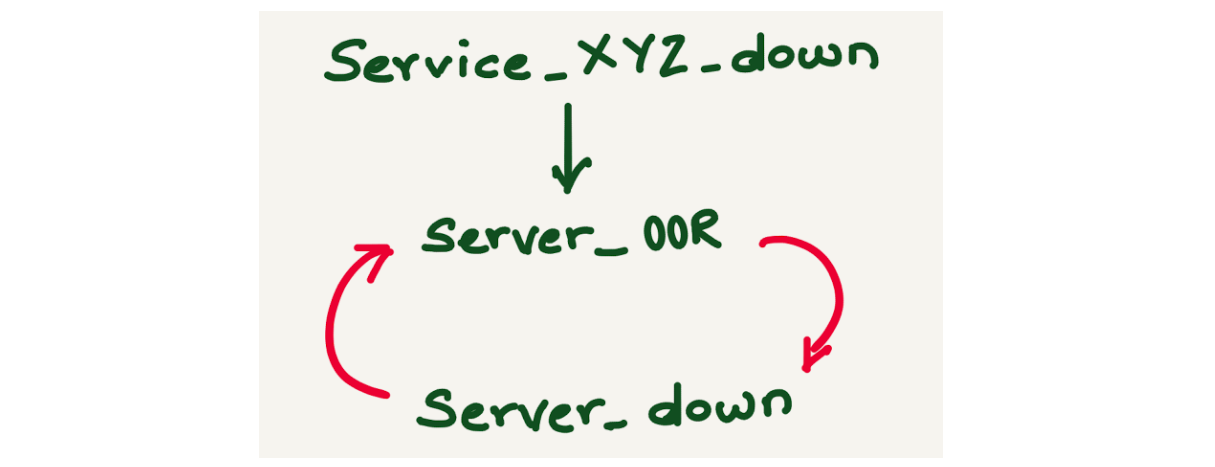
Failed inhibitions can be avoided if alert inhibitions are configured carefully.

Alertmanager provides a mechanism to silence an alert while it is being worked on or during maintenance. Silence can mute the alerts for a given time and it can be configured based on matchers, which can be an exact match, a regex, an alert name, or any other label. The silence matcher doesn’t necessarily translate to the alertname. By doing alert analysis, we could map the alerts and the silence ID by doing a JOIN query on the alerts and silences tables. We also discovered a lot of stale silences, where silence was created for a long duration and is not relevant anymore.
The directory contains a basic demo for implementing alerts observability. Running `docker-compose up` spawns several containers, including Prometheus, Alertmanager, Vector, ClickHouse, and Grafana. The vector.dev container queries the Alertmanager alerts API and writes the data into ClickHouse after transforming it. The Grafana dashboard showcases a demo of Alerts and Silences overview.
Make sure you have docker installed and run docker compose up to get started.
Visit http://localhost:3000/dashboards to explore the prebuilt demo dashboards.
As part of the observability team, we manage the Alertmanager, which is a multi-tenant system. It’s crucial for us to have visibility to detect and address system misuse, ensuring proper alerting. The use of alert analysis tools has significantly enhanced the experience for on-call personnel and our team, offering swift access to the alert system. Alerts observability has facilitated the troubleshooting of events such as why an alert did not fire, why an inhibited alert fired, or which alert silenced / inhibited another alert, providing valuable insights for improving alert management.
Moreover, alerts overview dashboards facilitate rapid review and adjustment, streamlining operations. Teams use these dashboards in the weekly alert reviews to provide tangible evidence of how an on-call shift went, identify which alerts fire most frequently, becoming candidates for cleanup or aggregation thus curbing system misuse and bolstering overall alert management. Additionally, we can pinpoint services that may require particular attention. Alerts observability has also empowered some teams to make informed decisions about on-call configurations, such as transitioning to longer but less frequent shifts or integrating on-call and unplanned work shifts.
In conclusion, alert observability plays a crucial role in averting burnout by minimizing interruptions and enhancing on-call duties’ efficiency. Offering alerts observability as a service benefits all teams by obviating the need for individual dashboard development and fostering a proactive monitoring culture.
If you found this blog post interesting and want to work on observability, please check out our job openings – we’re hiring for Alerting and Logging!
Post Syndicated from corbet original https://lwn.net/Articles/967107/
Christian Schaller writes
about the desktop-oriented work aimed at the upcoming Fedora 40
release.
Another major feature landing in Fedora Workstation 40 that Jonas
Ådahl and Ray Strode has spent a lot of effort on is finalizing the
remote desktop support for GNOME on Wayland. So there has been
support for remote connections for already logged in sessions
already, but with these updates you can do the login remotely too
and thus the session do not need to be started already on the
remote machine. This work will also enable 3rd party solutions to
do remote logins on Wayland systems, so while I am not at liberty
to mention names, be on the lookout for more 3rd party Wayland
remoting software becoming available this year.
Post Syndicated from The History Guy: History Deserves to Be Remembered original https://www.youtube.com/watch?v=weOQl1luoow
Post Syndicated from Bruce Schneier original https://www.schneier.com/blog/archives/2024/03/lessons-from-a-ransomware-attack-against-the-british-library.html
You might think that libraries are kind of boring, but this self-analysis of a 2023 ransomware and extortion attack against the British Library is anything but.
Post Syndicated from Емилия Милчева original https://www.toest.bg/bulgarski-politicheski-zhivotni/

На Аристотел принадлежи определението, че „човекът е политическо животно по природа“, тъй като може да достигне своя най-висок потенциал, като се занимава с нещата, касаещи полиса – тоест с политика. Колко висок е потенциалът на българските политически животни, повели обществото към шести парламентарни избори за последните три години?
Тестът за шестата поправка на Конституцията три месеца след гласуването ѝ дава шанс на президента Румен Радев да покаже онова лице, което нацията обича да вижда – национално отговорно и загрижено, макар и в рамките на стеснените му правомощия при назначаване на служебен кабинет. Такъв отново стана належащ, след като и третата политическа сила, на която държавният глава връчи мандат – „Има такъв народ“, най-малката партия в 49-тото НС, върна празна папка.
Медиите забълбукаха от въпроси има ли конституционна криза, кой може да е министър-председател измежду записаните в Конституцията десетина души и кого би избрал Румен Радев. Председателя на Народното събрание Росен Желязков (ГЕРБ), който следва Бойко Борисов още от Столичната община? Гуверньора на БНБ Димитър Радев, издигнат още през 2015-та начело на централната банка от ГЕРБ? Или един от тримата подуправители – Андрей Гюров (ПП), Петър Чобанов (ДПС), Радослав Миленков, избран през 2019 г. от сглобката ГЕРБ–ДПС?
А може би председателя на Сметната палата Димитър Главчев (ГЕРБ), който беше депутат още от голямата победа на партията през лятото на 2009-та? Или някой от двамата му заместници – Горица Кожарева, издигната от „Патриотичния фронт“ за този пост през 2015 г., и Тошко Тодоров, също от ГЕРБ? Кожарева дори беше временен шеф на институцията с гласовете на ГЕРБ, БСП, ДПС и „Български възход“, след като през 2023 г. бързо бе отстранен Цветан Цветков от Реформаторския блок.
Като възможен кандидат отпадна омбудсманът Диана Ковачева, бивша правосъдна министърка в кабинет на ГЕРБ, отскоро съдийка в Европейския съд по правата на човека. А нейната заместничка Елена Чернева-Маркова подаде оставка тази седмица със следния мотив:
Заемането на политическа длъжност, каквато несъмнено е тази на министър-председател, е несъвместимо с упражняваните от мен функции като заместник-омбудсман.
Самоотстраниха се и централните банкери и Радев обясни защо:
Има етичен кодекс и правила на Европейската централна банка, които забраняват на управители и подуправители да заемат политически постове. Има колизия с националното законодателство, което е очевидно, но това, за което малко се говори, е, че има колизия с европейското законодателство. Управителят на централната банка и неговата роля са изрично дефинирани в договора за функционирането на Европейския съюз, протоколите към него, Устава на ЕЦБ, Устава на Европейската система на централни банки. Те са много експлицитни в това отношение, че не могат да се съвместяват тези длъжности. Етичният кодекс изрично посочва, че управителят трябва да избягва каквото и да е участие в политическия процес.
Изглежда, че бащите на промените в Конституцията не са били наясно с тези правила, вписвайки управителя на БНБ и подуправителите в селекцията за премиери. Така че кръгът изглежда широк само на пръв поглед, защото накъдето и да се обърне Румен Радев, взорът му попада на ГЕРБ. На когото и от този кръг да се спре, няма да избегне критиките за връзка с Борисов. Вследствие на продължилата повече от десетилетие доминация във властта на Бойко Борисов регулаторите и контролните органи са окупирани от кадри на ГЕРБ, а тук-там се мяркат и свързани с ДПС.
Изгледи за конституционна криза няма, каквито опити за внушения има, въпреки че след промяната на Конституцията не са променени и съответстващите закони, не е подготвен и Закон за служебното правителство. Срокът е бил през юни и е практически невъзможно да се реализира в близките дни.
Никой не е очаквал, че колегите от ГЕРБ ще свалят правителство и ще ни хвърлят на избори два месеца след приемането на промените в Конституцията,
каза съпредседателят на „Демократична България“ Христо Иванов по bTV.
Проблемът е, че изброените в Конституцията лица не могат да откажат, но законите на институциите, в които работят, не им позволяват да заемат други длъжности, защото влизат в хипотеза на несъвместимост. По всяка вероятност изход ще бъде намерен – с вариант за неплатен отпуск, след което следва завръщане на предишната позиция.
Въпреки несъгласията си с конституционните промени, които атакува и в Конституционния съд, президентът обяви, че ще обсъди предварително с партиите намеренията си и кандидата за премиер. С така проявената добронамереност и разум сигурно очаква да му върнат жеста с предварително съгласуване на кандидатите за министри, за да няма скандал при подписване на указа за назначаването на правителството.
Тези служебни министри ще управляват заедно с 49-тия парламент, който ще работи до полагането на клетва от новите избраници, което означава до юни. Експериментът с още близо 3 месеца действащо Народно събрание може да бъде използван от политиците за полезна за обществото политическа работа. Например да приемат тези закони, чието негласуване бави отпускането на втория транш от 653 млн. евро по Плана за възстановяване и устойчивост, а предстоят и трети, и четвърти за общо над 1,2 млрд. евро.
Такива закони са приетият на първо четене миналата есен Закон за личния фалит, по който обаче не е работено впоследствие; пътната карта за енергетиката; законът за защита на лицата, подаващи сигнали или публично оповестяващи информация за нарушения. От ПП–ДБ смятат да внесат в парламента подготвения от Министерството на правосъдието проект на Закон за съдебната власт. Но дали ще получи коридор за обсъждане законът, трасиращ пътя към избори на Висш прокурорски съвет, Висш съдебен съвет, Инспекторат на съдебната власт и главен прокурор, предстои да се разбере.
Също така все още не е известно дали управлявалото доскоро мнозинство ПП–ДБ и ГЕРБ–СДС ще се заеме с избора поне на тези 85 членове на регулатори и контролни органи, за които е необходимо обикновено мнозинство. Идеята не е чужда на някои политици от ГЕРБ и ПП–ДБ. Със сигурност ще се наложи парламентът да избере омбудсман и негов заместник, при това без да губи време, тъй като през април Ковачева ще смени досегашния български съдия в ЕСПЧ Йонко Грозев. Продължават да са във висящо положение и управителят и подуправителят на НЗОК, които бяха първоначално избрани от парламента, а след скандал внесоха оставките си през декември 2023 г. Така Станимир Михайлов и Момчил Мавров тушираха възникналия тогава конфликт в сглобката, „помолила“ ги да подадат оставки.
Тези и други назначения обаче трябва да намерят разрешение независимо от публично изразеното нежелание от съпредседателя на ПП Кирил Петков да се назначават хора преди избори, „когато е мътна водата“. Предложението за това беше отправено от лидера на ГЕРБ Бойко Борисов, който смята, че е по-добре двете формации да работят заедно, вместо да се противопоставят. Мандатите на мнозина в тези държавни органи са изтекли от години, а неизвестността как ще са разпределени силите в 50-тия парламент след изборите през юни прави атрактивна офертата на лидера на ГЕРБ. Освен че налива основи за бъдеща коалиция. Със сглобките вече е приключено.
Post Syndicated from Зорница Христова original https://www.toest.bg/po-bukvite-larkin/

превод от английски Кристин Димитрова и Георги Пашов, София: Издателство за поезия ДА, 2024
За какво служат дните,
започва едно стихотворение на Филип Ларкин. В дните живеем, идва незабавният отговор. Почти детскоградински отговор, но пък и въпросът сякаш е такъв. И вижте как продължава – те идват, събуждат ни отново и отново. Идват, за да се радваме в тях.
И тук втори въпрос:
Къде да живеем освен в дните?
Какво ще рече това? Дали не е като в „Часовете“ при Майкъл Кънингам – времето на часовниците срещу вътрешното усещане за време и случване? Протяжността на времето срещу фрустрацията от неговата празнота, по-скоро от неговата запълненост с тривиални, ежедневни неща?
Да се върнем страница назад.
О, няма съмнение, че Арнолд не е егоист като мене. Той се ожени, за да не си отиде завинаги тя, и ето я тука деня и нощя.
Следва описание на брачния живот, което очевидно ужасява протагониста; ужасява го тъкмо с това, че бракът пълни с несвобода не дни, а години, задръства го, пълни го… с нищо. В какъв смисъл „с нищо“?

Друго стихотворение. Героят е на гара, на която вижда влак за своя роден град, за Ковънтри. Събеседникът му го пита нещо за града на детството – и героят се сепва и казва: не, какво детство, просто там съм роден. И когато разказва неукрасените си и неовкусени спомени, добавя накрая, че не е виновно градчето, не е виновен Ковънтри, защото
Нищото, като нещото, се случва навсякъде.
Но защо „нищо“? Какво трябва да се случи в Ковънтри, в София, където и да било, за да бъде „нищото“ нещо? Какво трябва да има във „фотоалбума на една млада дама“, какво точно трябва да купят парите в „Пари“, за да не навяват тъга?
Както пише преводачката Кристин Димитрова в своя послеслов, Ларкин има двойствено отношение към Дилън Томас и поетите от неговото поколение. Ранното възхищение преминава в силно разграничение; като предшественик се припознава единствено Харди. Неволно си представям бясната динамика в поезията на Томас, онази сила, дето през зелен фитил извлича цветето и понякога завихря дори езика до помътняване, до непрозрачност, за да може да го накара да каже, че „и смъртта ще остане без царство“.
На този фон Филип Ларкин иронично отбелязва, че „емпириката казва друго“. Не само за смъртта, а за цялата жизнена сила, която като че ли тупти у Дилън Томас, цялата неизчерпаемост на жизнената енергия, която всъщност можем да проследим и малко по-назад, да я наречем байроническа, романтическа, сюблимна.
Ето това липсва в Ковънтри. Това липсва в дните.
Наречете го както щете – високи прозорци?
Това е старата „сюблимност“ на романтиците. И всичко – цялото живеене, всички тези дни – изяжда нейното място, нейната възможност за случване. Затова „високите прозорци“ идват в края на стихотворението, което започва с двамата млади, които се чукат и тя ползва диафрагма – възможно най-несакралното на пръв поглед начало, но това, което ще възпре разливането на мига в живеене, в непрестанно възпроизвеждаща се причинно-следствена връзка.
И този парадокс присъства навсякъде в поезията на Ларкин – тя е на пръв поглед ужасно неромантична, дори подигравателна към всички клишета на романтиците – детето, любовта, природата – насмешлива и изпитателна, готова да припява като някакъв съвременен Тил Уленшпигел they fuck you up, your mom and dad… – и в същото време болезнено романтична в копнежа си да стопира всичко в очакване на сюблимното, което е… какво?
Онова от живота, което би било равно по сила на смъртта.
нещо, което да не е мираж, нито неумело самозалъгване, нито лъжа. Онова, което има предвид и Далчев в прочутото „не ме оставяй да загина, преди да съм живял“. Той копнее за това почти толкова силно, колкото всеки романтик; и толкова ясно описва неговото несъществуване, че то затрептява пред нас „в позлата и с изопнат такелаж“.
И това прави уж мизантропската му, насмешлива поезия дълбоко вълнуваща.
П.П. Ларкин е доста труден за превод по много причини. Радвам се, че е попаднал точно в ръцете на Георги Пашов и Кристин Димитрова. Препоръчвам горещо и нейния послеслов – там ще намерите всичко, което аз пропуснах.
В емблематичната си колонка, започната още през 2008 г. във в-к „Култура“, Марин Бодаков ни представяше нови литературни заглавия и питаше с какво точно тези книги ни променят. Вярваме, че е важно тази рубрика да продължи. От човек до човек, с нова книга в ръка.
Post Syndicated from Тоест original https://www.toest.bg/v-ada-bez-izhod-i-nie-byahme/

в ада без изход и ние бяхме и ние бяхме някога.
и сега сме и ще бъдем и утре, вдругиден
и во веки веков водите на същата река ще ни къпят.
колко месеца бяха единствено ден и нощ,
колко ли месеца не го търсих навсякъде?
минувачо, внимавай: пространството там
рязко кривва наляво, главата на влечугото
се къса от тялото, гипсът на шията се счупи и нацепи. онази глава
сега се носи сама над суша и вода,
сама е сега, сама на
кораба на себастиан.
а ти бъди внимателен: ако се подхлъзнеш там,
никаква карта няма да ти помогне,
напразно ще се мъчиш да откриеш изхода-входа-изхода,
напразно ще се насилваш да разкъсаш савана на пространството,
в което си се приплъзнал. отвъд няма да намериш нищо друго
освен следата от стъпките ти от тази страна.
безкраен и безизходен е адът.
и никоя география досега не успя да го приближи.
и никакъв полъх не го предвещава.
нито пък го следва опашка на комета.
като облак над въздуха се носи той
над суша и вода, никакъв полъх не го предвещава.
нито пък го следва опашка на комета.
(1994)
Йоан Ес. Поп
Превод от румънски Лора Ненковска
Йоан Ес. Поп (р. 1958) е един от живите класици на съвременната румънска поезия. Дебютира през 1994 г. със стихосбирката „Адът без изход“. Книгата му е истинско събитие на фона на оглушителната тишина, царяща в румънския литературен живот в първото десетилетие след промените. Йоан Ес. Поп работи в Музея на литературата в Букурещ и е автор на 13 стихосбирки и поетични антологии.
Лора Ненковска е преподавателка по средновековна и съвременна румънска литература и румънски език в СУ „Св. Климент Охридски“. Тя много обича да следи какво се случва в съвременната румънска (и не само) литература и е превела повече от 25 книги с проза, драматургия и поезия.
Според Екатерина Йосифова „четящият стихотворение сутрин… добре понася другите часове“ от деня. Убедени, че поезията държи умовете ни будни, а сърцата – отворени, в края на всеки месец ви предлагаме по едно стихотворение. Защото и в най-смутни времена доброто стихотворение е добра новина.
Post Syndicated from xkcd.com original https://xkcd.com/2913/

Post Syndicated from Explosm.net original https://explosm.net/comics/buying-groceries
New Cyanide and Happiness Comic
Post Syndicated from jzb original https://lwn.net/Articles/966631/
On March 21, Redis Ltd. announced that the Redis “in-memory data store
” project would now be
released under non-free, source-available licenses, starting with Redis 7.4. The
news is unwelcome, but not entirely unexpected. What is unusual with this situation is
the number of Redis alternatives to choose from; there are at least
four options to choose as a replacement for those who wish to stay
with free software, including a pre-existing fork called KeyDB and the Linux Foundation’s newly-announced Valkey project. The question now is which one(s)
Linux distributions, users, and providers will choose to take its place.
Post Syndicated from original https://www.toest.bg/vinagi-drugitie-sa-tezi-koito-se-izmukvat-po-terlitsi/

Ако на 17 март сте пропуснали да отпразнувате Деня на свети Патрик подобаващо, не унивайте. Съвсем спокойно и по всяко друго време може да извършите някоя от дейностите, с които се отбелязва празникът – да се закичите с трилистна детелина, да се облечете в зелено или да се почерпите с пинта „Гинес“. А ако пинтите станат повечко и се наложи, може дори да упражните т.нар. ирландско сбогуване.
Наименованието на последната „дейност“ все още не е сериозно навлязло в българския език, но самата тя – състояща се в това
– със сигурност е добре позната и широко разпространена практика както в България, така и на много други географски ширини. И макар че на дейността като цяло се гледа с неодобрение като проява на лошо възпитание, тя все пак има и известни преимущества.
От практическа гледна точка „ирландското сбогуване“ несъмнено предотвратява загубата на време, тъй като се избягват ненужни формалности. Наскоро попаднах на изследване, проведено сред австралийци. Според резултатите от него хората, които систематично напускат купони, без да се сбогуват, спестяват по цели два дни на година¹. Макар и числото вероятно да варира според конкретния случай, личностните специфики на отделния човек и общоприетите нрави в различни култури, безспорно е, че безкрайните сбогувания в края на социални сбирки могат да погълнат минути, часове (а с натрупване очевидно и цели дни), които бихме могли да вложим в други (по презумпция) по-полезни дейности.
Но извън чисто практичната му полза „ирландското сбогуване“ също така ни предоставя възможност да разгледаме отблизо някои любопитни езикови особености, които от своя страна отразяват още по-любопитни културни, социални и исторически феномени – и то без риск да ни обвинят в неприлични обноски.
Смята се, че
Макар че няма единодушна теория за появата му, според една от версиите, цитирана в базата данни с неологизми на университета „Райс“, изразът е разговорен и води началото си от Бостън, Масачузетс, a употребата му се отнася за някой, който напуска парти, бар или друго социално събиране, защото е пиян и иска да си тръгне, без да разговаря с никого и да разкрива нетрезвото си състояние.
Други, по-сантиментални теории свързват произхода на израза с т.нар. Ирландски картофен глад в средата на XIX век, който принуждава между един и два милиона души да eмигрират от Ирландия, голяма част от които впоследствие се заселват в Америка. Трети пък правят връзка между горните две теории, изтъквайки репутацията на ирландските имигранти и техните потомци като големи пиячи, на които често им се налага да практикуват „ирландското сбогуване“, поради което и самата практика започва да се нарича по този начин.
Както можем да предположим, макар и произходът на конкретния израз да е сравнително скорошен, самата практика е много по-стара, като лингвистите проследяват първообраза му не до другаде, а до родното място на добрите обноски – Англия. Използвайки възможността за пореден път да покажат два пръста² на древните си врагове от другата страна на Ламанша (който те, разбира се, наричат The English Channel), англичаните още от средата на XVIII век – като определение на страхливото оттегляне на французите по време на военни сражения³ – назовават практиката на напускане без сбогуване French leave, а в по-съвременен вариант тя съществува и като French exit.
От английския език изразът се разпространява и навлиза в испанския (despedirse a la francesca) и португалския (sair á francesca), а даже и в словенския (oditi po francosko), гръцкия (την κάνω/το σκάω αλά γαλλικά) и немския (sich auf französisch empfehlen), макар че там съществува и понятието einen polnischen Abgang machen („да направиш полски изход“)⁴.
Както може да се очаква, французите не остават длъжни на англичаните и на свой ред им показват една bras d’honneur, обозначавайки безцеремонното тръгване като filer a l’anglaise, тоест „измъкване по английски“. На свой ред цял набор от други езици заимстват израза, като например унгарският (angolosan távozik), румънският (a o sterge englezeste), полският (wyjść po angielsku), чешкият (vypařit se po anglicku), украинският („пiти по-англiйськи“) и руският („уйти по-английски“)⁵.
Италианците пък, явно предпочитайки да не заемат страна – или пък смятайки англичаните и французите за еднакво невъзпитани, – използват и двете разновидности: както andarsene alla francese, така и filarsela all’inglese.
Както съвсем намясто се отбелязва в статия по темата в Zeit Magazin,
Но не и според българския език, който – като никога! – в този случай се проявява доста по-възпитано и политкоректно от европейските си роднини.
Макар че ирландското, английското и френското сбогуване до известна степен вече са навлезли като фрази и в българския език, той по-скоро разчита на благозвучни, почти ономатопеични и винаги възвратни (тоест насочени не към друг, а към самия извършител на безцеремонното напускане) глаголи, за да назове въпросната практика, например: „изсулвам се“, „измъквам се“, „изнизвам се“, „изнасям се“, „спасявам се“, „чупя се“ и т.н. Някои от другите често използвани глаголи, освен възвратни, са и метафорични: „изпарявам се“, „омитам се“, „омъглявам се“⁶.
А когато изразите съдържат някакво сравнение, се разчита по-скоро на конкретни образи от всекидневието, отколкото на стереотипизиране на цели народи, например: „измъквам се по терлици/пантофи/капли“, „изхлузвам се като мокра връв“, „изнизвам се през задния вход“ или „изпарявам се като дим“. Вероятно всички вие вече сте се досетили и за най-цветистия български израз за въпросната практика, който може и да не обижда ничия национална принадлежност, но със сигурност нарушава добрия тон. (Да, става дума точно за фразата, в която напускането тихомълком се сравнява с друга универсална „човещинка“, или измъкването като „газ“ из „бельо“.)
Тук все пак е справедливо да отбележим, че и в нарочените по-горе за неполиткоректни езици съществуват и „по-дипломатични“ изрази за практиката да се изнижеш без обяснения. В САЩ например като синонимни за Irish goodbye се използва и вече леко остарялото понятие houdini, по името на американския илюзионист, живял в края на XIX и началото на XX век и известен с ловкото си измъкване от белезници, усмирителни ризи и всякакви други примки, както и новопоявилият се (и вече навлязъл и сред младото поколение по света, включително и в България) глагол to ghost, от „призрак“⁷. Французите пък, когато искат да спазят благоприличие и да не обиждат англичаните, използват израза partir comme un voleur („да напуснеш като крадец“).
За финал няма как да не се запитаме какво е положението в самата Ирландия. Според единия от тримата ирландци, до които се допитах, там не съществува конкретен израз, еквивалентен на „ирландско сбогуване“⁸. Другите двама изобщо не ми отговориха, което – вярвам, ще се съгласите – е точно толкова грубо, колкото да си тръгнеш, без да се сбогуваш.
Но все пак изглежда, че не само изразът, а и практиката, поне до известна степен, са достигнали и до Изумрудения остров. Миналата година например гледахме ирландската комедия, взела „Оскар“ за най-добър късометражен игрален филм, чието заглавие – An Irish Goodbye – е директно заимствано от израза. И докато в „Баншите от Инишерин“ – другия ирландски фаворит от 2023 г. – изразът може изобщо да не се споменава, няма как да не отбележим, че в самия център на историята, която филмът разказва, е точно едно абсолютно безцеремонно сбогуване. (Или поне опит за такова, макар и то впоследствие да се превръща в разтегленото сбогуване от алтернативната дефиниция на израза, което – освен че става доста кърваво – трае не часове, а дни наред, отваря нови теми за разговор и претърпява вълнуващи обрати.)⁹
Но дори и изразът Irish goodbye да не се използва в Ирландия, там сбогуването – както рязкото, така и разтегленото във времето и пространството – несъмнено е на почит10. Достатъчно е да споменем (без да се лъжем, че сме го чели) един от шедьоврите на ирландската литература: романа „Бдение над Финеган“ на Джеймс Джойс. Повествованието в него хем се разпростира подобно на болезнено дълго пиянско бълнуване, чийто край сякаш никога няма да настъпи (малко като настоящия текст), хем завършва напълно внезапно, без никакво предупреждение и по средата на изречението – съвсем в стила на ирландското сбогуване.
2 Показването на два пръста е британският еквивалент на универсалния вулгарен знак със среден пръст. Легендата проследява появата на първия жест до Стогодишната война (1337–1453), когато французите пленявали английските стрелци с лък и им отрязвали показалеца и средния пръст, за да им попречат да използват лъка, а незаловените стрелци започнали да показват знака V със същите два пръста като символ на неподчинение на французите.
3 Сред историческите източници няма консенсус дали английското French leave предхожда френското filer a l’anglaise, или обратното, но повечето лингвисти смятат, че и двата израза са се появили в резултат на взаимни обиди в страхливост между френски и английски войници по време на Седемгодишната война (1756–1763), а след това са започнали да се използват като определение на случаите, когато гости на бал или прием си тръгвали, без да се сбогуват с домакините.
4 Според статия в Zeit Magazin от 2014 г., докато по-старият израз „да се сбогуваш по френски“ (sich auf französisch empfehlen/verabschieden) е по-популярен в Западна Германия, в Източна Германия по-често се използва изразът със сходно значение „да направиш полски изход“ (einen polnischen Abgang machen). В статията се цитира научно изследване на германиста Дирк Рамтор, според което вторият израз произлиза от годините след падането на Берлинската стена, когато германците са имали навика да се шегуват на гърба на поляците и да ги набеждават, че са крадливи.
5 В руския си вариант изразът даже се появява в сценария „Как-то так всё вышло…“, който Владимир Висоцки пише в началото на 70-те години: „Снова возникли разговоры, все забыли про барда, и он незаметно ускользнул с женщиной, которой взгляд так безошибочно засек. Так сказать, ушел по-английски.“
6 Като става дума за (само)рефлексивност, мой близък от Швеция се пошегува с пословичната скандинавска социална скованост и каза, че там практиката да си тръгнеш, без да се сбогуваш, се нарича просто „най-нормално напускане на купон“.
7 На основата на „ирландското сбогуване“, „английското изнизване“ и „френския изход“ се раждат и цяла серия шеговити вариации, например: British exit, вдъхновен от Брекзит, който означава да обявиш на всеослушание, че си тръгваш, и часове по-късно да те открият пиян в някой ъгъл; Jewish goodbye, тоест да се сбогуваш с всички и след това още дълго да не си тръгнеш; и Tokyo Sayonara, когато на тръгване се сбогуваш единствено с котката.
8 В горецитираната статия в Zeit Magazin се твърди – както логично бихме могли да предположим, – че в Ирландия все пак се използва английският израз to take French leave.
9 Макар че около популярната дефиниция на израза Irish goodbye като цяло има консенсус, някои източници твърдят, че освен с установеното си и широко разпространено значение, той може да означава и точно обратното – безкрайно дълго сбогуване на входната врата, типично за големи ирландски семейства (но не само), по време на което се отварят нови теми и се провеждат цели разговори.
10 Неизненадващо, житието на самия покровител на Ирландия и ирландците свети Патрик съдържа цял набор такива „сбогувания“ – той бива отвлечен от пирати от родната си Англия, впоследствие бяга от робство и плен в Ирландия и т.н.
В рубриката „От дума на дума“ Екатерина Петрова търси актуални, интересни или новопоявили се думи от нашето ежедневие и проследява често изненадващия им произход, развитието на значенията им във времето и взаимовръзките им с близки и далечни езици.
Post Syndicated from Geographics original https://www.youtube.com/watch?v=IZoaJ6wxgbo
Post Syndicated from Tom Elkins original https://blog.rapid7.com/2024/03/28/stories-from-the-soc-part-1-idat-loader-to-bruteratel/

Rapid7’s Managed Detection and Response (MDR) team continuously monitors our customers’ environments, identifying emerging threats and developing new detections.
In August 2023, Rapid7 identified a new malware loader named the IDAT Loader. Malware loaders are a type of malicious software designed to deliver and execute additional malware onto a victim’s system. What made the IDAT Loader unique was the way in which it retrieved data from PNG files, searching for offsets beginning with 49 44 41 54 (IDAT).
At the time, the loader was seen being distributed via a FakeUpdates campaign. In two recent investigations, Rapid7’s Managed Detection & Response (MDR) observed the loader being used again. Based on the recent tactics, techniques and procedures observed (TTPs), we believe the activity is associated with financially motivated threat groups.
In this two-part blog series, we will examine the attack chain observed in two separate incidents, offering in-depth analysis of the malicious behavior detected. The incidents discussed in the series stem from opportunistic infections, wherein threat groups utilize malvertising and drive-by downloads in order to have their initial malicious payloads executed by users.
This first installment focuses on an incident triggered by a user downloading an application, which subsequently triggered the execution of the IDAT Loader and the BruteRatel C4 (BRC4) framework following initial access to a compromised asset.
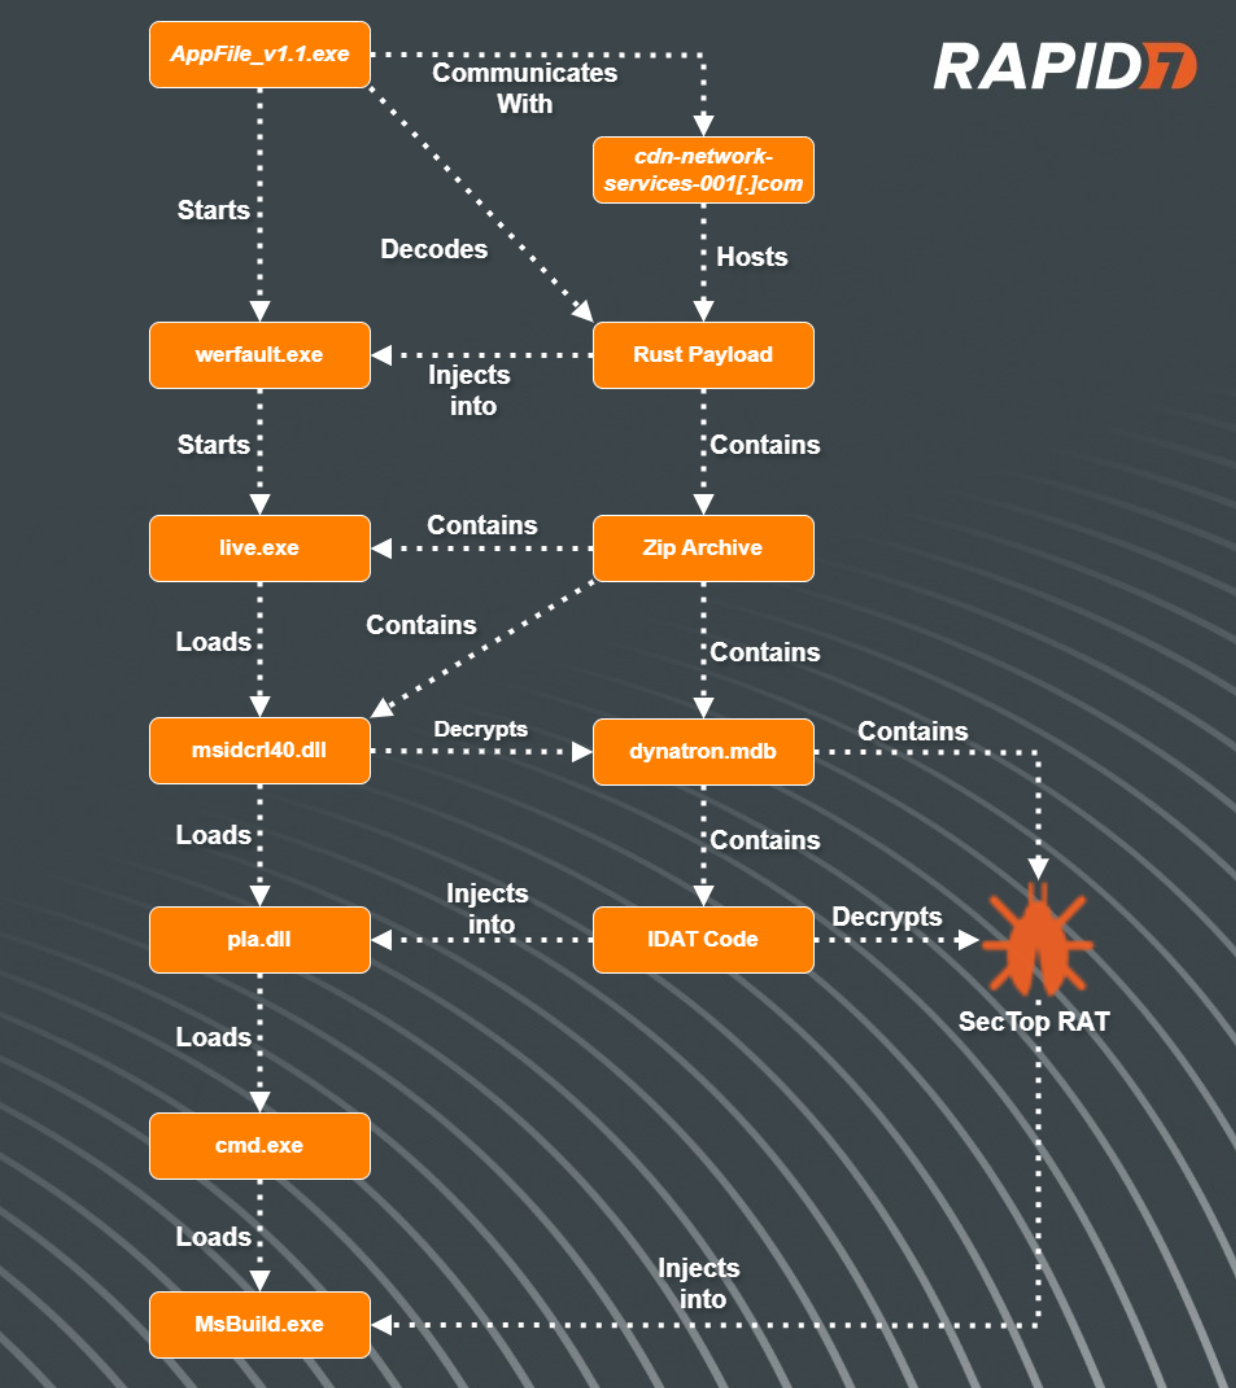
In a recent incident, Rapid7 observed a user navigate to a website that hosted popular Korean shows. Upon attempting to watch the video, the website redirected the user through various websites before ultimately directing the users browser into downloading a supposed application named AppFile_v1.1.exe. Threat actors utilize website redirection in order to make it difficult for network technologies to scan links for malicious content.
After initial analysis of the binary AppFile_v1.1.exe, Rapid7 determined the program was written in Rust.
During execution, the program will query the name of the executable. If the executable’s name matches AppFile_v1.1.exe, the program will continue. Most sandboxes will rename the files (sometimes based on the hash) of submitted programs. This technique helps to evade sandboxes, ensuring the malicious functions are not run. If the program name does not match its original intended name, the program will quit and display an error message, showing an image that a web page could not be loaded.

Next, the program will check to see if it resides within a debugger by querying the function IsDebuggerPresent. If the check passes, it will decrypt a hard-coded string that resolves to “Normal”. If not, the program will decrypt another hard-coded string that resolves to “Debugger” and then exit.
Once the anti-debug check passes, the program retrieves an encrypted string and XOR decrypts it, revealing the URL hxxps://cdn-network-services-001[.]com/update/minor/1/release.json.
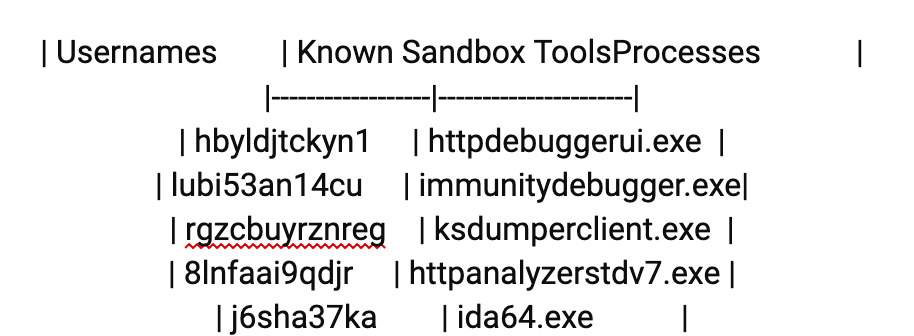
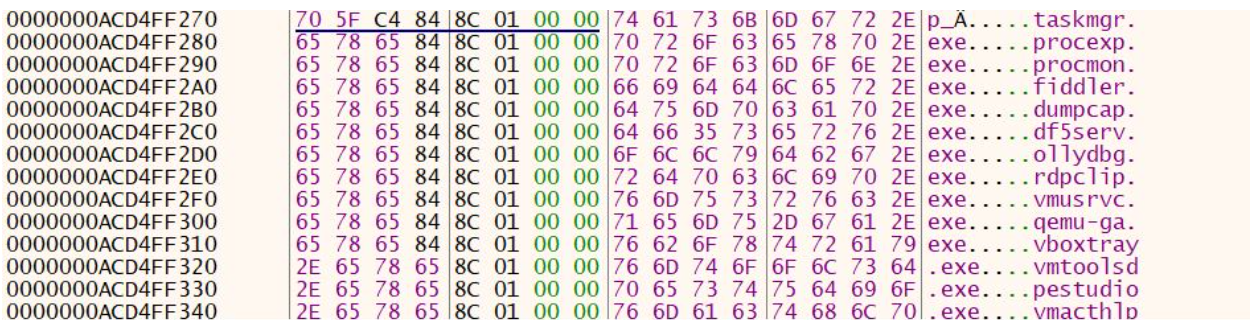
The program will then perform anti-analysis techniques, specifically querying for the username and open process and comparing them to a list of known sandbox usernames and tools. The list of usernames and processes are also XOR-encrypted and are decrypted at runtime. Based on Open Source Intelligence, we determined that another malware known as Serpent Stealer contained a similar table of user names. See Appendix A below for the complete list.
If any of the checks fail, the program will exit and display the message box. If the checks pass, the program will then utilize Rust library tokio-1.32.0/src/net/tcp/stream.rs in order to read in data from the decrypted URL and store the contents in memory.
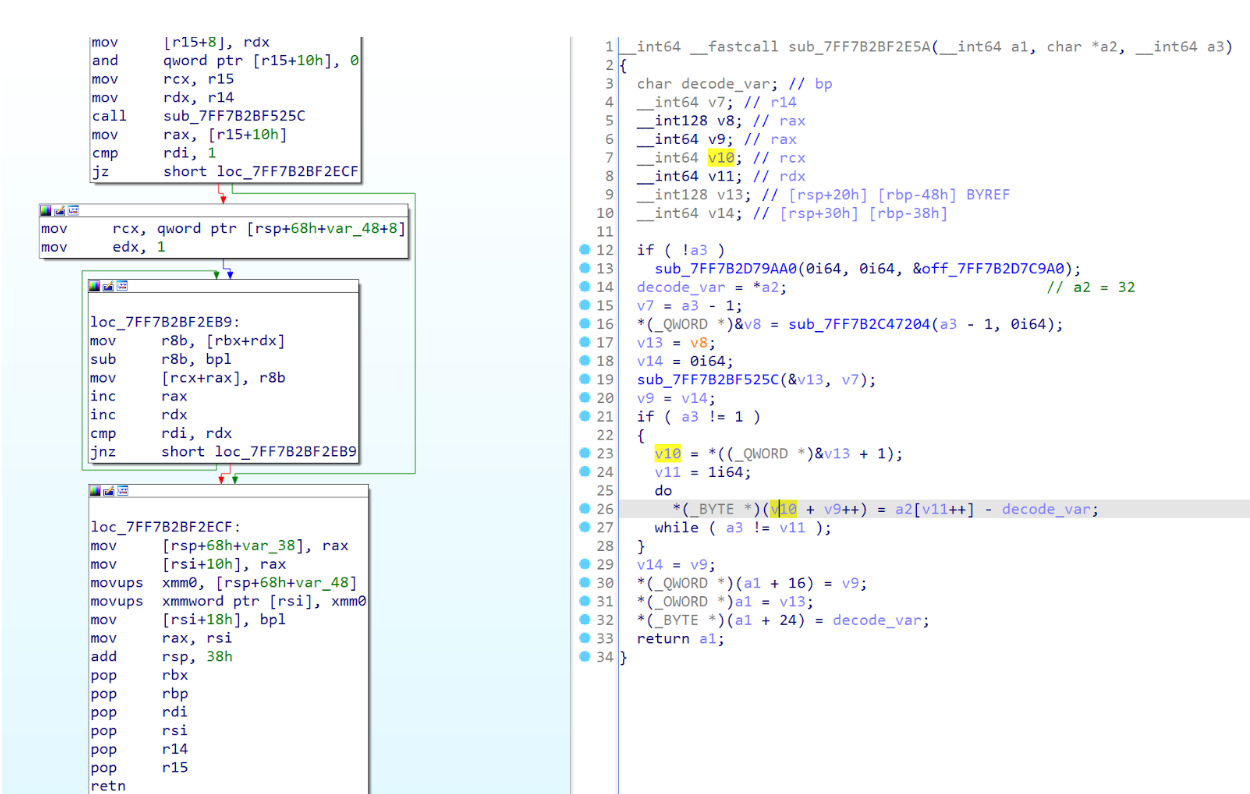
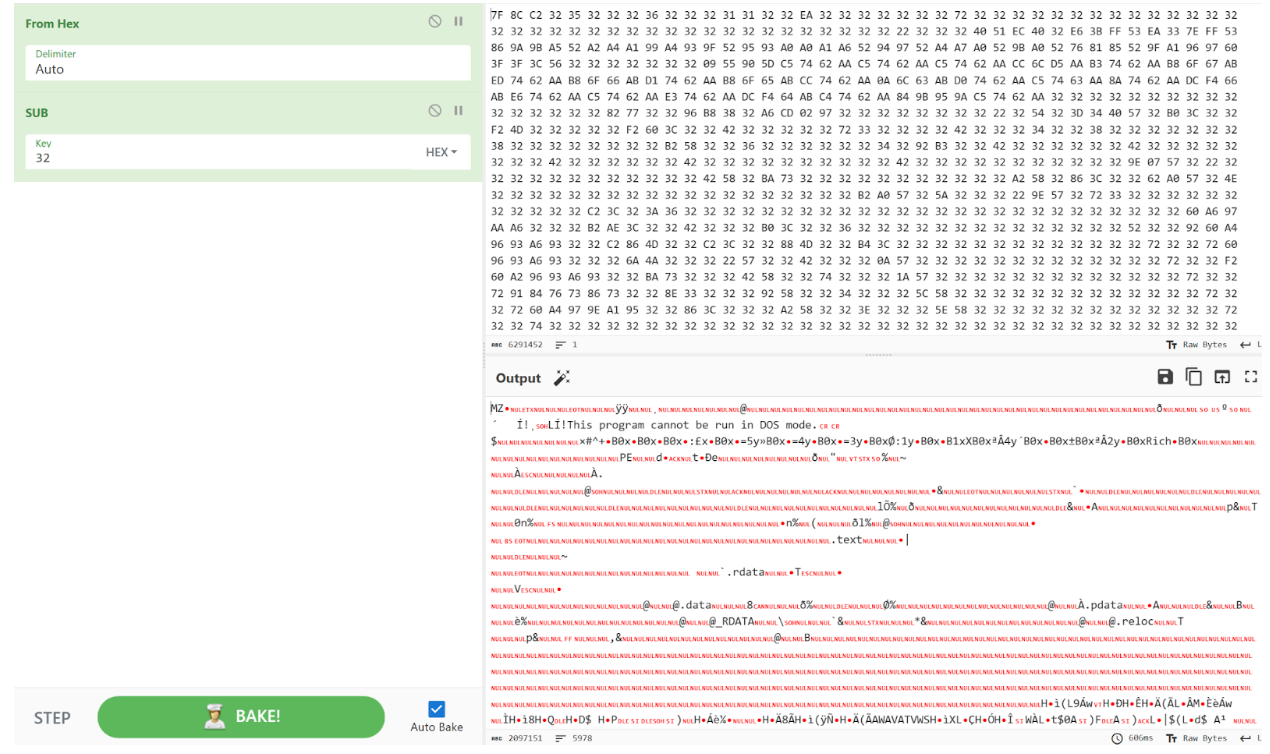
Upon initial analysis, the downloaded data appeared to be encoded. Subsequently, the data is passed into a function tasked with decoding it. The decoding process involves reading each byte and subtracting the hexadecimal value 32.
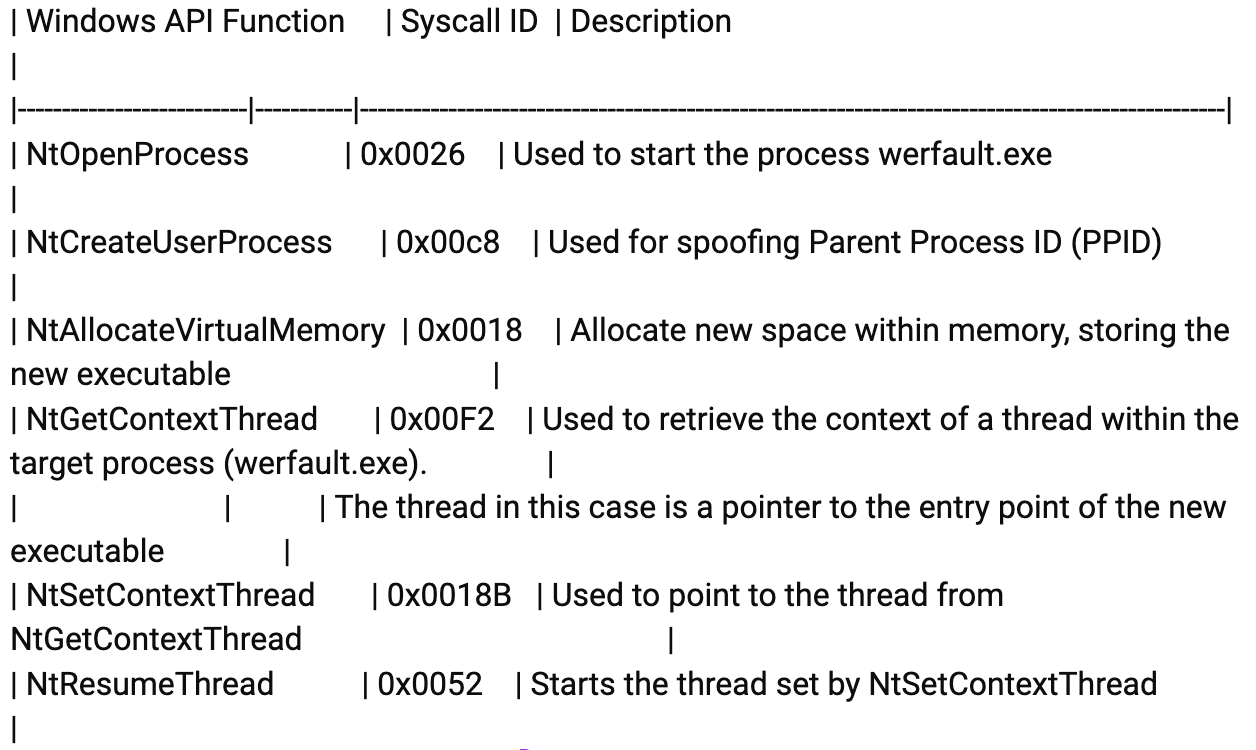
After the downloaded data is decoded, the program XOR decrypts another string, revealing a path to the executable C:\Windows\system32\werfault.exe. Using syscalls, the program then does the following:
After analysis of the decoded binary, we determined that it was another executable written in Rust. The program’s executable contains a zip archive within the .rdata section. During execution, the program generates a folder with a randomly generated name in the %TEMP% directory and extracts the contents of the archive into this newly created folder.
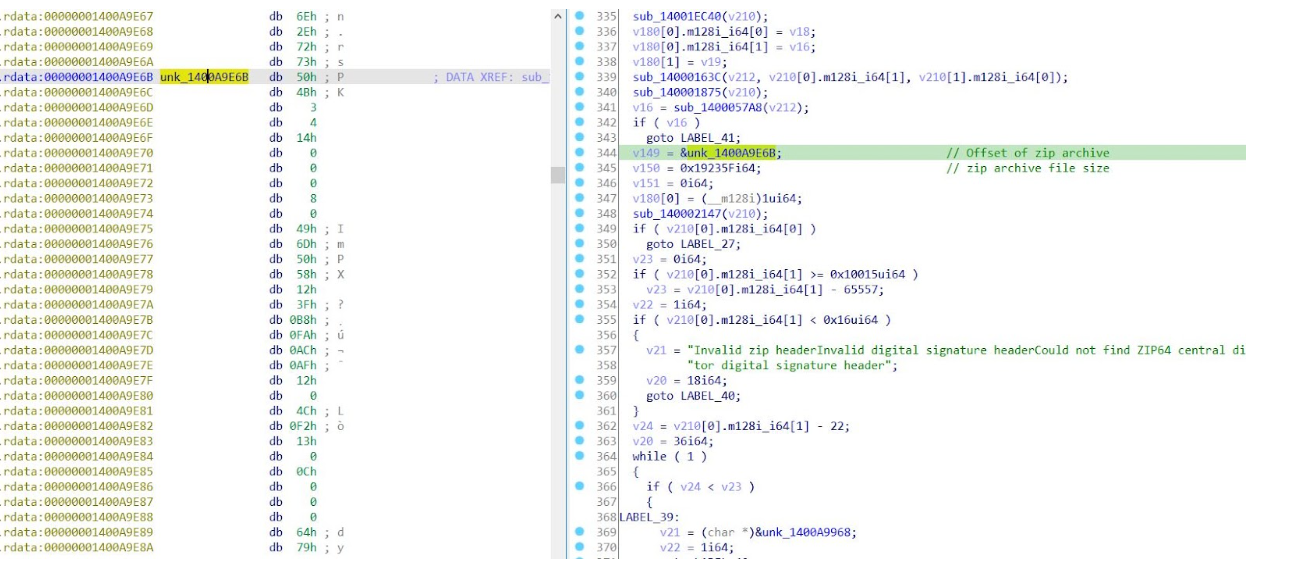
The archive contained a DLL, msidcrl40.dll, an executable named live.exe and an encrypted file, dynatron.mdb. Initial analysis of the DLL msidcrl40.dll showed that the DLL’s signature was corrupted, indicating the DLL was tampered with. Further analysis showed that the DLL contained code related to the IDAT Loader.
After the rust program drops the contents of the zip archive, it then proceeds to execute the binary live.exe, which sideloads the DLL, msidcrl40.dll, containing the IDAT Loader code.
After the binary live.exe loads the DLL msidcrl40.dll, the DLL executes the function containing the IDAT Loader. The IDAT then reads in encrypted contents contained within the file dynatron.mdb, searching for the offset 49 44 41 54 (IDAT) followed by C6 A5 79 EA. After decrypting the contents, the loader will then decompress the contents using RtlDecompressBuffer and execute additional code into a newly created process, cmd.exe.
The IDAT loader employs advanced techniques such as Process Doppelgänging and the Heaven’s Gate technique in order to initiate new processes and inject additional code.
The code contained within cmd.exe is responsible for decrypting the final payload and injecting it into a newly created process, msbuild.exe.
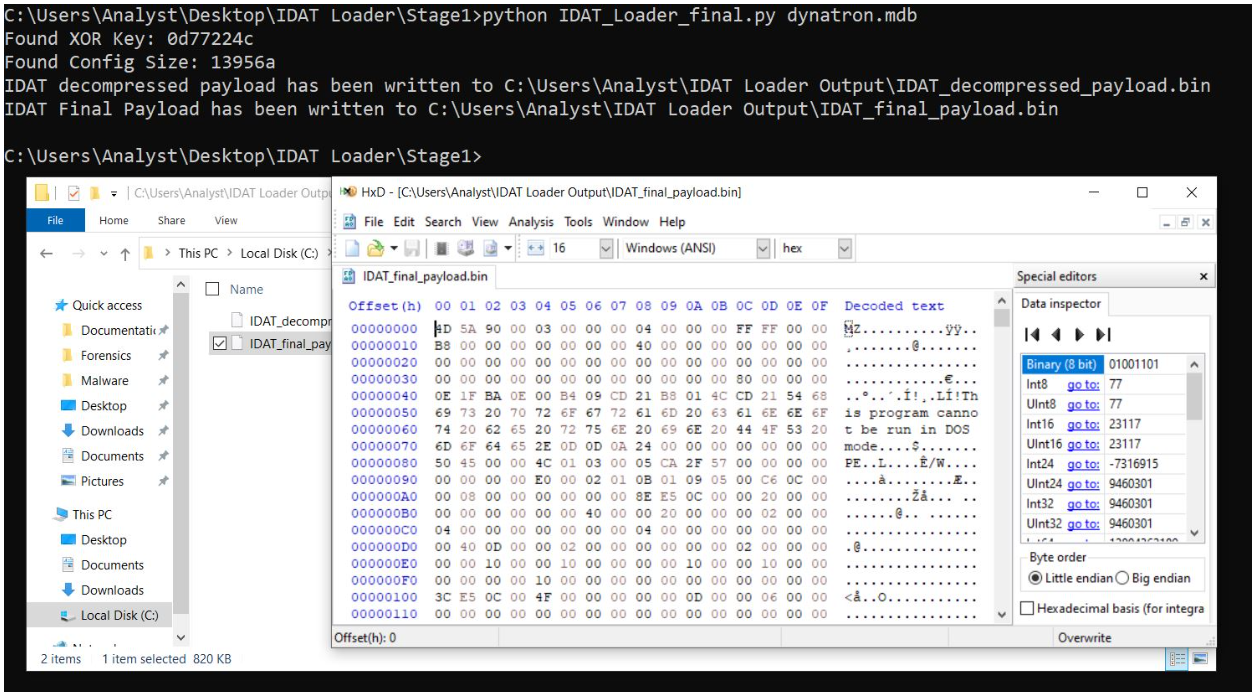
Using our IDAT Loader config extractor, we were able to extract the final payload and determined that it was SecTop RAT. During execution of the SecTop RAT, we observed that it communicated with the IP address 152.89.217[.]215.
After the SecTop RAT was executed successfully, Rapid7 observed follow-on activity in which the threat actor executed another version of the IDAT loader from within the folder path C:\ProgramData\. We observed the following related files were dropped by the threat actor into C:\ProgramData:
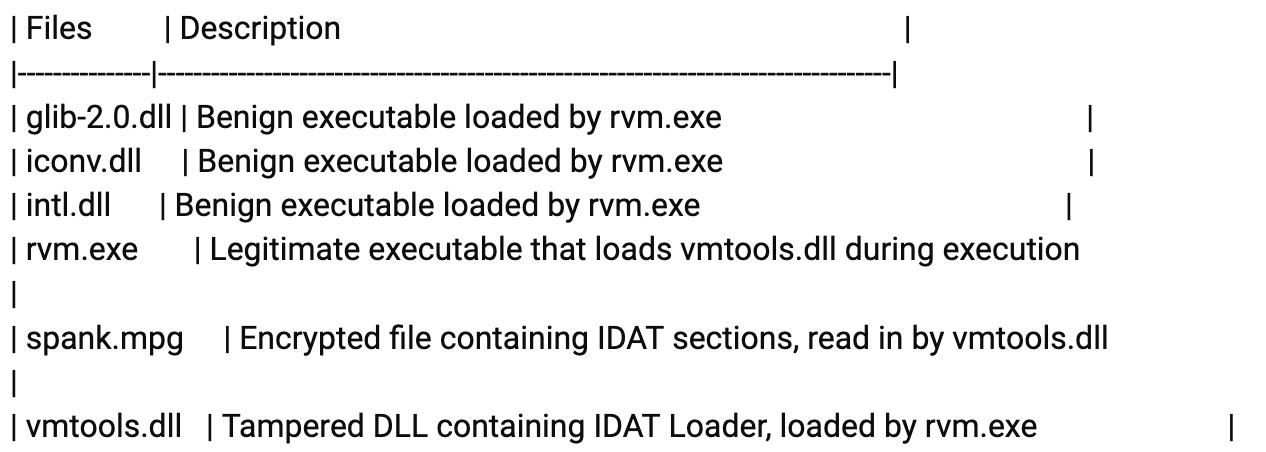
After analysis of the files, we determined that rvm.exe was a renamed executable rvmsetup.exe, a legitimate tool that is a part of the VMWare Tools toolset. The binary is used to join a VMWare source virtual machine to an active directory domain. We also observed that the binary vmtools.dll had a corrupted signature, indicating the binary’s code was tampered with. We observed that the DLL vmtools.dll contained code related to the IDAT Loader.
During execution of the executable, rvm.exe, the program loads vmtools.dll. After vmtools.dll is loaded, the DLL is directed to execute a function that contains the IDAT Loader. The IDAT Loader proceeds to read in contents from within spank.mpg, searching for the same offset, 49 44 41 54 (IDAT) followed by C6 A5 79 EA. After decrypting the contents within spank.mpg, the IDAT Loader spawns a new process, cmd.exe, injecting additional code that is responsible for decrypting the final payload and injecting it into a newly created process, explorer.exe.
Using our static config extractor, we extracted the final payload, a 64-bit executable. During initial analysis of the final payload, we observed that the program utilized the API functions VirtualAlloc and VirtualProtect. During execution of the program, it utilized VirtualAlloc to read in and store additional code, including encrypted data, into a new region of memory. The program then called upon the function VirtualProtect, changing the newly allocated region of memory (containing the new code) to be executable. We also observed the 64 bit executable (obtained from the IDAT Loader python script) had the capability to perform process hollowing by starting a new process, notepad.exe, and injecting the code into the newly created process.
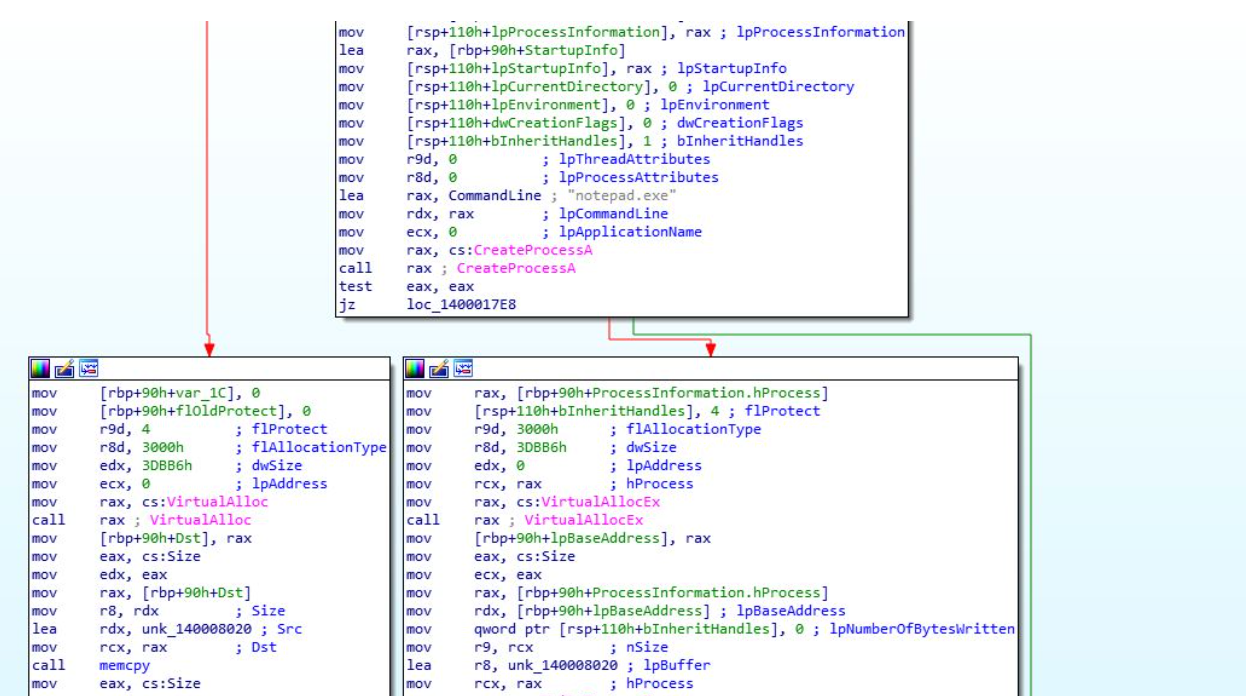
The newly allocated code was responsible for decrypting the encrypted data using RC4, copying the decrypted code into an allocated memory buffer via VirtualAlloc, and setting the memory buffer to have executable permission using VirtualProtect. Rapid7 determined the decrypted code was a Brute Ratel C4 (BRC4) “badger”.
Brute Ratel originated as a post-exploitation tool intended for penetration testers, designed to mimic adversary tactics as of December 2020. Its development aimed to replicate the functionality of established Command and Control (C2) software like Cobalt Strike, Mythic and Sliver. Following a successful compromise of a target, the attacker deploys the Brute Ratel “badger,” tasked with establishing communication with the attacker’s Command and Control domain.
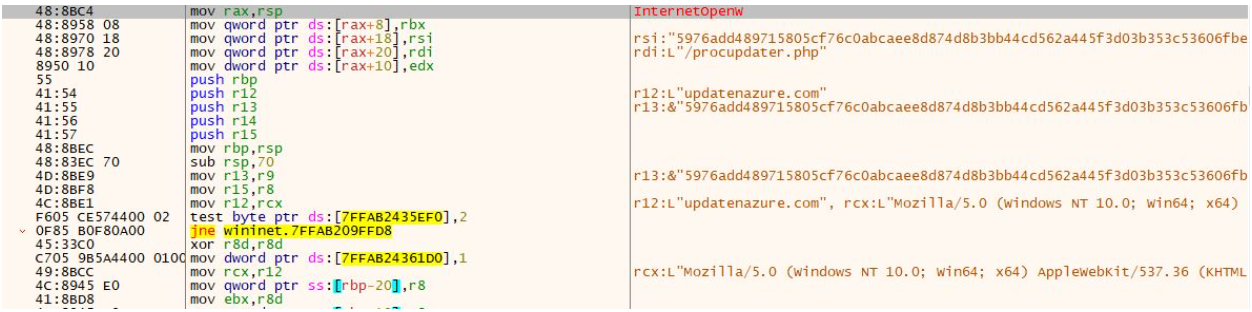
During execution of the BRC4 program, we observed that it reached out to the domain updatenazure[.]com.
After the BRC4 program was executed, we observed the threat actor attempting to enumerate the domain controller by using the command nltest /dclist.
InsightIDR and Managed Detection and Response customers have existing detection coverage through Rapid7’s expansive library of detection rules. Rapid7 recommends installing the Insight Agent on all applicable hosts to ensure visibility into suspicious processes and proper detection coverage. Below is a non-exhaustive list of detections deployed and alerting on activity described:
| Usernames | Processes |
|---|---|
| hbyldjtckyn1 | httpdebuggerui.exe |
| lubi53an14cu | immunitydebugger.exe |
| rgzcbuyrznreg | ksdumperclient.exe |
| 8lnfaai9qdjr | httpanalyzerstdv7.exe |
| j6sha37ka | ida64.exe |
| keecfmwgj | 32dbg.exe |
| pwouqdtdq | 64dbg.exe |
| qmis5df7u | protection_id.exe |
| txwas1m2t | vmsrvc.exe |
| uox1tzamo | x32dbg.exe |
| rb5bnfur2 | x64dbg.exe |
| cm0uegn4do | x96dbg.exe |
| douyo8rv71 | prl_cc.exe |
| paul jones | windbg.exe |
| pxmduopvyx | scylla.exe |
| fnbdsldtxy | idau64.exe |
| gexwjqdjxg | idaq64.exe |
| gjam1nxxvm | idag64.exe |
| jcotj17dzx | taskmgr.exe |
| 05kvauqkpqk5 | procexp.exe |
| 64f2tkiqo5k5h | procmon.exe |
| of20xqh4vl | fiddler.exe |
| harry johnson | dumpcap.exe |
| 4tgiizslims | df5serv.exe |
| bvjchrpnsxn | ollydbg.exe |
| kfu0lqwgx5p | rdpclip.exe |
| nok4zg7zhof | vmusrvc.exe |
| ogjb6gqgk0o5 | qemu-ga.exe |
| xplyvzr8sgc | vboxtray.exe |
| ykj0egq7fze | vmtoolsd.exe |
| ryjijkiroms | pestudio.exe |
| nzap7ubvas1 | vmacthlp.exe |
| 9yjcpseyimh | procexp64.exe |
| uhuqiuwoefu | wireshark.exe |
| 6o4kyhhjxbir | prl_tools.exe |
| 7wjlgx7pjlw4 | importrec.exe |
| 8nl0colnq5bq | vmwaretray.exe |
| g2dbyldgzz8yo | vmwareuser.exe |
| pqonjhvwexsst | xenservice.exe |
| rdhj0cnfevzxf | scylla_x86.exe |
| xmimmckziitdl | scylla_x64.exe |
| l3cnbb8ar5b8 | vboxservice.exe |
| vzy4jmh0jw02 | |
| 21zlucunfi85 | |
| sal.rosenburg | |
| defaultaccount | |
| wdagutilityaccount |
| Tactics | Techniques | Details |
|---|---|---|
| Initial Access | Drive-by Compromise (T1189) | Threat Actors utilize drive-by downloads in order to direct browsers to download their initial payloads without users consent |
| Execution | User Execution: Malicious File (T1204.002) | Users execute the binary AppFile_v1.1.exe |
| Execution | Native API (T1106) | The IDAT injector and IDAT loader are using Heaven’s Gate technique to evade detection |
| Defense Evasion | Hijack Execution Flow: DLL Search Order Hijacking (T1574.001) | run.exe loads a malicious wbxtrace.dll |
| Defense Evasion | Process Injection (T1055) | IDAT injector implements NtCreateSection + NtMapViewOfSection Code Injection technique to inject into cmd.exe process |
| Defense Evasion | Deobfuscate/Decode Files or Information (T1140) | msidcrl40.dll decrypts dynatron.mdb |
| Defense Evasion | Process Injection: Process Doppelgänging (T1055.013) | IDAT loader implements Process Doppelgänging technique to load the SecTop RAT |
| Defense Evasion | Masquerading (T1036) | dynatron.mdb file masqueraded to a .png file |
| Defense Evasion | Virtualization/Sandbox Evasion: Time Based Evasion (T1497.003) | Execution delays are performed by several stages throughout the attack flow |
| IOC | Sha256 | Notes |
|---|---|---|
| AppFile_v1.1.exe | A3A5E7011335A2284E2D4F73FD464FF129F0C9276878A054C1932BC50608584B | Rust Loader responsible for downloading IDAT Loader |
| msidcrl40.dll | 02D5E281689EC2D4AB8AC19C93321A09113E5D8FA39380A7021580EA1887B7A5 | Malicious DLL executed by live.exe |
| dynatron.mdb | C5C52331B208CAD19DC710786E26AC55090FFCA937410D76C53569D731F0BB92 | Encrypted payload decrypted by msidcrl40.dll |
| vmtools.dll | BEFE0DF365F0E2DC05225470E45FDF03609F098A526D617C478B81AC6BB9147F | Malicious DLL executed by rvm.exe |
| spank.mpg | E05E561C5118EFDBCA113CA231C527B62E59A4BFFAE3BD374F7B4FCDD10E7D90 | Encrypted payload decrypted by vmtools.dll |
| hxxps://cdn-network-services-001[.]com/update/minor/1/release.json | Downloads additional Rust binary containing IDAT Loader | |
| 152.89.217[.]215 | SecTop RAT domain | |
| updatenazure[.]com | BRC4 Domain |
| Article | URL |
|---|---|
| Uncovering the “Serpent” | https://malware.news/t/uncovering-the-serpent/76253 |
| Process Doppelgänging | https://malware.news/t/uncovering-the-serpent/76253 |
| Analysis of “Heaven’s Gate” part 1 | https://sachiel-archangel.medium.com/analysis-of-heavens-gate-part-1-62cca0ace6f0 |
| A Deep Dive Into Malicious Direct Syscall Detection | https://www.paloaltonetworks.com/blog/security-operations/a-deep-dive-into-malicious-direct-syscall-detection/ |
| Fake Update Utilizes New IDAT Loader To Execute StealC and Lumma Infostealers | https://www.rapid7.com/blog/post/2023/08/31/fake-update-utilizes-new-idat-loader-to-execute-stealc-and-lumma-infostealers/ |
Post Syndicated from Cliff Robinson original https://www.servethehome.com/new-vmware-esxi-to-proxmox-ve-import-wizard-available/
A new import wizard is out to help users exfiltrate virtual machines from VMware ESXi to Proxmox VE making the process much easier
The post New VMware ESXi to Proxmox VE Import Wizard Available appeared first on ServeTheHome.
Post Syndicated from Florian Mair original https://aws.amazon.com/blogs/big-data/krones-real-time-production-line-monitoring-with-amazon-managed-service-for-apache-flink/
Krones provides breweries, beverage bottlers, and food producers all over the world with individual machines and complete production lines. Every day, millions of glass bottles, cans, and PET containers run through a Krones line. Production lines are complex systems with lots of possible errors that could stall the line and decrease the production yield. Krones wants to detect the failure as early as possible (sometimes even before it happens) and notify production line operators to increase reliability and output. So how to detect a failure? Krones equips their lines with sensors for data collection, which can then be evaluated against rules. Krones, as the line manufacturer, as well as the line operator have the possibility to create monitoring rules for machines. Therefore, beverage bottlers and other operators can define their own margin of error for the line. In the past, Krones used a system based on a time series database. The main challenges were that this system was hard to debug and also queries represented the current state of machines but not the state transitions.
This post shows how Krones built a streaming solution to monitor their lines, based on Amazon Kinesis and Amazon Managed Service for Apache Flink. These fully managed services reduce the complexity of building streaming applications with Apache Flink. Managed Service for Apache Flink manages the underlying Apache Flink components that provide durable application state, metrics, logs, and more, and Kinesis enables you to cost-effectively process streaming data at any scale. If you want to get started with your own Apache Flink application, check out the GitHub repository for samples using the Java, Python, or SQL APIs of Flink.
Krones’s line monitoring is part of the Krones Shopfloor Guidance system. It provides support in the organization, prioritization, management, and documentation of all activities in the company. It allows them to notify an operator if the machine is stopped or materials are required, regardless where the operator is in the line. Proven condition monitoring rules are already built-in but can also be user defined via the user interface. For example, if a certain data point that is monitored violates a threshold, there can be a text message or trigger for a maintenance order on the line.
The condition monitoring and rule evaluation system is built on AWS, using AWS analytics services. The following diagram illustrates the architecture.

Almost every data streaming application consists of five layers: data source, stream ingestion, stream storage, stream processing, and one or more destinations. In the following sections, we dive deeper into each layer and how the line monitoring solution, built by Krones, works in detail.
The data is gathered by a service running on an edge device reading several protocols like Siemens S7 or OPC/UA. Raw data is preprocessed to create a unified JSON structure, which makes it easier to process later on in the rule engine. A sample payload converted to JSON might look like the following:
{
  "version": 1,
  "timestamp": 1234,
  "equipmentId": "84068f2f-3f39-4b9c-a995-d2a84d878689",
  "tag": "water_temperature",
  "value": 13.45,
  "quality": "Ok",
  "meta": {
    "sequenceNumber": 123,
    "flags": ["Fst", "Lst", "Wmk", "Syn", "Ats"],
    "createdAt": 12345690,
    "sourceId": "filling_machine"
  }
}AWS IoT Greengrass is an open source Internet of Things (IoT) edge runtime and cloud service. This allows you to act on data locally and aggregate and filter device data. AWS IoT Greengrass provides prebuilt components that can be deployed to the edge. The production line solution uses the stream manager component, which can process data and transfer it to AWS destinations such as AWS IoT Analytics, Amazon Simple Storage Service (Amazon S3), and Kinesis. The stream manager buffers and aggregates records, then sends it to a Kinesis data stream.
The job of the stream storage is to buffer messages in a fault tolerant way and make it available for consumption to one or more consumer applications. To achieve this on AWS, the most common technologies are Kinesis and Amazon Managed Streaming for Apache Kafka (Amazon MSK). For storing our sensor data from production lines, Krones choose Kinesis. Kinesis is a serverless streaming data service that works at any scale with low latency. Shards within a Kinesis data stream are a uniquely identified sequence of data records, where a stream is composed of one or more shards. Each shard has 2 MB/s of read capacity and 1 MB/s write capacity (with max 1,000 records/s). To avoid hitting those limits, data should be distributed among shards as evenly as possible. Every record that is sent to Kinesis has a partition key, which is used to group data into a shard. Therefore, you want to have a large number of partition keys to distribute the load evenly. The stream manager running on AWS IoT Greengrass supports random partition key assignments, which means that all records end up in a random shard and the load is distributed evenly. A disadvantage of random partition key assignments is that records aren’t stored in order in Kinesis. We explain how to solve this in the next section, where we talk about watermarks.
A watermark is a mechanism used to track and measure the progress of event time in a data stream. The event time is the timestamp from when the event was created at the source. The watermark indicates the timely progress of the stream processing application, so all events with an earlier or equal timestamp are considered as processed. This information is essential for Flink to advance event time and trigger relevant computations, such as window evaluations. The allowed lag between event time and watermark can be configured to determine how long to wait for late data before considering a window complete and advancing the watermark.
Krones has systems all around the globe, and needed to handle late arrivals due to connection losses or other network constraints. They started out by monitoring late arrivals and setting the default Flink late handling to the maximum value they saw in this metric. They experienced issues with time synchronization from the edge devices, which lead them to a more sophisticated way of watermarking. They built a global watermark for all the senders and used the lowest value as the watermark. The timestamps are stored in a HashMap for all incoming events. When the watermarks are emitted periodically, the smallest value of this HashMap is used. To avoid stalling of watermarks by missing data, they configured an idleTimeOut parameter, which ignores timestamps that are older than a certain threshold. This increases latency but gives strong data consistency.
public class BucketWatermarkGenerator implements WatermarkGenerator<DataPointEvent> {
private HashMap <String, WatermarkAndTimestamp> lastTimestamps;
private Long idleTimeOut;
private long maxOutOfOrderness;
}
After the data is collected from sensors and ingested into Kinesis, it needs to be evaluated by a rule engine. A rule in this system represents the state of a single metric (such as temperature) or a collection of metrics. To interpret a metric, more than one data point is used, which is a stateful calculation. In this section, we dive deeper into the keyed state and broadcast state in Apache Flink and how they’re used to build the Krones rule engine.
In Apache Flink, state refers to the ability of the system to store and manage information persistently across time and operations, enabling the processing of streaming data with support for stateful computations.
The broadcast state pattern allows the distribution of a state to all parallel instances of an operator. Therefore, all operators have the same state and data can be processed using this same state. This read-only data can be ingested by using a control stream. A control stream is a regular data stream, but usually with a much lower data rate. This pattern allows you to dynamically update the state on all operators, enabling the user to change the state and behavior of the application without the need for a redeploy. More precisely, the distribution of the state is done by the use of a control stream. By adding a new record into the control stream, all operators receive this update and are using the new state for the processing of new messages.
This allows users of Krones application to ingest new rules into the Flink application without restarting it. This avoids downtime and gives a great user experience as changes happen in real time. A rule covers a scenario in order to detect a process deviation. Sometimes, the machine data is not as easy to interpret as it might look at first glance. If a temperature sensor is sending high values, this might indicate an error, but also be the effect of an ongoing maintenance procedure. It’s important to put metrics in context and filter some values. This is achieved by a concept called grouping.
The grouping of data and metrics allows you to define the relevance of incoming data and produce accurate results. Let’s walk through the example in the following figure.

In Step 1, we define two condition groups. Group 1 collects the machine state and which product is going through the line. Group 2 uses the value of the temperature and pressure sensors. A condition group can have different states depending on the values it receives. In this example, group 1 receives data that the machine is running, and the one-liter bottle is selected as the product; this gives this group the state ACTIVE. Group 2 has metrics for temperature and pressure; both metrics are above their thresholds for more than 5 minutes. This results in group 2 being in a WARNING state. This means group 1 reports that everything is fine and group 2 does not. In Step 2, weights are added to the groups. This is needed in some situations, because groups might report conflicting information. In this scenario, group 1 reports ACTIVE and group 2 reports WARNING, so it’s not clear to the system what the state of the line is. After adding the weights, the states can be ranked, as shown in step 3. Lastly, the highest ranked state is chosen as the winning one, as shown in Step 4.
After the rules are evaluated and the final machine state is defined, the results will be further processed. The action taken depends on the rule configuration; this can be a notification to the line operator to restock materials, do some maintenance, or just a visual update on the dashboard. This part of the system, which evaluates metrics and rules and takes actions based on the results, is referred to as a rule engine.
By letting users build their own rules, the rule engine can have a high number of rules that it needs to evaluate, and some rules might use the same sensor data as other rules. Flink is a distributed system that scales very well horizontally. To distribute a data stream to several tasks, you can use the keyBy() method. This allows you to partition a data stream in a logical way and send parts of the data to different task managers. This is often done by choosing an arbitrary key so you get an evenly distributed load. In this case, Krones added a ruleId to the data point and used it as a key. Otherwise, data points that are needed are processed by another task. The keyed data stream can be used across all rules just like a regular variable.
When a rule changes its state, the information is sent to a Kinesis stream and then via Amazon EventBridge to consumers. One of the consumers creates a notification from the event that is transmitted to the production line and alerts the personnel to act. To be able to analyze the rule state changes, another service writes the data to an Amazon DynamoDB table for fast access and a TTL is in place to offload long-term history to Amazon S3 for further reporting.
In this post, we showed you how Krones built a real-time production line monitoring system on AWS. Managed Service for Apache Flink allowed the Krones team to get started quickly by focusing on application development rather than infrastructure. The real-time capabilities of Flink enabled Krones to reduce machine downtime by 10% and increase efficiency up to 5%.
If you want to build your own streaming applications, check out the available samples on the GitHub repository. If you want to extend your Flink application with custom connectors, see Making it Easier to Build Connectors with Apache Flink: Introducing the Async Sink. The Async Sink is available in Apache Flink version 1.15.1 and later.
 Florian Mair is a Senior Solutions Architect and data streaming expert at AWS. He is a technologist that helps customers in Europe succeed and innovate by solving business challenges using AWS Cloud services. Besides working as a Solutions Architect, Florian is a passionate mountaineer, and has climbed some of the highest mountains across Europe.
 Emil Dietl is a Senior Tech Lead at Krones specializing in data engineering, with a key field in Apache Flink and microservices. His work often involves the development and maintenance of mission-critical software. Outside of his professional life, he deeply values spending quality time with his family.
 Simon Peyer is a Solutions Architect at AWS based in Switzerland. He is a practical doer and is passionate about connecting technology and people using AWS Cloud services. A special focus for him is data streaming and automations. Besides work, Simon enjoys his family, the outdoors, and hiking in the mountains.
Post Syndicated from Jennifer Newman original https://backblazeprod.wpenginepowered.com/blog/managing-the-media-tidal-wave-backlight-iconiks-2024-media-report/

Everyone knows we’re living through an exceptional time when it comes to media production: Every day we experience a tidal wave of content—social video, virtual reality (VR) and augmented reality (AR) gaming, 10K sports footage, every streaming option imaginable—crashing down on us.
Two eye popping stats underscore that this perception is real: In December, Netflix shared that its users streamed close to 100 billion hours of content on its platform during the first half of 2023. At the beginning of 2024, YouTube revealed that its users watch one billion hours of video daily.
It’s hard to make sense of that volume of content, it’s even harder to understand how it’s produced. Imagine the armies of people and types of programs required to capture, ingest, transcode, store, tag, edit, distribute, and archive all of it. Managing that content means touching every stage, start to finish, of the production process through the data lifecycle.

To further complicate things, the modern production person’s workflow is nothing close to linear. They have to deal with:
While many companies are jumping in to provide tools to manage this tidal wave of content, one company, Backlight iconik, differentiates itself by providing industry-leading tools and offering public media reports on the state of media data today.
Since 2018, iconik has provided a cloud-based media asset management (MAM) tool to help production professionals tame the insanity of modern content development. For the past four years, they’ve also provided an annual Media Stats report to help the industry understand the type of media being developed and distributed, as well as where and how it’s stored. (In 2022, Backlight, a global media technology, acquired iconik, hence the name change.) If you want the full story, please check out Backlight iconik’s 2024 Media Stats Report,
As cloud storage specialists here at Backblaze (and, lovers of stats ourselves), we would like to dig into their stats on storage and offer our own take here for you today.
According to Backlight iconik’s Media Stats Report, iconik’s data exploded to 152PB, shooting up by a whopping 57%—that’s 53PB more than in 2023. To put it in perspective, that’s roughly 6TB of fresh data pouring in every hour. This surge in data can be attributed to both new customers integrating their archives with iconik and existing customers ramping up their usage.
An interesting find in their study was the difference between audio and video asset growth. Iconik is now managing 328 years of video (up 41% YoY) and 208 years of audio (up 50% YoY).

Over the last year, the growth of audio assets managed by Backlight iconik has surged, surpassing that of video, with a staggering 1,700 hours being added daily. They believe this surge is closely tied to the remarkable expansion of both the podcasting and audiobook markets in recent years. The global podcast market ballooned to $17.9 billion in 2023 and is forecasted to soar to $144 billion by 2032. Similarly, the audiobook market is projected to hit $35 billion by 2030, with expected revenue of $35.05 billion in the same year. While audio files are smaller than video files by far, it’s reasonable to anticipate a continued upward trajectory for audio assets across the media and entertainment landscape.
According to Backlight iconik’s 2024 Media Stats Report, the trend toward cloud storage is definitely on the rise as the increased competition in the market and move away from hyperscalers drive more reasonable pricing. Companies are opting to transition to the cloud at their own speed, and hybrid cloud setups give them the freedom to shift assets as needed to improve things like performance, ease of access, security, and meeting regulatory requirements.
The reasons so many media professionals are moving to cloud are relatively simple: Cloud workflows enable enhanced collaboration and flexibility, greater cost predictability, and heightened security and management capabilities. And often, all of the above is possible at a lower total cost than legacy solutions.
Pairing Backlight iconik and Backblaze provides a simple solution for users to manage, collaborate, and store media projects easily. By integrating with iconik, Backblaze boosts workflow effectiveness, delivering a strong cloud-based MAM system that allows thorough management of Backblaze B2 Cloud Storage data right from a web browser.
When Goalcast, the empowering media company, decided to dive into making their own content, they realized their current setup just wasn’t cutting it. With their team spread out all over the place, they needed an easy way to get footage, access videos from anywhere, and keep a stash of finished files ready to jazz up for YouTube, Facebook, Instagram, Snapchat, TikTok, and the Goalcast OTT app.
Goalcast combined LucidLink’s cloud-based workflows, iconik’s media asset manager and uploader features, and Backblaze B2 Cloud Storage. The integration between iconik, LucidLink, and Backblaze creates a slick media workflow. The content crew uploads raw footage straight into iconik, tossing in key details. Original files zip into Goalcast’s Backblaze B2 Bucket automatically, while edited versions are up for grabs via LucidLink. After the editing magic, final assets kick back into Backblaze B2.
The integration and partnership means endless possibilities for Goalcast. They’re saving around 150 hours a month in grunt work and stress. Now, they don’t have to fret about where footage hides or how to snag it—it’s all securely stored in Backblaze, ready for anyone on the team to grab, no matter where they’re working from.
You can get lost in the weeds of tech companies and storage solutions. It can hurt your brain. The sweet spot is these three—iconik, LucidLink, and Backblaze—and how they work together.
—Dan Schiffmacher, Production Operations Manager, Goalcast
Looking at Backlight iconik’s numbers and forecasts from a 25,000 foot vantage point makes one thing painfully clear: Effective media management and storage are going to be absolutely crucial for media teams to succeed in the future landscape of production. Dive deeper into how Backblaze and Backlight iconik can support you now and down the road, ensuring seamless media management, and affordable storage, that creates easy, stress-free expansion as your data continues to grow.
Already have iconik and want to get started with Backblaze? Click here.
The post Managing the Media Tidal Wave: Backlight iconik’s 2024 Media Report appeared first on Backblaze Blog | Cloud Storage & Cloud Backup.
