Cost considerations and common options for AWS Network Firewall log management

Post Syndicated from Sharon Li original https://aws.amazon.com/blogs/security/cost-considerations-and-common-options-for-aws-network-firewall-log-management/

When you’re designing a security strategy for your organization, firewalls provide the first line of defense against threats. Amazon Web Services (AWS) offers AWS Network Firewall, a stateful, managed network firewall that includes intrusion detection and prevention (IDP) for your Amazon Virtual Private Cloud (VPC).

Logging plays a vital role in any firewall policy, as emphasized by the National Institute of Standards and Technology (NIST) Guidelines on Firewalls and Firewall Policy. Logging enables organizations to take proactive measures to help prevent and recover from failures, maintain proper firewall security configurations, and gather insights for effectively responding to security incidents.

Determining the optimal logging approach for your organization should be approached on a case-by-case basis. It involves striking a balance between your security and compliance requirements and the costs associated with implementing solutions to meet those requirements.

This blog post walks you through logging configuration best practices, discusses three common architectural patterns for Network Firewall logging, and provides guidelines for optimizing the cost of your logging solution. This information will help you make a more informed choice for your organization’s use case.

Stateless and stateful rules engines logging

When discussing Network Firewall best practices, it’s essential to understand the distinction between stateful and stateless rules. Note that stateless rules don’t support firewall logging, which can make them difficult to work with in use cases that depend on logs.

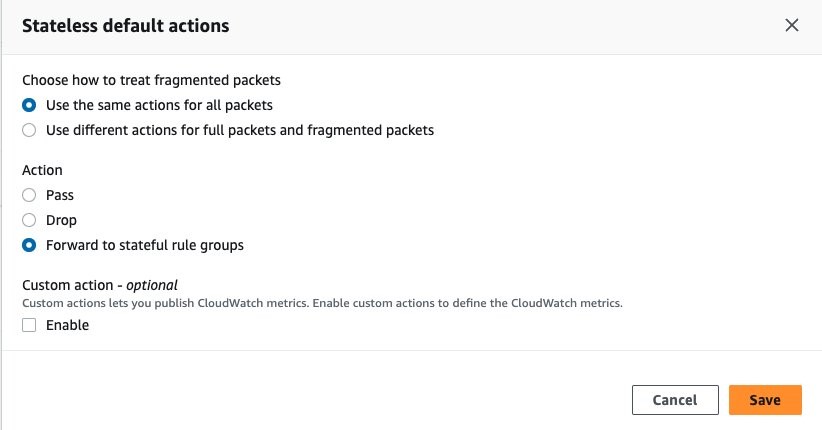
To verify that traffic is forwarded to the stateful inspection engine that generates logs, you can add a custom-defined stateless rule group that covers the traffic you need to monitor, or you can set a default action for stateless traffic to be forwarded to stateful rule groups in the firewall policy, as shown in the following figure.

Figure 1: Set up stateless default actions to forward to stateful rule groups

Figure 1: Set up stateless default actions to forward to stateful rule groups

Alert logs and flow logs

Network Firewall provides two types of logs:

  • Alert — Sends logs for traffic that matches a stateful rule whose action is set to Alert or Drop.
  • Flow — Sends logs for network traffic that the stateless engine forwards to the stateful rules engine.

To grasp the use cases of alert and flow logs, let’s begin by understanding what a flow is from the view of the firewall. For the network firewall, network flow is a one-way series of packets that share essential IP header information. It’s important to note that the Network Firewall flow log differs from the VPC flow log, as it captures the network flow from the firewall’s perspective and it is summarized in JSON format.

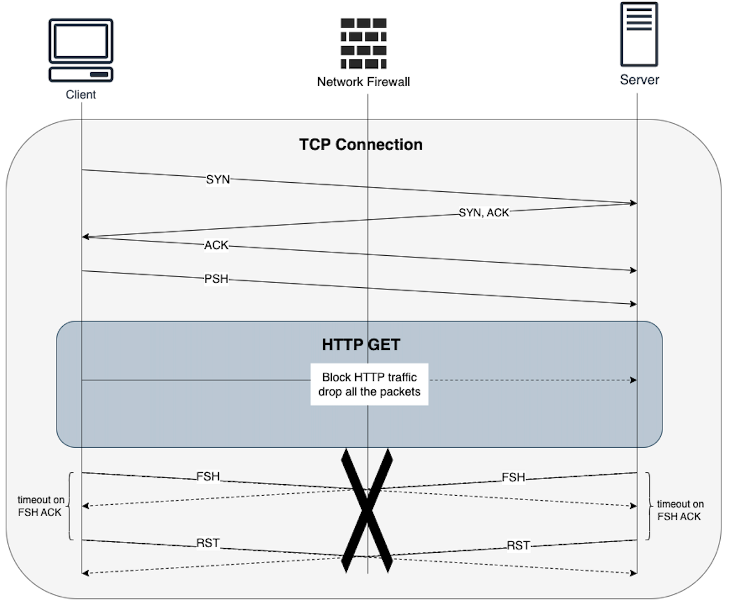
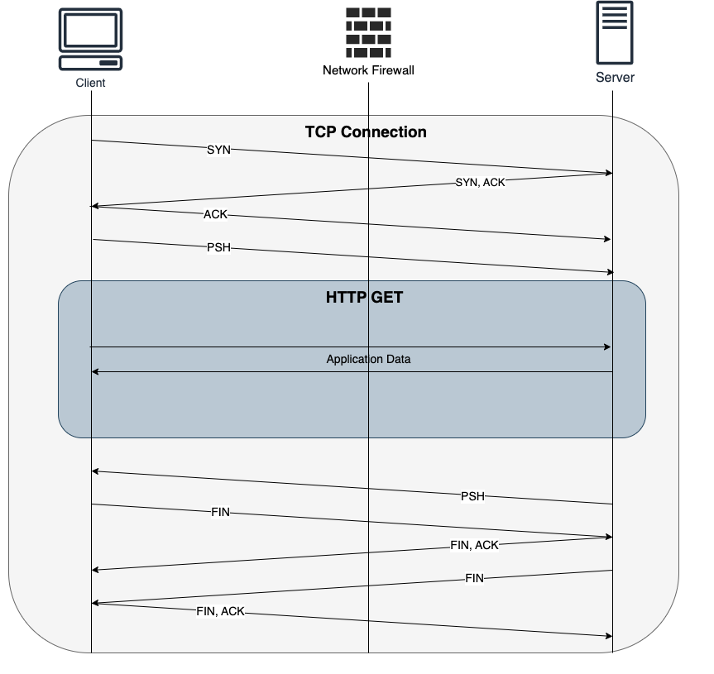
For example, the following sequence shows how an HTTP request passes through the Network Firewall.

Figure 2: HTTP request passes through Network Firewall

Figure 2: HTTP request passes through Network Firewall

When you’re using a stateful rule to block egress HTTP traffic, the TCP connection will be established initially. When an HTTP request comes in, it will be evaluated by the stateful rule. Depending on the rule’s action, the firewall may send a TCP reset to the sender when a Reject action is configured, or it may drop the packets to block them if a Drop action is configured. In the case of a Drop action, shown in Figure 3, the Network Firewall decides not to forward the packets at the HTTP layer, and the closure of the connection is determined by the TCP timers on both the client and server sides.

Figure 3: HTTP request blocked by Network Firewall

Figure 3: HTTP request blocked by Network Firewall

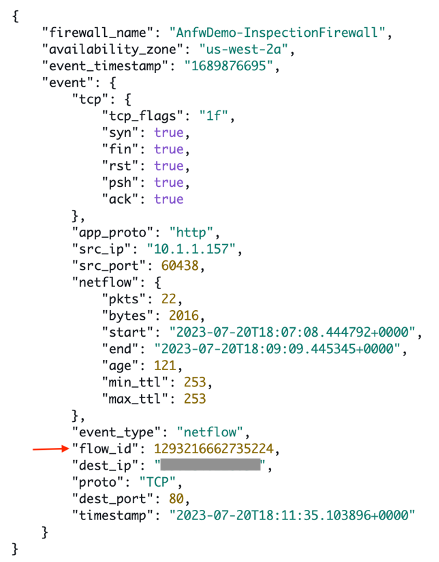
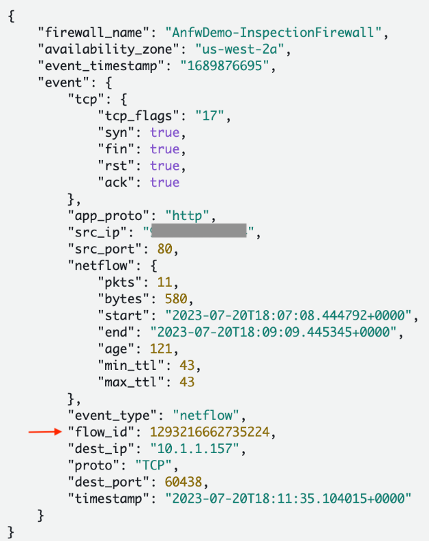
In the given example, the Network Firewall generates a flow log that provides information like IP addresses, port numbers, protocols, timestamps, number of packets, and bytes of the traffic. However, it doesn’t include details about the stateful inspection, such as whether the traffic was blocked or allowed.

Figure 4 shows the inbound flow log.

Figure 4: Inbound flow log

Figure 4: Inbound flow log

Figure 5 shows the outbound flow log.

Figure 5: Outbound flow log

Figure 5: Outbound flow log

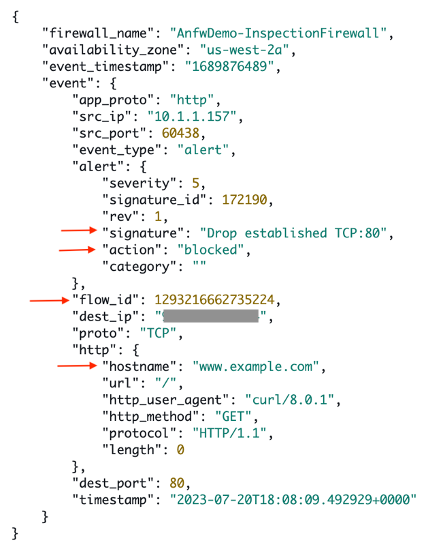
The alert log entry complements the flow log by containing stateful inspection details. The entry includes information about whether the traffic was allowed or blocked and also provides the hostname associated with the traffic. This additional information enhances the understanding of network activities and security events, as shown in Figure 6.

Figure 6: Alert log

Figure 6: Alert log

In summary, flow logs provide stateless information and are valuable for identifying trends, like monitoring IP addresses that transmit the most data over time in your network. On the other hand, alert logs contain stateful inspection details, making them helpful for troubleshooting and threat hunting purposes.

Keep in mind that flow logs can become excessive. When you’re forwarding traffic to a stateful inspection engine, flow logs capture the network flows crossing your Network Firewall endpoints. Because log volume affects overall costs, it’s essential to choose the log type that suits your use case and security needs. If you don’t need flow logs for traffic flow trends, consider only enabling alert logs to help reduce expenses.

Effective logging with alert rules

When you write stateful rules using the Suricata format, set the alert rule to be evaluated before the pass rule to log allowed traffic. Be aware that:

  • You must enable strict rule evaluation order to allow the alert rule to be evaluated before the pass rule. Otherwise the order of evaluation by default is pass rules first, then drop, then alert. The engine stops processing rules when it finds a match.
  • When you use pass rules, it’s recommended to add a message to remind anyone looking at the policy that these rules do not generate messages. This will help when developing and troubleshooting your rules.

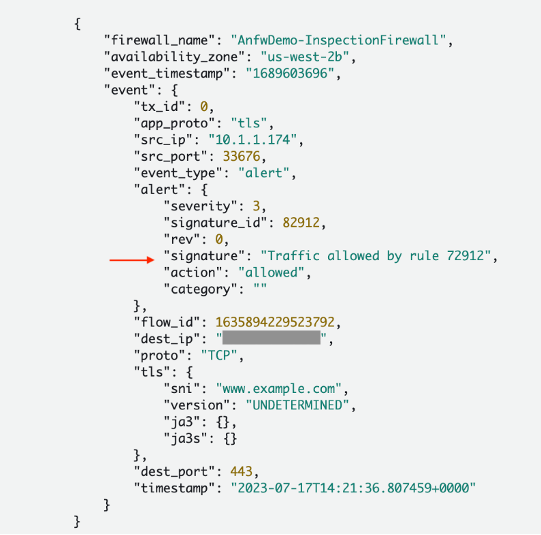
For example, the rules below will allow traffic to a target with a specific Server Name Indication (SNI) and log the traffic that was allowed. As you can see in the pass rule, it includes a message to remind the firewall policy maker that pass rules don’t alert. The alert rule evaluated before the pass rule logs a message to tell the log viewer which rule allows the traffic. This way you can see allowed domains in the logs.


alert tls $HOME_NET any -> $EXTERNAL_NET any (tls.sni; content:"www.example.com"; nocase; startswith; endswith; msg:"Traffic allowed by rule 72912"; flow:to_server, established; sid:82912;)
pass tls $HOME_NET any -> $EXTERNAL_NET any (tls.sni; content:"www.example.com"; nocase; startswith; endswith; msg:"Pass rules don't alert"; flow:to_server, established; sid:72912;)

This way you can see allowed domains in the alert logs.

Figure 7: Allowed domain in the alert log

Figure 7: Allowed domain in the alert log

Log destination considerations

Network Firewall supports the following log destinations:

You can select the destination that best fits your organization’s processes. In the next sections, we review the most common pattern for each log destination and walk you through the cost considerations, assuming a scenario in which you generate 15 TB Network Firewall logs in us-east-1 Region per month.

Amazon S3

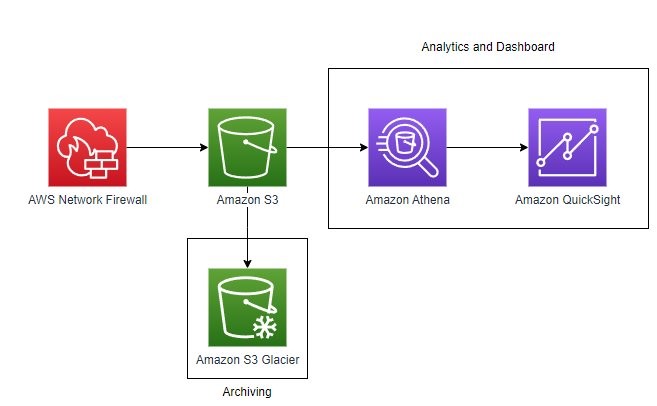
Network Firewall is configured to inspect traffic and send logs to an S3 bucket in JSON format using Amazon CloudWatch vended logs, which are logs published by AWS services on behalf of the customer. Optionally, logs in the S3 bucket can then be queried using Amazon Athena for monitoring and analysis purposes. You can also create Amazon QuickSight dashboards with an Athena-based dataset to provide additional insight into traffic patterns and trends, as shown in Figure 8.

Figure 8: Architecture diagram showing AWS Network Firewall logs going to S3

Figure 8: Architecture diagram showing AWS Network Firewall logs going to S3

Cost considerations

Note that Network Firewall logging charges for the pattern above are the combined charges for CloudWatch Logs vended log delivery to the S3 buckets and for using Amazon S3.

CloudWatch vended log pricing can influence overall costs significantly in this pattern, depending on the amount of logs generated by Network Firewall, so it’s recommended that your team be aware of the charges described in Amazon CloudWatch Pricing – Amazon Web Services (AWS). From the CloudWatch pricing page, navigate to Paid Tier, choose the Logs tab, select your Region and then under Vended Logs, see the information for Delivery to S3.

For Amazon S3, go to Amazon S3 Simple Storage Service Pricing – Amazon Web Services, choose the Storage & requests tab, and view the information for your Region in the Requests & data retrievals section. Costs will be dependent on storage tiers and usage patterns and the number of PUT requests to S3.

In our example, 15 TB is converted and compressed to approximately 380 GB in the S3 bucket. The total monthly cost in the us-east-1 Region is approximately $3800.

Long-term storage

There are additional features in Amazon S3 to help you save on storage costs:

Analytics and reporting

Athena and QuickSight can be used for analytics and reporting:

  • Athena can perform SQL queries directly against data in the S3 bucket where Network Firewall logs are stored. In the Athena query editor, a single query can be run to set up the table that points to the Network Firewall logging bucket.
  • After data is available in Athena, you can use Athena as a data source for QuickSight dashboards. You can use QuickSight to visualize data from your Network Firewall logs, taking advantage of AWS serverless services.
  • Please note that using Athena to scan firewall data in S3 might increase costs, as can the number of authors, users, reports, alerts, and SPICE data used in QuickSight.

Amazon CloudWatch Logs

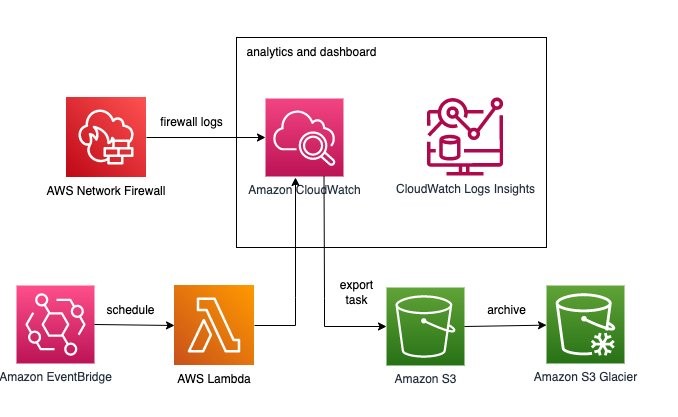
In this pattern, shown in Figure 9, Network Firewall is configured to send logs to Amazon CloudWatch as a destination. Once the logs are available in CloudWatch, CloudWatch Log Insights can be used to search, analyze, and visualize your logs to generate alerts, notifications, and alarms based on specific log query patterns.

Figure 9: Architecture diagram using CloudWatch for Network Firewall Logs

Figure 9: Architecture diagram using CloudWatch for Network Firewall Logs

Cost considerations

Configuring Network Firewall to send logs to CloudWatch incurs charges based on the number of metrics configured, metrics collection frequency, the number of API requests, and the log size. See Amazon CloudWatch Pricing for additional details.

In our example of 15 TB logs, this pattern in the us-east-1 Region results in approximately $6900.

CloudWatch dashboards offers a mechanism to create customized views of the metrics and alarms for your Network Firewall logs. These dashboards incur an additional charge of $3 per month for each dashboard.

Contributor Insights and CloudWatch alarms are additional ways that you can monitor logs for a pre-defined query pattern and take necessary corrective actions if needed. Contributor Insights are charged per Contributor Insights rule. To learn more, go to the Amazon CloudWatch Pricing page, and under Paid Tier, choose the Contributor Insights tab. CloudWatch alarms are charged based on the number of metric alarms configured and the number of CloudWatch Insights queries analyzed. To learn more, navigate to the CloudWatch pricing page and navigate to the Metrics Insights tab.

Long-term storage

CloudWatch offers the flexibility to retain logs from 1 day up to 10 years. The default behavior is never expire, but you should consider your use case and costs before deciding on the optimal log retention period. For cost optimization, the recommendation is to move logs that need to be preserved long-term or for compliance from CloudWatch to Amazon S3. Additional cost optimization can be achieved through S3 tiering. To learn more, see Managing your storage lifecycle in the S3 User Guide.

AWS Lambda with Amazon EventBridge, as shown in the following sample code, can be used to create an export task to send logs from CloudWatch to Amazon S3 based on an event rule, pattern matching rule, or scheduled time intervals for long-term storage and other use cases.

import boto3
import os
import datetime


GROUP_NAME = "/AnfwDemo/Anfw/Alert"
DESTINATION_BUCKET = "cwexportlogs-blog"
PREFIX = "network-logs"
NDAYS = 1
nDays = int(NDAYS)

currentTime = datetime.datetime.now()
StartDate = currentTime - datetime.timedelta(days=nDays)
EndDate = currentTime - datetime.timedelta(days=nDays - 1)


fromDate = int(StartDate.timestamp() * 1000)
toDate = int(EndDate.timestamp() * 1000)

BUCKET_PREFIX = os.path.join(PREFIX, StartDate.strftime('%Y{0}%m{0}%d').format(os.path.sep))

def lambda_handler(event, context):
    client = boto3.client('logs')
    response = client.create_export_task(
         logGroupName=GROUP_NAME,
         fromTime=fromDate,
         to=toDate,
         destination=DESTINATION_BUCKET,
         destinationPrefix=BUCKET_PREFIX
        )
    print(response)

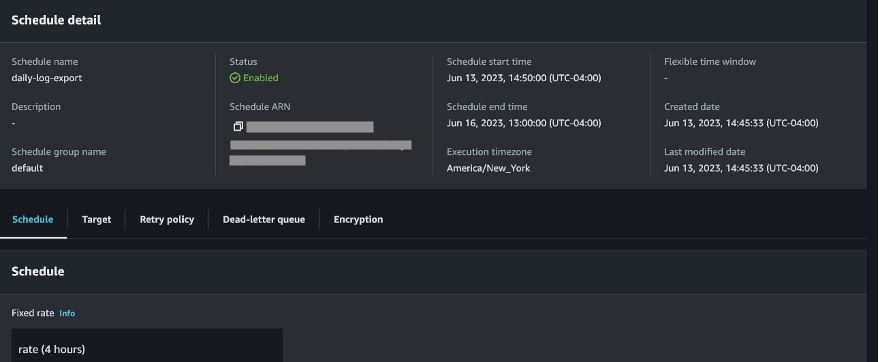
Figure 10 shows how EventBridge is configured to trigger the Lambda function periodically.

Figure 10: EventBridge scheduler for daily export of CloudWatch logs

Figure 10: EventBridge scheduler for daily export of CloudWatch logs

Analytics and reporting

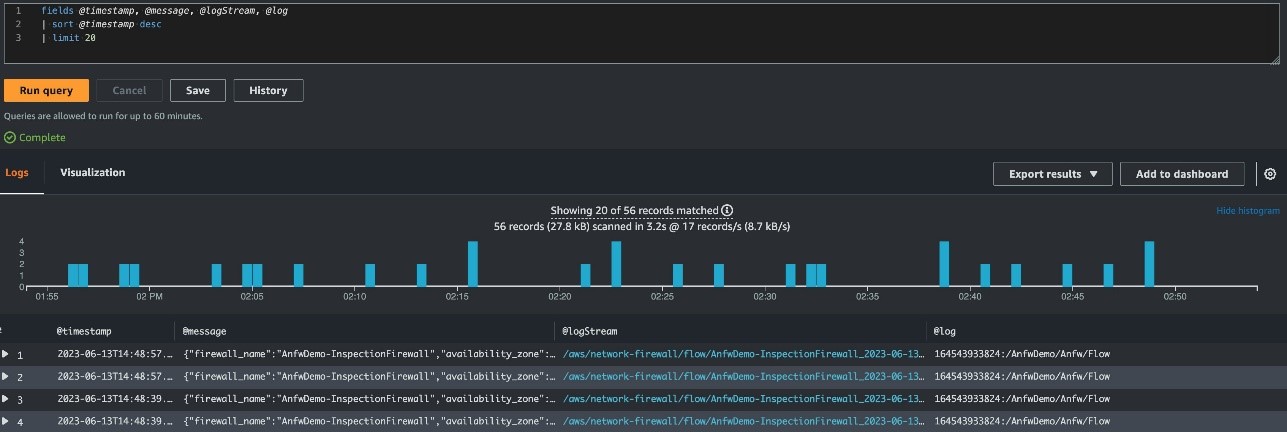
CloudWatch Insights offers a rich query language that you can use to perform complex searches and aggregations on your Network Firewall log data stored in log groups as shown in Figure 11.

The query results can be exported to CloudWatch dashboard for visualization and operational decision making. This will help you quickly identify patterns, anomalies, and trends in the log data to create the alarms for proactive monitoring and corrective actions.

Figure 11: Network Firewall logs ingested into CloudWatch and analyzed through CloudWatch Logs Insights

Figure 11: Network Firewall logs ingested into CloudWatch and analyzed through CloudWatch Logs Insights

Amazon Kinesis Data Firehose

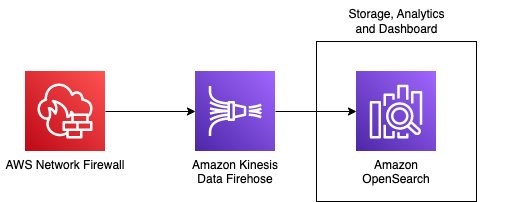
For this destination option, Network Firewall sends logs to Amazon Kinesis Data Firehose. From there, you can choose the destination for your logs, including Amazon S3, Amazon Redshift, Amazon OpenSearch Service, and an HTTP endpoint that’s owned by you or your third-party service providers. The most common approach for this option is to deliver logs to OpenSearch, where you can index log data, visualize, and analyze using dashboards as shown in Figure 12.

In the blog post How to analyze AWS Network Firewall logs using Amazon OpenSearch Service, you learn how to build network analytics and visualizations using OpenSearch in detail. Here, we discuss only some cost considerations of using this pattern.

Figure 12: Architecture diagram showing AWS Network Firewall logs going to OpenSearch

Figure 12: Architecture diagram showing AWS Network Firewall logs going to OpenSearch

Cost considerations

The charge when using Kinesis Data Firehose as a log destination is for CloudWatch Logs vended log delivery. Ingestion pricing is tiered and billed per GB ingested in 5 KB increments. See Amazon Kinesis Data Firehose Pricing under Vended Logs as source. There are no additional Kinesis Data Firehose charges for delivery unless optional features are used.

For 15 TB of log data, the cost of CloudWatch delivery and Kinesis Data Firehose ingestion is approximately $5400 monthly in the us-east-1 Region.

The cost for Amazon OpenSearch Service is based on three dimensions:

  • Instance hours, which are the number of hours that an instance is available to you for use
  • The amount of storage you request
  • The amount of data transferred in and out of OpenSearch Service

Storage pricing depends on the storage tier and type of instance that you choose. See pricing examples of using OpenSearch Service. When creating your OpenSearch domain, see Sizing Amazon OpenSearch Service domains to help you right-size your OpenSearch domain. Other cost optimization best practices include choosing the right storage tier and using AWS Graviton2 instances to improve performance.

For instance, allocating approximately 15 TB of UltraWarm storage in the us-east-1 Region will result in a monthly cost of $4700. Keep in mind that in addition to storage costs, you should also account for compute instances and hot storage.

In short, the estimated total cost for log ingestion and storage in the us-east-1 Region for this pattern is at least $10,100.

Leveraging OpenSearch will enable you to promptly investigate, detect, analyze, and respond to security threats.

Summary

The following table shows a summary of the expenses and advantages of each solution. Since storing logs is a fundamental aspect of log management, we use the monthly cost of using Amazon S3 as the log delivery destination as our baseline when making these comparisons.

Pattern Log delivery and storage cost as a multiple of the baseline cost Functionalities Dependencies
Amazon S3, Athena, QuickSight 1 The most economical option for log analysis. The solution requires security engineers to have a good analytics skillset. Familiarity with Athena query and query running time will impact the incident response time and the cost.
Amazon CloudWatch 1.8 Log analysis, dashboards, and reporting can be implemented from the CloudWatch console. No additional service is needed. The solution requires security engineers to be comfortable with CloudWatch Logs Insights query syntax. The CloudWatch Logs Insights query will impact the incident response time and the cost.
Amazon Kinesis Data Firehose, OpenSearch 2.7+ Investigate, detect, analyze, and respond to security threats quickly with OpenSearch. The solution requires you to invest in managing the OpenSearch cluster.

You have the flexibility to select distinct solutions for flow logs and alert logs based on your requirements. For flow logs, opting for Amazon S3 as the destination offers a cost-effective approach. On the other hand, for alert logs, using the Kinesis Data Firehose and OpenSearch solution allows for quick incident response. Minimizing the time required to address ongoing security challenges can translate to reduced business risk at different costs.

Conclusion

This blog post has explored various patterns for Network Firewall log management, highlighting the cost considerations associated with each approach. While cost is a crucial factor in designing an efficient log management solution, it’s important to consider other factors such as real-time requirements, solution complexity, and ownership. Ultimately, the key is to adopt a log management pattern that aligns with your operational needs and budgetary constraints. Network security is an iterative practice, and by optimizing your log management strategy, you can enhance your overall security posture while effectively managing costs.

For more information about working with Network Firewall, see What is AWS Network Firewall?

 
If you have feedback about this post, submit comments in the Comments section below. If you have questions about this post, contact AWS Support.

Want more AWS Security news? Follow us on Twitter.

Sharon Li

Sharon Li

Sharon is an Enterprise Solutions Architect at Amazon Web Services based in Boston, with a passion for designing and building secure workloads on AWS. Prior to her current role at AWS, Sharon worked as a software development engineer at Amazon, where she played a key role in bringing security into the development process.

Larry Tewksbury

Larry Tewksbury

Larry is an AWS Technical Account Manager based in New Hampshire. He works with enterprise customers in the Northeast to understand, scale, and optimize their cloud operations. Outside of work, he enjoys spending time with his family, hiking, and tech-based hobbies.

Shashidhar Makkapati

Shashidhar Makkapati

Shashidhar is an Enterprise Solutions Architect at Amazon Web Services, based in Charlotte, NC. With over two decades of experience as an enterprise architect, he has a keen focus on cloud adoption and digital transformation in the financial services industry. Shashidhar supports enterprise customers in the US Northeast. In his free time, he enjoys reading, traveling, and spending time with his family.

AWS Weekly Roundup – Amazon MWAA, EMR Studio, Generative AI, and More – August 14, 2023

Post Syndicated from Antje Barth original https://aws.amazon.com/blogs/aws/aws-weekly-roundup-amazon-mwaa-emr-studio-generative-ai-and-more-august-14-2023/

While I enjoyed a few days off in California to get a dose of vitamin sea, a lot has happened in the AWS universe. Let’s take a look together!

Last Week’s Launches
Here are some launches that got my attention:

Amazon MWAA now supports Apache Airflow version 2.6 – Amazon Managed Workflows for Apache Airflow (Amazon MWAA) is a managed orchestration service for Apache Airflow that you can use to set up and operate end-to-end data pipelines in the cloud. Apache Airflow version 2.6 introduces important security updates and bug fixes that enhance the security and reliability of your workflows. If you’re currently running Apache Airflow version 2.x, you can now seamlessly upgrade to version 2.6.3. Check out this AWS Big Data Blog post to learn more.

Amazon EMR Studio adds support for AWS Lake Formation fine-grained access control – Amazon EMR Studio is a web-based integrated development environment (IDE) for fully managed Jupyter notebooks that run on Amazon EMR clusters. When you connect to EMR clusters from EMR Studio workspaces, you can now choose the AWS Identity and Access Management (IAM) role that you want to connect with. Apache Spark interactive notebooks will access only the data and resources permitted by policies attached to this runtime IAM role. When data is accessed from data lakes managed with AWS Lake Formation, you can enforce table and column-level access using policies attached to this runtime role. For more details, have a look at the Amazon EMR documentation.

AWS Security Hub launches 12 new security controls – AWS Security Hub is a cloud security posture management (CSPM) service that performs security best practice checks, aggregates alerts, and enables automated remediation. With the newly released controls, Security Hub now supports three additional AWS services: Amazon Athena, Amazon DocumentDB (with MongoDB compatibility), and Amazon Neptune. Security Hub has also added an additional control against Amazon Relational Database Service (Amazon RDS). AWS Security Hub now offers 276 controls. You can find more information in the AWS Security Hub documentation.

Additional AWS services available in the AWS Israel (Tel Aviv) Region – The AWS Israel (Tel Aviv) Region opened on August 1, 2023. This past week, AWS Service Catalog, Amazon SageMaker, Amazon EFS, and Amazon Kinesis Data Analytics were added to the list of available services in the Israel (Tel Aviv) Region. Check the AWS Regional Services List for the most up-to-date availability information.

For a full list of AWS announcements, be sure to keep an eye on the What’s New at AWS page.

Other AWS News
Here are some additional blog posts and news items that you might find interesting:

AWS recognized as a Leader in 2023 Gartner Magic Quadrant for Contact Center as a Service with Amazon Connect – AWS was named a Leader for the first time since Amazon Connect, our flexible, AI-powered cloud contact center, was launched in 2017. Read the full story here. 

Generate creative advertising using generative AI –  This AWS Machine Learning Blog post shows how to generate captivating and innovative advertisements at scale using generative AI. It discusses the technique of inpainting and how to seamlessly create image backgrounds, visually stunning and engaging content, and reducing unwanted image artifacts.

AWS open-source news and updates – My colleague Ricardo writes this weekly open-source newsletter in which he highlights new open-source projects, tools, and demos from the AWS Community.

Upcoming AWS Events
Check your calendars and sign up for these AWS events:

Build On AWS - Generative AIBuild On Generative AI – Your favorite weekly Twitch show about all things generative AI is back for season 2 today! Every Monday, 9:00 US PT, my colleagues Emily and Darko look at new technical and scientific patterns on AWS, inviting guest speakers to demo their work and show us how they built something new to improve the state of generative AI.

In today’s episode, Emily and Darko discussed the latest models LlaMa-2 and Falcon, and explored them in retrieval-augmented generation design patterns. You can watch the video here. Check out show notes and the full list of episodes on community.aws.

AWS NLP Conference 2023 – Join this in-person event on September 13–14 in London to hear about the latest trends, ground-breaking research, and innovative applications that leverage natural language processing (NLP) capabilities on AWS. This year, the conference will primarily focus on large language models (LLMs), as they form the backbone of many generative AI applications and use cases. Register here.

AWS Global Summits – The 2023 AWS Summits season is almost coming to an end with the last two in-person events in Mexico City (August 30) and Johannesburg (September 26).

AWS Community Days – Join a community-led conference run by AWS user group leaders in your region: West Africa (August 19), Taiwan (August 26), Aotearoa (September 6), Lebanon (September 9), and Munich (September 14).

AWS re:Invent 2023AWS re:Invent (November 27 – December 1) – Join us to hear the latest from AWS, learn from experts, and connect with the global cloud community. Registration is now open.

You can browse all upcoming in-person and virtual events.

That’s all for this week. Check back next Monday for another Weekly Roundup!

— Antje

P.S. We’re focused on improving our content to provide a better customer experience, and we need your feedback to do so. Take this quick survey to share insights on your experience with the AWS Blog. Note that this survey is hosted by an external company, so the link doesn’t lead to our website. AWS handles your information as described in the AWS Privacy Notice.

The art and science of data product portfolio management

Post Syndicated from Faris Haddad original https://aws.amazon.com/blogs/big-data/the-art-and-science-of-data-product-portfolio-management/

This post is the first in a series dedicated to the art and science of practical data mesh implementation (for an overview of data mesh, read the original whitepaper The data mesh shift). The series attempts to bridge the gap between the tenets of data mesh and its real-life implementation by deep-diving into the functional and non-functional capabilities essential to a working operating model, laying out the decisions that need to be made for each capability, and describing the key business and technical processes required to implement them. Taken together, the posts in this series lay out some possible operating models for data mesh within an organization.

Kudzu

Kudzu—or kuzu (クズ)—is native to Japan and southeast China. First introduced to the southeastern United States in 1876 as a promising solution for erosion control, it now represents a cautionary tale about unintended consequences, as Kudzu’s speed of growth outcompetes everything from native grasses to tree systems by growing over and shading them from the sunlight they need to photosynthesize—eventually leading to species extinction and loss of biodiversity. The story of Kudzu offers a powerful analogy to the dangers and consequences of implementing data mesh architectures without fully understanding or appreciating how they are intended to be used. When the “Kudzu” of unmanaged pseudo-data products (methods of sharing data that masquerade as data products while failing to fulfill the myriad obligations associated with them) has overwhelmed the local ecosystem of true data products, eradication is costly and prone to failure, and can represent significant wasted effort and resources, as well as lost time.

Desert

While Kudzu was taking over the south in the 1930s, desertification caused by extensive deforestation was overwhelming the Midwest, with large tracts of land becoming barren and residents forced to leave and find other places to make a living. In the same way, overly restrictive data governance practices that either prevent data products from taking root at all, or pare them back too aggressively (deforestation), can over time create “data deserts” that drive both the producers and consumers of data within an organization to look elsewhere for their data needs. At the same time, unstructured approaches to data mesh management that don’t have a vision for what types of products should exist and how to ensure they are developed are at high risk of creating the same effect through simple neglect. This is due to a  common misconception about data mesh as a data strategy, which is that it is effectively self-organizing—meaning that once presented with the opportunity, data owners within the organization will spring to the responsibilities and obligations associated with publishing high-quality data products. In reality, the work of a data producer is often thankless, and without clear incentive strategies, organizations may end up with data deserts that create more data governance issues as producers and consumers go elsewhere to seek out the data they need to perform work.

Bonsai

Bonsai (盆栽) is an art form originating from an ancient Chinese tradition called penjing (盆景), and later shaped by the minimalist teachings of Zen Buddhism into the practice we know and recognize today. The patient practice of Bonsai offers useful analogies to the concepts and processes required to avoid the chaos of Kudzu as well as the specter of organizational data deserts. Bonsai artists carefully observe the naturally occurring buds that are produced by the tree and encourage those that add to the overall aesthetics of the tree, while pruning those that don’t work well with their neighbors. The same ideas apply equally well to data products within a data mesh—by encouraging the growth and adoption of those data products that add value to our data mesh, and continuously pruning those that do not, we maximize the value and sustainability of our data mesh implementations. In a similar vein, Bonsai artists must balance their vision for the shape of the tree with a respect for the natural characteristics and innate structure of the species they have chosen to work with—to ignore the biology of the tree would be disastrous to the longevity of the tree, as well as to the quality of the art itself. In the same way, organizations seeking to implement successful data mesh strategies must respect the nature and structure (legal, political, commercial, technology) of their organizations in their implementation.

Of the key capabilities proposed for the implementation of a sustainable data mesh operating model, the one that is most relevant to the problems we’ve described—and explore later in this post—is data product portfolio management.

Overview of data product portfolio management

Data mesh architectures are, by their nature, ideal for implementation within federated organizations, with decentralized ownership of data and clear legal, regulatory, or commercial boundaries between entities or lines of business. The same organizational characteristics that make data mesh architectures valuable, however, also put them at risk of turning into one of the twin nightmares of Kudzu or data deserts.

To define the shape and nature of an organizational data mesh, a number of key questions need to be answered, including but not limited to:

  • What are the key data domains within the organization? What are the key data products within these domains needed to solve current business problems? How do we iterate on this discovery process to add value while we are mapping our domains?
  • Who are the consumers in our organization, and what logical, regulatory, physical, or commercial boundaries might separate them from producers and their data products?
  • How do we encourage the development and maintenance of key data products in a decentralized organization?
  • How do we monitor data products against their SLAs, and ensure alerting and escalation on failure so that the organization is protected from bad data?
  • How do we enable those we see as being autonomous producers and consumers with the right skills, the right tools, and the right mindset to actually want to (and be able to) take more ownership of independently publishing data as a product and consuming it responsibly?
  • What is the lifecycle of a data product? When do new data products get created, and who is allowed to create them? When are data products deprecated, and who is accountable for the consequences to their consumers?
  • How do we define “risk” and “value” in the context of data products, and how can we measure this? Whose responsibility is it to justify the existence of a given data product?

To answer questions such as these and plan accordingly, organizations must implement data product portfolio management (DPPM). DPPM does not exist in a vacuum—by its nature, DPPM is closely related to and interdependent with enterprise architecture practices like business capability management and project portfolio management. DPPM itself may therefore also be considered, in part, an enterprise architecture practice.

As an enterprise architecture practice, DPPM is responsible for its implementation, which should reside within a function whose remit is appropriately global and cross-functional. This may be within the CDO office for those organizations that have a CDO or equivalent central data function, or the enterprise architecture team in organizations that do not.

Goals of DPPM

The goals of DPPM can be summarized as follows:

  • Protect value – DPPM protects the value of the organizational data strategy by developing, implementing, and enforcing frameworks to measure the contribution of data products to organizational goals in objective terms. Examples may include associated revenue, savings, or reductions in operational losses. Earlier in their lifecycle, data products may be measured by alternative metrics, including adoption (number of consumers) and level of activity (releases, interaction with consumers, and so on). In the pursuit of this goal, the DPPM capability is accountable for engaging with the business to continuously priorities where data as a product can add value and align delivery priority accordingly. Strategies for measuring value and prioritizing data products are explored later in this post.
  • Manage risk – All data products introduce risk to the organization—risk of wasted money and effort through non-adoption, risk of operational loss associated with improper use, and risk of failure on the part of the data product to meet requirements on availability, completeness, or quality. These risks are exacerbated in the case of proliferation of low-quality or unsupervised data products. DPPM seeks to understand and measure these risks on an individual and aggregated basis. This is a particularly challenging goal because what constitutes risk associated with the existence of a particular data product is determined largely by its consumers and is likely to change over time (though like entropy, is only ever likely to increase).
  • Guide evolution – The final goal of DPPM is to guide the evolution of the data product landscape to meet overarching organizational data goals, such as mutually exclusive or collectively exhaustive domains and data products, the identification and enablement of single-threaded ownership of product definitions, or the agile inclusion of new sources of data and creation of products to serve tactical or strategic business goals. Some principles for the management of data mesh evolution, and the evaluation of data products against organizational goals, are explored later in this post.

Challenges of DPPM

In this section, we explore some of the challenges of DPPM, and the pragmatic ways some of these challenges could be addressed.

Infancy

Data mesh as a concept is still relatively new. As such, there is little standardization associated with practical operating models for building and managing data mesh architectures, and no access to fully fledged out-of-the-box reference operating models, frameworks, or tools to support the practice of DPPM.

Some elements of DPPM are supported in disparate tools (for example, some data catalogs include basic community features that contribute to measuring value), but not in a holistic way. Over time, standardization of the processes associated with DPPM will likely occur as a side-effect of commoditization, driven by the popularity and adoption of new services that take on and automate more of the undifferentiated heavy lifting associated with mesh supervision. In the meantime, however, organizations adopting data mesh architectures are left largely to their own devices around how to operate them effectively.

Resistance

The purest expression of democracy is anarchy, and the more federated an organization is (itself a supporting factor in choosing data mesh architectures), the more resistance may be observed to any forms of centralized governance. This is a challenge for DPPM, because in some way it must come together in one place. Just as the Bonsai artist knows the vision for the entire tree, there must be a cohesive vision for and ability to guide the evolution of a data mesh, no matter how broadly federated and autonomous individual domains or data products might be.

Balancing this with the need to respect the natural shape (and culture) of an organization, however, requires organizations that implement DPPM to think about how to do so in a way that doesn’t conflict with the reality of the organization. This might mean, for example, that DPPM may need to happen at several layers—at minimum within data domains, possibly within lines of business, and then at an enterprise level through appropriate data committees, guilds, or other structures that bring stakeholders together. All of this complicates the processes and collaboration needed to perform DPPM effectively.

Maturity

Data mesh architectures, and therefore DPPM, presume relatively high levels of data maturity within an organization—a clear data strategy, understanding of data ownership and stewardship, principles and policies that govern the use of data, and a moderate-to-high level of education and training around data within the organization. A lack of data maturity within the organization, or a weak or immature enterprise architecture function, will face significant hurdles in the implementation of any data mesh architecture, let alone a strong and useful DPPM practice.

In reality, however, data maturity is not uniform across organizations. Even in seemingly low-maturity organizations, there are often teams who are more mature and have a higher appetite to engage. By leaning into these teams and showing value through them first, then using them as evangelists, organizations can gain maturity while benefitting earlier from the advantages of data mesh strategies.

The following sections explore the implementation of DPPM along the lines of people, process, and technology, as well as describing the key characteristics of data products—scope, value, risk, uniqueness, and fitness—and how they relate to data mesh practices.

People

To implement DPPM effectively, a wide variety of stakeholders in the organization may need to be involved in one capacity or another. The following table suggests some key roles, but it’s up to an individual organization to determine how and if these map to their own roles and functions.

Function RACI Role Responsibility
Senior Leadership A Chief Data Officer Ultimately accountable for organizational data strategy and implementation. Approves changes to DPPM principles and operating model. Acts as chair of, and appoints members to, the data council.
. R Data Council** Stakeholder body representing organizational governance around data strategy. Acts as steering body for the governance of DPPM as a practice (KPI monitoring, maturity assessments, auditing, and so on). Approves changes to guidelines and methodologies. Approves changes to data product portfolio (discussed later in this post). Approves and governs centrally funded and prioritized data product development activities.
Enterprise Architecture AR Head of Enterprise Architecture Responsible for development and enforcement of data strategy. Accountable and responsible for the design and implementation of DPPM as an organizational capability.
. R Domain Architect Responsible for the implementing screening, data product analysis, periodic evaluation, and optimal portfolio selection practices. Responsible for the development of methodologies and their selection criteria.
Legal & Compliance C Legal & Compliance Officer Consults on permissibility of data products with reference to local regulation. Consults on permissibility of data sharing with reference to local regulation or commercial agreements.
. C Data Privacy Officer Consults on permissibility of data use with reference to local data privacy law. Consults on permissibility of cross-entity or border data sharing with reference to data privacy law.
Information Security RC Information Security Officer Consults on maturity assessments (discussed later in this post) for information security-relevant data product capabilities. Approves changes to data product technology architecture. Approves changes to IAM procedures relating to data products.
Business Functions A Data Domain Owner Ultimately accountable for the appropriate use of domain data, as well as its quality and availability. Accountable for domain data products. Approves changes to the domain data model and domain data product portfolio.
c R Data Domain Steward Responsible for implementing data domain responsibilities, including operational (day-to-day) governance of domain data products. Approves use of domain data in new data products, and performs regular (such as yearly) attestation of data products using domain data.
. A Data Owner Ultimately accountable for the appropriate use of owned data (for example, CRM data), as well as its quality and availability.
. R Data Steward Responsible for implementing data responsibilities. Approves use of owned data in new data products, and performs regular (such as yearly) attestation of data products using owned data.
. AR Data Product Owner Accountable and responsible for the design, development, and delivery of data products against their stated SLOs. Contributes to data product analysis and portfolio adjustment practices for own data products.

** The data council typically consists of permanent representatives from each function (data domain owners), enterprise architecture, and the chief data officer or equivalent.

Process

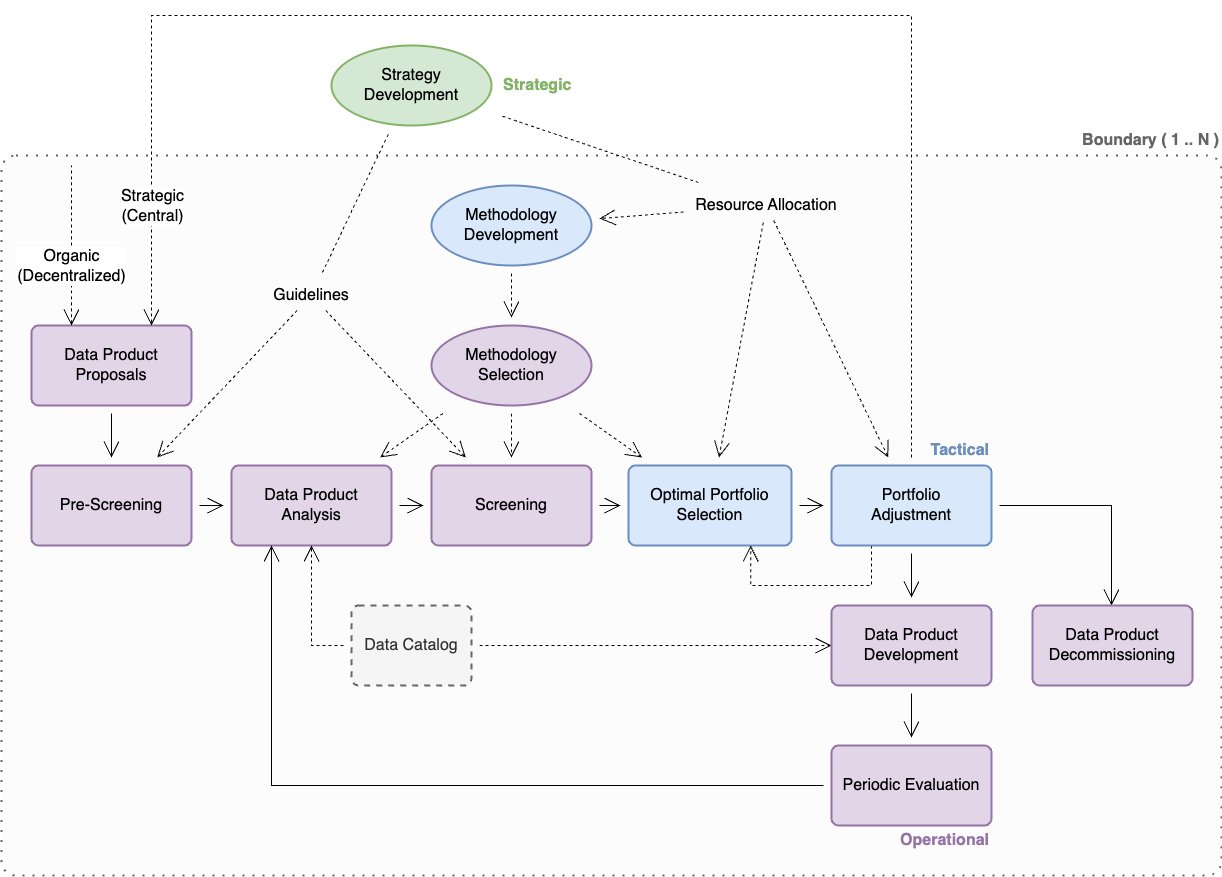
The following diagram illustrates the strategic, tactical, and operational practices associated with DPPM. Some considerations for the implementation of these practices is explored in more detail in this post, though their specific interpretation and implementation is dependent on the individual organization.

Boundaries

When reading this section, it’s important to bear in mind the impact of boundaries—although strategy development may be established as a global practice, other practices within DPPM must respect relevant organizational boundaries (which may be physical, geographical, operational, legal, commercial, or regulatory in nature). In some cases, the existence of boundaries may require some or all tactical and operational practices to be duplicated within each associated boundary. For example, an insurance company with a property and casualty legal entity in North America and a life entity in Germany may need to implement DPPM separately within each entity.

Strategy development

This practice deals with answering questions associated with the overall data mesh strategy, including the following:

  • The overall scope (data domains, participating entities, and so on) of the data mesh
  • The degree of freedom of participating entities in their definition and implementation of the data mesh (for example, a mesh of meshes vs. a single mesh)
  • The distribution of responsibilities for activities and capabilities associated with the data mesh (degree of democratization)
  • The definition and documentation of key performance indicators (KPIs) against which the data mesh should be governed (such as risk and value)
  • The governance operating model (including this practice)

Key deliverables include the following:

  • Organizational guidelines for operational processes around pre-screening and screening of data products
  • Well-defined KPIs that guide methodology development and selection for practices like data product analysis, screening, and optimal portfolio selection
  • Allocation of organizational resources (people, budget, time) to the implementation of tactical processes around methodology development, optimal portfolio selection, and portfolio adjustment

Key considerations

In this section, we discuss some key considerations for strategy development.

Data mesh structure

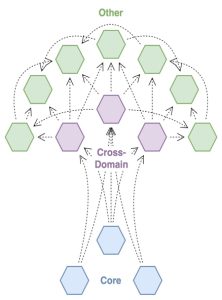
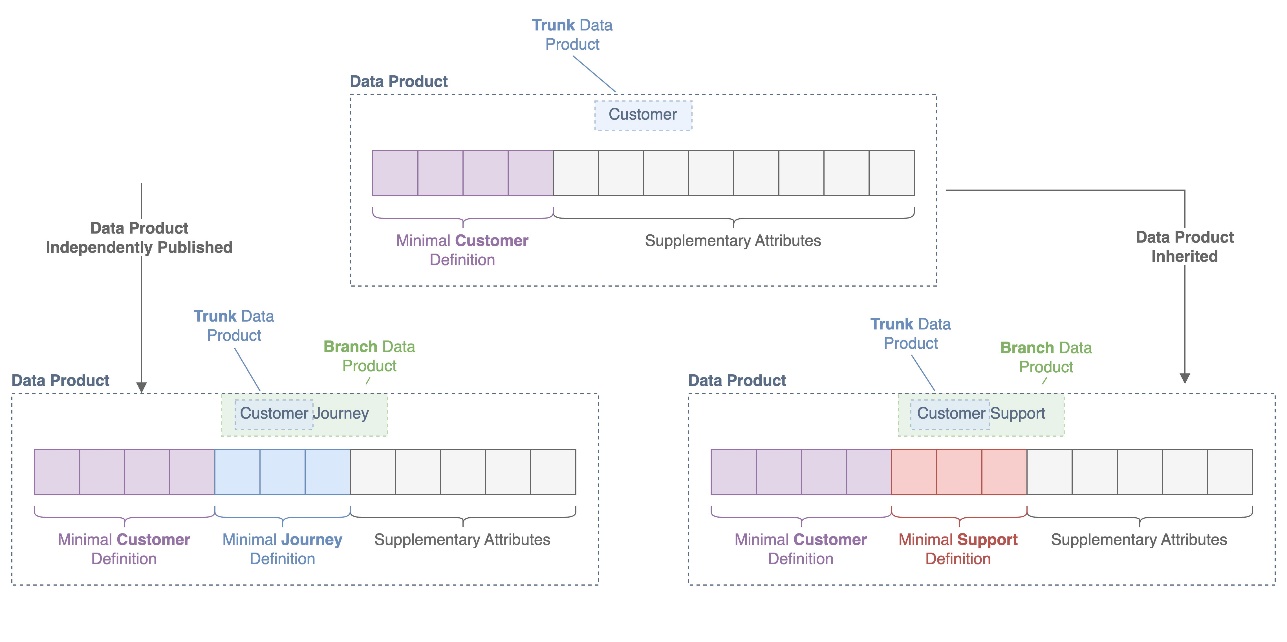
This diagram illustrates the analogous relationship between data products in a data mesh, and the structure of the mesh itself.

The following considerations relate to screening, data product analysis, and optimal portfolio selection.

  • Trunk (core data products) – Core data products are those that are central to the organization’s ability to function, and from which the majority of other data products are derived. These may be data products consumed in the implementation of key business activities, or associated with critical processes such as regulatory reporting and risk management. Organizational governance for these data products typically favors availability and data accuracy over agility.
  • Branch (cross-domain data products) – Cross-domain data products represent the most common cross-domain use cases for data (for example, joining customer data with product data). These data products may be widely used across business functions to support reporting and analytics, and—to a lesser extent—operational processes. Because these data products may consume a variety of sources, organizational governance may favor a balanced view on agility vs. reliability, accepting some degree of risk in return for being able to adapt to changes in data sources. Data product versioning can offer mitigation of risks associated with change.
  • Leaf (everything else) – These are the myriad data products that may arise within a data mesh, either as permanent additions to support individual teams and use cases or as temporary data products to fill data gaps or support time-limited initiatives. Because the number of these data products may be high and risks are typically limited to a single process or a small part of the organization, organizational governance typically favors a light touch and may prefer to govern through guidelines and best practices, rather than through active participation in the data product lifecycle.

Data products vs. data definitions

The following figure illustrates how data definitions are defined and inherited throughout the lineage of data products.

In a data mesh architecture, data products may inherit data from each other (one data product consumes another in its data pipeline) or independently publish data within (or related to) the same domain. For example, a customer data product may be inherited by a customer support data product, while another the customer journey data product may directly publish customer-relevant data from independent sources. When no standards are applied to how domain data attributes are used and published, data products even within the same data domain may lose interoperability because it becomes difficult or impossible to join them together for reporting or analytics purposes.

To prevent this, it can be useful to distinguish between data products and data definitions. Typically, organizations will select a single-threaded owner (often a data owner or steward, or a domain data owner or steward) who is responsible for defining minimal data definitions for common and reusable data entities within data domains. For example, a data owner responsible for the sales and marketing data domain may identify a customer data product as a reusable data entity within the domain and publish a minimal data definition that all producers of customer-relevant data must incorporate within their data products, to ensure that all data products associated with customer data are interoperable.

DPPM can assist in the identification and production of data definitions as part of its data product analysis activities, as well as enforce their incorporation as part of oversight of data product development.

Service management thinking

These considerations relate to data product analysis, periodic evaluation, and methodology selection.

Data products are services provided to the organization or externally to customers and partners. As such, it may make sense to adapt a service management framework like ITIL, in combination with the ITIL Maturity Model, for use in evaluating the fitness of data products for their scope and audience, as well as in describing the roles, processes, and acceptable technologies that should form the operating model for any data product.

At the operational level, the stakeholders required to implement each practice may change depending on the scope of the data product. For example, the release management practice for a core data product may require involvement of the data council, whereas the same practice for a team data product may only involve the team or functional head. To avoid creating decision-making bottlenecks, organizations should aim to minimize the number of stakeholders in each case and focus on single-threaded owners wherever possible.

The following table proposes a subset of capabilities and how they might be applied to data products of different scopes. Suggested target maturity levels, between 1 and 5, are included for each scope. (1= Initial, 5= Optimizing)

Target Maturity Data Product Scope.
4 – 5 3 – 4 2 – 3 2
Capability    Core
  Cross-Domain
  Function / Team
  Personal
Information Security Management X X X X
Knowledge Management X X X .
Release Management X X X .
Service-Level Management X X X .
Measurement and Reporting X X . .
Availability Management X X . .
Capacity and Performance Management X X . .
Incident Management X X . .
Monitoring and Event Management X X . .
Service Validation and Testing X X . .

Methodology development

This practice deals with the development of concrete, objective frameworks, metrics, and processes for the measurement of data product value and risk. Because the driving factors behind risk and value are not necessarily the same between products, it may be necessary to develop several methodologies or variants thereof.

Key deliverables include the following:

  • Well-defined frameworks for measuring risk and value of data products, as well as for determining the optimal portfolio of data products
  • Operationally feasible, measurable metrics associated with value and risk

Key considerations

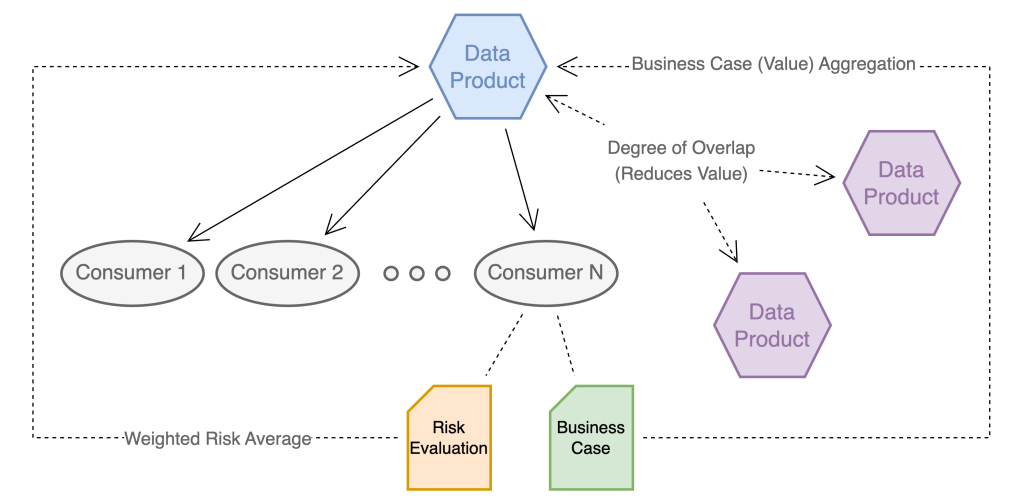
A key consideration for assessing data products is that of consumer value or risk vs. uniqueness. The following diagram illustrates how value and risk of a data product are driven by its consumers.

Data products don’t inherently present risk or add value, but rather indirectly pose—in an aggregated fashion—the risk and value created by their consumers.

In a consumer-centric value and risk model, governance of consumers ensures that all data use meets the following requirements:

  • Is associated with a business case justifying the use of data (for example, new business, cost reduction through business process automation, and so on)
  • Is regularly evaluated with reference to the risk associated with the use case (for example, regulatory reporting

The value and risk associated with the linked data products are then calculated as an aggregation. Where organizations already track use cases associated with data, either as part of data privacy governance or as a by-product of the access approval process, these existing systems and databases can be reused or extended.

Conversely, where data products overlap with each other, their value to the organization is reduced accordingly, because redundancies between data products represent an inefficient use of resources and increase organizational complexity associated with data quality management.

To ensure that the model is operationally feasible (see the key deliverables of methodology development), it may be sufficient to consider simple aggregations, rather than attempting to calculate value and risk attribution at a product or use case level.

Optimal portfolio selection

This practice deals with the determination of which combination of data products (existing, new, or potential) would best meet the organization’s current and known future needs. This practice takes input from data product analysis and data product proposals, as well as other enterprise architecture practices (for example, business architecture), and considers trade-offs between data-debt and time-to-value, as well as other considerations such as redundancy between data products to determine the optimal mix of permanent and temporary data products at any given point in time.

Because the number of data products in an organization may become significant over time, it may be useful to apply heuristics to the problem of optimal portfolio selection. For example, it may be sufficient to consider core and cross-domain data products (trunk and branches) during quarterly portfolio reviews, with other data products (leaves) audited on a yearly basis.

Key deliverables include the following:

  • A target state definition for the data mesh, including all relevant data products
  • An indication of organizational priorities for use by the portfolio adjustment practice

Key considerations

The following are key considerations regarding the data product half-life:

  • Long-term or strategic data products – These data products fill a long-term organizational need, are often associated with key source systems in various domains, and anchor the overall data strategy. Over time, as an organization’s data mesh matures, long-term data products should form the bulk of the mesh.
  • Time-bound data products – These data products fill a gap in data strategy and allow the organization to move on data opportunities until core data products can be updated. An example of this might be data products created and used in the context of mergers and acquisitions transactions and post-acquisition, to provide consistent data for reporting and business intelligence until mid-term and long-term application consolidation has taken place. Time-bound data products are considered as data-debt and should be managed accordingly.
  • Purpose-driven data products – These data products serve a narrow, finite purpose. Purpose-driven data products may or may not be time-bound, but are characterized primarily by a strict set of consumers known in advance. Examples of this might include:
    • Data products developed to support system-of-record harmonization between lines of business (for example, deduplication of customer records between insurance lines of business using separate CRM systems
    • Data products created explicitly for the monitoring of other data products (data quality, update frequency, and so on)

Portfolio adjustment

This practice implements the feasibility analysis, planning and project management, as well as communication and organizational change management activities associated with changes to the optimal portfolio. As part of this practice, a gap analysis is conducted between the current and target data product portfolio, and a set of required actions and estimated time and effort prepared for review by the organization. During such a period, data products may be marked for development (new data products to fill a need), changes, consolidation (merging two or more data products into a single data product), or deprecation. Several iterations of optimal portfolio selection and portfolio adjustment may be required to find an appropriate balance between optimality and feasibility of implementation.

Key deliverables include the following:

  • A gap analysis between the current and target data product portfolio, as well as proposed remediation activities
  • High-level project plans and effort or budget assessments associated with required changes, for approval by relevant stakeholders (such as the data council)

Data product proposals

This practice organizes the collection and prioritization of requests for new, or changes to existing, data products within the organization. Its implementation may be adapted from or managed by existing demand management processes within the organization.

Key deliverables include a registry of demand against new or existing data products, including metadata on source systems, attributes, known use cases, proposed data product owners, and suggested organizational priority.

Methodology selection

This practice is associated with the identification and application of the most appropriate methodologies (such as value and risk) during data product analysis, screening, and optimal portfolio selection. The selection of an appropriate methodology for the type, maturity, and scope of a data product (or an entire portfolio) is a key element in avoiding either a “Kudzu” mesh or a “data desert.”

Key deliverables include reusable selection criteria for mapping methodologies to data products during data product analysis, screening, and optimal portfolio selection.

Pre-screening

This optional practice is primarily a mechanism to avoid unnecessary time and effort in the comparatively expensive practice of data product analysis by offering simple self-service applications of guidelines to the evaluation of data products. An example might include the automated approval of data products that fall under the classification of personal data products, requiring only attestation on the part of the requester that they will uphold the relevant portions of the guideline that governs such data products.

Key deliverables include tools and checklists for the self-service evaluation of data products against guidelines and automated registration of approved data products.

Data product analysis

This practice incorporates guidelines, methodologies, as well as (where available) metadata relating to data products (performance against SLOs, service management metrics, degree of overlap with other data products) to establish an understanding of the value and risk associated with individual data products, as well as gaps between current and target capability maturities, and compliance with published product definitions and standards.

Key deliverables include a summary of findings for a particular data product, including scores for relevant value, risk, and maturity metrics, as well as operational gaps requiring remediation and recommendations on next steps (repair, enhance, decommission, and so on).

Screening

This optional practice is a mechanism to reduce complexity in optimal portfolio selection by ensuring the early removal of data products from consideration that fail to meet value or risk targets, or have been identified as redundant to other data products already available in the organization.

Key deliverables include a list of data products that should be slated for removal (direct-to-decommissioning).

Data product development

This practice is not performed directly under DPPM, but is managed in part by the portfolio adjustment practice, and may be governed by standards that are developed as part of DPPM. In the context of DPPM, this practice is primarily associated with ensuring that data products are developed according to the specifications agreed as part of portfolio adjustment.

Key deliverables include project management and software or service development deliverables and artefacts.

Data product decommissioning

This practice manages the decommissioning of data products and the migration of affected consumers to new or other data products where relevant. Unmanaged decommissioning of data products, especially those with many downstream consumers, can threaten the stability of the entire data mesh, as well as have significant consequences to business functions.

Key deliverables include a decommissioning plan, including stakeholder assessment and sign-off, timelines, migration plans for affected consumers, and back-out strategies.

Periodic evaluation

This practice manages the calendar and implementation of periodic reviews of the data mesh, both in its entirety as well as at the data product level, and is primarily an exercise in project management.

Key deliverables include the following:

  • yearly review calendar, published and made available to all data product owners and affected stakeholders
  • Project management deliverables and artefacts, including evidence of evaluations having been performed against each data product

Technology

Although most practices within DPPM don’t rely heavily on technology and automation, some key supporting applications and services are required to implement DPPM effectively:

  • Data catalog – Core to the delivery of DPPM is the organizational data catalog. Beyond providing transparency into what data products exist within an organization, a data catalog can provide key insights into data lineage between data products (key to the implementation of portfolio adjustment) and adoption of data products by the organization. The data catalog can also be used to capture and make available both the documented as well as the realized SLO for any given data product, and—through the use of a business glossary—assist in the identification of redundancy between data products.
  • Service management – Service management solutions (such as ServiceNOW) used in the context of data product management offer important insights into the fitness of data products by capturing and tracking incidents, problems, requests, and other metrics against data products.
  • Demand management – A demand management solution supports self-service implementation and automation of data product proposal and pre-screening activities, as well as prioritization activities associated with selection and development of data products.

Conclusion

Although this post focused on implementing DPPM in the context of a data mesh, this capability—like data product thinking—is not exclusive to data mesh architectures. The practices outlined here can be practiced at any scale to ensure that the production and use of data within the organization is always in line with its current and future needs, that governance is implemented in a consistent way, and that the organization can have Bonsai, not Kudzu.

For more information about data mesh and data management, refer to the following:

In upcoming posts, we will cover other aspects of data mesh operating models, including data mesh supervision and service management models for data product owners.


About the Authors


Maximilian Mayrhofer
is a Principal Solutions Architect working in the AWS Financial Services EMEA Go-to-Market team. He has over 12 years experience in digital transformation within private banking and asset management. In his free time, he is an avid reader of science fiction and enjoys bouldering.


Faris Haddad
is the Data & Insights Lead in the AABG Strategic Pursuits team. He helps enterprises successfully become data-driven.
Amazon Pinpoint 10DLC Campaign Types and Quotas for SMS

Post Syndicated from Tyler Holmes original https://aws.amazon.com/blogs/messaging-and-targeting/amazon-pinpoint-10dlc-campaign-types-and-quotas-for-sms/

The following 10DLC Campaigns, or, Use Cases outlined in Table 2 are currently supported by Amazon Pinpoint. As part of the process to register for sending SMS to US based phone numbers you must select at least one Campaign that will be associated with the 10DLC number you procure. If you require more than one Use Case then you will need more than one 10DLC, or you can select the standard mixed use case which supports lower volumes of messages. Throughput is determined based on the company vetting score of the registered sender of the message and what is being sent, not on the amount of numbers associated with the Campaign. For a breakdown of vetting scores and quotas see below:

Throughput and Volume Quotas for 10DLC Vetted Companies

*Note that by default each number associated to a 10DLC campaign supports 1 MPS. In order to increase your numbers to match what your campaign qualifies for by carriers you will be required to submit a MPS increase request.

Table 1

Vetting Score Message Parts per Second (MPS) (AT&T Limits) Maximum daily messages (T-Mobile & Sprint)
High(75-100) 75 200,000
Medium-High(50-74) 40 40,000
Medium-Low(1-49) 4 10,000
Basic(0, Skipped Vetting) 0.2 2,000

Standard 10DLC Campaign Use Cases

Select the campaign that most closely aligns with your use case(s).

Table 2

Campaign/Use-Case Name Intended Use Cases
Account Notifications Status notifications about an account that the recipient is a part of or owns
Customer Care Communications related to support or account management
Delivery Notifications Notifications about the status of a delivery of a product or service
Fraud Alert Messaging Notifications related to potential fraudulent activity
Higher Education Messaging Messaging originating from colleges, universities, or other post-secondary education institutions
Low Volume Small throughput, any combination of use-cases. Examples include: test, demo accounts
Marketing Messaging Promotional content related to sales or other offers
Mixed Use Cases Covers multiple use cases such as Account Notifications and Delivery Notifications. Mixed campaigns have lower throughput than dedicated ones
Polling and Voting – Not for Political Use Delivering messages containing customer surveys or other voting related actions. Not for political use
Public Service Announcements (PSA) Messages intended to raise awareness of a particular topic
Security Alerts Notifications related to a compromised software or hardware system that requires recipients to take an action
Two Factor Authentication(2FA) or One-Time Password(OTP) Authentication, account verifications, or one-time passcode
Special Use Cases Currently Pinpoint supports only the following special use cases. These may require different registration processes and/or fees than the Standard Use Cases above
Charity / 501(c)(3) Nonprofit Communications from a registered company classified as a 501(c)(3). Does not include religious organizations

How to use AWS Verified Access logs to write and troubleshoot access policies

Post Syndicated from Ankush Goyal original https://aws.amazon.com/blogs/security/how-to-use-aws-verified-access-logs-to-write-and-troubleshoot-access-policies/

On June 19, 2023, AWS Verified Access introduced improved logging functionality; Verified Access now logs more extensive user context information received from the trust providers. This improved logging feature simplifies administration and troubleshooting of application access policies while adhering to zero-trust principles.

In this blog post, we will show you how to manage the Verified Access logging configuration and how to use Verified Access logs to write and troubleshoot access policies faster. We provide an example showing the user context information that was logged before and after the improved logging functionality and how you can use that information to transform a high-level policy into a fine-grained policy.

Overview of AWS Verified Access

AWS Verified Access helps enterprises to provide secure access to their corporate applications without using a virtual private network (VPN). Using Verified Access, you can configure fine-grained access policies to help limit application access only to users who meet the specified security requirements (for example, user identity and device security status). These policies are written in Cedar, a new policy language developed and open-sourced by AWS.

Verified Access validates each request based on access policies that you set. You can use user context—such as user, group, and device risk score—from your existing third-party identity and device security services to define access policies. In addition, Verified Access provides you an option to log every access attempt to help you respond quickly to security incidents and audit requests. These logs also contain user context sent from your identity and device security services and can help you to match the expected outcomes with the actual outcomes of your policies. To capture these logs, you need to enable logging from the Verified Access console.

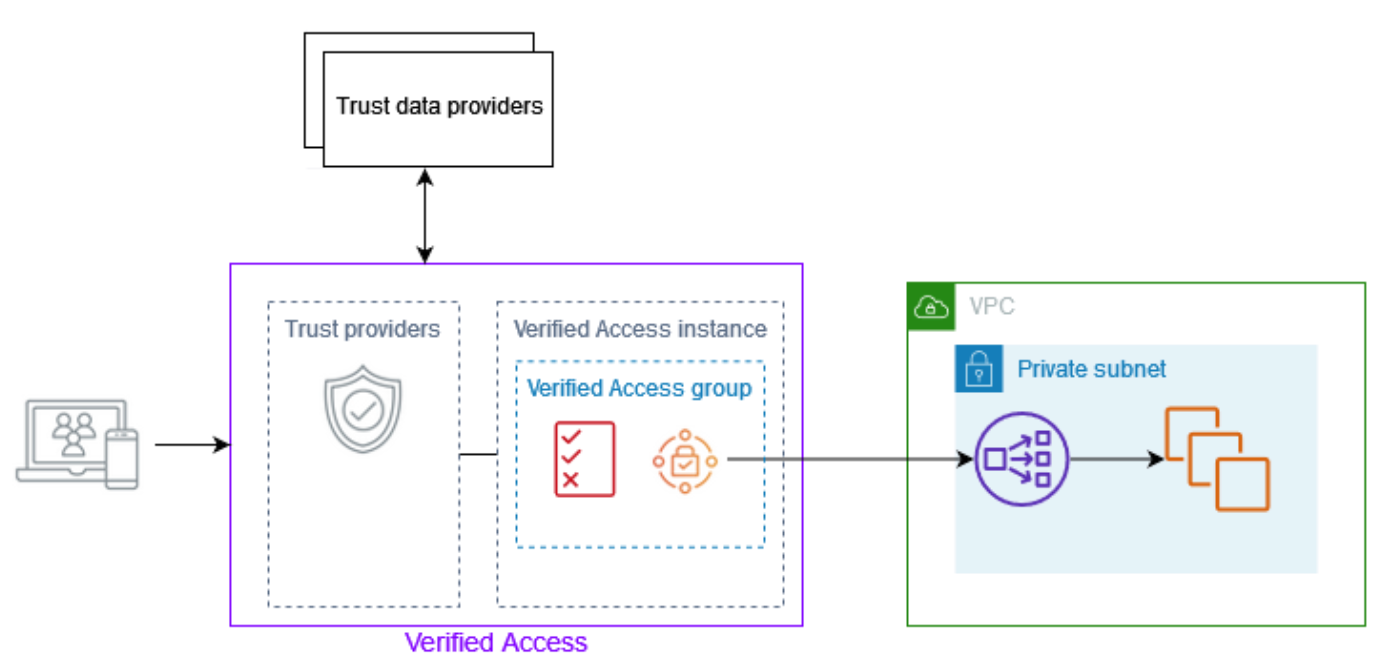
Figure 1: Overview of AWS Verified Access architecture showing Verified Access connected to an application

Figure 1: Overview of AWS Verified Access architecture showing Verified Access connected to an application

After a Verified Access administrator attaches a trust provider to a Verified Access instance, they can write policies using the user context information from the trust provider. This user context information is custom to an organization, and you need to gather it from different sources when writing or troubleshooting policies that require more extensive user context.

Now, with the improved logging functionality, the Verified Access logs record more extensive user context information from the trust providers. This eliminates the need to gather information from different sources. With the detailed context available in the logs, you have more information to help validate and troubleshoot your policies.

Let’s walk through an example of how this detailed context can help you improve your Verified Access policies. For this example, we set up a Verified Access instance using AWS IAM Identity Center (successor to AWS Single Sign-on) and CrowdStrike as trust providers. To learn more about how to set up a Verified Access instance, see Getting started with Verified Access. To learn how to integrate Verified Access with CrowdStrike, see Integrating AWS Verified Access with device trust providers.

Then we wrote the following simple policy, where users are allowed only if their email matches the corporate domain.

permit(principal,action,resource)
when {
    context.sso.user.email.address like "*@example.com"
};

Before improved logging, Verified Access logged basic information only, as shown in the following example log.

    "identity": {
        "authorizations": [
            {
                "decision": "Allow",
                "policy": {
                    "name": "inline"
                }
            }
        ],
        "idp": {
            "name": "user",
            "uid": "vatp-09bc4cbce2EXAMPLE"
        },
        "user": {
            "email_addr": "[email protected]",
            "name": "Test User Display",
            "uid": "[email protected]",
            "uuid": "00u6wj48lbxTAEXAMPLE"
        }
    }

Modify an existing Verified Access instance

To improve the preceding policy and make it more granular, you can include checks for various user and device details. For example, you can check if the user belongs to a particular group, has a verified email, should be logging in from a device with an OS that has an assessment score greater than 50, and has an overall device score greater than 15.

Modify the Verified Access instance logging configuration

You can modify the instance logging configuration of an existing Verified Access instance by using either the AWS Management Console or AWS Command Line Interface (AWS CLI).

  1. Open the Verified Access console and select Verified Access instances.
  2. Select the instance that you want to modify, and then, on the Verified Access instance logging configuration tab, select Modify Verified Access instance logging configuration.
    Figure 2: Modify Verified Access logging configuration

    Figure 2: Modify Verified Access logging configuration

  3. Under Update log version, select ocsf-1.0.0-rc.2, turn on Include trust context, and select where the logs should be delivered.
    Figure 3: Verified Access log version and trust context

    Figure 3: Verified Access log version and trust context

After you’ve completed the preceding steps, Verified Access will start logging more extensive user context information from the trust providers for every request that Verified Access receives. This context information can have sensitive information. To learn more about how to protect this sensitive information, see Protect Sensitive Data with Amazon CloudWatch Logs.

The following example log shows information received from the IAM Identity Center identity provider (IdP) and the device provider CrowdStrike.

"data": {
    "context": {
        "crowdstrike": {
            "assessment": {
                "overall": 21,
                "os": 53,
                "sensor_config": 4,
                "version": "3.6.1"
            },
            "cid": "7545bXXXXXXXXXXXXXXX93cf01a19b",
            "exp": 1692046783,
            "iat": 1690837183,
            "jwk_url": "https://assets-public.falcon.crowdstrike.com/zta/jwk.json",
            "platform": "Windows 11",
            "serial_number": "ec2dXXXXb-XXXX-XXXX-XXXX-XXXXXX059f05",
            "sub": "99c185e69XXXXXXXXXX4c34XXXXXX65a",
            "typ": "crowdstrike-zta+jwt"
        },
        "sso": {
            "user": {
                "user_id": "24a80468-XXXX-XXXX-XXXX-6db32c9f68fc",
                "user_name": "XXXX",
                "email": {
                    "address": "[email protected]",
                    "verified": false
                }
            },
            "groups": {
                "04c8d4d8-e0a1-XXXX-383543e07f11": {
                    "group_name": "XXXX"
                }
            }
        },
        "http_request": {
            "hostname": "sales.example.com",
            "http_method": "GET",
            "x_forwarded_for": "52.XX.XX.XXXX",
            "port": 80,
            "user_agent": "Mozilla/5.0 (Windows NT 10.0; Win64; x64; rv:109.0) Gecko/20100101 Firefox/115.0",
            "client_ip": "52.XX.XX.XXXX"
        }
    }
}

The following example log shows the user context information received from the OpenID Connect (OIDC) trust provider Okta. You can see the difference in the information provided by the two different trust providers: IAM Identity Center and Okta.

"data": {
    "context": {
        "http_request": {
            "hostname": "sales.example.com",
            "http_method": "GET",
            "x_forwarded_for": "99.X.XX.XXX",
            "port": 80,
            "user_agent": "Mozilla/5.0 (Macintosh; Intel Mac OS X 10_15_7) AppleWebKit/605.1.15 (KHTML, like Gecko) Version/16.5 Safari/605.1.15",
            "client_ip": "99.X.XX.XXX"
        },
        "okta": {
            "sub": "00uXXXXXXXJNbWyRI5d7",
            "name": "XXXXXX",
            "locale": "en_US",
            "preferred_username": "[email protected]",
            "given_name": "XXXX",
            "family_name": "XXXX",
            "zoneinfo": "America/Los_Angeles",
            "groups": [
                "Everyone",
                "Sales",
                "Finance",
                "HR"
            ],
            "exp": 1690835175,
            "iss": "https://example.okta.com"
        }
    }
}

The following is a sample policy written using the information received from the trust providers.

permit(principal,action,resource)
when {
  context.idcpolicy.groups has "<hr-group-id>" &&
  context.idcpolicy.user.email.address like "*@example.com" &&
  context.idcpolicy.user.email.verified == true &&
  context has "crdstrikepolicy" &&
  context.crdstrikepolicy.assessment.os > 50 &&
  context.crdstrikepolicy.assessment.overall > 15
};

This policy only grants access to users who belong to a particular group, have a verified email address, and have a corporate email domain. Also, users can only access the application from a device with an OS that has an assessment score greater than 50, and has an overall device score greater than 15.

Conclusion

In this post, you learned how to manage Verified Access logging configuration from the Verified Access console and how to use improved logging information to write AWS Verified Access policies. To get started with Verified Access, see the Amazon VPC console.

 
If you have feedback about this post, submit comments in the Comments section below. If you have questions about this post, contact AWS Support.

Want more AWS Security news? Follow us on Twitter.

Ankush Goyal

Ankush Goyal

Ankush is an Enterprise Support Lead in AWS Enterprise Support who helps Enterprise Support customers streamline their cloud operations on AWS. He enjoys working with customers to help them design, implement, and support cloud infrastructure. He is a results-driven IT professional with over 18 years of experience.

Anbu Kumar Krishnamurthy

Anbu Kumar Krishnamurthy

Anbu is a Technical Account Manager who specializes in helping clients integrate their business processes with the AWS Cloud to achieve operational excellence and efficient resource utilization. Anbu helps customers design and implement solutions, troubleshoot issues, and optimize their AWS environments. He works with customers to architect solutions aimed at achieving their desired business outcomes.

Nuta: Exploring the internals of Linux v0.01

Post Syndicated from corbet original https://lwn.net/Articles/941591/

For those who find the 6.x kernel intimidating, Seiya Nuta has written a look at the 0.01
kernel
, which reflects a simpler time.

By the way, there’s an interesting comment about the scheduler:

    *  'schedule()' is the scheduler function. This is GOOD CODE! There
    * probably won't be any reason to change this, as it should work well
    * in all circumstances (ie gives IO-bound processes good response etc).

Yes it’s indeed good code. Unfortunately (or fortunately), this
prophecy is false. Linux became one of most practical and
performant kernel which has introduced many new scheduling
improvements and algorithms over the years, like Completely Fair
Scheduler (CFS).

How SeatGeek uses AWS Serverless to control authorization, authentication, and rate-limiting in a multi-tenant SaaS application

Post Syndicated from Umesh Kalaspurkar original https://aws.amazon.com/blogs/architecture/how-seatgeek-uses-aws-to-control-authorization-authentication-and-rate-limiting-in-a-multi-tenant-saas-application/

SeatGeek is a ticketing platform for web and mobile users, offering ticket purchase and reselling for sports games, concerts, and theatrical productions. In 2022, SeatGeek had an average of 47 million daily tickets available, and their mobile app was downloaded 33+ million times.

Historically, SeatGeek used multiple identity and access tools internally. Applications were individually managing authorization, leading to increased overhead and a need for more standardization. SeatGeek sought to simplify the API provided to customers and partners by abstracting and standardizing the authorization layer. They were also looking to introduce centralized API rate-limiting to prevent noisy neighbor problems in their multi-tenant SaaS application.

In this blog, we will take you through SeatGeek’s journey and explore the solution architecture they’ve implemented. As of the publication of this post, many B2B customers have adopted this solution to query terabytes of business data.

Building multi-tenant SaaS environments

Multi-tenant SaaS environments allow highly performant and cost-efficient applications by sharing underlying resources across tenants. While this is a benefit, it is important to implement cross-tenant isolation practices to adhere to security, compliance, and performance objectives. With that, each tenant should only be able to access their authorized resources. Another consideration is the noisy neighbor problem that occurs when one of the tenants monopolizes excessive shared capacity, causing performance issues for other tenants.

Authentication, authorization, and rate-limiting are critical components of a secure and resilient multi-tenant environment. Without these mechanisms in place, there is a risk of unauthorized access, resource-hogging, and denial-of-service attacks, which can compromise the security and stability of the system. Validating access early in the workflow can help eliminate the need for individual applications to implement similar heavy-lifting validation techniques.

SeatGeek had several criteria for addressing these concerns:

  1. They wanted to use their existing Auth0 instance.
  2. SeatGeek did not want to introduce any additional infrastructure management overhead; plus, they preferred to use serverless services to “stitch” managed components together (with minimal effort) to implement their business requirements.
  3. They wanted this solution to scale as seamlessly as possible with demand and adoption increases; concurrently, SeatGeek did not want to pay for idle or over-provisioned resources.

Exploring the solution

The SeatGeek team used a combination of Amazon Web Services (AWS) serverless services to address the aforementioned criteria and achieve the desired business outcome. Amazon API Gateway was used to serve APIs at the entry point to SeatGeek’s cloud environment. API Gateway allowed SeatGeek to use a custom AWS Lambda authorizer for integration with Auth0 and defining throttling configurations for their tenants. Since all the services used in the solution are fully serverless, they do not require infrastructure management, are scaled up and down automatically on-demand, and provide pay-as-you-go pricing.

SeatGeek created a set of tiered usage plans in API Gateway (bronze, silver, and gold) to introduce rate-limiting. Each usage plan had a pre-defined request-per-second rate limit configuration. A unique API key was created by API Gateway for each tenant. Amazon DynamoDB was used to store the association of existing tenant IDs (managed by Auth0) to API keys (managed by API Gateway). This allowed us to keep API key management transparent to SeatGeek’s tenants.

Each new tenant goes through an onboarding workflow. This is an automated process managed with Terraform. During new tenant onboarding, SeatGeek creates a new tenant ID in Auth0, a new API key in API Gateway, and stores association between them in DynamoDB. Each API key is also associated with one of the usage plans.

Once onboarding completes, the new tenant can start invoking SeatGeek APIs (Figure 1).

SeatGeek's fully serverless architecture

Figure 1. SeatGeek’s fully serverless architecture

  1. Tenant authenticates with Auth0 using machine-to-machine authorization. Auth0 returns a JSON web token representing tenant authentication success. The token includes claims required for downstream authorization, such as tenant ID, expiration date, scopes, and signature.
  2. Tenant sends a request to the SeatGeak API. The request includes the token obtained in Step 1 and application-specific parameters, for example, retrieving the last 12 months of booking data.
  3. API Gateway extracts the token and passes it to Lambda authorizer.
  4. Lambda authorizer retrieves the token validation keys from Auth0. The keys are cached in the authorizer, so this happens only once for each authorizer launch environment. This allows token validation locally without calling Auth0 each time, reducing latency and preventing an excessive number of requests to Auth0.
  5. Lambda authorizer performs token validation, checking tokens’ structure, expiration date, signature, audience, and subject. In case validation succeeds, Lambda authorizer extracts the tenant ID from the token.
  6. Lambda authorizer uses tenant ID extracted in Step 5 to retrieve the associated API key from DynamoDB and return it back to API Gateway.
  7. The API Gateway uses API key to check if the client making this particular request is above the rate-limit threshold, based on the usage plan associated with API key. If the rate limit is exceeded, HTTP 429 (“Too Many Requests”) is returned to the client. Otherwise, the request will be forwarded to the backend for further processing.
  8. Optionally, the backend can perform additional application-specific token validations.

Architecture benefits

The architecture implemented by SeatGeek provides several benefits:

  • Centralized authorization: Using Auth0 with API Gateway and Lambda authorizer allows for standardization the API authentication and removes the burden of individual applications having to implement authorization.
  • Multiple levels of caching: Each Lambda authorizer launch environment caches token validation keys in memory to validate tokens locally. This reduces token validation time and helps to avoid excessive traffic to Auth0. In addition, API Gateway can be configured with up to 5 minutes of caching for Lambda authorizer response, so the same token will not be revalidated in that timespan. This reduces overall cost and load on Lambda authorizer and DynamoDB.
  • Noisy neighbor prevention: Usage plans and rate limits prevent any particular tenant from monopolizing the shared resources and causing a negative performance impact for other tenants.
  • Simple management and reduced total cost of ownership: Using AWS serverless services removed the infrastructure maintenance overhead and allowed SeatGeek to deliver business value faster. It also ensured they didn’t pay for over-provisioned capacity, and their environment could scale up and down automatically and on demand.

Conclusion

In this blog, we explored how SeatGeek used AWS serverless services, such as API Gateway, Lambda, and DynamoDB, to integrate with external identity provider Auth0, and implemented per-tenant rate limits with multi-tiered usage plans. Using AWS serverless services allowed SeatGeek to avoid undifferentiated heavy-lifting of infrastructure management and accelerate efforts to build a solution addressing business requirements.

[$] A new futex API

Post Syndicated from corbet original https://lwn.net/Articles/940944/

The Linux fast user-space mutex (“futex”) subsystem debuted with the 2.6.0
kernel; it provides a mechanism that can be used to implement user-space
locking. Since futexes avoid calling into the kernel whenever possible,
they can indeed be fast, especially in the uncontended case. The API used
to access futexes has never been seen as one of Linux’s strongest points,
though, so there has long been a desire to improve it. This patch
series
from Peter Zijlstra shows what the future of futexes may look
like.

Security updates for Monday

Post Syndicated from jake original https://lwn.net/Articles/941587/

Security updates have been issued by Debian (gst-plugins-ugly1.0, libreoffice, linux-5.10, netatalk, poppler, and sox), Fedora (chromium, ghostscript, java-1.8.0-openjdk-portable, java-11-openjdk, java-11-openjdk-portable, java-17-openjdk-portable, java-latest-openjdk-portable, kernel, linux-firmware, mingw-python-certifi, ntpsec, and php), Oracle (.NET 6.0, .NET 7.0, 15, 18, bind, bind9.16, buildah, cjose, curl, dbus, emacs, firefox, go-toolset and golang, go-toolset:ol8, grafana, iperf3, java-1.8.0-openjdk, java-11-openjdk, java-17-openjdk, kernel, libcap, libeconf, libssh, libtiff, libxml2, linux-firmware, mod_auth_openidc:2.3, nodejs, nodejs:16, nodejs:18, open-vm-tools, openssh, postgresql:12, postgresql:13, python-requests, python27:2.7, python3, python38:3.8 and python38-devel:3.8, python39:3.9 and python39-devel:3.9, ruby:2.7, samba, sqlite, systemd, thunderbird, virt:ol and virt-devel:rhel, and webkit2gtk3), SUSE (docker, java-1_8_0-openj9, kernel, kernel-firmware, libyajl, nodejs14, openssl-1_0_0, poppler, and webkit2gtk3), and Ubuntu (golang-yaml.v2, intel-microcode, linux, linux-aws, linux-aws-5.4, linux-gcp, linux-gcp-5.4, linux-gkeop,
linux-iot, linux-kvm, linux-oracle, linux-oracle-5.4, linux-raspi,
linux-raspi-5.4, linux, linux-aws, linux-azure, linux-gcp, linux-ibm, linux-kvm,
linux-lowlatency, linux-oracle, linux-raspi, linux-oem-6.1, pygments, and pypdf2).

What’s New in CVSS v4

Post Syndicated from Devin Krugly original https://blog.rapid7.com/2023/08/14/whats-new-in-cvss-v4/

What's New in CVSS v4

The pending update to the Common Common Vulnerability Scoring System (CVSS), version 4.0, has garnered a noticeable volume of articles, blog posts and watercooler (now known as Slack and Zoom) air time. Reaction from the community has been positive, with general sentiment pinned somewhere near “practical.”

CVSS provides a standardized method for evaluating the potential severity (and in many cases impact) of a vulnerability so organizations can make informed decisions about how to respond to specific security issues. Its fundamentals have been widely adopted by vendors, researchers, academics, and vulnerability analysts.

What's New in CVSS v4

The standard has been improved over time with the release of v1 in Feb. 2005, v2 in June 2007, and v3 in June 2015. The current version (v3.1) debuted in June 2019. Version 4 is slated for release on October 1, 2023.

So, what’s new in CVSS v4?

CVSS v4 ushers in some meaningful improvements wrapped in a bit of nuanced complexity, especially if you’re a vendor or threat researcher responsible for providing base scores. As far back as CVSS v1, the standard has recognized that things like time, value of the target, exploit activity, and specific operating environment all influence the amount of risk associated with a unique vulnerability. A balance between completeness and ease of use has been sought in development of more recent CVSS versions.

Temporal and Environmental Metrics were intended to provide business context to help influence tradeoff decisions. However, these metrics were “optional” in v3, and adoption stagnated and never really grew beyond use of Base Metrics. Reality reflects this observation partially due to the score subjectivity stemming from assessor interpretation(s), human bias, but most importantly the fact that calculating “optional” metrics requires resources and time that organizations might invest in other areas.

The following summary is presented in sequence across each of the scoring systems v4 groups:

Base Metric Groups and Definitions

Greater precision and accuracy by introducing four (4) groups where only one group has been in practical use until now. The specification document also emphasizes that Base Metrics, provided by vendors and researchers, represent intrinsic qualities. Threat and Environmental groups, which provide business and situational context are intended to be, and can only be, provided by end user organizations.

  • Clarity that CVSS-B is designed to measure the severity of a vulnerability and should not be used alone to assess risk, while CVSS-BTE much more closely approximates risk.
  • CVSS-B – Base metrics plus….. [what’s commonly used today and composed of the Base Metric Group]
  • CVSS-BT – Base and Threat Metrics
  • CVSS-BE – Base and Environmental Metrics
  • CVSS-BTE – Base, Threat, Environmental metrics
  • more on the Supplemental Metric Group later
What's New in CVSS v4

Figure 1. CVSS v.4 Metric Groups, FIRST.org (2023)

Exploitability Metric provides clarification to improve upon the often cited lack of granularity

  • Attack Vector (physical/logical location) – {Network, Adjacent, Local, Physical}
  • Attack Complexity (consideration for mitigating controls) – {Low, High}
  • Attack Requirements (dependencies for exploit/attack to be successful) – {None, Present},
  • Privileges Required (needed prior to attempted exploit) – {None, Low, High}
  • User Interaction (is participation necessary) – {None, Passive, Active}

Impact Metric clarification that Impact measures consequences post attack, also intended usage guidance (with examples) and consideration for Vulnerable (primary) and Subsequent (secondary) Systems across Confidentiality (C), Integrity (I) and Availability (A) dimensions to improve application and usage, these measures replace the often criticized and misused Scope metric in v3.x.

  • Vulnerable System Confidentiality (data disclosure beyond authorized users) – {High, Low, None}
  • Vulnerable System Integrity (loss of trust or accuracy of the data) – {High, Low, None}
  • Vulnerable System Availability (loss of accessibility to compute resources) – {High, Low, None}
  • Subsequent System Confidentiality (data disclosure beyond authorized users) – {High, Low, None}
  • Subsequent System Integrity (loss of trust or accuracy of the data) – {High, Low, None}
  • Subsequent System Availability (loss of accessibility to compute resources) – {High, Low, None}

Threat Metric Group and Definition

Previously called Temporal Metrics in v3.x, Threat Metrics are intended to provide the ‘likelihood’ of a particular CVE being attacked, there are three (3) components which should be assessed in deriving a “Exploit Maturity” value {Not Defined, Attacked, Proof-of-Concept, Unreported}, responsibility for which lies with the affected organization.

  • Current state of exploit techniques (ex. consider advances with ML alongside the Mitre ATT&CK TTPs)
  • Exploit code availability (ex. is there a POC on Github)
  • Active, observable exploitation (ex. what’s the threat analyst or your TIP tell you)

Environmental Metric Group

Like the Threat Metric Group, this set of assessments is intended to be derived by the affected organization and allow an analyst to further tailor any one CVSS score for the use case of the affected asset/system. We return to the security fundamental  ‘CIA Triad’ as the measures to modify or tailor the overall CVSS v4 score(s).

  • Confidentiality | Integrity | Availability Requirement – {Not Defined (insufficient information to choose value), High (catastrophic adverse effect), Medium (serious adverse effect), Low (limited adverse effect)}

Modified Base Metrics within the Environmental Group are intended to codify “mitigations” which may be in place for any vulnerability OR capture instances where the risk is greater due to a lack of expected controls – for example an administrative UI exposed to the internet.

Accommodation for Safety (human safety) where exploitation may result in injuries or worse.

Supplemental Metric Group

An entirely new group of optional measures to accommodate a wide spectrum of extrinsic factors that can influence risk decisions including consideration for

  • Automatable (can an attacker automate exploitation en masse) – {Not Defined, No, Yes}
  • Recovery (ability for a system to resume performance and availability after an attack) – {Not Defined, Automatic, User, Irrecoverable}
  • Safety (degree of impact for predictable injury using IEC 61508 Consequence Categories) – {Not Defined, Present, Negligible}
  • Value Density (level of resources attacker will gain after a single exploit) – {Not Defined, Diffused, Concentrated}
  • Provider Urgency (supplemental urgency rating, available to any supplier in the chain) – {Not Defined, Red, Amber, Green, Clear}
  • Vulnerability Response Effort (supplemental information to suggest level-of-effort (LOE) involved in remediation/mitigation) – {Not Defined, Low, Moderate, High}

That concludes this summary of changes pertaining to the metrics used to derive and supplement a CVSS v4 score. There are also several functional accommodations that have been made including:

  • Vector String updates to accommodate all the revised metric definitions and versioning, which may be a bit unwieldy in practical use for some, but machine readable has extensible value – get your decoder rings ready (ex. CVSS:4.0/AV:P/AC:H/AT:P/PR:H/UI:N/VC:L/VI:H/VA:N/SC:N/SI:H/SA:L/S:P/R:U/RE:M/U:Clear/MAV:A/MAT:P/MPR:N/MUI:A/MVC:H/MVI:L/MVA:N/MSC:H/MSI:L/MSA:N/CR:H/IR:M/AR:L/E:P) [Check out the Interactive Caclulator]
  • Qualitative and quantitative improvements to create greater vuln score distribution and score results, improvements to underlying equations to generate scores
  • Accommodation for unique Base Scores for multiple product versions, platforms and/or OS (operating system)
  • Guidance to baseline Software Vulnerabilities at ‘reasonable worst-case’ implementation scenario and remove confusion regarding software library effects, for example
  • Stronger advocacy to correlate data from both asset management and vulnerability management systems, whenever possible, to drive adoption and use of all four (4) metric groups, similarly to better incorporate and optimize the use of threat intelligence
  • and, finally consideration for transitional support so a single vulnerability may accommodate use of both v4.0 scores and current v3.1 scores.

Day to day impacts

I wouldn’t anticipate the calculation and LOE to derive a CVSS-B (Base Metric) score to significantly increase, but the thought process and underlying analysis sequence will require some updates to existing processes. The bulk of the Base Metric procedural updates will fall to the usual suspects and host of vendors. The more interesting impacts will affect the security teams and vulnerability analysts. It isn’t provocative to suggest that operationalizing the optional metrics, both in v3.x and in the current proposal, could require a pretty heavy lift. Consider the effort a vuln analyst would need to invest on a typical Patch Tuesday to derive Threat Metrics and Environmental Metric groups for every relevant CVE. Doing so for every new vuln and derivation for each Patch Tuesday could easily bleed into the next patch cycle, so automation using enterprise grade vuln management solutions like Rapid7 IVM will continue to be a necessity to facilitate efficient vuln response at scale.

The preceding scenario is precisely the rationale behind the development and release of Rapid7’s new risk scoring model. It will deliver on many of the core tenets of risk-assessment systems including the flexibility to accommodate organizationally specific factors like those defined under Threat and Environmental Metric Groups business to provide teams with a prioritized list of remediation targets.

Summary

While perceptually complex, as proposed CVSS v4 is a meaningful, well researched and structured framework to advance the discipline of vulnerability management. As many have opined, there is room for improvement in the, now old enough to drive, scoring system and in the cybersecurity’s rigor and practical use of all that is considered in the v4 User Guide.

It will be interesting to understand the community’s reaction towards adoption both in scale and complexity—all at once “big bang” approach or incremental change over a longer time horizon. Also, how much of the new system is adopted in practice. Regardless, the resulting work and effort is impressive both in scale and detail. It will resonate with many in the cybersecurity and the broader information technology field(s) and certainly deliver some overdue considerations for others.

The anonymous public comment period ([email protected]) closed on July 31, 2023. First.org is targeting all feedback to be reviewed and addressed by August 31, 2023, with a target official publication date of October 1, 2023.

Wasm core dumps and debugging Rust in Cloudflare Workers

Post Syndicated from Sven Sauleau original http://blog.cloudflare.com/wasm-coredumps/

Wasm core dumps and debugging Rust in Cloudflare Workers

Wasm core dumps and debugging Rust in Cloudflare Workers

A clear sign of maturing for any new programming language or environment is how easy and efficient debugging them is. Programming, like any other complex task, involves various challenges and potential pitfalls. Logic errors, off-by-ones, null pointer dereferences, and memory leaks are some examples of things that can make software developers desperate if they can't pinpoint and fix these issues quickly as part of their workflows and tools.

WebAssembly (Wasm) is a binary instruction format designed to be a portable and efficient target for the compilation of high-level languages like Rust, C, C++, and others. In recent years, it has gained significant traction for building high-performance applications in web and serverless environments.

Cloudflare Workers has had first-party support for Rust and Wasm for quite some time. We've been using this powerful combination to bootstrap and build some of our most recent services, like D1, Constellation, and Signed Exchanges, to name a few.

Using tools like Wrangler, our command-line tool for building with Cloudflare developer products, makes streaming real-time logs from our applications running remotely easy. Still, to be honest, debugging Rust and Wasm with Cloudflare Workers involves a lot of the good old time-consuming and nerve-wracking printf'ing strategy.

What if there’s a better way? This blog is about enabling and using Wasm core dumps and how you can easily debug Rust in Cloudflare Workers.

What are core dumps?

In computing, a core dump consists of the recorded state of the working memory of a computer program at a specific time, generally when the program has crashed or otherwise terminated abnormally. They also add things like the processor registers, stack pointer, program counter, and other information that may be relevant to fully understanding why the program crashed.

In most cases, depending on the system’s configuration, core dumps are usually initiated by the operating system in response to a program crash. You can then use a debugger like gdb to examine what happened and hopefully determine the cause of a crash. gdb allows you to run the executable to try to replicate the crash in a more controlled environment, inspecting the variables, and much more. The Windows' equivalent of a core dump is a minidump. Other mature languages that are interpreted, like Python, or languages that run inside a virtual machine, like Java, also have their ways of generating core dumps for post-mortem analysis.

Core dumps are particularly useful for post-mortem debugging, determining the conditions that lead to a failure after it has occurred.

WebAssembly core dumps

WebAssembly has had a proposal for implementing core dumps in discussion for a while. It's a work-in-progress experimental specification, but it provides basic support for the main ideas of post-mortem debugging, including using the DWARF (debugging with attributed record formats) debug format, the same that Linux and gdb use. Some of the most popular Wasm runtimes, like Wasmtime and Wasmer, have experimental flags that you can enable and start playing with Wasm core dumps today.

If you run Wasmtime or Wasmer with the flag:

--coredump-on-trap=/path/to/coredump/file

The core dump file will be emitted at that location path if a crash happens. You can then use tools like wasmgdb to inspect the file and debug the crash.

But let's dig into how the core dumps are generated in WebAssembly, and what’s inside them.

How are Wasm core dumps generated

(and what’s inside them)

When WebAssembly terminates execution due to abnormal behavior, we say that it entered a trap. With Rust, examples of operations that can trap are accessing out-of-bounds addresses or a division by zero arithmetic call. You can read about the security model of WebAssembly to learn more about traps.

The core dump specification plugs into the trap workflow. When WebAssembly crashes and enters a trap, core dumping support kicks in and starts unwinding the call stack gathering debugging information. For each frame in the stack, it collects the function parameters and the values stored in locals and in the stack, along with binary offsets that help us map to exact locations in the source code. Finally, it snapshots the memory and captures information like the tables and the global variables.

DWARF is used by many mature languages like C, C++, Rust, Java, or Go. By emitting DWARF information into the binary at compile time a debugger can provide information such as the source name and the line number where the exception occurred, function and argument names, and more. Without DWARF, the core dumps would be just pure assembly code without any contextual information or metadata related to the source code that generated it before compilation, and they would be much harder to debug.

WebAssembly uses a (lighter) version of DWARF that maps functions, or a module and local variables, to their names in the source code (you can read about the WebAssembly name section for more information), and naturally core dumps use this information.

All this information for debugging is then bundled together and saved to the file, the core dump file.

The core dump structure has multiple sections, but the most important are:

  • General information about the process;
  • The threads and their stack frames (note that WebAssembly is single threaded in Cloudflare Workers);
  • A snapshot of the WebAssembly linear memory or only the relevant regions;
  • Optionally, other sections like globals, data, or table.

Here’s the thread definition from the core dump specification:

corestack   ::= customsec(thread-info vec(frame))
thread-info ::= 0x0 thread-name:name ...
frame       ::= 0x0 ... funcidx:u32 codeoffset:u32 locals:vec(value)
                stack:vec(value)

A thread is a custom section called corestack. A corestack section contains the thread name and a vector (or array) of frames. Each frame contains the function index in the WebAssembly module (funcidx), the code offset relative to the function's start (codeoffset), the list of locals, and the list of values in the stack.

Values are defined as follows:

value ::= 0x01       => ∅
        | 0x7F n:i32 => n
        | 0x7E n:i64 => n
        | 0x7D n:f32 => n
        | 0x7C n:f64 => n

At the time of this writing these are the possible numbers types in a value. Again, we wanted to describe the basics; you should track the full specification to get more detail or find information about future changes. WebAssembly core dump support is in its early stages of specification and implementation, things will get better, things might change.

This is all great news. Unfortunately, however, the Cloudflare Workers runtime doesn’t support WebAssembly core dumps yet. There is no technical impediment to adding this feature to workerd; after all, it's based on V8, but since it powers a critical part of our production infrastructure and products, we tend to be conservative when it comes to adding specifications or standards that are still considered experimental and still going through the definitions phase.

So, how do we get core Wasm dumps in Cloudflare Workers today?

Polyfilling

Polyfilling means using userland code to provide modern functionality in older environments that do not natively support it. Polyfills are widely popular in the JavaScript community and the browser environment; they've been used extensively to address issues where browser vendors still didn't catch up with the latest standards, or when they implement the same features in different ways, or address cases where old browsers can never support a new standard.

Meet wasm-coredump-rewriter, a tool that you can use to rewrite a Wasm module and inject the core dump runtime functionality in the binary. This runtime code will catch most traps (exceptions in host functions are not yet catched and memory violation not by default) and generate a standard core dump file. To some degree, this is similar to how Binaryen's Asyncify works.

Let’s look at code and see how this works. He’s some simple pseudo code:

export function entry(v1, v2) {
    return addTwo(v1, v2)
}

function addTwo(v1, v2) {
  res = v1 + v2;
  throw "something went wrong";

  return res
}

An imaginary compiler could take that source and generate the following Wasm binary code:

  (func $entry (param i32 i32) (result i32)
    (local.get 0)
    (local.get 1)
    (call $addTwo)
  )

  (func $addTwo (param i32 i32) (result i32)
    (local.get 0)
    (local.get 1)
    (i32.add)
    (unreachable) ;; something went wrong
  )

  (export "entry" (func $entry))

“;;” is used to denote a comment.

entry() is the Wasm function exported to the host. In an environment like the browser, JavaScript (being the host) can call entry().

Irrelevant parts of the code have been snipped for brevity, but this is what the Wasm code will look like after wasm-coredump-rewriter rewrites it:

  (func $entry (type 0) (param i32 i32) (result i32)
    ...
    local.get 0
    local.get 1
    call $addTwo ;; see the addTwo function bellow
    global.get 2 ;; is unwinding?
    if  ;; label = @1
      i32.const x ;; code offset
      i32.const 0 ;; function index
      i32.const 2 ;; local_count
      call $coredump/start_frame
      local.get 0
      call $coredump/add_i32_local
      local.get 1
      call $coredump/add_i32_local
      ...
      call $coredump/write_coredump
      unreachable
    end)

  (func $addTwo (type 0) (param i32 i32) (result i32)
    local.get 0
    local.get 1
    i32.add
    ;; the unreachable instruction was here before
    call $coredump/unreachable_shim
    i32.const 1 ;; funcidx
    i32.const 2 ;; local_count
    call $coredump/start_frame
    local.get 0
    call $coredump/add_i32_local
    local.get 1
    call $coredump/add_i32_local
    ...
    return)

  (export "entry" (func $entry))

As you can see, a few things changed:

  1. The (unreachable) instruction in addTwo() was replaced by a call to $coredump/unreachable_shim which starts the unwinding process. Then, the location and debugging data is captured, and the function returns normally to the entry() caller.
  2. Code has been added after the addTwo() call instruction in entry() that detects if we have an unwinding process in progress or not. If we do, then it also captures the local debugging data, writes the core dump file and then, finally, moves to the unconditional trap unreachable.

In short, we unwind until the host function entry() gets destroyed by calling unreachable.

Let’s go over the runtime functions that we inject for more clarity, stay with us:

  • $coredump/start_frame(funcidx, local_count) starts a new frame in the coredump.
  • $coredump/add_*_local(value) captures the values of function arguments and in locals (currently capturing values from the stack isn’t implemented.)
  • $coredump/write_coredump is used at the end and writes the core dump in memory. We take advantage of the first 1 KiB of the Wasm linear memory, which is unused, to store our core dump.

A diagram is worth a thousand words:

Wasm core dumps and debugging Rust in Cloudflare Workers

Wait, what’s this about the first 1 KiB of the memory being unused, you ask? Well, it turns out that most WebAssembly linters and tools, including Emscripten and WebAssembly’s LLVM don’t use the first 1 KiB of memory. Rust and Zig also use LLVM, but they changed the default. This isn’t pretty, but the hugely popular Asyncify polyfill relies on the same trick, so there’s reasonable support until we find a better way.

But we digress, let’s continue. After the crash, the host, typically JavaScript in the browser, can now catch the exception and extract the core dump from the Wasm instance’s memory:

try {
    wasmInstance.exports.someExportedFunction();
} catch(err) {
    const image = new Uint8Array(wasmInstance.exports.memory.buffer);
    writeFile("coredump." + Date.now(), image);
}

If you're curious about the actual details of the core dump implementation, you can find the source code here. It was written in AssemblyScript, a TypeScript-like language for WebAssembly.

This is how we use the polyfilling technique to implement Wasm core dumps when the runtime doesn’t support them yet. Interestingly, some Wasm runtimes, being optimizing compilers, are likely to make debugging more difficult because function arguments, locals, or functions themselves can be optimized away. Polyfilling or rewriting the binary could actually preserve more source-level information for debugging.

You might be asking what about performance? We did some testing and found that the impact is negligible; the cost-benefit of being able to debug our crashes is positive. Also, you can easily turn wasm core dumps on or off for specific builds or environments; deciding when you need them is up to you.

Debugging from a core dump

We now know how to generate a core dump, but how do we use it to diagnose and debug a software crash?

Similarly to gdb (GNU Project Debugger) on Linux, wasmgdb is the tool you can use to parse and make sense of core dumps in WebAssembly; it understands the file structure, uses DWARF to provide naming and contextual information, and offers interactive commands to navigate the data. To exemplify how it works, wasmgdb has a demo of a Rust application that deliberately crashes; we will use it.

Let's imagine that our Wasm program crashed, wrote a core dump file, and we want to debug it.

$ wasmgdb source-program.wasm /path/to/coredump
wasmgdb>

When you fire wasmgdb, you enter a REPL (Read-Eval-Print Loop) interface, and you can start typing commands. The tool tries to mimic the gdb command syntax; you can find the list here.

Let's examine the backtrace using the bt command:

wasmgdb> bt
#18     000137 as __rust_start_panic () at library/panic_abort/src/lib.rs
#17     000129 as rust_panic () at library/std/src/panicking.rs
#16     000128 as rust_panic_with_hook () at library/std/src/panicking.rs
#15     000117 as {closure#0} () at library/std/src/panicking.rs
#14     000116 as __rust_end_short_backtrace<std::panicking::begin_panic_handler::{closure_env#0}, !> () at library/std/src/sys_common/backtrace.rs
#13     000123 as begin_panic_handler () at library/std/src/panicking.rs
#12     000194 as panic_fmt () at library/core/src/panicking.rs
#11     000198 as panic () at library/core/src/panicking.rs
#10     000012 as calculate (value=0x03000000) at src/main.rs
#9      000011 as process_thing (thing=0x2cff0f00) at src/main.rs
#8      000010 as main () at src/main.rs
#7      000008 as call_once<fn(), ()> (???=0x01000000, ???=0x00000000) at /rustc/b833ad56f46a0bbe0e8729512812a161e7dae28a/library/core/src/ops/function.rs
#6      000020 as __rust_begin_short_backtrace<fn(), ()> (f=0x01000000) at /rustc/b833ad56f46a0bbe0e8729512812a161e7dae28a/library/std/src/sys_common/backtrace.rs
#5      000016 as {closure#0}<()> () at /rustc/b833ad56f46a0bbe0e8729512812a161e7dae28a/library/std/src/rt.rs
#4      000077 as lang_start_internal () at library/std/src/rt.rs
#3      000015 as lang_start<()> (main=0x01000000, argc=0x00000000, argv=0x00000000, sigpipe=0x00620000) at /rustc/b833ad56f46a0bbe0e8729512812a161e7dae28a/library/std/src/rt.rs
#2      000013 as __original_main () at <directory not found>/<file not found>
#1      000005 as _start () at <directory not found>/<file not found>
#0      000264 as _start.command_export at <no location>

Each line represents a frame from the program's call stack; see frame #3:

#3      000015 as lang_start<()> (main=0x01000000, argc=0x00000000, argv=0x00000000, sigpipe=0x00620000) at /rustc/b833ad56f46a0bbe0e8729512812a161e7dae28a/library/std/src/rt.rs

You can read the funcidx, function name, arguments names and values and source location are all present. Let's select frame #9 now and inspect the locals, which include the function arguments:

wasmgdb> f 9
000011 as process_thing (thing=0x2cff0f00) at src/main.rs
wasmgdb> info locals
thing: *MyThing = 0xfff1c

Let’s use the p command to inspect the content of the thing argument:

wasmgdb> p (*thing)
thing (0xfff2c): MyThing = {
    value (0xfff2c): usize = 0x00000003
}

You can also use the p command to inspect the value of the variable, which can be useful for nested structures:

wasmgdb> p (*thing)->value
value (0xfff2c): usize = 0x00000003

And you can use p to inspect memory addresses. Let’s point at 0xfff2c, the start of the MyThing structure, and inspect:

wasmgdb> p (MyThing) 0xfff2c
0xfff2c (0xfff2c): MyThing = {
    value (0xfff2c): usize = 0x00000003
}

All this information in every step of the stack is very helpful to determine the cause of a crash. In our test case, if you look at frame #10, we triggered an integer overflow. Once you get comfortable walking through wasmgdb and using its commands to inspect the data, debugging core dumps will be another powerful skill under your belt.

Tidying up everything in Cloudflare Workers

We learned about core dumps and how they work, and we know how to make Cloudflare Workers generate them using the wasm-coredump-rewriter polyfill, but how does all this work in practice end to end?

We've been dogfooding the technique described in this blog at Cloudflare for a while now. Wasm core dumps have been invaluable in helping us debug Rust-based services running on top of Cloudflare Workers like D1, Privacy Edge, AMP, or Constellation.

Today we're open-sourcing the Wasm Coredump Service and enabling anyone to deploy it. This service collects the Wasm core dumps originating from your projects and applications when they crash, parses them, prints an exception with the stack information in the logs, and can optionally store the full core dump in a file in an R2 bucket (which you can then use with wasmgdb) or send the exception to Sentry.

We use a service binding to facilitate the communication between your application Worker and the Coredump service Worker. A Service binding allows you to send HTTP requests to another Worker without those requests going over the Internet, thus avoiding network latency or having to deal with authentication. Here’s a diagram of how it works:

Wasm core dumps and debugging Rust in Cloudflare Workers

Using it is as simple as npm/yarn installing @cloudflare/wasm-coredump, configuring a few options, and then adding a few lines of code to your other applications running in Cloudflare Workers, in the exception handling logic:

import shim, { getMemory, wasmModule } from "../build/worker/shim.mjs"

const timeoutSecs = 20;

async function fetch(request, env, ctx) {
    try {
        // see https://github.com/rustwasm/wasm-bindgen/issues/2724.
        return await Promise.race([
            shim.fetch(request, env, ctx),
            new Promise((r, e) => setTimeout(() => e("timeout"), timeoutSecs * 1000))
        ]);
    } catch (err) {
      const memory = getMemory();
      const coredumpService = env.COREDUMP_SERVICE;
      await recordCoredump({ memory, wasmModule, request, coredumpService });
      throw err;
    }
}

The ../build/worker/shim.mjs import comes from the worker-build tool, from the workers-rs packages and is automatically generated when wrangler builds your Rust-based Cloudflare Workers project. If the Wasm throws an exception, we catch it, extract the core dump from memory, and send it to our Core dump service.

You might have noticed that we race the workers-rs shim.fetch() entry point with another Promise to generate a timeout exception if the Rust code doesn't respond earlier. This is because currently, wasm-bindgen, which generates the glue between the JavaScript and Rust land, used by workers-rs, has an issue where a Promise might not be rejected if Rust panics asynchronously (leading to the Worker runtime killing the worker with “Error: The script will never generate a response”.). This can block the wasm-coredump code and make the core dump generation flaky.

We are working to improve this, but in the meantime, make sure to adjust timeoutSecs to something slightly bigger than the typical response time of your application.

Here’s an example of a Wasm core dump exception in Sentry:

Wasm core dumps and debugging Rust in Cloudflare Workers

You can find a working example, the Sentry and R2 configuration options, and more details in the @cloudflare/wasm-coredump GitHub repository.

Too big to fail

It's worth mentioning one corner case of this debugging technique and the solution: sometimes your codebase is so big that adding core dump and DWARF debugging information might result in a Wasm binary that is too big to fit in a Cloudflare Worker. Well, worry not; we have a solution for that too.

Fortunately the DWARF for WebAssembly specification also supports external DWARF files. To make this work, we have a tool called debuginfo-split that you can add to the build command in the wrangler.toml configuration:

command = "... && debuginfo-split ./build/worker/index.wasm"

What this does is it strips the debugging information from the Wasm binary, and writes it to a new separate file called debug-{UUID}.wasm. You then need to upload this file to the same R2 bucket used by the Wasm Coredump Service (you can automate this as part of your CI or build scripts). The same UUID is also injected into the main Wasm binary; this allows us to correlate the Wasm binary with its corresponding DWARF debugging information. Problem solved.

Binaries without DWARF information can be significantly smaller. Here’s our example:

4.5 MiB debug-63372dbe-41e6-447d-9c2e-e37b98e4c656.wasm
313 KiB build/worker/index.wasm

Final words

We hope you enjoyed reading this blog as much as we did writing it and that it can help you take your Wasm debugging journeys, using Cloudflare Workers or not, to another level.

Note that while the examples used here were around using Rust and WebAssembly because that's a common pattern, you can use the same techniques if you're compiling WebAssembly from other languages like C or C++.

Also, note that the WebAssembly core dump standard is a hot topic, and its implementations and adoption are evolving quickly. We will continue improving the wasm-coredump-rewriter, debuginfo-split, and wasmgdb tools and the wasm-coredump service. More and more runtimes, including V8, will eventually support core dumps natively, thus eliminating the need to use polyfills, and the tooling, in general, will get better; that's a certainty. For now, we present you with a solution that works today, and we have strong incentives to keep supporting it.

As usual, you can talk to us on our Developers Discord or the Community forum or open issues or PRs in our GitHub repositories; the team will be listening.

China Hacked Japan’s Military Networks

Post Syndicated from Bruce Schneier original https://www.schneier.com/blog/archives/2023/08/china-hacked-japans-military-networks.html

The NSA discovered the intrusion in 2020—we don’t know how—and alerted the Japanese. The Washington Post has the story:

The hackers had deep, persistent access and appeared to be after anything they could get their hands on—plans, capabilities, assessments of military shortcomings, according to three former senior U.S. officials, who were among a dozen current and former U.S. and Japanese officials interviewed, who spoke on the condition of anonymity because of the matter’s sensitivity.

[…]

The 2020 penetration was so disturbing that Gen. Paul Nakasone, the head of the NSA and U.S. Cyber Command, and Matthew Pottinger, who was White House deputy national security adviser at the time, raced to Tokyo. They briefed the defense minister, who was so concerned that he arranged for them to alert the prime minister himself.

Beijing, they told the Japanese officials, had breached Tokyo’s defense networks, making it one of the most damaging hacks in that country’s modern history.

More analysis.

Kernel prepatch 6.5-rc6

Post Syndicated from corbet original https://lwn.net/Articles/941405/

The 6.5-rc6 kernel prepatch is out for
testing.

So apart from the regularly scheduled hardware mitigation patches,
everything looks fairly normal. And I guess the hw mitigation is to
be considered normal too, apart from the inevitable fixup patches
it then causes because the embargo keeps us from testing it widely
and keeps it from all our public automation. Sigh.

The collective thoughts of the interwebz