GitHub Availability Report: February 2023

Post Syndicated from Jakub Oleksy original https://github.blog/2023-03-01-github-availability-report-february-2023/

In February, we experienced three incidents that resulted in degraded performance across GitHub services. This report also sheds light into a January incident that resulted in degraded performance for GitHub Packages and GitHub Pages and another January incident that impacted Git users.

January 30 21:31 UTC (lasting 35 minutes)

On January 30 at 21:36 UTC, our alerting system detected a 500 error response increase in requests made to the Container registry. As a result, most builds on GitHub Pages and requests to GitHub Packages failed during the incident.

Upon investigation, we found that a change was made to the Container registry Redis configuration at 21:30 UTC to enforce authentication on Redis connections. There was an issue with the Container registry production deployment file where client connections were unable to authenticate due to a hard coded connection string, resulting in errors and preventing successful connections.

At 22:12 UTC, we reverted the configuration change for Redis authentication. Container registry began recovering two minutes later, and GitHub Pages was considered healthy again by 22:21 UTC.

To help prevent future incidents, we improved management of secrets in the Container registry’s Redis deployment configurations and added extra test coverage for authenticated Redis connections.

January 30 18:35 UTC (lasting 7 hours)

On January 30 at 18:35 UTC, GitHub deployed a change which slightly altered the compression settings on source code downloads. This change altered the checksums of the resulting archive files, resulting in unforeseen consequences for a number of communities. The contents of these files were unchanged, but many communities had come to rely on the precise layout of bytes also being unchanged. When we realized the impact we reverted the change and communicated with affected communities.

We did not anticipate the broad impact this change would have on a number of communities and are implementing new procedures to prevent future incidents. This includes working through several improvements in our deployment of Git throughout GitHub and adding a checksum validation to our workflow.

See this related blog post for details about our plan going forward.

February 7 21:30 UTC (lasting 20 hours and 35 minutes)

On February 7 at 21:30 UTC, our monitors detected failures creating, starting, and connecting to GitHub Codespaces in the Southeast Asia region, caused by a datacenter outage of our cloud provider. To reduce the impact to our customers during this time, we redirected codespace creations to a secondary location, allowing new codespaces to be used. Codespaces in that region recovered automatically when the datacenter recovered, allowing existing codespaces in the region to be restarted. Codespaces in other regions were not impacted during this incident.

Based on learnings from this incident, we are evaluating expanding our regional redundancy and have started making architectural changes to better handle temporary regional and datacenter outages, including more regularly exercising our failover capabilities.

February 18 02:36 UTC (lasting 2 hours and 26 minutes)

On February 18 at 02:36 UTC, we became aware of errors in our application code pointing to connectivity issues to our MySQL databases. Upon investigation, we believe these errors were due to a few unhealthy deployments of our sharding middleware. At 03:30 UTC, we performed a re-deployment of the database infrastructure in an effort to remediate. Unfortunately, this propagated the issue to all Kubernetes pods, leading to system-wide errors. As a result, multiple services returned 500 error responses and GitHub users were experiencing issues signing in to GitHub.com.

At 04:30 UTC, we found that the database topology in 30% of our deployments was corrupted, which prevented applications from connecting to the database. We applied a copy of the correct database topology to all deployments, which resolved the errors across services by 05:00 UTC. Users were then able to sign in to GitHub.com.

To help prevent future incidents, we added a monitor to detect database topology errors so we can identify this well in advance of these changes impacting production systems. We have also improved our observability around topology reloads, both successful and erroneous ones. We are also doing a deeper review of the contributing factors to this incident to learn and improve both our architecture and operations to prevent a recurrence.

February 28 16:05 UTC (lasting 1 hour and 26 minutes)

On February 28 at 16:05 UTC, we were notified of degraded performance for GitHub Codespaces. We resolved the incident at 17:31 UTC.

Due to the recency of this incident, we are still investigating the contributing factors and will provide a more detailed update in next month’s report.


Please follow our status page for real-time updates on status changes. To learn more about what we’re working on, check out the GitHub Engineering Blog.

Build a semantic search engine for tabular columns with Transformers and Amazon OpenSearch Service

Post Syndicated from Kachi Odoemene original https://aws.amazon.com/blogs/big-data/build-a-semantic-search-engine-for-tabular-columns-with-transformers-and-amazon-opensearch-service/

Finding similar columns in a data lake has important applications in data cleaning and annotation, schema matching, data discovery, and analytics across multiple data sources. The inability to accurately find and analyze data from disparate sources represents a potential efficiency killer for everyone from data scientists, medical researchers, academics, to financial and government analysts.

Conventional solutions involve lexical keyword search or regular expression matching, which are susceptible to data quality issues such as absent column names or different column naming conventions across diverse datasets (for example, zip_code, zcode, postalcode).

In this post, we demonstrate a solution for searching for similar columns based on column name, column content, or both. The solution uses approximate nearest neighbors algorithms available in Amazon OpenSearch Service to search for semantically similar columns. To facilitate the search, we create features representations (embeddings) for individual columns in the data lake using pre-trained Transformer models from the sentence-transformers library in Amazon SageMaker. Finally, to interact with and visualize results from our solution, we build an interactive Streamlit web application running on AWS Fargate.

We include a code tutorial for you to deploy the resources to run the solution on sample data or your own data.

Solution overview

The following architecture diagram illustrates the two-stage workflow for finding semantically similar columns. The first stage runs an AWS Step Functions workflow that creates embeddings from tabular columns and builds the OpenSearch Service search index. The second stage, or the online inference stage, runs a Streamlit application through Fargate. The web application collects input search queries and retrieves from the OpenSearch Service index the approximate k-most-similar columns to the query.

Solution architecture

Figure 1. Solution architecture

The automated workflow proceeds in the following steps:

  1. The user uploads tabular datasets into an Amazon Simple Storage Service (Amazon S3) bucket, which invokes an AWS Lambda function that initiates the Step Functions workflow.
  2. The workflow begins with an AWS Glue job that converts the CSV files into Apache Parquet data format.
  3. A SageMaker Processing job creates embeddings for each column using pre-trained models or custom column embedding models. The SageMaker Processing job saves the column embeddings for each table in Amazon S3.
  4. A Lambda function creates the OpenSearch Service domain and cluster to index the column embeddings produced in the previous step.
  5. Finally, an interactive Streamlit web application is deployed with Fargate. The web application provides an interface for the user to input queries to search the OpenSearch Service domain for similar columns.

You can download the code tutorial from GitHub to try this solution on sample data or your own data. Instructions on the how to deploy the required resources for this tutorial are available on Github.

Prerequistes

To implement this solution, you need the following:

  • An AWS account.
  • Basic familiarity with AWS services such as the AWS Cloud Development Kit (AWS CDK), Lambda, OpenSearch Service, and SageMaker Processing.
  • A tabular dataset to create the search index. You can bring your own tabular data or download the sample datasets on GitHub.

Build a search index

The first stage builds the column search engine index. The following figure illustrates the Step Functions workflow that runs this stage.

Step functions workflow

Figure 2 – Step functions workflow – multiple embedding models

Datasets

In this post, we build a search index to include over 400 columns from over 25 tabular datasets. The datasets originate from the following public sources:

For the the full list of the tables included in the index, see the code tutorial on GitHub.

You can bring your own tabular dataset to augment the sample data or build your own search index. We include two Lambda functions that initiate the Step Functions workflow to build the search index for individual CSV files or a batch of CSV files, respectively.

Transform CSV to Parquet

Raw CSV files are converted to Parquet data format with AWS Glue. Parquet is a column-oriented format file format preferred in big data analytics that provides efficient compression and encoding. In our experiments, the Parquet data format offered significant reduction in storage size compared to raw CSV files. We also used Parquet as a common data format to convert other data formats (for example JSON and NDJSON) because it supports advanced nested data structures.

Create tabular column embeddings

To extract embeddings for individual table columns in the sample tabular datasets in this post, we use the following pre-trained models from the sentence-transformers library. For additional models, see Pretrained Models.

Model name Dimension Size (MB)
all-MiniLM-L6-v2 384 80
all-distilroberta-v1 768 290
average_word_embeddings_glove.6B.300d 300 420

The SageMaker Processing job runs create_embeddings.py(code) for a single model. For extracting embeddings from multiple models, the workflow runs parallel SageMaker Processing jobs as shown in the Step Functions workflow. We use the model to create two sets of embeddings:

  • column_name_embeddings – Embeddings of column names (headers)
  • column_content_embeddings – Average embedding of all the rows in the column

For more information about the column embedding process, see the code tutorial on GitHub.

An alternative to the SageMaker Processing step is to create a SageMaker batch transform to get column embeddings on large datasets. This would require deploying the model to a SageMaker endpoint. For more information, see Use Batch Transform.

Index embeddings with OpenSearch Service

In the final step of this stage, a Lambda function adds the column embeddings to a OpenSearch Service approximate k-Nearest-Neighbor (kNN) search index. Each model is assigned its own search index. For more information about the approximate kNN search index parameters, see k-NN.

Online inference and semantic search with a web app

The second stage of the workflow runs a Streamlit web application where you can provide inputs and search for semantically similar columns indexed in OpenSearch Service. The application layer uses an Application Load Balancer, Fargate, and Lambda. The application infrastructure is automatically deployed as part of the solution.

The application allows you to provide an input and search for semantically similar column names, column content, or both. Additionally, you can select the embedding model and number of nearest neighbors to return from the search. The application receives inputs, embeds the input with the specified model, and uses kNN search in OpenSearch Service to search indexed column embeddings and find the most similar columns to the given input. The search results displayed include the table names, column names, and similarity scores for the columns identified, as well as the locations of the data in Amazon S3 for further exploration.

The following figure shows an example of the web application. In this example, we searched for columns in our data lake that have similar Column Names (payload type) to district (payload). The application used all-MiniLM-L6-v2 as the embedding model and returned 10 (k) nearest neighbors from our OpenSearch Service index.

The application returned transit_district, city, borough, and location as the four most similar columns based on the data indexed in OpenSearch Service. This example demonstrates the ability of the search approach to identify semantically similar columns across datasets.

Web application user interface

Figure 3: Web application user interface

Clean up

To delete the resources created by the AWS CDK in this tutorial, run the following command:

cdk destroy --all

Conclusion

In this post, we presented an end-to-end workflow for building a semantic search engine for tabular columns.

Get started today on your own data with our code tutorial available on GitHub. If you’d like help accelerating your use of ML in your products and processes, please contact the Amazon Machine Learning Solutions Lab.


About the Authors

Kachi Odoemene is an Applied Scientist at AWS AI. He builds AI/ML solutions to solve business problems for AWS customers.

Taylor McNally is a Deep Learning Architect at Amazon Machine Learning Solutions Lab. He helps customers from various industries build solutions leveraging AI/ML on AWS. He enjoys a good cup of coffee, the outdoors, and time with his family and energetic dog.

Austin Welch is a Data Scientist in the Amazon ML Solutions Lab. He develops custom deep learning models to help AWS public sector customers accelerate their AI and cloud adoption. In his spare time, he enjoys reading, traveling, and jiu-jitsu.

Enhance operational insights for Amazon MSK using Amazon Managed Service for Prometheus and Amazon Managed Grafana

Post Syndicated from Anand Mandilwar original https://aws.amazon.com/blogs/big-data/enhance-operational-insights-for-amazon-msk-using-amazon-managed-service-for-prometheus-and-amazon-managed-grafana/

Amazon Managed Streaming for Apache Kafka (Amazon MSK) is an event streaming platform that you can use to build asynchronous applications by decoupling producers and consumers. Monitoring of different Amazon MSK metrics is critical for efficient operations of production workloads. Amazon MSK gathers Apache Kafka metrics and sends them to Amazon CloudWatch, where you can view them. You can also monitor Amazon MSK with Prometheus, an open-source monitoring application. Many of our customers use such open-source monitoring tools like Prometheus and Grafana, but doing it in self-managed environment comes with its own challenges regarding manageability, availability, and security.

In this post, we show how you can build an AWS Cloud native monitoring platform for Amazon MSK using the fully managed, highly available, scalable, and secure services Amazon Managed service for Prometheus and Amazon Managed Grafana for better operational insights.

Why is Kafka monitoring critical?

As a critical component of the IT infrastructure, it is necessary to track Amazon MSK clusters’ operations and their efficiencies. Amazon MSK metrics helps monitor critical tasks while operating applications. You can not only troubleshoot problems that have already occurred, but also discover anomalous behavior patterns and prevent problems from occurring in the first place.

Some customers currently use various third-party monitoring solutions like lenses.io, AppDynamics, Splunk, and others to monitor Amazon MSK operational metrics. In the context of cloud computing, customers are looking for an AWS Cloud native service that offers equivalent or better capabilities but with the added advantage of being highly scalable, available, secure, and fully managed.

Amazon MSK clusters emit a very large number of metrics via JMX, many of which can be useful for tuning the performance of your cluster, producers, and consumers. However, that large volume brings complexity with monitoring. By default, Amazon MSK clusters come with CloudWatch monitoring of your essential metrics. You can extend your monitoring capabilities by using open-source monitoring with Prometheus. This feature enables you to scrape a Prometheus friendly API to gather all the JMX metrics and work with the data in Prometheus.

This solution provides a simple and easy observability platform for Amazon MSK along with much needed insights into various critical operational metrics that yields the following organizational benefits for your IT operations or application teams:

  • You can quickly drill down to various Amazon MSK components (broker level, topic level, or cluster level) and identify issues that need investigation
  • You can investigate Amazon MSK issues after the event using the historical data in Amazon Managed Service for Prometheus
  • You can shorten or eliminate long calls that waste time questioning business users on Amazon MSK issues

In this post, we set up Amazon Managed Service for Prometheus, Amazon Managed Grafana, and a Prometheus server running as container on Amazon Elastic Compute Cloud (Amazon EC2) to provide a fully managed monitoring solution for Amazon MSK.

The solution provides an easy-to-configure dashboard in Amazon Managed Grafana for various critical operation metrics, as demonstrated in the following video.

Solution overview

Amazon Managed Service for Prometheus reduces the heavy lifting required to get started with monitoring applications across Amazon MSK, Amazon Elastic Kubernetes Service (Amazon EKS), Amazon Elastic Container Service (Amazon ECS), and AWS Fargate, as well as self-managed Kubernetes clusters. The service also seamlessly integrates with Amazon Managed Grafana to simplify data visualization, team management authentication, and authorization.

Grafana empowers you to create dashboards and alerts from multiple sources such as an Amazon Managed Prometheus workspace, CloudWatch, AWS X-Ray, Amazon OpenSearch Service, Amazon Redshift, and Amazon Timestream.

The following diagram demonstrates the solution architecture. This solution deploys a Prometheus server running as a container within Amazon EC2, which constantly scrapes metrics from the MSK brokers and remote write metrics to an Amazon Managed Service for Prometheus workspace. As of this writing, Amazon Managed Service for Prometheus is not able to scrape the metrics directly, therefore a Prometheus server is necessary to do so. We use Amazon Managed Grafana to query and visualize the operational metrics for the Amazon MSK platform.

Solution Architecture

The following are the high-level steps to deploy the solution:

  1. Create an EC2 key pair.
  2. Configure your Amazon MSK cluster and associated resources. We demonstrate how to configure an existing Amazon MSK cluster or create a new one.
    1. Option A:- Modify an existing Amazon MSK cluster
    2. Option B:- Create a new Amazon MSK cluster
  3. Enable AWS IAM Identity Center (successor to AWS Single Sign-On), if not enabled.
  4. Configure Amazon Managed Grafana and Amazon Managed Service for Prometheus.
  5. Configure Prometheus and start the service.
  6. Configure the data sources in Amazon Managed Grafana.
  7. Import the Grafana dashboard.

Prerequisites

git clone https://github.com/aws-samples/amazonmsk-managed-observability
  • You download three CloudFormation template files along with the Prometheus configuration file (prometheus.yml), targets.json file (you need this to update the MSK broker DNS later on), and three JSON files for creating a dashboard within Amazon Managed Grafana.
  • Make sure internet connection is allowed to download docker image of Prometheus from within Prometheus server

1. Create an EC2 key pair

To create your EC2 key pair, complete the following steps:

  1. On the Amazon EC2 console, under Network & Security in the navigation pane, choose Key Pairs.
  2. Choose Create key pair.
  3. For Name, enter DemoMSKKeyPair.
  4. For Key pair type¸ select RSA.
  5. For Private key file format, choose the format in which to save the private key:
    1. To save the private key in a format that can be used with OpenSSH, select .pem.
    2. To save the private key in a format that can be used with PuTTY, select .ppk.

Create EC2 Key Pair - DemoMSKKeyPair

The private key file is automatically downloaded by your browser. The base file name is the name that you specified as the name of your key pair, and the file name extension is determined by the file format that you chose.

  1. Save the private key file in a safe place.

2. Configure your Amazon MSK cluster and associated resources.

Using the following options to configure an existing Amazon MSK cluster or create a new one.

2.a Modify an existing Amazon MSK cluster

If you want to create a new Amazon MSK cluster for this solution, skip to the section – 2.b.Create a new Amazon MSK cluster, otherwise complete the steps in this section to modify an existing cluster.

Validate cluster monitoring settings

We must enable enhanced partition-level monitoring (available at an additional cost) and open monitoring with Prometheus. Note that open monitoring with Prometheus is only available for provisioned mode clusters.

  1. Sign in to the account where the Amazon MSK cluster is that you want to monitor.
  2. Open your Amazon MSK cluster.
  3. On the Properties tab, navigate to Monitoring metrics.
  4. Check the monitoring level for Amazon CloudWatch metrics for this cluster, and choose Edit to edit the cluster.
  5. Select Enhance partition-level monitoring.

Editing monitoring attributes of Amazon MSK Cluster

  1. Check the monitoring label for Open monitoring with Prometheus, and choose Edit to edit the cluster.
  2. Select Enable open monitoring for Prometheus.
  3. Under Prometheus exporters, select JMX Exporter and Note Exporter.

enable Open monitoring with Prometheus

  1. Under Broker log delivery, select Deliver to Amazon CloudWatch Logs.
  2. For Log group, enter your log group for Amazon MSK.
  3. Choose Save changes.

Deploy CloudFormation stack

Now we deploy the CloudFormation stack Prometheus_Cloudformation.yml that we downloaded earlier.

  1. On the AWS CloudFormation console, choose Stacks in the navigation pane.
  2. Choose Create stack.
  3. For Prepare template, select Template is ready.
  4. For Template source, select Upload a template.
  5. Upload the Prometheus_Cloudformation.yml file, then choose Next.

CloudFormation - Create Stack for Prometheus_Cloudformation.yml

  1. For Stack name, enter Prometheus.
  2. VPCID – Provide the VPC ID where your Amazon MSK cluster is deployed (mandatory)
  3. VPCCIdr – Provide the VPC CIDR where your Amazon MSK Cluster is deployed (mandatory)
  4. SubnetID – Provide any one of the subnets ID where your existing Amazon MSK cluster is deployed (mandatory)
  5. MSKClusterName – Provide the name your existing Amazon MSK Cluster
  6. Leave Cloud9InstanceType, KeyName, and LatestAmild as default.
  7. Choose Next.

CloudFormation - Specify stack details for Prometheus Stack

  1. On the Review page, select I acknowledge that AWS CloudFormation might create IAM resources.
  2. Choose Create stack.

You’re redirected to the AWS CloudFormation console, and can see the status as CREATE_IN_PROGRESSS. Wait until the status changes to COMPLETE.

CloudFormation stack creation status for Prometheus Stack

  1. On the stack’s Outputs tab, note the values for the following keys (if you don’t see anything under Outputs tab, click on refresh icon):
    1. PrometheusInstancePrivateIP
    2. PrometheusSecurityGroupId

getting private IP and Security Group ID for Prometheus Stack

Update the Amazon MSK cluster security group

Complete the following steps to update the security group of the existing Amazon MSK cluster to allow communication from the Kafka client and Prometheus server:

  1. On the Amazon MSK console, navigate to your Amazon MSK cluster.
  2. On the Properties tab, under Network settings, open the security group.
  3. Choose Edit inbound rules.
  4. Choose Add rule and create your rule with the following parameters:
    1. Type – Custom TCP
    2. Port range – 11001–11002
    3. Source – The Prometheus server security group ID

Set up your AWS Cloud9 environment

To configure your AWS Cloud9 environment, complete the following steps:

  1. On the AWS Cloud9 console, choose Environments in the navigation pane.
  2. Select Cloud9EC2Bastion and choose Open in Cloud9.

AWS Cloud9 home page

  1. Close the Welcome tab and open a new terminal tab
  2. Create an SSH key file with the contents from the private key file DemoMSKKeyPair using the following command:
    touch /home/ec2-user/environment/EC2KeyMSKDemo

  3. Run the following command to list the newly created key file
    ls -ltr

  4. Open the file, enter the contents of the private key file DemoMSKKeyPair, then save the file.

Updating the key file with the private file content

  1. Change the permissions of the file using the following command:
    chmod 600 /home/ec2-user/environment/EC2KeyMSKDemo

  2. Log in to the Prometheus server using this key file and the private IP noted earlier:
    ssh -i /home/ec2-user/environment/EC2KeyMSKDemo ec2-user@<Private-IP-of-Prometheus-instance>

  3. Once you’re logged in, check if the Docker service is up and running using the following command:
    systemctl status docker

checking docker service status

  1. To exit the server, enter exit and press Enter.

2.b Create a new Amazon MSK cluster

If you don’t have an Amazon MSK cluster running in your environment, or you don’t want to use an existing cluster for this solution, complete the steps in this section.

As part of these steps, your cluster will have the following properties:

Deploy CloudFormation stack

Complete the following steps to deploy the CloudFormation stack MSKResource_Cloudformation.yml:

  1. On the AWS CloudFormation console, choose Stacks in the navigation pane.
  2. Choose Create stack.
  3. For Prepare template, select Template is ready.
  4. For Template source, select Upload a template.
  5. Upload the MSKResource_Cloudformation.yml file, then choose Next.
  6. For Stack name, enter MSKDemo.
  7. Network Configuration – Generic (mandatory)
    1. Stack to be deployed in NEW VPC? (true/false) – if false, you MUST provide VPCCidr and other details under Existing VPC section (Default is true)
    2. VPCCidr – Default is 10.0.0.0/16 for a new VPC. You can have any valid values as per your environment. If deploying in an existing VPC, provide the CIDR for the same
  8. Network Configuration – For New VPC
    1. PrivateSubnetMSKOneCidr (Default is 10.0.1.0/24)
    2. PrivateSubnetMSKTwoCidr (Default is 10.0.2.0/24)
    3. PrivateSubnetMSKThreeCidr (Default is 10.0.3.0/24)
    4. PublicOneCidr (Default is 10.0.0.0/24)
  9. Network Configuration – For Existing VPC (You need at least 4 subnets)
    1. VpcId – Provide the value if you are using any existing VPC to deploy the resources else leave it blank(default)
    2. SubnetID1 – Any one of the existing subnets from the given VPCID
    3. SubnetID2 – Any one of the existing subnets from the given VPCID
    4. SubnetID3 – Any one of the existing subnets from the given VPCID
    5. PublicSubnetID – Any one of the existing subnets from the given VPCID
  10. Leave the remaining parameters as default and choose Next.

Specifying the parameter details for MSKDemo stack

  1. On the Review page, select I acknowledge that AWS CloudFormation might create IAM resources.
  2. Choose Create stack.

You’re redirected to the AWS CloudFormation console, and can see the status as CREATE_IN_PROGRESSS. Wait until the status changes to COMPLETE.

CloudFormation stack creation status

  1. On the stack’s Outputs tab, note the values for the following (if you don’t see anything under Outputs tab, click on refresh icon):
    1. KafkaClientPrivateIP
    2. PrometheusInstancePrivateIP

Set up your AWS Cloud9 environment

Follow the steps as outlined in the previous section to configure your AWS Cloud9 environment.

Retrieve the cluster broker list

To get your MSK cluster broker list, complete the following steps:

  1. On the Amazon MSK console, navigate to your cluster.
  2. In the Cluster summary section, choose View client information.
  3. In the Bootstrap servers section, copy the private endpoint.

You need this value to perform some operations later, such as creating an MSK topic, producing sample messages, and consuming those sample messages.

  1. Choose Done.
  2. On the Properties tab, in the Brokers details section, note the endpoints listed.

These need to be updated in the targets.json file (used for Prometheus configuration in a later step).

3. Enable IAM Identity Center

Before you deploy the CloudFormation stack for Amazon Managed Service for Prometheus and Amazon Managed Grafana, make sure to enable IAM Identity Center.

If you don’t use IAM Identity Center, alternatively, you can set up user authentication via SAML. For more information, refer to Using SAML with your Amazon Managed Grafana workspace.

If IAM Identity Center is currently enabled/configured in another region, you don’t need to enable in your current region.

Complete the following steps to enable IAM Identity Center:

  1. On the IAM Identity Center console, under Enable IAM Identity Center, choose Enable.

Enabling IAM Identity Center

  1. Choose Create AWS organization.

4. Configure Amazon Managed Grafana and Amazon Managed Service for Prometheus

Complete the steps in this section to set up Amazon Managed Service for Prometheus and Amazon Managed Grafana.

Deploy CloudFormation template

Complete the following steps to deploy the CloudFormation stack AMG_AMP_Cloudformation:

  1. On the AWS CloudFormation console, choose Stacks in the navigation pane.
  2. Choose Create stack.
  3. For Prepare template, select Template is ready.
  4. For Template source, select Upload a template.
  5. Upload the AMG_AMP_Cloudformation.yml file, then choose Next.
  6. For Stack name, enter ManagedPrometheusAndGrafanaStack, then choose Next.
  7. On the Review page, select I acknowledge that AWS CloudFormation might create IAM resources.
  8. Choose Create stack.

You’re redirected to the AWS CloudFormation console, and can see the status as CREATE_IN_PROGRESSS. Wait until the status changes to COMPLETE.

  1. On the stack’s Outputs tab, note the values for the following (if you don’t see anything under Outputs tab, click on refresh icon):
    1. GrafanaWorkspaceURL – This is Amazon Managed Grafana URL
    2. PrometheusEndpointWriteURL – This is the Amazon Managed Service for Prometheus write endpoint URL

Outputs information for ManagedPromethusAndGrafana Stack

Create a user for Amazon Managed Grafana

Complete the following steps to create a user for Amazon Managed Grafana:

  1. On the IAM Identity Center console, choose Users in the navigation pane.
  2. Choose Add user.
  3. For Username, enter grafana-admin.
  4. Enter and confirm your email address to receive a confirmation email.

IAM Identity Center - Specifying user information

  1. Skip the optional steps, then choose Add user.

A success message appears at the top of the console.

  1. In the confirmation email, choose Accept invitation and set your user password.

Screenshot showing Invitation link for the new user

  1. On the Amazon Managed Grafana console, choose Workspaces in the navigation pane.
  2. Open the workspace Amazon-Managed-Grafana.
  3. Make a note of the Grafana workspace URL.

You use this URL to log in to view your Grafana dashboards.

  1. On the Authentication tab, choose Assign new user or group.

Amazon Managed Grafana - Workspace information - Assigning user

  1. Select the user you created earlier and choose Assign users and groups.

Amazon Managed Grafana - Assigning user to workspace

  1. On the Action menu, choose what kind of user to make it: admin, editor, or viewer.

Note that your Grafana workspace needs as least one admin user.

  1. Navigate to the Grafana URL you copied earlier in your browser.
  2. Choose Sign in with AWS IAM Identity Center.

Amazon Managed Grafana URL landing page

  1. Log in with your IAM Identity Center credentials.

5. Configure Prometheus and start the service

When you cloned the GitHub repo, you downloaded two configuration files: prometheus.yml and targets.json. In this section, we configure these two files.

  1. Use any IDE (Visual Studio Code or Notepad++) to open prometheus.yml.
  2. In the remote_write section, update the remote write URL and Region.

prometheus.yml file

  1. Use any IDE to open targets.json.
  2. Update the targets with the broker endpoints you obtained earlier.

targets.json file

  1. In your AWS Cloud9 environment, choose File, then Upload Local Files.
  2. Choose Select Files and upload targets.json and prometheus.yml from your local machine.

Upload file dialog page within AWS Cloud9 Environment

  1. In the AWS Cloud9 environment, run the following command using the key file you created earlier:
    ssh -i /home/ec2-user/environment/EC2KeyMSKDemo ec2-user@<Private-IP-of-Prometheus instance> mkdir -p /home/ec2-user/Prometheus

  2. copy targets.json to the Prometheus server:
    scp -i /home/ec2-user/environment/EC2KeyMSKDemo targets.json ec2-user@<Private-IP-of-Prometheus-instance>:/home/ec2-user/prometheus/

  3. copy prometheus.yml to the Prometheus server:
    scp -i /home/ec2-user/environment/EC2KeyMSKDemo prometheus.yml ec2-user@<Private-IP-of-Prometheus-instance>:/home/ec2-user/prometheus/

  4. SSH into the Prometheus server and start the container service for Prometheus
    ssh -i /home/ec2-user/environment/EC2KeyMSKDemo ec2-user@<Private-IP-of-Prometheus instance>

  5. start the prometheus container
    sudo docker run -d -p 9090:9090 --name=prometheus -v /home/ec2-user/prometheus/prometheus.yml:/etc/prometheus/prometheus.yml -v /home/ec2-user/prometheus/targets.json:/etc/prometheus/targets.json prom/prometheus --config.file=/etc/prometheus/prometheus.yml

  6. Check if the Docker service is running:

Start the prometheus container inside Prometheus Server

6. Configure data sources in Amazon Managed Grafana

To configure your data sources, complete the following steps:

  1. Log in to the Amazon Managed Grafana URL.
  2. Choose AWS Data Services in the navigation pane, then choose Data Sources.

Amazon Managed Grafana - Configuring data source

  1. For Service, choose Amazon Managed Service for Prometheus.
  2. For Region, choose your Region.

The correct resource ID is populated automatically.

  1. Select your resource ID and choose Add 1 data source.

Configuring data source for Amazon managed Prometheus

  1. Choose Go to settings.

Configuring data source for Amazon managed Prometheus

  1. For Name, enter Amazon Managed Prometheus and enable Default.

The URL is automatically populated.

  1. Leave everything else as default.

Configuring data source for Amazon managed Prometheus

  1. Choose Save & Test.

If everything is correct, the message Data source is working appears.

Now we configure CloudWatch as a data source.

  1. Choose AWS Data Services, then choose Data source.
  2. For Services, choose CloudWatch.
  3. For Region, choose your correct Region.
  4. Choose Add data source.
  5. Select the CloudWatch data source and choose Go to settings.

Configuring data source with Service as CloudWatch

  1. For Name, enter AmazonMSK-CloudWatch.
  2. Choose Save & Test.

7. Import the Grafana dashboard

You can use the following preconfigured dashboards, which are available to download from the GitHub repo:

  • Kafka Metrics
  • MSK Cluster Overview
  • AWS MSK – Kafka Cluster-CloudWatch

To import your dashboard, complete the following steps:

  1. In Amazon Managed Grafana, choose the plus sign in the navigation pane.
  2. Choose Import.

Importing preconfigured dashboard

  1. Choose Upload JSON file.
  2. Choose the dashboard you downloaded.
  3. Choose Load.

Configuring dashboard by importing the json file

The following screenshot shows your loaded dashboard.

Dashboard showing cluster level metrics

Generate sample data in Amazon MSK (Optional – when you create a new Amazon MSK Cluster)

To generate sample data in Amazon MSK, complete the following steps:

  1. In your AWS Cloud9 environment, log in to the Kafka client.
    ssh -i /home/ec2-user/environment/EC2KeyMSKDemo ec2-user@<Private-IP-of-Kafka Client>

  2. Set the broker endpoint variable
    export MYBROKERS="<Bootstrap Servers Endpoint – captured earlier>"

  3. Run the following command to create a topic called TLSTestTopic60:
    /home/ec2-user/kafka/bin/kafka-topics.sh --command-config /home/ec2-user/kafka/config/client.properties --bootstrap-server $MYBROKERS --create --topic TLSTestTopic60 --partitions 5 --replication-factor 2

  4. Still logged in to the Kafka client, run the following command to start the producer service:
    /home/ec2-user/kafka/bin/kafka-console-producer.sh --producer.config /home/ec2-user/kafka/config/client.properties --broker-list $MYBROKERS --topic TLSTestTopic60

Creating topic and producing messages in Kafka Producer service

  1. Open a new terminal from within your AWS Cloud9 environment and log in to the Kafka client instance
    ssh -i /home/ec2-user/environment/EC2KeyMSKDemo ec2-user@<Private-IP-of-Kafka Client>

  2. Set the broker endpoint variable
    export MYBROKERS="<Bootstrap Servers Endpoint – captured earlier>"

  3. Now you can start the consumer service and see the incoming messages
    /home/ec2-user/kafka/bin/kafka-console-consumer.sh --consumer.config /home/ec2-user/kafka/config/client.properties --bootstrap-server $MYBROKERS --topic TLSTestTopic60 --from-beginning

Starting Kafka consumer service

  1. Press CTRL+C to stop the producer/consumer service.

Kafka metrics dashboards on Amazon Managed Grafana

You can now view your Kafka metrics dashboards on Amazon Managed Grafana:

  • Cluster overall health – Configured using Amazon Managed Service for Prometheus as the data source:
    • Critical metrics

Amazon MSK cluster overview – Configured using Amazon Managed Service for Prometheus as the data source:

  • Critical metrics
  • Cluster throughput (broker-level metrics)

  • Cluster metrics (JVM)

Kafka cluster operation metrics – Configured using CloudWatch as the data source:

  • General overall stats

  • CPU and Memory metrics

Clean up

You will continue to incur costs until you delete the infrastructure that you created for this post. Delete the CloudFormation stack you used to create the respective resources.

If you used an existing cluster, make sure to remove the inbound rules you updated in the security group (otherwise the stack deletion will fail).

  1. On the Amazon MSK console, navigate to your existing cluster.
  2. On the Properties tab, in the Networking settings section, open the security group you applied.
  3. Choose Edit inbound rules.

  1. Choose Delete to remove the rules you added.
  2. Choose Save rules.

Now you can delete your CloudFormation stacks.

  1. On the AWS CloudFormation console, choose Stacks in the navigation pane.
  2. Select ManagedPrometheusAndGrafana and choose Delete.
  3. If you used an existing Amazon MSK cluster, delete the stack Prometheus.
  4. If you created a new Amazon MSK cluster, delete the stack MSKDemo.

Conclusion

This post showed how you can deploy a fully managed, highly available, scalable, and secure monitoring system for Amazon MSK using Amazon Managed Service for Prometheus and Amazon Managed Grafana, and use Grafana dashboards to gain deep insights into various operational metrics. Although this post only discussed using Amazon Managed Service for Prometheus and CloudWatch as the data sources in Amazon Managed Grafana, you can enable various other data sources, such as AWS IoT SiteWise, AWS X-Ray, Redshift, and Amazon Athena, and build a dashboard on top of those metrics. You can use these managed services for monitoring any number of Amazon MSK platforms. Metrics are available to query in Amazon Managed Grafana or Amazon Managed Service for Prometheus in near-real time.

You can use this post as prescriptive guidance and deploy an observability solution for a new or an existing Amazon MSK cluster, identify the metrics that are important for your applications and then create a dashboard using Amazon Managed Grafana and Prometheus.


About the Authors

Anand Mandilwar is an Enterprise Solutions Architect at AWS. He works with enterprise customers helping customers innovate and transform their business in AWS. He is passionate about automation around Cloud operation , Infrastructure provisioning and Cloud Optimization. He also likes python programming. In his spare time, he enjoys honing his photography skill especially in Portrait and landscape area.

Ajit Puthiyavettle is a Solution Architect working with enterprise clients, architecting solutions to achieve business outcomes. He is passionate about solving customer challenges with innovative solutions. His experience is with leading DevOps and security teams for enterprise and SaaS (Software as a Service) companies. Recently he is focussed on helping customers with Security, ML and HCLS workload.

Content Repository for Unstructured Data with Multilingual Semantic Search: Part 1

Post Syndicated from Patrik Nagel original https://aws.amazon.com/blogs/architecture/content-repository-for-unstructured-data-with-multilingual-semantic-search-part-1/

Unstructured data can make up to 80 percent of data in the day-to-day business of financial organizations. For example, these organizations typically store and read PDFs and images for claim processing, underwriting, and know your customer (KYC). Organizations need to make this ingested data accessible and searchable across different entities while logically separating data access according to role requirements.

In this two-part series, we use AWS services to build an end-to-end content repository for storing and processing unstructured data with the following features:

  • Dynamic access control-based logic over unstructured data
  • Multilingual semantic search capabilities

In part 1, we build the architectural foundation for the content repository, including the resource access control logic and a web UI to upload and list documents.

Solution overview

The content repository includes four building blocks:

Frontend and interaction: For this function, we use AWS Amplify, which is a set of purpose-built tools and features to help frontend web and mobile developers quickly build full-stack applications on AWS. The React application uses the AWS Amplify authentication feature to quickly set up a complete authentication flow integrated into Amazon Cognito. Amplify also hosts the frontend application.

Authentication and authorization: Implementing dynamic resource access control with a combination of roles and attributes is fundamental to your content repository security. Amazon Cognito provides a managed, scalable user directory, user sign-up and sign-in flows, and federation capabilities through third-party identity providers. We use Amazon Cognito user pools as the source of user identity for the content repository. You can work with user pool groups to represent different types of user collection, and you can manage their permissions using a group-associated AWS Identity and Access Management (IAM) role.

Users authenticate against the Amazon Cognito user pool. The web app will exchange the user pool tokens for AWS credentials through an Amazon Cognito identity pool in the content repository. You can complement the IAM role-based authorization model by mapping your relevant attributes to principal tags that will be evaluated as part of IAM permission policies. This allows a dynamic and flexible authorization strategy. For use cases that need federation with third-party identity providers, you can base your user collection on existing user group attributes, such as Active Directory group membership.

Backend and business logic: Authenticated users are redirected to the Amazon API Gateway. API Gateway provides managed publishing for application programming interfaces (APIs) that act as the repository’s “front door.” API Gateway also interacts with the repository’s backend through RESTful APIs. This makes the business logic of the content repository extensible for future use cases, such as transcription and translation. We use AWS Lambda as a serverless, event-driven compute service to run specific business logic code, such as uploading a document to the content repository.

Content storage: Amazon Simple Storage Service (Amazon S3) provides virtually unlimited scalability and high durability. With Amazon S3, you can cost-effectively store unstructured documents in their native formats and make it accessible in a secure and scalable way. Enriching the uploaded documents with tags simplifies data governance with fine-grained access control.

Technical architecture

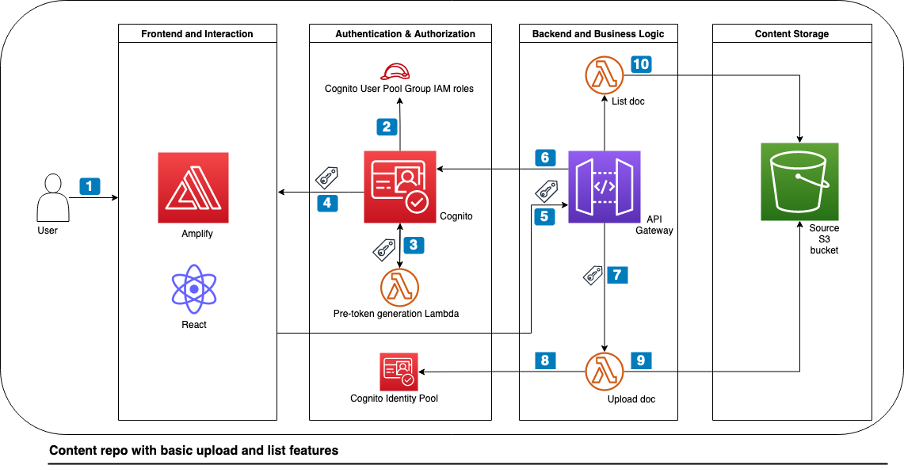
The technical architecture of the content repository with these four components can be found in Figure 1.

Technical architecture of the content repository

Figure 1. Technical architecture of the content repository

Let’s explore the architecture step by step.

  1. The frontend uses the Amplify JS library to add the authentication UI component to your React app, allowing authenticated users to sign in.
  2. Once the user provides their sign-in credentials, they are redirected to Amazon Cognito user pools to be authenticated.
  3. Once the authentication is successful, Amazon Cognito invokes a pre-token generation Lambda function. This function customizes the identity (ID) token with a new claim called department. This new claim is the Amazon Cognito group name from the cognito:preferred_role claim.
  4. Amazon Cognito returns the identity, access, and refresh token in JSON format to the frontend.
  5. The Amplify client library stores the tokens and handles refreshes using the refresh token while the React frontend application calls the API Gateway with the ID token. Note: Usually, you would use the access token to grant access to authorized resources. For this architecture, we use the ID token because we have enriched it with the custom claim during step 3.
  6. API Gateway uses its native integration with Amazon Cognito and validates the ID token’s signature and expiration using Amazon Cognito user pool authorizer. For more complex authorization scenarios, you can use API Gateway Lambda authorizer with the AWS JSON Web Token (JWT) Verify library for verifying JWTs signed by Amazon Cognito.
  7. After successful validation, API Gateway passes the ID token to the backend Lambda function, which can verify and authorize upon it for access control.
  8. Upon document upload action, the backend Lambda function calls the Amazon Cognito identity pool to exchange the ID token for the temporary AWS credentials associated with the cognito:preferred_role claim.
  9. The document upload Lambda function returns a pre-signed URL with the custom department claim in the Amazon S3 path prefix as well as the object tag. The Amazon S3 pre-signed URL is used for the document upload from the frontend application directly to Amazon S3.
  10. Upon document list action, similar to step 8, the backend Lambda function exchanges the ID token for the temporary AWS credentials. The Lambda function returns only the documents based on the user’s preferred group and associated custom department claim.

Prerequisites

You must have the following prerequisites for this solution:

Walkthrough

Setup

The following steps will deploy two AWS CDK stacks into your AWS account:

  • content-repo-stack (blog-content-repo-stack.ts) creates the environment detailed in Figure 1.
  • demo-data-stack (userpool-demo-data-stack.ts) deploys sample users, groups, and role mappings.

To continue setup, use the following commands:

  1. Clone the project git repository:
    git clone https://github.com/aws-samples/content-repository-with-dynamic-access-control content-repository
  2. Install the necessary dependencies:
    cd content-repository/backend-cdk
    npm install
    
  3. Configure environment variables:
    export CDK_DEFAULT_ACCOUNT=$(aws sts get-caller-identity --query 'Account' --output text)
    export CDK_DEFAULT_REGION=$(aws configure get region)
    
  4. Bootstrap your account for AWS CDK usage:
    cdk bootstrap aws://$CDK_DEFAULT_ACCOUNT/$CDK_DEFAULT_REGION
  5. Deploy the code to your AWS account:
    cdk deploy --all

Using the repository

Once you deploy the CDK stacks in your AWS account, follow these steps:

1. Access the frontend application:

a. Copy the amplifyHostedAppUrl value shown in the AWS CDK output from the content-repo-stack.

b. Use the URL with your web browser to access the frontend application.

c. A temporary page displays until the automated build and deployment of the React application completes after 4-5 minutes.

2. Application sign-in and role-based access control (RBAC):

a. The React webpage prompts you to sign in and then change the temporary password.

b. The content repository provides two demo users with credentials as part of the demo-data-stack in the AWS CDK output. In this walkthrough, we use the sales-user user, which belongs to the sales department group to validate RBAC.

3. Upload a document to the content repository:

a. Authenticate as sales-user.

b. Select upload to upload your first document to the content repository.

c. The repository provides sample documents in the assets sub-folder.

4. List your uploaded document:

a. Select list to show the uploaded sales content.

b. To verify the dynamic access control, repeat steps 2 and 3 for the marketing-user user, which belongs to the marketing department group.

c. Sign-in to the AWS Management Console and navigate to the Amazon S3 bucket with the prefix content-repo-stack-s3sourcebucket to confirm that all the uploaded content exists.

Implementation notes

Frontend deployment and cross-origin access

The content-repo-stack contains an AwsCustomResource construct. This construct uses the Amplify API to start the release job of the Amplify hosted frontend application. The preBuild step of the Amplify application build specification dynamically configures its backend for the Amazon Cognito-based authentication. The required Amazon Cognito configuration parameters are retrieved from the AWS Systems Manager Parameter Store during build time. Similarly, the Amplify application postBuild step updates the Amazon S3 cross-origin resource sharing (CORS) rule for the Amazon S3 bucket to only allow cross-origin access from the Amplify-hosted URL of the frontend application.

Application sign-in and access control

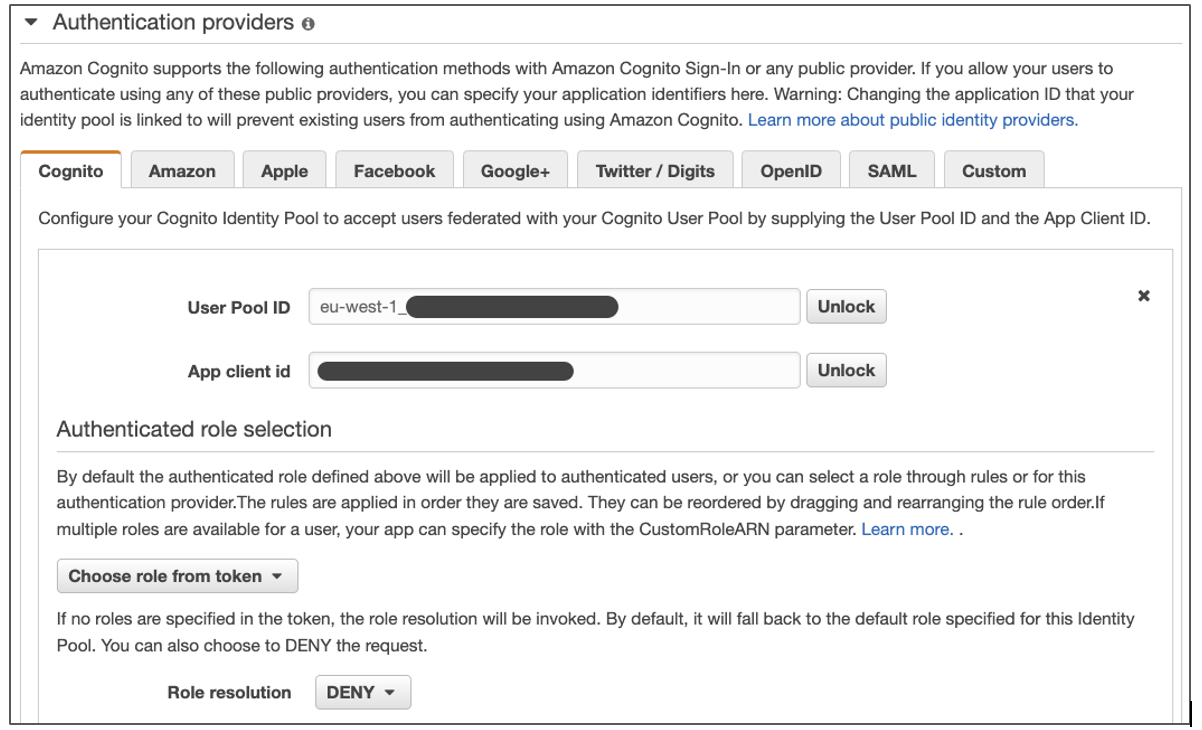
The Amazon Cognito identity pool configuration is set to Choose role from token for authenticated users, as in Figure 2. This setup permits authenticated users to pass the roles in the ID token that the Amazon Cognito user pool assigned. Backend Lambda functions use the roles that appear in the cognito:roles and cognito:preferred_role claims in the ID token for RBAC.

Amazon Cognito identity pool configuration – using tokens to assign roles to authenticated users

Figure 2. Amazon Cognito identity pool configuration – using tokens to assign roles to authenticated users

In the attributes for access control section, we configured a custom mapping from the augmented department token claim to a tag key, as in Figure 3. The backend logic uses the tag key to match the PrincipalTag condition in IAM policies to control access to AWS resources.

Amazon Cognito identity pool configuration – custom mapping from claim names to tag keys

Figure 3. Amazon Cognito identity pool configuration – custom mapping from claim names to tag keys

Document upload

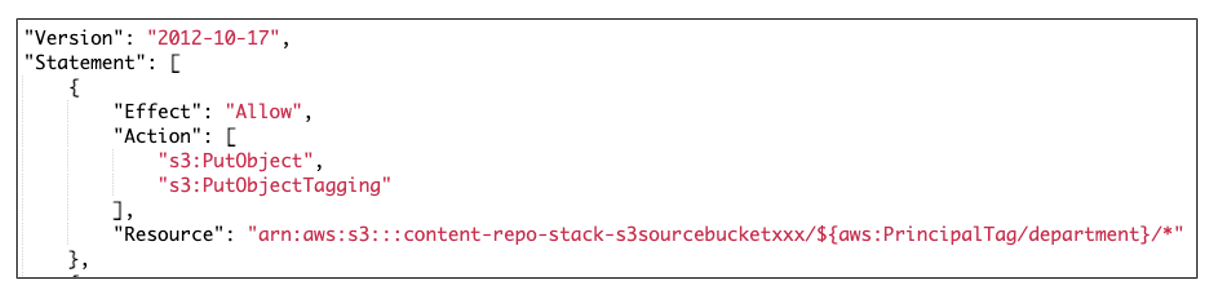
The presigned_url.py Lambda function generates a pre-signed Amazon S3 URL using the department token claim as the key. This function automatically organizes the uploaded document into a logical structure in the Amazon S3 source bucket. Accordingly, the cognito:preferred_role used for the Amazon S3 client credentials in the Lambda function has a permission policy using the PrincipalTag department to dynamically limit access to the Amazon S3 key, as in Figure 4.

Permission policy using PrincipalTag to upload documents to Amazon S3

Figure 4. Permission policy using PrincipalTag to upload documents to Amazon S3

Document listing

The list functionality only shows the uploaded content belonging to the preferred group of authenticated Amazon Cognito user pool user. To only list the files that a specific user (for example, sales-user) has access to, use the PrincipalTag s3:prefix condition, as in Figure 5.

Permission policy using s3:prefix condition with session tags to list documents

Figure 5. Permission policy using s3:prefix condition with session tags to list documents

Cleanup

In the backend-cdk subdirectory, delete the deployed resources:

cdk destroy --all

Conclusion

In this blog, we demonstrated how to build a content repository with an easy-to-use web application for unstructured data that ingests documents while maintaining dynamic access control for users within departments. These steps provide a foundation to build your own content repository to store and process documents. As next steps, based on your organization’s security requirements, you can implement more complex access control use cases by balancing IAM role and principal tags. For example, you can use Amazon Cognito user pool custom attributes for additional dimensions such as document “clearance” with optional modification in the pre-token generation Lambda.

In the next part of this blog series, we will enrich the content repository with multi-lingual semantic search features while maintaining the access control fundamentals we’ve already implemented. For additional information on how you can build a solution to search for information across multiple scanned documents, PDFs, and images with compliance capabilities, please refer our Document Understanding Solution from AWS Solutions Library.

Ryabitsev: Fix your mutt

Post Syndicated from original https://lwn.net/Articles/924822/

Konstantin Ryabitsev has a
request
for anybody who is using mutt for kernel work:

At some point in the recent past, mutt changed the way it generates
Message-ID header values. Instead of the perfectly good
old way of doing it, the developers switched to using
base64-encoded random bytes. The base64 dictionary contains the
/ character, which causes unnecessary difficulties when
linking to these messages on lore.kernel.org, since the /
character needs to be escaped as %2F for everything to
work properly.

The post includes a simple workaround for the problem.

Позитивно за Розовата къща

Post Syndicated from Юлия Георгиева original https://www.toest.bg/pozitivno-za-rozovata-kushta/

(4 години в 1700 думи)

Позитивно за Розовата къща

Преди доста години ми попадна видео за една организация, която работи с хора със зависимости в Канада. Бях много впечатлена от липсата на натиск и очакване хората да прекратят употребата на наркотици възможно най-бързо. Сградата имаше три етажа. На първия се намираше дневен център, посещаван от хората, които в момента употребяват незаконни вещества. Там те можеха да се нахранят, да си починат, да получат помощ от социални работници, медицинско лице, психолози. В дневния център се провеждаха обучения за превенция на свръхдоза и кръвнопреносими инфекции, предлагаха се тестове, а също така бяха осигурени инструменти за безопасна употреба. Експертите там оставяха достатъчно време на посетителите да намерят себе си и да решат да се качат на следващия етаж.

За тези, които имаха желание да променят нещо повече в ежедневието си, беше предвиден въпросният втори етаж, където можеха да живеят. Настанилите се там разполагаха с малка стая и работа според квалификацията и възможностите си. Спазваха се ясни правила, а експертите съдействаха да се достигне моментът, в който тези хора ще пожелаят изцяло да спрат употребата на наркотици.

На третия етаж беше терапевтичната общност, където хората получаваха подкрепа за пълно прекратяване на употребата, ресоциализация и пълноценно завръщане към „нормалния“ живот.

Всичко беше толкова разумно преценено и измислено, толкова ненасилствено, че този модел се превърна в еталон за мен.

И така, в един слънчев априлски ден на 2019 година за първи път отидох в къща „Посока“. Това беше името на едно място, управлявано от наши колеги, които три пъти в седмицата за по няколко часа осигуряваха храна, пералня и подкрепа за хора, които вземаха наркотици. Целта им беше да мотивират посетителите на къщата да се включат в терапевтичната програма на Асоциация „Солидарност“.

Дотук всичко изглеждаше прекрасно, като изключим дребния факт, че дневният център на асоциацията не получаваше никаква държавна подкрепа.

Както добре знаем, в България пари за хора със зависимости почти не се планират и не се отпускат.

Терапията, предлагана в къщата, беше платена, а ползващите услугите там не разполагаха със средства.


Седяхме си на слънце, разговаряхме с колегите, представяхме си какво можем да направим, как да подобрим нещата в сферата, как да овластим хора от общността, за да се погрижат сами за себе си, когато чухме телефона да звъни. Уж позвъняване като всяко друго, а преобърна и нашия свят, и света на посетителите на къщата. Оказа се, че са хазяите и се обаждат да уточнят ден, в който къщата да бъде освободена. Асоциацията нямаше средства да продължи да плаща наем и да поддържа мястото.

Само това имахме, вече и него го няма. Никой не ни иска. Така ще си умрем.

Това са думите, които тогава чух и които цял живот ще помня. В тях нямаше гняв и обида. Само мъка. Ужасно много мъка. Сега, когато се връщам отново там, изпитвам същата болка. Но и много ясно си спомням гласа, който изкрещя в главата ми:

Направи нещо! Престъпление е да не опиташ!

Обърнах се към колегата и го попитах дали би останал да работи, ако намерим пари.

В Управителния съвет на Центъра за хуманни политики за минути взехме решение, че ще пробваме. Нямахме никакви средства за подобна дейност, а това, което искахме да направим, беше съвсем различно от всичко правено в България до онзи момент. Вероятно беше неразумна идея, но когато притеснено описах във Facebook какво се случва, и съобщих, че събираме средства, за да осигурим място за хората със зависимости, където те да се чувстват приети, това се прие неочаквано добре от наистина много хора.

Призивът се разпространи като пожар: известни хора споделиха статуса, Бояна Петкова направи кампания за събиране на средства в „Платформата“ (защото ние още нямахме профил, а трябваше да се действа много бързо), звъняха ни журналисти, приятели, напълно непознати. И в сметката започнаха да пристигат пари. След няколко часа се събра сумата от 700 лв. – толкова беше първият ни наем тогава. С Бояна крещяхме като деца от щастие. На следващия ден вече имахме нужните 1400 лв., за да сключим договор за наем и да запазим мястото. В същото време колегите от „Солидарност“ ни дариха цялото оборудване на къщата. Работещите там решиха, че остават. Хората, които я посещаваха, бяха на върха на щастието и когато ги попитахме как биха искали да се казва, си избраха „Розовата къща“.

По същото време бях поканена да говоря на форум „Ключ“ и направо побърках организаторите на събитието, когато им заявих, че напълно променям концепцията на изказването си и презентацията си – три дни преди самото събитие. Мисля, че този „Ключ“ също даде силен тласък на разпространението на новината и на кампанията за събиране на средства.

И Розовата къща тръгна по собствения си път. Потърси ме художничка, която предложи да направи лого. Когато се обадихме да поръчаме балони за откриването, от магазина отказаха да им платим, бяха разбрали за нас и искаха да помогнат. Хора от ресторантьорския бизнес ни подариха хапки за събитието. Обаждаха ни се всякакви хора, които искаха да помогнат с каквото могат.

Чак когато първата вълна на ентусиазъм и адреналин отмина, когато сключихме договора за наем и се заехме с осигуряването на документите, които да легитимират работата ни, си дадох сметка какво сме направили. Бяхме сложили

началото на нещо, което имаше потенциал да развие цялостна нова концепция за работа с хора със зависимости.

Ненасилствена, отнасяща се с уважение към личността и нуждите на всеки отделен човек. Модел, за който бяхме мечтали през годините, но не вярвахме, че е възможно да осъществим.

Първата ни работа беше да променим работното време и така къщата заработи всеки делничен ден. Всеки ден по няколко часа хората имаха къде да се подслонят, да се нахранят, да погледат филм или да послушат музика, да споделят едни с други за живота си, за света си. В онези предковидни времена купувахме хляб, сирене и лютеница; посетителите заедно приготвяха сандвичите си, режеха салата и плодове, смееха се, превръщаха къщата в дом. Едно от момчетата обичаше, като дойде, да излъска цялата къща, а после да се изкъпе, да си облече чисти дрехи и да си сложи пантофи.

В началото имаше няколко редовни посетители. После започнаха да водят приятели, приятелите доведоха своите приятели. Появиха се първите ни доброволци, някои от колегите си тръгнаха, дойдоха нови. Екипът се стикова и заработи като добре смазана машина. Хората започнаха да търсят подкрепа за повече неща – за издаване на лични документи, за придружаване до лекари, правна помощ и какво ли още не.

Малко по малко къщата се напълни, но пък точно тогава дойде първата карантина.

Наложи се да затворим за две седмици. Това беше най-тежкото време, което преживяхме. Навън все още беше студено, хората нямаше къде да отидат, как да се нахранят. Приютите напълно затвориха, моловете също – нямаше къде да се влезе на топло поне за малко.

Усещането, че за пореден път всички ги изоставихме, беше унищожително. Не издържахме дълго и по време на най-драконовските мерки решихме да отворим достъпа до къщата. Беше много тежко да пускаме по трима-четирима души, а останалите да стоят навън на студа, докато изгоним постоплилите се и пуснем следващата група… но беше по-добре от нищо. Изискванията покрай пандемията повишиха и цената на издръжката на къщата. Храната вече трябваше да е опакована, а ресторантите (самите те в криза) сменяха правилата през ден.

И когато изглеждаше, че може и да не успеем, спечелихме финансиране от Дарителския форум и нещата отново се наредиха. Обадиха ни се и страхотните хора от CoKitchen, които и преди бяха дарявали, но сега пожелаха да осигуряват ежедневно топла храна срещу минимално заплащане, колкото да покрият цената на продуктите. Имало е случаи, когато не сме им плащали с месеци, но те никога не ни се разсърдиха… Благодарение на тях

и до днес сме единственото място в София, където има топла храна всеки работен ден.

Със затоплянето на времето нещата тръгнаха по обичайния начин. С нас се свързаха от Българската хранителна банка, за да предложат да работим заедно. Тогава нямахме кола, но приятели от Фондация П.У.Л.С. протегнаха ръка и се заеха да ни доставят невероятни вкуснотии със своя бус. А от „Каритас“ започнаха да ни посещават, за да превързват нуждаещите се и да правят тестове за кръвнопреносими инфекции.

През 2021 г. успяхме да осигурим проектни средства и къщата заработи по цял ден. Елмира Нешева пое ежедневните грижи за всичко в нея. Приятели ни подариха кола, така че вече можехме сами да получаваме храната, а Ивайло Веселинов стана и шофьор. Илияна Иванова започна да работи индивидуално с някои от посетителите и постигна неочаквано високи резултати. По това време адвокат Наташа Добрева вече отдавна защитаваше правата на нашите хора и имаше спечелени дела, а сега ни свърза и с Камелия Димитрова, заедно с която организираха няколко срещи за превенция на трафика на хора. Александра Иванова се захвана да преподава български на хората, които не можеха да пишат. Илияна започна да ходи в следствието, за да помага на колегите си да работят с някои от арестуваните, които познавахме. В началото на 2022 г. отново успяхме да осигурим проектни средства и към екипа се присъедини и Велислава Иванова.

И така, стъпка по стъпка,

Розовата къща се превърна в пристан за около 400 души.

Някои от тях спряха да идват, други успяха да се преборят със света и сега не употребяват наркотици, имат дом и живот.

Но на мен все ми се струва, че Розовата къща е опора не само за хората, които идват физически всеки ден, но и за онези хиляди, които ни подкрепиха през годините, онези, които правят България добро и смислено място.

А аз виждам вече осъществената мечта да имаме онзи първи етаж от страхотния канадски модел. Но сега вече на дневен ред идва вторият етаж.

Broadcom Tomahawk 5 based 51.2T Bailly Co-Packaged Optics Switch Shown

Post Syndicated from Rohit Kumar original https://www.servethehome.com/broadcom-tomahawk-5-based-51-2t-bailly-co-packaged-optics-switch-shown-cpo/

For OFC 2023, there is a new Broadcom Tomahawk 5 co-packaged optics 51.2T switch. CPO is about to become a big deal in the networking industry

The post Broadcom Tomahawk 5 based 51.2T Bailly Co-Packaged Optics Switch Shown appeared first on ServeTheHome.

Proactive Insights with Amazon DevOps Guru for RDS

Post Syndicated from Kishore Dhamodaran original https://aws.amazon.com/blogs/devops/proactive-insights-with-amazon-devops-guru-for-rds/

Today, we are pleased to announce a new Amazon DevOps Guru for RDS capability: Proactive Insights. DevOps Guru for RDS is a fully-managed service powered by machine learning (ML), that uses the data collected by RDS Performance Insights to detect and alert customers of anomalous behaviors within Amazon Aurora databases. Since its release, DevOps Guru for RDS has empowered customers with information to quickly react to performance problems and to take corrective actions. Now, Proactive Insights adds recommendations related to operational issues that may prevent potential issues in the future.

Proactive Insights requires no additional set up for customers already using DevOps Guru for RDS, for both Amazon Aurora MySQL-Compatible Edition and Amazon Aurora PostgreSQL-Compatible Edition.

The following are example use cases of operational issues available for Proactive Insights today, with more insights coming over time:

  • Long InnoDB History for Aurora MySQL-Compatible engines – Triggered when the InnoDB history list length becomes very large.
  • Temporary tables created on disk for Aurora MySQL-Compatible engines – Triggered when the ratio of temporary tables created versus all temporary tables breaches a threshold.
  • Idle In Transaction for Aurora PostgreSQL-Compatible engines – Triggered when sessions connected to the database are not performing active work, but can keep database resources blocked.

To get started, navigate to the Amazon DevOps Guru Dashboard where you can see a summary of your system’s overall health, including ongoing proactive insights. In the following screen capture, the number three indicates that there are three ongoing proactive insights. Click on that number to see the listing of the corresponding Proactive Insights, which may include RDS or other Proactive Insights supported by Amazon DevOps Guru.

Amazon DevOps Guru Dashboard where you can see a summary of your system’s overall health, including ongoing proactive insights

Figure 1. Amazon DevOps Guru Dashboard where you can see a summary of your system’s overall health, including ongoing proactive insights.

Ongoing problems (including reactive and proactive insights) are also highlighted against your database instance on the Database list page in the Amazon RDS console.

Proactive and Reactive Insights are highlighted against your database instance on the Database list page in the Amazon RDS console

Figure 2. Proactive and Reactive Insights are highlighted against your database instance on the Database list page in the Amazon RDS console.

In the following sections, we will dive deep on these use cases of DevOps Guru for RDS Proactive Insights.

Long InnoDB History for Aurora MySQL-Compatible engines

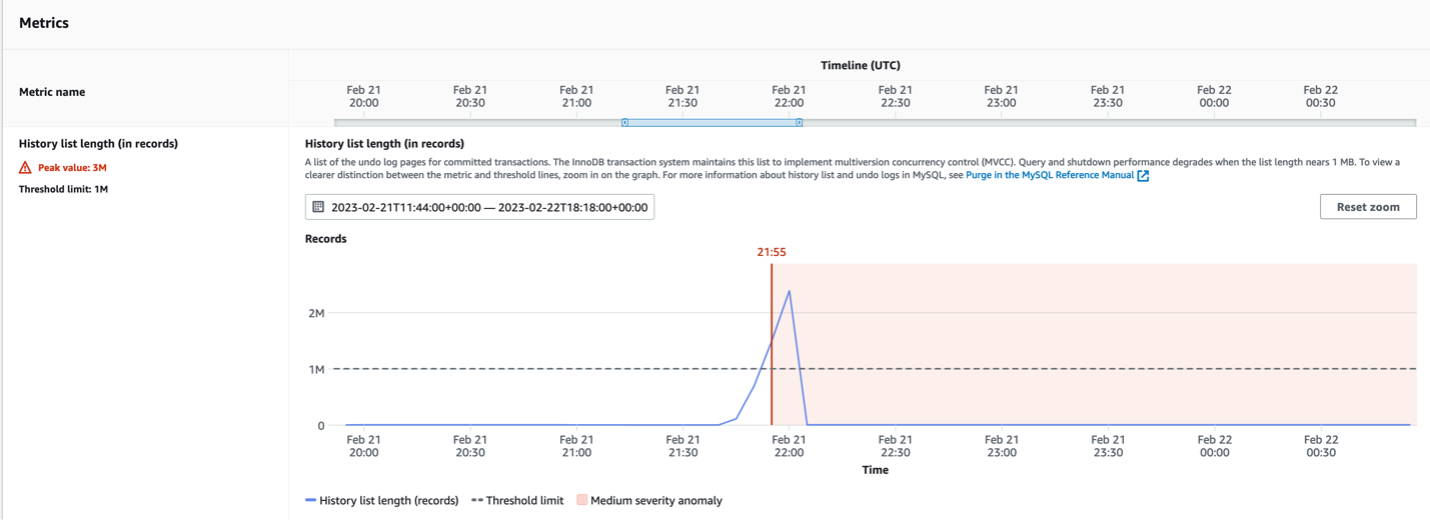
The InnoDB history list is a global list of the undo logs for committed transactions. MySQL uses the history list to purge records and log pages when transactions no longer require the history.  If the InnoDB history list length grows too large, indicating a large number of old row versions, queries and even the database shutdown process can become slower.

DevOps Guru for RDS now detects when the history list length exceeds 1 million records and alerts users to close (either by commit or by rollback) any unnecessary long-running transactions before triggering database changes that involve a shutdown (this includes reboots and database version upgrades).

From the DevOps Guru console, navigate to Insights, choose Proactive, then choose “RDS InnoDB History List Length Anomalous” Proactive Insight with an ongoing status. You will notice that Proactive Insights provides an “Insight overview”, “Metrics” and “Recommendations”.

Insight overview provides you basic information on this insight. In our case, the history list for row changes increased significantly, which affects query and shutdown performance.

Long InnoDB History for Aurora MySQL-Compatible engines Insight overview

Figure 3. Long InnoDB History for Aurora MySQL-Compatible engines Insight overview.

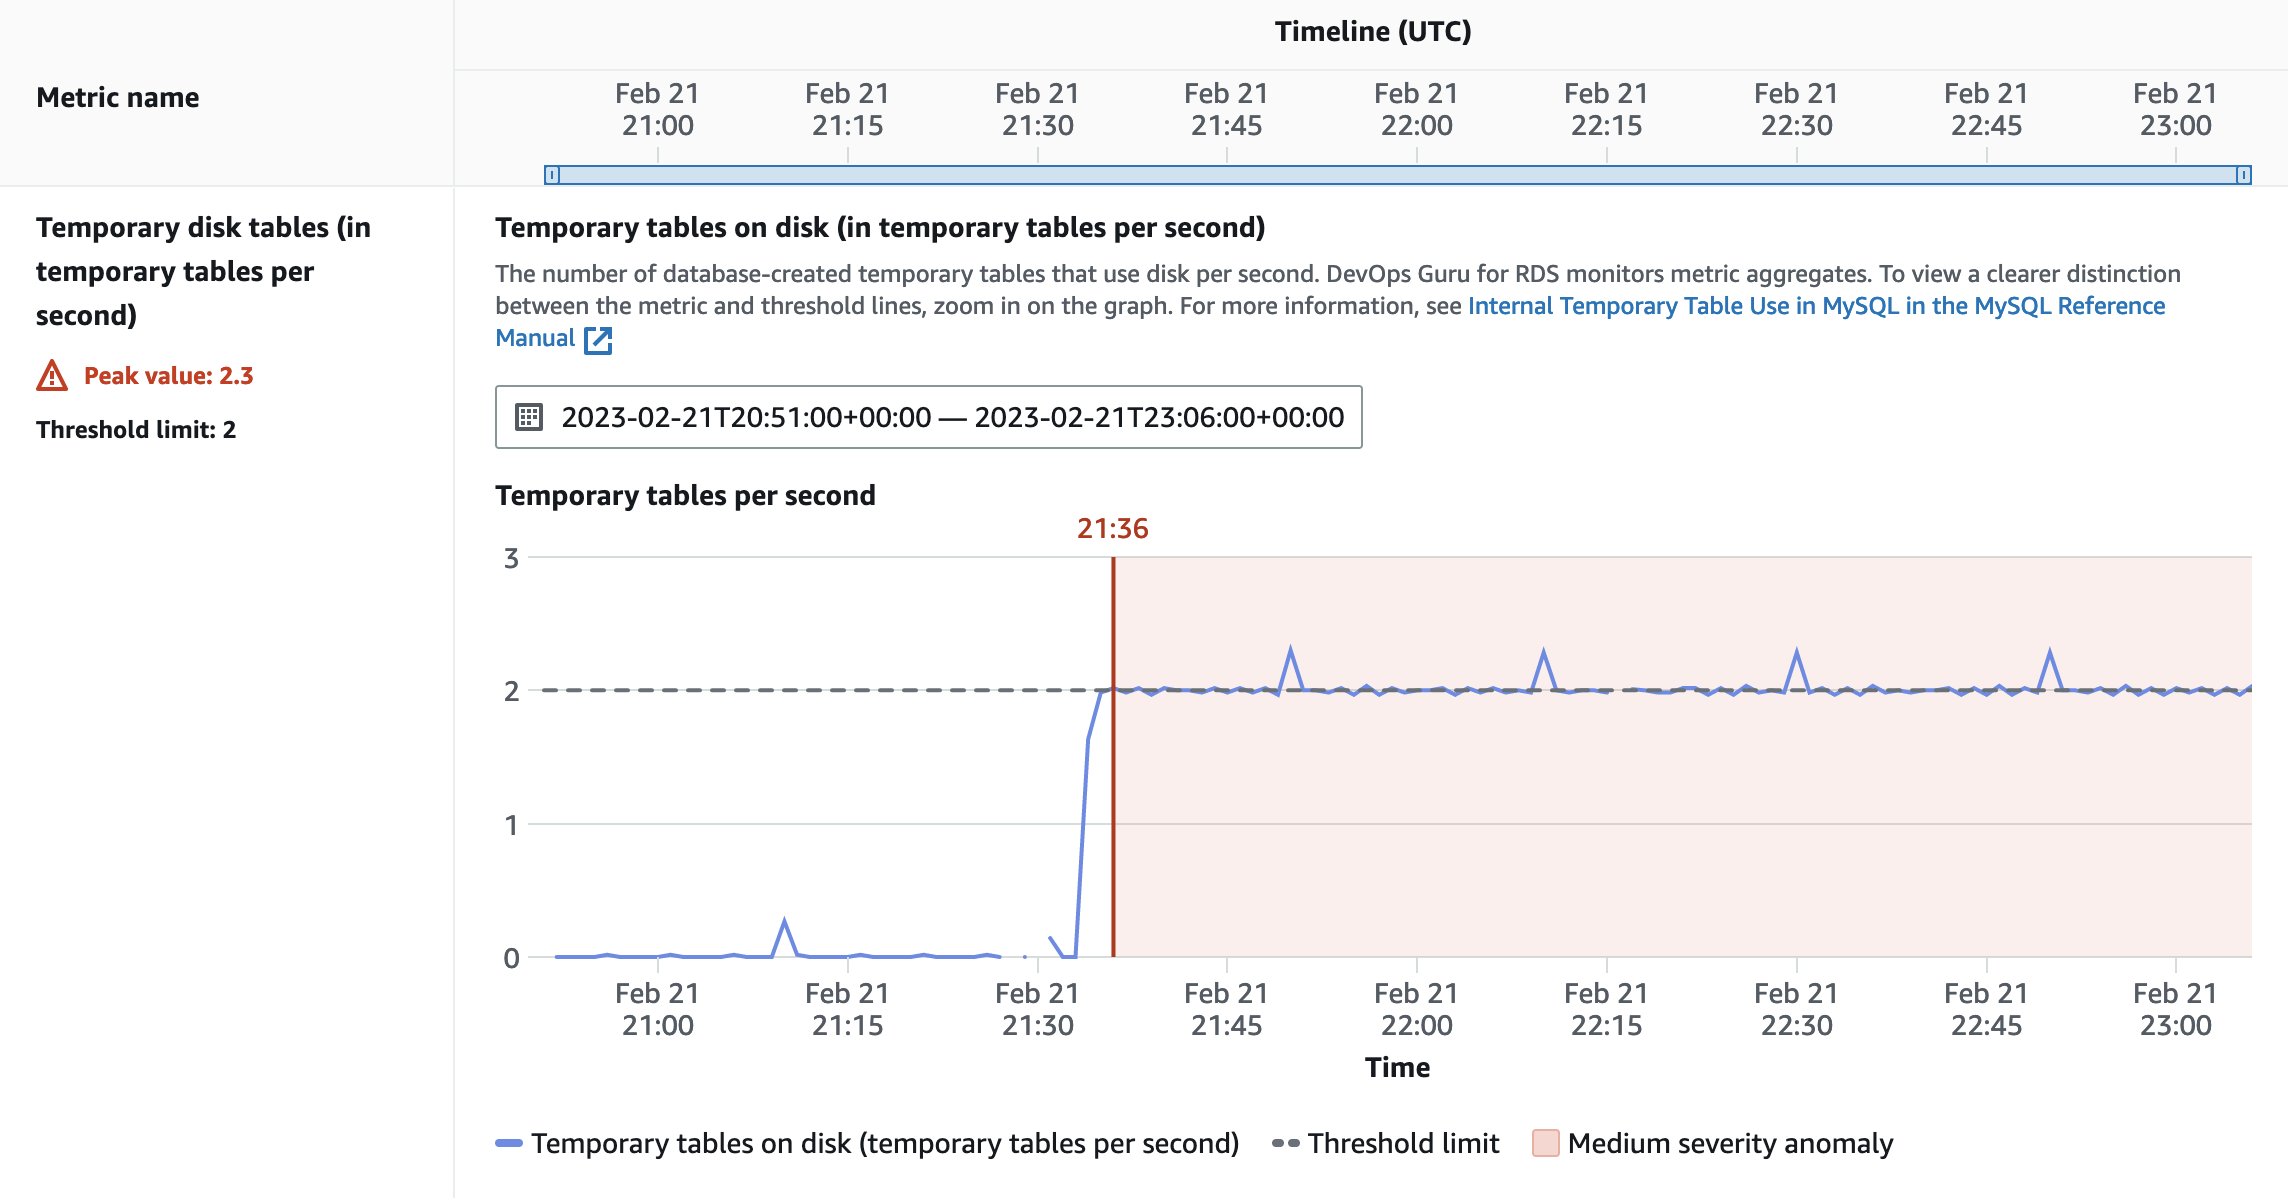
The Metrics panel gives you a graphical representation of the history list length and the timeline, allowing you to correlate it with any anomalous application activity that may have occurred during this window.

Long InnoDB History for Aurora MySQL-Compatible engines Metrics panel

Figure 4. Long InnoDB History for Aurora MySQL-Compatible engines Metrics panel.

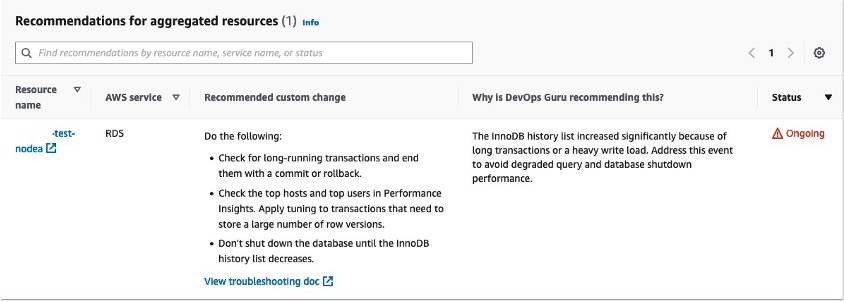
The Recommendations section suggests actions that you can take to mitigate this issue before it leads to a bigger problem. You will also notice the rationale behind the recommendation under the “Why is DevOps Guru recommending this?” column.

The Recommendations section suggests actions that you can take to mitigate this issue before it leads to a bigger problem

Figure 5. The Recommendations section suggests actions that you can take to mitigate this issue before it leads to a bigger problem.

Temporary tables created on disk for Aurora MySQL-Compatible engines

Sometimes it is necessary for the MySQL database to create an internal temporary table while processing a query. An internal temporary table can be held in memory and processed by the TempTable or MEMORY storage engine, or stored on disk by the InnoDB storage engine. An increase of temporary tables created on disk instead of in memory can impact the database performance.

DevOps Guru for RDS now monitors the rate at which the database creates temporary tables and the percentage of those temporary tables that use disk. When these values cross recommended levels over a given period of time, DevOps Guru for RDS creates an insight exposing this situation before it becomes critical.

From the DevOps Guru console, navigate to Insights, choose Proactive, then choose “RDS Temporary Tables On Disk Anomalous” Proactive Insight with an ongoing status. You will notice this Proactive Insight provides an “Insight overview”, “Metrics” and “Recommendations”.

Insight overview provides you basic information on this insight. In our case, more than 58% of the total temporary tables created per second were using disk, with a sustained rate of two temporary tables on disk created every second, which indicates that query performance is degrading.

Temporary tables created on disk insight overview

Figure 6. Temporary tables created on disk insight overview.

The Metrics panel shows you a graphical representation of the information specific for this insight. You will be presented with the evolution of the amount of temporary tables created on disk per second, the percentage of temporary tables on disk (out of the total number of database-created temporary tables), and of the overall rate at which the temporary tables are created (per second).

Temporary tables created on disk evolution of the amount of temporary tables created on disk per second

Figure 7. Temporary tables created on disk – evolution of the amount of temporary tables created on disk per second.

Temporary tables created on disk the percentage of temporary tables on disk (out of the total number of database-created temporary tables)

Figure 8. Temporary tables created on disk – the percentage of temporary tables on disk (out of the total number of database-created temporary tables).

Temporary tables created on disk overall rate at which the temporary tables are created (per second)

Figure 9. Temporary tables created on disk – overall rate at which the temporary tables are created (per second).

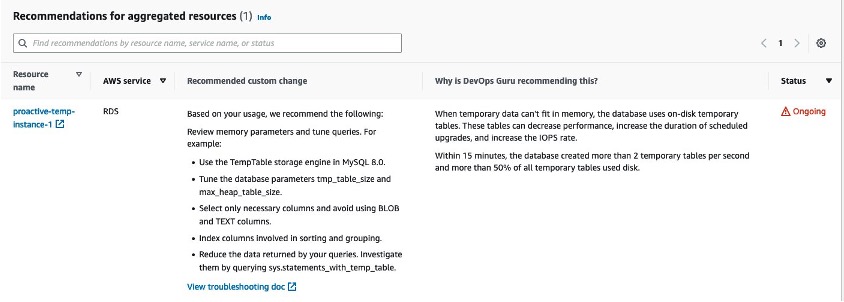
The Recommendations section suggests actions to avoid this situation when possible, such as not using BLOB and TEXT data types, tuning tmp_table_size and max_heap_table_size database parameters, data set reduction, columns indexing and more.

Temporary tables created on disk actions to avoid this situation when possible, such as not using BLOB and TEXT data types, tuning tmp_table_size and max_heap_table_size database parameters, data set reduction, columns indexing and more

Figure 10. Temporary tables created on disk – actions to avoid this situation when possible, such as not using BLOB and TEXT data types, tuning tmp_table_size and max_heap_table_size database parameters, data set reduction, columns indexing and more.

Additional explanations on this use case can be found by clicking on the “View troubleshooting doc” link.

Idle In Transaction for Aurora PostgreSQL-Compatible engines

A connection that has been idle in transaction  for too long can impact performance by holding locks, blocking other queries, or by preventing VACUUM (including autovacuum) from cleaning up dead rows.
PostgreSQL database requires periodic maintenance, which is known as vacuuming. Autovacuum in PostgreSQL automates the execution of VACUUM and ANALYZE commands. This process gathers the table statistics and deletes the dead rows. When vacuuming does not occur, this negatively impacts the database performance. It leads to an increase in table and index bloat (the disk space that was used by a table or index and is available for reuse by the database but has not been reclaimed), leads to stale statistics and can even end in transaction wraparound (when the number of unique transaction ids reaches its maximum of about two billion).

DevOps Guru for RDS monitors the time spent by sessions in an Aurora PostgreSQL database in idle in transaction state and raises initially a warning notification, followed by an alarm notification if the idle in transaction state continues (the current thresholds are 1800 seconds for the warning and 3600 seconds for the alarm).

From the DevOps Guru console, navigate to Insights, choose Proactive, then choose “RDS Idle In Transaction Max Time Anomalous” Proactive Insight with an ongoing status. You will notice this Proactive Insights provides an “Insight overview”, “Metrics” and “Recommendations”.

In our case, a connection has been in “idle in transaction” state for more than 1800 seconds, which could impact the database performance.

A connection has been in “idle in transaction” state for more than 1800 seconds, which could impact the database performance

Figure 11. A connection has been in “idle in transaction” state for more than 1800 seconds, which could impact the database performance.

The Metrics panel shows you a graphical representation of when the long-running “idle in transaction” connections started.

The Metrics panel shows you a graphical representation of when the long-running “idle in transaction” connections started

Figure 12. The Metrics panel shows you a graphical representation of when the long-running “idle in transaction” connections started.

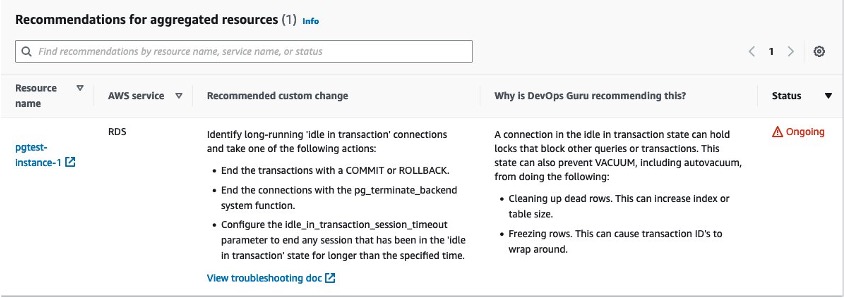
As with the other insights, recommended actions are listed and a troubleshooting doc is linked for even more details on this use case.

Recommended actions are listed and a troubleshooting doc is linked for even more details on this use case

Figure 13. Recommended actions are listed and a troubleshooting doc is linked for even more details on this use case.

Conclusion

With Proactive Insights, DevOpsGuru for RDS enhances its abilities to help you monitor your databases by notifying you about potential operational issues, before they become bigger problems down the road. To get started, you need to ensure that you have enabled Performance Insights on the database instance(s) you want monitored, as well as ensure and confirm that DevOps Guru is enabled to monitor those instances (for example by enabling it at account level, by monitoring specific CloudFormation stacks or by using AWS tags for specific Aurora resources). Proactive Insights is available in all regions where DevOps Guru for RDS is supported. To learn more about Proactive Insights, join us for a free hands-on Immersion Day (available in three time zones) on March 15th or April 12th.

About the authors:

Kishore Dhamodaran

Kishore Dhamodaran is a Senior Solutions Architect at AWS.

Raluca Constantin

Raluca Constantin is a Senior Database Engineer with the Relational Database Services (RDS) team at Amazon Web Services. She has 16 years of experience in the databases world. She enjoys travels, hikes, arts and is a proud mother of a 12y old daughter and a 7y old son.

Jonathan Vogel

Jonathan is a Developer Advocate at AWS. He was a DevOps Specialist Solutions Architect at AWS for two years prior to taking on the Developer Advocate role. Prior to AWS, he practiced professional software development for over a decade. Jonathan enjoys music, birding and climbing rocks.

New InsightCloudSec Compliance Pack: Key Takeaways From the Azure Security Benchmark V3

Post Syndicated from James Alaniz original https://blog.rapid7.com/2023/03/01/new-insightcloudsec-compliance-pack-key-takeaways-from-the-azure-security-benchmark-v3/

New InsightCloudSec Compliance Pack: Key Takeaways From the Azure Security Benchmark V3

Implementing the proper security policies and controls to keep cloud environments, and the applications and sensitive data they host secure, is a daunting task for anyone. It’s even more of a challenge for folks that are just getting started on their journey to the cloud, and for teams that lack hands-on experience securing dynamic, highly-ephemeral cloud environments.

To reduce the learning curve for teams ramping up their cloud security programs, cloud providers have curated sets of security controls, including recommended resource configurations and access policies to provide some clarity. While these frameworks may not be the be-all-end-all—because let’s face it, there is no silver bullet when it comes to securing these environments—they are a really great place to start as you define and implement the standards that are right for your business. In a recent post, we covered some highlights within the AWS Foundational Security Best Practices, so be sure to check that out in case you missed it.

Today, we’re going to dive into the new Azure Security Benchmark V3, and identify some of the controls that we view as particularly impactful. Let’s dig in.

How does Azure Security Benchmark V3 differ from AWS Foundational Security Best Practices?

Before we get started with some specifics from the Azure Security Benchmark, it’s probably worthwhile to highlight some key similarities and differences between the Microsoft and AWS benchmarks.

The AWS Foundational Security Best Practices are, as one might intuitively expect, focused solely on AWS environments. These best practices provide prescriptive guidance around how a given resource or service should be configured to mitigate the risks of security incidents. Because the recommendations are so prescriptive and targeted, users are able to leverage AWS Config—a native service provided by AWS to assess resource configurations—to ensure the recommended configuration is utilized.

Much like the AWS Foundational Security Best Practices, the Azure Security Benchmark is a set of guidelines and recommendations provided by Microsoft to help organizations establish a baseline for what “good” looks like in terms of effective cloud security controls and configurations. However, where AWS’s guidelines are laser-focused on AWS environments, Microsoft has taken a cloud-agnostic approach, with higher-level security principles that can be applied regardless of which platform you select to run your mission-critical workloads. This approach makes quite a bit of sense given AWS and Microsoft’s respective go-to-market strategies and target customer bases. It also means implementation of these recommendations requires a slightly different approach.

As noted above, the guidance in the Azure Security Benchmark isn’t tied to Azure specifically, it’s more broad in nature and speaks to general approaches and themes. For example,it recommends that you use encryption and proper key management hygiene, as opposed to specifying a granular resource or service configuration. That’s not to say that Microsoft hasn’t provided any Azure-specific guidance, as many of the guidelines are accompanied by step-by-step instructions as to how you can implement them in your Azure environment. As AWS has provided checks within AWS Config, Azure has similarly provided checks within Defender for Cloud that help ensure your environment is configured in accordance with the benchmark recommendations.

Five recommendations from the Azure Security Benchmark V3 we find particularly impactful

Now that we’ve compared the benchmarks, let’s take a look at some of the recommendations provided within the Azure Security Benchmark V3 that we find particularly impactful for hardening your cloud security posture.

NS-2: Secure cloud services with network controls

This recommendation focuses on securing cloud services by establishing a private access point for the resources. Additionally, you should be sure to disable or restrict access from public networks (when possible) to avoid unwanted access from folks outside of your organization.

DP-3, 4 & 5: Data Protection and Encryption At Rest and In Transit

These recommendations are focused on ensuring proper implementation of data security controls, most notably via encryption for all sensitive data, whether in transit or at rest. Data should be encrypted at rest by default, and teams should use the option for customer-managed keys whenever required.

DP-8: Ensure Security of Key and Certificate Repository

Another Data Protection control, this recommendation is centered on proper hardening of the key vault service. Teams should ensure the security of the key vault service used for the cryptographic key and certificate lifecycle management. Key vault service hardening can be accomplished through a variety of controls, including identity and access, network security, logging and monitoring, and backup.

PA-1: Separate and Limit Highly Privileged/Administrative Users

Teams should ensure all business-critical accounts are identified and should apply limits to the number of privileged or administrative accounts in your cloud’s control plane, management plane, and data/workload plane. Additionally, you should restrict privileged accounts in other management, identity, and security systems that have administrative access to your assets, such as tools with agents installed on business-critical systems that could be weaponized.

LT-1: Enable Threat Detection Capabilities for Azure Resources

This one is fairly self-explanatory, but focuses on ensuring you are monitoring your cloud environment for potential threats. Whether or not you’re using native services provided by your cloud provider of choice—such as Azure Defender for Cloud or Azure Sentinel—you should leverage a cloud detection and response tool that can monitor resource inventory, configurations, and user activity in real time to identify anomalous activity across your environment.

Implement and enforce Azure Security Benchmark V3 with InsightCloudSec

New InsightCloudSec Compliance Pack: Key Takeaways From the Azure Security Benchmark V3

InsightCloudSec allows security teams to establish and continuously measure compliance against organizational policies, whether they’re based on service provider best practices like those provided by Microsoft, a common industry framework, or a custom pack tailored to specific business needs.

A compliance pack within InsightCloudSec is a set of checks that can be used to continuously assess your cloud environments for compliance with a given regulatory framework, or industry or provider best practices. The platform comes out of the box with 30+ compliance packs, including a dedicated pack for the Azure Security Benchmark V3.

InsightCloudSec continuously assesses your entire cloud environment—whether that’s a single Azure environment or across multiple platforms—for compliance with best practice recommendations, and detects noncompliant resources within minutes after they are created or an unapproved change is made. If you so choose, you can make use of the platform’s native, no-code automation to remediate the issue—either via deletion or by adjusting the configuration or permissions—without any human intervention.

If you’re interested in learning more about how InsightCloudSec helps continuously and automatically enforce cloud security standards, be sure to check out the demo!

Active Exploitation of ZK Framework CVE-2022-36537

Post Syndicated from Stephen Fewer original https://blog.rapid7.com/2023/03/01/etr-active-exploitation-of-zk-framework-cve-2022-36537/

Active Exploitation of ZK Framework CVE-2022-36537

Emergent threats evolve quickly, and as we learn more about this vulnerability, this blog post will evolve, too.

Rapid7 is aware of active exploitation of CVE-2022-36537 in vulnerable versions of ConnectWise R1Soft Server Backup Manager software. The root cause of the vulnerability is an information disclosure flaw in ZK Framework, an open-source Java framework for creating web applications. ConnectWise uses ZK Framework in its popular R1Soft and Recovery products; the vulnerability is being used for remote code execution and the installation of malicious drivers that function as backdoors. After initial access is obtained, attackers have reportedly been able to execute commands on all systems running the agent connected to the R1Soft server.

The advisory and NVD entry for CVE-2022-36537 indicate that ostensibly, the flaw is merely an information disclosure vulnerability. Rapid7 believes this categorization significantly downplays the risk and the impact of CVE-2022-36537 and should not be used as a basis for lower prioritization.

Overview

In May 2022, software company Potix released an update to ZK Framework, an open-source Java framework used to create enterprise web and mobile applications in pure Java. The update addressed CVE-2022-36537, which had been reported to Potix by Code White GmbH’s Markus Wulftange. The vulnerability arises from an issue in ZK Framework’s AuUploader component that allows an attacker to forward a HTTP request to an internal URI. Successful exploitation allows an attacker to obtain sensitive information or target an endpoint that might otherwise be unreachable. Since ZK Framework is a library, CVE-2022-36537 is likely to affect a range of other products in addition to the core framework itself.

In October 2022, security firm Huntress published a blog on a Lockbit 3.0 ransomware incident that included exploitation of CVE-2022-36537 in ConnectWise R1Soft Server Backup Manager software. Threat actors exploited the vulnerability to bypass authentication, deployed a malicious JDBC database driver that allowed for arbitrary code execution, and finally used the REST API to send commands to registered agents—commands that instructed the agents to push ransomware to downstream systems. The malicious JDBC driver also functions as a backdoor into compromised systems.

On February 22, 2023, the NCC Group’s FOX IT team published a similar account of an incident where they had observed threat actors exploiting CVE-2022-36537 against ConnectWise R1Soft servers as far back as November 29, 2022. According to FOX IT’s research, several hundred R1Soft servers were backdoored as of January 2023, of which more than 140 remain compromised. They have a full account of the attack chain and a list of IOCs here.

FOX IT said that the adversary used R1Soft “as both an initial point of access and as a platform to control downstream systems connected via the R1Soft Backup Agent. This agent is installed on systems to support being backed up by the R1Soft server software and typically runs with high privileges. This means that after the adversary initially gained access via the R1Soft server software it was able to execute commands on all systems running the agent connected to this R1Soft server.”

Shodan reports 3,643 instances of ConnectWise R1Soft Server Backup Manager as of March 1, 2023. Multiple public proof-of-concept (PoC) exploits are available dating back to December 2022. On February 27, 2023, the U.S. Cybersecurity and Infrastructure Security Agency (CISA) added CVE-2022-36537 to its Known Exploited Vulnerabilities (KEV) list and published a warning that “This type of vulnerability is a frequent attack vector for malicious cyber actors and poses a significant risk to the federal enterprise.”  

As mentioned above, the primary advisory and NVD entry for CVE-2022-36537 both note that the core vulnerability in ZK Framework is an information disclosure flaw (hence the 7.5 CVSSv3 score). In the context of ConnectWise R1Soft, however, the impact of the flaw is remote code execution, not merely information disclosure.

The public PoCs include code that uses the vulnerability to leak the contents of the file /Configuration/database-drivers.zul and expose a unique ID value that is intended to be secret. Once the attacker has this ID value, they can exploit the vulnerability once more to reach an otherwise inaccessible endpoint and upload the malicious database driver.

Affected products

ZK Framework (core)

All versions of ZK Framework from 9.6.1 and below are vulnerable to CVE-2022-36537. Potix released version 9.6.2 to fix this issue on May 4, 2022, alongside several hotfixes for earlier branches (9.6.0, 9.5.1, 9.0.1, and 8.6.4).

Fixed versions of ZK Framework are:

  • 9.6.2
  • 9.6.0.2 (security release)
  • 9.5.1.4 (security release)
  • 9.0.1.3 (security release)
  • 8.6.4.2 (security release)

Workarounds are available, but as always, we strongly recommend applying patches. See Potix’s advisory for further details on affected ZK Framework versions.

ConnectWise products

According to ConnectWise’s advisory, CVE-2022-36537 affects the following products and versions:

  • ConnectWiseRecover v2.9.7 and earlier versions are vulnerable
  • ConnectWise R1Soft Server Backup Manager (SBM): SBM v6.16.3 and earlier versions are vulnerable

ConnectWise R1Soft users should upgrade the server backup manager to SBM v6.16.4 released October 28, 2022 using the R1Soft upgrade wiki.

The advisory also indicates that “affected ConnectWise Recover SBMs have automatically been updated to the latest version of Recover (v2.9.9)” as of October 28, 2022.

Mitigation guidance

ConnectWise R1Soft Server Backup Manager users should update their R1Soft installations to a fixed version (v6.16.4) on an emergency basis, without waiting for a regular patch cycle to occur, and examine their environments for signs of compromise. Both Huntress and FOX IT have information on observed indicators of compromise.

ZK Framework users should likewise update to a fixed version immediately, without waiting for a regular patch cycle to occur. As with many library vulnerabilities, assessing exposure may be complex. It’s likely there are additional applications that implement ZK Framework; downstream advisories may include other information about ease or impact of exploitation.

Since ConnectWise R1Soft appears to be the primary vector for known attacks as of March 1, 2023, we strongly advise prioritizing those patches.

Rapid7 customers

Our researchers are currently evaluating the feasibility of adding a vulnerability check for InsightVM and Nexpose.

Godot 4.0 released

Post Syndicated from original https://lwn.net/Articles/924814/

The waiting is done; version
4.0
of the Godot game engine has been released.

4 years of development. 12,000 merged pull requests. 7,000 fixed
issues. 1,500 individual contributors across engine and docs.

The Godot 4.0 release is by all metrics our biggest release so far.
No stone has been left unturned, all parts of the engine have been
modernized, refactored, overhauled, rewritten, redesigned.

See the
release notes
for more information.

Considerations for the security operations center in the cloud: deployment using AWS security services

Post Syndicated from Stuart Gregg original https://aws.amazon.com/blogs/security/considerations-for-the-security-operations-center-in-the-cloud-deployment-using-aws-security-services/

Welcome back. If you’re joining this series for the first time, we recommend that you read the first blog post in this series, Considerations for security operations in the cloud, for some context on what we will discuss and deploy in this blog post. In the earlier post, we talked through the different operating models (centralized, decentralized, or hybrid) that you can deploy for a Security Operations Center (SOC) function when you operate in the cloud. We covered the advantages of each model and some of the potential drawbacks you might see when you start to scale up operations within the cloud.

This post will focus on the Amazon Web Services (AWS) native security service, AWS Security Hub, that you can use to deploy in different SOC operating models. AWS Security Hub is a cloud security posture management service that SOC teams can use to perform security best practice checks and aggregate alerts. AWS Security Hub accepts findings from multiple sources, whether native to AWS, from the pre-built integrations, or from your own sources converted into the AWS Security Finding Format (ASFF). The data collected in Security Hub facilitates response and remediation actions.

Although the models we describe here use services that are native to AWS, the reference architectures that correspond to each operating model can be applied to a variety of deployments, including multi-cloud and traditional on-premises deployments. The majority of this post will focus on the decentralized and hybrid models—the centralized model is well documented and has reference architectures already available for you today.

Each organization is different, and no one operating model will fit everyone. You should choose the model that works best for your organizational landscape, with an understanding that the landscape will change and evolve over time. Using feedback loops and being open to change is important to help you meet the continued needs of your business. Additional factors to consider include, but are not limited to: staff skills, compliance requirements, previous operating model, and budget.

The centralized model

The centralized operating model for the SOC is well documented and frequently discussed, both at AWS and in the security community. According to AWS best practices, typically you designate a central security tooling account that is dedicated to operating security services, monitoring AWS accounts, and automating security alerting and response. The security tooling account serves as the administrator account for security services that are managed in an administrator/member structure across your AWS accounts. The key objectives for establishing a security tooling account are the following:

  • Provide a dedicated enclave with controlled access for managing security guardrails, monitoring, and response.
  • Maintain the appropriate centralized security infrastructure to monitor security operations data and maintain traceability across the security lifecycle.

Figure 1 demonstrates the variety of AWS security services that you can deploy in the central security account. For example, Security Hub within the security tooling account can act as the administrator to enable Security Hub in the member accounts, as well as view findings, view insights, and set security standards across member accounts, which can help simplify security posture management across your existing and future accounts.

Figure 1: Reference architecture for the security tooling account in a centralized model

Figure 1: Reference architecture for the security tooling account in a centralized model

As mentioned earlier, you can enable Security Hub to administer and enable member accounts. This is achieved by using AWS Organizations and the delegated administrator functionality. In addition, you can use Security Hub cross-Region aggregation within the delegated administrator account to aggregate findings, finding updates, insights, control compliance statuses, and security scores from multiple Regions to a single aggregation Region. You can then manage this data from the aggregation Region. Figure 2 shows the reference architecture for this functionality.

Figure 2: Reference architecture for Security Hub in the delegated administrator model

Figure 2: Reference architecture for Security Hub in the delegated administrator model

The AWS Security Reference Architecture (AWS SRA) is a great starting point for establishing the centralized security operations model. The AWS SRA is a holistic set of guidelines for deploying the full complement of AWS security services in a multi-account environment. You can use it to help design, implement, and manage AWS security services so that they align with AWS best practices. The AWS SRA’s Security Hub Organization solution provides deployable templates and examples that automate the process of enabling Security Hub by delegating administration to an account and configuring Security Hub for the existing and future AWS Organizations accounts.

The decentralized and hybrid models

As mentioned in Considerations for security operations in the cloud, the decentralized and hybrid SOC models provide many benefits for organizations. The flexibility of these operating models allows organizational units (OUs) to control how they deal with security-related incidents while still having organization-wide visibility into security posture. This flexibility is important as organizations start to scale up activities within the cloud.

The reference architecture in Figure 3 shows how the benefits we discussed in our earlier blog post can be architected in the decentralized and hybrid operating models in the AWS Cloud.

Figure 3: Reference architecture for the decentralized and hybrid operating models in AWS

Figure 3: Reference architecture for the decentralized and hybrid operating models in AWS

The key features of this architecture are as follows:

  1. The organization root account is separate, according to AWS Organizations best practices. By using service control policies (SCPs), the root account can still achieve a level of governance across the business.
  2. Dedicated accounts have been created for each OU for the Security Hub administration. The model we will use for this deployment is the invite model. In this reference architecture and as an example, we’re using Amazon GuardDuty to flow findings into Security Hub. When you use this model, each OU can manage findings for that OU. This gives you flexibility to work from the Security Hub admin with full visibility of the OU and accounts associated with that OU, or to work in each member account and view findings for that account only.
  3. (Optional, for use with the hybrid model) Each OU’s Security Hub member accounts first send events to their Security Hub admin account. The Security Hub admin account will then send events for that OU to the local Amazon EventBridge bus. You can then set up rules to forward events to a central EventBridge bus in a dedicated AWS account. In the architecture in Figure 3, this account is named SecAnalytics. This step will follow a similar flow as the one described in this AWS Cloud Operations & Migrations blog post.
  4. (Optional, for use with the hybrid model) After the OUs have sent data to the central bus, you can use a capability similar to the one in this AWS Architecture Blog post to start organizing the findings and gain organization-wide visibility. The solution in the earlier post used Amazon QuickSight to visualize the data, but you can use another tool or pre-existing data pipeline.

Items 3 and 4 labeled with (Optional) are capabilities that enable the hybrid model; these are not required if you only want to enable the decentralized model.

Considerations for all deployments

Keep the following considerations in mind for all deployments:

  • Steady state operations should be considered for whichever model you deploy in. For the centralized model, you can use functionality within AWS Organizations to automatically enable Security Hub for accounts within the organization. In the decentralized and hybrid models, you will need to build out this capability or use a similar capability as described in this repo.
  • Alert fatigue happens when humans work on the same repetitive tasks’ day in and day out. To help reduce this, within the reference architecture and solution overview, we’ve added the capability described in this Security Blog post to automatically suppress findings based on criteria set by you. For the centralized model, you can add this capability in the delegated admin account for Security Hub. For the decentralized and hybrid models, we recommend that you put the auto-suppression capability in the Security Hub admin account, and then centralize the rules for suppression for that OU at the Security Hub admin level. This will reduce the overhead for deploying suppression rules multiple times and give a single location where rules are placed for that OU.
  • Context is key. Within the reference architecture and solution overview for decentralized and hybrid deployments, we’ve added the capability described in this Security Blog post. This capability will add additional context, such as the account name, the OU associated with the account, security contact information, and account tags. This information is pulled from AWS Organizations to enrich Security Hub findings. This additional context can also be used in the centralized model.

Deploy the decentralized and hybrid models

In this section, we’ll walk you through the deployment that reflects the reference architecture for the decentralized and hybrid models. Figure 4 shows the solution architecture, including the solution that needs to be deployed in the Security Hub admin account and in the aggregation Region for each business unit within the organization. The solution provides the capability to suppress Security Hub findings, enrich the findings, and propagate findings to central security accounts.

Figure 4: Reference architecture for the decentralized and hybrid deployment

Figure 4: Reference architecture for the decentralized and hybrid deployment

The solution architecture consists of the following:

  • An EventBridge rule to invoke a Lambda function (Suppression Lambda) as the target to suppress any findings based on specific generator IDs within specific member accounts.

    Note: The Security Hub Generator IDs and AWS Account IDs in the EventBridge rule are left as placeholders so that you can fill based on your needs.

  • An EventBridge rule to invoke a Lambda function (Enrichment Lambda) as the target to enrich the findings with AWS account and OU related metadata, along with alternate contact information to better prioritize the findings. The API calls to AWS Organizations and AWS account management services are optimized by caching the metadata in an Amazon DynamoDB table with a time-to-live (TTL) value of 24 hours.
  • An EventBridge rule to post the enriched findings that were not suppressed to a custom EventBridge event bus in the organization-level Security Tooling/SecAnalytics account.

Prerequisites

The following are the prerequisites for this deployment:

  • AWS Organizations is utilized across the business. In this scenario, AWS Organizations will be used to group AWS accounts into OUs, as well as to provide enrichment data for Security Hub findings.
  • Alternative contacts for AWS accounts have been filled out with the most up-to-date information. This is a best practice recommendation. This information will be used for enrichment of the Security Hub findings.
  • Your organization already has a pipeline in place for indexing Security Hub findings and visualizing them.
  • Security Hub is set up in the invite model. OU-level Security Hub accounts have been invited and accepted to be managed by the OU-level Security Hub admin account.
  • The grouping of findings across multiple OU-level Security Hub admin accounts uses Amazon EventBridge to forward events to a centralized bus. You should have the event bus set up ready for this deployment.

Deploy the solution

This solution deployment consists of two parts:

  1. Create an IAM role in your Organizations management account that allows BU-level Security Hub admin to access account metadata, as described in the Create the IAM role procedure that follows.
  2. Deploy the Enrichment Lambda function, the Suppression Lambda function, and the associated EventBridge event rules within the BU-level Security Hub administrator account.

Create the IAM role

Follow the instructions in Creating a role to delegate permissions to an IAM user to create an IAM role by using the IAM console, AWS Command Line Interface (AWS CLI), or AWS API. Create the role in the AWS Organizations management account with the role name as account-contact-readonly, based on the following trust and permission policy templates. You will need the account ID of your BU-level Security Hub administrator account.

The IAM trust policy allows the Security Hub administrator account to assume the role in your Organizations management account.

Note: The following trust policy shows only one BU Security admin account. You will need to add all BU Security admin accounts to the trust policy.

IAM role trust policy

{
   "Version": "2012-10-17",
   "Statement": [
     {
       "Effect": "Allow",
       "Principal": {
         "AWS": "arn:aws:iam::<BU SecHubAdmin Account ID>:root"
       },
       "Action": "sts:AssumeRole",
       "Condition": {}
     }
   ]
 }

Note: Replace <BU SecHubAdmin Account ID> with the account ID of your decentralized BU-level Security Hub administrator account. After the solution is deployed, you should update the principal in the preceding trust policy to use the new IAM role created for the solution.

IAM permission policy

{
     "Version": "2012-10-17",
     "Statement": [
         {
            "Action": "Account:GetAlternateContact",
            "Resource": [
                "arn:aws:account::<Org Management Account ID>:account/o-*/*"
            ],
            "Effect": "Allow"
        },
        {
            "Action": [
                "organizations:DescribeAccount",
                "organizations:ListTagsForResource",
                "organizations:DescribeOrganizationalUnit",
                "organizations:ListParents"
            ],
            "Resource": [
                "arn:aws:organizations::<Org Management Account ID>:account/o-*/*",
                "arn:aws:organizations::<Org Management Account ID>:ou/o-*/ou-*"
            ],
            "Effect": "Allow"
        }
     ]
 }

The IAM permission policy allows the Security Hub administrator account to look up the alternate contact information for the member accounts.

Make a note of the role Amazon Resource Name (ARN) for the IAM role, which will be similar to this format:
arn:aws:iam::<Org Management Account ID>:role/account-contact-readonly.

You will need this ARN when you deploy the solution in the next procedure.

Use AWS CloudFormation to create the IAM role

Alternatively, you can use the CloudFormation template we provide in our GitHub repository to create the role in the management account. The IAM role ARN is available in the Outputs section of the created CloudFormation stack.

Deploy the solution to your BU-level Security Hub administrator account

After you have the IAM role created, you can deploy the solution either from the AWS Management Console, or from our GitHub repository by using the AWS SAM CLI.

Note: If you’ve designated an aggregation Region within the BU-level Security Hub administrator account, you can deploy this solution only in the aggregation Region. Otherwise, you need to deploy this solution separately in each Region of the BU-level Security Hub administrator account where Security Hub is enabled.

To deploy the solution by using the AWS Management Console

  1. In your Security Hub administrator account, launch the template by choosing the following Launch Stack button, which creates the stack the in us-east-1 Region.

    Launch Stack stack

    Note: If your Security Hub aggregation Region is different than us-east-1 or you want to deploy the solution in a different AWS Region, you can deploy the solution from the GitHub repository described in the next section.

  2. On the Quick create stack page, for Stack name, enter a unique stack name for this account; for example, aws-security-hub-decentralized-deployment-stack. 
     
    Figure 5: Quick create CloudFormation stack for the solution

    Figure 5: Quick create CloudFormation stack for the solution

  3. For SecurityToolingAccountEventBus, provide the EventBus ARN in the security tooling account to post the Security Hub findings from the BU-level Security Hub administrator account.
  4. For OrgManagementAccountContactRole, enter the role ARN of the role you created previously in the Create IAM role procedure.
  5. Choose Create stack.
  6. After the stack is created, go to the Resources tab and take note of the name of the IAM role that was created.
  7. Update the principal element of the IAM role trust policy that you previously created in the Organizations management account in the Create the IAM role procedure, replacing the existing value with the role name you noted down.

To deploy the solution from our GitHub repository and AWS SAM CLI

  1. Install the AWS SAM CLI.
  2. Download or clone the GitHub repository by using the following commands.

    git clone https://github.com/aws-samples/aws-securityhub-decentralized-operations-solution.git
    cd aws-securityhub-decentralized-operations-solution

  3. Update the content of the profile.txt file with the profile name you want to use for the deployment.
  4. To create a new bucket for deployment artifacts, run create-bucket.sh by specifying the Region as argument.

    $ ./create-bucket.sh us-east-1

  5. Deploy the solution to the account by running the deploy.sh script by specifying the Region as argument.

    $ ./deploy.sh us-east-1

  6. After the stack is created, go to the Resources tab and take note of the name of the IAM role that was created.
  7. Update the principal element of the IAM role trust policy that you previously created in the Organizations management account in the Create the IAM role procedure, replacing it with the role name you noted down.

    "AWS": "arn:aws:iam::<BU SH Delegated Account ID>: role/<Role Name>"

Note: The EventBridge rule to invoke the findings suppression Lambda function uses placeholders for the generator IDs and AWS account IDs. You need to update the EventBridge rule to meet your specific organizational requirements.

Further enhancements and conclusion

Beyond what is described in the decentralized and hybrid models, you can extend the solution to include the following aspects to meet your security operational needs:

  • In Considerations for security operations in the cloud, we spoke about the role of ChatOps. AWS Chatbot can enable OUs to set up rules to post notifications directly into chat rooms such as Amazon Chime or Slack. You can define rules to send only certain severity notifications or findings that are important to your OU to the chat room.
  • SCPs give organizations a level of control and governance. See this blog post for some best practices for deploying SCPs, as well as example policies that could be beneficial for your organization in any model you operate in.
  • We’ve performed testing of the decentralized and hybrid models in the reference architecture within one AWS Region. Although we don’t see any reason why this solution would not work in multiple Regions, if you do operate in multiple Regions you would need to deploy the CloudFormation template in each Region that you operate in. At this stage, you can keep findings within a Region or choose to centralize across multiple Regions by sending to the single central bus in Amazon EventBridge—the flexibility is yours.
  • The decentralized and hybrid models can also be extended if you operate in multiple organizations in AWS Organizations or have standalone accounts outside of your organization that you want to monitor. Interesting use cases could be in mergers and acquisitions scenarios, when newly acquired accounts need to be monitored to understand their posture before bringing them fully into the organization.

Throughout this two-part blog series, we’ve explored the role of the Security Operations Center (SOC) function, both traditionally in an on-premises environment and in the cloud. We’ve explored different operating models, from the traditional centralized deployment to the decentralized and hybrid models. We’ve also demonstrated, with reference architectures and deployable solutions, how you can achieve the different operating models in the AWS Cloud by using native AWS services. In the end, you should choose the model that works best for your environment and the security landscape you work in.

 
If you have feedback about this post, submit comments in the Comments section below. If you have questions about this post, contact AWS Support.

Want more AWS Security news? Follow us on Twitter.

Stuart Gregg

Stuart Gregg

Stuart enjoys providing thought leadership and being a trusted advisor to customers. In his spare time Stuart can be seen either training for an Ironman or snacking.

Author

Siva Rajamani

Siva is a Boston-based Enterprise Solutions Architect. He enjoys working closely with customers and supporting their digital transformation and AWS adoption journey. His core areas of focus are Serverless, Application Integration, and Security.

GitHub Actions: Introducing faster GitHub-hosted x64 macOS runners

Post Syndicated from Stephen Glass original https://github.blog/2023-03-01-github-actions-introducing-faster-github-hosted-x64-macos-runners/

Today, GitHub is releasing a public beta for all new, more powerful hosted macOS runners for GitHub Actions. Teams who are looking to speed up their macOS jobs now have new options to meet their needs.

Faster GitHub-hosted macOS runners

When developers use GitHub-hosted runners for GitHub Actions, GitHub is always working to give teams performance and flexibility to quickly build for different platforms. The new GitHub-hosted macOS runners are based on the most current x64 Apple hardware and reduce the time it takes to run your jobs. This means less time waiting on your CI and more time building and rapidly testing code.

In addition to the existing 3-core macOS hosted runners, we are also introducing a new “XL” size, 12-core macOS runner to allow you to pay for that extra performance when you need it. Increasing your runner size is as simple as changing a single line in your workflow file, making it super easy to speed up lagging builds, and with on-demand availability when you want it, you only pay for what you use.

PyTorch, the open source machine learning framework, has used the new runner to improve build times from 1.5 hours to 30 minutes!

If you’re already using the 3-core macOS runners, simply request to join the beta, and we’ll give you access to the hardware to our new fleet. To try the new 12-core runner runner, update the runs-on: key in your GitHub Actions workflow YAML to target the macos-12-xl or macos-latest-xl runner images once you’re in the beta.

The new macOS XL runner is always billed in both private and public repositories and so does not consume any of the free included GitHub Action minutes. To learn more about runner per job minute pricing, check out the docs.

Learn more and join the beta

To learn more about using the new macOS runner, check out the hosted runner docs.

Apple silicon is on the way!

We’ve started racking up and testing out Apple silicon-based machines in the hosted runner data centers. Follow this roadmap item to track progress. We hope to be offering a limited beta in CY2023 depending on hardware availability, but keep your eyes on the GitHub blog for more information.

Security updates for Wednesday

Post Syndicated from original https://lwn.net/Articles/924794/

Security updates have been issued by Debian (multipath-tools and syslog-ng), Fedora (gnutls and guile-gnutls), Oracle (git, httpd, lua, openssl, php, python-setuptools, python3.9, sudo, tar, and vim), Red Hat (kpatch-patch), Scientific Linux (git), SUSE (compat-openssl098, glibc, openssl, postgresql13, python-Django, webkit2gtk3, and xterm), and Ubuntu (awstats, expat, firefox, gnutls28, lighttpd, php7.2, php7.4, php8.1, python-pip, and tar).

Трансът на Върховния касационен съд

Post Syndicated from Светла Енчева original https://www.toest.bg/transut-na-vurhovniia-kasatsionien-sud/

Вместо увод: няколко терминологични уточнения

Трансът на Върховния касационен съд

Какво означава „транс“? С тази съставна част на думите се означава преминаване на някаква граница или на друго място – например трансатлантически полет или транснационална инициатива. В този смисъл „да изпаднеш в транс“ ще рече, че съзнанието се „пренася“ някъде другаде.

Трансхора пък са онези, чиято джендър идентичност не съответства на пола, с който са се родили, един вид – преминава „границата“ му. Трансмъжете са се родили като жени, но имат устойчива мъжка идентичност (често – от ранна детска възраст); при трансжените е обратното. В българските официални документи се използва терминът „транссексуалност“, макар че в строгия смисъл на думата транссексуалните са само част от трансхората – тези от тях, които променят пола си с хормони и/или операции.

Въпреки демонизирането на понятието „джендър“ в резултат на кампанията против Конвенцията на Съвета на Европа за превенция и борба с насилието над жени и домашното насилие, по-известна като Истанбулската конвенция (ИК), има смисъл то да се употребява и да се разграничава от „пол“. „Джендър“ са социалните и психологическите измерения на пола.

Пример: няма различия между половите признаци на жените в България и Афганистан, но първите имат право на образование, а вторите – не. Освен това едни и същи афганистанки доскоро са имали право на образование, а вече нямат, без нищо в биологията им да се е променило. Как едно общество разбира ролята (включително биологичната) на жената, е въпрос на джендър, не на пол.

Решението на Върховния касационен съд за трансхората накратко

В България е възможно трансчовек да смени пола си по документи, или поне беше повече от 30 години – до 20 февруари т.г. Възможността се предвижда в Закона за гражданската регистрация (чл. 75, ал. 5) и в Правилника за издаване на български лични документи (чл. 20, ал. 2, т. 4). А в Допълнителните разпоредби на Закона за защита от дискриминация изрично се казва, че в дискриминационния признак „пол“ се включват и случаите на промяна на пола (§ 1, т. 17). Тъй като обаче няма ясни правила какви са критериите, за да се допусне такава промяна, съдебната практика в това отношение е противоречива.

На 20 февруари Върховният касационен съд (ВКС) в свое тълкувателно решение отговори на въпроса: „Допустимо ли е и при какви предпоставки съдът да допусне по реда на Закона за гражданската регистрация промяна на данните в съставените актове за гражданско състояние на молител, който твърди, че е транссексуален?“

Краткият отговор на този въпрос според ВКС, е „не“, с което на практика съдът забрани юридическата смяна на пола:

Обективното материално право, действащо на територията на Република България, не предвижда възможност съдът да допусне в производството по реда на глава III, раздел VIII от Закона за гражданската регистрация промяна на данните относно пола, името и единния граждански номер в актовете за гражданско състояние на молител, който твърди, че е транссексуален.

Така смятат 28 от общо 49 съдии, а 21 са на обратната позиция и се подписват под особено мнение, в което мотивират несъгласието си. Според тях решението „трябва да бъде точно в противоположен смисъл. Съдът може да допусне правна промяна на пола на транссексуален човек, като съобрази характерните особености на всеки конкретен случай и наличието на баланс между обществените и личните интереси“.

Решението на ВКС не пада като гръм от ясно небе. Преди него беше Конституционният съд

На 27.07.2018 г. КС отсъди, че ИК противоречи на Конституцията на България, с аргумента, че понятието „джендър идентичност“ не съответства на „половата бинарност“, т.е. на разбирането, че съществуват само два пола. КС също заключи, че само биологичният пол е конституционен и социалната роля на жената е да бъде майка. Да се чуди човек защо конституционни съдийки, подписали се под решението, са станали такива, вместо само да раждат деца.

На 26.10.2021 г. КС постанови в духа на предишното си решение, че полът според Конституцията има единствено биологичен смисъл и няма социално или психологическо изражение, отделно от биологичното. Нищо че в Основния закон не се обяснява какво е пол (както впрочем и в ИК). В мотивите ставаше дума не за човешки права, а за семейство, традиции, религия, църква и бинарност на пола.

Ако след първото решение на КС съдилищата, които трябваше да се произнасят по дела за юридическа смяна на пола на транслица, започнаха да постановяват повече откази, то след второто отказите се увеличиха в още по-голяма степен.

Мисловните еквилибристики на ВКС

В двете си решения КС интерпретира както Конституцията, така и международни документи, които България е ратифицирала, доста фриволно спрямо съдържанието и духа им, но в унисон с доминиращата антиджендър реторика. ВКС не просто се съобразява с КС като с по-висша инстанция, а и надгражда интерпретативните му прийоми в опитите да подчини изцяло правото на личен живот на обществения интерес.

Тълкувайки решението на КС от 2021 г. например, ВКС буквално отменя статута на светска държава на България: понеже „ценностните разбирания на обществото“ са „формирани от религията и морала“ (а кой реши, че именно от това са формирани?), „налагането от страна на държавата на правни разрешения, намиращи се в колизия с установени морални и/или религиозни норми и принципи, би се характеризирало със спорна легитимност и би компрометирало регулативния им потенциал“.

За да останем в религиозната стилистика, ВКС тълкува и конвенциите за правата на човека, които България е ратифицирала, а също и практиките на Европейския съд за правата на човека, както дяволът чете евангелието. България бива съдена от Европейския съд за правата на човека (ЕСПЧ) отново и отново за случаи на отказ за смяна на пола, а едно от най-важните дела е „Я.Т. срещу България“. В същото време ВКС твърди, че тази тема е от компетентността на държавите членки на ЕС. Което е само частично вярно – държавите сами решават как точно да спазват човешките права, но са длъжни да ги спазват.

В особеното си мнение несъгласните с решението съдии посочват и абсурда в разбирането за „биологичен пол“ и на ВКС, и на КС:

Според общоупотребимия български език „биологичен“ означава „който е свързан с живота, с живите организми“. Нито българският съд, в продължение на повече от тридесет години, е допускал правна промяна на пола на починали лица, нито ЕСПЧ е приемал, че съществува такава правна възможност. Транссексуалните лица, интерсексуалните лица и другите лица, при които е необходима промяна на пола по медицински причини, са живи хора и техният пол е биологичен според Конституцията на РБ.

Ходещото опровержение на половата бинарност

„Решението на ВКС бетонира юридически дискриминацията на трансхората. Трансчовек вече не може да се оплаче, че е дискриминиран в резултат на отказа за юридическа промяна на пола си, защото според решението няма дискриминация. Най-циничното е, че ВКС не спира трансхората да водят дела, само предопределя изхода им – тези дела трябва да получат отказ“, отбелязва Пол Найденов в разговор с „Тоест“.

Пол Найденов е интерсекс – тоест човек, чийто пол не е ясен по рождение, и то не в смисъла на джендър, а чисто биологически. Той е с мъжки хромозоми и мъжка джендър идентичност, но е резистентен към мъжки полови хормони. При раждането си е записан като жена, а през пубертета насилствено е опериран, за да заприлича на такава, но женска идентичност така и не придобива.

Пол е първият интерсекс човек в България, който завежда дело за промяна на пола в личните си документи. Печели го през 2017 г. Хора като него са живо опровержение на схващането на КС и ВКС, че полът е само бинарен. Опровержение, което няма нищо общо нито с морала, нито с религията.

Пол Найденов обръща внимание, че освен всичките си проблеми, решението на ВКС е противоконституционно спрямо предходното на КС. Защото според ВКС полът, с който човек се е родил, е непроменим. По тази логика интерсекс хората не могат да си сменят пола в документите, а КС подчертава, че това е възможно.

Въпреки че не е транс, на Пол не са му чужди проблемите на трансхората. Преди да спечели делото, му се е случвало да не го назначат на работа след спечелен конкурс само защото в автобиографията си е Пол Найденов, държи се и изглежда като мъж, а името в личната му карта е женско. Опитът го е научил да забелязва неловките детайли във всекидневието на трансхората, чиито документи не са сменени:

В решението на ВКС се казва, че то не накърнява правата на трансхората, но когато трансчовек, изглеждащ като мъж, отиде в болницата и го викат пред всички с женско име, това не е въпрос на човещина.

Според Пол най-неприятното е, че ВКС „препраща топката във вратата на правотворчеството, тоест той буквално настоява да се създаде закон за смяна на пола, което най-вероятно ще рефлектира в абсолютно мракобесно законодателство“. Под „мракобесно“ има предвид например налагането на задължителна кастрация. Така пола си по документи ще могат да сменят само хора, които са готови да се подложат на такава процедура и чието финансово и здравословно състояние я позволява. Той се тревожи, че няма обединена общност на трансхората в България, която да отстоява интересите си, поради което такъв закон няма да е разработен съвместно с тях.

А какво всъщност пише в Конституцията

Ако четем Конституцията по логиката на КС и респективно на ВКС, излиза, че мъжът има само една социална роля. И тя е… да се ожени. Защото единственият път, когато се споменава думата „мъж“ в Основния закон, е в чл. 46, т. 1, в която се казва, че бракът е доброволен съюз между мъж и жена. Споделям това прозрение с Пол Найденов, който продължава логиката на разсъждение:

Пряко следствие от решението на ВКС е, че чисто хипотетично може да се окаже, че изнасилването не е противоконституционно, защото, ако жената зачене в резултат на него, това значи, че тя изпълнява конституционната си роля да бъде майка.

Ако излезем от паралелната реалност на мисловния транс на ВКС и КС, както и от политическите злоупотреби с темата, Конституцията изглежда съвсем различно.

В Основния ни закон не става дума за биологичен пол. Единствените биологични неща, които се споменават в нея, са ресурси на морските пространства, силно действащи вещества и препарати.

Не се споменават нито „традиционно семейство“, нито „традиционни ценности“, нито „традиции“. Единствената употреба на дума с този корен е в чл. 13, ал. 3, която гласи, че традиционната религия в България е православието. Но в горната алинея се подчертава, че религиозните институции са отделени от държавата, а в долната – че религиозните общности и институции, както и верските убеждения не могат да се използват за политически цели.

По логиката на горното и КС, и ВКС, и партии като БСП, която предизборно обещава да инициира референдум за „джендър идеологията“, пряко нарушават Конституцията.

Ценностите, за които става дума в Основния закон, са два вида – общочовешки (споменават се два пъти) и национални (веднъж). За националните ценности не е уточнено какви са, а общочовешките са шест – „свобода, мир, хуманизъм, равенство, справедливост и търпимост“. Поне пет от тях решенията на КС и ВКС нарушават (за мира може да се спори).

Що се отнася до религията, в Конституцията се търси баланс между религиозната свобода и светското законодателство. „Религиозните и другите убеждения не са основание за отказ да се изпълняват задълженията, установени в Конституцията и законите“, се казва в ал. 2 на чл. 58. Не личи КС и ВКС да се съобразяват и с това.

Малко вероятно е съдиите от КС и ВКС да не си дават сметка колко абсурдни решения вземат и какви може да бъдат последствията от тях. Не само за транс и по-общо за ЛГБТИ хората, нито само за жените, преживели насилие, а за България и международния ѝ авторитет като цяло. Тези последствия ще лежат на тяхната съвест.

За финал – опит за нотка оптимизъм

„Надявам се, че ще напишеш оптимистична статия, защото в момента много трансхора буквално са изтрещели. Десетки дела за промяна на пола отлежаваха и сега ще завършат с отрицателни решения“, споделя Пол Найденов в края на разговора ни. Отговарям, че идеята ми беше по-скоро да напиша иронична статия.

Опитвам се да намеря нещо оптимистично в цялата ситуация. И то е в предположението, че абсурдният транс, в която се вкара България в резултат на антиджендър кампанията и чийто последен връх е решението на ВКС, не може да продължава вечно. Рано или късно ще се блъсне в нещо, което ще го спре или поне ограничи. Например в европейските институции.

Но пък не е много оптимистично да се надяваме все някой отвън да ни спасява. Ще ми се жените и трансхората в България повече да се борят за правата си. Както и партиите, които претендират да са демократични и проевропейски, да не се снишават от страх да не им падне рейтингът. И да не оставят само „Възраждане“, БСП, радикални националисти и ултраконсервативни религиозни организации да се изказват по темата.

Чисто теоретично не е невъзможно всичко това да се случи. По-добре теоретичен оптимизъм, отколкото никакъв, нали?

Заглавно изображение: Един от лъвовете пред сградата на Съдебната палата в София, където заседава ВКС.
Снимка: Wikimedia Commons / Bin im Garten
Колаж: „Тоест“

The collective thoughts of the interwebz