Post Syndicated from original https://xkcd.com/2745/

Post Syndicated from original https://xkcd.com/2745/
Post Syndicated from Abhi Sodhani original https://aws.amazon.com/blogs/big-data/access-amazon-athena-in-your-applications-using-the-websocket-api/
Modern applications are built with modular independent components or microservices that rely on an API framework to communicate with services. Many organizations are building data lakes to store and analyze large volumes of structured, semi-structured, and unstructured data. In addition, many teams are moving towards a data mesh architecture, which requires them to expose their data sets as easily consumable data products. To accomplish this on AWS, organizations use Amazon Simple Storage Service (Amazon S3) to provide cheap and reliable object storage to house their datasets. To enable interactive querying and analyzing their data in place using familiar SQL syntax, many teams are turning to Amazon Athena. Athena is an interactive query service that is used by modern applications to query large volumes of data on an S3 data lake using standard SQL.
When working with SQL databases, application developers and business analysts are most familiar with simple permissions management and synchronous query-response protocols—if a user has permissions to submit a query, they do so and receive the results from the server when the query is complete. Directly accessing Athena APIs, for example when integrating with a custom web application, requires an AWS Identity and Access Management (IAM) role for the applications, and requires you to build a custom process to poll for query completion asynchronously. The IAM role needs access to run Athena API calls, as well as S3 permissions to retrieve the Athena output stored on Amazon S3. Polling for Athena query completion when performed at several intervals could result in increased latency from the client perspective.
In this post, we present a solution that can integrate with your front-end application to query data from Amazon S3 using an Athena synchronous API invocation. With this solution, you can add a layer of abstraction to your application on direct Athena API calls and promote the access using the WebSocket API developed with Amazon API Gateway. The query results are returned back to the application as Amazon S3 presigned URLs.
For illustration purposes, this post builds a COVID-19 data lake with a WebSocket API to handle Athena queries. Your application can invoke the WebSocket API to pull the data from Amazon S3 using an Athena SQL query, and the WebSocket API returns the JSON response with the presigned Amazon S3 URL. The application needs to parse the JSON message to read the presigned URL, download the data to local, and report the data back to the front end.
We use AWS Step Functions to poll the Athena query run. When the query is complete, Step Functions invokes an AWS Lambda function to generate the presigned URL and send the request back to the application.
The application doesn’t require direct access to Athena, just access to invoke the API. When using this solution, you should secure the API following AWS guidelines. For more information, refer to Controlling and managing access to a WebSocket API in API Gateway.
The following diagram summarizes the architecture, key components, and interactions in the solution.

The application is composed of the WebSocket API in API Gateway, which handles the connectivity between the client and Athena. A client application using the framework can submit the Athena SQL query and get back the presigned URL containing the query results data. The workflow includes the following steps:
runquery action, which invokes the RunQuery Lambda function.The RunQuery Lambda function runs the Athena query using the start_query_execution request:
The Amazon S3 presigned URL is generated by invoking the generate_presigned_url request with the bucket and key information that hosts the Athena results. The code hard codes the presigner expiration to 120 seconds, which is configurable in the function input parameter PreSignerExpireSeconds. See the following code:
This post assumes you have the following:
To enable the WebSocket API of API Gateway, complete the following steps:
To make the data from the AWS COVID-19 data lake available in the Data Catalog in your AWS account, create a CloudFormation stack using the following template. If you’re signed in to your AWS account, the following page fills out most of the stack creation form for you. All you need to do is choose Create stack. For instructions on creating a CloudFormation stack, see Getting started with AWS CloudFormation.
You can also use an existing Athena database to query, in which case you need to update the stack parameters.
If this is the first time you’re using Athena, you must specify a query result location on Amazon S3. For more information about querying and accessing the data from Athena, see A public data lake for analysis of COVID-19 data.
pBucketName with the S3 bucket (in the us-east-2 region) that stores the Athena results and also update the database if you want to query an existing database.At a high level, these are the primary resources deployed by the application template:
To test the WebSocket API, you can use wscat, an open-source command line tool.
WebSocketURI output in the serverlessrepo-aws-app-athena-websocket-integration stack that was deployed by the AWS SAM application you deployed previously.runquery function, send a JSON message like the following example. This triggers the state machine to run your SQL query using Athena and, using Lambda, return an S3 presigned URL to your client, which you can access to download the query results. Note that the API accepts any valid Athena query. Additional query validation could be added to the internal Lambda function if desired.pre-signed-url and enter it into your browser window to access the results.The presigned URL provides you temporary credentials to download the query results. For more information, refer to Using presigned URLs. This process can be integrated into a front-end web application to automatically download and display the results of the query.
To avoid incurring ongoing charges, delete the resources you provisioned by deleting the CloudFormation stacks CovidLakeStacks and serverlessrepo-AthenaWebSocketIntegration via the AWS CloudFormation console. For detailed instructions, refer to the cleanup sections in the starter kit README files in the GitHub repo.
In this post, we showed how to integrate your application with Athena using the WebSocket API. We have included a GitHub repo for you to understand the code and modify it per your application requirements, to get the full benefits of the solution. We encourage you to further explore the features of the API Gateway WebSocket API to add in security using authorizers, view live invocations using dashboards, and expand the framework for more routes on action request.
Let’s stay in touch via the GitHub repo.
 Abhi Sodhani is a Sr. AI/ML Solutions Architect at AWS. He helps customers with a wide range of solutions, including machine leaning, artificial intelligence, data lakes, data warehousing, and data visualization. Outside of work, he is passionate about books, yoga, and travel.
 Robin Zimmerman is a Data and ML Engineer with AWS Professional Services. He works with AWS enterprise customers to develop systems to extract value from large volumes of data using AWS data, analytics, and machine learning services. When he’s not working, you’ll probably find him in the mountains—rock climbing, skiing, mountain biking, or out on whatever other adventure he can dream up.
Post Syndicated from Flora Wu original https://aws.amazon.com/blogs/big-data/use-apache-iceberg-in-a-data-lake-to-support-incremental-data-processing/
Apache Iceberg is an open table format for very large analytic datasets, which captures metadata information on the state of datasets as they evolve and change over time. It adds tables to compute engines including Spark, Trino, PrestoDB, Flink, and Hive using a high-performance table format that works just like a SQL table. Iceberg has become very popular for its support for ACID transactions in data lakes and features like schema and partition evolution, time travel, and rollback.
Apache Iceberg integration is supported by AWS analytics services including Amazon EMR, Amazon Athena, and AWS Glue. Amazon EMR can provision clusters with Spark, Hive, Trino, and Flink that can run Iceberg. Starting with Amazon EMR version 6.5.0, you can use Iceberg with your EMR cluster without requiring a bootstrap action. In early 2022, AWS announced general availability of Athena ACID transactions, powered by Apache Iceberg. The recently released Athena query engine version 3 provides better integration with the Iceberg table format. AWS Glue 3.0 and later supports the Apache Iceberg framework for data lakes.
In this post, we discuss what customers want in modern data lakes and how Apache Iceberg helps address customer needs. Then we walk through a solution to build a high-performance and evolving Iceberg data lake on Amazon Simple Storage Service (Amazon S3) and process incremental data by running insert, update, and delete SQL statements. Finally, we show you how to performance tune the process to improve read and write performance.
More and more customers are building data lakes, with structured and unstructured data, to support many users, applications, and analytics tools. There is an increased need for data lakes to support database like features such as ACID transactions, record-level updates and deletes, time travel, and rollback. Apache Iceberg is designed to support these features on cost-effective petabyte-scale data lakes on Amazon S3.
Apache Iceberg addresses customer needs by capturing rich metadata information about the dataset at the time the individual data files are created. There are three layers in the architecture of an Iceberg table: the Iceberg catalog, the metadata layer, and the data layer, as depicted in the following figure (source).
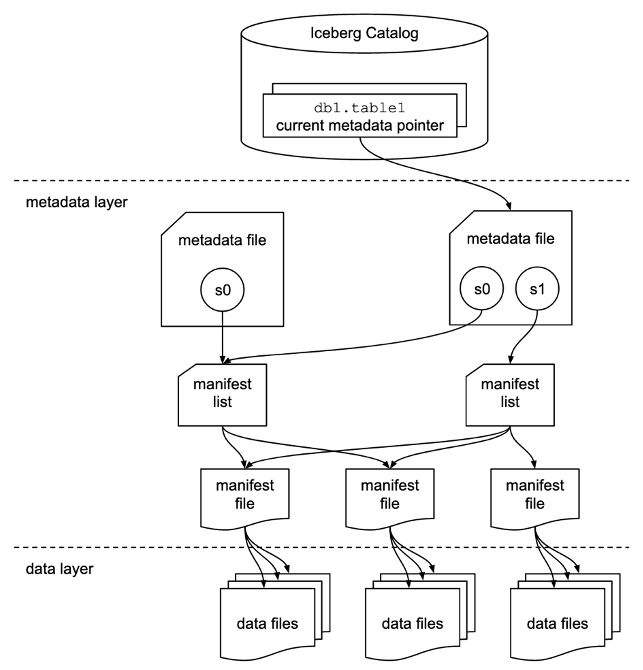
The Iceberg catalog stores the metadata pointer to the current table metadata file. When a select query is reading an Iceberg table, the query engine first goes to the Iceberg catalog, then retrieves the location of the current metadata file. Whenever there is an update to the Iceberg table, a new snapshot of the table is created, and the metadata pointer points to the current table metadata file.
The following is an example Iceberg catalog with AWS Glue implementation. You can see the database name, the location (S3 path) of the Iceberg table, and the metadata location.

The metadata layer has three types of files: the metadata file, manifest list, and manifest file in a hierarchy. At the top of the hierarchy is the metadata file, which stores information about the table’s schema, partition information, and snapshots. The snapshot points to the manifest list. The manifest list has the information about each manifest file that makes up the snapshot, such as location of the manifest file, the partitions it belongs to, and the lower and upper bounds for partition columns for the data files it tracks. The manifest file tracks data files as well as additional details about each file, such as the file format. All three files work in a hierarchy to track the snapshots, schema, partitioning, properties, and data files in an Iceberg table.
The data layer has the individual data files of the Iceberg table. Iceberg supports a wide range of file formats including Parquet, ORC, and Avro. Because the Iceberg table tracks the individual data files instead of only pointing to the partition location with data files, it isolates the writing operations from reading operations. You can write the data files at any time, but only commit the change explicitly, which creates a new version of the snapshot and metadata files.
In this post, we walk you through a solution to build a high-performing Apache Iceberg data lake on Amazon S3; process incremental data with insert, update, and delete SQL statements; and tune the Iceberg table to improve read and write performance. The following diagram illustrates the solution architecture.

To demonstrate this solution, we use the Amazon Customer Reviews dataset in an S3 bucket (s3://amazon-reviews-pds/parquet/). In real use case, it would be raw data stored in your S3 bucket. We can check the data size with the following code in the AWS Command Line Interface (AWS CLI):
The total object count is 430, and total size is 47.4 GiB.
To set up and test this solution, we complete the following high-level steps:
To follow along with this walkthrough, you must have an AWS account with an AWS Identity and Access Management (IAM) role that has sufficient access to provision the required resources.
Choose the Region in which you want to create the S3 bucket and provide a unique name:
You can create an EMR cluster from the AWS Management Console, Amazon EMR CLI, or AWS Cloud Development Kit (AWS CDK). For this post, we walk you through how to create an EMR cluster from the console.
[{"classification":"iceberg-defaults","properties":{"iceberg.enabled":true}}].
iceberg-blog-cluster.We now walk you through how to create a notebook in EMR Studio from the console.
The Get started page appears in a new tab.
iceberg-workspace.In the navigation pane, there is a notebook that has the same name as the Workspace. In our case, it is iceberg-workspace.
Use the following code, providing your own S3 bucket name:
This sets the following Spark session configurations:
s3://iceberg-curated-blog-data.You can use either Spark on Amazon EMR or Athena to load the Iceberg table. In the EMR Studio Workspace notebook Spark session, run the following commands to load the data:
After you run the code, you should find two prefixes created in your data warehouse S3 path (s3://iceberg-curated-blog-data/reviews.db/all_reviews): data and metadata.
Athena is a serverless query engine that you can use to perform read, write, update, and optimization tasks against Iceberg tables. To demonstrate how the Apache Iceberg data lake format supports incremental data ingestion, we run insert, update, and delete SQL statements on the data lake.
Navigate to the Athena console and choose Query editor. If this is your first time using the Athena query editor, you need to configure the query result location to be the S3 bucket you created earlier. You should be able to see that the table reviews.all_reviews is available for querying. Run the following query to verify that you have loaded the Iceberg table successfully:
Process incremental data by running insert, update, and delete SQL statements:
In this section, we walk through different ways to improve Apache Iceberg read and write performance.
Apache Iceberg is a table format, and it supports table properties to configure table behavior such as read, write, and catalog. You can improve the read and write performance on Iceberg tables by adjusting the table properties.
For example, if you notice that you write too many small files for an Iceberg table, you can config the write file size to write fewer but bigger size files, to help improve query performance.
| Property | Default | Description |
| write.target-file-size-bytes | 536870912 (512 MB) | Controls the size of files generated to target about this many bytes |
Use the following code to alter the table format:
To make a query run fast, the less data read the better. Iceberg takes advantage of the rich metadata it captures at write time and facilitates techniques such as scan planning, partitioning, pruning, and column-level stats such as min/max values to skip data files that don’t have match records. We walk you through how query scan planning and partitioning work in Iceberg and how we use them to improve query performance.
For a given query, the first step in a query engine is scan planning, which is the process to find the files in a table needed for a query. Planning in an Iceberg table is very efficient, because Iceberg’s rich metadata can be used to prune metadata files that aren’t needed, in addition to filtering data files that don’t contain matching data. In our tests, we observed Athena scanned 50% or less data for a given query on an Iceberg table compared to original data before conversion to Iceberg format.
There are two types of filtering:
Partitioning is a way to group records with the same key column values together in writing. The benefit of partitioning is faster queries that access only part of the data, as explained earlier in query scan planning: data filtering. Iceberg makes partitioning simple by supporting hidden partitioning, in the way that Iceberg produces partition values by taking a column value and optionally transforming it.
In our use case, we first run the following query on the Iceberg table not partitioned. Then we partition the Iceberg table by the category of the reviews, which will be used in the query WHERE condition to filter out records. With partitioning, the query could scan much less data. See the following code:
Run the following select statement on the non-partitioned all_reviews table vs. the partitioned table to see the performance difference:
The following table shows the performance improvement of data partitioning, with about 50% performance improvement and 70% less data scanned.
| Dataset Name | Non-Partitioned Dataset | Partitioned Dataset |
| Runtime (seconds) | 8.20 | 4.25 |
| Data Scanned (MB) | 131.55 | 33.79 |
Note that the runtime is the average runtime with multiple runs in our test.
We saw good performance improvement after partitioning. However, this can be further improved by using column-level stats from Iceberg manifest files. In order to use the column-level stats effectively, you want to further sort your records based on the query patterns. Sorting the whole dataset using the columns that are often used in queries will reorder the data in such a way that each data file ends up with a unique range of values for the specific columns. If these columns are used in the query condition, it allows query engines to further skip data files, thereby enabling even faster queries.
When implementing update and delete on Iceberg tables in the data lake, there are two approaches defined by the Iceberg table properties:
To test the impact of the two approaches, you can run the following code to set the Iceberg table properties:
Run the update, delete, and select SQL statements in Athena to show the runtime difference for copy-on-write vs. merge-on-read:
The following table summarizes the query runtimes.
| Query | Copy-on-Write | Merge-on-Read | ||||
| UPDATE | DELETE | SELECT | UPDATE | DELETE | SELECT | |
| Runtime (seconds) | 66.251 | 116.174 | 97.75 | 10.788 | 54.941 | 113.44 |
| Data scanned (MB) | 494.06 | 3.07 | 137.16 | 494.06 | 3.07 | 137.16 |
Note that the runtime is the average runtime with multiple runs in our test.
As our test results show, there are always trade-offs in the two approaches. Which approach to use depends on your use cases. In summary, the considerations come down to latency on the read vs. write. You can reference the following table and make the right choice.
| . | Copy-on-Write | Merge-on-Read |
| Pros | Faster reads | Faster writes |
| Cons | Expensive writes | Higher latency on reads |
| When to use | Good for frequent reads, infrequent updates and deletes or large batch updates | Good for tables with frequent updates and deletes |
If your data file size is small, you might end up with thousands or millions of files in an Iceberg table. This dramatically increases the I/O operation and slows down the queries. Furthermore, Iceberg tracks each data file in a dataset. More data files lead to more metadata. This in turn increases the overhead and I/O operation on reading metadata files. In order to improve the query performance, it’s recommended to compact small data files to larger data files.
When updating and deleting records in Iceberg table, if the read-on-merge approach is used, you might end up with many small deletes or new data files. Running compaction will combine all these files and create a newer version of the data file. This eliminates the need to reconcile them during reads. It’s recommended to have regular compaction jobs to impact reads as little as possible while still maintaining faster write speed.
Run the following data compaction command, then run the select query from Athena:
The following table compares the runtime before vs. after data compaction. You can see about 40% performance improvement.
| Query | Before Data Compaction | After Data Compaction |
| Runtime (seconds) | 97.75 | 32.676 seconds |
| Data scanned (MB) | 137.16 M | 189.19 M |
Note that the select queries ran on the all_reviews table after update and delete operations, before and after data compaction. The runtime is the average runtime with multiple runs in our test.
After you follow the solution walkthrough to perform the use cases, complete the following steps to clean up your resources and avoid further costs:
In this post, we introduced the Apache Iceberg framework and how it helps resolve some of the challenges we have in a modern data lake. Then we walked you though a solution to process incremental data in a data lake using Apache Iceberg. Finally, we had a deep dive into performance tuning to improve read and write performance for our use cases.
We hope this post provides some useful information for you to decide whether you want to adopt Apache Iceberg in your data lake solution.
 Flora Wu is a Sr. Resident Architect at AWS Data Lab. She helps enterprise customers create data analytics strategies and build solutions to accelerate their businesses outcomes. In her spare time, she enjoys playing tennis, dancing salsa, and traveling.
 Daniel Li is a Sr. Solutions Architect at Amazon Web Services. He focuses on helping customers develop, adopt, and implement cloud services and strategy. When not working, he likes spending time outdoors with his family.
Post Syndicated from Yota Hamaoka original https://aws.amazon.com/blogs/big-data/visualize-database-privileges-on-amazon-redshift-using-grafana/
Amazon Redshift is a fully managed, petabyte-scale data warehouse service in the cloud. Amazon Redshift enables you to use SQL for analyzing structured and semi-structured data with best price performance along with secure access to the data.
As more users start querying data in a data warehouse, access control is paramount to protect valuable organizational data. Database administrators want to continuously monitor and manage user privileges to maintain proper data access in the data warehouse. Amazon Redshift provides granular access control on the database, schema, table, column, row, and other database objects by granting privileges to roles, groups, and users from a SQL interface. To monitor privileges configured in Amazon Redshift, you can retrieve them by querying system tables.
Although Amazon Redshift provides a broad capability of managing access to database objects, we have heard from customers that they want to visualize and monitor privileges without using a SQL interface. In this post, we introduce predefined dashboards using Grafana which visualizes database privileges without writing SQL. This dashboard will help database administrators to reduce the time spent on database administration and increase the frequency of monitoring cycles.
Security is the top priority at AWS. Amazon Redshift provides four levels of control:
This post focuses on database access, which relates to user access control against database objects. For more information, see Managing database security.
Amazon Redshift uses the GRANT command to define permissions in the database. For most database objects, GRANT takes three parameters:
To remove access, use the REVOKE command.
Additionally, Amazon Redshift offers granular access control with the Row-level security (RLS) feature. You can attach or detach RLS policies to identities with the ATTACH RLS POLICY and DETACH RLS POLICY commands, respectively. See RLS policy ownership and management for more details.
Generally, database administrator monitors and reviews the identities, objects, and privileges periodically to ensure proper access is configured. They also need to investigate access configurations if database users face permission errors. These tasks require a SQL interface to query multiple system tables, which can be a repetitive and undifferentiated operation. Therefore, database administrators need a single pane of glass to quickly navigate through identities, objects, and privileges without writing SQL.
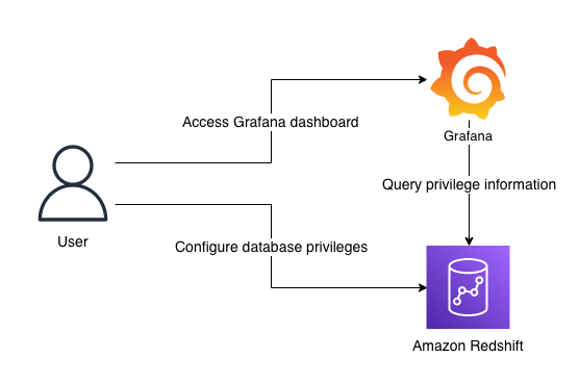
The following diagram illustrates the solution architecture and its key components:
Note that the dashboard focuses on visualization. SQL interface is required to configure privileges in Amazon Redshift. You can use query editor v2, a web-based SQL interface which enables users to run SQL commands from a browser.
Before moving to the next section, you should have the following prerequisites:
While Amazon Managed Grafana controls the plugin version and updates periodically, local Grafana allows user to control the version. Therefore, local Grafana could be an option if you need earlier access for the latest features. Refer to plugin changelog for released features and versions.
After you have finished the prerequisites, you should have access to Grafana configured with Amazon Redshift as a data source. Next, import two dashboards for visualization.
Each dashboard will appear once imported.
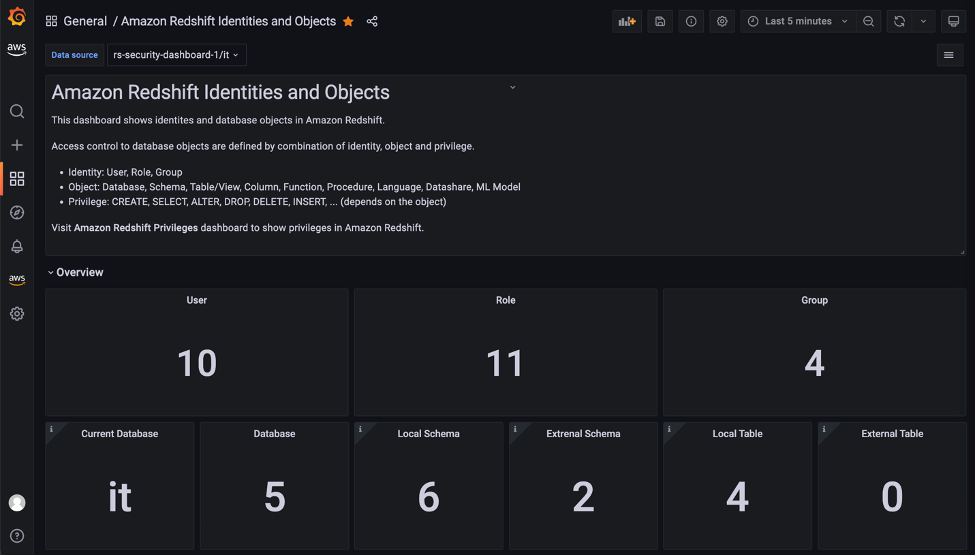
The Amazon Redshift Identities and Objects dashboard shows identites and database objects in Amazon Redshift, as shown in the following screenshot.
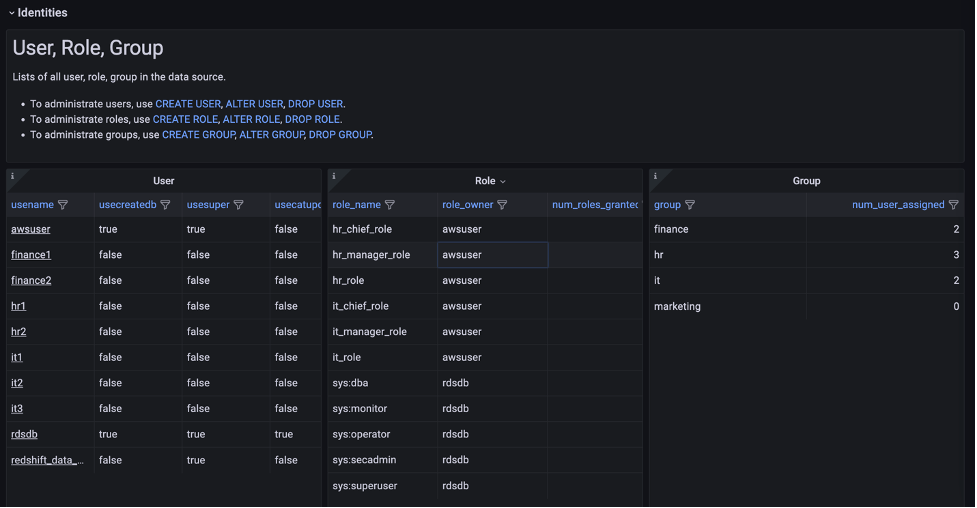
The Identities section shows the detail of each user, role, and group in the source database.
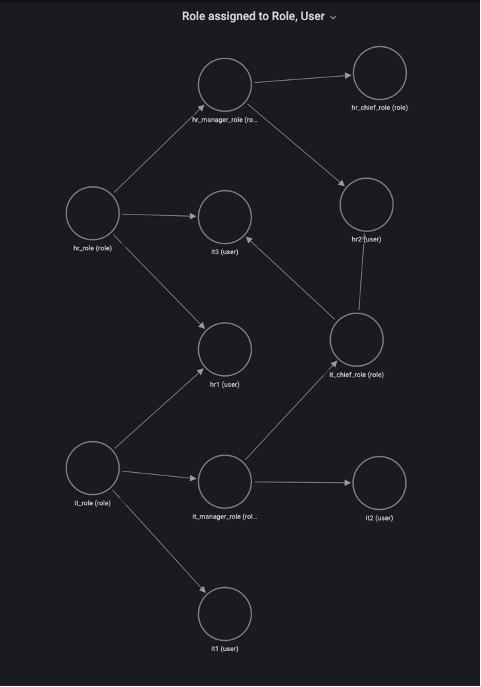
One of the key features in this dashboard is the Role assigned to Role, User section, which uses a node graph panel to visualize the hierarchical structure of roles and users from multiple system tables. This visualization can help administrators quickly examine which roles are inherited to users instead of querying multiple system tables. For more information about role-based access, refer to Role-based access control (RBAC).
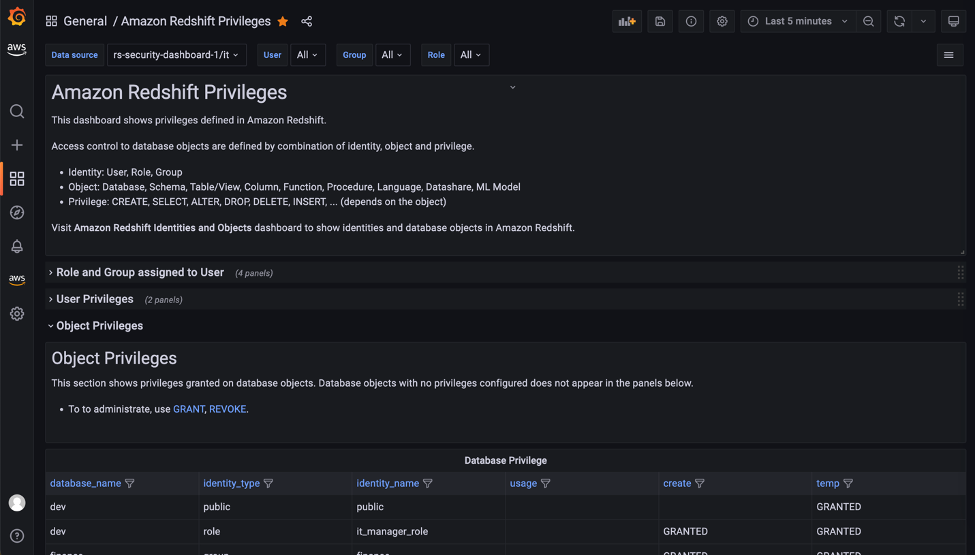
The Amazon Redshift Privileges dashboard shows privileges defined in Amazon Redshift.
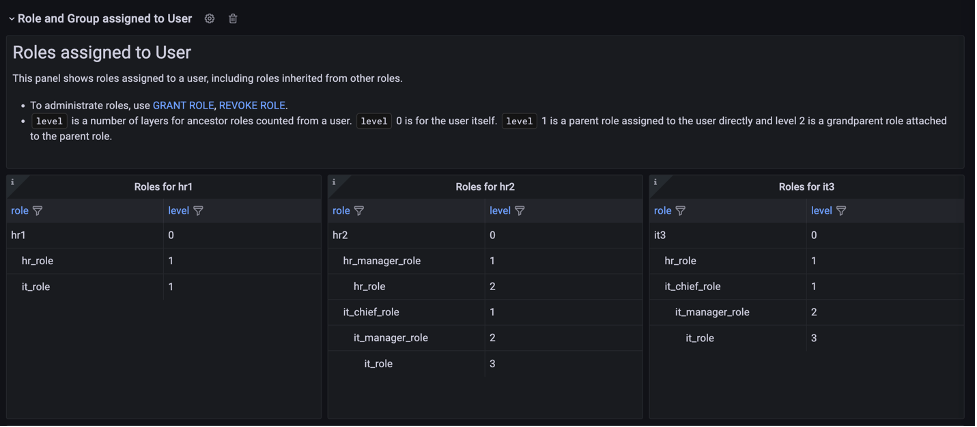
In the Role and Group assigned to User section, open the Role assigned to User panel to list the roles for a specific user. In this panel, you can list and compare roles assigned to multiple users. Use the User drop-down at the top of the dashboard to select users.

The dashboard will refresh immediately and show filtered result for selected users. Following screenshot is the filtered result for user hr1, hr2 and it3.
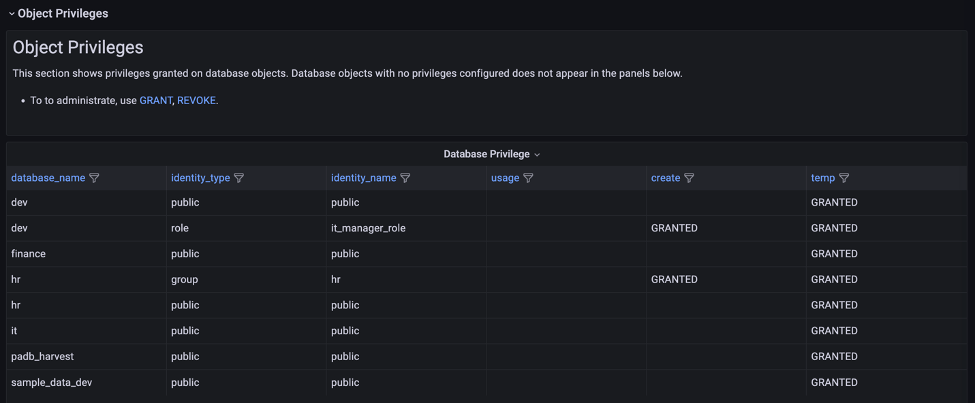
The Object Privileges section shows the privileges granted for each database object and identity. Note that objects with no privileges granted are not listed here. To show the full list of database objects, use the Amazon Redshift Identities and Objects dashboard.
The Object Privileges (RLS) section contains visualizations for row-level security (RLS). The Policy attachments panel enables you to examine RLS configuration by visualizing relation between of tables, policies, roles and users.
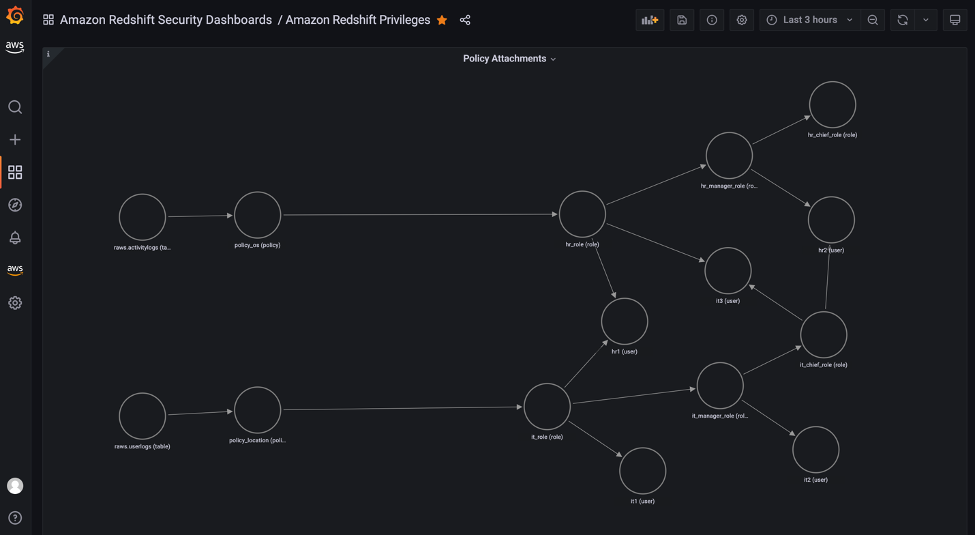
In this post, we introduced a visualization for database privileges of Amazon Redshift using predefined Grafana dashboards. Database administrators can use these dashboards to quickly navigate through identities, objects, and privileges without writing SQL. You can also customize the dashboard to meet your business requirements. The JSON definition file of this dashboard is maintained as part of OSS in the Redshift data source for Grafana GitHub repository.
For more information about the topics described to in this post, refer to the following:

Yota Hamaoka is an Analytics Solution Architect at Amazon Web Services. He is focused on driving customers to accelerate their analytics journey with Amazon Redshift.
Post Syndicated from Rizel Scarlett original https://github.blog/2023-03-02-why-python-keeps-growing-explained/
Which programming language has been around for more than three decades and continues to grow in popularity each year?
If you guessed Python, you nailed it. In the 2022 Octoverse report, we found that Python remains the second most-used programming language on GitHub. Interestingly, Python’s use grew more than 22 percent year over year with more than four million developers on GitHub using it at some point in 2022.
In this article, we’ll dive into a brief history of Python, its benefits, its use cases, and seek to answer why a program language conceived in the 1980s continues to dominate development. And, since this is GitHub, we’ll also offer a few useful tips and tricks for developers new to—and experienced in—Python.

Python is a high-level, interpreted programming language with a simple syntax, which makes it easily readable and extremely user- and beginner-friendly. Originally built to satisfy Guido Van Rossum’s desire for a programming language that was simple to use and beautiful to look at, Python was first released to the world in 1991.
Fun fact: Python was named after the BBC TV show, “Monty Python’s Flying Circus.”
Since its development, it has grown to have widespread applicability for developers, data scientists, researchers, and more. But how, you may ask, can a coding language be simple and beautiful to look at? Here’s some proof:
print("Hello world.")
vs.
public class HelloWorld {
    public static void main (String[]args) {
      System.out.println.("Hello world");
    }
}
Since Python is a general-purpose language, it can be used in a variety of applications, and its uncomplicated nature makes it an excellent language for automating tasks, building websites or software, and analyzing data.
Python also has several other characteristics that make it popular amongst developers and engineers. These include:
It’s open source. You can download the source code, modify it, and use it however you want.
It’s portable. Some languages require you to modify code to run on different platforms, but Python is a cross-platform language, which means you can run the same code on any operating system with a Python interpreter.
It’s extendable. Python code can be written in other languages (such as C++), and users can add low-level modules to the Python interpreter to customize and optimize their tools.
It has a broad standard library. This library is available for anyone to access and means that users don’t have to write code for every single function—they can access built-in modules that help with issues in everyday programming and more.

Python can be used for just about anything, from web and software development to machine learning and artificial intelligence (AI). Let’s take a look at some of its most common use cases.
import antigravity

def main():
    antigravity.fly()

if __name__ == '__main__':
    main()
Run this command to check out an inside joke among Python developers.
Python is a popular language for web and software development because you can create complex, multi-protocol applications while maintaining concise, readable syntax. In fact, some of the most popular applications were built with Python. Plus, Python’s open source community provides developers with an extensive amount of reusable code, frameworks, and support. Case in point: Django is one of the most-used Python frameworks designed by experienced developers to help others accelerate their application build times and avoid issues that might balk their progress.
One of Python’s key benefits is its ability to automate manual, repetitive tasks. With Python, you can learn how to automate just about anything by using either built-in modules or pre-written code from its robust library. Or you can write your own custom scripts to perform specific actions. For example, you can easily automate emails with the “smtplib” module or copy files with the “shutil” module. Python also has a robust set of testing frameworks, which makes it an excellent language for test automation. Frameworks such as Pytest, Behave, and Robot allow developers to write simple yet effective tests to ensure the quality of their builds.
Here’s a fun fact: Python is the top preferred language for data science and research. Since its syntax is easily understandable and adaptable, people with little-to-no development experience can easily learn Python and use it to manipulate data for research, reporting, predictable or regression analyses, and more. Collecting and parsing data can be a time-consuming task for data scientists. Python is also one of the top languages for training machine learning (ML) models. Through specific algorithms, these models can analyze and identify patterns in data to make predictions or decisions based on that data. They also constantly evolve based on outputs of previous datasets to confront new variables. Data scientists and developers training ML models often utilize libraries, such as NumPy, Pandas, and Matplotlib, to automate functions like cleaning, data transformation, and visualization.
Similar to how Python can assist data scientists with the heavy lift of large data sets, Python is widely used in the financial industry to quickly perform complex computations. Stock markets generate huge amounts of data, and Python can be used to import data on stock prices and generate strategies through algorithms to identify trading opportunities. The language can also be used for portfolio optimization, risk management, financial modeling and visualization, cryptocurrency analysis, and even fraud detection.
Python can also be found in some of the most complex, artificial intelligence (AI) technologies—and it’s actually one of the preferred languages for AI. Python’s concise and readable code allows developers to create consistent, reliable systems, and its vast library provides a number of frameworks like PyBrain, which offers developers powerful algorithms for machine learning tasks. Plus, Python’s visualization capabilities can help convert these large datasets for AI or ML into comprehensible graphs or reports. Interestingly enough, OpenAI, the artificial intelligence research lab, utilizes the Python framework, Pytorch, as their standard framework for deep learning, which trains its AI systems.

In addition to its relative simplicity to learn, there are a few other reasons why Python continues to consistently grow in popularity. These include:
It has an expansive, supportive community of users. Even the best developers run into problems— and this is where user communities can become an invaluable resource. Python has a huge community with documentation, tutorials, tips, and tricks to master the language. The Python community on GitHub, for example, offers everything from information on the latest version of the language to bug reports and update notes.
It’s academic. Python has become the go-to language in academia with some students even encountering Python as early as elementary school. (Believe it or not, there are children’s picture books dedicated to Python.) While computer science students are often taught Python, its use extends beyond that discipline into other areas of STEM and academic research. For example, Python can be used to solve differential equations, perform statistical analyses, simulate and track particle diffusion, and more.
It has high corporate demand. Because of its wide scale applicability in development and data analysis work, learning and knowing Python is often considered a top-skill among job seekers. According to Statista, Python was the third most demanded language in 2022 by recruiters worldwide.
Python is everywhere—and it’s been used to build a significant number of the technologies, websites, and even systems most people encounter on a daily basis. It powers everything from your favorite video streaming service to the ML algorithms that can help you make your next cryptocurrency trade. And for an even broader scope example (pun absolutely intended), NASA uses Python to power data analysis with its sophisticated James Webb Space Telescope, which makes it one of the few programming languages that is, quite literally, out of this world. 

A quick Google search will yield hundreds of resources out there to jumpstart your Python journey—and that can quickly get a little overwhelming. To simplify things, here are a few helpful GitHub repositories to help you get started with Python:
To get started, download the latest version of Python.
GitHub offers two easier ways to start working with Python: GitHub Codespaces and GitHub Copilot.
You can start building today for free with GitHub Codespaces, which every developer on GitHub gets 60 free hours of use time per month to spin up a development environment in the cloud from any device at speed. Check out the Django quick start template to begin coding right in your browser!
You can also use GitHub Copilot, GitHub’s AI pair programmer, to write your first lines of Python. Here’s how:
From machine learning to data analysis, Python’s versatility allows it to continue its explosive growth with developers and non-developers alike. Experiment with Python through GitHub or on your local machine to be part of this growth and get started today!
Post Syndicated from Talks at Google original https://www.youtube.com/watch?v=gEQ7L5Sitlg
Post Syndicated from Molly Clancy original https://www.backblaze.com/blog/what-is-the-cjis-security-policy/
It’s always been the case that specific industries are subject to their own security standards when it comes to protecting sensitive data. You’ve probably heard of the complex rules and regulations around personal health information and credit card data, for example. Law enforcement agencies do some of the most specialized work possible, so the entire world of criminal justice is subject to its own policies and procedures. Here’s what you need to know about Criminal Justice Information Services and the CJIS Security Policy.
Criminal Justice Information Services (CJIS) is the largest division of the FBI. It was originally established in 1992 to give law enforcement agencies, national security teams, and the intelligence community shared access to a huge repository of highly sensitive data like fingerprints and active case reports. The CJIS Security Policy exists to safeguard that information by defining protocols for the entire data life cycle wherever it exists, both at rest and in transit. It’s easy to see how important it is for law enforcement agencies to need quick and secure access to this case critical data, but it’s also clear just how detrimental that data could be if it got into the wrong hands.
To get a better sense of the CJIS Security Policy and how it works, let’s start by looking at the data it covers. These are the five types of data that qualify as criminal justice information (CJI):
The sensitivity of the types of data that qualify as CJI explains just how complicated the CJIS Security Policy is. To complicate matters further, CJIS (under the FBI and in turn the U.S. Department of Justice) issues regular updates to the Security Policy. The complexity inherent in the national policy, in combination with the pressure of keeping pace with constant changes, has meant that many law enforcement, national security, and intelligence agencies opt not to share data between agencies in lieu of taking the necessary steps to keep it safe in compliance with CJIS.
Each individual government agency is responsible for managing their own CJIS compliance. And the Security Policy applies to anyone interacting with that data, regardless of what system they use to do so or how they are associated with the agency that owns it. That means law enforcement representatives, lawyers, contractors, and private entities, for example, are all subject to the rules laid out in the CJIS Security Policy. What’s more, state governments and their respective CJIS Security Officers are responsible for managing the application of the Security Policy at the state level.

Despite all this complexity, CJIS doesn’t issue any official compliance certifications. Instead, compliance with the Security Policy falls under the purview of each individual organization, agency, or government body. Having the right technical controls in place to satisfy all standardized areas of the policy—and managing those controls on an ongoing basis—is the best (and the only) way to achieve CJIS compliance. These are the 13 key areas listed in the Security Policy:
Before an agency or organization shares CJI with any other entity, both parties must establish and mutually sign a formal information exchange agreement to certify that everyone involved is in CJIS compliant.
Any individuals interacting with CJI have to participate in annual specialized training about how they are expected to comply with the Security Policy.
Every agency interacting with CJI must have an Incident Response Plan (IRP) in place to ensure their ability to identify security incidents when they occur. IRPs also outline plans to contain and remediate damage as quickly and efficiently as possible.
Organizations have to monitor who accesses CJI, when they access it, and what they do with it. Establishing visibility into interactions like file access, login attempts, password changes, etc. helps dissuade bad actors from accessing data they shouldn’t and also gives agencies the forensic information they need to investigate incidents if breaches do occur.
Another way to ensure that only authorized users interact with CJI is to limit access based on specific attributes like job title, location, and IP address. Implementing role-based access controls helps limit the availability of CJI, so only the people who need to use that data can access it (and only when absolutely necessary).
Because of the rules around auditing & accountability and access control, the Security Policy also stipulates the importance of authenticating every user’s identity. CJIS’ identification & authentication rules include the use of multifactor authentication, regular password resets, and revoked credentials after five unsuccessful login attempts.
Only authorized users should be allowed to change the configuration of the systems that store CJI. This includes simple tasks like performing software updates, but it also extends to the hardware realm, for example when it comes to adding or removing devices from a network.
Compliant agencies must establish policies to protect all forms of media, including putting procedures in place for the secure disposal of that media once it is no longer in use.
Any physical spaces (like on-premises server rooms, for example) should be locked, monitored by camera equipment, and equipped with alarms to prevent unauthorized access.

Cybersecurity best practices should be in place, including perimeter protection measures like Intrusion Prevention Systems, firewalls, and anti-virus solutions. In the category of encryption, FIPS 140-2 certification and a minimum of 128 bit strength are required.
Although the CJIS doesn’t issue compliance certifications, agencies still have to be available for formal audits by CJIS representatives (like the CJIS Audit Unit and the CJIS Systems Agency) at least once every three years.
Any personnel with access to CJI have to undergo a screening process and background checks (including fingerprinting) to ensure their fitness to handle sensitive data.
In order to remain in compliance, organizations have to develop acceptable use policies that govern how mobile devices are used, how they connect to the internet, what applications they can have on them, and even what websites they can access. In this case, mobile devices include smartphones, tablets, and laptops that can access CJI. When representatives use mobile devices to access CJI, those devices (and that access) are subject to all the areas of the Security Policy.
For any organization to achieve CJIS compliance, any partner or vendor that accesses, interacts with, or stores their CJI also needs to comply with the same Security Policy standards. You guessed it: that means cloud storage providers too. It’s your job to ensure that your organization is CJIS-compliant before transmitting your data to any cloud storage provider. At Backblaze, we follow the same security standards outlined in the CJIS Security Policy so that you can trust that your CJI is protected and your agency is in compliance even while it’s being stored in Backblaze B2 Cloud Storage or via our Business Backup product.
The post What is the CJIS Security Policy? appeared first on Backblaze Blog | Cloud Storage & Cloud Backup.
Post Syndicated from Rohit Kumar original https://www.servethehome.com/marvell-teralynx-10-announced-for-51-2t-800gbe-switching/
The Marvell Teralynx 10 is a new 51.2T switch solution for 64x 800GbE switches that is the next iteration from its Innovium acquisition
The post Marvell Teralynx 10 Announced for 51.2T 800GbE Switching appeared first on ServeTheHome.
Post Syndicated from Michael Davie original https://aws.amazon.com/blogs/security/three-ways-to-boost-your-email-security-and-brand-reputation-with-aws/
If you own a domain that you use for email, you want to maintain the reputation and goodwill of your domain’s brand. Several industry-standard mechanisms can help prevent your domain from being used as part of a phishing attack. In this post, we’ll show you how to deploy three of these mechanisms, which visually authenticate emails sent from your domain to users and verify that emails are encrypted in transit. It can take as little as 15 minutes to deploy these mechanisms on Amazon Web Services (AWS), and the result can help to provide immediate and long-term improvements to your organization’s email security.
Phishing through email remains one of the most common ways that bad actors try to compromise computer systems. Incidents of phishing and related crimes far outnumber the incidents of other categories of internet crime, according to the most recent FBI Internet Crime Report. Phishing has consistently led to large annual financial losses in the US and globally.
An earlier post has covered how you can use Amazon Simple Email Service (Amazon SES) to send emails that align with best practices, including the IETF internet standards: Sender Policy Framework (SPF), DomainKeys Identified Mail (DKIM), and Domain-based Message Authentication, Reporting, and Conformance (DMARC). This post will show you how to build on this foundation and configure your domains to align with additional email security standards, including the following:

Figure 1: A mock-up of how BIMI enables branded logos to be displayed in email user interfaces
These three standards require your Domain Name System (DNS) to publish specific records, for example by using Amazon Route 53, that point to web pages that have additional information. You can host this information without having to maintain a web server by storing it in Amazon Simple Storage Service (Amazon S3) and delivering it through Amazon CloudFront, secured with a certificate provisioned from AWS Certificate Manager (ACM).
Note: This AWS solution works for DKIM, BIMI, and DMARC, regardless of what you use to serve the actual email for your domains, which services you use to send email, and where you host DNS. For purposes of clarity, this post assumes that you are using Route 53 for DNS. If you use a different DNS hosting provider, you will manually configure DNS records in your existing hosting provider.
The architecture for this solution is depicted in Figure 2.

Figure 2: The architecture diagram showing how the solution components interact
The interaction points are as follows:
Email is a complex system of interoperating technologies. It is also brittle: a typo or a missing DNS record can make the difference between whether an email is delivered or not. Pay close attention to your email server and the users of your email systems when implementing the solution in this blog post. The main indicator that something is wrong is the absence of email. Instead of seeing an error in your email server’s log, users will tell you that they’re expecting to receive an email from somewhere and it’s not arriving. Or they will tell you that they sent an email, and their recipient can’t find it.
The DNS uses a lot of caching and time-out values to improve its efficiency. That makes DNS records slow and a little unpredictable as they propagate across the internet. So keep in mind that as you monitor your systems, it can be hours or even more than a day before the DNS record changes have an effect that you can detect.
This solution uses AWS Cloud Development Kit (CDK) custom resources, which are supported by AWS Lambda functions that will be created as part of the deployment. These functions are configured to use CDK-selected runtimes, which will eventually pass out of support and require you to update them.
You will need permission in an AWS account to create and configure the following resources:
You might also want to enable these optional services:
BIMI has some additional requirements:
p=quarantine or p=reject. Additionally, the domain’s policy cannot have sp=none or pct<100.Note: Do not adjust the DMARC policy of your domain without careful testing, because this can disrupt mail delivery.
Note: If you are not ready to purchase a VMC, you can deploy this solution and validate that BIMI is correctly configured for your domain, but your branded logo will not display to recipients at major email providers.
This solution deploys the DNS records and supporting files that are required to implement BIMI, MTA-STS, and SMTP TLS reporting for an email domain. We’ll look at the deployment in more detail in the following sections.
BIMI is described by the Internet Engineering Task Force (IETF) as follows:
Brand Indicators for Message Identification (BIMI) permits Domain Owners to coordinate with Mail User Agents (MUAs) to display brand-specific Indicators next to properly authenticated messages. There are two aspects of BIMI coordination: a scalable mechanism for Domain Owners to publish their desired Indicators, and a mechanism for Mail Transfer Agents (MTAs) to verify the authenticity of the Indicator. This document specifies how Domain Owners communicate their desired Indicators through the BIMI Assertion Record in DNS and how that record is to be interpreted by MTAs and MUAs. MUAs and mail-receiving organizations are free to define their own policies for making use of BIMI data and for Indicator display as they see fit.
If your organization has a trademark-protected logo, you can set up BIMI to have that logo displayed to recipients in their email inboxes. This can have a positive impact on your brand and indicates to end users that your email is more trustworthy. The BIMI Group shows examples of how brand logos are displayed in user inboxes, as well as a list of known email service providers that support the display of BIMI logos.
As a domain owner, you can implement BIMI by publishing the relevant DNS records and hosting the relevant files. To have your logo displayed by most email hosting providers, you will need to purchase a Verified Mark Certificate from a BIMI-qualified certificate authority.
This solution will deploy a valid BIMI record in Route 53 (or tell you what to publish in the DNS if you’re not using Route 53) and will store your provided SVG logo and Verified Mark Certificate files in Amazon S3, to be delivered through CloudFront with a valid TLS certificate from ACM.
To support BIMI, the solution makes the following changes to your resources:
default._bimi.<your-domain>. The value of this record is: v=BIMI1; l=<url-of-your-logo> a=<url-of-verified-mark-certificate>. The value of <your-domain> refers to the domain that is used in the From header of messages that your organization sends.<url-of-your-logo> and <url-of-verified-mark-certificate>, respectively.MTA-STS is described by the IETF in RFC 8461 as follows:
SMTP (Simple Mail Transport Protocol) MTA Strict Transport Security (MTA-STS) is a mechanism enabling mail service providers to declare their ability to receive Transport Layer Security (TLS) secure SMTP connections and to specify whether sending SMTP servers should refuse to deliver to MX hosts that do not offer TLS with a trusted server certificate.
Put simply, MTA-STS helps ensure that email servers always use encryption and certificate-based authentication when sending email to your domains, so that message integrity and confidentiality are preserved while in transit across the internet. MTA-STS also helps to ensure that messages are only sent to authorized servers.
This solution will deploy a valid MTA-STS policy record in Route 53 (or tell you what value to publish in the DNS if you’re not using Route 53) and will create an MTA-STS policy document to be hosted on S3 and delivered through CloudFront with a valid TLS certificate from ACM.
To support MTA-STS, the solution makes the following changes to your resources:
_mta-sts.<your-domain>. The value of this record is: v=STSv1; id=<unique value used for cache invalidation>.https://mta-sts.<your-domain>/.well-known/mta-sts.txt.<your-domain> in both cases is the domain that is used for routing inbound mail to your organization and is typically the same domain that is used in the From header of messages that your organization sends externally. Depending on the complexity of your organization, you might receive inbound mail for multiple domains, and you might choose to publish MTA-STS policies for each domain.In the example MTA-STS policy file provided in the GitHub repository and explained later in this post, the MTA-STS policy mode is set to testing. This means that your email server is advertising its willingness to negotiate encrypted email connections, but it does not require TLS. Servers that want to send mail to you are allowed to connect and deliver mail even if there are problems in the TLS connection, as long as you’re in testing mode. You should expect reports when servers try to connect through TLS to your mail server and fail to do so.
Be fully prepared before you change the MTA-STS policy to enforce. After this policy is set to enforce, servers that follow the MTA-STS policy and that experience an enforceable TLS-related error when they try to connect to your mail server will not deliver mail to your mail server. This is a difficult situation to detect. You will simply stop receiving email from servers that comply with the policy. You might receive reports from them indicating what errors they encountered, but it is not guaranteed. Be sure that the email address you provide in SMTP TLS reporting (in the following section) is functional and monitored by people who can take action to fix issues. If you miss TLS failure reports, you probably won’t receive email. If the TLS certificate that you use on your email server expires, and your MTA-STS policy is set to enforce, this will become an urgent issue and will disrupt the flow of email until it is fixed.
SMTP TLS reporting is described by the IETF in RFC 8460 as follows:
A number of protocols exist for establishing encrypted channels between SMTP Mail Transfer Agents (MTAs), including STARTTLS, DNS-Based Authentication of Named Entities (DANE) TLSA, and MTA Strict Transport Security (MTA-STS). These protocols can fail due to misconfiguration or active attack, leading to undelivered messages or delivery over unencrypted or unauthenticated channels. This document describes a reporting mechanism and format by which sending systems can share statistics and specific information about potential failures with recipient domains. Recipient domains can then use this information to both detect potential attacks and diagnose unintentional misconfigurations.
As you gain the security benefits of MTA-STS, SMTP TLS reporting will allow you to receive reports from other internet email providers. These reports contain information that is valuable when monitoring your TLS security posture, identifying problems, and learning about attacks that might be occurring.
This solution will deploy a valid SMTP TLS reporting record on Route 53 (or provide you with the value to publish in the DNS if you are not using Route 53).
To support SMTP TLS reporting, the solution makes the following changes to your resources:
_smtp._tls.<your-domain>. The value of this record is: v=TLSRPTv1; rua=mailto:<report-receiver-email-address><report-receiver-email-address> might be an address in your domain or in a third-party provider. Automated systems that process these reports must be capable of processing GZIP compressed files and parsing JSON.In this section, you’ll learn how to deploy the solution to create the previously described AWS resources in your account.
git clone https://github.com/aws-samples/serverless-mail
 cd serverless-mail/email-security-records
CONFIG.py to reflect your desired settings, as follows:
VMC_FILENAME = None.ROUTE_53_HOSTED = False. In this case, you will need to set TLS_CERTIFICATE_ARN to the Amazon Resource Name (ARN) of a certificate hosted on ACM in us-east-1. This certificate is used by CloudFront and must support two subdomains: mta-sts and your configured BIMI_ASSET_SUBDOMAIN.assets folder.assets/.well-known/mta-sts.txt to reflect your mail exchange (MX) servers and policy requirements. An example file is provided at assets/.well-known/mta-sts.txt.exampleemail-security-records folder.python3 -m venv .venv
source .venv/bin/activatepip install -r requirements.txtUsing AWS CDK version 2.17.0 or later, deploy the bootstrap in the target account by running the following command. To learn more, see Bootstrapping in the AWS CDK Developer Guide.
cdk bootstrap
cdk synth cdk deploy
Note: If you use Route53, these records are created and activated in your DNS zones as soon as the CDK finishes deploying. As the records propagate through the DNS, they will gradually start affecting the email in the affected domains.
After you have deployed the CDK solution, you can test it to confirm that the DNS records and web resources are published correctly.
dig +short TXT default._bimi.<your-domain.example>
Verify the response. For example:
"v=BIMI1; l=https://bimi-assets.<your-domain.example>/logo.svg"
https://bimi-assets.<your-domain.example>/logo.svg) to verify that the logo is available and that the HTTPS certificate is valid.dig +short TXT _mta-sts.<your-domain.example>
The value of this record is as follows:
v=STSv1; id=<unique value used for cache invalidation>
https://mta-sts.<your-domain.example>/.well-known/mta-sts.txtdig +short TXT _smtp._tls.<your-domain.example>
Verify the response. For example:
"v=TLSRPTv1; rua=mailto:<your email address>"
Depending on which domains you communicate with on the internet, you will begin to see TLS reports arriving at the email address that you have defined in the TLS reporting DNS record. We recommend that you closely examine the TLS reports, and use automated analytical techniques over an extended period of time before changing the default testing value of your domain’s MTA-STS policy. Not every email provider will send TLS reports, but examining the reports in aggregate will give you a good perspective for making changes to your MTA-STS policy.
To remove the resources created by this solution:
cdk-email-security-records folder.cdk destroy.Note: The asset and log buckets are automatically emptied and deleted by the cdk destroy command.
When external systems send email to or receive email from your domains they will now query your new DNS records and will look up your domain’s BIMI, MTA-STS, and TLS reporting information from your new CloudFront distribution. By adopting the email domain security mechanisms outlined in this post, you can improve the overall security posture of your email environment, as well as the perception of your brand.
If you have feedback about this post, submit comments in the Comments section below. If you have questions about this post, contact AWS Support.
Want more AWS Security news? Follow us on Twitter.
Post Syndicated from original https://lwn.net/Articles/924746/
While the 6.3 kernel has gained more support for the Rust language, it
still remains true that there is little that can be done in Rust beyond the
creation of a “hello world” module. That functionality was already
available in C, of course, with a level of safety similar to what Rust can
provide. Interest is growing, though, in merging actually useful modules
written in Rust; that will require some more capable infrastructure than is
currently present. A recent discussion on the handling of time values in
Rust demonstrates the challenges — and opportunities — inherent in this
effort.
Post Syndicated from Kristian Freeman original https://blog.cloudflare.com/how-we-built-an-open-source-seo-tool-using-workers-d1-and-queues/


Building applications on Cloudflare Workers has always been fun. Workers applications have low latency response times by default, and easy developer ergonomics thanks to Wrangler. It’s no surprise that for years now, developers have been going from idea to production with Workers in just a few minutes.
Internally, we’re no different. When a member of our team has a project idea, we often reach for Workers first, and not just for the MVP stage, but in production, too. Workers have been a secret ingredient to Cloudflare’s innovation for some time now, allowing us to build products like Access, Stream and Workers KV. Even better, when we have new ideas and we can use new Cloudflare products to build them, it’s a great way to give feedback on those products.
We’ve discussed this in the past on the Cloudflare blog – in May last year, I wrote how we rebuilt Cloudflare’s developer documentation using many of the tools that had recently been released in the Workers ecosystem: Cloudflare Pages for hosting, and Bulk Redirects for the redirect rules. In November, we released a new version of our API documentation, which again used Pages for hosting, and Pages functions for intelligent caching and transformation of our API schema.
In this blog post, I’m excited to show off some of the new tools in Cloudflare’s developer arsenal, D1 and Queues, to prototype and ship an internal tool for our SEO experts at Cloudflare. We’ve made this project, which we’re calling Prospector, open-source too – check it out in our cloudflare/templates repo on GitHub. Whether you’re a developer looking to understand how to use multiple parts of Cloudflare’s developer stack together, or an SEO specialist who may want to deploy the tool in production, we’ve made it incredibly easy to get up and running.
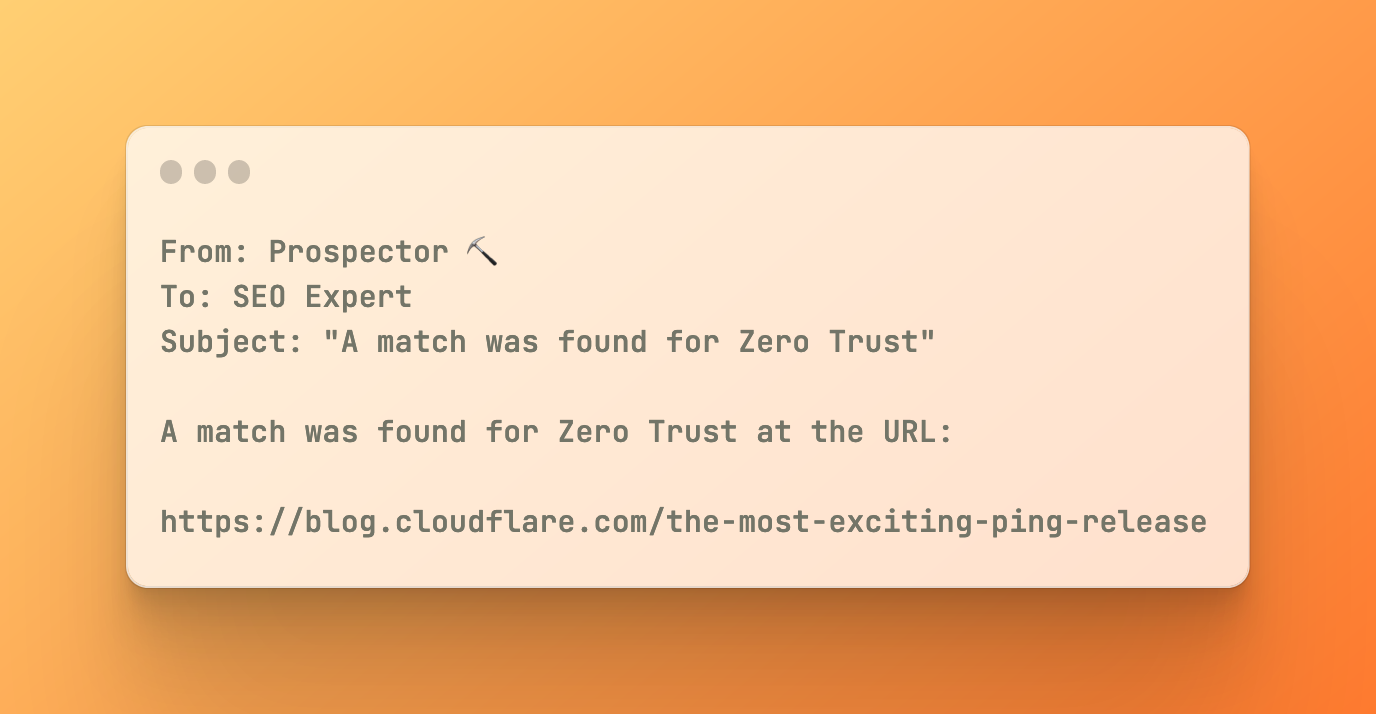
Prospector is a tool that allows Cloudflare’s SEO experts to monitor our blog and marketing site for specific keywords. When a keyword is matched on a page, Prospector will notify an email address. This allows our SEO experts to stay informed of any changes to our website, and take action accordingly.
Using MailChannels’ integration with Workers, we can quickly and easily send emails from our application using a single API call. This allows us to focus on the core functionality of the application, and not worry about the details of sending emails.
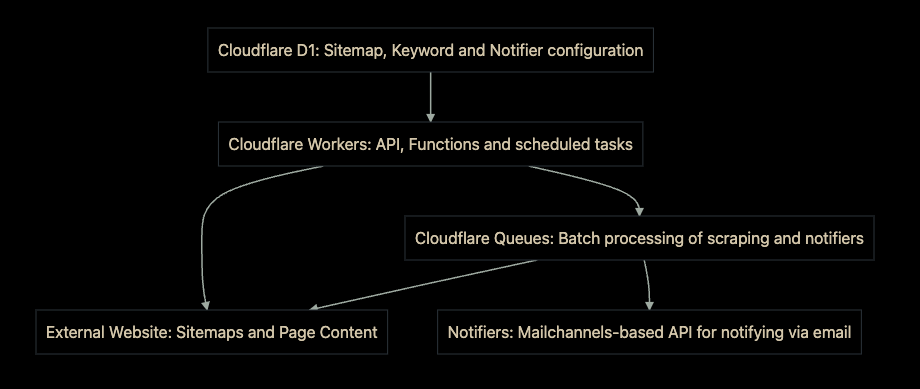
Prospector uses Cloudflare Workers as the user-facing API for the application. It uses D1 to store and retrieve data in real-time, and Queues to handle the fetching of all URLs and the notification process. We’ve also included an intuitive user interface for the application, which is built with HTML, CSS, and JavaScript.
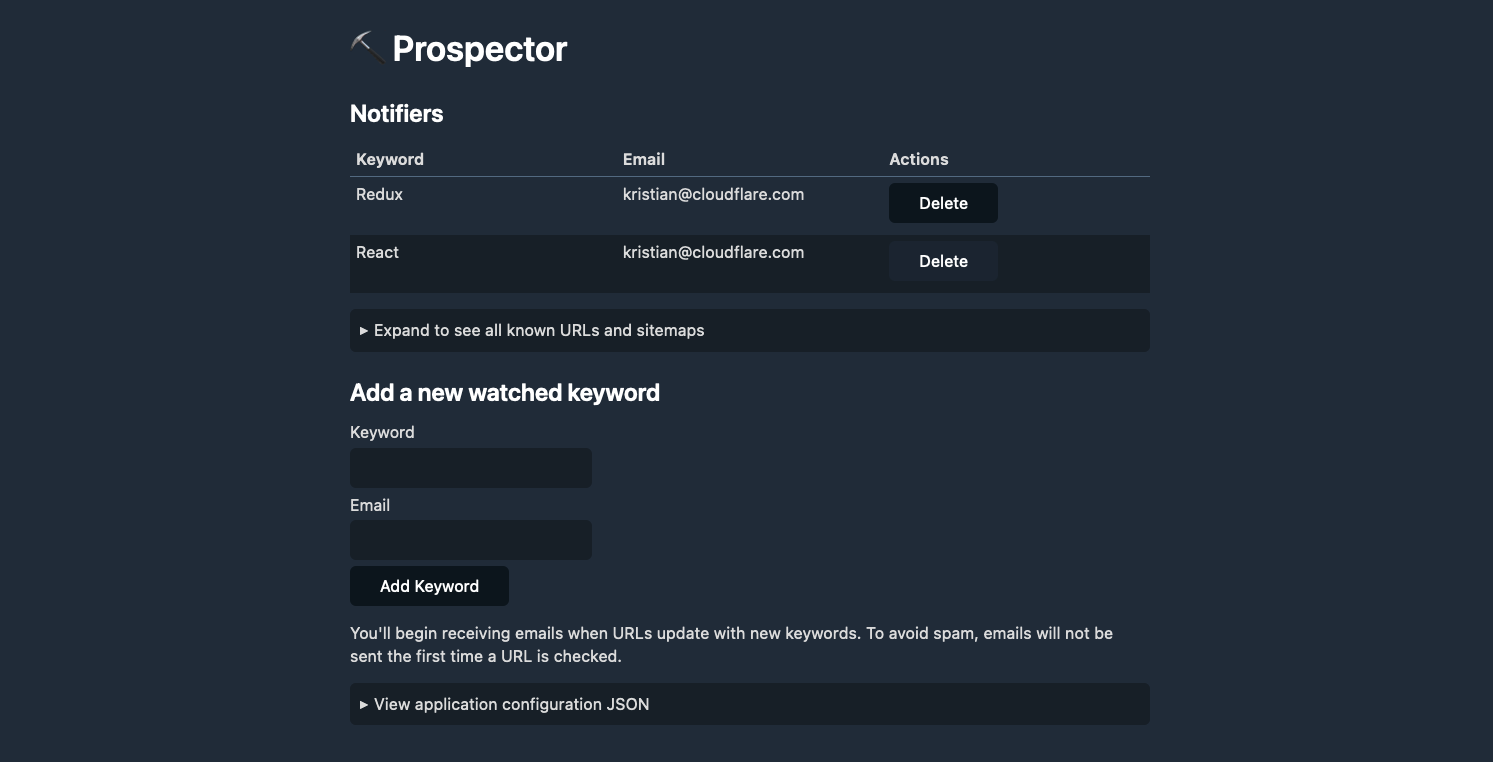
It is widely known in SEO that both internal and external links help Google and other search engines understand what a website is about, which impacts keyword rankings. Not only do these links guide readers to additional helpful information, they also allow web crawlers for search engines to discover and index content on the site.
Acquiring external links is often a time-consuming process and at the discretion of third parties, whereas website owners typically have much more control over internal links. As a result, internal linking is one of the most useful levers available in SEO.
In an ideal world, every piece of content would be fully formed upon publication, replete with helpful internal links throughout the piece. However, this is often not the case. Many times, content is edited after the fact or additional pieces of relevant content come along after initial publication. These situations result in missed opportunities for internal linking.
Like other large organizations, Cloudflare has published thousands of blogs and web pages over the years. We share new content every time a product/technology is introduced and improved. Ultimately, that also means it’s become more challenging to identify opportunities for internal linking in a timely, automated fashion. We needed a tool that would allow us to identify internal linking opportunities as they appear, and speed up the time it takes to identify new internal linking opportunities.
Although we tested several tools that might solve this problem, we found that they were limited in several ways. First, some tools only scanned the first 2,000 characters of a web page. Any opportunities found beyond that limit would not be detected. Next, some tools did not allow us to limit searches to certain areas of the site and resulted in many false positives. Finally, other potential solutions required manual operation, leaving the process at the mercy of human memory.
To solve our problem (and ultimately, improve our SEO), we needed an automated tool that could discover and notify us of new instances of targeted phrases on a specified range of pages.
First, let’s explore the data model for Prospector. We have two main tables: notifiers and urls. The notifiers table stores the email address and keyword that we want to monitor. The urls table stores the URL and sitemap that we want to scrape. The notifiers table has a one-to-many relationship with the urls table, meaning that each notifier can have many URLs associated with it.
In addition, we have a sitemaps table that stores the sitemap URLs that we’ve scraped. Many larger websites don’t just have a single sitemap: the Cloudflare blog, for instance, has a primary sitemap that contains four sub-sitemaps. When the application is deployed, a primary sitemap is provided as configuration, and Prospector will parse it to find all of the sub-sitemaps.
Finally, notifier_matches is a table that stores the matches between a notifier and a URL. This allows us to keep track of which URLs have already been matched, and which ones still need to be processed. When a match has been found, the notifier_matches table is updated to reflect that, and “matches” for a keyword are no longer processed. This saves our SEO experts from a crowded inbox, and allows them to focus and act on new matches.
Connecting the pieces with Cloudflare Queues
Cloudflare Queues acts as the work queue for Prospector. When a new notifier is added, a new job is created for it and added to the queue. Behind the scenes, Queues will distribute the work across multiple Workers, allowing us to scale the application as needed. When a job is processed, Prospector will scrape the URL and check for matches. If a match is found, Prospector will send an email to the notifier’s email address.
Using the Cron Triggers functionality in Workers, we can schedule the scraping process to run at a regular interval – by default, once a day. This allows us to keep our data up-to-date, and ensures that we’re always notified of any changes to our website. It also allows the end-user to configure when they receive emails in case they want to receive them more or less frequently, or at the beginning of their workday.
The Module Workers syntax for Workers makes accessing the application bindings – the constants available in the application for querying D1, Queues, and other services – incredibly easy. src/index.ts, the entrypoint for the application, looks like this:
import { DBUrl, Env } from './types'

import {
  handleQueuedUrl,
  scheduled,
} from './functions';

import h from './api'

export default {
  async fetch(
	request: Request,
	env: Env,
	ctx: ExecutionContext
  ): Promise<Response> {
	return h.fetch(request, env, ctx)
  },

  async queue(
	batch: MessageBatch<Error>,
	env: Env
  ): Promise<void> {
	for (const message of batch.messages) {
  	const url: DBUrl = JSON.parse(message.body)
  	await handleQueuedUrl(url, env.DB)
	}
  },

  async scheduled(
	env: Env,
  ): Promise<void> {
	await scheduled({
  	authToken: env.AUTH_TOKEN,
  	db: env.DB,
  	queue: env.QUEUE,
  	sitemapUrl: env.SITEMAP_URL,
	})
  }
};
With this syntax, we can see where the various events incoming to the application – the fetch event, the queue event, and the scheduled event – are handled. The fetch event is the main entrypoint for the application, and is where we handle all of the API routes. The queue event is where we handle the work that’s been added to the queue, and the scheduled event is where we handle the scheduled scraping process.
Central to the application, of course, is Workers – acting as the API gateway and coordinator. We’ve elected to use the popular open-source framework Hono, an Express-style API for Workers, in Prospector. With Hono, we can quickly map out a REST API in just a few lines of code. Here’s an example of a few API routes and how they’re defined with Hono:
const app = new Hono()

app.get("/", (context) => {
  return context.html(index)
})

app.post("/notifiers", async context => {
  try {
	const { keyword, email } = await context.req.parseBody()
	await context.env.DB.prepare(
  	"insert into notifiers (keyword, email) values (?, ?)"
	).bind(keyword, email).run()
	return context.redirect('/')
  } catch (err) {
	context.status(500)
	return context.text("Something went wrong")
  }
})

app.get('/sitemaps', async (context) => {
  const query = await context.env.DB.prepare(
	"select * from sitemaps"
  ).all();
  const sitemaps: Array<DBSitemap> = query.results
  return context.json(sitemaps)
})
Crucial to the development of Prospector are the improved TypeScript bindings for Workers. As announced in November of last year, TypeScript bindings for Workers are now automatically generated based on our open source runtime, workerd. This means that whenever we use the types provided from the @cloudflare/workers-types package in our application, we can be sure that the types are always up-to-date.
With these bindings, we can define the types for our environment variables, and use them in our application. Here’s an example of the Env type, which defines the environment variables that we use in the application:
export interface Env {
  AUTH_TOKEN: string
  DB: D1Database
  QUEUE: Queue
  SITEMAP_URL: string
}
Notice the types of the DB and QUEUE bindings – D1Database and Queue, respectively. These types are automatically generated, complete with type signatures for each method inside of the D1 and Queue APIs. This means that we can be sure that we’re using the correct methods, and that we’re passing the correct arguments to them, directly from our text editor – without having to refer to the documentation.
One of my favorite things about Workers is that deploying applications is quick and easy. Using `wrangler.toml` and some simple build scripts, we can deploy a fully-functional application in just a few minutes. Prospector is no different. With just a few commands, we can create the necessary D1 database and Queues instance, and deploy the application to our account.
First, you’ll need to clone the repository from our cloudflare/templates repository:
git clone $URL
If you haven’t installed wrangler yet, you can do so by running:
npm install @cloudflare/wrangler -g
With Wrangler installed, you can login to your account by running:
wrangler login
After you’ve done that, you’ll need to create a new D1 database, as well as a Queues instance. You can do this by running the following commands:
wrangler d1 create $DATABASE_NAMEwrangler queues create $QUEUE_NAME
Configure your wrangler.toml with the appropriate bindings (see [the README](URL) for an example):
[[ d1_databases ]]
binding = "DB"
database_name = "keyword-tracker-db"
database_id = "ab4828aa-723b-4a77-a3f2-a2e6a21c4f87"
preview_database_id = "8a77a074-8631-48ca-ba41-a00d0206de32"

[[queues.producers]]
  queue = "queue"
  binding = "QUEUE"

[[queues.consumers]]
  queue = "queue"
  max_batch_size = 10
  max_batch_timeout = 30
  max_retries = 10
  dead_letter_queue = "queue-dlq"
Next, you can run the bin/migrate script to create the tables in your database:
bin/migrate
This will create all the needed tables in your database, both in development (locally) and in production. Note that you’ll even see the creation of a honest-to-goodness .sqlite3 file in your project directory – this is the local development database, which you can connect to directly using the same SQLite CLI that you’re used to:
$ sqlite3 .wrangler/state/d1/DB.sqlite3sqlite> .tables notifier_matches notifiers sitemaps urls
Finally, you can deploy the application to your account:
npm run deploy
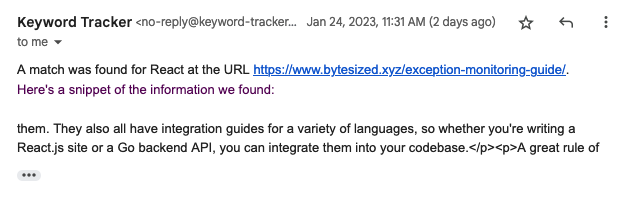
With a deployed application, you can visit your Workers URL to see the user interface. From there, you can add new notifiers and URLs, and see the results of your scraping process. When a new keyword match is found, you’ll receive an email with the details of the match instantly:
For some time, there have been a great deal of applications that were hard to build on Workers without relational data or background task tooling. Now, with D1 and Queues, we can build applications that seamlessly integrate between real-time user interfaces, geographically distributed data, background processing, and more, all using the same developer ergonomics and low latency that Workers is known for.
D1 has been crucial for building this application. On larger sites, the number of URLs that need to be scraped can be quite large. If we were to use Workers KV, our key-value store, for storing this data, we would quickly struggle with how to model, retrieve, and update the data needed for this use-case. With D1, we can build relational data models and quickly query just the data we need for each queued processing task.
Using these tools, developers can build internal tools and applications for their companies that are more powerful and more scalable than ever before. With the integration of Cloudflare’s Zero Trust suite, developers can make these applications secure by default, and deploy them to Cloudflare’s global network. This allows developers to build applications that are fast, secure, and reliable, all without having to worry about the underlying infrastructure.
Prospector is a great example of how easy it is to build applications on Cloudflare Workers. With the recent addition of D1 and Queues, we’ve been able to build fully-functional applications that require real-time data and background processing in just a few hours. We’re excited to share the open-source code for Prospector, and we’d love to hear your feedback on the project.
If you have any questions, feel free to reach out to us on Twitter at @cloudflaredev, or join us in the Cloudflare Workers Discord community, which recently hit 20k members and is a great place to ask questions and get help from other developers.
Post Syndicated from original https://lwn.net/Articles/924922/
Security updates have been issued by CentOS (git), Debian (spip), Fedora (epiphany), Mageia (binwalk, chromium-browser-stable, crmsh, emacs, libraw, libtiff, nodejs, pkgconf, tar, and vim), Oracle (kernel and systemd), SUSE (emacs, kernel, nrpe, and rubygem-activerecord-4_2), and Ubuntu (c-ares, git, postgresql-12, postgresql-14, and sox).
Post Syndicated from Ivan Nikulin original https://blog.cloudflare.com/introducing-oxy/


In this blog post, we are proud to introduce Oxy – our modern proxy framework, developed using the Rust programming language. Oxy is a foundation of several Cloudflare projects, including the Zero Trust Gateway, the iCloud Private Relay second hop proxy, and the internal egress routing service.
Oxy leverages our years of experience building high-load proxies to implement the latest communication protocols, enabling us to effortlessly build sophisticated services that can accommodate massive amounts of daily traffic.
We will be exploring Oxy in greater detail in upcoming technical blog posts, providing a comprehensive and in-depth look at its capabilities and potential applications. For now, let us embark on this journey and discover what Oxy is and how we built it.
We refer to Oxy as our “next-generation proxy framework”. But what do we really mean by “proxy framework”? Picture a server (like NGINX, that reader might be familiar with) that can proxy traffic with an array of protocols, including various predefined common traffic flow scenarios that enable you to route traffic to specific destinations or even egress with a different protocol than the one used for ingress. This server can be configured in many ways for specific flows and boasts tight integration with the surrounding infrastructure, whether telemetry consumers or networking services.
Now, take all of that and add in the ability to programmatically control every aspect of the proxying: protocol decapsulation, traffic analysis, routing, tunneling logic, DNS resolution, and so much more. And this is what Oxy proxy framework is: a feature-rich proxy server tightly integrated with our internal infrastructure that’s customizable to meet application requirements, allowing engineers to tweak every component.
This design is in line with our belief in an iterative approach to development, where a basic solution is built first and then gradually improved over time. With Oxy, you can start with a basic solution that can be deployed to our servers and then add additional features as needed, taking advantage of the many extensibility points offered by Oxy. In fact, you can avoid writing any code, besides a few lines of bootstrap boilerplate and get a production-ready server with a wide variety of startup configuration options and traffic flow scenarios.
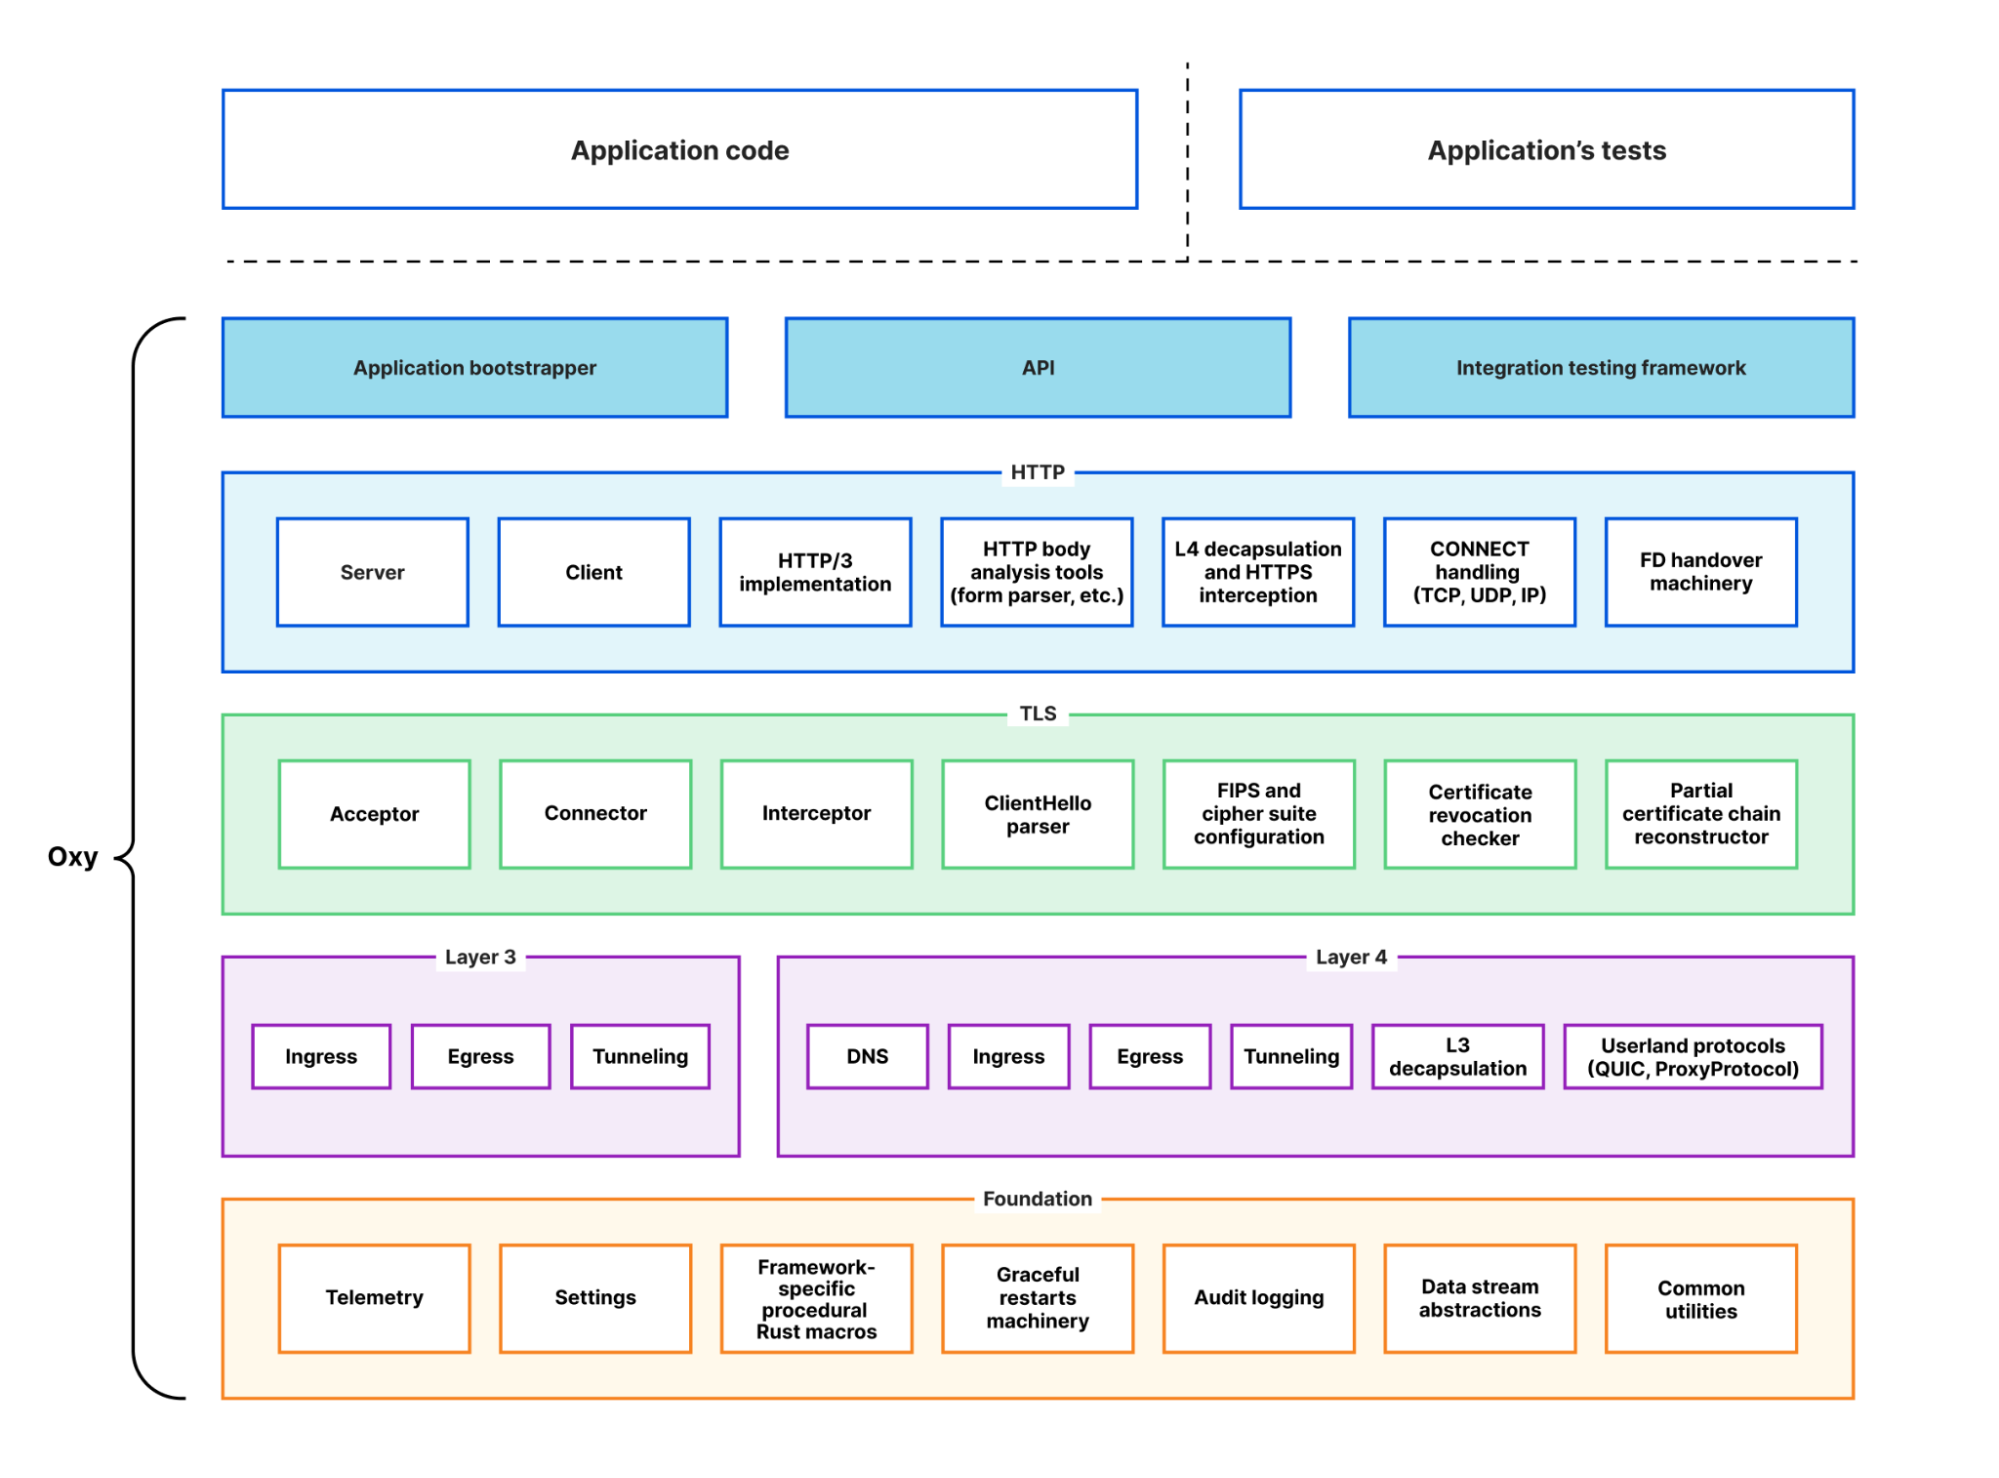
For example, suppose you’d like to implement an HTTP firewall. With Oxy, you can proxy HTTP(S) requests right out of the box, eliminating the need to write any code related to production services, such as request metrics and logs. You simply need to implement an Oxy hook handler for HTTP requests and responses. If you’ve used Cloudflare Workers before, then you should be familiar with this extensibility model.
Similarly, you can implement a layer 4 firewall by providing application hooks that handle ingress and egress connections. This goes beyond a simple block/accept scenario, as you can build authentication functionality or a traffic router that sends traffic to different destinations based on the geographical information of the ingress connection. The capabilities are incredibly rich, and we’ve made the extensibility model as ergonomic and flexible as possible. As an example, if information obtained from layer 4 is insufficient to make an informed firewall decision, the app can simply ask Oxy to decapsulate the traffic and process it with HTTP firewall.
The aforementioned scenarios are prevalent in many products we build at Cloudflare, so having a foundation that incorporates ready solutions is incredibly useful. This foundation has absorbed lots of experience we’ve gained over the years, taking care of many sharp and dark corners of high-load service programming. As a result, application implementers can stay focused on the business logic of their application with Oxy taking care of the rest. In fact, we’ve been able to create a few privacy proxy applications using Oxy that now serve massive amounts of traffic in production with less than a couple of hundred lines of code. This is something that would have taken multiple orders of magnitude more time and lines of code before.
As previously mentioned, we’ll dive deeper into the technical aspects in future blog posts. However, for now, we’d like to provide a brief overview of Oxy’s capabilities. This will give you a glimpse of the many ways in which Oxy can be customized and used.
On-ramp defines a combination of transport layer socket type and protocols that server listeners can use for ingress traffic.
Oxy supports a wide variety of traffic on-ramps:
With Oxy, you have the ability to analyze and manipulate traffic at multiple layers of the OSI model – from layer 3 to layer 7. This allows for a wide range of possibilities in terms of how you handle incoming traffic.
One of the most notable and powerful features of Oxy is the ability for applications to force decapsulation. This means that an application can analyze traffic at a higher level, even if it originally arrived at a lower level. For example, if an application receives IP traffic, it can choose to analyze the UDP traffic encapsulated within the IP packets. With just a few lines of code, the application can tell Oxy to upgrade the IP flow to a UDP tunnel, effectively allowing the same code to be used for different on-ramps.
The application can even go further and ask Oxy to sniff UDP packets and check if they contain HTTP/3 traffic. In this case, Oxy can upgrade the UDP traffic to HTTP and handle HTTP/3 requests that were originally received as raw IP packets. This allows for the simultaneous processing of traffic at all three layers (L3, L4, L7), enabling applications to analyze, filter, and manipulate the traffic flow from multiple perspectives. This provides a robust toolset for developing advanced traffic processing applications.
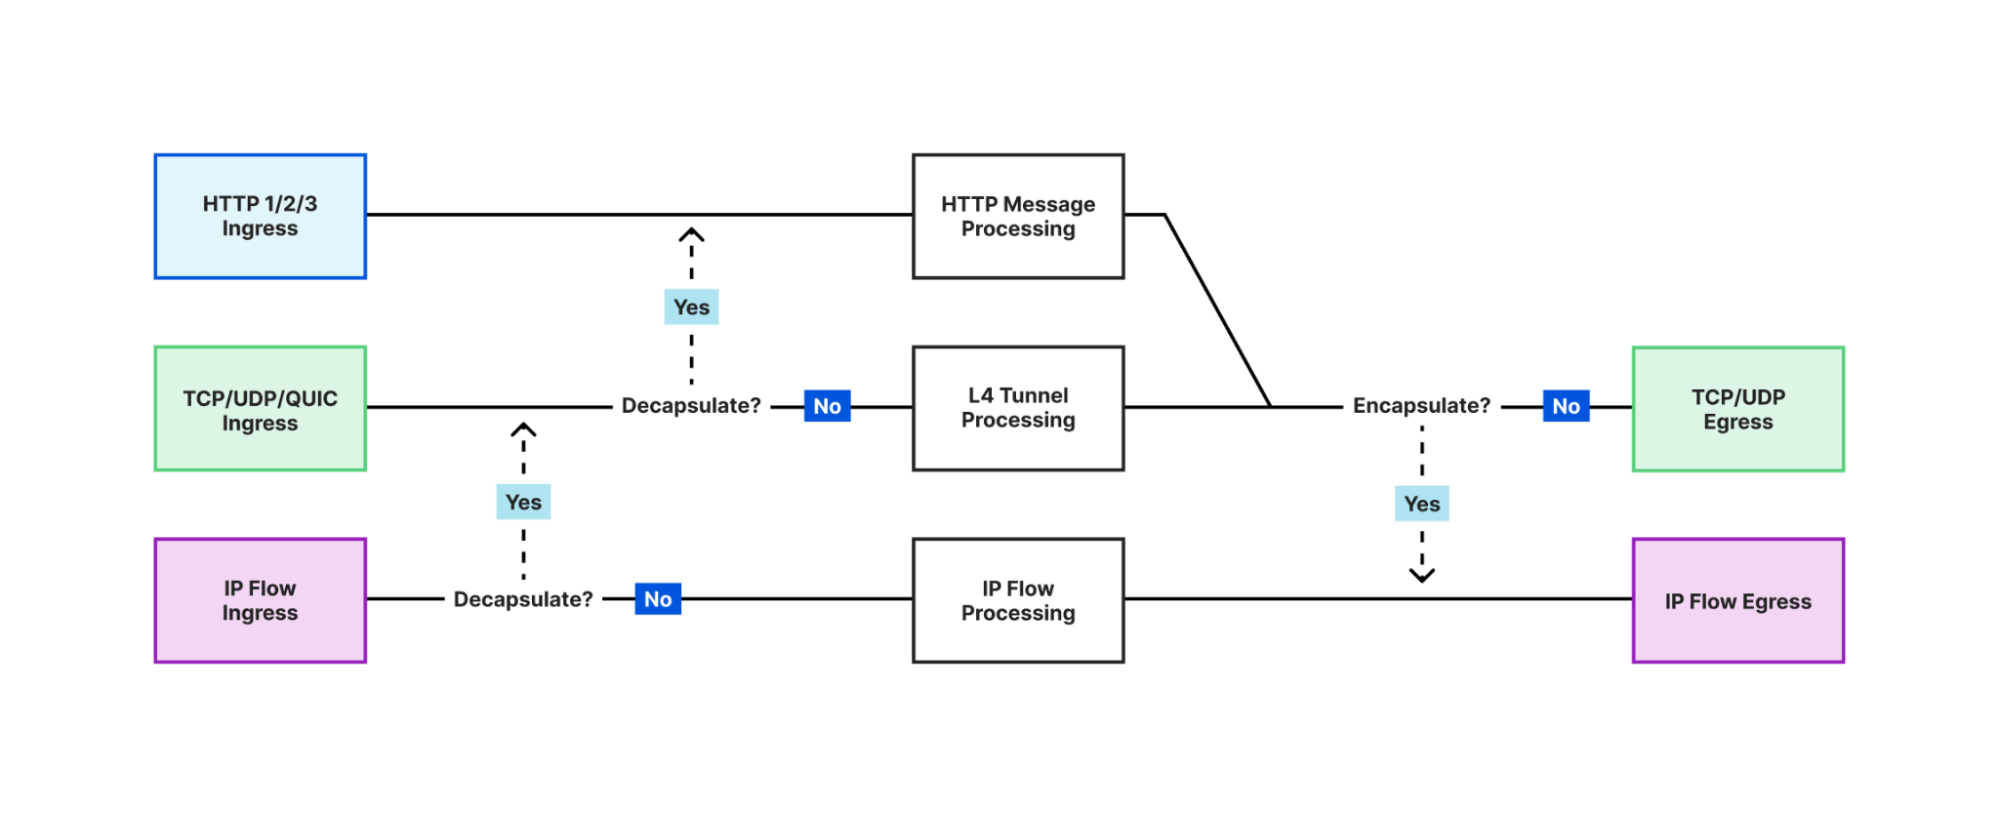
Off-ramp defines a combination of transport layer socket type and protocols that proxy server connectors can use for egress traffic.
Oxy offers versatility in its egress methods, supporting a range of protocols including HTTP 1 and 2, UDP, TCP, and IP. It is equipped with internal DNS resolution and caching, as well as customizable resolvers, with automatic fallback options for maximum system reliability. Oxy implements happy eyeballs for TCP, advanced tunnel timeout logic and has the ability to route traffic to internal services with accompanying metadata.
Additionally, through collaboration with one of our internal services (which is an Oxy application itself!) Oxy is able to offer geographical egress — allowing applications to route traffic to the public Internet from various locations in our extensive network covering numerous cities worldwide. This complex and powerful feature can be easily utilized by Oxy application developers at no extra cost, simply by adjusting configuration settings.
We’ve discussed Oxy’s communication capabilities with the outside world through on-ramps and off-ramps. In the middle, Oxy handles efficient stateful tunneling of various traffic types including TCP, UDP, QUIC, and IP, while giving applications full control over traffic blocking and redirection.
Additionally, Oxy effectively handles HTTP traffic, providing full control over requests and responses, and allowing it to serve as a direct HTTP or API service. With built-in tools for streaming analysis of HTTP bodies, Oxy makes it easy to extract and process data, such as form data from uploads and downloads.
In addition to its multi-layer traffic processing capabilities, Oxy also supports advanced HTTP tunneling methods, such as CONNECT-UDP and CONNECT-IP, using the latest extensions to HTTP 3 and 2 protocols. It can even process HTTP CONNECT request payloads on layer 4 and recursively process the payload as HTTP if the encapsulated traffic is HTTP.
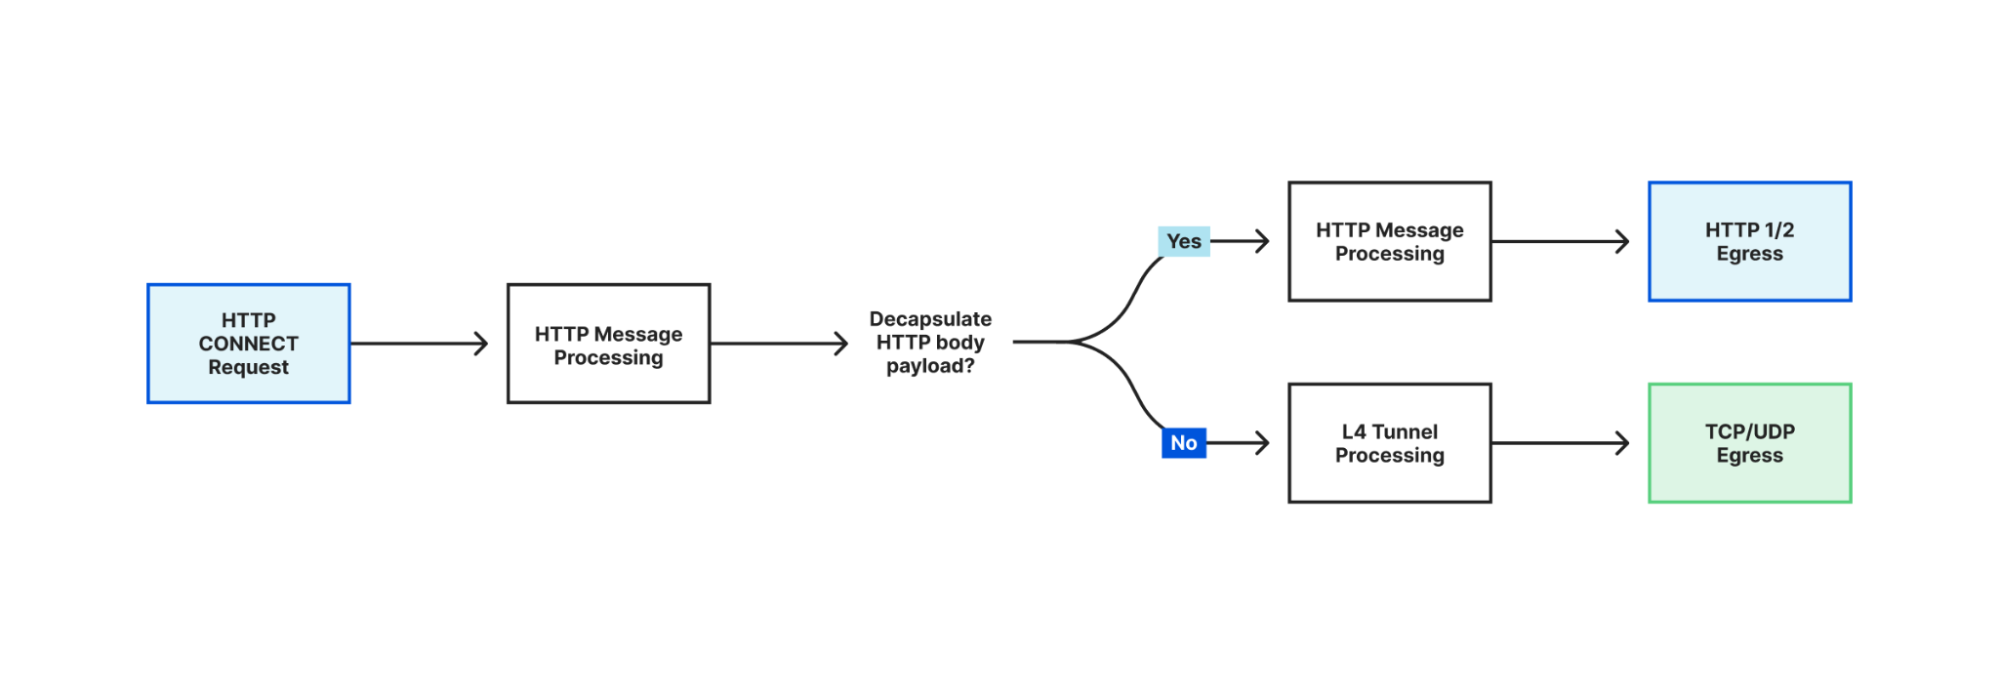
The modern Internet is unimaginable without traffic encryption, and Oxy, of course, provides this essential aspect. Oxy’s cryptography and TLS are based on BoringSSL, providing both a FIPS-compliant version with a limited set of certified features and the latest version that supports all the currently available TLS features. Oxy also allows applications to switch between the two versions in real-time, on a per-request or per-connection basis.
Oxy’s TLS client is designed to make HTTPS requests to upstream servers, with the functionality and security of a browser-grade client. This includes the reconstruction of certificate chains, certificate revocation checks, and more. In addition, Oxy applications can be secured with TLS v1.3, and optionally mTLS, allowing for the extraction of client authentication information from x509 certificates.
Oxy has the ability to inspect and filter HTTPS traffic, including HTTP/3, and provides the means for dynamically generating certificates, serving as a foundation for implementing data loss prevention (DLP) products. Additionally, Oxy’s internal fork of BoringSSL, which is not FIPS-compliant, supports the use of raw public keys as an alternative to WebPKI, making it ideal for internal service communication. This allows for all the benefits of TLS without the hassle of managing root certificates.
Oxy is more than just a set of building blocks for network applications. It acts as a cohesive glue, handling the bootstrapping of the entire proxy application with ease, including parsing and applying configurations, setting up an asynchronous runtime, applying seccomp hardening and providing automated graceful restarts functionality.
With built-in support for panic reporting to Sentry, Prometheus metrics with a Rust-macro based API, Kibana logging, distributed tracing, memory and runtime profiling, Oxy offers comprehensive monitoring and analysis capabilities. It can also generate detailed audit logs for layer 4 traffic, useful for billing and network analysis.
To top it off, Oxy includes an integration testing framework, allowing for easy testing of application interactions using TypeScript-based tests.
To take full advantage of Oxy’s capabilities, one must understand how to extend and configure its features. Oxy applications are configured using YAML configuration files, offering numerous options for each feature. Additionally, application developers can extend these options by leveraging the convenient macros provided by the framework, making customization a breeze.
Suppose the Oxy application uses a key-value database to retrieve user information. In that case, it would be beneficial to expose a YAML configuration settings section for this purpose. With Oxy, defining a structure and annotating it with the #[oxy_app_settings] attribute is all it takes to accomplish this:
///Application’s key-value (KV) database settings
#[oxy_app_settings]
pub struct MyAppKVSettings {
    /// Key prefix.
    pub prefix: Option<String>,
    /// Path to the UNIX domain socket for the appropriate KV
    /// server instance.
    pub socket: Option<String>,
}
Oxy can then generate a default YAML configuration file listing available options and their default values, including those extended by the application. The configuration options are automatically documented in the generated file from the Rust doc comments, following best Rust practices.
Moreover, Oxy supports multi-tenancy, allowing a single application instance to expose multiple on-ramp endpoints, each with a unique configuration. But, sometimes even a YAML configuration file is not enough to build a desired application, this is where Oxy’s comprehensive set of hooks comes in handy. These hooks can be used to extend the application with Rust code and cover almost all aspects of the traffic processing.
To give you an idea of how easy it is to write an Oxy application, here is an example of basic Oxy code:
struct MyApp;

// Defines types for various application extensions to Oxy's
// data types. Contexts provide information and control knobs for
// the different parts of the traffic flow and applications can extend // all of them with their custom data. As was mentioned before,
// applications could also define their custom configuration.
// It’s just a matter of defining a configuration object with
// `#[oxy_app_settings]` attribute and providing the object type here.
impl OxyExt for MyApp {
    type AppSettings = MyAppKVSettings;
    type EndpointAppSettings = ();
    type EndpointContext = ();
    type IngressConnectionContext = MyAppIngressConnectionContext;
    type RequestContext = ();
    type IpTunnelContext = ();
    type DnsCacheItem = ();

}

#[async_trait]
impl OxyApp for MyApp {
    fn name() -> &'static str {
        "My app"
    }

    fn version() -> &'static str {
        env!("CARGO_PKG_VERSION")
    }

    fn description() -> &'static str {
        "This is an example of Oxy application"
    }

    async fn start(
        settings: ServerSettings<MyAppSettings, ()>
    ) -> anyhow::Result<Hooks<Self>> {
        // Here the application initializes various hooks, with each
        // hook being a trait implementation containing multiple
        // optional callbacks invoked during the lifecycle of the
        // traffic processing.
        let ingress_hook = create_ingress_hook(&settings);
        let egress_hook = create_egress_hook(&settings);
        let tunnel_hook = create_tunnel_hook(&settings);
        let http_request_hook = create_http_request_hook(&settings);
        let ip_flow_hook = create_ip_flow_hook(&settings);

        Ok(Hooks {
            ingress: Some(ingress_hook),
            egress: Some(egress_hook),
            tunnel: Some(tunnel_hook),
            http_request: Some(http_request_hook),
            ip_flow: Some(ip_flow_hook),
            ..Default::default()
        })
    }
}

// The entry point of the application
fn main() -> OxyResult<()> {
    oxy::bootstrap::<MyApp>()
}
Oxy leverages the safety and performance benefits of Rust as its implementation language. At Cloudflare, Rust has emerged as a popular choice for new product development, and there are ongoing efforts to migrate some of the existing products to the language as well.
Rust offers memory and concurrency safety through its ownership and borrowing system, preventing issues like null pointers and data races. This safety is achieved without sacrificing performance, as Rust provides low-level control and the ability to write code with minimal runtime overhead. Rust’s balance of safety and performance has made it popular for building safe performance-critical applications, like proxies.
We intentionally tried to stand on the shoulders of the giants with this project and avoid reinventing the wheel. Oxy heavily relies on open-source dependencies, with hyper and tokio being the backbone of the framework. Our philosophy is that we should pull from existing solutions as much as we can, allowing for faster iteration, but also use widely battle-tested code. If something doesn’t work for us, we try to collaborate with maintainers and contribute back our fixes and improvements. In fact, we now have two team members who are core team members of tokio and hyper projects.
Even though Oxy is a proprietary project, we try to give back some love to the open-source community without which the project wouldn’t be possible by open-sourcing some of the building blocks such as https://github.com/cloudflare/boring and https://github.com/cloudflare/quiche.
At the beginning of our journey, we set out to implement a proof-of-concept for an HTTP firewall using Rust for what would eventually become Zero Trust Gateway product. This project was originally part of the WARP service repository. However, as the PoC rapidly advanced, it became clear that it needed to be separated into its own Gateway proxy for both technical and operational reasons.
Later on, when tasked with implementing a relay proxy for iCloud Private Relay, we saw the opportunity to reuse much of the code from the Gateway proxy. The Gateway project could also benefit from the HTTP/3 support that was being added for the Private Relay project. In fact, early iterations of the relay service were forks of the Gateway server.
It was then that we realized we could extract common elements from both projects to create a new framework, Oxy. The history of Oxy can be traced back to its origins in the commit history of the Gateway and Private Relay projects, up until its separation as a standalone framework.
Since our inception, we have leveraged the power of Oxy to efficiently roll out multiple projects that would have required a significant amount of time and effort without it. Our iterative development approach has been a strength of the project, as we have been able to identify common, reusable components through hands-on testing and implementation.
Our small core team is supplemented by internal contributors from across the company, ensuring that the best subject-matter experts are working on the relevant parts of the project. This contribution model also allows us to shape the framework’s API to meet the functional and ergonomic needs of its users, while the core team ensures that the project stays on track.
Although Pingora, another proxy server developed by us in Rust, shares some similarities with Oxy, it was intentionally designed as a separate proxy server with a different objective. Pingora was created to serve traffic from millions of our client’s upstream servers, including those with ancient and unusual configurations. Non-UTF 8 URLs or TLS settings that are not supported by most TLS libraries being just a few such quirks among many others. This focus on handling technically challenging unusual configurations sets Pingora apart from other proxy servers.
The concept of Pingora came about during the same period when we were beginning to develop Oxy, and we initially considered merging the two projects. However, we quickly realized that their objectives were too different to do that. Pingora is specifically designed to establish Cloudflare’s HTTP connectivity with the Internet, even in its most technically obscure corners. On the other hand, Oxy is a multipurpose platform that supports a wide variety of communication protocols and aims to provide a simple way to develop high-performance proxy applications with business logic.
Oxy is a proxy framework that we have developed to meet the demanding needs of modern services. It has been designed to provide a flexible and scalable solution that can be adapted to meet the unique requirements of each project and by leveraging the power of Rust, we made it both safe and fast.
Looking forward, Oxy is poised to play one of the critical roles in our company’s larger effort to modernize and improve our architecture. It provides a solid block in foundation on which we can keep building the better Internet.
As the framework continues to evolve and grow, we remain committed to our iterative approach to development, constantly seeking out new opportunities to reuse existing solutions and improve our codebase. This collaborative, community-driven approach has already yielded impressive results, and we are confident that it will continue to drive the future success of Oxy.
Stay tuned for more tech savvy blog posts on the subject!
Post Syndicated from Николай Марченко original https://bivol.bg/bulgarian-golden-passport-scandal-in-uruguay-with-a-colonel-from-the-russian-interior-ministry.html

Since 2008, Former colonel of the Ministry of Internal Affairs (MIA) of the Russian Federation, Andrey Valeryevich Kashtanov, has held a passport of the Republic of Bulgaria under the notorious…
Post Syndicated from Bruce Schneier original https://www.schneier.com/blog/archives/2023/03/dumb-password-rules.html
Examples of dumb password rules.
There are some pretty bad disasters out there.
My worst experiences are with sites that have artificial complexity requirements that cause my personal password-generation systems to fail. Some of the systems on the list are even worse: when they fail they don’t tell you why, so you just have to guess until you get it right.
Post Syndicated from The Atlantic original https://www.youtube.com/watch?v=nHLrrDD99tg
Post Syndicated from Николай Марченко original https://bivol.bg/pasport-rusnak-uruguay.html

Бивш полковник на Министерството на вътрешните работи (МВР) на Руската Федерация Андрей Валериевич Каштанов от 2008 г. притежава паспорт на Република България по скандалната програма “Гражданство срещу инвестиции”. „Биволъ“ писа…
Post Syndicated from Jeff Barr original https://aws.amazon.com/blogs/aws/in-the-works-aws-region-in-malaysia/
We launched an AWS Region in Australia earlier this year, four more (Switzerland, Spain, the United Arab Emirates, and India) in 2022, and are working on regions in Canada, Israel, New Zealand, and Thailand. All told, we now have 99 Availability Zones spread across 31 geographic regions.
Malaysia in the Works
Today I am happy to announce that we are working on an AWS region in Malaysia. This region will give AWS customers the ability to run workloads and store data that must remain in-country.
The region will include three Availability Zones (AZs), each one physically independent of the others in the region yet far enough apart to minimize the risk that an AZ-level event will have on business continuity. The AZs will be connected to each other by high-bandwidth, low-latency network connections over dedicated, fully-redundant fiber.
AWS in Malaysia
We are planning to invest at least $6 Billion (25.5 billion Malaysian ringgit) in Malaysia by 2037.
Many organizations in Malaysia are already making use of the existing AWS Regions. This includes enterprise and public sector organizations such as Axiata Group, Baba Products, Bank Islam Malaysia, Celcom Digi, PayNet, PETRONAS, Tenaga Nasional Berhad (TNB), Asia Pacific University of Technology & Innovation, Cybersecurity Malaysia, Department of Statistics Malaysia, Ministry of Higher Education Malaysia, and Pos Malaysia, and startups like Baba’s, BeEDucation Adventures, CARSOME, and StoreHub.
Here’s a small sample of some of the exciting and innovative work that our customers are doing in Malaysia:
Johor Corporation (JCorp) is the principal development institution that drives the growth of the state of Johor’s economy through its operations in the agribusiness, wellness, food and restaurants, and real estate and infrastructure sectors. To power JCorp’s digital transformation and achieve the JCorp 3.0 reinvention plan goals, the company is leveraging the AWS cloud to manage its data and applications, serving as a single source of truth for its business and operational knowledge, and paving the way for the company to tap on artificial intelligence, machine learning and blockchain technologies in the future.
Radio Televisyen Malaysia (RTM), established in 1946, is the national public broadcaster of Malaysia, bringing news, information, and entertainment programs through its six free-to-air channels and 34 radio stations to millions of Malaysians daily. Bringing cutting-edge AWS technologies closer to RTM in Malaysia will accelerate the time it takes to develop new media services, while delivering a better viewer experience with lower latency.
Bank Islam, Malaysia’s first listed Islamic banking institution, provides end-to-end financial solutions that meet the diverse needs of their customers. The bank taps AWS’ expertise to power its digital transformation and the development of Be U digital bank through its Centre of Digital Experience, a stand-alone division that creates cutting-edge financial services on AWS to enhance customer experiences.
Malaysian Administrative Modernization Management Planning Unit (MAMPU) encourages public sector agencies to adopt cloud in all ICT projects in order to accelerate emerging technologies application and increase the efficiency of public service. MAMPU believes the establishment of the AWS Region in Malaysia will further accelerate digitalization of the public sector, and bolster efforts for public sector agencies to deliver advanced citizen services seamlessly.
Malaysia is also home to both Independent Software Vendors (ISVs) and Systems Integrators that are members of the AWS Partner Network (APN). The ISV partners build innovative solutions on AWS and the SIs provide business, technical, marketing, and go-to-market support to customers. AWS Partners based in Malaysia include Axrail, eCloudvalley, Exabytes, G-AsiaPacific, GHL, Maxis, Radmik Solutions Sdn Bhd, Silverlake, Tapway, Fourtitude, and Wavelet.
New Explainer Video
To learn more about our global infrastructure, be sure to watch our new AWS Global Infrastructure Explainer video:
Stay Tuned
As usual, subscribe to this blog so that you will be among the first to know when the new region is open!
— Jeff;
Post Syndicated from original https://lwn.net/Articles/924241/
The LWN.net Weekly Edition for March 2, 2023 is available.
Post Syndicated from original https://lwn.net/Articles/924114/
The Python-packaging discussions continued in January and February; they
show no sign of abating in March either. This time around, we look (again)
at tools for packaging, including a brand new Rust-based entrant. There is
also a proposal to have interested parties create Python Enhancement
Proposals (PEPs) for packaging solutions that would be judged by a panel of
PEP delegates in order to try to choose something that the whole community
can rally around—without precluding the existence of other options. As
always, it is all a difficult balancing act.