Post Syndicated from Dennis Rothmel original https://aws.amazon.com/blogs/security/how-to-automate-aws-managed-microsoft-ad-scaling-based-on-utilization-metrics/
AWS Directory Service for Microsoft Active Directory (AWS Managed Microsoft AD), provides a fully managed service for Microsoft Active Directory (AD) in the AWS cloud. When you create your directory, AWS deploys two domain controllers in separate Availability Zones that are exclusively yours for high availability. For use cases requiring even higher resilience and performance, in a specific Region or during specific hours, AWS Managed Microsoft AD allows you to scale by deploying additional domain controllers to meet your needs. These domain controllers can help load-balance, increase overall performance, or simply provide additional nodes to protect against temporary availability issues. AWS Managed Microsoft AD allows you to define the correct number of domain controllers for your directory based on your individual use case.
This post will walk you through how to automate scaling in AWS Managed Microsoft AD using utilization metrics from your directory. You’ll do this using Amazon CloudWatch Alarms, SNS notifications, and a Lambda function to increase the number of domain controllers in your directory based on utilization peaks.
Simplified directory scaling
AWS Managed Microsoft AD has now simplified this directory scaling process by integrating with Amazon CloudWatch metrics. This new integration enables you to:
- Analyze your directory to identify expected average and peak directory utilization
- Scale your directory based on utilization data to adequately address the expected load
- Automate the addition of domain controllers to handle unexpected load.
Integration is available for both domain controller utilization metrics such as CPU, Memory, Disk and Network, and for AD-specific metrics, such as LDAP searches, binds, DNS queries, and Directory reads/writes. Analyzing this data over time to identify expected average and peak utilization on your directory can help you deploy additional domain controllers in Regions that need them. Once you’ve established this utilization baseline, you can deploy additional domain controllers to service this load, and configure alarms for anything exceeding this baseline.
Solution overview
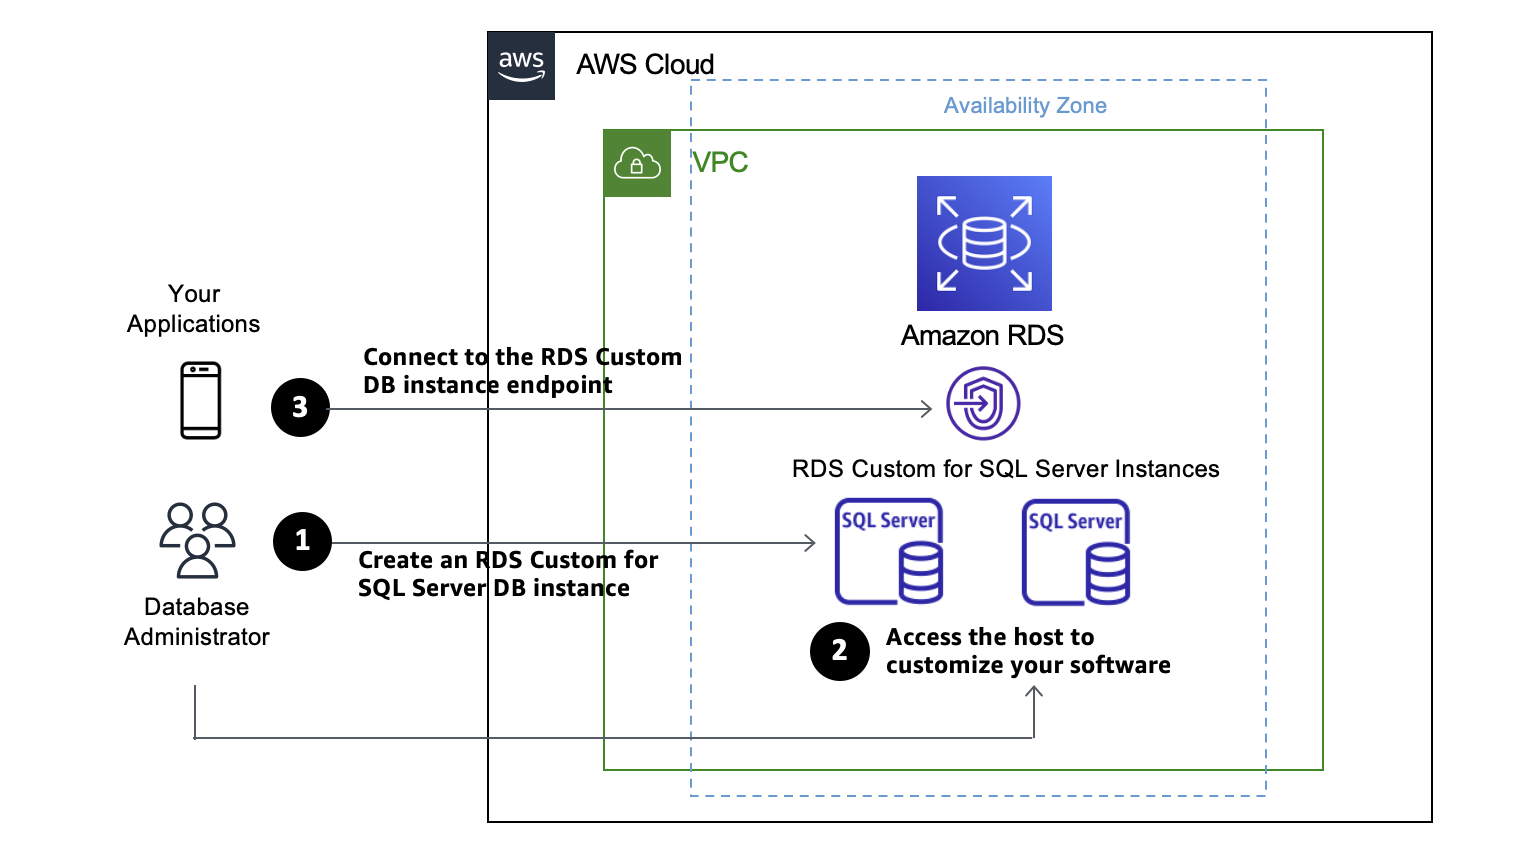
In this example, our AWS Managed Microsoft AD has the default two domain controllers; once your utilization threshold is reached, you’ll add one additional domain controller (domain controller 3 in the diagram) to cover this additional load.
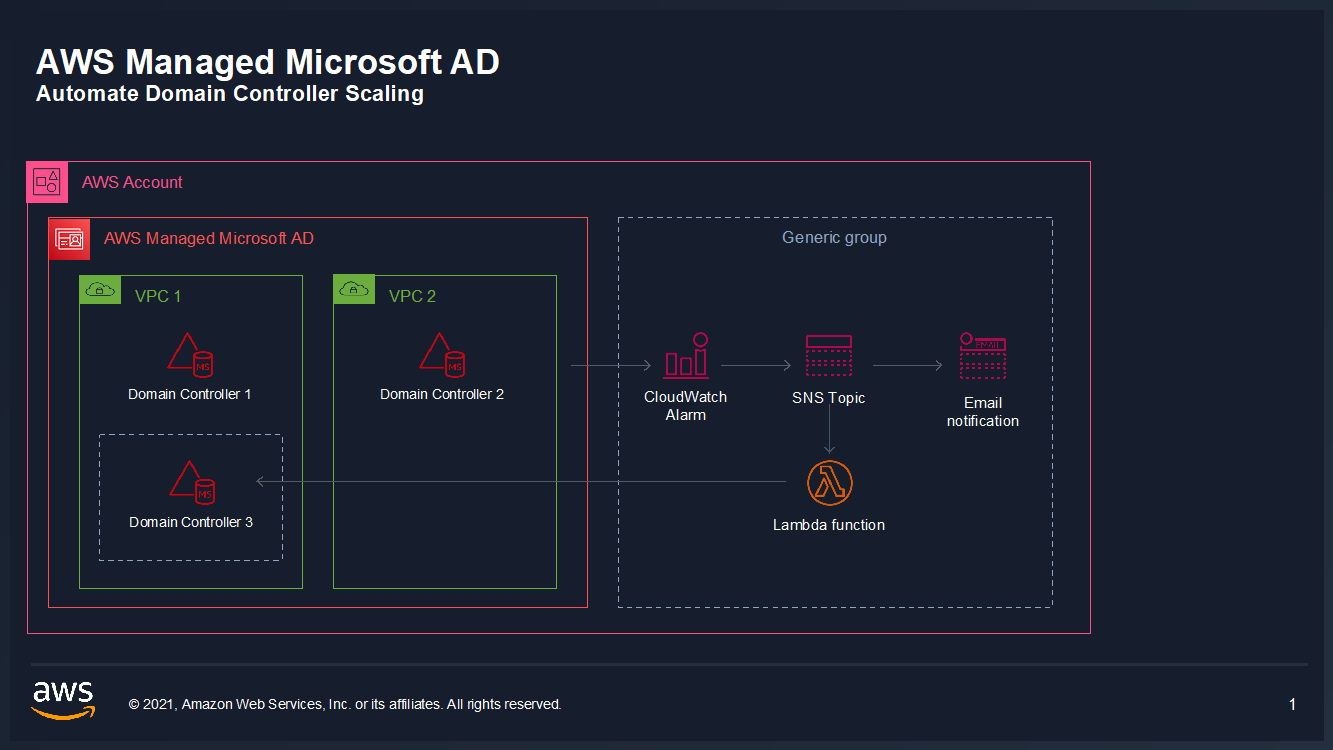
Figure 1: Solution overview
To create a CloudWatch Alarm with SNS topic notifications
- In the AWS Console, navigate to CloudWatch
- Choose Metrics to see the Browse Metrics panel
- Choose the Directory Service namespace, then choose AWS Managed Microsoft AD.
- In the Directory ID column, select your directory and check search for this only.
- From the Metric Category column, select Processor from Metric Category and check add to search. This view will show the processor utilization for your directory.
- To see the average utilization across all domain controllers, choose Add Math, then All Functions, then AVG to create a metric math expression for average CPU utilization across all domain controllers.
- Next, choose the Graphed Metrics tab in the CloudWatch metrics console, select the newly created expression, then select the bell icon from the Actions column to create a CloudWatch alarm based on this metric.
- Configure the threshold alarm to trigger when CPU utilization exceeds 70%.
- On the Configure actions screen, configure the actions using the parameters listed below to send an email notification when the alarm state is triggered. See Figure 6 for an image of how email notifications are configured.
- In the Alarm name field, provide a name for the alarm. You can optionally also add an Alarm description. Choose Next.
- Review your configuration, and choose Create alarm to create the alarm.
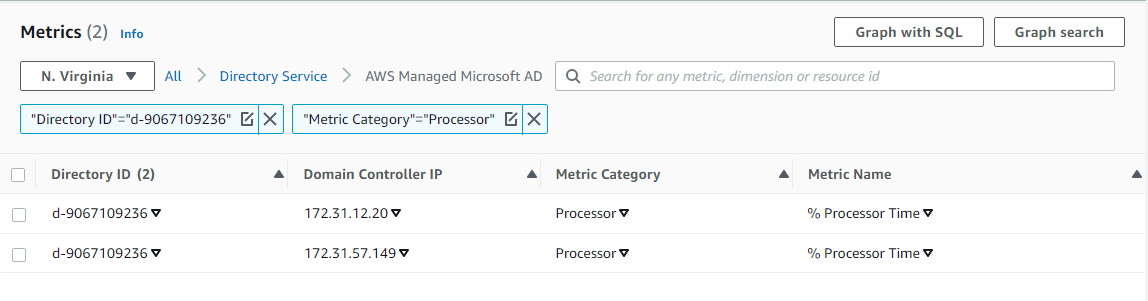
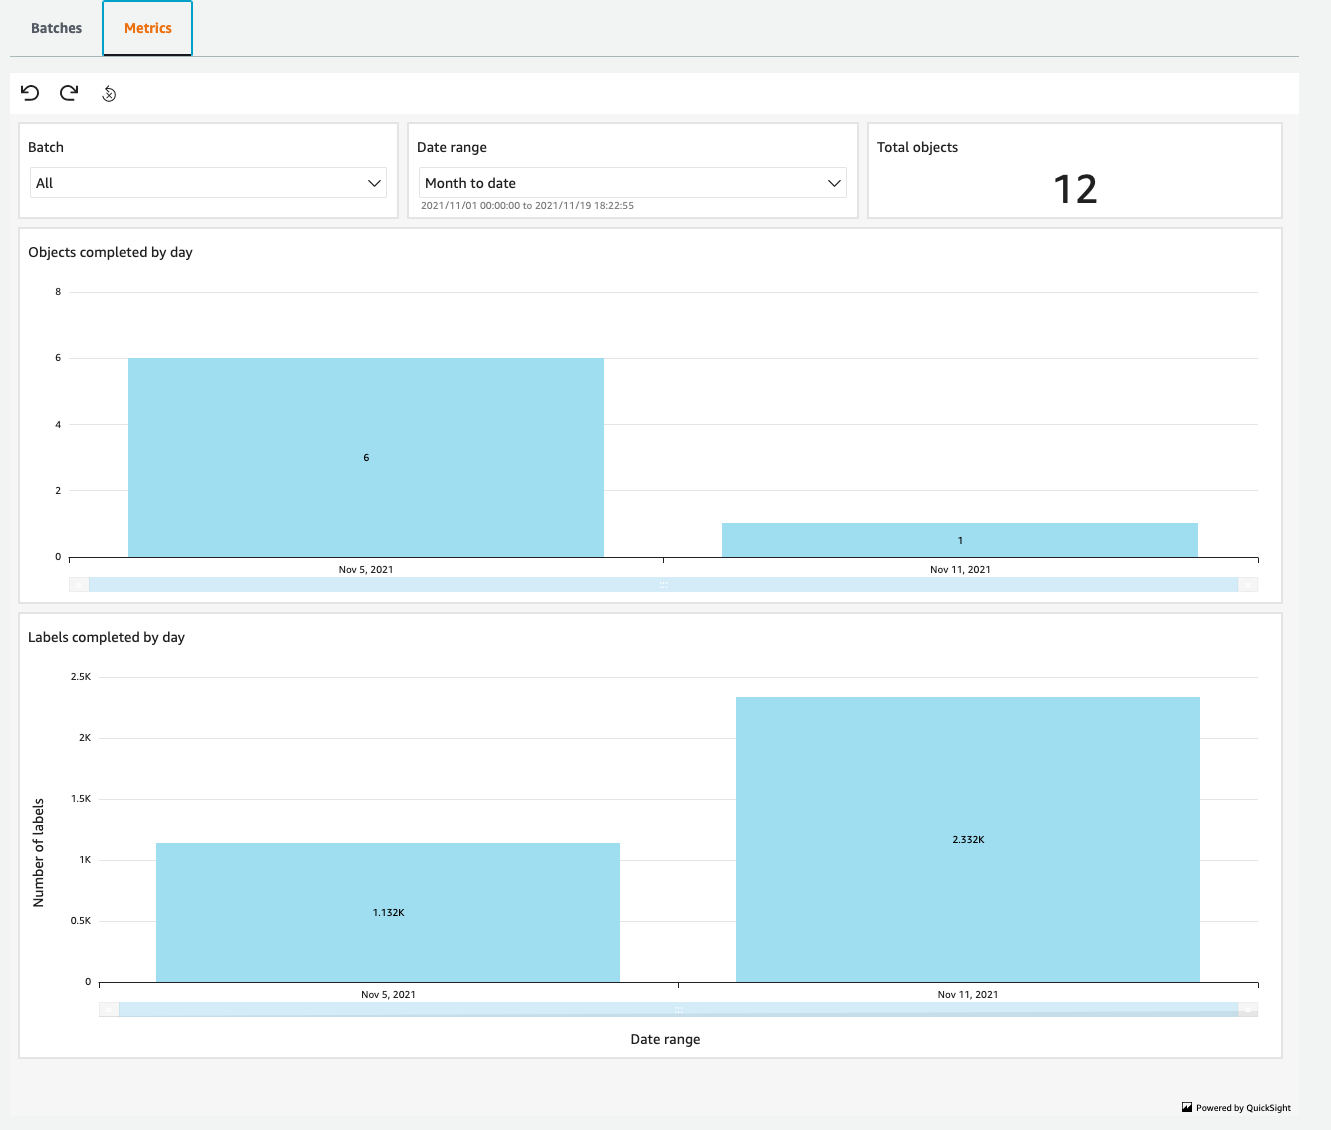
Figure 2. Processor utilization metrics
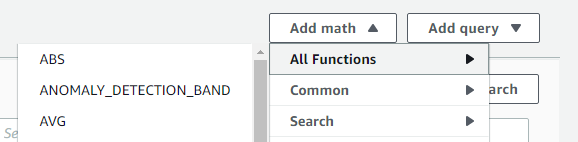
Figure 3. Adding a math function to compute average
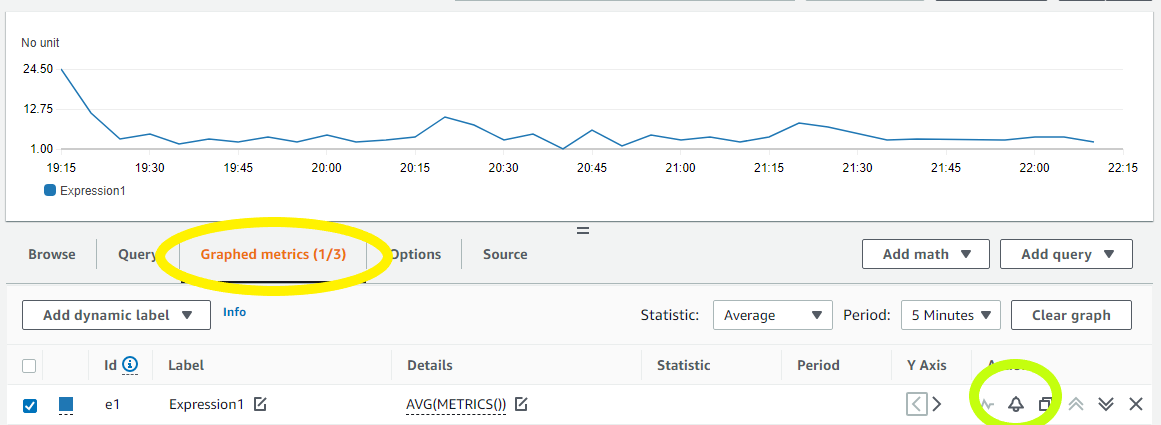
Figure 4. Create a CloudWatch Alarm using Metric Math Expression
In the Metrics section, under Period, choose 1 Hour.
In the Conditions section, under Threshold Type, choose Static. Under Define the alarm condition, choose Greater than threshold. Under Define the threshold value, enter 70. See Figure 5 for an image of how alarm parameters should look on your screen. Choose Next to Configure actions.
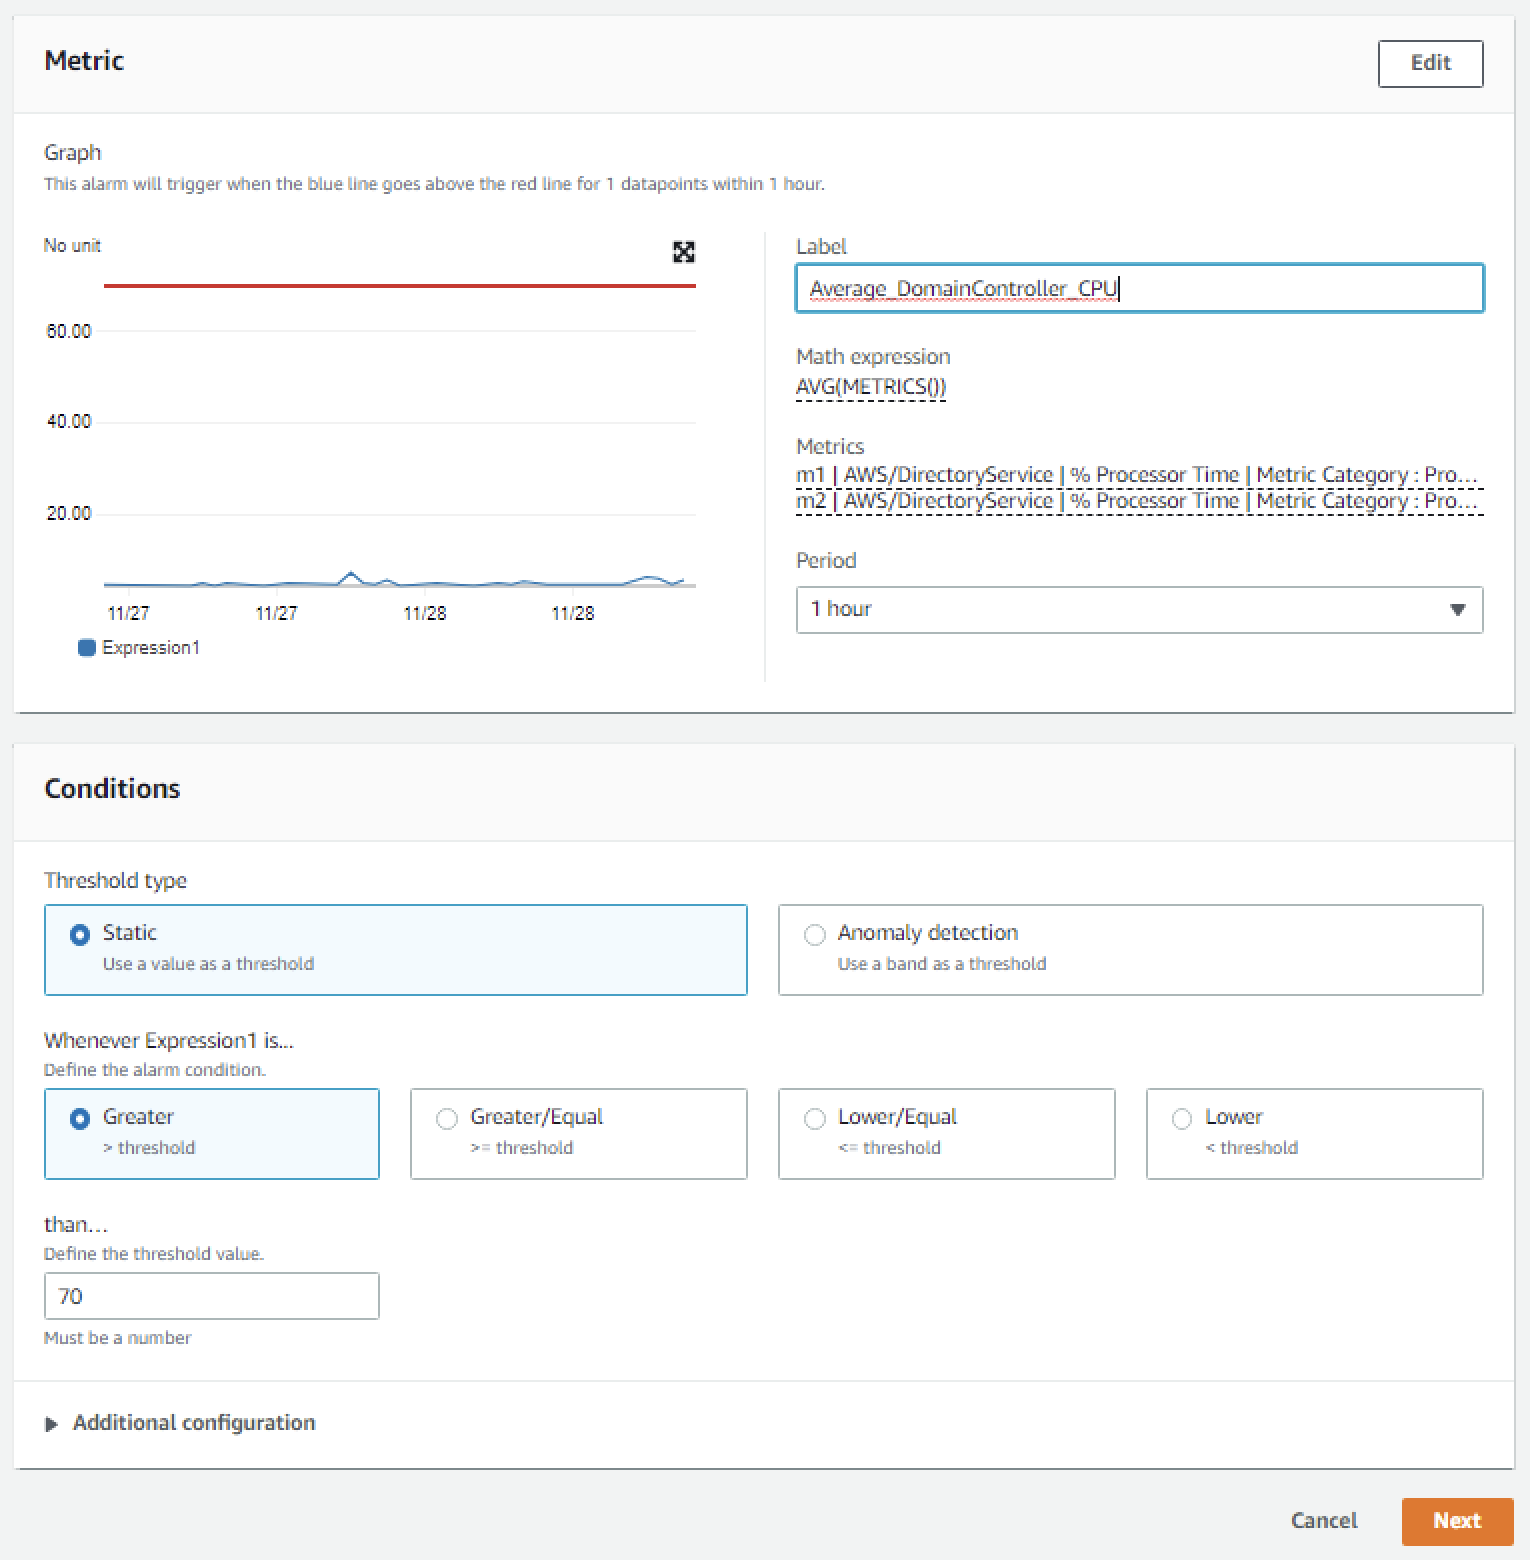
Figure 5. Configure the alarm parameters
In the Notification section, set Alarm state trigger to In alarm. Set Select an SNS topic to Create topic. Fill in the name of the alarm in the Create a new topic field, and add the email where notifications should be sent to the Email endpoints that will receive notification field. An email address is required to create the SNS topic and you should use an email address that’s accessible by your operations team. This SNS topic will be used to trigger the Lambda automation described in a later section. Note: make a note of the SNS topic name you chose; you will use it later when creating the Lambda function in the To create an AWS Lambda function to automate scale out procedure below.
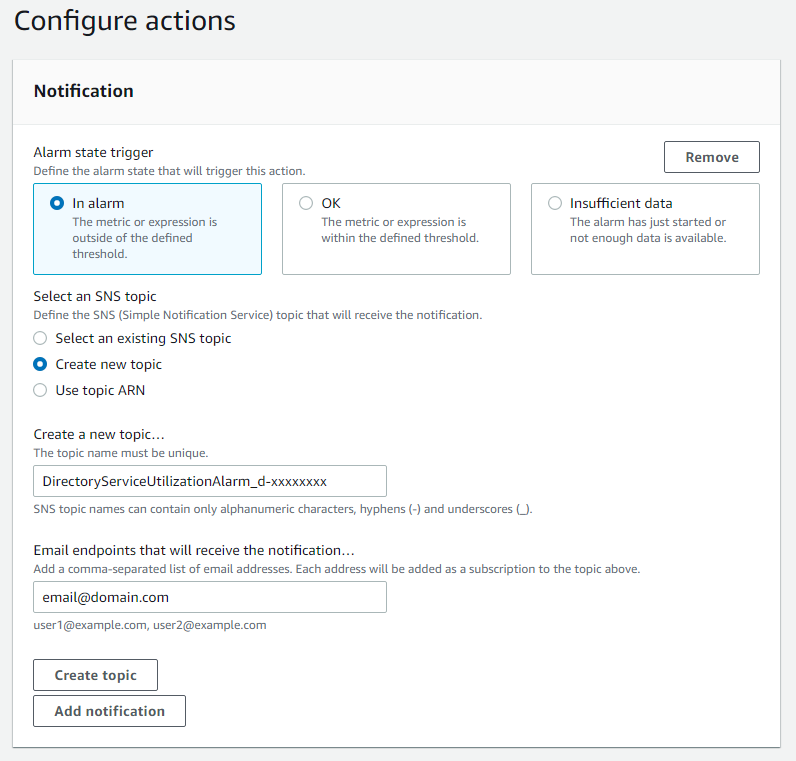
Figure 6. Create SNS topic and email notification
Once you’ve completed these steps, you will now have an alarm implemented for when domain controller CPU utilization exceeds an average of 70% across both domain controllers. This will trigger an SNS topic when your directory is experiencing a heavy load, which will be used to start the Lambda automation and will send an informational email notification. In the next section, we’ll configure an AWS Lambda function to automate the addition of a domain controller based on this SNS topic.
For additional details on CloudWatch Alarms, please see the Amazon CloudWatch documentation.
To create an AWS Lambda function to automate scale out
The sample Lambda function shown below checks the number of domain controllers in this Region, and increases that by adding one additional domain controller. This procedure describes how to configure the IAM role required for this Lambda function, then how to deploy the Lambda function to execute when the alarm is triggered to automatically add a domain controller when your load exceeds your typical usage baseline.
Note: For additional details on Lambda creation, please see the AWS Lambda documentation.
To automate scale-out using AWS Lambda
- In the AWS Console, navigate to IAM and choose Policies, then choose Create Policy.
- Choose the JSON tab, and create a new IAM role using the policy provided in JSON below.
- Choose Next:Tags to add tags (optional) before choosing Next:Review.
- On the Create Policy screen, provide a name in the Name field. You can optionally also add a description. Choose Create policy to complete creating the new policy.
- In the AWS Console, navigate to Lambda and choose Create Function
- On the Create Function screen, select Author from Scratch and provide a Name, then choose Create Function.
- Once created, on the Lambda function’s page, choose the Configuration tab, then choose Permissions from the sidebar and choose the execution role name linked under Role name. This will open the IAM console in another tab, preloaded to your Lambda execution role.
- On the execution role screen, choose Attach policies and select the IAM policy you’ve just created (e.g. DirectoryService-DCNumber Update). On the Attach Permissions screen, choose Attach policy to complete updating the execution role. Once completed this step, you may close this tab and return the previous browser tab.
- On the Lambda function screen, choose the Configuration tab, then choose Triggers from the sidebar.
- On the Add Trigger screen, choose the pulldown under Trigger configuration and select SNS. On the SNS topic box, select the SNS topic you created in Step 9 of the To create a CloudWatch Alarm with SNS topic notifications procedure above. Then choose Add to complete the trigger configuration.
- On the Lambda function screen, choose the Configuration tab, then choose Environment variables from the sidebar.
- On the Environment variables card, click Edit.
- On the Edit environment variables screen, choose Add environment variables and use the Key “DIRECTORY_ID” and the Value will be the directory ID for you AWS Managed Microsoft AD.
- On the Lambda function screen, choose the Code tab to open the in-browser code editor experience inside the Code source card. Paste in the sample Lambda function code given below to complete the implementation.
For more details on this configuration, see the AWS Directory Service documentation.
Sample policy
Note: make a note of the policy name you chose; you will use it later when updating the execution role for the Lambda function.
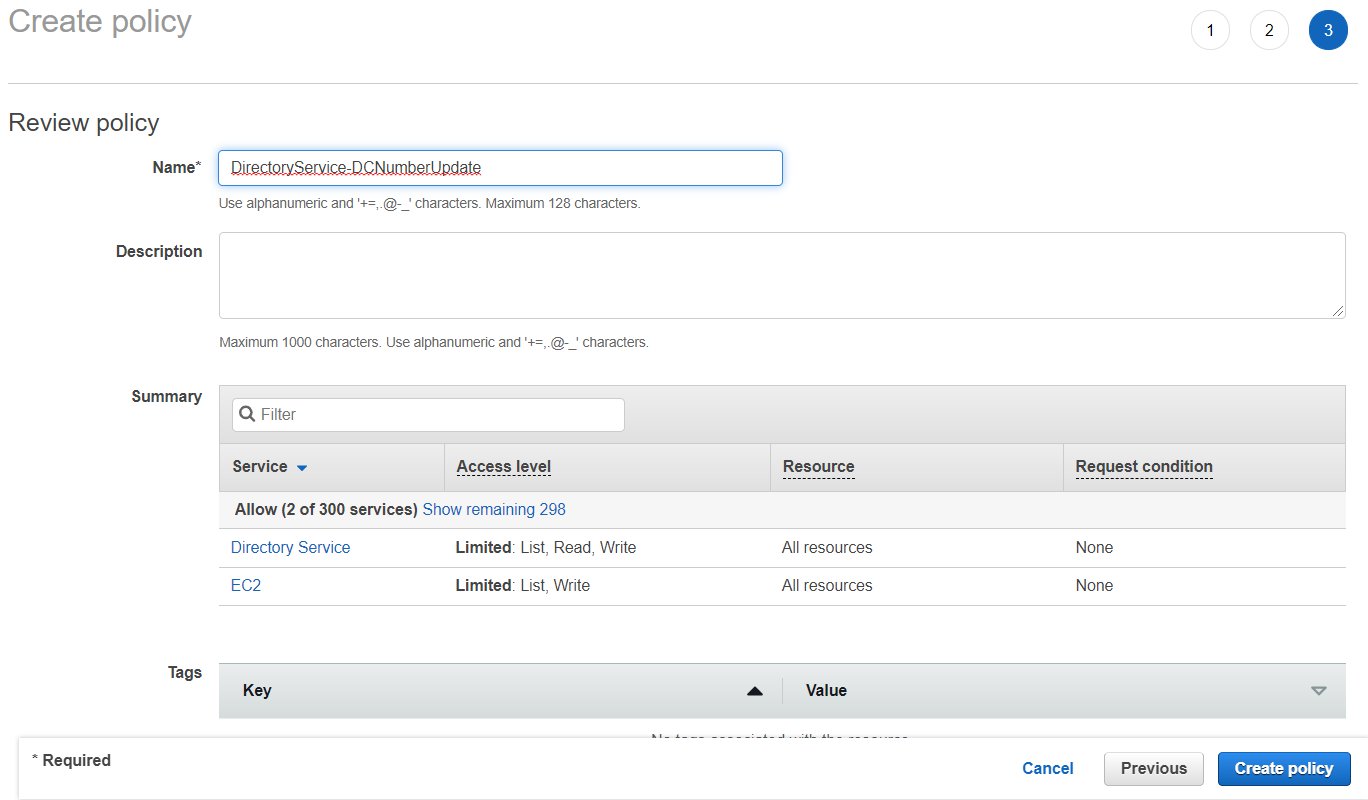
Figure 7. Provide a name to create the IAM policy
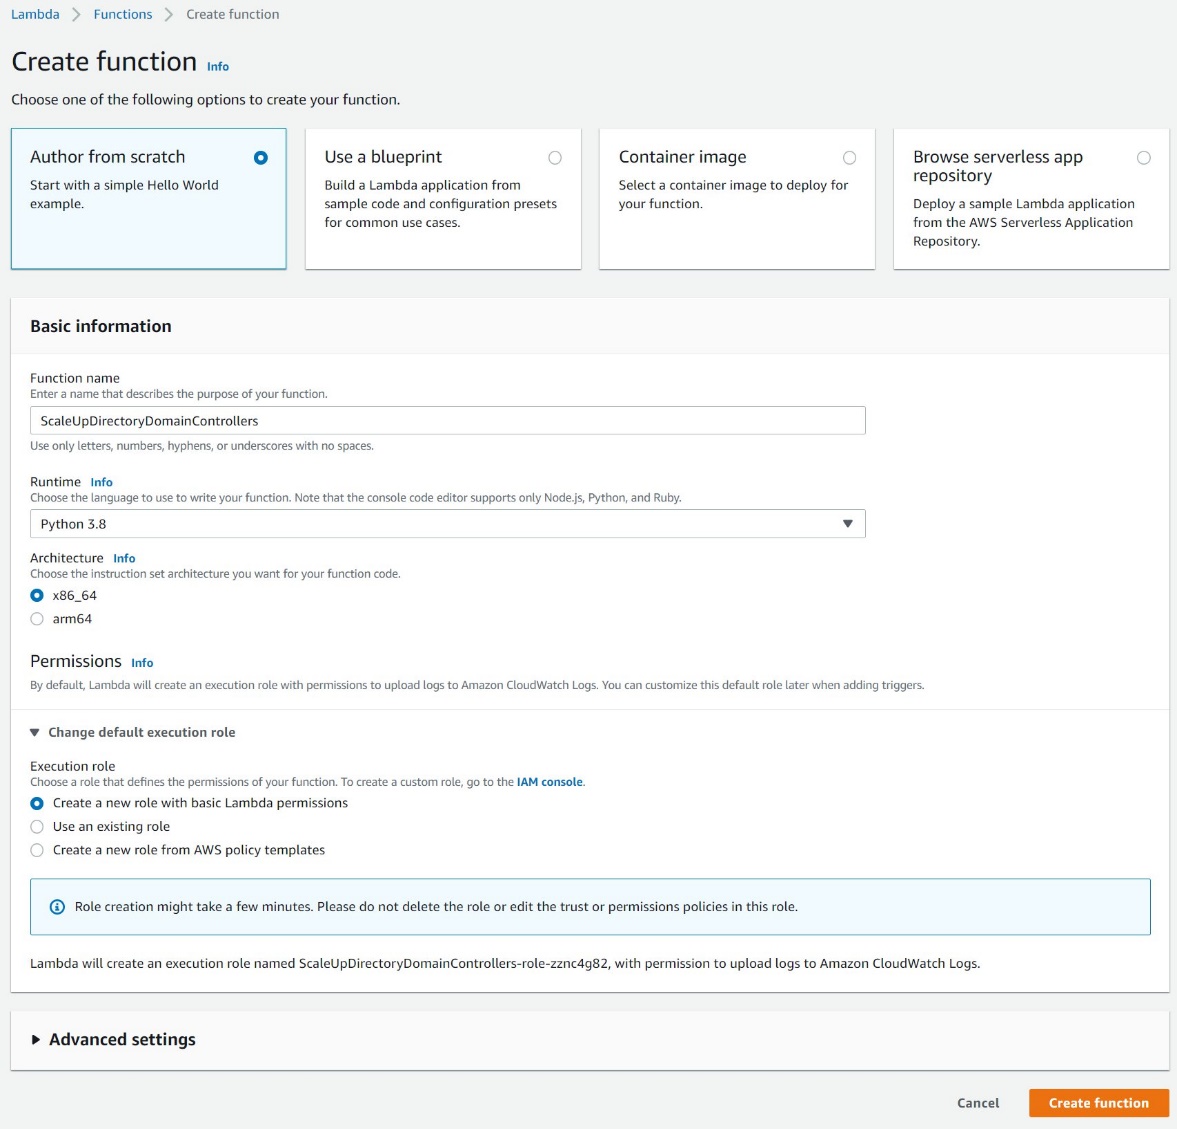
Figure 8. Create a Lambda function
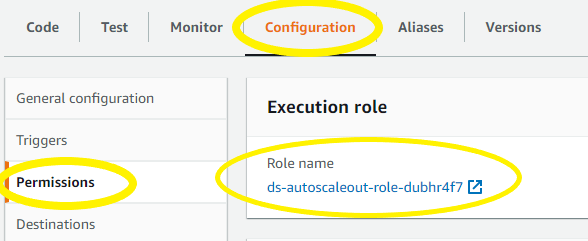
Figure 9: Select the Execution Role
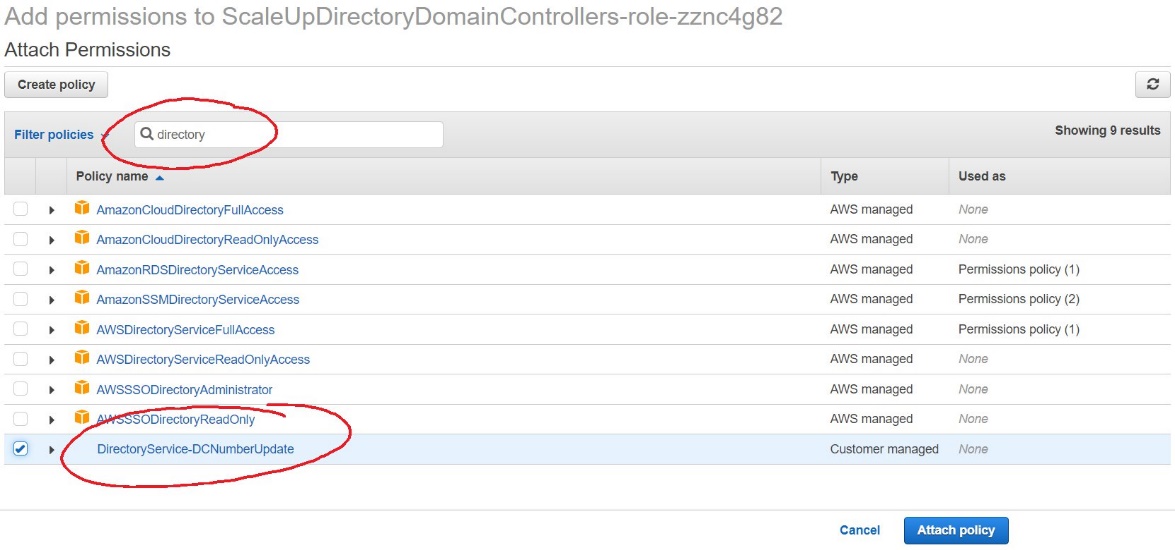
Figure 10. Select and attach the IAM policy
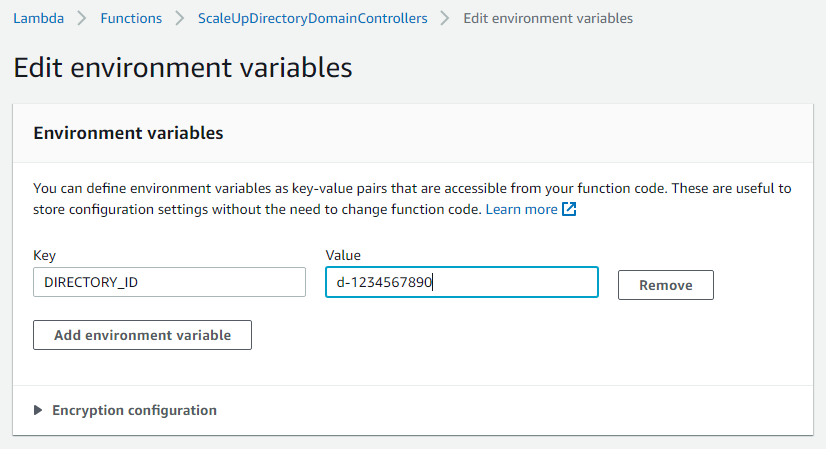
Figure 11. The “Edit environment variables” screen
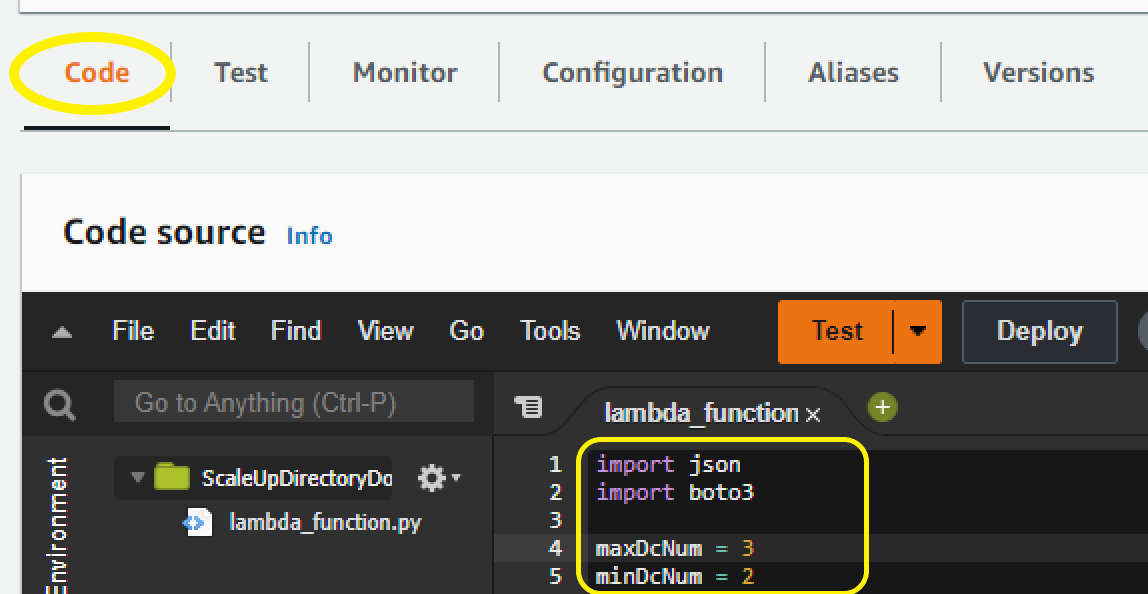
Figure 12. Paste sample code to complete the Lambda function setup
Sample Lambda function code
The sample Lambda function given below automates adding another domain controller to your directory. When your CloudWatch alarm triggers, you will receive a notification email, and an additional domain controller will be deployed to provide the added capacity to support the increase in directory usage.
Note: The example code contains a variable for the maximum number of domain controllers (maxDcNum), to prevent you from over provisioning in the event of a missed configuration. This value is set to 3 for this blog post’s example and can be increased to suit your use case.
Note: When testing this Lambda function, remember that this will increase the number of domain controllers for your directory in that Region. If the additional domain controller is not needed, please reduce the count after the test to avoid costs for an additional domain controller. The same principles used in this article to automate the addition of domain controllers can be applied to automate the reduction of domain controllers and you should consider automating the reduction to optimize for resilience, performance and cost.
Conclusion
In this post, you’ve implemented alarms based on thresholds in Domain Controller utilization using AWS CloudWatch and automation to increase the number of domain controllers using AWS Lambda functions. This solution helps to cost-effectively improve resilience and performance of your directory, by scaling your directory based on historical load patterns.
To learn more about using AWS Managed Microsoft AD, visit the AWS Directory Service documentation. For general information and pricing, see the AWS Directory Service home page. If you have comments about this blog post, submit a comment in the Comments section below. If you have implementation or troubleshooting questions, start a new thread on the Directory Service forum or contact AWS Support.
Want more AWS Security news? Follow us on Twitter.