OVHcloud, the largest hosting provider in Europe, has used Let’s Encrypt for TLS certificates since 2016. Since then, they’ve provisioned tens of millions of certificates for their shared hosting customers. We often get asked about how large integrations work and their best practices so this will be the first in a series of blog posts we’ll publish on the topic.
OVHcloud first started looking into using Let’s Encrypt certificates because the team saw a need for the protection provided by TLS for every customer (remember, way back five years ago, when that wasn’t just a thing everybody did?). “Our goal was to deliver TLS simply. We didn’t want to have to write a tutorial for our customers to upload a cert, but instead just click and it works,” said Guillaume Marchand, OVHcloud’s Technical Team Lead.
They considered building their own CA but determined the cost and complexity of doing so would be impractical. Instead, they build an ACME client to prepare for using Let’s Encrypt. It took about six months, “we simply followed the RFC and did a bit of reverse engineering of Certbot,” said Guillaume. In addition to a custom client, OVHcloud automated their Certificate Signing Request (CSR) process and certificate installation process.
Getting a TLS certificate is on the critical path to onboarding a shared hosting client, so monitoring is a big part of OVHcloud’s success with Let’s Encrypt. They set up monitoring at every step in the delivery process: requesting the certificate, asking for challenges, waiting for validation, and requesting certificate creation. They also keep an eye on how long it takes to get a certificate (“it’s really fast”). OVHcloud also monitors our status page to stay apprised of our operational status.
Over 10,000 certificates are issued from Let’s Encrypt to OVHcloud every day. As the company continues to expand into North America, they predict that number will grow. The initial and ongoing work done by the OVHcloud team ensures that TLS will be a simple and reliable aspect of their service.
OVHcloud is a longtime sponsor of ISRG so we’d like to close by thanking them for not just being great technical collaborators, but also financial supporters.
As a nonprofit project, 100% of our funding comes from contributions from our community of users and supporters. We depend on their support in order to provide our services for the public benefit. If your company or organization would like to sponsor Let’s Encrypt please email us at [email protected]. If you can support us with a donation, we ask that you make an individual contribution.
Open-Sourcing a Monitoring GUI for Metaflow, Netflix’s ML Platform
tl;dr Today, we are open-sourcing a long-awaited GUI for Metaflow. The Metaflow GUI allows data scientists to monitor their workflows in real-time, track experiments, and see detailed logs and results for every executed task. The GUI can be extended with plugins, allowing the community to build integrations to other systems, custom visualizations, and embed upcoming features of Metaflow directly into its views.
Metaflow is a full-stack framework for data science that we started developing at Netflix over four years ago and which we open-sourced in 2019. It allows data scientists to define ML workflows, test them locally, scale-out to the cloud, and deploy to production in idiomatic Python code. Since open-sourcing, the Metaflow community has been growing quickly: it is now the 7th most starred active project on Netflix’s GitHub account with nearly 4800 stars. Outside Netflix, Metaflow is used to power machine learning in production by hundreds of companies across industries from bioinformatics to real estate.
Since its inception, Metaflow has been a command-line-centric tool. It makes it easy for data scientists to express even complex machine learning applications in idiomatic Python, test them locally, or scale them out in the cloud — all using their favorite IDEs and terminals. Following our culture of freedom and responsibility, Metaflow grants data scientists the freedom to choose the right modeling approach, handle data and features flexibly, and construct workflows easily while ensuring that the resulting project executes responsibly and robustly on the production infrastructure.
As the number and criticality of projects running on Metaflow increased — some of which are very central to our business — our ML platform team started receiving an increasing number of support requests. Frequently, the questions were of the nature “can you help me understand why my flow takes so long to execute” or “how can I find the logs for a model that failed last night.” Technically, Metaflow provides a Python API that allows the user to inspect all details e.g., in a notebook, but writing code in a notebook to answer basic questions like this felt overkill and unnecessarily tedious. After observing the situation for months, we started forming an understanding of the kind of a new user interface that could address the growing needs of our users.
Requirements for a Metaflow GUI
Metaflow is a human-centered system by design. We consider our Python API and the CLI to be integral parts of the overall user interface and user experience, which singularly focuses on making it easier to build production-ready ML projects from scratch. In our approach, Python code provides a highly expressive and productive user interface for expressing complex business logic, such as ML models and workflows. At the same time, the CLI allows users to execute specific commands quickly and even automate common actions. When it comes to complex, real-life development work like this, it would be hard to achieve the same level of productivity on a graphical user interface.
However, textual UIs are quite lacking when it comes to discoverability and getting a holistic understanding of the system’s state. The questions we were hearing reflected this gap: we were lacking a user interface that would allow the users, quite simply, to figure out quickly what is happening in their Metaflow projects.
Netflix has a long history of developing innovative tools for observability, so when we began to specify requirements for the new GUI, we were able to leverage experiences from the previous GUIs built for other use cases, as well as real-life user stories from Metaflow users. We wanted to scope the GUI tightly, focusing on a specific gap in the Metaflow experience:
The GUI should allow the users to see what flows and tasks are executing and what is happening inside them. Notably, we didn’t want to replace any of the functionality in the Metaflow APIs or CLI with the GUI — just to complement them. This meant that the GUI would be read-only: all actions like writing code and starting executions should happen on the users’ IDE and terminal as before. We also had no need to build a model-monitoring GUI yet, which is a wholly separate problem domain.
The GUI would be targeted at professional data scientists. Instead of a fancy GUI for demos and presentations, we wanted a serious productivity tool with carefully thought-out user workflows that would fit seamlessly into our toolchain of data science. This requires attention to small details: for instance, users should be able to copy a link to any view in the GUI and share it e.g., on Slack, for easy collaboration and support (or to integrate with the Metaflow Slack bot). And, there should be natural affordances for navigating between the CLI, the GUI, and notebooks.
The GUI should be scalable and snappy: it should handle our existing repository consisting of millions of runs, some of which contain tens of thousands of tasks without hiccups. Based on our experiences with other GUIs operating at Netflix-scale, this is not a trivial requirement: scalability needs to be baked into the design from the very beginning. Sluggish GUIs are hard to debug and fix afterwards, and they can have a significantly negative impact on productivity.
The GUI should integrate well with other GUIs. A modern ML stack consists of many independent systems like data warehouses, compute layers, model serving systems, and, in particular, notebooks. It should be possible to find runs and tasks of interest in the Metaflow GUI and use a task-specific view to jump to other GUIs for further information. Our landscape of tools is constantly evolving, so we didn’t want to hardcode these links and views in the GUI itself. Instead, following the integration-friendly ethos of Metaflow, we want to embed relevant information in the GUI as plugins.
Finally, we wanted to minimize the operational overhead of the GUI. In particular, under no circumstances should the GUI impact Metaflow executions. The GUI backend should be a simple service, optionally sitting alongside the existing Metaflow metadata service, providing a read-only, real-time view to the stored state. The frontend side should be easily extensible and maintainable, suggesting that we wanted a modern React app.
Monitoring GUI for Metaflow
As our ML Platform team had limited frontend resources, we reached out to Codemate to help with the implementation. As it often happens in software engineering projects, the project took longer than expected to finish, mostly because the problem of tracking and visualizing thousands of concurrent objects in real-time in a highly distributed environment is a surprisingly non-trivial problem (duh!). After countless iterations, we are finally very happy with the outcome, which we have now used in production for a few months.
When you open the GUI, you see an overview of all flows and runs, both current and historical, which you can group and filter in various ways:
Runs Grouped by flows
We can use this view for experiment tracking: Metaflow records every execution automatically, so data scientists can track all their work using this view. Naturally, the view can be grouped by user. They can also tag their runs and filter the view by tags, allowing them to focus on particular subsets of experiments.
After you click a specific run, you see all its tasks on a timeline:
Timeline view for a run
The timeline view is extremely useful in understanding performance bottlenecks, distribution of task runtimes, and finding failed tasks. At the top, you can see global attributes of the run, such as its status, start time, parameters etc. You can click a specific task to see more details:
Task view
This task view shows logs produced by a task, its results, and optionally links to other systems that are relevant to the task. For instance, if the task had deployed a model to a model serving platform, the view could include a link to a UI used for monitoring microservices.
As specified in our requirements, the GUI should work well with Metaflow CLI. To facilitate this, the top bar includes a navigation component where the user can copy-paste any pathspec, i.e., a path to any object in the Metaflow universe, which are prominently shown in the CLI output. This way, the user can easily move from the CLI to the GUI to observe runs and tasks in detail.
While the CLI is great, it is challenging to visualize flows. Each flow can be represented as a Directed Acyclic Graph (DAG), and so the GUI provides a much better way to visualize a flow. The DAG view presents all the steps of a flow and how they are related. Each step may have developer comments. They are colored to indicate the current state. Split steps are grouped by shaded boxes, while steps that participated in a foreach are grouped by a double shade box. Clicking on a step will take you to the Task view.
DAG View
Users at different organizations will likely have some special use cases that are not directly supported. The Metaflow GUI is extensible through its plugin API. For example, Netflix has its container orchestration platform called Titus. Users can configure tasks to utilize Titus to scale up or out. When failures happen, users will need to access their Titus containers for more information, and within the task view, a simple plugin provides a link for further troubleshooting.
Example task-level plugin
Try it at home!
We know that our user stories and requirements for a Metaflow GUI are not unique to Netflix. A number of companies in the Metaflow community have requested GUI for Metaflow in the past. To support the thriving community and invite 3rd party contributions to the GUI, we are open-sourcing our Monitoring GUI for Metaflow today!
With the new GUI, data scientists don’t have to fly blind anymore. Instead of reaching out to a platform team for support, they can easily see the state of their workflows on their own. We hope that Metaflow users outside Netflix will find the GUI equally beneficial, and companies will find creative ways to improve the GUI with new plugins.
This post is written by Jessie Xie, Solutions Architect for EC2 Spot, and Peter Manastyrny, Senior Product Manager for EC2 Auto Scaling and EC2 Fleet.
Amazon EC2 Spot Instances let you run flexible, fault-tolerant, or stateless applications in the AWS Cloud at up to a 90% discount from On-Demand prices. Since we introduced Spot Instances back in 2009, we have been building new features and integrations with a single goal – to make Spot easy and efficient to use for your flexible compute needs.
Spot Instances are spare EC2 compute capacity in the AWS Cloud available for steep discounts. In exchange for the discount, Spot Instances are interruptible and must be returned when EC2 needs the capacity back. The location and amount of spare capacity available at any given moment is dynamic and changes in real time. This is why Spot workloads should be flexible, meaning they can utilize a variety of different EC2 instance types and can be shifted in real time to where the spare capacity currently is. You can use Spot Instances with tools such as EC2 Fleet and Amazon EC2 Auto Scaling which make it easy to run workloads on multiple instance types.
The AWS Cloud spans 81 Availability Zones across 25 Regions with plans to launch 21 more Availability Zones and 7 more Regions. However, until now there was no way to find an optimal location (either a Region or Availability Zone) to fulfill your Spot capacity needs without trying to launch Spot Instances there first. Today, we are excited to announce Spot placement score, a new feature that helps you identify an optimal location to run your workloads on Spot Instances. Spot placement score recommends an optimal Region or Availability Zone based on the amount of Spot capacity you need and your instance type requirements.
Spot placement score is useful for workloads that could potentially run in a different Region. Additionally, because the score takes into account your instance type selection, it can help you determine if your request is sufficiently instance type flexible for your chosen Region or Availability Zone.
How Spot placement score works
To use Spot placement score you need to specify the amount of Spot capacity you need, what your instance type requirements are, and whether you would like a recommendation for a Region or a single Availability Zone. For instance type requirements, you can either provide a list of instance types, or the instance attributes, like the number of vCPUs and amount of memory. If you choose to use the instance attributes option, you can then use the same attribute configuration to request your Spot Instances in the recommended Region or Availability Zone with the new attribute-based instance type selection feature in EC2 Fleet or EC2 Auto Scaling.
Spot placement score provides a list of Regions or Availability Zones, each scored from 1 to 10, based on factors such as the requested instance types, target capacity, historical and current Spot usage trends, and time of the request. The score reflects the likelihood of success when provisioning Spot capacity, with a 10 meaning that the request is highly likely to succeed. Provided scores change based on the current Spot capacity situation, and the same request can yield different scores when ran at different times. It is important to note that the score serves as a guideline, and no score guarantees that your Spot request will be fully or partially fulfilled.
You can also filter your score by Regions or Availability Zones, which is useful for cases where you can use only a subset of AWS Regions, for example any Region in the United States.
Let’s see how Spot placement score works in practice through an example.
Using Spot placement score with AWS Management Console
To try Spot placement score, log into your AWS account, select EC2, Spot Requests, and click on Spot placement score to open the Spot placement score window.
Here, you need provide your target capacity and instance type requirements by clicking on Enter requirements. You can enter target capacity as a number of instances, vCPUs, or memory. vCPUs and memory options are useful for vertically scalable workloads that are sized for a total amount of compute resources and can utilize a wide range of instance sizes. Target capacity is limited and based on your recent Spot usage with accounting for potential usage growth. For accounts that do not have recent Spot usage, there is a default limit aligned with the Spot Instances limit.
For instance type requirements, there are two options. First option is to select Specify instance attributes that match your compute requirements tab and enter your compute requirements as a number of vCPUs, amount of memory, CPU architecture, and other optional attributes. Second option is to select Manually select instance types tab and select instance types from the list.
Please note that you need to select at least three different instance types (that is, different families, generations, or sizes). If you specify a smaller number of instance types, Spot placement score will always yield a low score. Spot placement score is designed to help you find an optimal location to request Spot capacity tailored to your specific workload needs, but it is not intended to be used for getting high-level Spot capacity information across all Regions and instance types.
Let’s try to find an optimal location to run a workload that can utilize r5.8xlarge, c5.9xlarge, and m5.8xlarge instance types and is sized at 2000 instances.
Once you select 2000 instances under Target capacity, select r5.8xlarge, c5.9xlarge, and m5.8xlarge instances under Select instance types, and click Load placement score button, you will get a list of Regions sorted by score in a descending order. There is also an option to filter by specific Regions if needed.
The highest rated Region for your requirements turns out to be US East (N. Virginia) with a score of 8. The second closest contender is Europe (Ireland) with a score of 5. That tells you that right now the optimal Region for your Spot requirements is US East (N. Virginia).
Let’s now see if it is possible to get a higher score. Remember, the key best practice for Spot is to be flexible and utilize as many instance types as possible. To do that, press the Edit button on the Target capacity and instance type requirements tab. For the new request, keep the same target capacity at 2000, but expand the selection of instance types by adding similarly sized instance types from a variety of instance families and generations, i.e., r5.4xlarge, r5.12xlarge, m5zn.12xlarge, m5zn.6xlarge, m5n.8xlarge, m5dn.8xlarge, m5d.8xlarge, r5n.8xlarge, r5dn.8xlarge, r5d.8xlarge, c5.12xlarge, c5.4xlarge, c5d.12xlarge, c5n.9xlarge. c5d.9xlarge, m4.4xlarge, m4.16xlarge, m4.10xlarge, r4.8xlarge, c4.8xlarge.
After requesting the scores with updated requirements, you can see that even though the score in US East (N. Virginia) stays unchanged at 8, the scores for Europe (Ireland) and US West (Oregon) improved dramatically, both raising to 9. Now, you have a choice of three high-scored Regions to request your Spot Instances, each with a high likelihood to succeed.
To request Spot Instances based on the score, you can use EC2 Fleet or EC2 Auto Scaling. Please note, that the score implies that you use capacity-optimized Spot allocation strategy when requesting the capacity. If you use other allocation strategies, such as lowest-price, the result in the recommended Region or Availability Zone will not align with the score provided.
You can also request the scores at the Availability Zone level. This is useful for running workloads that need to have all instances in the same Availability Zone, potentially to minimize inter-Availability Zone data transfer costs. Workloads such as Apache Spark, which involve transferring a high volume of data between instances, would be a good use case for this. To get scores per Availability Zone you can check the box Provide placement scores per Availability Zone.
When requesting instances based on Availability Zone recommendation, you need to make sure to configure EC2 Fleet or EC2 Auto Scaling request to only use that specific Availability Zone.
With Spot placement score, you can test different instance type combinations at different points in time, and find the most optimal Region or Availability Zone to run your workloads on Spot Instances.
Availability and pricing
You can use Spot placement score today in all public and AWS GovCloud Regions with the exception of those based in China, where we plan to release later. You can access Spot placement score using the AWS Command Line Interface (CLI), AWS SDKs, and Management Console. There is no additional charge for using Spot placement score, you will only pay EC2 standard rates if provisioning instances based on recommendation.
The first AWS service I used, more than ten years ago, was Amazon Elastic Compute Cloud (Amazon EC2). Over time, EC2 has added a wide selection of instance types optimized to fit different use cases, with a varying combination of CPU/GPU, memory, storage, and networking capacity to give you the flexibility to choose the appropriate mix of resources for your applications.
One of the key advantages of the cloud is elasticity. With EC2 Fleet, you can synchronously request capacity across multiple instance types and purchase options, launching your instances across multiple Availability Zones, using the On-Demand, Reserved, and Spot Instances together. With EC2 Auto Scaling, you can automatically add or remove EC2 instances according to conditions you define and add advanced instance management capabilities such as warm pools, instance refresh, and health checks. With these tools, you need to manually update your configurations to benefit from the newest EC2 instances. Also, when you use EC2 Spot Instances to optimize your costs, it is important that you select multiple instance types to access the highest amount of Spot capacity. Until now, there was no easy way to build and maintain instance type configurations in a flexible way.
Today, I am happy to share that we are introducing attribute-based instance type selection (ABS), a new feature that lets you express your instance requirements as a set of attributes, such as vCPU, memory, and storage. Your requirements are translated by ABS to all matching instance types, simplifying the creation and maintenance of instance type configurations. This also allows you to automatically use newer generation instance types when they are released and access a broader range of capacity via EC2 Spot Instances. EC2 Fleet and EC2 Auto Scaling select and launch instances that fit the specified attributes, removing the need to manually pick instance types.
ABS is ideal for flexible workloads and frameworks, such as when running containers or web fleets, processing big data, and implementing continuous integration and deployment (CI/CD) tooling. When using Spot Instances, instead of picking and entering tens of instance types and sizes, you can now just use a simple attribute config to cover all of them and include new ones as they come out.
How Attribute-Based Instance Type Selection Works With ABS, you replace the list of instance types with your instance requirements. You can specify instance requirements inside a launch template or in the EC2 Fleet or EC2 Auto Scaling requests as a launch template override.
ABS works in two steps:
First, ABS determines a list of instance types based on specified attributes, AWS Region, Availability Zone, and price.
Then, EC2 Auto Scaling or EC2 Fleet applies the selected allocation strategy to that list.
For Spot Instances, ABS supports the capacity-optimized and the lowest-price allocation strategies.
For On-Demand Instances, ABS supports the lowest-price allocation strategy. EC2 Auto Scaling or EC2 Fleet will resolve ABS attributes to a list of instance types and will launch the lowest priced instance first to fulfill the On-Demand portion of the capacity request, moving to the next lowest priced instance if needed.
By default ABS enables price protection to keep your spending under control. Price protection makes ABS avoid provisioning overly expensive instance types even if they happen to fit the attributes you selected and keeps the prices of provisioned instances within certain boundaries. With price protection enabled, ABS doesn’t select instance types whose price is above price protection thresholds. There are two separate thresholds for Spot and On-Demand instances that you can optionally customize.
Let’s see how ABS works in practice with a couple of examples.
Using Attribute-Based Instance Type Selection with EC2 Auto Scaling I use the AWS Command Line Interface (CLI) with the --generate-cli-skeleton parameter to generate a file in YAML format with all the parameters accepted by the CreateAutoScalingGroup API.
In the YAML file, there is a new InstanceRequirements section that can be used to override the configuration of the launch template. These are all the attributes I can choose from with some sample values:
Instead of providing a list of overrides, each having an InstanceType attribute with a single instance type selected, I can now select the instance types based on my requirements. I can specify the minimum and maximum amount of vCPUs, and the range of memory. Optionally, I can ask for a minimum amount of memory per vCPUs.
There are many more attributes that I can select from. For example, I can include, exclude, or require the use of bare metal or burstable instances. I can add networking or storage requirements. If necessary, I can ask for GPU or FPGA accelerators, and so on.
In my case, I ask for instances with two to four vCPUs and at least 2048 MiB of memory. Previously, it would have taken about 40 overrides, one for each instance type that meets these requirements, but with ABS, I just have to specify three parameters in the InstanceRequirements section. This is the full configuration file I am going to use to create the Auto Scaling group:
After a few minutes, four EC2 instances (corresponding to my DesiredCapacity) are running in the EC2 console. In the list, I find both C3 and C5a instances, spanning both time and CPU manufacturer.
Of those instances, 50 percent is On-Demand (based on the OnDemandPercentageAboveBaseCapacity option in the InstancesDistribution section). In the Spot Request tab of the EC2 console, I see the two requests:
As expected, all instance types follow my requirements and have size large. However, I quickly realize my application needs more compute capacity in each instance. I update the Auto Scaling group with the new requirements, asking for more vCPUs (between four and six):
EC2 Auto Scaling performs a rolling replacement of the instances based on the new requirements. After a few minutes, all instances have been replaced by new ones with size xlarge, and I have a mix of C5, C5a, and M3 instances running. All previous instances have been terminated.
Similar to before, two of the new instances are launched using Spot requests. The previous Spot requests have been closed.
How to Preview Matching Instances without Launching Them To better understand how the new ABS works, I use the new EC2 GetInstanceTypesFromInstanceRequirements API. This API returns the list of instance types matching my requirements.
Note that here I had to specify the type of architecture (x86_64) and virtualization (hvm). When creating the Auto Scaling group, this information was provided by the Amazon Machine Images (AMI) used by the launch template.
Now, let’s preview all the instance types selected by these requirements:
Using this new EC2 API, I can quickly test different requirements and see how they map to instance types. When new instance types are released, they are automatically added to the list if they match my requirements.
This new feature makes it easy to use flexible instance type configurations instead of long lists of instance types. In this way, you can automatically use newer generation instance types when they are released in the Region. Also, you can easily access more capacity with your Spot requests.
IT developers are frequently looking for an analytics system that tracks app user behavior and engagement with various marketing campaigns. It can be challenging to differentiate between use cases and advantages of utilizing Long Codes, Short Codes and Toll-Free numbers to feed into interaction analytics. With Amazon Pinpoint, developers can learn how each user prefers to engage and can personalize their end-user’s experience to increase engagement.
In this blog post, we’ll evaluate the differences between Long Codes, Short Codes and Toll-Free and we’ll also discuss messaging templates and creating journeys to customize events handling in Amazon Pinpoint.
Typical use cases of Amazon Pinpoint include:
Sending timely and targeted message to your customers promoting your products and services with basic templates or highly-personalized messages.
Event-based campaigns can be used to send a message when a customer creates a new account or when they add an item to their cart but don’t purchase it. These communications are transactional in nature and can be sent on customer activities within your application.
You can create customer outreach with millions in user communities and use built-in analytics to observe your campaign performance.
SMS messaging forms one of the most critical communication channels with customers. Both one way and two-way messaging are supported by Amazon Pinpoint when you enable the SMS channel in your project.
Architecture overview
The following diagram illustrates a typical architecture for how Pinpoint integrates with various AWS services.
Long codes, short codes, and toll-free numbers
Dedicated long codes and 10DLC
A dedicated long code, also referred to as a long virtual number or LVN, is a standard phone number that contains up to 12 digits, depending on the country that it’s based in. You cannot request a long code for A2P messaging within the United States. Instead, you’ll need to request a 10DLC.
Typically used for customer service-related communications, long codes also allow businesses to establish consistent experiences. This is done by using the same number to send both SMS text messages as well as voice messages to customers.
In the United States, 10-digit long code (10DLC) numbers are designed specifically for high-volume Application-to-Person (A2P) messaging. Before purchasing a 10DLC, you must first register your company and create a campaign using the Amazon Pinpoint console. Since Jun 1, 2021, United States mobile carriers require 10DLC for A2P messages.
Common use cases: Customer service, appointment reminders, two-way communications, fraud, or emergency notifications (10DLC), promotional messaging (10DLC).
Advantages:
Customer Trust and Brand recognition: 10DLC and dedicated long codes are registered and dedicated to individual companies and campaigns. This means that if you send multiple messages to a recipient each message will appear to come from the same number.
SMS and Voice capable: Businesses can use the same long code numbers for both SMS and voice communications to provide consistent contact experiences to their customers.
High reliability and delivery rate (10DLC): 10DLC has been adopted by United States wireless carriers specifically for business messaging. By requiring a registration and pre-vetting process, wireless carriers can support higher message volumes and better deliverability while protecting consumers from potential abuse.
Low costs: 10DLC and dedicated long code numbers cost less than dedicate short codes.
Fast provisioning: Dedicated long codes are typically provisioned within 24-hours. 10DLC numbers are provisioned in about 1 week. These timelines are much shorter than the 10+ weeks needed for short code provisioning.
Disadvantages:
Carrier specific limits (10DLC): United States mobile carriers have announced varying throughput and volume limits depending on the tier assigned to your company. This can make planning more difficult. See 10DLC capabilities for an outline of carrier-specific limits.
Limited Throughput (Long Codes): Mobile carriers limit the throughput rate of dedicated long codes to 1 message part per second (MPS) in Canada and 10 MPS in all other countries and regions. This creates a bottleneck when messaging thousands of recipients.
Transactional messaging only (Long Codes): Mobile carriers prohibit the use of long codes for promotional or marketing messages. Violations could cause carriers to block messages, impose fines, or shut down service.
Difficult to remember: Compared to 5-digit to 6-digit short codes, 10-digit numbers are more difficult for customers to remember and to enter into their devices.
Toll-free numbers
Similar to dedicated long codes, toll-free numbers are 10-digit phone numbers beginning with one of the following area codes: 800, 888, 877, 866, 855, 844, or 833. Toll-free numbers are primarily used for transactional messages but they can be used promotional messaging if recipients opt-in to receiving messages and the opt-out rate is low.
Common use cases: Customer service, appointment reminders, two-way communications, fraud or emergency notifications.
Advantages:
SMS and Voice capable: Businesses can use the same toll-free numbers for both SMS and voice communications to provide consistent contact experiences to their customers.
Low costs: Like 10DLC and dedicated long code numbers, toll-free numbers cost significantly less than dedicate short codes.
Fast Provisioning: Typically, toll-free numbers are available immediately after request submission.
Disadvantages:
Supported in United States Only: Currently Amazon Pinpoint only supports SMS-enabled toll-free numbers in the United States. A toll-free number cannot be used to send messages outside of the US.
Limited Throughput: Mobile carriers limit the throughput rate of toll-free numbers to 3 MPS.
Dedicated short codes
Dedicated short codes are 3-digit to 8-digit numbers are commonly used for high-throughput application-to-person (A2P) messaging workloads. Mobile carriers review and approve all new short code requests before making them active. This vetting process allows messages sent using short codes to bypass carrier filters.
Common use-cases: Promotional messaging, emergency alert systems, mass communications, contest and voting submissions, and two-factor authentication.
Advantages:
High-throughput and high-volume messaging: Short codes are designed to be used for high volume messaging campaigns. The vetting and approval process required before activating short codes allows carriers to provide increased MPS throughput and daily message volume quotas while still protecting consumers from abuse.
High reliability and delivery rate: Due to the lengthy approval and audit process required to acquire a dedicated short code, short codes are not subject to carrier filtering resulting in reliable message delivery.
Easy to remember: Short codes are commonly 5–6 digits in length. This short length allows users to easily recognize and remember codes, increasing campaign effectiveness.
Disadvantages:
Lengthy Provisioning Time: It can take 8–12 weeks for short codes to become active on all carrier networks.
High Cost: Short code numbers have high one-time setup and monthly fees compared to other originating identities. For example, in the United States, there’s a $650 one-time setup fee plus an additional recurring charge of $995.00 per month for each short code.
Strict rules and regulations: Short codes are governed by different regulatory bodies depending on the country and region. For example, in the United States short codes are regulated by the Federal Communications Commission (FCC), Federal Trade Commission (FTC), and Cellular Telecommunications Industry Association (CTIA). Review Best Practices to learn about the key SMS messaging laws around the world.
Number type
Number format
Channel support
Two-way capable
Requires registration
Estimated Provisioning time
SMS throughput (message segments per-second)²
Pricing³
1
Long Code/10DLC
10DLC: 10 digits Long Codes: up to 12 digits
SMS Voice
Yes*
Yes
1 week
United States (US): Varies¹ Canada (CA): 1 MPS All other countries and regions: 10 MPS
$1/mo + registration
2
Short code
3–8 digits
SMS
Yes*
Yes
United States (US): 12 weeks Canada (CA): 16 weeks All other countries and regions: Varies
United States (US) 100 MPS Canada (CA): 100 MPS All other countries and regions: Varies by country
United States (US): $650 setup + $995/mo Canada (CA): $3,000 setup + $995/mo All other countries and regions: Varies
3
Toll-free
10 digits
SMS Voice
Yes*
No
Available immediately
United States (US): 3 MPS Canada (CA): N/A All other countries and regions: N/A
When you start using Amazon Pinpoint, you’ll want to think about your message templates. These templates are the context of your messages and can be used for any of the four supported messaging channels–SMS, Voice, Push Notifications, and Voice.
When creating your templates, you can use custom attributes that you imported when building your segment. We won’t be going into building your segments as that’s covered in Building segments.
We’ll outline how to create a template for SMS messages as that’s focus for this blog post. The first section we have to fill out is our template details. You can access template creation page by navigating to the Message templates section in the left ‘hamburger’ menu when on the pinpoint service page.
Here you’ll start by naming your template and giving this initial version a description. A sample format you can follow for naming your template names is channel_message-type_segment_target-campaign. For our example we’ll be using the name SMS_Transactional_NEUSA-Customers_WelcomeNewCustomer.
Next, we’ll build our template. We open the attribute finder by clicking on ‘Case attribute finder’ on the top right of that section and then loading our “Custom Attributes.”
When writing your message templates, you need to think through how these are perceived by the reader and if any words or phrases appear to be a spam message. We’ll examine what makes a message to appear like spam in the next section as we cover message structure.
The key part of building an Amazon Pinpoint template is the message.
First, there are a few components that make up your SMS message; the greeting, body, and closing. We’ll start with the greeting section as this is the first thing our recipients will read. When you build out your campaign in Amazon Pinpoint, more on Amazon Pinpoint campaigns by visiting Amazon Pinpoint campaigns, you choose the type of message you’ll be sending. This is one of the reasons why our naming convention contains “message-type” portion. You choose between Transactional or Promotional Messages.
When sending out promotional messages you’ll want to avoid directly addressing the person by name in the greeting.
The reason for this is when sending out promotional messages they are traditionally sent in bulk through various carriers around the world. Therefore, using the recipient’s name in the greeting could be viewed as a targeted spam message and something you should avoid when creating templates for your promotional messages. Instead consider using your company name for the greeting as this quickly tells readers who the message is from upfront.
Transactional messages have a bit more leeway when it comes to the greeting section and the recipient’s name can be used, with some caveats. You’ll still want to avoid using language that indicates spam, for example, punctuation like “Hi Bob-” or “Greetings Jane!” and instead greet your customers with a purpose “Bob’s order record:” or “Jane: Account Update”. Otherwise, you can leave out the name all together or substitute it with your company name. The goal with the greeting in a transactional message is to give the user an idea what the message is about.
Now that we have an idea of our greeting, we move onto the body which will contain the context of your message and any links or data you may want to pass on to the customer. Let’s start off with introducing randomness and taking advantage of the “Attributes Finder” panel we enabled earlier. We can use attributes for common things like the customer’s name, account identifier, payment due, city, or any other information we may have on the recipient as part of our segment for our template as well.
If a URL is needed for the user to perform some action once they receive that message, this is an easy way to achieve randomness. We’ll want each URL to be unique which we can do by using a URL shortener like the one described by Eric Johnson @ https://aws.amazon.com/blogs/compute/building-a-serverless-url-shortener-app-without-lambda-part-1/. Other options to add uniqueness to our message might be a timestamp with the seconds, an anti-phishing phrase, city or zip-code, or any other unique information that’s ideally not something personally identifiable.
In the example below, we’ve used the following template:
[Attributes.CompanyName] Purchase the items today and receive [Attributes.DiscountAmount] of your next order. Visit [Attributes.ShortURL] to checkout and complete your order.
When messages are sent that use this template, Amazon Pinpoint will use the custom attributes provided in the segment data to populate the custom fields.
Proactive interactions
When sending messages to customers, it’s important to think about how to handle certain events that may come back from a message sent to a customer. These include common events such as a customer opting out of messages or a message failure. We’ll start by handling opt-outs as this is a common one and sometimes unintentional.
In the below screenshot, we’ve setup a Amazon Pinpoint journey (for more information about journeys, visit Amazon Pinpoint journeys to take actions based a customer’s response to a message. If the customer responds back to the message with “stop”, we’ve setup the yes/no split to invoke a Lambda function and send the customer an email. In this case our email may include a message like “You have opted out of SMS messaging, if this was unintentional, please visit your account to reactivate.”
We invoke a Lambda function to update the customer record with their SMS status. On the customer portal, you could then have a button next to the SMS status, that when clicked, calls the appropriate APIs to opt-in the customer. Another way to achieve this is to validate phone number using Pinpoint’s validation API even before the page loads and then show the same button the customer.
Another common scenario are message failures, which we can address in the same manner. Our journey is configured with the same entry, SMS send, and yes/no split. However, this time we evaluate if the message failed, and if it does, we send an email to the customer. Similar to opt-outs, we can use a Lambda trigger to update the customer database and then prompt the user to update their phone number. This scenario is commonly caused when phone numbers are incorrect or entered in wrong format. So, a great way to reduce errors is to validate the phone number after the customer enters it in (more information about how to validate numbers in Amazon Pinpoint can be found in the Developer Guide)
The following flow shows a typical Pinpoint journey and integration with your application backend.
Conclusion
In this blog post, we showed you how to use features of Amazon Pinpoint like templates, and then journeys, to automatically resolve failed messages, opt-outs, and other events. We also reviewed the various types of phone number options available in Amazon Pinpoint, as well as how to monitor your usage.
From here, navigate to the console, setup your project in Amazon Pinpoint, and begin testing the various channels. We recommend watching a video on building immersive experiences with Amazon Pinpoint and Journeys. We have only just begun showing you what is possible with Amazon Pinpoint today.
Field Notes provides hands-on technical guidance from AWS Solutions Architects, consultants, and technical account managers, based on their experiences in the field solving real-world business problems for customers.
The oss-security
mailing list is specifically set up for reports and discussion of security flaws in
open-source software after their embargo, if any, has expired. But the
response to a recent report
of the fix for a security flaw in the Linux kernel went in a different
direction than usual. The report did not break the two-week embargo
period, instead it was “late”, which has highlighted some problems in the
management of flaws of this nature.
AWS CloudHSM provides a cloud-based hardware security module (HSM) that enables you to easily generate and use your own encryption keys in AWS. Using CloudHSM as part of a Microsoft Active Directory Certificate Services (AD CS) public key infrastructure (PKI) fortifies the security of your certificate authority (CA) private key and ensures the security of the trust hierarchy. In this blog post, we walk you through how to migrate your existing Microsoft AD CS CA private key to the HSM in a CloudHSM cluster.
The challenge
Organizations implement public key infrastructure (PKI) as an application to provide integrity and confidentiality between internal and customer-facing applications. A PKI provides encryption/decryption, message hashing, digital certificates, and digital signatures to ensure these security objectives are met. Microsoft AD CS is a popular choice for creating and managing a CA for enterprise applications such as Active Directory, Exchange, and Systems Center Configuration Manager. Moving your Microsoft AD CS to AWS as part of your overall migration plan allows you to continue to use your existing investment in Windows certificate auto enrollment for users and devices without disrupting existing workflows or requiring new certificates to be issued. However, when you migrate an on-premises infrastructure to the cloud, your security team may determine that storing private keys on the AD CS server’s disk is insufficient for protecting the private key that signs the certificates issued by the CA. Moving from storing private keys on the AD CS server’s disk to a hardware security module (HSM) can provide the added security required to maintain trust of the private keys.
This walkthrough shows you how to migrate your existing AD CS CA private key to the HSM in your CloudHSM cluster. The resulting configuration avoids the security concerns of using keys stored on your AD CS server, and uses the HSM to perform the cryptographic signing operations.
Prerequisites
For this walkthrough, you should have the following in place:
In order to ensure a smooth migration, we recommend that you review the Active Directory Certificate Services Migration Guide for Windows Server 2012 R2 for more information about migrating Active Directory Certificate Services, planning your CA migration, and the supporting infrastructure for Certificate Revocation List (CRL) distribution and Authority Information Access (AIA) endpoints.
Migrating a domain
In this section, you will walk through migrating your AD CS environment to AWS by using your existing CA certificate and private key that will be secured in CloudHSM. In order to securely migrate the private key into the HSM, you will install the CloudHSM client and import the keys directly from the existing CA server.
This walkthrough includes the following steps:
Create a crypto user (CU) account
Import the CA private key into CloudHSM
Export the CA certificate and database
Configure and import the certificate into the new Windows CA server
Install AD CS on the new server
The operations you perform on the HSM require the credentials of an HSM user. Each HSM user has a type that determines the operations you can perform when authenticated as that user. Next, you will create a crypto user (CU) account to use with your CA servers, to manage keys and to perform cryptographic operations.
To create the CU account
From the on-premises CA server, use the following command to log in with the crypto officer (CO) account that you created when you activated the cluster. Be sure to replace <co_password> with your CO password.
loginHSM CO admin <co_password>
Use the following command to create the CU account. Replace <cu_user> and <cu_password> with the username and password you want to use for the CU.
Now that you have the CloudHSM client installed and configured on the on-premises CA server, you can import the CA private key from the local server into your CloudHSM cluster.
To import the CA private key into CloudHSM
Open an administrative command prompt and navigate to C:\Program Files\Amazon\CloudHSM.
To identify the unique container name for your CA’s private key, enter certutil -store my to list all certificates stored in the local machine store. The CA certificate will be shown as follows:
================ Certificate 0 ================
Serial Number: <certificate_serial_number>
Issuer: CN=example-CA, DC=example, DC=com
 NotBefore: 6/25/2021 5:04 PM
 NotAfter: 6/25/2022 5:14 PM
Subject: CN=example-CA-test3, DC=example, DC=com
Certificate Template Name (Certificate Type): CA
CA Version: V0.0
Signature matches Public Key
Root Certificate: Subject matches Issuer
Template: CA, Root Certification Authority
Cert Hash(sha1): cb7c09cd6c76d69d9682a31fbdbbe01c29cebd82
  Key Container = example-CA-test3
  Unique container name: <unique_container_name>
  Provider = Microsoft Software Key Storage Provider
Signature test passed
Verify that the key is backed by the Microsoft Software Key Storage Provider and make note of the <unique_container_name> from the output, to use it in the following steps.
Use the following command to set the environment variable n3fips_password. Replace <cu_user> and <cu_password> with the username and password for the CU you created earlier for the CloudHSM cluster. This variable will be used by the import_key command in the next step.
set n3fips_password=<cu_user>:<cu_password>
Use the following import_key command to import the private key into the HSM. Replace <unique_container_name> with the value you noted earlier.
import_key.exe -RSA "<unique_container_name>”
The import_key command will report that the import was successful. At this point, your private key has been imported into the HSM, but the on-premises CA server will continue to run using the key stored locally.
The Active Directory Certificate Services Migration Guide for Windows Server 2012 R2 uses the Certification Authority snap-in to migrate the CA database, as well as the certificate and private key. Because you have already imported your private key into the HSM, next you will need to make a slight modification to this process and export the certificate manually, without its private key.
To export the CA certificate and database
To open the Microsoft Management Console (MMC), open the Start menu and in the search field, enter MMC, and choose Enter.
From the File menu, select Add/Remove Snapin.
Select Certificates and choose Add.
You will be prompted to select which certificate store to manage. Select Computer account and choose Next.
Select Local Computer, choose Finish, then choose OK.
In the left pane, choose Personal, then choose Certificates. In the center pane, locate your CA certificate, as shown in Figure 1.
Figure 1: Microsoft Management Console Certificates snap-in
Open the context (right-click) menu for the certificate, choose All Tasks, then choose Export.
In the Certificate Export Wizard, choose Next, then choose No, do not export the private key.
Under Select the format you want to use, select Cryptographic Message Syntax Standard – PKCS #7 format file (.p7b) and select Include all certificates in the certification path if possible, as shown in Figure 2.
Figure 2: Certificate Export Wizard
Save the file in a location where you’ll be able to locate it later, so you will be able to copy it to the new CA server.
From the Start menu, browse to Administrative Tools, then choose Certificate Authority.
Open the context (right-click) menu for your CA and choose All Tasks, then choose Back up CA.
In the Certificate Authority Backup Wizard, choose Next. For items to back up, select only Certificate database and certificate database log. Leave all other options unselected.
Under Back up to this location, choose Browse and select a new empty folder to hold the backup files, which you will move to the new CA later.
After the backup is complete, in the MMC, open the context (right-click) menu for your CA, choose All Tasks, then choose Stop service.
At this point, until you complete the migration, your CA will no longer be issuing new certificates.
To configure and import the certificate into the new Windows CA server
Copy the certificate (.p7b file) backup from the on-premises CA server to the EC2 instance.
On your EC2 instance, locate the certificate you just copied, as shown in Figure 3. Open the certificate to start the import process.
Figure 3: Certificate Manager tool
Select Install Certificate. For Store Location, select Local Machine.
Select Place the Certificates in the following store. Allowing Windows to place the certificate automatically will install it as a trusted root certificate, rather than a server certificate.
Select Browse, select the Personal store, and then choose OK.
Choose Next, then choose Finish to complete the certificate installation.
At this point, you’ve installed the public key and certificate from the on-premises CA server to your EC2-based Windows CA server. Next, you need to link this installed certificate with the private key, which is now stored on the CloudHSM cluster, in order to make it functional for signing issued certificates and CRLs.
To link the certificate with the private key
Open an administrative command prompt and navigate to C:\Program Files\Amazon\CloudHSM.
Use the following command to set the environment variable n3fips_password. Replace <cu_user> and <cu_password> with the username and password for the CU that you created earlier for the CloudHSM cluster. This variable will be used by the import_key command in the next step.
set n3fips_password=<cu_user>:<cu_password>
Use the following import_key command to represent all keys stored on the HSM in a new key container in the key storage provider. This step is necessary to allow the cryptography tools to see the CA private key that is stored on the HSM.
import_key -from HSM -all
Use the following Windows certutil command to find your certificate’s unique serial number.
certutil -store my
Take note of the CA certificate’s serial number.
Use the following Windows certutil command to link the installed certificate with the private key stored on the HSM. Replace <certificate_serial_number> with the value noted in the previous step.
certutil -repairstore my <certificate_serial_number>
Enter the command certutil -store my. The CA certificate will be shown as follows. Verify that the certificate is now linked with the HSM-backed private key. Note that the private key is using the Cavium Key Store Provider. Also note the message Encryption test passed, which means that the private key is usable for encryption.
================ Certificate 0 ================
Serial Number: <certificate_serial_number>
Issuer: CN=example-CA, DC=example, DC=com
 NotBefore: 6/25/2021 5:04 PM
 NotAfter: 6/25/2022 5:14 PM
Subject: CN=example-CA, DC=example, DC=com
Certificate Template Name (Certificate Type): CA
CA Version: V0.0
Signature matches Public Key
Root Certificate: Subject matches Issuer
Template: CA, Root Certification Authority
Cert Hash(sha1): cb7c09cd6c76d69d9682a31fbdbbe01c29cebd82
  Key Container = PRV_KEY_IMPORT-6-9-7e5cde
  Provider = Cavium Key Storage Provider
Private key is NOT exportable
Encryption test passed
Now that your CA certificate and key materials are in place, you are ready to setup your EC2 instance as a CA server.
To install AD CS on the new server
In Microsoft’s documentation to Install the Certificate Authority role on your new EC2 instance, follow steps 1-8. Do not complete the remaining steps, because you will be configuring the CA to use the existing HSM backed certificate and private-key instead of generating a new key.
In Confirm installation selections, select Install.
After your installation is complete, Server Manager will show a notification banner prompting you to configure AD CS. Select Configure Active Directory Certificate Services from this prompt.
Select either Standalone or Enterprise CA installation, based upon the configuration of your on-premises CA.
Select Use Existing Certificate and Private Key and browse to select the CA certificate imported from your on-premises CA server.
Select Next and verify your location for the certificate database files.
Select Finish to complete the wizard.
To restore the CA database backup, from the Start menu, browse to Administrative Tools, then choose Certificate Authority.
Open the context (right-click) menu for the certificate authority and choose All Tasks, then choose Restore CA. Browse to and select the database backup that you copied from the on-premises CA server.
Review the Active Directory Certificate Services Migration Guide for Windows Server 2012 R2 to complete migration of your remaining Microsoft Public Key Infrastructure (PKI) components. Depending on your existing CA environment, these steps may include establishing new CRL and AIA endpoints, configuring Windows Routing and Remote Access to use the new CA, or configuring certificate auto enrollment for Windows clients.
Conclusion
In this post, we walked you through migrating an on-premises Microsoft AD CS environment to an AWS environment that uses AWS CloudHSM to secure the CA private key. By migrating your existing Windows PKI backed by AWS CloudHSM, you can continue to use your Windows certificate auto enrollment for users and devices with your private key secured in a dedicated HSM.
If you have feedback about this blog post, submit comments in the Comments section below. You can also start a new thread on the AWS CloudHSM forum to get answers from the community.
Want more AWS Security how-to content, news, and feature announcements? Follow us on Twitter.
In this episode of Security Nation, Jen and Tod chat with Jack Cable, security architect at the Krebs Stamos Group, about Ransomwhere, a crowdsourced ransomware payment tracker. They chat about how Cable came up with the idea, the role of cryptocurrency in tracking these payments, and how better data sharing can help combat the surge in ransomware attacks.
Stick around for our Rapid Rundown, where Tod and Jen talk about a remote code execution vulnerability that open-source forum provider Discourse experienced recently, which CISA released a notification about over the weekend. Tod highlights some of the many things Discourse is doing right with its security program.
Jack Cable
Jack Cable is a security researcher and student at Stanford University, currently working as a security architect at Krebs Stamos Group. Jack formerly served as an Election Security Technical Advisor at CISA, where he led the development and deployment of Crossfeed, a pilot to scan election assets nationwide. Jack is a top-ranked bug bounty hacker, having identified over 350 vulnerabilities in companies including Google, Facebook, Uber, Yahoo, and the US Department of Defense. After placing first in the Hack the Air Force challenge, Jack began working at the Pentagon’s Defense Digital Service. Jack was named one of Time Magazine’s 25 most influential teens for 2018. At Stanford, Jack is a research assistant with the Stanford Internet Observatory and Stanford Empirical Security Research Group and launched Stanford’s bug bounty program, one of the first in higher education.
Like the show? Want to keep Jen and Tod in the podcasting business? Feel free to rate and review with your favorite podcast purveyor, like Apple Podcasts.
Want More Inspiring Stories From the Security Community?
You’re probably familiar with containers if you’re even remotely involved in software development or systems administration. In their 2023 survey, the Cloud Native Computing Foundation found that over 90% organizations use containers in production. Additionally, more than 90% of organizations that rely on cloud native practices for most or all of their application development and deployment also depend on containers.
But, whether orchestrating containers is a regular part of your day-to-day life, or you are just trying to understand what an operating system kernel is, it helps to have an understanding of some container basics.
Today, we’re explaining what containers are, how they’re used, and how cloud storage fits into the container picture—all in one neat and tidy containerized blog post package. (And, yes, the kernel is important, so we’ll get to that, too).
What are containers?
Containers are packaged units of software that contain all of the dependencies (e.g. binaries, libraries, programming language versions, etc.) they need to run no matter where they live—on a laptop, in the cloud, or in an on-premises data center. That’s a fairly technical definition, so you might be wondering, “OK, but what are they really?”
The generally accepted definition of the term applies almost exactly to what the technology does.
A container, generally = a receptacle for holding goods; a portable compartment in which freight is placed (as on a train or ship) for convenience of movement.
A container in software development = a figurative “receptacle” for holding software. The second part of the definition applies even better—shipping containers are often used as a metaphor to describe what containers do. In shipping, instead of stacking goods in a jumbled pile, goods are packed into standard-sized containers that fit on whatever is hauling them—a ship, a train, or a trailer.
Likewise, instead of “shipping” an unwieldy mess of code, including the required operating system, containers package software into lightweight units that share the same operating system (OS) kernel and can run anywhere—on a laptop, on a server, in the cloud, etc.
What’s an OS kernel?
As promised, here’s where the OS kernel becomes important. The kernel is the core programming at the center of the OS that controls all other parts of the OS. The term makes sense if you consider the definition of “kernel” as “the central or essential part” as in “a kernel of truth.” (It also begs the question, “Why didn’t they just call it a colonel?” especially because it’s in charge of so many things… But that’s neither here nor there.) And now you know what an OS kernel does.
Compared to older virtualization technology, namely virtual machines which are measured in gigabytes, containers are only megabytes in size. That means you can run quite a few of them on a given computer or server much like you can stack many containers onto a ship.
Indeed, the founders of Docker, the software that sparked widespread container adoption, looked to the port of Oakland, California for inspiration. Former Docker CEO, Ben Golub, explained in an interview with InfoWorld, “We could see all the container ships coming into the port of Oakland, and we were talking about the value of the container in the world of shipping. The fact it was easier to ship a car from one side of the world than to take an app from one server to another, that seemed like a problem ripe for solving.” In fact, it’s right there in their logo.
And that is exactly what containers, mainly via Docker’s popularity, did—they solved the problem of environment inconsistency for developers. Before containers became widely used, moving software between environments meant things broke, a lot. If a developer wrote an app on their laptop, then moved it into a testing environment on a server, for example, everything had to be the same—same versions of the programming language, same permissions, same database access, etc. If not, you had a very sad app.
Virtualization 101
Containers work their magic by way of virtualization. Virtualization is the process of creating a simulated computing environment that’s abstracted from the physical computing hardware—essentially a computer-generated computer, also referred to as a software-defined computer.
The first virtualization technology to really take off was the virtual machine (VM). A VM sits atop a hypervisor—a lightweight software layer that allows multiple operating systems to run in tandem on the same hardware. VMs allow developers and system administrators to make the most of computing hardware. Before VMs, each application had to run on its own server, and it probably didn’t use the server’s full capacity. After VMs, you could use the same server to run multiple applications, increasing efficiency and lowering costs.
Containers vs. virtual machines
While VMs increase hardware efficiency, each VM requires its own OS and a virtualized copy of the underlying hardware. Because of this, VMs can take up a lot of system resources, and they’re slow to start up.
Containers, on the other hand, do not virtualize the hardware. Instead, they share the host operating system’s kernel, making them much smaller and faster than VMs. Want to know more? Check out our deep dive into the differences between VMs and containers.
The benefits of containers
Containers allow developers and system administrators to develop, test, and deploy software and applications faster and more efficiently than older virtualization technologies like VMs. The benefits of containers include:
Portability: Containers include all of the dependencies they need to run in any environment, provided that environment includes the appropriate OS. This reduces the errors and bugs that arise when moving applications between different environments, increasing portability.
Size: Containers share OS resources and don’t include their own OS image, making them lightweight—megabytes compared to VMs’ gigabytes. As such, one machine or server can support many containers.
Speed: Again, because they share OS resources and don’t include their own OS image, containers can be spun up in seconds compared to VMs which can take minutes to spin up.
Resource efficiency: Similar to VMs, containers allow developers to make the best use of hardware and software resources.
Isolation: Also similar to VMs, with containers, different applications or even component parts of a singular application can be isolated such that issues like excessive load or bugs on one don’t impact others.
Container use cases
Containers are nothing if not versatile, so they can be used for a wide variety of use cases. However, there are a few instances where containers are especially useful:
Enabling microservices architectures: Before containers, applications were typically built as all-in-one units or “monoliths.” With their portability and small size, containers changed that, ushering in the era of microservices architecture. Applications could be broken down into their component “services,” and each of those services could be built in its own container and run independently of the other parts of the application. For example, the code for your application’s search bar can be built separately from the code for your application’s shopping cart, then loosely coupled to work as one application.
Supporting modern development practices: Containers and the microservices architectures they enable paved the way for modern software development practices. With the ability to split applications into their component parts, each part could be developed, tested, and deployed independently. Thus, developers can build and deploy applications using modern development approaches like DevOps, continuous integration/continuous deployment (CI/CD), and agile development.
Facilitating hybrid cloud and multi-cloud approaches: Because of their portability, containers enable developers to utilize hybrid cloud and/or multi-cloud approaches. Containers allow applications to move easily between environments—from on-premises to the cloud or between different clouds.
Accelerating cloud migration or cloud-native development: Existing applications can be refactored using containers to make them easier to migrate to modern cloud environments. Containers also enable cloud-native development and deployment.
The role of software containers in AI application development
In addition to enabling microservices architectures and supporting modern development practices, containers play a role in AI application development. Their ability to provide consistent, reproducible environments makes them ideal for AI, where managing complex dependencies and ensuring uniform performance across different platforms are essential.
AI projects often rely on specific versions of libraries, drivers, and runtimes, which can lead to compatibility issues and errors. Containers solve this problem by encapsulating all necessary dependencies, libraries, and runtime environments to provide a consistent and reproducible platform for AI development. This encapsulation ensures that AI models and applications run the same way, regardless of the underlying infrastructure and provides consistency from development through production.
The portability of containers also offers advantages for deploying AI workloads across diverse environments. They can be easily moved between local development machines, on-premises servers, and cloud platforms without requiring code or configuration changes. This flexibility supports easy scalability of AI applications to meet changing demands—such as increased user loads or the need for more intensive data processing.
Additionally, containers enable organizations to leverage the most cost effective and powerful computing resources available, whether it’s local hardware for testing and development or cloud-based GPU clusters for training large-scale models. This ability moves workloads efficiently across different environments and also supports hybrid and multi-cloud strategies to provide organizations with greater agility, while reducing costs and avoiding vendor lock-in.
Container tools
The two most widely recognized container tools are Docker and Kubernetes. They’re not the only options out there, but in their 2023 developer survey, Stack Overflow found that nearly 52% out of 90,000+ respondents use Docker and 19% use Kubernetes. But what do they do?
1. What is Docker?
Container technology had been around for a while in the form of Linux containers or LXC, but the widespread adoption of containers happened only in the past decade with the introduction of Docker.
Docker was launched in 2013 as a project to build single-application LXC containers, introducing several changes to LXC that make containers more portable and flexible to use. It later morphed into its own container runtime environment. At a high level, Docker is a Linux utility that can efficiently create, ship, and run containers.
Docker introduced more standardization to containers than previous technologies and focused on developers, specifically, making it the de facto standard in the developer world for application development.
2. What is Kubernetes?
As containerization took off, many early adopters found themselves facing a new problem: how to manage a whole bunch of containers. Enter: Kubernetes. Kubernetes is an open-source container orchestrator. It was developed at Google (deploying billions of containers per week is no small task) as a “minimum viable product” version of their original cluster orchestrator, ominously named Borg. Today, it is managed by the Cloud Native Computing Foundation, and it helps automate management of containers including provisioning, load balancing, basic health checks, and scheduling.
Kubernetes allows developers to describe the desired state of a container deployment using YAML files (YAML stands for Yet Another Markup Language, which is yet another winning tech acronym.). The YAML file uses declarative language to tell Kubernetes “this is what this container deployment should look like” and Kubernetes does all the grunt work of creating and maintaining that state.
Containers + storage: What you need to know
Containers are inherently ephemeral or stateless. They get spun up, and they do their thing. When they get spun down, any data that was created while they were running is destroyed with them. But most applications are stateful, and need data to live on even after a given container goes away.
Object storage is inherently scalable. It enables the storage of massive amounts of unstructured data while still maintaining easy data accessibility. For containerized applications that depend on data scalability and accessibility, it’s an ideal solution for keeping stateful data stateful.
There are three essential use cases where object storage works hand in hand with containerized applications:
Backup and disaster recovery: Tools like Docker and Kubernetes enable easy replication of containers, but replication doesn’t replace traditional backup and disaster recovery just as sync services aren’t a good replacement for backing up the data on your laptop, for example. With object storage, you can replicate your entire environment and back it up to the cloud. There’s just one catch: some object storage providers have retention minimums, sometimes up to 90 days. If you’re experimenting and iterating on your container architecture, or if you use CI/CD methods, your environment is constantly changing. With retention minimums, that means you might be paying for previous iterations much longer than you want to. (Shameless plug: Backblaze B2 Cloud Storage is calculated hourly, with no minimum retention requirement.)
Primary storage: You can use a cloud object storage repository to store your container images, then when you want to deploy them, you can pull them into the compute service of your choice.
Origin storage: If you’re serving out high volumes of media, or even if you’re just hosting a simple website, object storage can serve as your origin store coupled with a CDN for serving out content globally. For example, CloudSpot, a SaaS platform that serves professional photographers, moved to a Kubernetes cluster environment and connected it to their origin store in Backblaze B2, where they now keep 120+ million files readily accessible for their customers.
Need object storage for your containerized application?
Now that you have a handle on what containers are and what they can do, you can make decisions about how to build your applications or structure your internal systems. Whether you’re contemplating moving your application to the cloud, adopting a hybrid or multi-cloud approach, or going completely cloud native, containers can help you get there. And with object storage, you have a data repository that can keep up with your containerized workloads.
Ready to connect your application to scalable, S3-compatible object storage? You can get started today for free.
For those of you still using the X.org display server, version 21.1 is
out. It includes “fully mature” meson build support, Glamor
support in Xvfb, variable refresh rate support, touchpad gestures, and
more.
Security updates have been issued by Debian (mosquitto and php7.0), Fedora (python-django-filter and qt), Mageia (fossil, opencryptoki, and qtbase5), openSUSE (apache2, busybox, dnsmasq, ffmpeg, pcre, and wireguard-tools), Red Hat (kpatch-patch), SUSE (apache2, busybox, dnsmasq, ffmpeg, java-11-openjdk, libvirt, open-lldp, pcre, python, qemu, util-linux, and wireguard-tools), and Ubuntu (apport and libslirp).
Building a serverless application changes the way developers think about testing their code. Previously, developers would emulate the complete infrastructure locally and only commit code ready for testing. However, with serverless, local emulation can be more complex.
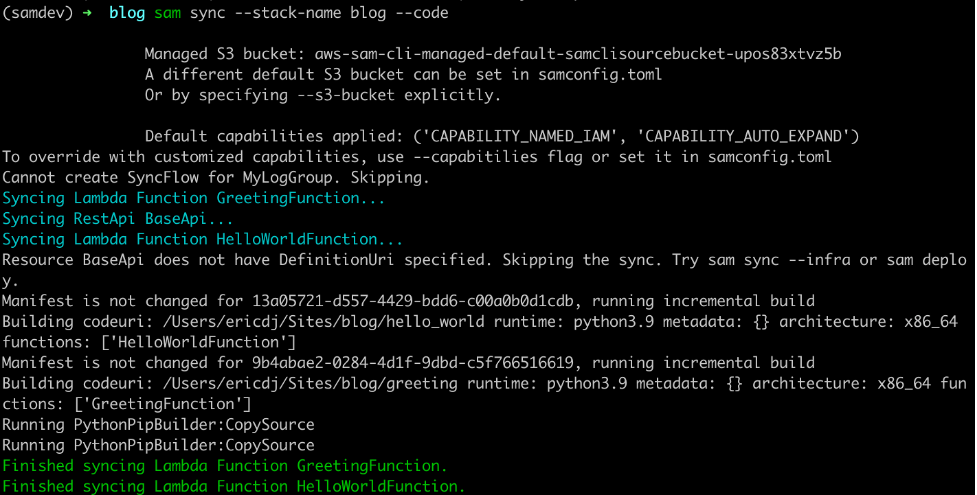
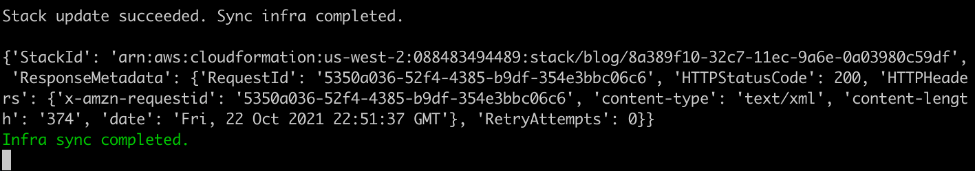
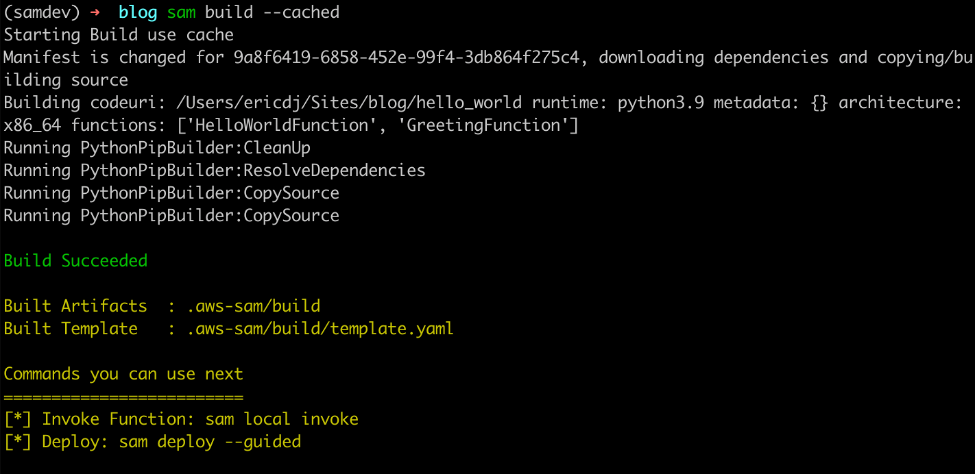
In this post, I show you how to bypass most local emulation by testing serverless applications in the cloud against production services using AWS SAM Accelerate. AWS SAM Accelerate aims to increase infrastructure accuracy for testing with sam sync, incremental builds, and aggregated feedback for developers. AWS SAM Accelerate brings the developer to the cloud and not the cloud to the developer.
AWS SAM Accelerate
The AWS SAM team has listened to developers wanting a better way to emulate the cloud on their local machine and we believe that testing against the cloud is the best path forward. With that in mind, I am happy to announce the beta release of AWS SAM Accelerate!
Previously, the latency of deploying after each change has caused developers to seek other options. AWS SAM Accelerate is a set of features to reduce that latency and enable developers to test their code quickly against production AWS services in the cloud.
To demonstrate the different options, this post uses an example application called “Blog”. To follow along, create your version of the application by downloading the demo project. Note, you need the latest version of AWS SAM and Python 3.9 installed. AWS SAM Accelerate works with other runtimes, but this example uses Python 3.9.
After installing the pre-requisites, set up the demo project with the following commands:
Create a folder for the project called blog mkdir blog && cd blog
AWS SAM downloads the sample project into the current folder. With the blog application in place, you can now try out AWS SAM Accelerate.
AWS SAM sync
The first feature of AWS SAM Accelerate is a new command called sam sync. This command synchronizes your project declared in an AWS SAM template to the AWS Cloud. However, sam sync differentiates between code and configuration.
Anything else is considered configuration. The following description of the sam sync options explains how sam sync differentiates between configuration synchronization and code synchronization. The resulting patterns are the fastest way to test code in the cloud with AWS SAM.
Using sam sync (no options)
The sam synccommand with no options deploys or updates all infrastructure and code like the sam deploy command. However, unlike sam deploy, sam sync bypasses the AWS CloudFormationchangeset process. To see this, run:
sam sync --stack-name blog
AWS SAM sync with no options
First, sam sync builds the code using the sam build command and then the application is synchronized to the cloud.
Successful sync
Using SAM sync code, resource, resource-id flags
The sam sync command can also synchronize code changes to the cloud without updating the infrastructure. This code synchronization uses the service APIs and bypasses CloudFormation, allowing AWS SAM to update the code in seconds instead of minutes.
To synchronize code, use the --code flag, which instructs AWS SAM to sync all the code resources in the stack:
sam sync --stack-name blog --code
AWS SAM sync with the code flag
The sam sync command verifies each of the code types present and synchronizes the sources to the cloud. This example uses an API Gateway REST API and two Lambda functions. AWS SAM skips the REST API because there is no external OpenAPI file for this project. However, the Lambda functions and their dependencies are synchronized.
You can limit the synchronized resources by using the --resource flag with the --code flag:
sam sync --stack-name blog --code --resource AWS::Serverless::Function
SAM sync specific resource types
This command limits the synchronization to Lambda functions. Other available resources are AWS::Serverless::Api, AWS::Serverless::HttpApi, and AWS::Serverless::StateMachine.
You can target one specific resource with the --resource-id flag to get more granular:
sam sync --stack-name blog --code --resource-id HelloWorldFunction
SAM sync specific resource
This time sam sync ignores the GreetingFunction and only updates the HelloWorldFunction declared with the command’s --resource-id flag.
Using the SAM sync watch flag
The sam sync --watch option tells AWS SAM to monitor for file changes and automatically synchronize when changes are detected. If the changes include configuration changes, AWS SAM performs a standard synchronization equivalent to the sam sync command. If the changes are code only, then AWS SAM synchronizes the code with the equivalent of the sam sync --code command.
The first time you run the sam sync command with the --watch flag, AWS SAM ensures that the latest code and infrastructure are in the cloud. It then monitors for file changes until you quit the command:
sam sync --stack-name blog --watch
Initial sync
To see a change, modify the code in the HelloWorldFunction (hello_world/app.py) by updating the response to the following:
return {
  "statusCode": 200,
  "body": json.dumps({
    "message": "hello world, how are you",
    # "location": ip.text.replace("\n", "")
  }),
}
Once you save the file, sam sync detects the change and syncs the code for the HelloWorldFunction to the cloud.
AWS SAM detects changes
Auto dependency layer nested stack
During the initial sync, there is a logical resource name called AwsSamAutoDependencyLayerNestedStack. This feature helps to synchronize code more efficiently.
When working with Lambda functions, developers manage the code for the Lambda function and any dependencies required for the Lambda function. Before AWS SAM Accelerate, if a developer does not create a Lambda layer for dependencies, then the dependencies are re-uploaded with the function code on every update. However, with sam sync, the dependencies are automatically moved to a temporary layer to reduce latency.
Auto dependency layer in change set
During the first synchronization, sam sync creates a single nested stack that maintains a Lambda layer for each Lambda function in the stack.
Auto dependency layer in console
These layers are only updated when the dependencies for one of the Lambda functions are updated. To demonstrate, change the requirements.txt (greeting/requirements.txt) file for the GreetingFunction to the following:
Requests
boto3
AWS SAM detects the change, and the GreetingFunction and its temporary layer are updated:
Auto dependency layer synchronized
The Lambda function changes because the Lambda layer version must be updated.
Incremental builds with sam build
The second feature of AWS SAM Accelerate is an update to the SAM build command. This change separates the cache for dependencies from the cache for the code. The build command now evaluates these separately and only builds artifacts that have changed.
To try this out, build the project with the cached flag:
sam build --cached
The first build establishes cache
The first build recognizes that there is no cache and downloads the dependencies and builds the code. However, when you rerun the command:
The second build uses existing cached artifacts
The sam build command verifies that the dependencies have not changed. There is no need to download them again so it builds only the application code.
Finally, update the requirements file for the HelloWorldFunction (hello_w0rld/requirements.txt) to:
Requests
boto3
Now rerun the build command:
AWS SAM build detects dependency changes
The sam build command detects a change in the dependency requirements and rebuilds the dependencies and the code.
Aggregated feedback for developers
The final part of AWS SAM Accelerate’s beta feature set is aggregating logs for developer feedback. This feature is an enhancement to the already existing sam logs command. In addition to pulling Amazon CloudWatch Logs or the Lambda function, it is now possible to retrieve logs for API Gateway and traces from AWS X-Ray.
To test this, start the sam logs:
sam logs --stack-name blog --include-traces --tail
Invoke the HelloWorldApi endpoint returned in the outputs on syncing:
The sam logs command returns logs for the AWS Lambda function, Amazon API Gateway REST execution logs, and AWS X-Ray traces.
AWS Lambda logs from Amazon CloudWatch
Amazon API Gateway execution logs from Amazon CloudWatch
Traces from AWS X-Ray
The full picture
Development diagram for AWS SAM Accelerate
With AWS SAM Accelerate, creating and testing an application is easier and faster. To get started:
Start a new project: sam init
Synchronize the initial project with a development environment: sam sync --stack-name <project name> --watch
Start monitoring for logs: sam logs --stack-name <project name> --include-traces --tail
Test using response data or logs.
Iterate.
Rinse and repeat!
Some caveats
AWS SAM Accelerate is in beta as of today. The team has worked hard to implement a solid minimum viable product (MVP) to get feedback from our community. However, there are a few caveats.
Amazon State Language (ASL) code updates for Step Functions does not currently support DefinitionSubstitutions.
API Gateway OpenAPI template must be defined in the DefiitionUri parameter and does not currently support pseudo parameters and intrinsic functions at this time
The sam logs command only supports execution logs on REST APIs and access logs on HTTP APIs.
Function code cannot be inline and must be defined as a separate file in the CodeUri parameter.
Conclusion
When testing serverless applications, developers must get to the cloud as soon as possible. AWS SAM Accelerate helps developers escape from emulating the cloud locally and move to the fidelity of testing in the cloud.
In this post, I walk through the philosophy of why the AWS SAM team built AWS SAM Accelerate. I provide an example application and demonstrate the different features designed to remove barriers from testing in the cloud.
We invite the serverless community to help improve AWS SAM for building serverless applications. As with AWS SAM and the AWS SAM CLI (which includes AWS SAM Accelerate), this project is open source and you can contribute to the repository.
This post is written by Markus Ziller, Solutions Architect
Since AWS launched in 2006, cloud computing disrupted traditional IT operations by providing a more cost-efficient, scalable, and secure alternative to owning hardware and data centers. Similarly, cloud gaming today enables gamers to play video games with pay-as-you go pricing. This removes the need of high upfront investments in gaming hardware. Cloud gaming platforms like Amazon Luna are an entryway, but customers are limited to the games available on the service. Furthermore, many customers also prefer to own their games, or they already have a sizable collection. For those use cases, vendor-neutral software like NICE DCV or Parsec are powerful solutions for streaming your games from anywhere.
This post shows a way to stream video games from the AWS Cloud to your local machine. I will demonstrate how you can provision a powerful gaming machine with pay-as-you-go pricing that allows you to play even the most demanding video games with zero upfront investment into gaming hardware.
The post comes with code examples on GitHub that let you follow along and replicate this post in your account.
In this example, I use the AWS Cloud Development Kit (AWS CDK), an open source software development framework, to model and provision cloud application resources. Using the CDK can reduce the complexity and amount of code needed to automate resource deployment.
Overview of the solution
The main services in this solution are Amazon Elastic Compute Cloud (Amazon EC2) and Amazon Elastic Block Store (Amazon EBS). The architecture is as follows:
The key components of this solution are described in the following list. During this post, I will explain each component in detail. Deploy this architecture with the sample CDK project that comes with this blog post.
An Amazon Virtual Private Cloud (Amazon VPC) that lets you launch AWS resources in a logically isolated virtual network. This includes a network configuration that lets you connect with instances in your VPC on ports 3389 and 8443.
An Amazon EC2 instance of the G4 instance family. Amazon EC2 G4 instances are the most cost-effective and versatile GPU instances. Utilize G4 instances to run your games.
A way to create a personal gaming Amazon Machine Images (AMI). AMIs mean that you only need to conduct the initial configuration of your gaming instance once. After that, create new gaming instances on demand from your AMI.
Walkthrough
The following sections walk through the steps required to set up your personal gaming AMI. You will only have to do this once.
After completing the prerequisites, clone the associated GitHub repository by running the following command in a local directory:git clone [email protected]:aws-samples/cloud-gaming-on-ec2-instances
Open the repository in your preferred local editor, and then review the contents of the *.ts files in cdk/bin/ and cdk/lib/
In gaming-on-g4-instances.ts you will find two CDK stacks: G4DNStack and G4ADStack. A CDK stack is a unit of deployment. All AWS resources defined within the scope of a stack, either directly or indirectly, are provisioned as a single unit.
The architecture for both stacks is similar, and it only differs in the instance type that will be deployed.
G4DNStack and G4ADStack share parameters that determine the configuration of the EC2 instance, the VPC network and the preinstalled software. The stacks come with defaults for some parameters – I recommend keeping the default values.
EC2
instanceSize: Sets the EC2 size. Defaults to g4dn.xlarge and g4ad.4xlarge, respectively. Check the service page for a list of valid configurations.
sshKeyName: The name of the EC2 key pair you will use to connect to the instance. Ensure you have access to the respective .pem file.
volumeSizeGiB: The root EBS volume size. Around 20 GB will be used for the Windows installation, the rest will be available for your software.
VPC
openPorts: Access from these ports will be allowed. Per default, this will allow access for Remote Desktop Protocol (RDP) (3389) and NICE DCV (8443).
associateElasticIp: Controls if an Elastic IP address will be created and added to the EC2 instance. An Elastic IP address is a static public IPv4 address. Contrary to dynamic IPv4 addresses managed by AWS, it will not change after an instance restart. This is an optional convenience that comes at a small cost for reserving the IP address for you.
allowInboundCidr: Access from this CIDR range will be allowed. This limits the IP space from where your instance is routable. It can be used to add an additional security layer. Per default, traffic from any IP address will be allowed to reach your instance. Notwithstanding allowInboundCidr, an RDP or NICE DCV connection to your instance requires valid credentials and will be rejected otherwise.
gridSwCertUrl: The NVIDIA driver requires a certificate file, which can be downloaded from Amazon S3.
Choose an instance type based on your performance and cost requirements, and then adapt the config accordingly. I recommend starting with the G4DNStack, as it comes at the lowest hourly instance cost. If you need more graphics performance, then choose the G4ADStack for up to 40% improvement in graphics performance.
After choosing an instance, follow the instructions in the README.md in order to deploy the stack.
The CDK will create a new Amazon VPC with a public subnet. It will also configure security groups to allow inbound traffic from the CIDR range and ports specific in the config. By default, this will allow inbound traffic from any IP address. I recommend restricting access to your current IP address by going to checkip.amazonaws.com and replacing 0.0.0.0/0 with <YOUR_IP>/32 for the allowInboundCidr config parameter.
Besides the security groups, the CDK also manages all required IAM permissions.
It creates the following resources in your VPC:
An EC2 GPU instance running Windows Server 2019. Depending on the stack you chose, the default instance type will be g4dn.xlarge or g4ad.4xlarge. You can override this in the template. When the EC2 instance is launched, the CDK runs an instance-specific PowerShell script. This PowerShell script downloads all drivers and NICE DCV. Check the code to see the full script or add your own commands.
An EBS gp3 volume with your defined size (default: 150 GB).
(Optionally) An Elastic IP address as a static public IP address for your gaming instances.
After the stack has been deployed, you will see the following output:
Click the first link, and download the remote desktop file in order to connect to your instance. Use the .pem file from the previous step to receive the instance password.
Install drivers on EC2
You will use the RDP to initially connect to your instance. RDP provides a user with a graphical interface to connect to another computer over a network connection. RDP clients are available for a large number of platforms. Use the public IP address provided by the CDK output, the username Administrator, and the password displayed by the EC2 dialogue.
Ensure that you note the password for later steps.
Most configuration process steps are automated by the CDK. However, a few actions (e.g., driver installation) cannot be properly automated. For those, the following manual steps are required once.
Navigate to $home\Desktop\InstallationFiles. If the folder contains an empty file named “OK”, then everything was downloaded correctly and you can proceed with the installation. If you connect while the setup process is still in progress, then wait until the OK file gets created before proceeding. This typically takes 2-3 minutes.
The next step differs slightly for g4ad and g4dn instances.
g4ad instances with AMD Radeon Pro V520
Follow the instructions in the EC2 documentation to install the AMD driver from the InstallationFiles folder. The installation may take a few minutes, and it will display the following output when successfully finished.
Next, install NICE DCV Server and Display driver by double-clicking the respective files. Finally, restart the instance by running the Restart-Computer PowerShell command.
g4dn instances with NVIDIA T4
Navigate to 1_NVIDIA_drivers, run the NVIDIA driver installer for Windows Server 2019 and follow the instructions.
Next, double-click the respective files in the InstallationFiles folder in order to install NICE DCV Server and Display driver.
Finally, right-click on 4_update_registry.ps1, and select “Run with PowerShell” to activate the driver. In order to complete the setup, restart the instance.
Install your software
After the instance restart, you can connect from your local machine to your EC2 instance with NICE DCV. The NICE DCV bandwidth-adaptive streaming protocol allows near real-time responsiveness for your applications without compromising the image accuracy. This is the recommended way to stream latency sensitive applications.
Download the NICE DCV viewer client and connect to your EC2 instance with the same credentials that you used for the RDP connection earlier. After testing the NICE DCV connection, I recommend disabling RDP by removing the corresponding rule in your security group.
You are now all set to install your games and tools on the EC2 instance. Make sure to install it on the C: drive, as you will create an AMI with the contents of C: later.
Start and stop your instance on demand
At this point, you have fully set up the EC2 instance for cloud gaming on AWS. You can now start and stop the instance when needed. The following CLI commands are all you need to remember:
This will use the regular On-Demand instance capacity of EC2, and you will be billed hourly charges for the time that your instance is running. If your instance is stopped, you will only be charged for the EBS volume and the Elastic IP address if you chose to use one.
Launch instances from AMI
Make sure you have installed all of the applications you require on your EC2, and then create your personal gaming AMI by running the following AWS CLI command.
This command will start a new EC2 instance with the exact same configuration as your initial EC2, but with all your software already installed.
Conclusion
This post walked you through creating your personal cloud gaming stack. You are now all set to lean back and enjoy the benefits of per second billing while playing your favorite video games in the AWS cloud.
Visit the Amazon EC2 G4 instances service page to learn more about how AWS continues to push the boundaries of cost-effectiveness for graphic-intensive applications.
Forrester’s New Wave for Edge Development Platforms has just been announced. We’re thrilled that they have named Cloudflare a leader (you can download a complimentary copy of the report here).
Since the very beginning, Cloudflare has sought to help developers building on the web, and since the introduction of Workers in 2017, Cloudflare has enabled developers to deploy their applications to the edge itself.
According to the report by Forrester Vice President, Principal Analyst, Jeffrey Hammond, Cloudflare “offers strong compute, data services and web development capabilities. Alongside Workers, Workers KV adds edge data storage. Pages, Stream and Images provide higher level platform services for modern web workloads. Cloudflare has an intuitive developer experience, fast, global deployment of updated code, and minimal cold start times.”
Reimagining development for the modern web
Building on the web has come a long way. The idea that one might have to buy a physical machine in order to build a website seems incomprehensible now. The cloud has played a major role in making it easier for developers to get started. However, since the advent of the cloud, things have stalled — and innovation has become more incremental. That means that while developers don’t have to think about buying a server, they’re still tasked with thinking about where in the world it is, how to add concurrency to handle increasing traffic, and how to make them secure.
We wanted to abstract that all away. Our aim: to reimagine what things might look like if developers could truly just think about the application they wanted to build. Leaving the scaling, speed, and even compliance, to us.
Of course, reimagining things is always scary. There’s no guarantee that taking a new approach is going to work — it usually requires a leap of faith.
It’s been gratifying to see developers flock to our platform — and the applications they’ve been able to build, free of scalability and latency constraints, have been phenomenal.
It’s also gratifying to be named a Leader in Edge Development Platforms by Forrester — one of the preeminent analyst firms in the industry. We feel it really does provide industry recognition to the approach we bet on four years ago.
Cloudflare is the most differentiated among all the vendors evaluated
We received a differentiated rating in the following criteria:
Developer experience
Programming model
Platform execution model
“Day 2+” experience
Integrations
Roadmap
Vision
Market approach
While being able to build our platform atop Cloudflare’s network gave us an advantage in eliminating latency from the start, we knew that wasn’t enough to compel developers to think in a new way. Since the release of Workers, we have relentlessly focused on making the experience of building a new application as easy as possible at every step of the way: from onboarding, through day 2, and beyond.
This approach extends beyond tooling, and to how we think about additional services developers need in order to complete their applications. For example, in thinking about providing data solutions on the edge, we again wanted to make the distributed nature of the system just work, rather than making developers think about it, which is what led us to develop Durable Objects. With Durable Objects, Cloudflare can make intelligent decisions about where to store the data based on access patterns (or compliance — whichever is most important to the developer), rather than forcing the developer to think about regions.
As we expand our offering, it’s important to us that it continues to be intuitive and easy for developers to solve problems.
We’re just getting started
But, we’re not stopping here. As our cofounder Michelle likes to say, we’re just getting started. We recognize this is just the beginning of the journey to bring the full stack to the edge. We have some exciting announcements coming in the next couple of weeks — stay tuned!
As public cloud adoption continues to grow year after year, we see more and more enterprises realizing the strategic advantage the cloud can provide to help deliver new and innovative products quicker, roll out new features with ease, and reach new customers. But along with those advantages comes a new level of complexity and risk that organizations need to account for.
Rapid7’s recently released 2021 Cloud Misconfigurations Report revealed that there were 121 publicly reported data exposure events last year that were the result of cloud misconfigurations.
One critical part of preventing these misconfigurations is the strategic, gradual adoption of automated notification and remediation workflows.
The benefits of automation in cloud security
Automation in the cloud is the implementation of tools that take away the responsibility of security from the user and make it automated. These tools can catch and fix misconfigurations before you even realize they were ever there.
Some of the benefits these tools can bring include:
Data breach protection: Despite increased regulations, data breaches continue to grow. Most of these breaches happen when organizations make inadequate or inappropriate investments in cloud security. Now more than ever, companies are under increasing pressure to make appropriate investments to protect customer data as they scale and expand their cloud footprint.
Threat protection: When using cloud services, it’s common to be overwhelmed with the large volume of threat signals you receive from a wide variety of sources. Without being able to decipher the signals from noise, it’s difficult to identify true risk and act on it in a timely fashion.
To deliver threat protection, InsightCloudSec integrates with native cloud service providers’ security platforms (e.g., Amazon GuardDuty) and other partners (e.g., Tenable) for best-in-class, intelligent threat detection that continuously monitors for malicious activity and unauthorized behavior. These services use machine learning, anomaly detection, and integrated threat intelligence to identify and prioritize potential threats. You’ll be able to detect cryptocurrency mining, credential compromise behavior, communication with known command-and-control servers, and API calls from known malicious IP addresses.
While automating every workflow possible isn’t the answer, one thing is clear: Enterprise-scale cloud environments have outstripped the human capacity to manage them manually.
Not only is automation essential for bringing security — it’s a way to cut down the time it would take to fix resources, as compared to a manual approach. Automation greatly reduces the risk of human error in the cloud and allows workflows to include automated security across the board.
How InsightCloudSec provides it
InsightCloudSec comes with an automated program that we call our bots, which allow you to execute actions on resources based on your conditions. Your bot consists of three things: scope, filters, and actions. A single bot can be configured to apply a unified approach to remediation across all clouds, creating a consistent, scalable, and sustainable approach to cloud security.
Scope: The scope chosen by the user determines which resources and places the bot will evaluate. You choose the bounds that the bot is constricted to. An example of a scope would be all of your AWS, GCP, and Azure accounts, looking for the Storage Container resource (e.g., S3 bucket, Blob storage, and Google Cloud storage).
Filters: InsightCloudSec comes with over 800 filters you can choose from. These filters are the condition on which the bot will act. An example of a filter would be Storage Container Public Access, which will evaluate if any of the resources within your scope have public access due to their permission(s) and/or bucket policy.
Actions: Finally, this is what the bot actually does. InsightCloudSec ships with over 100 different actions that you can customize. For example, if you set up a bot could to identify storage containers that are public, the action would be the bot notifying the team and cleaning up the exposed permissions.
Bots offer a unified approach to remediation across all your cloud environments. With InsightCloudSec, you can customize them just how you want it based on the full context of a misconfiguration. Automation with InsightCloudSec is the key to achieving security at the speed of scale.
What common cloud security mistakes are organizations making?
Vice has a detailed article about how the FBI gets data from cell phone providers like AT&T, T-Mobile, and Verizon, based on a leaked (I think) 2019 139-page presentation.
The collective thoughts of the interwebz
Manage Consent
To provide the best experiences, we use technologies like cookies to store and/or access device information. Consenting to these technologies will allow us to process data such as browsing behavior or unique IDs on this site. Not consenting or withdrawing consent, may adversely affect certain features and functions.
Functional
Always active
The technical storage or access is strictly necessary for the legitimate purpose of enabling the use of a specific service explicitly requested by the subscriber or user, or for the sole purpose of carrying out the transmission of a communication over an electronic communications network.
Preferences
The technical storage or access is necessary for the legitimate purpose of storing preferences that are not requested by the subscriber or user.
Statistics
The technical storage or access that is used exclusively for statistical purposes.The technical storage or access that is used exclusively for anonymous statistical purposes. Without a subpoena, voluntary compliance on the part of your Internet Service Provider, or additional records from a third party, information stored or retrieved for this purpose alone cannot usually be used to identify you.
Marketing
The technical storage or access is required to create user profiles to send advertising, or to track the user on a website or across several websites for similar marketing purposes.
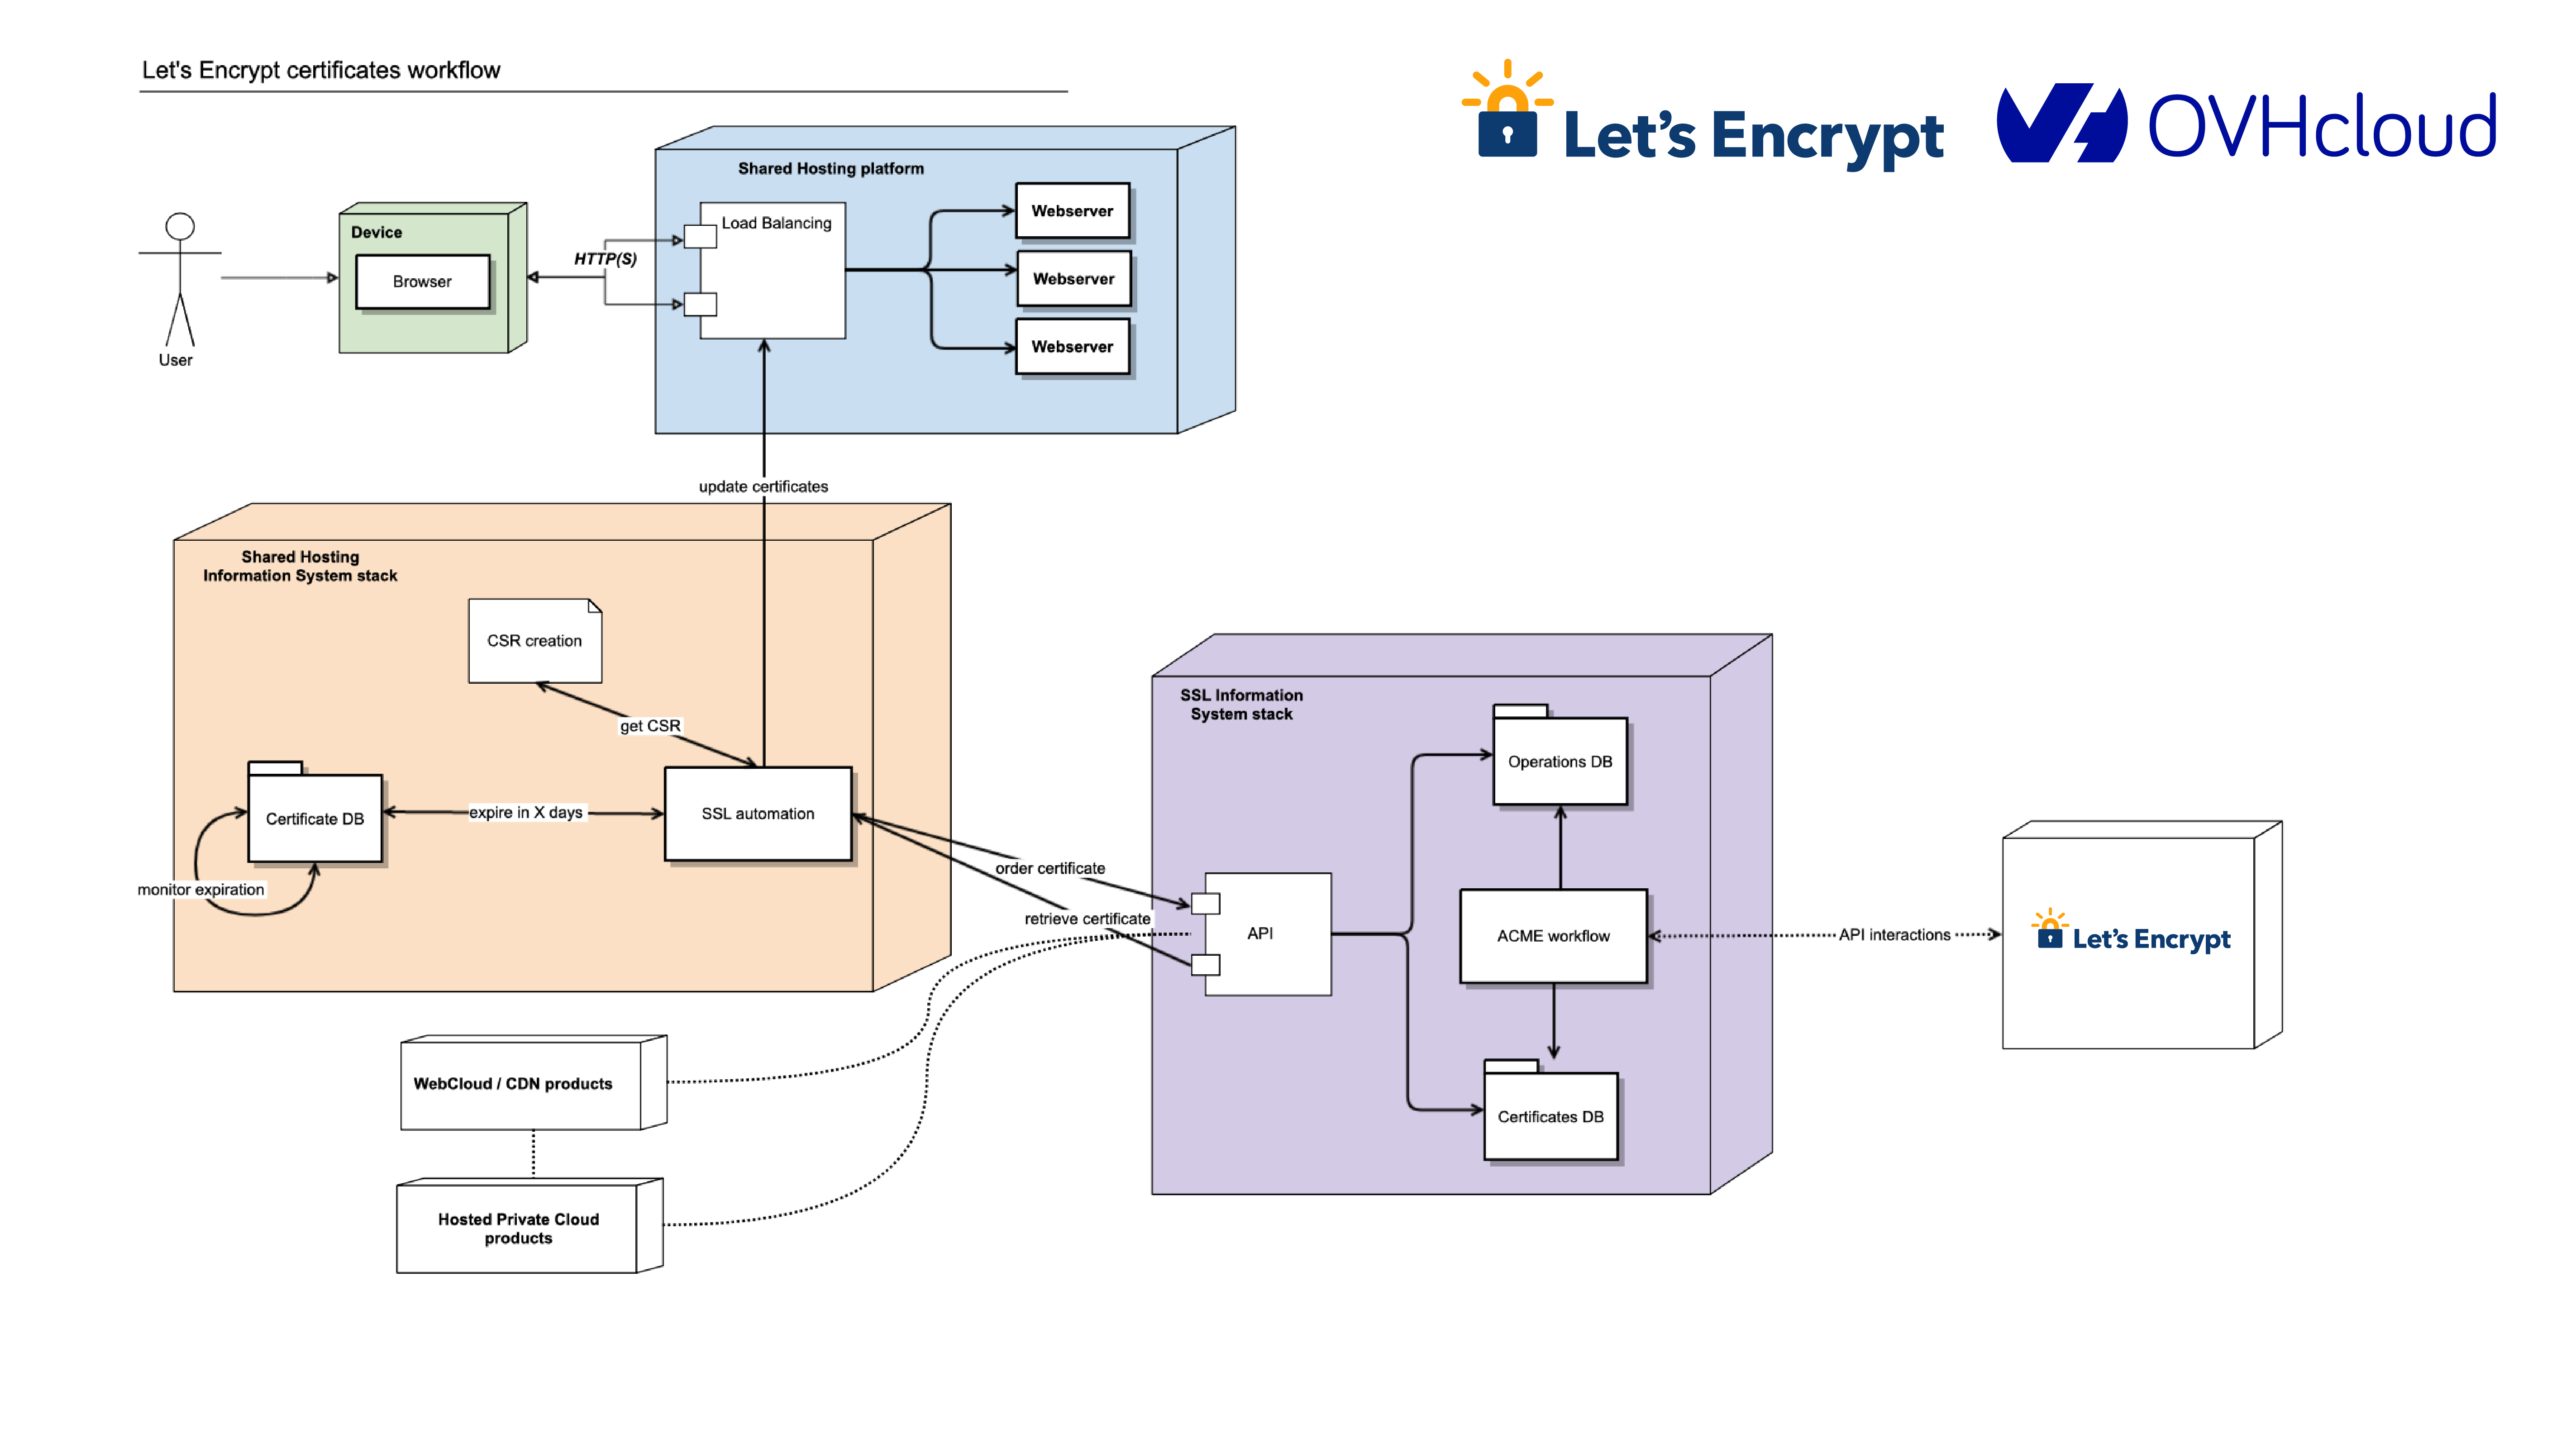
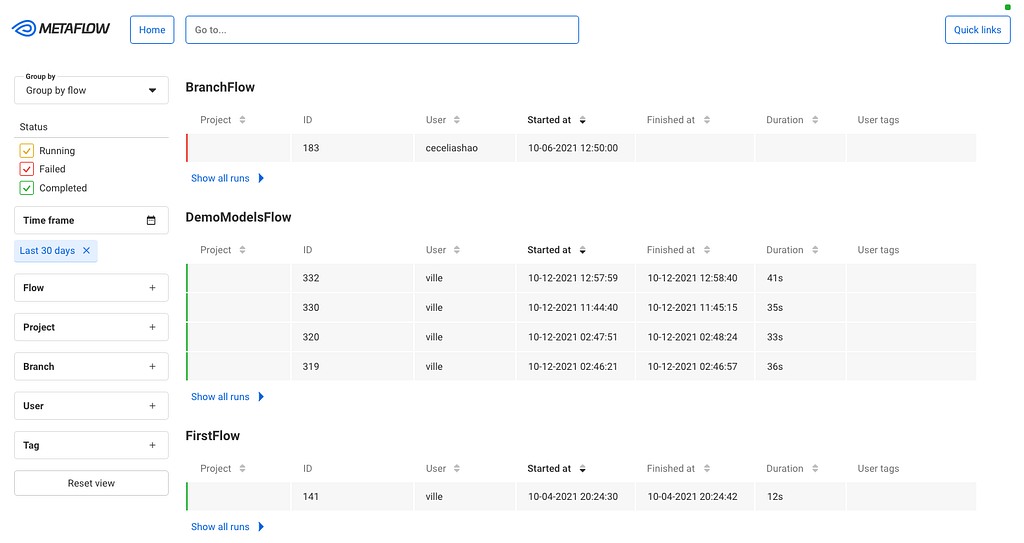
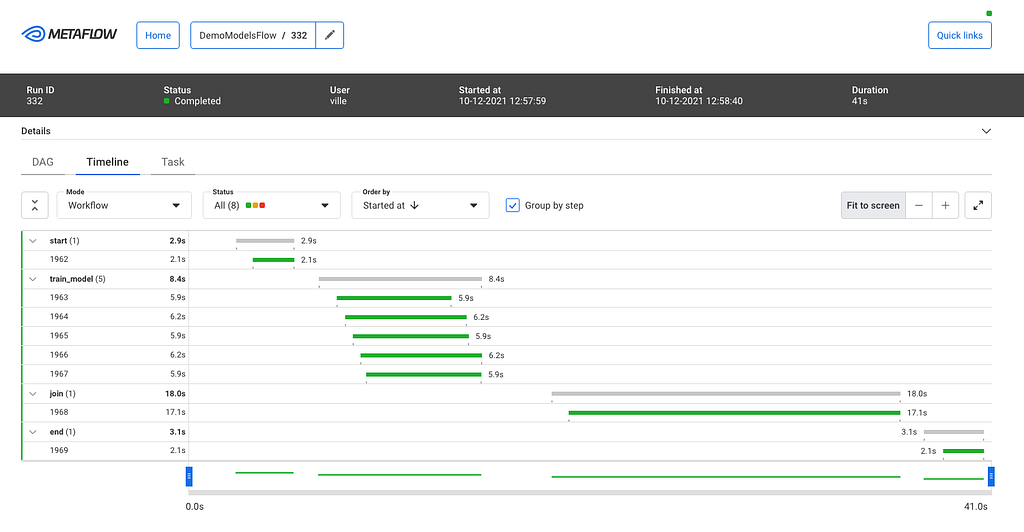
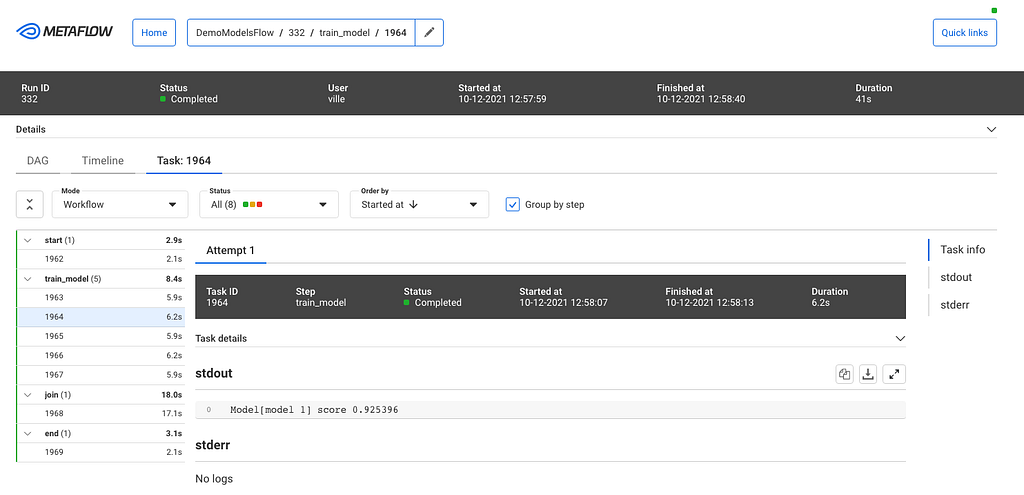
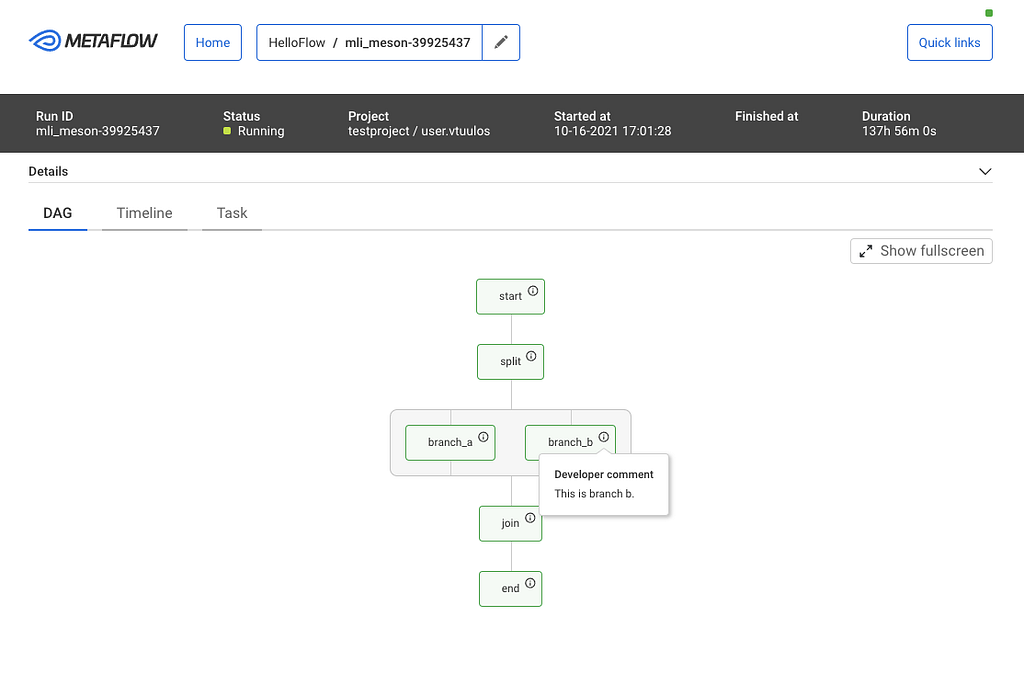
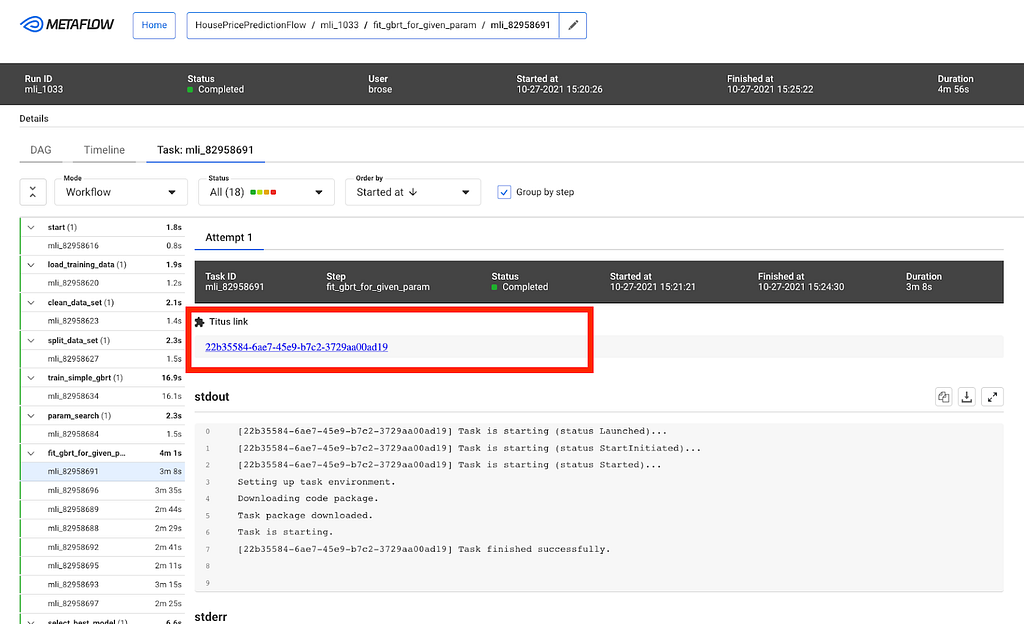


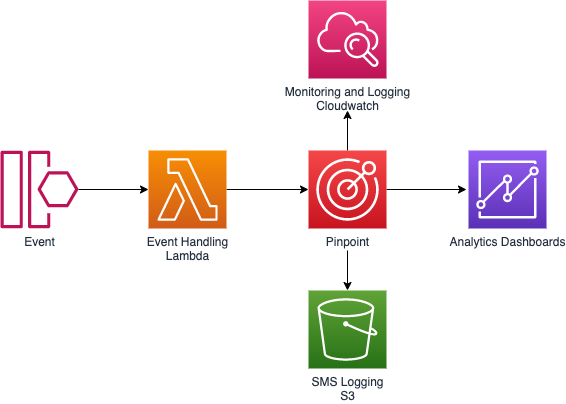
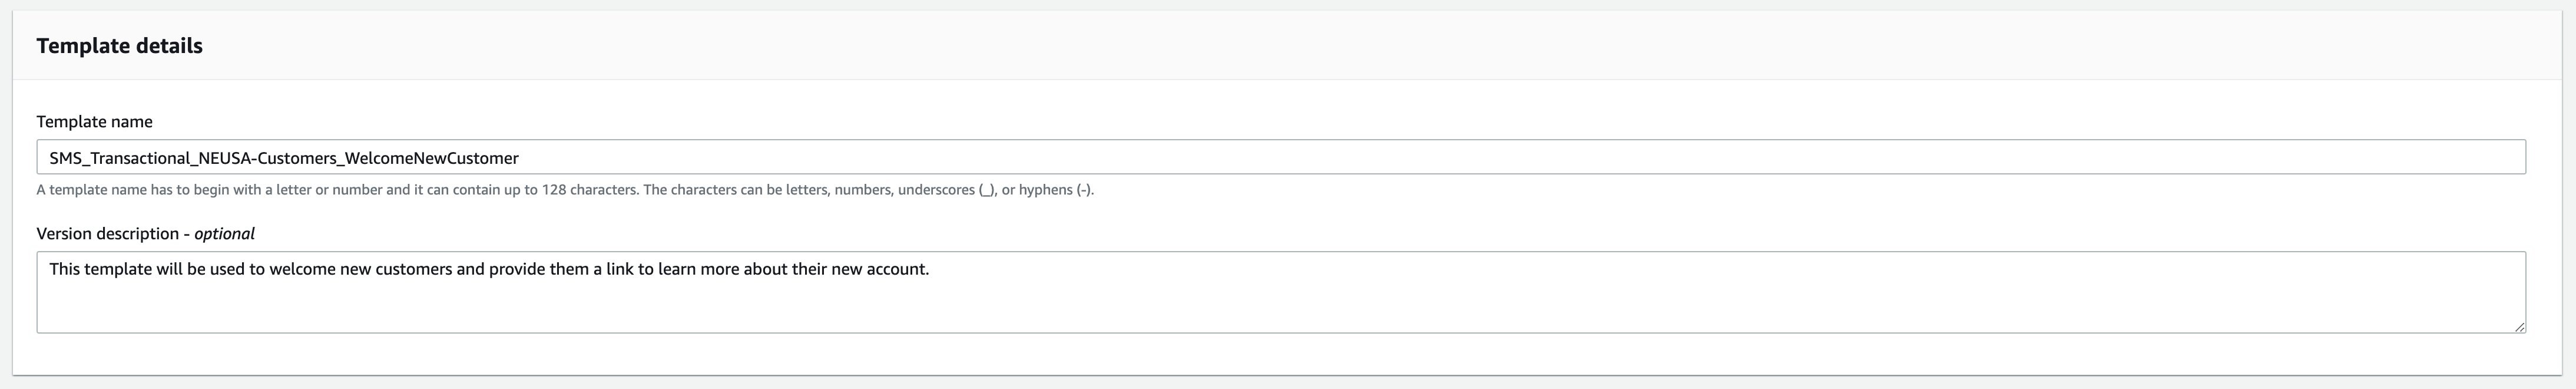

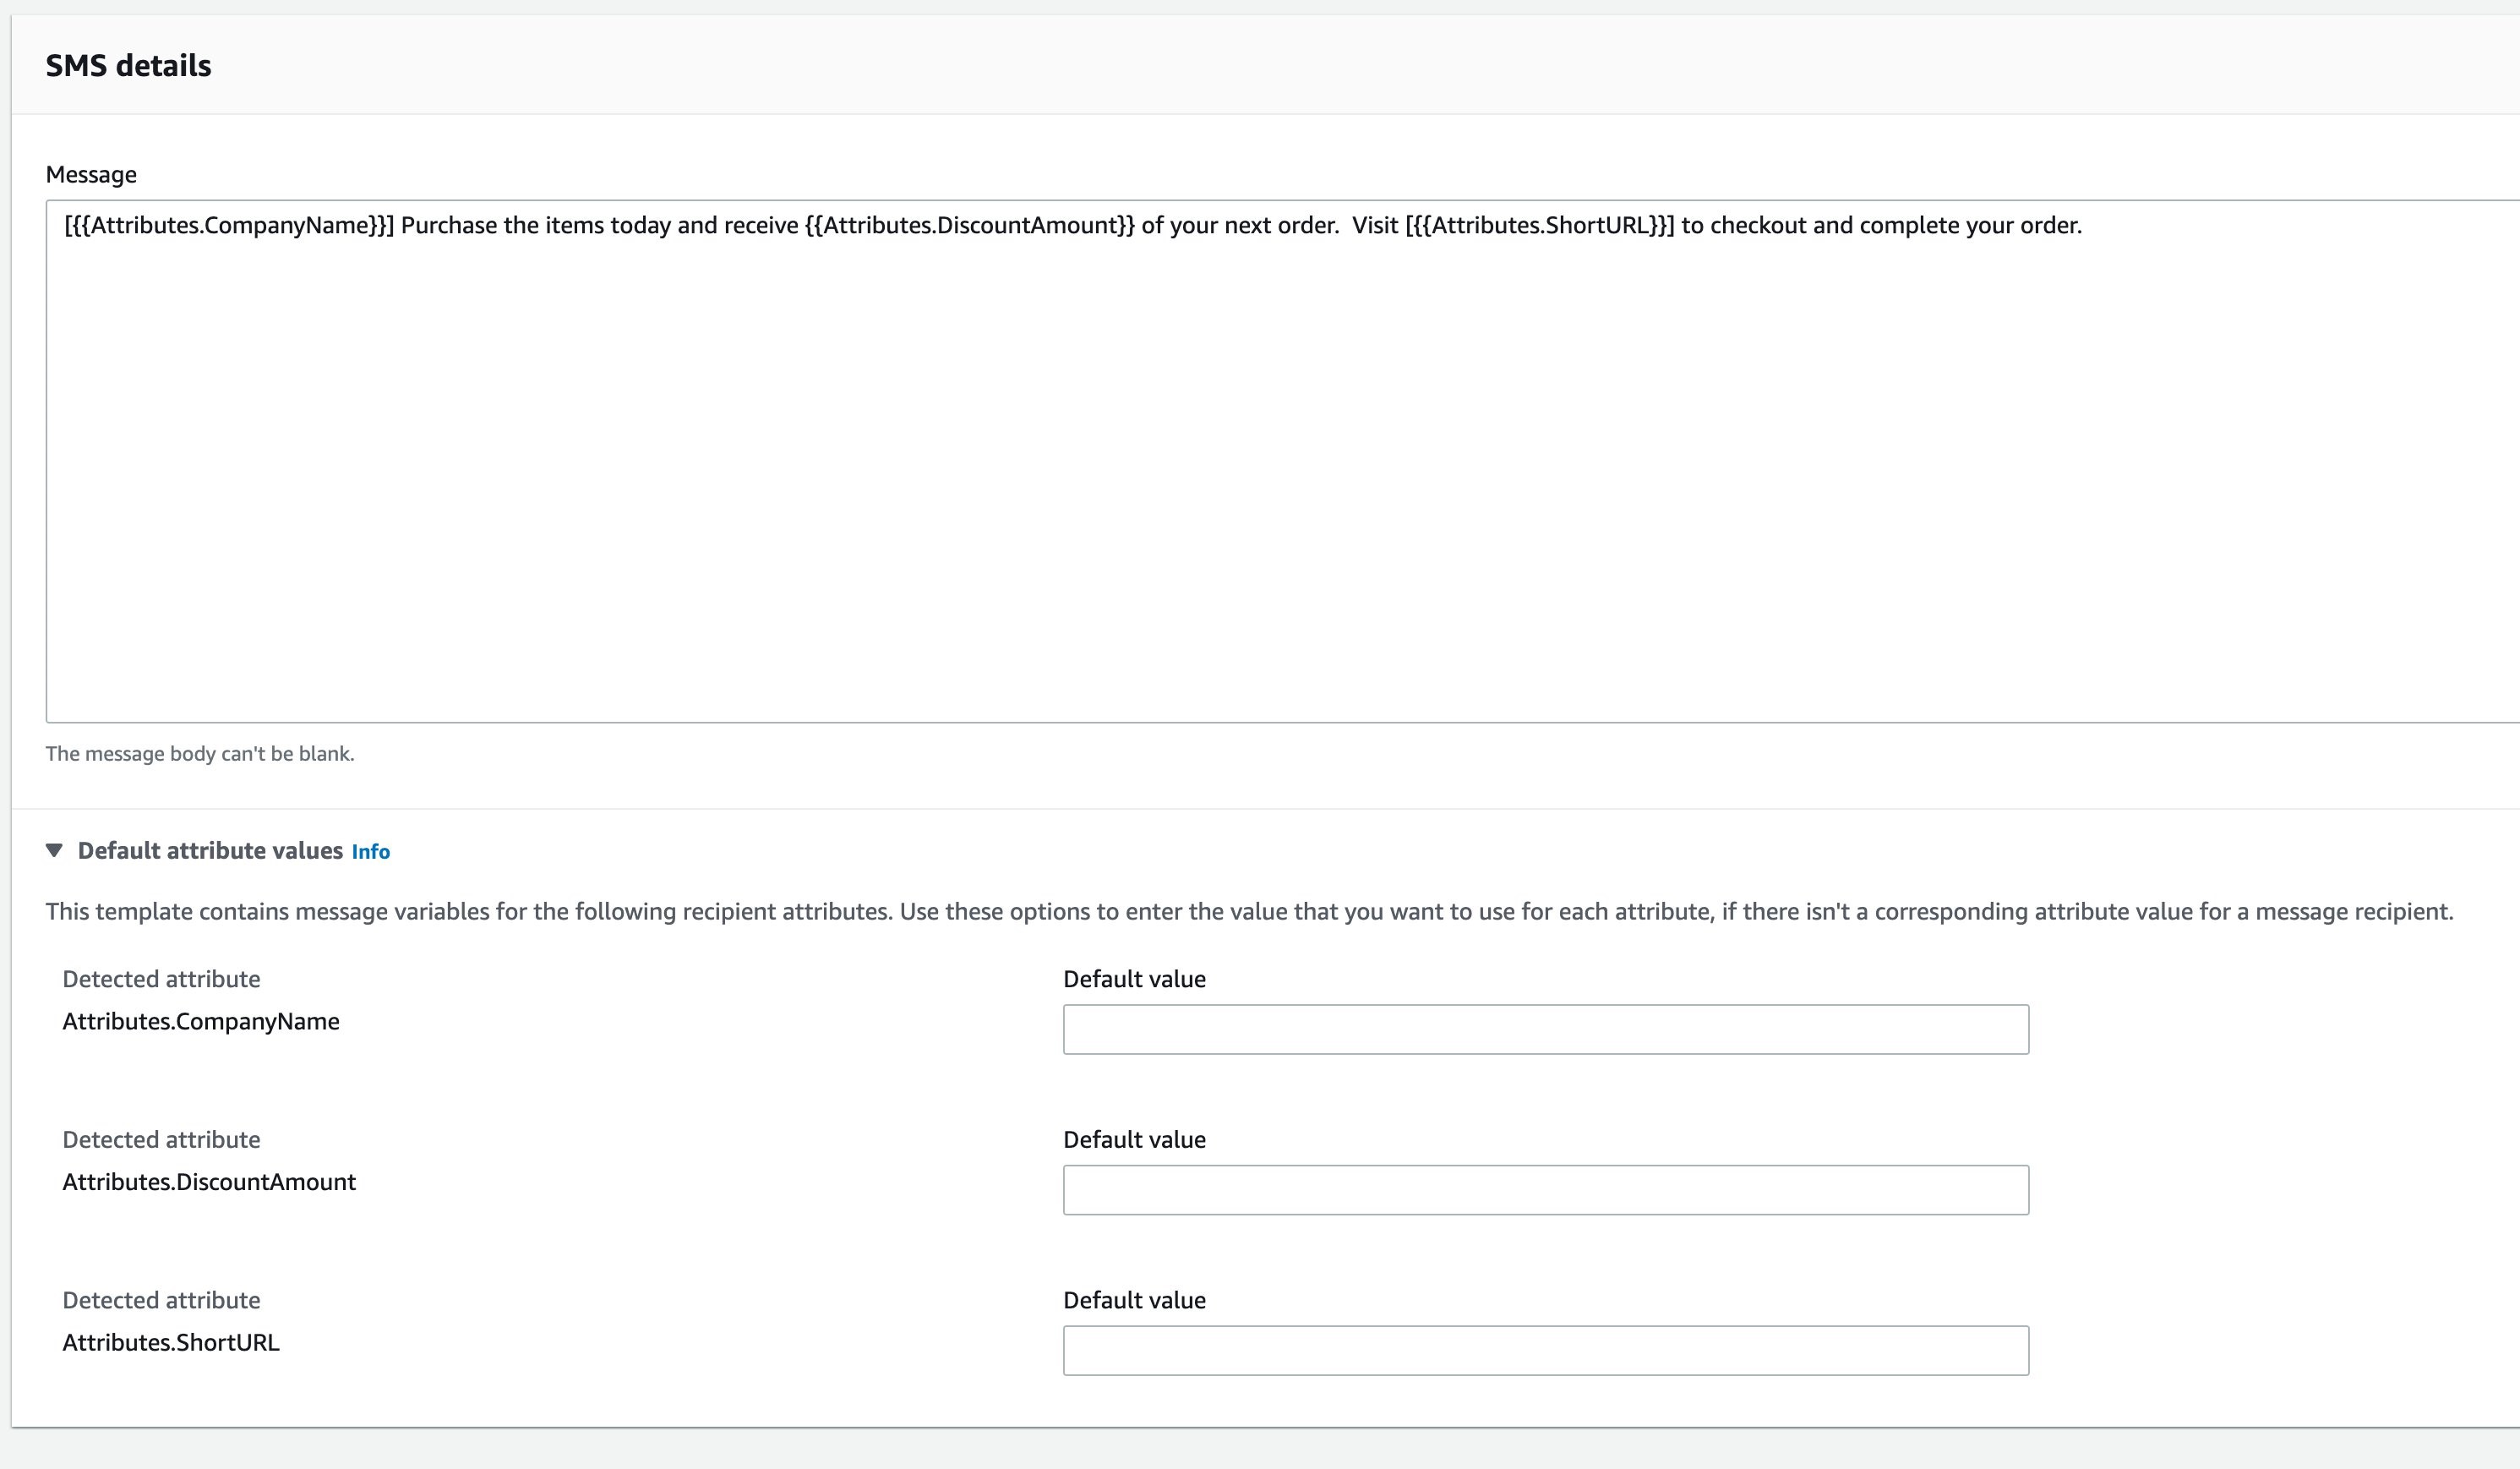

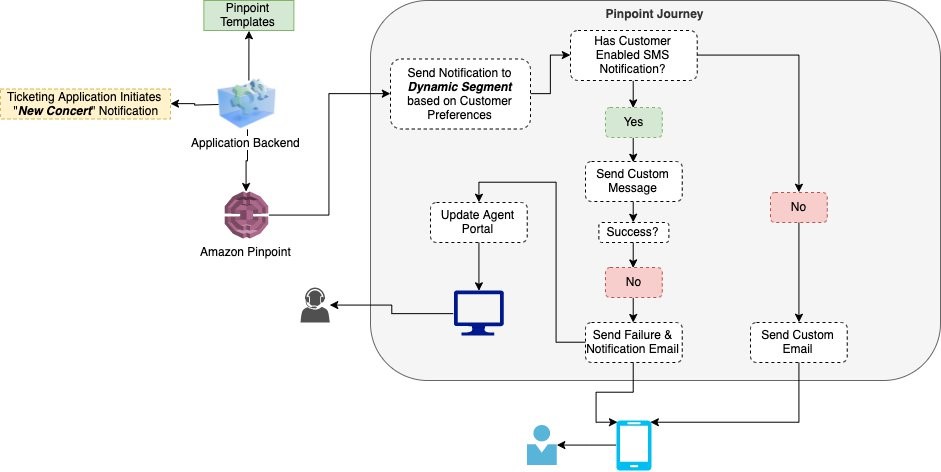
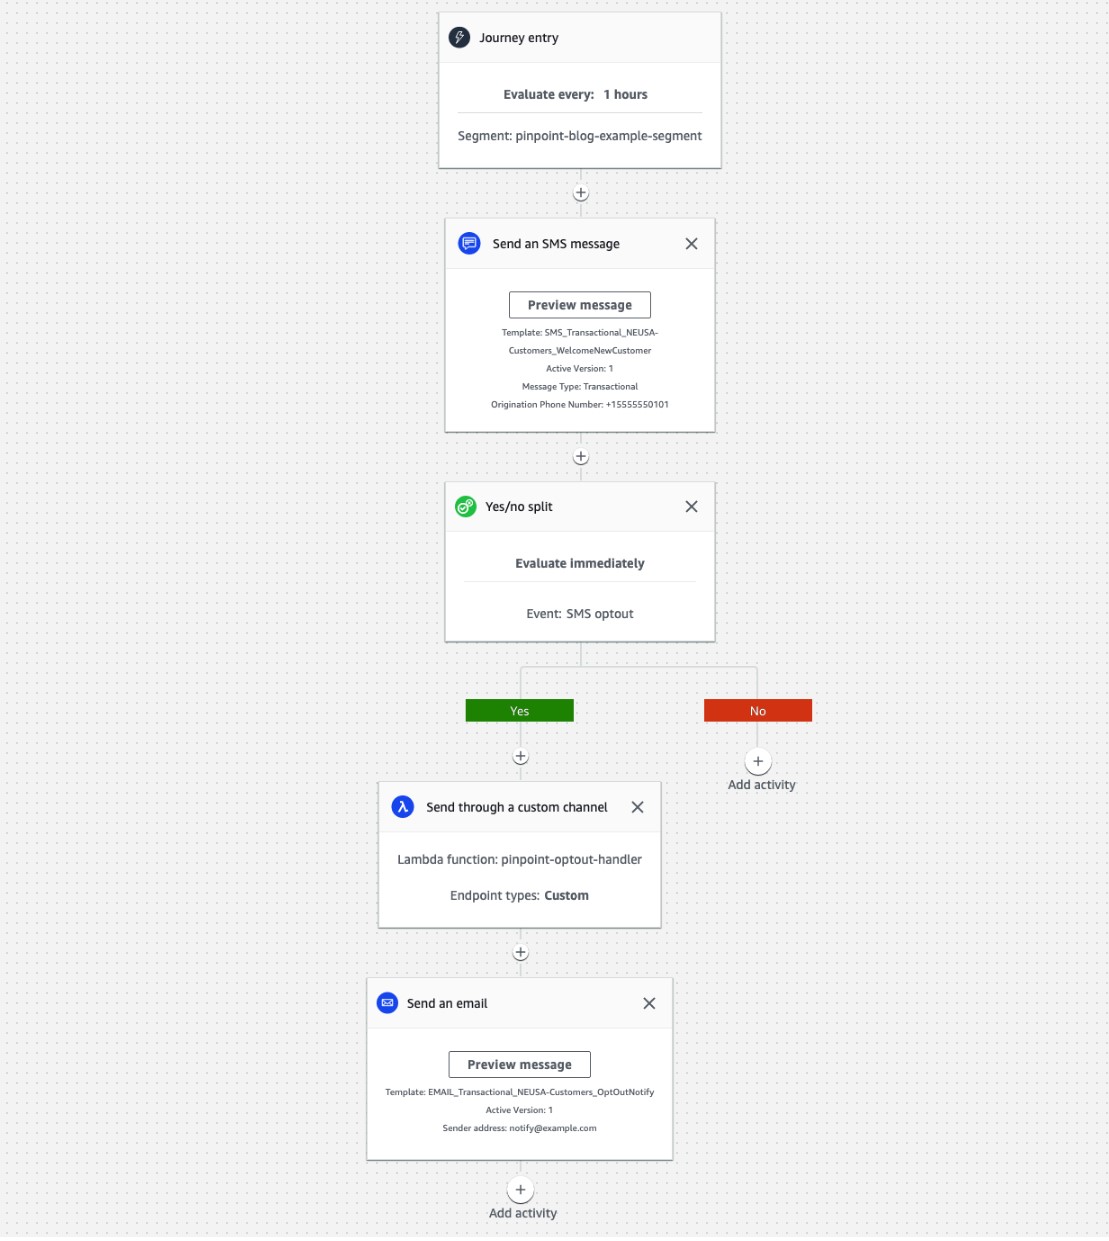


![[Security Nation] Jack Cable on Ransomwhere](https://blog.rapid7.com/content/images/2021/10/headhsot.jpeg)