Creating AWS Serverless batch processing architectures

Post Syndicated from James Beswick original https://aws.amazon.com/blogs/compute/creating-aws-serverless-batch-processing-architectures/

This post is written by Reagan Rosario, AWS Solutions Architect and Mark Curtis, Solutions Architect, WWPS.

Batch processes are foundational to many organizations and can help process large amounts of information in an efficient and automated way. Use cases include file intake processes, queue-based processing, and transactional jobs, in addition to heavy data processing jobs.

This post explains a serverless solution for batch processing to implement a file intake process. This example uses AWS Step Functions for orchestration, AWS Lambda functions for on-demand instance compute, Amazon S3 for storing the data, and Amazon SES for sending emails.

Overview

This post’s example takes a common use-case of a business’s need to process data uploaded as a file. The test file has various data fields such as item ID, order date, order location. The data must be validated, processed, and enriched with related information such as unit price. Lastly, this enriched data may need to be sent to a third-party system.

Step Functions allows you to coordinate multiple AWS services in fully managed workflows to build and update applications quickly. You can also create larger workflows out of smaller workflows by using nesting. This post’s architecture creates a smaller and modular Chunk processor workflow, which is better for processing smaller files.

As the file size increases, the size of the payload passed between states increases. Executions that pass large payloads of data between states can be stopped if they exceed the maximum payload size of 262,144 bytes.

To process large files and to make the workflow modular, I split the processing between two workflows. One workflow is responsible for splitting up a larger file into chunks. A second nested workflow is responsible for processing records in individual chunk files. This separation of high-level workflow steps from low-level workflow steps also allows for easier monitoring and debugging.

Splitting the files in multiple chunks can also improve performance by processing each chunk in parallel. You can further improve the performance by using dynamic parallelism via the map state for each chunk.

Solution architecture

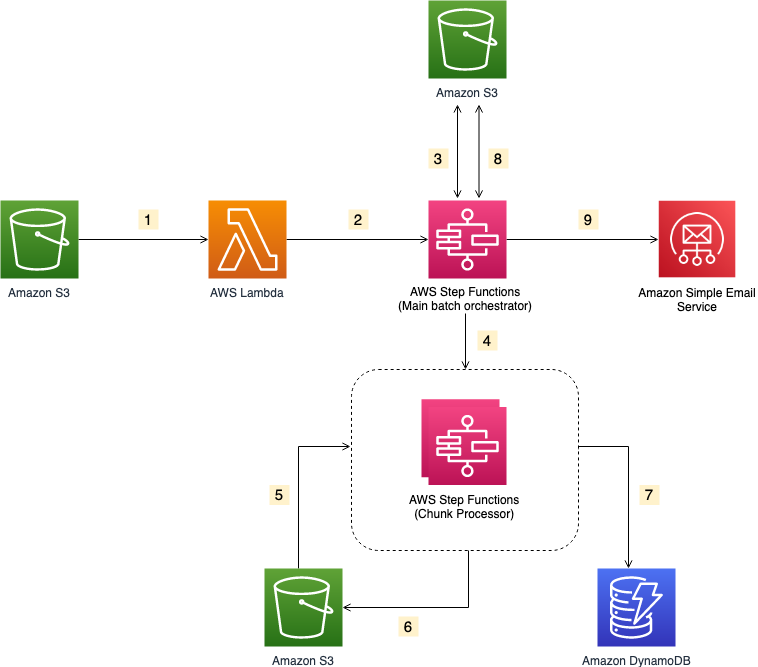
  1. The file upload to an S3 bucket triggers the S3 event notification. It invokes the Lambda function asynchronously with an event that contains details about the object.
  2. Lambda function calls the Main batch orchestrator workflow to start the processing of the file.
  3. Main batch orchestrator workflow reads the input file and splits it into multiple chunks and stores them in an S3 bucket.
  4. Main batch orchestrator then invokes the Chunk Processor workflow for each split file chunk.
  5. Each Chunk processor workflow execution reads and processes a single split chunk file.
  6. Chunk processor workflow writes the processed chunk file back to the S3 bucket.
  7. Chunk processor workflow writes the details about any validation errors in an Amazon DynamoDB table.
  8. Main batch orchestrator workflow then merges all the processed chunk files and saves it to an S3 bucket.
  9. Main batch orchestrator workflow then emails the consolidated files to the intended recipients using Amazon Simple Email Service.

Step Functions workflow

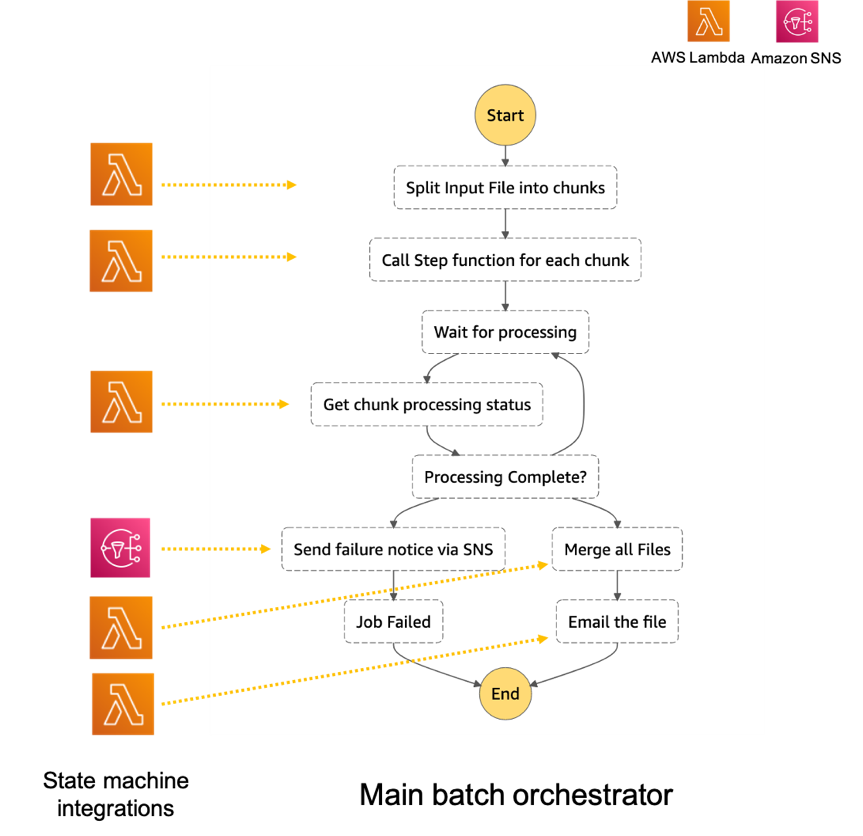
  1. The Main batch orchestrator workflow orchestrates the processing of the file.
    1. The first task state Split Input File into chunks calls a Lambda function. It splits the main file into multiple chunks based on the number of records and stores each chunk into an S3 bucket.
    2. The next task state Call Step Functions for each chunk invokes a Lambda function. It triggers a workflow for each chunk of the file. It passes information such as the name of bucket and the key where the chunk file to be processed is present.
    3. Then we wait for all the child workflow executions to complete.
    4. Once all the child workflows are processed successfully, the next task state is Merge all Files. This combines all the processed chunks into a single file and then stores the file back to the S3 bucket.
    5. The next task state Email the file takes the output file. It generates an S3 presigned URL for the file and sends an email with the S3 presigned URL.Chunk processor workflow
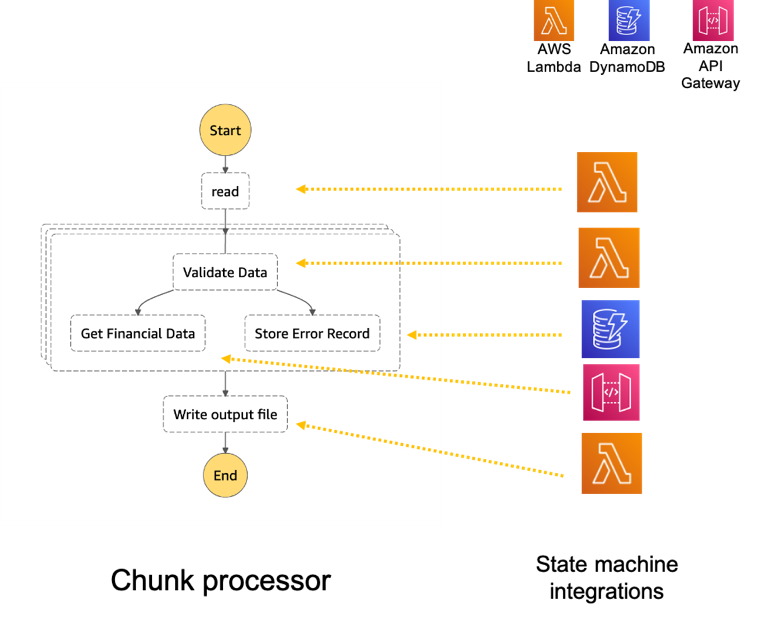
  2. The Chunk processor workflow is responsible for processing each row from the chunk file that was passed.
    1. The first task state Read reads the chunked file from S3 and converts it to an array of JSON objects. Each JSON object represents a row in the chunk file.
    2. The next state is a map state called Process messages (not shown in the preceding visual workflow). It runs a set of steps for each element of an input array. The input to the map state is an array of JSON objects passed by the previous task.
    3. Within the map state, Validate Data is the first state. It invokes a Lambda function that validates each JSON object using the rules that you have created. Records that fail validation are stored in an Amazon DynamoDB table.
    4. The next state Get Financial Data invokes Amazon API Gateway endpoints to enrich the data in the file with data from a DynamoDB table.
    5. When the map state iterations are complete, the Write output file state triggers a task. It calls a Lambda function, which converts the JSON data back to CSV and writes the output object to S3.

Prerequisites

Deploying the application

  1. Clone the repository.
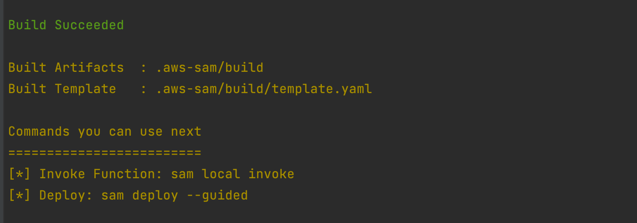
  2. Change to the directory and build the application source:
    sam build
    sam build
  3. Package and deploy the application to AWS. When prompted, input the corresponding parameters as shown below:
    sam deploy –guided
    sam deploy
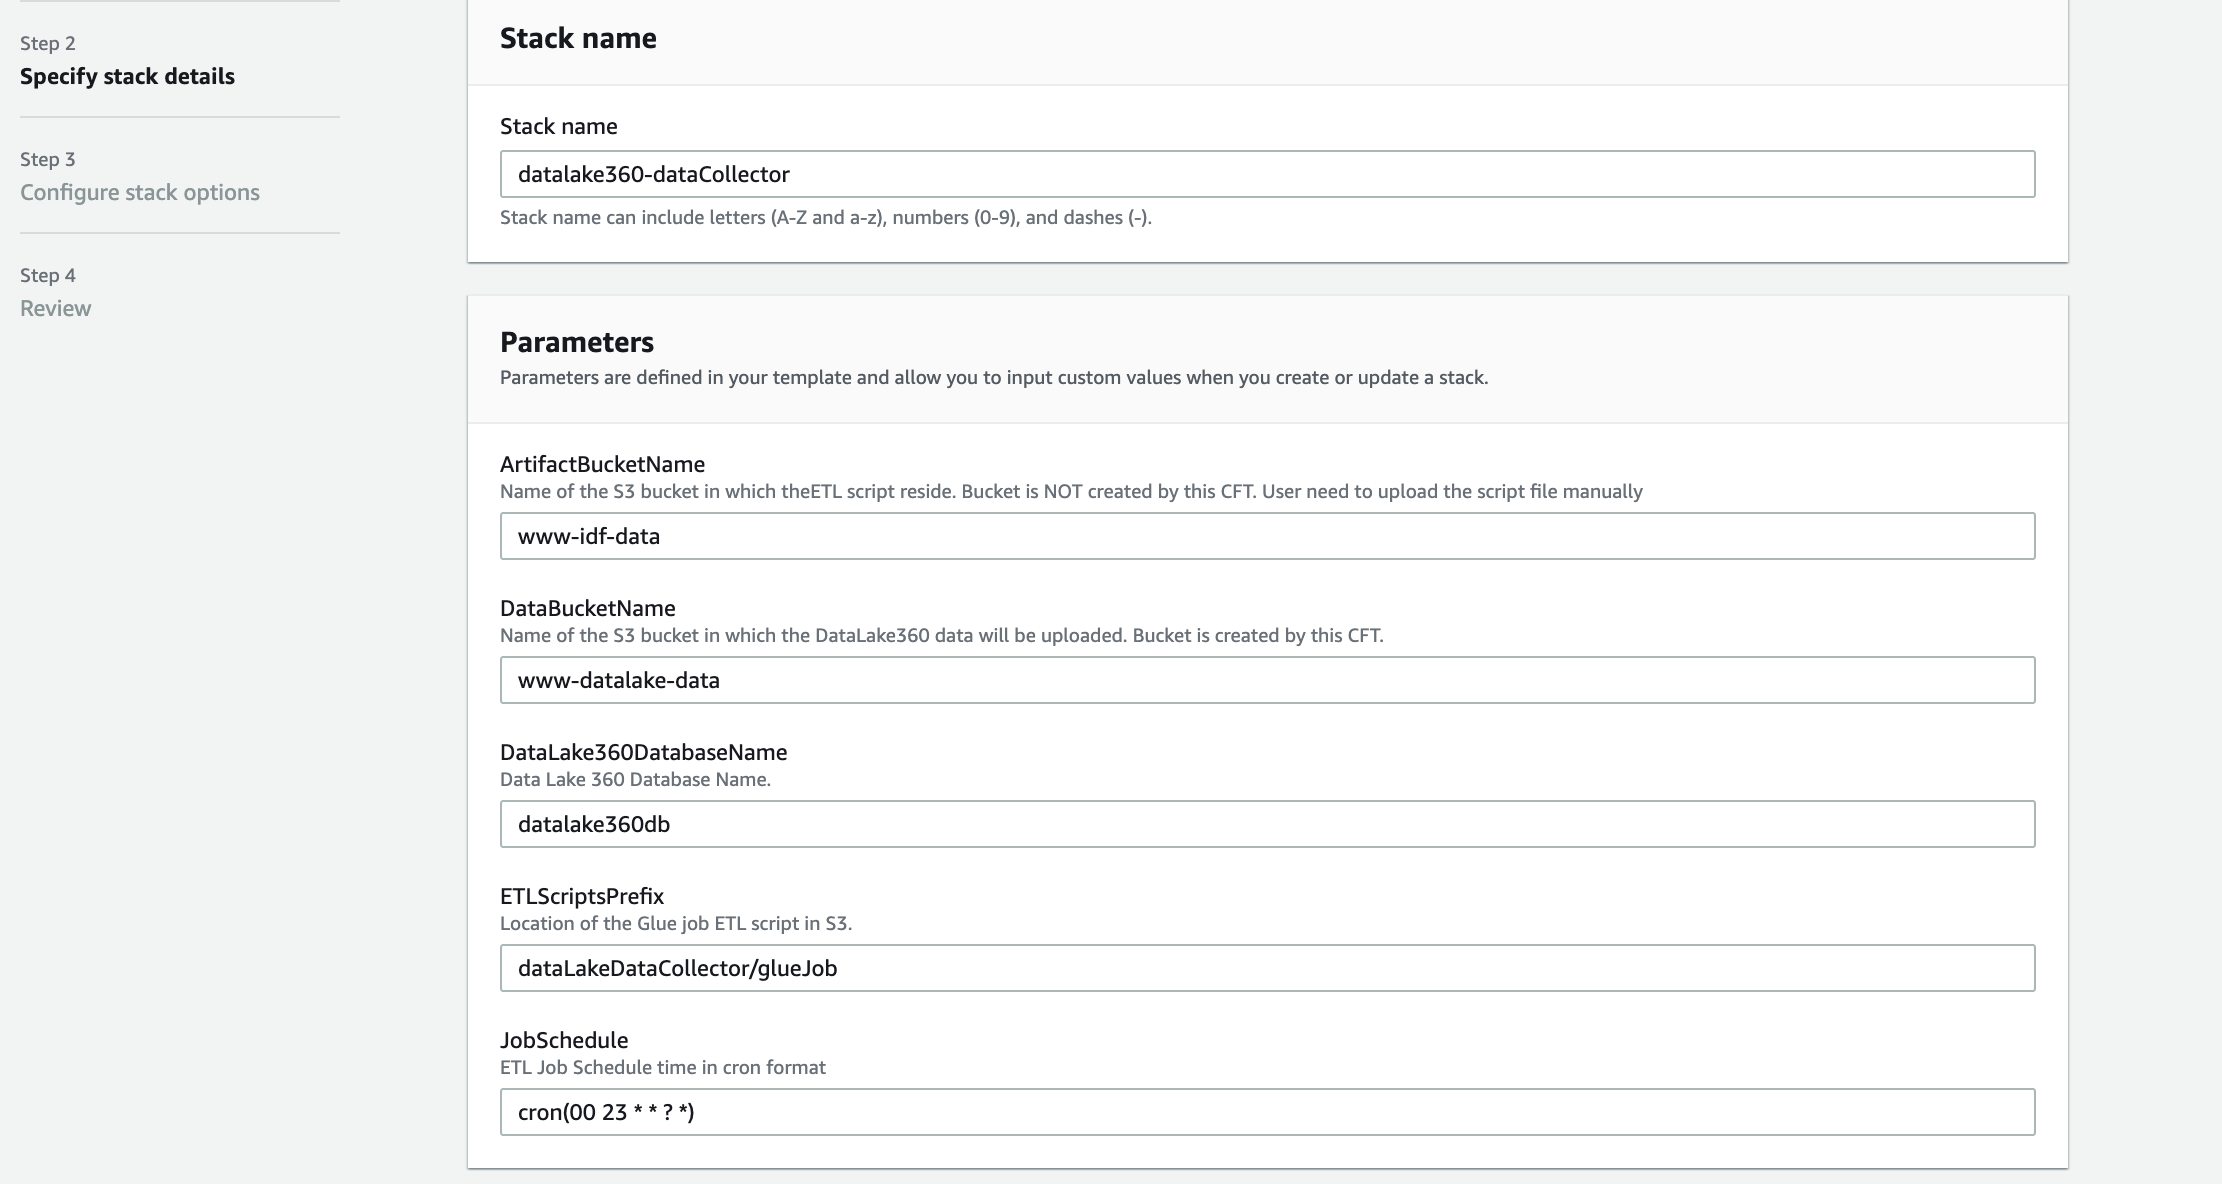
Note the template parameters:
    • SESSender: The sender email address for the output file email.
    • SESRecipient: The recipient email address for the output file email.
    • SESIdentityName: An email address or domain that Amazon SES users use to send email.
    • InputArchiveFolder: Amazon S3 folder where the input file will be archived after processing.
    • FileChunkSize: Size of each of the chunks, which is split from the input file.
    • FileDelimiter: Delimiter of the CSV file (for example, a comma).
  4. After the stack creation is complete, you see the source bucket created in Outputs.
    Outputs
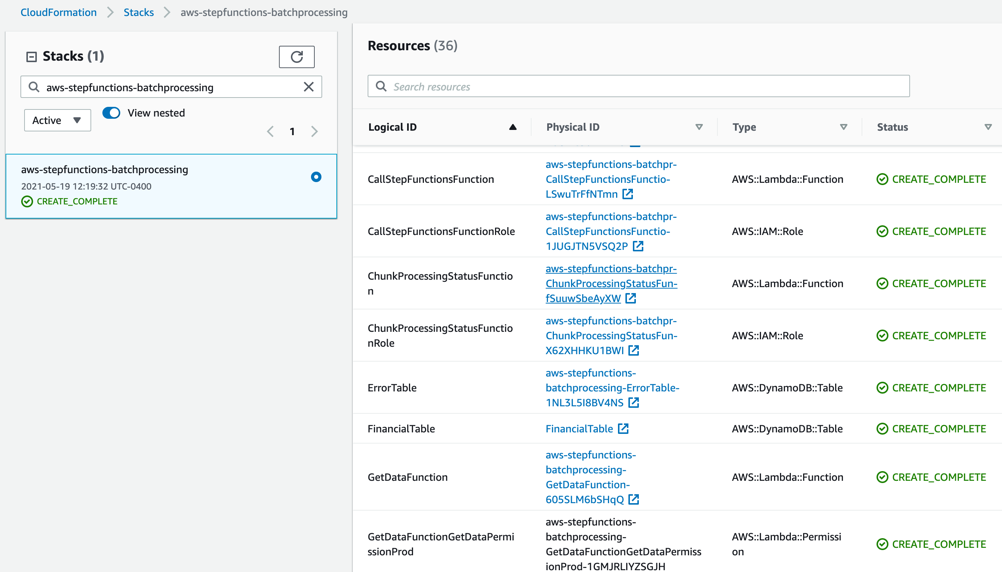
  5. Review the deployed components in the AWS CloudFormation Console.
    CloudFormation console

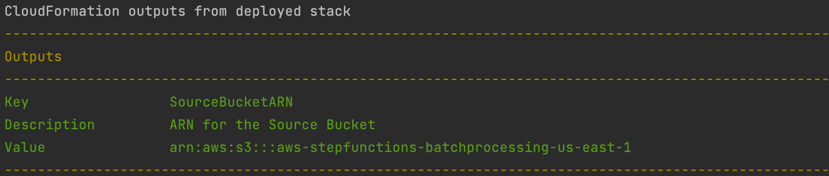
Testing the solution

  1. Before you can send an email using Amazon SES, you must verify each identity that you’re going to use as a “From”, “Source”, “Sender”, or “Return-Path” address to prove that you own it. Refer Verifying identities in Amazon SES for more information.
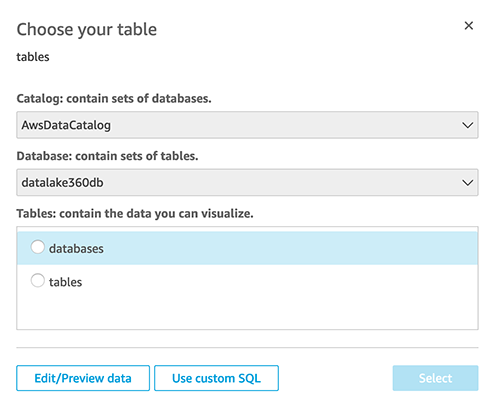
  2. Locate the S3 bucket (SourceBucket) in the Resources section of the CloudFormation stack. Choose the physical ID.
    s3 bucket ID
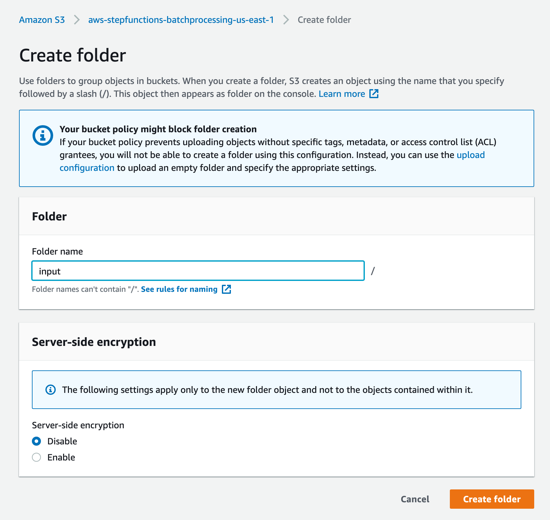
  3. In the S3 console for the SourceBucket, choose Create folder. Name the folder input and choose Create folder.
    Create folder
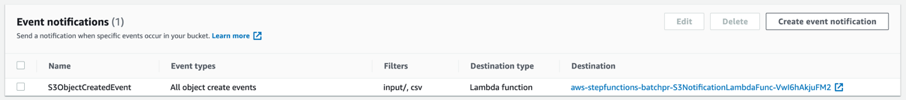
  4. The S3 event notification on the SourceBucket uses “input” as the prefix and “csv” as the suffix. This triggers the notification Lambda function. This is created as a part of the custom resource in the AWS SAM template.
    Event notification
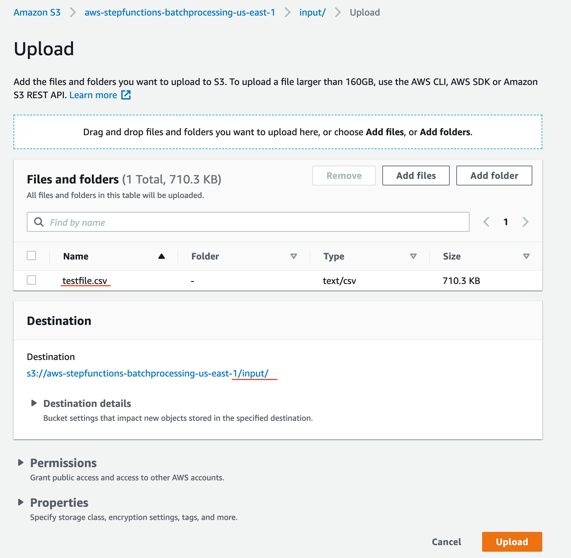
  5. In the S3 console for the SourceBucket, choose the Upload button. Choose Add files and browse to the input file (testfile.csv). Choose Upload.
    Upload dialog
  6. Review the data in the input file testfile.csv.
    Testfile.csv
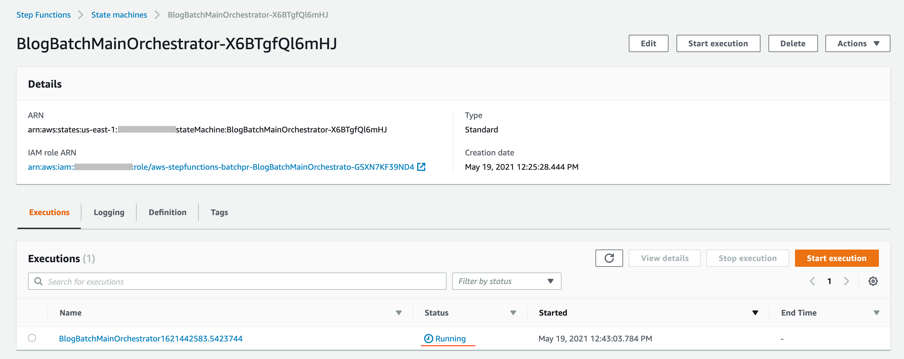
  7. After the object is uploaded, the event notification triggers the Lambda Function. This starts the main orchestrator workflow. In the Step Functions console, you see the workflow is in a running state.
    Step Functions console
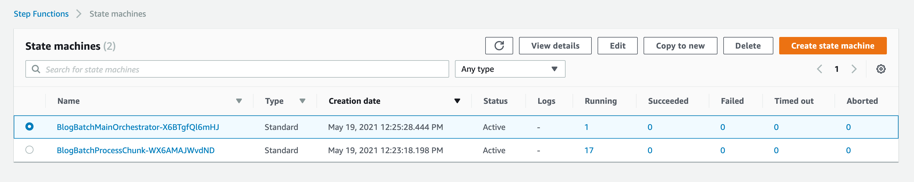
  8. Choose an individual state machine to see additional information.
    State machine
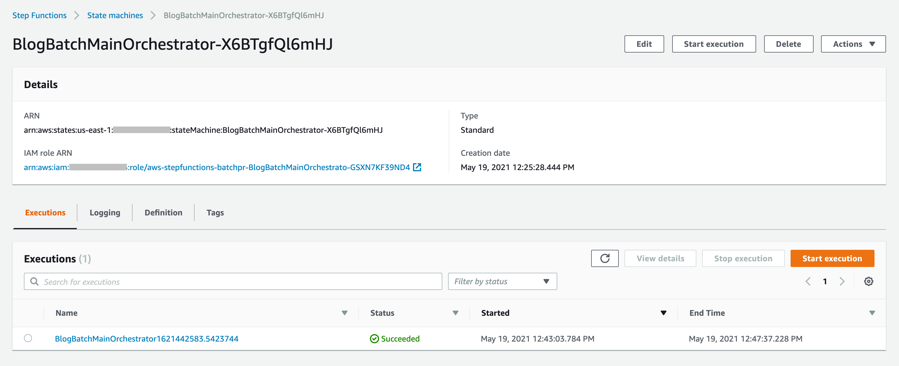
  9. After a few minutes, both BlogBatchMainOrchestrator and BlogBatchProcessChunk workflows have completed all executions. There is one execution for the BlogBatchMainOrchestrator workflow and multiple invocations of the BlogBatchProcessChunk workflow. This is because the BlogBatchMainOrchestrator invokes the BlogBatchProcessChunk for each of the chunked files.
    Workflow #1Workflow #2

Checking the output

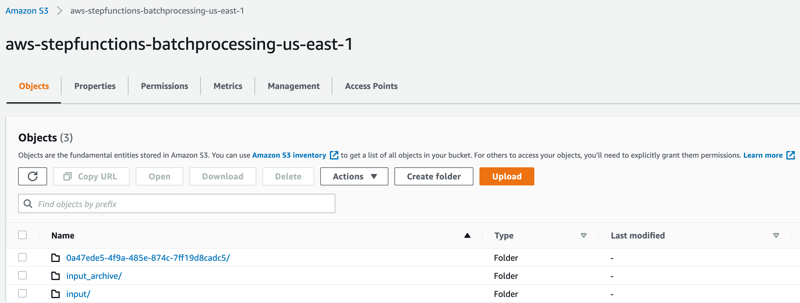
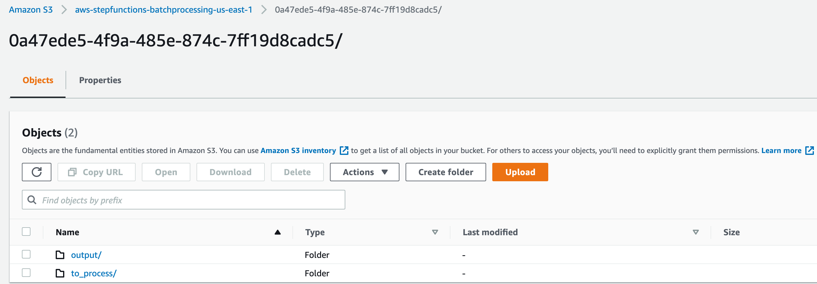
  1. Open the S3 console and verify the folders created after the process has completed.
    S3 folders
    The following subfolders are created after the processing is complete:
    input_archive – Folder for archival of the input object.
    0a47ede5-4f9a-485e-874c-7ff19d8cadc5 – Subfolder with a unique UUID in the name. This is created for storing the objects generated during batch execution.
  2. Select the folder 0a47ede5-4f9a-485e-874c-7ff19d8cadc5.
    Folder contents
    output – This folder contains the completed output objects, some housekeeping files, and processed chunk objects.
    Output folderto_process – This folder contains all the split objects from the original input file.
    to_process folder
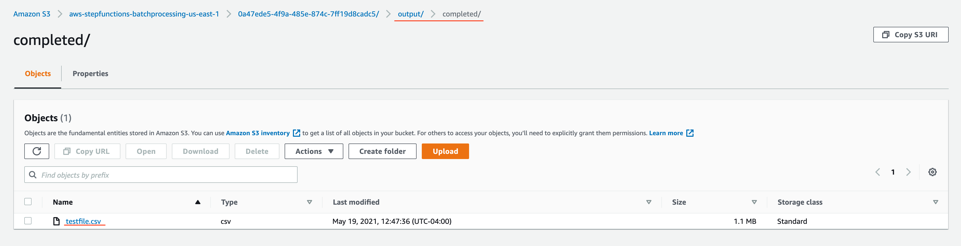
  3. Open the processed object from the output/completed folder.
    Processed object
    Inspect the output object testfile.csv. It is enriched with additional data (columns I through N) from the DynamoDB table fetched through an API call.Output testfile.csv

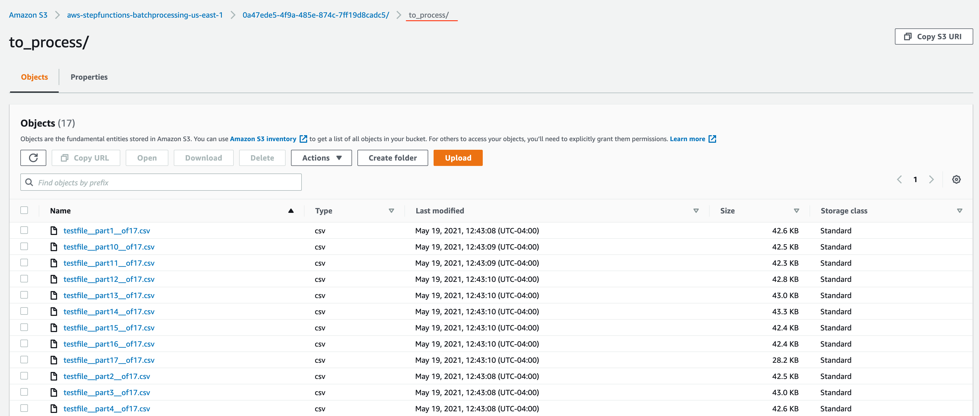
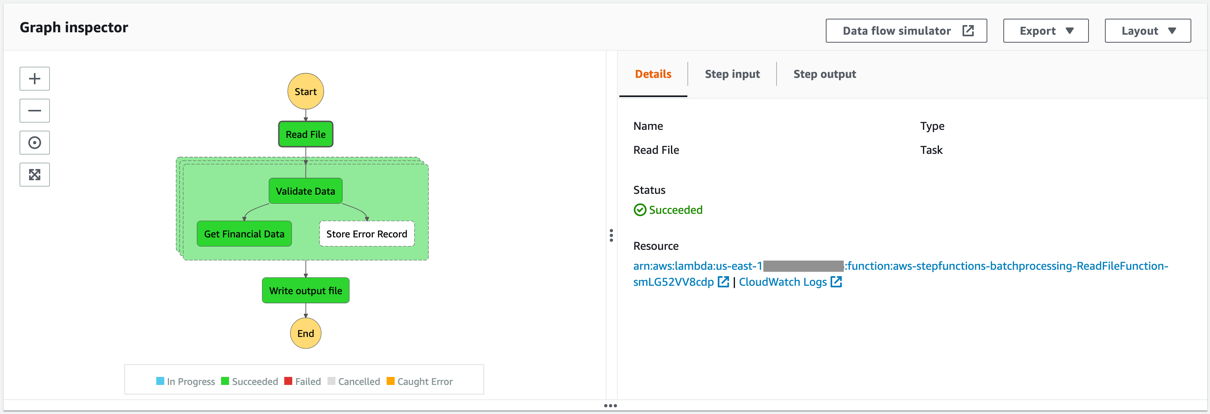
Viewing a completed workflow

Open the Step Functions console and browse to the BlogBatchMainOrchestrator and BlogBatchProcessChunk state machines. Choose one of the executions of each to locate the Graph Inspector. This shows the execution results for each state.

BlogBatchMainOrchestrator:

BlogBatchMainOrchestrator

BlogBatchProcessChunk:

BlogBatchProcessChunk

Batch performance

For this use case, this is the time taken for the batch to complete, based on the number of input records:

No. of records Time for batch completion
10 k 5 minutes
100 k 7 minutes

The performance of the batch depends on other factors such as the Lambda memory settings and data in the file. Read more about Profiling functions with AWS Lambda Power Tuning.

Conclusion

This blog post shows how to use Step Functions’ features and integrations to orchestrate a batch processing solution. You use two Steps Functions workflows to implement batch processing, with one workflow splitting the original file and a second workflow processing each chunk file.

The overall performance of our batch processing application is improved by splitting the input file into multiple chunks. Each chunk is processed by a separate state machine. Map states further improve the performance and efficiency of workflows by processing individual rows in parallel.

Download the code from this repository to start building a serverless batch processing system.

Additional Resources:

For more serverless learning resources, visit Serverless Land.

Без държава за бъдеще и капачките са бъдеще

Post Syndicated from original https://bivol.bg/%D0%B1%D0%B5%D0%B7-%D0%B4%D1%8A%D1%80%D0%B6%D0%B0%D0%B2%D0%B0-%D0%B7%D0%B0-%D0%B1%D1%8A%D0%B4%D0%B5%D1%89%D0%B5-%D0%B8-%D0%BA%D0%B0%D0%BF%D0%B0%D1%87%D0%BA%D0%B8%D1%82%D0%B5-%D1%81%D0%B0-%D0%B1%D1%8A.html

четвъртък 21 октомври 2021


Сега, на пръв поглед нещата са кристално ясни. Всички знаем, че българското здравеопазване е бездънна каца, в която се набутват едни милиарди, а те изчезват яко дим, без какъвто и…

Problems with Multifactor Authentication

Post Syndicated from Bruce Schneier original https://www.schneier.com/blog/archives/2021/10/problems-with-multifactor-authentication.html

Roger Grimes on why multifactor authentication isn’t a panacea:

The first time I heard of this issue was from a Midwest CEO. His organization had been hit by ransomware to the tune of $10M. Operationally, they were still recovering nearly a year later. And, embarrassingly, it was his most trusted VP who let the attackers in. It turns out that the VP had approved over 10 different push-based messages for logins that he was not involved in. When the VP was asked why he approved logins for logins he was not actually doing, his response was, “They (IT) told me that I needed to click on Approve when the message appeared!”

And there you have it in a nutshell. The VP did not understand the importance (“the WHY”) of why it was so important to ONLY approve logins that they were participating in. Perhaps they were told this. But there is a good chance that IT, when implementinthe new push-based MFA, instructed them as to what they needed to do to successfully log in, but failed to mention what they needed to do when they were not logging in if the same message arrived. Most likely, IT assumed that anyone would naturally understand that it also meant not approving unexpected, unexplained logins. Did the end user get trained as to what to do when an unexpected login arrived? Were they told to click on “Deny” and to contact IT Help Desk to report the active intrusion?

Or was the person told the correct instructions for both approving and denying and it just did not take? We all have busy lives. We all have too much to do. Perhaps the importance of the last part of the instructions just did not sink in. We can think we hear and not really hear. We can hear and still not care.

Hello World’s first-ever special edition is here!

Post Syndicated from Gemma Coleman original https://www.raspberrypi.org/blog/hello-world-big-book-of-computing-pedagogy/

Hello World, our free magazine for computing and digital making educators, has just published its very first special edition: The Big Book of Computing Pedagogy!

“When I started to peruse the draft for The Big Book of Computing Pedagogy, I was simply stunned.”

Monica McGill, founder & CEO of CSEDResearch.org

Cover of The Big Book of Computing Pedagogy.

This special edition focuses on practical approaches to teaching computing in the classroom, and includes some of our favourite pedagogically themed articles from previous issues of Hello World, as well as a few never-seen-before pieces. It is structured around twelve pedagogical principles, first developed by us as part of our work related to the National Centre for Computing Education in England. These twelve principles are based on up-to-date research around the best ways of approaching the teaching and learning of computing.

A girl doing a physical computing project with Raspberry Pi hardware.

Grounded in research and practice

Computing education is still relatively new, and it’s a field that’s constantly changing and adapting. Despite leaving school less than ten years ago, I remember my days in the computer lab being limited to learning about how to add animations on PowerPoints and trying out basic Excel formulas (and yes, there was still the odd mouse with a ball knocking about!).

A tweet praising The Big Book of Computing Pedagogy.
The Big Book of Computing Pedagogy — a big hit with educators!

Computing education research is even younger, and we are proud to be an important part of this growing space. As an organisation, we engage in rigorous original research around computing education and learning for young people, and we share all of our research work through blogs, reports, research seminars, and academic publications. We’re particularly proud to have partnered with the University of Cambridge to establish the Raspberry Pi Computing Education Research Centre

12 principles of computing pedagogy: lead with concepts; structure lessons; make concrete; unplug, unpack, repack; work together; read and explore code first; foster program comprehension; model everything; challenge misconceptions; create projects; get hands-on; add variety.
Our special edition of Hello World is organised around twelve pedagogical principles.

The Big Book of Computing Pedagogy represents another way in which we bring research and practice to computing educators in an accessible and engaging way. The book aims to be an educator’s companion to learning about tried and tested approaches to teaching computing.

A tweet praising The Big Book of Computing Pedagogy.
The perfect morning read for computing educators.

It includes articles on techniques for fostering program comprehension, advice for bringing physical computing to your classroom, and introductions to frameworks for structuring your computing lessons. As with all Hello World content, we’re bridging the gap between research and practice by giving you accessible chunks of research, followed by stories of trusty educators who have tried out the approaches in their classroom or educational space.

A tweet praising The Big Book of Computing Pedagogy.
Teachers are jumping for joy at this special edition.

Monica McGill, founder and CEO of CSEDResearch.org, says about Hello World’s latest offering, “When I started to peruse the draft for The Big Book of Computing Pedagogy, I was simply stunned. I found the ready-to-consume content to be solidly based on research evidence and tried-and-true best practices from teachers themselves. This resource provides valuable insights into introducing computing to students via unplugged activities, integrating the Predict–Run–Investigate–Modify–Make (PRIMM) pedagogical model, and introducing physical devices for computing — all written in a way that teachers can adopt and use in their own classrooms.”

We’ve been thrilled to see the reaction of educators to this special edition, with many teachers already using it as a reference guide and for a spot of CPD. Why not join them and download it for free today?

Subscribe now to get each new Hello World — whether regular issue or special edition — straight to your digital inbox, for free! And if you’re based in the UK and do paid or unpaid work in education, you can subscribe for free print issues.

PS Have you listened to our Hello World podcast yet? A new episode has just come out, and it’s great! Listen and subscribe wherever you get your podcasts.

The post Hello World’s first-ever special edition is here! appeared first on Raspberry Pi.

Designing products and services based on Jobs to be Done

Post Syndicated from Grab Tech original https://engineering.grab.com/designing-products-and-services-based-on-jtbd

Introduction

In 2016, Clayton Christensen, a Harvard Business School professor, wrote a book called Competing Against Luck. In his book, he talked about the kind of jobs that exist in our everyday life and how we can uncover hidden jobs through the act of non-consumption. Non-consumption is the inability for a consumer to fulfil an important Job to be Done (JTBD).

JTBD is a framework; it is a different way of looking at consumer goals and is based on the notion that people buy products and services to get a job done. In this article, we will walk through what the JTBD framework is, look at an example of a popular JTBD, and look at how we use the JTBD framework in one of Grab’s services.

JTBD framework

In his book, Clayton Christensen gives the example of the milkshake, as a JTBD example. In the mid-90s, a fast food chain was trying to understand how to improve the milkshakes they were selling and how they could sell more milkshakes. To sell more, they needed to improve the product. To understand the job of the milkshake, they interviewed their customers. They asked their customers why they were buying the milkshakes, and what progress the milkshake would help them make.

Job 1: To fill their stomachs

One of the key insights was the first job, the customers wanted something that could fill their stomachs during their early morning commute to the office. Usually, these car drives would take one to two hours, so they needed something to keep them awake and to keep themselves full.

In this scenario, the competition could be a banana, but think about the properties of a banana. A banana could fill your stomach but your hands get dirty and sticky after peeling it. Bananas cannot do a good job here. Another competitor could be a Snickers bar, but it is rather unhealthy, and depending on how many bites you take, you could finish it in one minute.

By understanding the job the milkshake was performing, the restaurant now had a specific way of improving the product. The milkshake could be made milkier so it takes time to drink through a straw. The customer can then enjoy the milkshake throughout the journey; the milkshake is optimised for the job.

Search data flow
Milkshake

Job 2: To make children happy

As part of the study, they also interviewed parents who came to buy milkshakes in the afternoon, around 3:00 PM. They found out that the parents were buying the milkshakes to make their children happy.

By knowing this, they were able to optimise the job by offering a smaller version of the milkshake which came in different flavours like strawberry and chocolate. From this milkshake example, we learn that multiple jobs can exist for one product. From that, we can make changes to a product to meet those different jobs.

JTBD at GrabFood

A team at GrabFood wanted to prioritise which features or products to build, and performed a prioritisation exercise. However, there was a lack of fundamental understanding of why our consumers were using GrabFood or any other food delivery services. To gain deeper insights on this, we conducted a JTBD study.

We applied the JTBD framework in our research investigation. We used the force diagram framework to find out what job a consumer wanted to achieve and the corresponding push and pull factors driving the consumer’s decision. A job here is defined as the progress that the consumer is trying to make in a particular context.

Search data flow
Force diagram

There were four key points in the force diagram:

  • What jobs are people using GrabFood for?
  • What did people use prior to GrabFood to get the jobs done?
  • What pushed them to seek a new solution? What is attractive about this new solution?
  • What are the things that will make them go back to the old product? What are the anxieties of the new product?

By applying this framework, we progressively asked these questions in our interview sessions:

  • Can you remind us of the last time you used GrabFood? — This was to uncover the situation or the circumstances.
  • Why did you order this food? — This was to get down to the core of the need.
  • Can you tell us, before GrabFood, what did you use to get the same job done?

From the interview sessions, we were able to uncover a number of JTBDs, one example was working parents buying food for their families. Before GrabFood, most of them were buying from food vendors directly, but that is a time consuming activity and it adds additional friction to an already busy day. This led them in search of a new solution and GrabFood provided that solution.

Let’s look at this JTBD in more depth. One anxiety that parents had when ordering GrabFood was the sheer number of choices they had to make in order to check out their order:

Search data flow
Force diagram – inertia, anxiety

There was already a solution for this problem: bundles! Food bundles is a well-known concept from the food and beverage industry; items that complement each other are bundled together for a more efficient checkout experience.

Search data flow
Force diagram – pull, push

However, not all GrabFood merchants created bundles to solve this problem for their consumers. This was an untapped opportunity for the merchants to solve a critical problem for their consumers. Eureka! We knew that we needed to help merchants create bundles in an efficient way to solve for the consumer’s JTBD.

We decided to add a functionality to the GrabMerchant app that allowed merchants to create bundles. We built an algorithm that matched complementary items and automatically suggested these bundles to merchants. The merchant only had to tap a button to create a bundle instantly.

Search data flow
Bundle

The feature was released and thousands of restaurants started adding bundles to their menu. Our JTBD analysis proved to be correct: food and beverage entrepreneurs were now equipped with an essential tool to drive growth and we removed an obstacle for parents to choose GrabFood to solve for their JTBD.

Conclusion

At Grab, we understand the importance of research. We educate designers and other non-researcher employees to conduct research studies. We also encourage the sharing of research findings, and we ensure that research insights are consumable. By using the JTBD framework and asking questions specifically to understand the job of our consumers and partners, we are able to gain fundamental understanding of why our consumers are using our products and services. This helps us improve our products and services, and optimise it for the jobs that need to be done throughout Southeast Asia.

This article was written based on an episode of the Grab Design Podcast – a conversation with Grab Lead Researcher Soon Hau Chua. Want to listen to the Grab Design Podcast? Join the team, we’re hiring!


Special thanks to Amira Khazali and Irene from Tech Learning.


Join us

Grab is a leading superapp in Southeast Asia, providing everyday services that matter to consumers. More than just a ride-hailing and food delivery app, Grab offers a wide range of on-demand services in the region, including mobility, food, package and grocery delivery services, mobile payments, and financial services across over 400 cities in eight countries.

Powered by technology and driven by heart, our mission is to drive Southeast Asia forward by creating economic empowerment for everyone. If this mission speaks to you, join our team today!

Making the Web safer and more secure for everyone

Post Syndicated from Let's Encrypt original https://letsencrypt.org/2021/10/21/celebrating-encryption-globally.html

The Internet Society has supported our work toward a 100% encrypted Web since before we’d even issued our first certificate. Their commitment to helping us execute our vision has been a substantial help over the years. Today, I’m excited to invite Christine Runnegar, Senior Director at The Internet Society and member of ISRG’s Board of Directors, to share her thoughts.

-Josh Aas, Executive Director, ISRG & Let’s Encrypt

Today, across the world, communities, organizations, and individuals are celebrating Global Encryption Day. Organized by the Global Encryption Coalition (GEC), it’s a day to take stock of the crucial role that encryption plays in securing our communications on the Internet.

The Internet Society is a GEC Steering Committee member because access to encryption is a key tool for us to realize our mission of keeping the Internet a force for good. That’s why the Internet Society is also a proud financial sponsor of Internet Security Research Group (ISRG), which founded and operates Let’s Encrypt. Let’s Encrypt provides digital certificates to more than 260 million websites, making a more secure and privacy-respecting Web for users all over the world. In just five years, the percentage of Web pages loaded over HTTPS has risen from under 50% to more than 85% and climbing, principally because of the community that has coalesced around the importance of encryption everywhere. Encrypted Web traffic protects the confidentiality and integrity of information users share with, or learn from, websites. It makes us all safer online.

Let’s Encrypt is a great success story, and an outstanding example of how supporting public interest infrastructure, such as a certificate authority operated for the public’s benefit, helps ensure everyone has access to the benefits of encryption.

We depend on contributions from our community of users and supporters in order to provide our services. If your company or organization would like to sponsor Let’s Encrypt please email us at [email protected]. We ask that you make an individual contribution if it is within your means.

[$] Empowering users of GPL software

Post Syndicated from original https://lwn.net/Articles/873415/rss

A new style of GPL-enforcement lawsuit was
filed
on October 19 by Software Freedom Conservancy (SFC)
against television maker Vizio. Unlike previous GPL-enforcement suits, which
have been pursued on behalf of the developers and copyright holders of
GPL-licensed code, this suit has been filed on behalf of owners of the TVs
in question. The idea that owners of devices that contain code under the
GPL have the right to access that code seems clearly embodied in the
license, but it remains to be seen if the courts will decide that those
owners have the legal standing to sue for relief.

Traffic Sequence: Which Product Runs First?

Post Syndicated from Sam Marsh original https://blog.cloudflare.com/traffic-sequence-which-product-runs-first/

Traffic Sequence: Which Product Runs First?

Traffic Sequence: Which Product Runs First?

“Which came first, the chicken or the egg?” It’s one of life’s great questions. There are hundreds of articles published which conclude with eggs predating chickens by millions of years. Unfortunately, Cloudflare users don’t have New Scientist on hand to answer similar questions.

Which runs first, Firewall Rules or Workers? Page Rules or Transform Rules? Whilst not as philosophically challenging, the answers to these questions are key to setting up your Cloudflare zone correctly. Answering them has become increasingly difficult as more and more functionality is added, thanks to our incredible rate of shipping products. What was once a relatively easy to understand traffic flow exploded in complexity with the introduction of products such as Workers, Load Balancing Rules and Transform Rules. And this big bang of product announcements is only accelerating each year.

To begin addressing this problem, we developed Traffic Sequence. Traffic Sequence is a simple dashboard illustration which shows a default, high-level overview of how Cloudflare products interact. Think of this as your atlas, rather than your black cab driver’s “Knowledge”. This helps you understand that London is in the south east of the UK, but not that it’s quicker to walk than use the London Underground between Leicester Square and Covent Garden.

Traffic Sequence: Which Product Runs First?

Traffic Sequence is now enabled for all zones by default, appearing on ten product pages within the dashboard. Traffic Sequence highlights in blue the product area you are currently configuring, showing where within the HTTP request lifecycle the specific product sits. This provides context and allows users to understand which products will see the impact of changes here, and which products will not.

Traffic Sequence is designed to make Cloudflare’s edge clearer to our customers, allowing users to understand how products fit together and understand how HTTP requests flow between each.

Dear Cloudflare, which runs first?

Understanding how traffic is routed through Cloudflare has been one of the most common questions from both Cloudflare staff and customers alike.

But why does it matter? Let’s go through a simple example.

Released in April 2021, “Transform Rules” lets users rewrite URLs of HTTP requests as they proxy through their zone — for example, rewriting /login.php to /super/secret/login-page.php, all invisible to the end user.

In this scenario, the administrator also has a Firewall Rule blocking requests to the URI Path /login.php when the visitor is coming from a country other than the United States. What they would see, however, is that visitors from these other countries are still reaching the /login.php page on their servers. Why is this?

This is because URL rewrites happen before Firewall Rules, meaning the Firewall Rules product won’t see a URI Path of /login.php. Instead it will see HTTP requests with the rewritten URI path of /super/secret/login-page.php. Thus, when Firewall Rules evaluates the customers rule it checks:

  1. Is this from a country that is not the USA? Yes
  2. AND – Is this request going to a URI Path of /login.php? No.

As both criteria are not evaluated as ‘true’,  the rule does not match and the traffic is allowed on its journey.

This is why it is so important to know how Cloudflare’s products interoperate to get the most out of your plan, and achieve your goals without having to dig through mountains of documentation.

In an alternate timeline, Traffic Sequence is used to highlight that Firewall Rules run after URL rewriting occurs, and therefore see’s the rewritten value in the URI Path. With this information the customer can then configure a Firewall Rule to look for the rewritten value in URI Path and accomplish their desired setup.

From napkin to working prototype

Traffic Sequence was originally borne out of a “back of the napkin” idea during the creation of Transform Rules and URL Normalization, in an attempt to show where these transformations were happening:

Traffic Sequence: Which Product Runs First?

The idea might have started from a need of our own, but it ended up addressing well known customer and internal problems: whenever we build a new product everyone wants to understand how it fits into the big picture. So we pushed the idea further, proposing it to other teams and soliciting feedback.

This project was a great example of how bringing the right level of fidelity of thinking to the table can be evolved into an opportunity to ship to learn. Something that was initially meant as an explainer diagram for one rule type has become an almost bespoke experience of the dashboard, as it is unique to each customer’s Cloudflare environment, displaying only the products available for use in that zone. We offer many options and routes to products, but we didn’t have a straightforward flow of information that customers can rely on, focusing only on what they have set up and have access to.

As part of the design process, we try to focus on asking lots of questions rather than just finding an answer. Some of the considerations we had were:

  • What if we show customers a product they aren’t using?
  • What if we show customers a product they aren’t entitled to on their plan level?
  • Why aren’t we showing “this product”?
  • Do we have this visualisation on by default?

After gaining internal momentum to flesh out this project, we decided to focus on three areas:

  1. Simplifying a complex ecosystem – what is a useful simplification?
  2. Value that this will add beyond this first application
  3. Opportunity to test out different navigation and mental models.

After all, this is not just a map of our system, but a new way of navigating it entirely.

Positive early internal feedback not only aligned with our goals, but allowed us to iterate on points that needed improvement. We knew that this could be a game-changer for promoting clarity, improving discoverability and saving time with navigation: going for one click instead of three for most items.

Traffic Sequence: Which Product Runs First?

A couple of iterations later, we were ready to put this in the hands of our users for early testing:


Thanks to our incredible community we had a high level of interest in the first week, providing insight into how this feature would be used in the real world, and answering the ultimate question of this experiment: “Does this solve the problem of understanding how Cloudflare handles HTTP requests?”  via our Traffic Sequence survey form:

  • “I didn’t know where my requests were going… until now.”
  • “It’s always been confusing which products/features affect which other products/features.”
  • “It’s really handy to be able to explain the ordering that these are happening in, and I like the deeplink into the relevant area.”

These were all a great reminder that what triggered this work was ingrained in real customer needs.

Other feedback was rapidly incorporated into the prototype; specifically splitting Transform Rules into two separate sections to highlight that URL rewrites and header modifications occur at different parts of the request flow. We also added features which our users deemed important for clarity, such as IP Access Rules.

Traffic Sequence for all

Thanks to the great feedback and participation of all testers, both internal and external, we are now in a position where we are comfortable to take the covers off and make Traffic Sequence available to all users.

Traffic Sequence: Which Product Runs First?

The visualisation can be hidden easily by clicking on the “hide” button, and the display automatically hides to preserve critical whitespace when needed:

Traffic Sequence: Which Product Runs First?

When new products are added, or updates to products occur which modify the traffic order, this diagram will be updated accordingly.

Evolving Traffic Sequence

We know this is a high level, generic overview of how Cloudflare products interact. There is a level of nuance underneath, and a number of products and features not shown in the Traffic Sequence illustration which play an important part in keeping users safe and secure.

In the future we have aspirations to build “the other side of the coin”. Traffic Sequence provides a simple to understand view of how the products work by default at a high level. We also want to create a detailed, almost traceroute-like feature which allows users to see exactly what happens to their traffic — which products it goes via and what happens within those products, and potentially a lot more. Stay tuned!

Try it now

This feature is now enabled by default on all customer zones, and is visible within the dashboard locations outlined above.

Please do try it out and let us know what you think via the Cloudflare Community

Build operational metrics for your enterprise AWS Glue Data Catalog at scale

Post Syndicated from Sachin Thakkar original https://aws.amazon.com/blogs/big-data/build-operational-metrics-for-your-enterprise-aws-glue-data-catalog-at-scale/

Over the last several years, enterprises have accumulated massive amounts of data. Data volumes have increased at an unprecedented rate, exploding from terabytes to petabytes and sometimes exabytes of data. Increasingly, many enterprises are building highly scalable, available, secure, and flexible data lakes on AWS that can handle extremely large datasets. After data lakes are productionized, to measure the efficacy of the data lake and communicate the gaps or accomplishments to the business groups, enterprise data teams need tools to extract operational insights from the data lake. Those insights help answer key questions such as:

  • The last time a table was updated
  • The total table count in each database
  • The projected growth of a given table
  • The most frequently queried table vs. least queried tables

In this post, I walk you through a solution to build an operational metrics dashboard (like the following screenshot) for your enterprise AWS Glue Data Catalog on AWS.

Solution overview

This post shows you how to collect metadata information from your data lake’s AWS Glue Data Catalog resources (databases and tables) and build an operational dashboard on this data.

The following diagram illustrates the overall solution architecture and steps.

The steps are as follows:

  1. A data collector Python program runs on a schedule and collects metadata details about databases and tables from the enterprise Data Catalog.
  2. The following key data attributes are collected for each table and database in your AWS Glue Data Catalog.
Table Data Database Data
TableName DatabaseName
DatabaseName CreateTime
Owner SharedResource
CreateTime SharedResourceOwner
UpdateTime SharedResourceDatabaseName
LastAccessTime Location
TableType Description
Retention
CreatedBy
IsRegisteredWithLakeFormation
Location
SizeInMBOnS3
TotalFilesonS3
  1. The program reads each table’s file location and computes the number of files on Amazon Simple Storage Service (Amazon S3) and the size in MB.
  2. All the data for the tables and databases is stored in an S3 bucket for downstream analysis. The program runs every day and creates new files partitioned by year, month, and day on Amazon S3.
  3. We crawl the data created in Step 4 using an AWS Glue crawler.
  4. The crawler creates an external database and tables for our generated dataset for downstream analysis.
  5. We can query the extracted data with Amazon Athena.
  6. We use Amazon QuickSight to build our operational metrics dashboard and gain insights into our data lake content and usage.

For simplicity, this program crawls and collects data from the Data Catalog for the us-east-1 Region only.

Walkthrough overview

The walkthrough includes the following steps:

  1. Configure your dataset.
  2. Deploy the core solution resources with an AWS CloudFormation template, and set up and trigger the AWS Glue job.
  3. Crawl the metadata dataset and create external tables in the Data Catalog.
  4. Build a view and query the data through Athena.
  5. Set up and import data into QuickSight to create an operational metrics dashboard for the Data Catalog.

Configure your dataset

We use the AWS COVID-19 data lake for analysis. This data lake is comprised of data in a publicly readable S3 bucket.

To make the data from the AWS COVID-19 data lake available in your AWS account, create a CloudFormation stack using the following template. If you’re signed in to your AWS account, the following link fills out most of the stack creation form for you. Make sure to change the Region to us-east-1. For instructions on creating a CloudFormation stack, see Get started.

This template creates a COVID-19 database in your Data Catalog and tables that point to the public AWS COVID-19 data lake. You don’t need to host the data in your account, and you can rely on AWS to refresh the data as datasets are updated through AWS Data Exchange.

For more information about the COVID-19 dataset, see A public data lake for analysis of COVID-19 data.

Your environment may already have existing datasets in the Data Catalog. The program collects the aforementioned attributes for those datasets as well, which can be used for analysis.

Deploy your resources

To make it easier to get started, we created a CloudFormation template that automatically sets up a few key components of the solution:

  • An AWS Glue job (Python program) that is triggered based on a schedule
  • The AWS Identity and Access Management (IAM) role required by the AWS Glue job so the job can collect and store details about databases and tables in the Data Catalog
  • A new S3 bucket for the AWS Glue job to store the data files
  • A new database in the Data Catalog for storing our metrics data tables

The source code for the AWS Glue job and the CloudFormation template are available in the GitHub repo.

You must first download the AWS Glue Python code from GitHub and upload it to an existing S3 bucket. The path of this file needs to be provided when running the CloudFormation stack.

  1. Launch the stack:
  2. Provide values for your parameters as shown in the following screenshot.

After the stack is deployed successfully, you can check the resources created on the stack’s Resources tab.

You can verify and check the AWS Glue job setup and trigger, which is scheduled as per your specified time.

Now that we have verified that the stack is successfully set up, we can run our AWS Glue job manually and collect key attributes for our analysis.

  1. On the AWS Glue console, choose AWS Glue Studio in the navigation pane.
  2. In the AWS Glue Studio Console, click on Jobs and select the DataCollector job and Run the job.

The AWS Glue job collects data and stores it in the S3 bucket created for us through AWS CloudFormation. The job creates separate folders for database and table data, as shown in the following screenshot.

Crawl and set up external tables for the metrics data

Follow these steps to create tables in the database by using AWS Glue crawlers on the data stored on Amazon S3. Note that the database has been created for us using the CloudFormation stack.

  1. On the AWS Glue console, under Databases in the navigation pane, choose Tables.
  2. Choose Add tables.
  3. Choose Add tables using a crawler.
  4. Enter a name for the crawler and choose Next.
  5. For Add crawler, choose Create source type.
  6. Specify the crawler source type by choosing Data stores and choose Next.
  7. In the Add a data store section, for Choose a data store, choose S3.
  8. For Crawl data in, select Specified path.
  9. For Include path, enter the path to the tables folder generated by the AWS Glue job: s3://<data bucket created using CFN>/datalake/tables/.
  10. When asked if you want to create another data store, select No and then choose Next.
  11. On the Choose an IAM Role page, select Choose an Existing IAM Role.
  12. For IAM role, choose the IAM role created through the CloudFormation stack.
  13. Choose Next.
  14. On the Output page, for Database, choose the AWS Glue database you created earlier.
  15. Choose Next.
  16. Review your selections and choose Finish.
  17. Select the crawler you just created and choose Run crawler.

The crawler should take only a few minutes to complete. While it’s running, status messages may appear, informing you that the system is attempting to run the crawler and then is actually running the crawler. You can choose the refresh icon to check on the current status of the crawler.

  1. In the navigation pane, choose Tables.

The table called tables, which was created by the crawler, should be listed.

Query data with Athena

This section demonstrates how to query these tables using Athena. Athena is a serverless, interactive query service that makes it easy to analyze the data in the AWS COVID-19 data lake. Athena supports SQL, a common language that data analysts use for analyzing structured data. To query the data, complete the following steps:

  1. Sign in to the Athena console.
  2. If this is your first time using Athena, you must specify a query result location on Amazon S3.
  3. On the drop-down menu, choose the datalake360db database.
  4. Enter your queries and explore the datasets.

Set up and import data into QuickSight and create an operational metrics dashboard

Set up QuickSight before you import the dataset, and make sure that you have at least 512 MB of SPICE capacity. For more information, see Managing SPICE Capacity.

Before proceeding, make sure your QuickSight account has IAM permissions to access Athena (see Authorizing Connections to Amazon Athena) and Amazon S3.

Let’s first create our datasets.

  1. On the QuickSight console, choose Datasets in the navigation pane.
  2. Choose New dataset.
  3. Choose Athena from the list of data sources.
  4. For Data source name, enter a name.
  5. For Database, choose the database that you set up in the previous step (datalake360db).
  6. For Tables, select databases.
  7. Finish creating your dataset..
  8. Repeat same steps to create a tables dataset.

Now you edit the databases dataset.

  1. From the datasets list, choose the databases dataset.
  2. Choose Edit dataset.
  3. Change the createtime field type from string to date.
  4. Enter the date format as yy/MM/dd HH:mm:ss.
  5. Choose Update.
  6. Similarly, change the tables dataset fields createtime, updatetime, and lastaccessedtime to the date type.
  7. Choose Save and Publish to save the changes to the dataset.

Next, we add calculated fields for the count of databases and tables.

  1. For the tables dataset, choose Add calculation.
  2. Add the calculated field tablesCount as distinct_count({tablename}.
  3. Similarly, add a new calculated field databasesCount as distinct_count({databasename}.

Now let’s create a new analysis.

  1. In the navigation pane, choose Analysis.
  2. Choose the tables dataset.
  3. Choose Create analysis.

Let’s create our first visual for the count of number of databases and tables in our data lake Data Catalog.

  1. Create a new visual and add databasesCount from the fields list.

This provides us with a count of databases in our Data Catalog.

  1. Similarly, add a visual to display the total number of tables using the tablesCount field.

Let’s create second visual for the total number of files on Amazon S3 and total storage size on Amazon S3.

  1. Similar to the previous step, we add a new visual and choose the totalfilesons3 and sizeinmbons3 fields to display Amazon S3-related storage details.

Let’s create another visual to check which are the least used datasets.

  1. Add a visual using the LastAccessTime data element.

Finally, let’s create one more visual to check if databases are shared resources from different accounts.

  1. Select the databases dataset.
  2. We create a table visual type and add databasename, sharedresource, and description fields.

Now you have an idea of what types of visuals are possible using this data. The following screenshot is one example of a finished dashboard.

Clean up

To avoid ongoing charges, delete the CloudFormation stacks and output files in Amazon S3 that you created during deployment. You have to delete the data in the S3 buckets before you can delete the buckets.

Conclusion

In this post, we showed how you can set up an operational metrics dashboard for your Data Catalog. We set up our program to collect key data elements about our tables and databases from the AWS Glue Data Catalog. We then used this dataset to build our operational metrics dashboard and gained insights on our data lake.


About the Authors

Sachin Thakkar is a Senior Solutions Architect at Amazon Web Services, working with a leading Global System Integrator (GSI). He brings over 22 years of experience as an IT Architect and as Technology Consultant for large institutions. His focus area is on Data & Analytics. Sachin provides architectural guidance and supports the GSI partner in building strategic industry solutions on AWS

Configure single sign-on authentication for Amazon Athena with Azure AD integrated to on-premises AD

Post Syndicated from Niraj Kumar original https://aws.amazon.com/blogs/big-data/configure-single-sign-on-authentication-for-amazon-athena-with-azure-ad-integrated-to-on-premises-ad/

Amazon Athena is an interactive query service that makes it easier to analyze data directly in Amazon Simple Storage Service (Amazon S3) using standard SQL. Cloud operation teams can use AWS Identity and Access Management (IAM) federation to centrally manage access to Athena. This simplifies administration by allowing a governing team to control user access to Athena workgroups from a centrally managed Azure AD connected to an on-premise Active Directory. This setup reduces the overhead experience by cloud operation teams when managing IAM users. Athena supports federation with Active Directory Federation Service (ADFS), PingFederate, Okta, and Microsoft Azure Active Directory (Azure AD) federation.

For more information on how to use ADFS with Athena, see Enabling Federated Access to the Athena API. .

This blog post illustrates how to set up AWS IAM federation with Azure AD connected to on-premises AD and configure Athena workgroup- level access for different users. We are going to cover two scenarios:

  1. Azure AD managed users and groups, and on-premises AD.
  2. On-prem Active directory managed users and groups synchronized to Azure AD.

We don’t cover how to setup synchronization between on-premises AD and Azure AD with the help of Azure AD connect. For more information on how to integrate Azure AD with an AWS Managed AD , see Enable Office 365 with AWS Managed Microsoft AD without user password synchronization and how to integrate Azure AD with an on-premises AD , see Microsoft article Custom installation of Azure Active Directory Connect.

Solution overview

This solution helps you configure IAM federation with Azure AD connected to on-premises AD and configure Athena workgroup-level access for users. You can control access to the workgroup by either an on-premises AD group or Azure AD group. The solution consists of four sections:

  1. Set up Azure AD as your identity provider (IdP):
    1. Set up Azure AD as your SAML IdP for an AWS single-account app.
    2. Configure the Azure AD app with delegated permissions.
  2. Set up your IAM IdP and roles:
    1. Set up an IdP trusting Azure AD.
    2. Set up an IAM user with read role permission.
    3. Set up an IAM role and policies for each Athena workgroup.
  3. Set up user access in Azure AD:
    1. Set up automatic IAM role provisioning.
    2. Set up user access to the Athena workgroup role.
  4. Access Athena:
    1. Access Athena using the web-based Microsoft My Apps portal.
    2. Access Athena using SQL Workbench/J a free, DBMS-independent, cross-platform SQL query tool.

The following diagram illustrates the architecture of the solution.

The solution workflow includes the following steps:

  1. The developer workstation connects to Azure AD via a SQL Workbench/j JDBC Athena driver to request a SAML token (two-step OAuth process).
  2. Azure AD sends authentication traffic back to on-premises via an Azure AD pass-through agent or ADFS.
  3. The Azure AD pass-through agent or ADFS connects to on-premises DC and authenticates the user.
  4. The pass-through agent or ADFS sends a success token to Azure AD.
  5. Azure AD constructs a SAML token containing the assigned IAM role and sends it to the client.
  6. The client connects to AWS Security Token Service (AWS STS) and presents the SAML token to assume the Athena role and generates temporary credentials.
  7. AWS STS sends temporary credentials to the client.
  8. The client uses the temporary credentials to connect to Athena.

Prerequisites

You must meet the following requirements prior to configuring the solution:

  • On the Azure AD side, complete the following:
    • Set up the Azure AD Connect server and sync with on-premises AD
    • Set up the Azure AD pass-through or Microsoft ADFS federation between Azure AD and on-premises AD
    • Create three users (user1, user2, user3) and three groups (athena-admin-adgroup, athena-datascience-adgroup, athena-developer-adgroup) for three respective Athena workgroups
  • On the Athena side, create three Athena workgroups: athena-admin-workgroup, athena-datascience-workgroup, athena-developer-workgroup

For more information on using sample Athena workgroups, see A public data lake for analysis of COVID-19 data.

Set up Azure AD

In this section we will cover Azure AD configuration details for Athena in Microsoft Azure subscription. Mainly we will register an app, configure federation, delegate app permission and generate App secret.

Set Azure AD as SAML IdP for an AWS single-account app

To set up Azure AD as your SAML IdP, complete the following steps:

  1. Sign in to the Azure Portal with Azure AD global admin credentials.
  2. Choose Azure Active Directory.
  3. Choose Enterprise applications.
  4. Choose New application.
  5. Search for Amazon in the search bar.
  6. Choose AWS Single-Account Access.
  7. For Name, enter Athena-App.
  8. Choose Create.
  9. In the Getting Started section, under Set up single sign on, choose Get started.
  10. For Select a single sign-on method, choose SAML.
  11. For Basic SAML Configuration, choose Edit.

  12. For Identifier (Entity ID), enter https://signin.aws.amazon.com/saml#1.
  13. Choose Save.
  14. Under SAML Signing Certificate, for Federation Metadata XML, choose Download.

This file is required to configure your IAM IdP in the next section. Save this file on your local machine to use later when configuring IAM on AWS.

Configure your Azure AD app with delegated permissions

To configure your Azure AD app, complete the following steps:

  1. Choose Azure Active Directory.
  2. Choose App registrations and All Applications.
  3. Search for and choose Athena-App.
  4. Note the values for Application (client) ID and Directory (tenant) ID.

You need these values in the JDBC connection when you connect to Athena.

  1. Under API Permissions, choose Add a permission.
  2. Choose Microsoft Graph and Delegated permissions.
  3. For Select permissions, search for user.read.
  4. For User, choose User.Read.
  5. Choose Add permission.
  6. Choose Grant admin consent and Yes.
  7. Choose Authentication and Add a platform.
  8. Choose Mobile and Desktop applications.
  9. Under Custom redirect URIs, enter http://localhost/athena.
  10. Choose Configure.
  11. Choose Certificates & secrets and New client secret.
  12. Enter a description.
  13. For Expires, choose 24 months.
  14. Copy the client secret value to use when configuring the JDBC connection.

Set up the IAM IdP and roles

In this section we will cover IAM configuration in AWS account. Mainly we will create an IAM user, Roles and policies.

Set up an IdP trusting Azure AD

To set up your IdP trusting Azure AD, complete the following steps:

  1. On the IAM console, choose Identity providers in the navigation pane.
  2. Choose Add provider.
  3. For Provider Type, choose SAML.
  4. For Provider Name, enter AzureADAthenaProvider.
  5. For Metadata Document, upload the file downloaded from Azure Portal.
  6. Choose Add provider.

Set up an IAM user with read role permission

To set up your IAM user, complete the following steps:

  1. On the IAM console, choose Users in the navigation pane.
  2. Choose Add user.
  3. For User name, enter ReadRoleUser.
  4. For Access type, select Programmatic access.
  5. Choose Next: Permissions.
  6. For Set permissions, choose Attach existing policies directly.
  7. Choose Create policy.
  8. Select JSON and enter the following policy, which gives read access to enumerate roles in IAM:
    {
        "Version": "2012-10-17",
        "Statement": [
            {
                "Effect": "Allow",
                "Action": [
                    "iam:ListRoles"
                ],
                "Resource": "*"
            }
        ]
    }
    

  9. Choose Next: Tags.
  10. Choose Next: Review.
  11. For Name, enter readrolepolicy.
  12. Choose Create policy.
  13. On the Add User tab, search for and choose the role readrole.
  14. Choose Next: tags.
  15. Choose Next: Review.
  16. Choose Create user.
  17. Download the .csv file containing the access key ID and secret access key.

We use these when configuring Azure AD automatic provisioning.

Set up an IAM role and policies for each Athena workgroup

To set up IAM roles and policies for your Athena workgroups, complete the following steps:

  1. On the IAM console, choose Roles in the navigation pane.
  2. Choose Create role.
  3. For Select type of trusted entity, choose SAML 2.0 federation.
  4. For SAML provider, choose AzureADAthenaProvider.
  5. Choose Allow programmatic and AWS Management Console access.
  6. Under Condition, choose Key.
  7. Select SAML:aud.
  8. For Condition, select StringEquals.
  9. For Value, enter http://localhost/athena.
  10. Choose Next: Permissions.
  11. Choose Create policy.
  12. Choose JSON and enter the following policy (provide the ARN of your workgroup):
{
    "Version": "2012-10-17",
    "Statement": [
        {
            "Effect": "Allow",
            "Action": [
                "athena:ListEngineVersions",
                "athena:ListWorkGroups",
                "athena:ListDataCatalogs",
                "athena:ListDatabases",
                "athena:GetDatabase",
                "athena:ListTableMetadata",
                "athena:GetTableMetadata"
            ],
            "Resource": "*"
        },
        {
            "Effect": "Allow",
            "Action": [
                "athena:BatchGetQueryExecution",
                "athena:GetQueryExecution",
                "athena:ListQueryExecutions",
                "athena:StartQueryExecution",
                "athena:StopQueryExecution",
                "athena:GetQueryResults",
                "athena:GetQueryResultsStream",
                "athena:CreateNamedQuery",
                "athena:GetNamedQuery",
                "athena:BatchGetNamedQuery",
                "athena:ListNamedQueries",
                "athena:DeleteNamedQuery",
                "athena:CreatePreparedStatement",
                "athena:GetPreparedStatement",
                "athena:ListPreparedStatements",
                "athena:UpdatePreparedStatement",
                "athena:DeletePreparedStatement"
            ],
            "Resource": [
                "arn:aws:athena:xxxx:xxxxxx:xxx/xxxx"
            ]
        },
        {
            "Effect": "Allow",
            "Action": [
                "athena:DeleteWorkGroup",
                "athena:UpdateWorkGroup",
                "athena:GetWorkGroup",
                "athena:CreateWorkGroup"
            ],
            "Resource": [
                "arn:aws:athena:xxxx:xxxxxx:xxx/xxxx"
            ]
        },
        {
            "Effect": "Allow",
            "Action": [
                "glue:CreateDatabase",
                "glue:DeleteDatabase",
                "glue:GetDatabase",
                "glue:GetDatabases",
                "glue:UpdateDatabase",
                "glue:CreateTable",
                "glue:DeleteTable",
                "glue:BatchDeleteTable",
                "glue:UpdateTable",
                "glue:GetTable",
                "glue:GetTables",
                "glue:BatchCreatePartition",
                "glue:CreatePartition",
                "glue:DeletePartition",
                "glue:BatchDeletePartition",
                "glue:UpdatePartition",
                "glue:GetPartition",
                "glue:GetPartitions",
                "glue:BatchGetPartition"
            ],
            "Resource": [
                "*"
            ]
        },
        {
            "Effect": "Allow",
            "Action": [
                "s3:GetBucketLocation",
                "s3:GetObject",
                "s3:ListBucket",
                "s3:ListBucketMultipartUploads",
                "s3:ListMultipartUploadParts",
                "s3:AbortMultipartUpload",
                "s3:CreateBucket",
                "s3:PutObject",
                "s3:PutBucketPublicAccessBlock"
            ],
            "Resource": [
                "*"
            ]
        },
        {
            "Effect": "Allow",
            "Action": [
                "s3:GetObject",
                "s3:ListBucket"
            ],
            "Resource": [
                "*"
            ]
        },
        {
            "Effect": "Allow",
            "Action": [
                "s3:ListBucket",
                "s3:GetBucketLocation",
                "s3:ListAllMyBuckets"
            ],
            "Resource": [
                "*"
            ]
        },
        {
            "Effect": "Allow",
            "Action": [
                "sns:ListTopics",
                "sns:GetTopicAttributes"
            ],
            "Resource": [
                "*"
            ]
        },
        {
            "Effect": "Allow",
            "Action": [
                "cloudwatch:PutMetricAlarm",
                "cloudwatch:DescribeAlarms",
                "cloudwatch:DeleteAlarms"
            ],
            "Resource": [
                "*"
            ]
        },
        {
            "Effect": "Allow",
            "Action": [
                "lakeformation:GetDataAccess"
            ],
            "Resource": [
                "*"
            ]
        }
    ]
}

The policy grants full access to Athena workgroup. It’s based on the AWS managed policy AmazonAthenaFullAccess and workgroup example policies.

  1. Choose Next: Tags.
  2. Choose Next: Review.
  3. For Name, enter athenaworkgroup1policy.
  4. Choose Create policy.
  5. On the Create role tab, search for athenaworkgroup1policy and select the policy.
  6. Choose Next: Tags.
  7. Choose Next: Review.
  8. Choose Create role.
  9. For Name, enter athenaworkgroup1role.
  10. Choose Create role.

Set up user access in Azure AD

In this section we will setup Automatic provisioning and assign users to app from Microsoft Azure portal.

Set up automatic IAM role provisioning

To set up automatic IAM role provisioning, complete the following steps:

  1. Sign in to the Azure Portal with Azure AD global admin credentials.
  2. Choose Azure Active Directory.
  3. Choose Enterprise Applications and choose Athena-App.
  4. Choose Provision User Accounts.
  5. In the Provisioning section, choose Get started.
  6. For Provisioning Mode, choose Automatic.
  7. Expand Admin credentials and populate clientsecret and Secret Token with the access key ID and secret access key of ReadRoleUser, respectively.
  8. Choose Test Connection and Save.
  9. Choose Start provisioning.

The initial cycle can take some time to complete, after which the IAM roles are populated in Azure AD.

Set up user access to the Athena workgroup role

To set up user access to the workgroup role, complete the following steps:

  1. Sign in to Azure Portal with Azure AD global admin credentials.
  2. Choose Azure Active Directory.
  3. Choose Enterprise Applications and choose Athena-App.
  4. Choose Assign users and groups and Add user/group.
  5. Under Users and groups, select the group that you want to assign Athena permission to. For this post, we use athena-admin-adgroup; alternatively, you can select user1.
  6. Choose Select.
  7. For Select a role, select the role athenaworkgroup1role.
  8. Choose Select.
  9. Choose Assign.

Access Athena

In this section we will demonstrate how to access Athena from AWS console and developer tool SQL Workbench/J

Access Athena using the web-based Microsoft My Apps portal

To use the Microsoft My Apps portal to access Athena, complete the following steps:

  1. Sign in to Azure Portal with Azure AD global admin credentials.
  2. Choose Azure Active Directory
  3. Choose Enterprise Applications and choose Athena-App.
  4. Choose
  5. Properties.
  6. Copy the value for User access URL.
  7. Open a web browser and enter the URL.

The link redirects you to an Azure login page.

  1. Log in with the on-premises user credentials.

You’re redirected to the AWS Management Console.

Access Athena using SQL Workbench/J

In highly regulated organizations, internal users aren’t allowed to use the console to access Athena. In such cases, you can use SQL Workbench/J, an open-source tool that enables connectivity to Athena using a JDBC driver.

  1. Download the latest Athena JDBC driver (choose the appropriate driver based on your Java version).
  2. Download and install SQL Workbench/J.
  3. Open SQL Workbench/J.
  4. On the File menu, choose Connect Window.
  5. Choose Manage Drivers.
  6. For Name, enter a name for your driver.
  7. Browse to the folder location where you downloaded and unzipped the driver.
  8. Choose OK.

Now that we configured the Athena driver, it’s time to connect to Athena. You need to fill out the connection URL, user name, and password.

Use the following connection string to connect to Athena with a user account without MFA (provide the values collected earlier in the post):

jdbc:awsathena://AwsRegion=xxxx;AwsCredentialsProviderClass=com.simba.athena.iamsupport.plugin.AzureCredentialsProvider;tenant_id=xxxx;client_id=xxxx;Workgroup=xxxx;client_secret=xxxx

To connect using a user account with MFA enabled, use the browser Azure AD Credentials Provider. You need to construct the connection URL and fill out the user name Username and password

Use the following connection string to connect to Athena with a user account that has MFA enabled (provide the values you collected earlier):

jdbc:awsathena://AwsRegion=xxxx;AwsCredentialsProviderClass=com.simba.athena.iamsupport.plugin.BrowserAzureCredentialsProvider;tenant_id=xxxx;client_id=xxxx;Workgroup=xxxx;

Replace text in red with details collected earlier in the article.

When the connection is established, you can run queries against Athena.

Proxy configuration

If you’re connecting to Athena through a proxy server, make sure that the proxy server allows port 444. The result set streaming API uses port 444 on the Athena server for outbound communications. Set the ProxyHost property to the IP address or host name of your proxy server. Set the ProxyPort property to the number of the TCP port that the proxy server uses to listen for client connections. See the following code:

jdbc:awsathena://AwsRegion=xxxx;AwsCredentialsProviderClass=com.simba.athena.iamsupport.plugin.BrowserAzureCredentialsProvider;tenant_id=xxxx;client_id=xxxx;Workgroup=xxxx;ProxyHost=xxxx;ProxyPort=xxxx

Summary

In this post, we configured IAM federation with Azure AD connected to on-premises AD and set up granular access to an Athena workgroup. We also looked at how to access Athena through the console using the Microsoft My Apps web portal and SQL Workbench/J tool. We also discussed how the connection works over a proxy. The same federation infrastructure can also be leveraged for ODBC driver configuration. You can also use the instructions in this post to set up SAML-based Azure IdP to enable federated access to Athena Workgroups.


About the Author

Niraj Kumar is a Principal Technical Account Manager for financial services at AWS, where he helps customers design, architect, build, operate, and support workloads on AWS in a secure and robust manner. He has over 20 years of diverse IT experience in the fields of enterprise architecture, cloud and virtualization, security, IAM, solution architecture, and information systems and technologies. In his free time, he enjoys mentoring, coaching, trekking, watching documentaries with his son, and reading something different every day.

Computer Vision at the Edge with AWS Panorama

Post Syndicated from Sébastien Stormacq original https://aws.amazon.com/blogs/aws/computer-vision-at-the-edge-with-aws-panorama/

Today, the AWS Panorama Appliance is generally available to all of you. The AWS Panorama Appliance is a computer vision (CV) appliance designed to be deployed on your network to analyze images provided by your on-premises cameras.

AWS Panorama Appliance

Every week, I read about new and innovative use cases for computer vision. Some customers are using CV to verify pallet trucks are parked in designated areas to ensure worker safety in warehouses, some are analyzing customer walking flows in retail stores to optimize space and product placement, and some are using it to recognize cats and mice, just to name a few.

AWS customers agree the cloud is the most convenient place to train computer vision models thanks to its virtually infinite access to storage and compute resources. In the cloud, data scientists have access to powerful tools such as Amazon SageMaker and a wide variety of compute resources and frameworks.

However, when it’s time to analyze images from one or multiple video feeds, many of you are telling us the cloud is not the place where you want to run such workloads. There are a number of reasons for that: sometimes the facilities where the images are captured do not have enough bandwidth to send video feeds to the cloud, some use cases require very low latency, or some just want to keep their images on premises and not send them for analysis outside of their network.

At re:Invent 2020, we announced the AWS Panorama Appliance and SDK to address these requirements.

AWS Panorama is a machine learning appliance and software development kit (SDK) that allows you to bring computer vision to on-premises cameras to make predictions locally with high accuracy and low latency. With the AWS Panorama Appliance, you can automate tasks that have traditionally required human inspection to improve visibility into potential issues. For example, you can use AWS Panorama Appliance to evaluate manufacturing quality, identify bottlenecks in industrial processes, and monitor workplace security even in environments with limited or no internet connectivity. The software development kit allows camera manufacturers to bring equivalent capabilities directly inside their IP camera.

As usual on this blog, I would like to walk you through the development and deployment of a computer vision application for the AWS Panorama Appliance. The demo application from this blog uses a machine learning model to recognise objects in frames of video from a network camera. The application loads a model onto the AWS Panorama Appliance, gets images from a camera, and runs those images through the model. The application then overlays the results on top of the original video and outputs it to a connected display. The application uses libraries provided by AWS Panorama to interact with input and output video streams and the model, no low level programming is required.

Let’s first define a few concepts. I borrowed the following definitions from the AWS Panorama documentation page.

Concepts
The AWS Panorama Appliance is the hardware that runs your applications. You use the AWS Panorama console or AWS SDKs to register an appliance, update its software, and deploy applications to it. The software that runs on the appliance discovers and connects to camera streams, sends frames of video to your application, and optionally displays video output on an attached display.

The appliance is an edge device. Instead of sending images to the AWS Cloud for processing, it runs applications locally on optimized hardware. This enables you to analyze video in real time and process the results with limited connectivity. The appliance only requires an internet connection to report its status, upload logs, and get software updates and deployments.

An application comprises multiple components called nodes, which represent cameras, models, code, or global variables. A node can be configuration only (inputs and outputs), or include artifacts (models and code). Application nodes are bundled in node packages that you upload to an S3 access point, where the AWS Panorama Appliance can access them. An application manifest is a configuration file that defines connections between the nodes.

A computer vision model is a machine learning network that is trained to process images. Computer vision models can perform various tasks such as classification, detection, segmentation, and tracking. A computer vision model takes an image as input and outputs information about the image or objects in the image.

AWS Panorama supports models built with Apache MXNet, DarkNet, GluonCV, Keras, ONNX, PyTorch, TensorFlow, and TensorFlow Lite. You can build models with Amazon SageMaker and import them from an Amazon Simple Storage Service (Amazon S3) bucket.

AWS Panorama Context

Now that we grasp the concepts, let’s get our hands on.

Unboxing Your AWS Panorama Appliance
In the box the service team sent me, I found the appliance itself (no surprise!), a power cord and two ethernet cables. The box also contains a USB key to initially configure the appliance. The device is designed to work in industrial environments. It has two ethernet ports next to the power connector on the back. On the front, protected behind a sliding door, I found a SD card reader, one HDMI connector and two USB ports. There is also a power button and a reset button to reinitialise the device to its factory state.

AWS Panorama Appliance Front Side AWS Panorama Appliance Back Side AWS Panorama USB key

Configuring Your Appliance
I first configured it for my network (cable + DHCP, but it also supports static IP configuration) and registered it to securely connect back to my AWS Account. To do so, I navigated to the AWS Management Console, entered my network configuration details. It generated a set of configuration files and certificates. I copied them to the appliance using the provided USB key. My colleague Martin Beeby shared screenshots of this process. The team slightly modified the screens based on the feedback they received during the preview, but I don’t think it is worth going through the step-by-step process again. Tip from the field: be sure to use the USB key provided in the box, it is correctly formatted and automatically recognised by the appliance (my own USB key was not recognized properly).

I then downloaded a sample application from the Panorama GitHub repository and tried it with the Test Utility for Panorama, also available on this GitHub (the test utility is an EC2 instance configured to act as a simulator). The Test Utility for Panorama uses Jupyter notebooks to quickly experiment with sample applications or your code before deploying it to the appliance. It also lists commands allowing you to deploy your applications to the appliance programmatically.

Panorama Command Line
The Panorama command line simplifies the operations to create a project, import assets, package it, and deploy it to the AWS Panorama Appliance. You can follow these instructions to download and install the Panorama command line.

When receiving an application developed by someone else, like the sample application, I have to replace AWS account IDs in all application files and directory names. I do this with one single command:

panorama-cli import-application

Application Structure
A Panorama application structure looks as follows:

├── assets
├── graphs
│   └── example_project
│       └── graph.json
└── packages
    ├── accountXYZ-model-1.0
    │   ├── descriptor.json
    │   └── package.json
    └── accountXYZ-sample-app-1.0
        ├── Dockerfile
        ├── descriptor.json
        ├── package.json
        └── src
            └── app.py

  • graph.json lists all the packages and nodes in this application. Nodes are the way to define an application in Panorama.
  • in each package package.json has details about the package and the assets it uses.
  • model package model has a descriptor.json which contains the metadata required for compiling the model.
  • container packagesample-app package contains the application code in the src directory and a Dockerfile to build the container. descriptor.json has details about which command and file to use when the container is launched.
  • assets directory is where all the assets reside, such as packaged code and compiled models. You should not make any changes in this directory.

Note that package names are prefixed with your account number.

When my application is ready, I build the container (I am using a Linux machine with Docker Engine and Docker CLI to avoid using Docker Desktop for macOS or Windows.)

$ panorama-cli build-container                               \
               --container-asset-name {container_asset_name} \ 
               --package-path packages/{account_id}-{package_name}-1.0 

A Note About the Cameras
AWS Panorama Appliance has a concept of “abstract cameras”. Abstract camera sources are placeholders that can be mapped to actual camera devices during application deployment. The Test Utility for Panorama allows you to map abstract cameras to video files for easy, repeatable tests.

Adding a ML Model
The AWS Panorama Appliance supports multiple ML Model frameworks. Models may be trained on Amazon SageMaker or any other solution of your choice. I downloaded my ML model from S3 and import it to my project:

panorama-cli add-raw-model                                                 \
    --model-asset-name {asset_name}                                        \
    --model-s3-uri s3://{S3_BUCKET}/{project_name}/{ML_MODEL_FNAME}.tar.gz \
    --descriptor-path {descriptor_path}                                    \
    --packages-path {package_path}

Behind the scenes, ML Models are compiled to optimise them to the Nvidia Accelerated Linux Arm64 architecture of the AWS Panorama Appliance.

Package the Application
Now that I have a ML model and my application code packaged in a container, I am ready to package my application assets for AWS Panorama Appliance:

panorama-cli package-application

This command uploads all my application assets to the AWS cloud account along with all the manifests.

Deploy the Application
Finally I deploy the application to the AWS Panorama Appliance. A deployment copies the application and its configuration, like camera stream selection, from the AWS cloud to my on-premise AWS Panorama Appliance. I may deploy my application programmatically using Python code (and the Boto3 SDK you might know already):


client = boto3.client('panorama')
client.create_application_instance(
    Name="AWS News Blog Sample Application",
    Description="An object detection app",
    ManifestPayload={
       'PayloadData': manifest         # <== this is the graph.json file content 
    },
    RuntimeRoleArn=role,               # <== this is a role that gives my app permissions to use AWS Services such as Cloudwatch
    DefaultRuntimeContextDevice=device # <== this is my device name 
)

Alternatively, I may use the AWS Management Console:

On Deployed applications, I select Deploy application.

AWS Panorama - Start the deployment

I copy and paste the content of graphs/<project name>/graph.json to the console and select Next.

AWS Panorama - Copy Graph JSON

I give my application a name and an optional description. I select Proceed to deploy.

AWS Panoram Deploy - Application Name

The next steps are

  • declare an IAM role to give permissions to my application to use AWS Service. The minimal permissions set allows to call the PuMetricData API on CloudWatch.
  • select the AWS Panorama Appliance I want to deploy to
  • map the abstract cameras defined in the application descriptors.json to physical cameras known by the AWS Panorama Appliance
  • fill in any application-specific inputs, such as acceptable threshold value, log level etc.

An example IAM policy is

AWSTemplateFormatVersion: '2010-09-09'
Description: Resources for an AWS Panorama application.
Resources:
  runtimeRole:
    Type: AWS::IAM::Role
    Properties:
      AssumeRolePolicyDocument:
        Version: "2012-10-17"
        Statement:
          -
            Effect: Allow
            Principal:
              Service:
                - panorama.amazonaws.com
            Action:
              - sts:AssumeRole
      Policies:
        - PolicyName: cloudwatch-putmetrics
          PolicyDocument:
            Version: 2012-10-17
            Statement:
              - Effect: Allow
                Action: 'cloudwatch:PutMetricData'
                Resource: '*'
      Path: /service-role/

These six screenhots capture this process:

AWS Panorama - Deploy 2 AWS Panorama - Deploy 1 AWS Panorama - Deploy 3
AWS Panorama - Deploy 4 AWS Panorama - Deploy 5 AWS Panorama - Deploy 5

The deployment takes 15-30 minutes depending on the size of your code and your ML models, and the appliance available bandwidth. Eventually, the status turn green to “Running”.

AWS Panorama - Deployment Completed

Once the application is deployed to your AWS Panorama Appliance it begins to run, continuously analyzing video and generating highly accurate predictions locally within milliseconds. I connect an HDMI cable to the AWS Panorama Appliance to monitor the output, and I can see:

AWS Panorama HDMI output

Should anything goes wrong during the deployment or during the life of the application, I have access to the logs on Amazon CloudWatch. There are two log streams created, one for the AWS Panorama Appliance itself and one for the application.

AWS Panorama Appliance log AWS Panorama application log

Pricing and Availability
The AWS Panorama Appliance is available to purchase at AWS Elemental order page in the AWS Console. You can place orders from the United States, Canada, the United Kingdom, and the European Union. There is a one-time charge of $4,000 for the appliance itself.

There is a usage charge of $8.33 / month / camera feed.

AWS Panorama stores versioned copies of all assets deployed to the AWS Panorama Appliance (including ML models and business logic) in the cloud. You are charged $0.10 per-GB, per-month for this storage.

You may incur additional charges if the business logic deployed to your AWS Panorama Appliance uses other AWS services. For example, if your business logic uploads ML predictions to S3 for offline analysis, you will be billed separately by S3 for any storage charges incurred.

The AWS Panorama Appliance can be installed anywhere. The appliance connects back to the AWS Panorama service in the AWS cloud in one of the following AWS Region : US East (N. Virginia), US West (Oregon), Canada (Central), or Europe (Ireland).

Go and build your first computer vision model today.

— seb

Amazon EC2 Auto Scaling will no longer add support for new EC2 features to Launch Configurations

Post Syndicated from Pranaya Anshu original https://aws.amazon.com/blogs/compute/amazon-ec2-auto-scaling-will-no-longer-add-support-for-new-ec2-features-to-launch-configurations/

This post is written by Scott Horsfield, Principal Solutions Architect, EC2 Scalability and Surabhi Agarwal, Sr. Product Manager, EC2.

In 2010, AWS released launch configurations as a way to define the parameters of instances launched by EC2 Auto Scaling groups. In 2017, AWS released launch templates, the successor of launch configurations, as a way to streamline and simplify the launch process for Auto Scaling, Spot Fleet, Amazon EC2 Spot Instances, and On-Demand Instances. Launch templates define the steps required to create an instance, by capturing instance parameters in a resource that can be used across multiple services. Launch configurations have continued to live alongside launch templates but haven’t benefitted from all of the features we’ve added to launch templates.

Today, AWS is recommending that customers using launch configurations migrate to launch templates. We will continue to support and maintain launch configurations, but we will not be adding any new features to them. We will focus on adding new EC2 features to launch templates only. You can continue using launch configurations, and AWS is committed to supporting applications you have already built using them, but in order for you to take advantage of our most recent and upcoming releases, a migration to launch templates is recommended. Additionally, we plan to no longer support new instance types with launch configurations by the end of 2022. Our goal is to have all customers moved over to launch templates by then.

Moving to launch templates is simple to accomplish and can be done easily today. In this blog, we provide more details on how you can transition from launch configurations to launch templates. If you are unable to transition to launch templates due to lack of tooling or specific functions, or have any concerns, please contact AWS Support.

Launch templates vs. launch configurations

Launch configurations have been a part of Amazon EC2 Auto Scaling Groups since 2010. Customers use launch configurations to define Auto Scaling group configurations that include AMI and instance type definition. In 2017, AWS released launch templates, which reduce the number of steps required to create an instance by capturing all launch parameters within one resource that can be used across multiple services. Since then, AWS has released many new features such as Mixed Instance Policies with Auto Scaling groups, Targeted Capacity Reservations, and unlimited mode for burstable performance instances that only work with launch templates.

Launch templates provide several key benefits to customers, when compared to launch configurations, that can improve the availability and optimization of the workloads you host in Auto Scaling groups and allow you to access the full set of EC2 features when launching instances in an Auto Scaling group.

Some of the key benefits of launch templates when used with Auto Scaling groups include:

How to determine where you are using launch configurations

Use the Launch Configuration Inventory Script to find all of the launch configurations in your account. You can use this script to generate an inventory of launch configurations across all regions in a single account or all accounts in your AWS Organization.

The script can be run with a variety of options for different levels of account access. You can learn more about these options in this GitHub post. In its simplest form it will use the default credentials profile to inventory launch configurations across all regions in a single account.

Screenshot of Launch Configuration Inventory script

Once the script has completed, you can view the generated inventory.csv file to get a sense of how many launch configurations may need to be converted to launch templates or deleted.

Screenshot of script

How to transition to launch templates today

If you’re ready to move to launch templates now, making the transition is simple and mostly automated through the AWS Management Console. For customers who do not use the AWS Management Console, most popular Infrastructure as Code (IaC), such as CloudFormation and Terraform, already support launch templates, as do the AWS CLI and SDKs.

To perform this transition, you will need to ensure that your user has the required permissions.

Here are some examples to get you started.

AWS Management Console

  1. Open the EC2 Launch Configuration console. You must sign in if you are not already authenticated.
  2. From the Launch Configuration console, click on the Copy to launch template button and select Copy all.
    1. Alternatively, you can select individual launch configurations, and use the Copy selected option to selectively copy certain launch configurations.copy to launch template screenshot
  1. Review the list of templates and click on the Copy button when you’re ready to proceed.3. Review the list of templates and click on the Copy button when you’re ready to proceed.
  1. Once the copy process has completed, you can close the wizard.

4. Once the copy process has completed, you can close the wizard.

  1. Navigate to the EC2 Launch Template console to view your newly created launch templates.5. Navigate to the EC2 Launch Template console to view your newly created launch templates.
  1. Your launch templates are now ready to replace launch configurations in your Auto Scaling group configuration. Navigate to the Auto Scaling group console, select your Auto Scaling group, and click on the Edit.

. Navigate to the Auto Scaling group console, select your Auto Scaling group, and click on the Edit button.

  1. Next, scroll down to the Launch configuration section, and click Switch to launch template.7. Next, scroll down to the Launch configuration section, and click Switch to launch template.
  1. Select your newly created Launch template, review and confirm your configuration, and when ready scroll down to the bottom of the page and click the Update button.when ready scroll down to the bottom of the page and click the Update button.
  2. Now that you’ve migrated your launch configurations to launch templates you can prevent users from creating new launch configurations by updating their IAM permissions to deny the autoscaling:CreateLaunchConfiguration action.

Instances launched by this Auto Scaling group continue to run and are not automatically be replaced by making this change. Any instance launched after making this change uses the launch template for its configuration. As your Auto Scaling group scales up and down, the older instances are replaced. If you’d like to force an update, you can use Instance Refresh to ensure that all instances are running the same launch template and version.

CloudFormation and Terraform

If you use CloudFormation to create and manage your infrastructure, you should use the AWS::EC2::LaunchTemplate resource to create launch templates. After adding a launch template resource to your CloudFormation stack template file update your Auto Scaling group resource definition by adding a LaunchTemplate property and removing the existing LaunchConfigurationName property. We have several examples available to help you get started.

Using launch templates with Terraform is a similar process. Update your template file to include a aws_launch_template resource and then update your aws_autoscaling_group resources to reference the launch template.

In addition to making these changes, you may also want to consider adding a MixedInstancesPolicy to your Auto Scaling group. A MixedInstancesPolicy allows you to configure your Auto Scaling group with multiple instance types and purchase options. This helps improve the availability and optimization of your applications. Some examples of these benefits include using Spot Instances and On-Demand Instances within the same Auto Scaling group, combining CPU architectures such as Intel, AMD, and ARM (Graviton2), and having multiple instance types configured in case of a temporary capacity issue.

You can generate and configure example templates for CloudFormation and Terraform in the AWS Management Console.

AWS CLI

If you’re using the AWS CLI to create and manage your Auto Scaling groups, these examples will show you how to accomplish common tasks when using launch templates.

SDKs

AWS SDKs already include APIs for creating launch templates. If you’re using one of our SDKs to create and configure your Auto Scaling groups, you can find more information in the SDK documentation for your language of choice.

Next steps

We’re excited to help you take advantage of the latest EC2 features by making the transition to launch templates as seamless as possible. As we make this transition together, we’re here to help and will continue to communicate our plans and timelines for this transition. If you are unable to transition to launch templates due to lack of tooling or functionalities or have any concerns, please contact AWS Support. Also, stay tuned for more information on tools to help make this transition easier for you.

Crash CORS: A Guide for Using CORS

Post Syndicated from Molly Clancy original https://www.backblaze.com/blog/crash-cors-a-guide-for-using-cors/

The dreaded CORS error is the bane of many a web developer’s day-to-day life. Even for experts, it can be eternally frustrating. Today, we’re digging into CORS, starting with the basics and working up to sharing specific code samples to help you enable CORS for your web development project. What is CORS? Why do you need it? And how can you enable it to save time and resources?

We’ll answer those questions so you can put the CORS bane behind you.

What Is CORS?

CORS stands for cross-origin resource sharing. To define CORS, we first need to explain its counterpoint—the same-origin policy, or SOP. The SOP is a policy that all modern web browsers use for security purposes, and it dictates that a web address with a given origin can only request data from the same origin. CORS is a mechanism that allows you to bypass the SOP so you can request data from websites with different origins.

Let’s break that down piece by piece, then we’ll get into why you’d want to bypass the same-origin policy in the first place.

What Is an Origin?

All websites have an origin, and it is defined by the protocol, domain, and port of its URL.

You’re probably familiar with the working parts of a URL, but they each have a different function. The protocol, also known as the scheme, identifies the method for exchanging data. Typical protocols are http, https, or mailto. The domain, also known as the hostname, is a specific webpage’s unique identifier. You may not be as familiar with the port as it’s not normally visible in a typical web address. Just like a port on the water, it’s the connection point where information comes in and out of a server. Different port numbers specify the types of information the port handles.

When you understand what an origin is, the “cross-origin” part of CORS makes a bit more sense. It simply means web addresses with different origins. In web addresses with the same origin, the protocol, domain, and port all match.

What Is the Same-origin Policy?

The same-origin policy was developed and implemented as a security measure against a specific website vulnerability that was discovered and exploited in the 2000s. Before the same-origin policy was in place, bad actors could use cookies stored in people’s browsers to make requests to other websites illicitly. This is known as cross-site request forgery, or CSRF, pronounced “sea surf.” It’s also known as “session riding.” Tubular.

Let’s say you log in to Netflix on your laptop to add Ridley Scott’s 1982 classic, “Blade Runner” to your queue, as one does. You click “Remember Me” so you don’t have to log in every time, and your browser keeps your credentials stored in a cookie so that the Netflix site knows you are logged in no matter where you navigate within their site.

Afterwards, you’re bored, so you fall down an internet rabbit hole wondering why “Blade Runner” is called “Blade Runner” when there are few blades and little running. You end up on a site about samurai swords that happens to be malicious—it has a script in its code that uses your authentication credentials stored in that cookie to make a request to Netflix that can change your address and add a bunch of DVDs to your queue (also, it’s 2006, and this actually happened). You’ve become a victim of cross-site request forgery.

To thwart this threat, browsers enabled the same-origin policy to prohibit requests from one origin to another.

Why Do You Need CORS?

While the same-origin policy helped stop bad actors from nefariously accessing websites, it posed a problem—sometimes you need or want assets and data from different origins. This is where the “resource sharing” part of cross-origin resource sharing comes in.

CORS allows you to set rules governing which origins are allowed to bypass the same-origin policy so you can share resources from those origins.

For example, you might host your website’s front end at www.catblaze.com, but you host your back-end API at api.catblaze.com. Or, you might need to display a bunch of cat videos stored in Backblaze B2 Cloud Storage on your website, www.catblaze.com (more on that below).

Do I Need CORS?

Let’s say you have a website, and you dabble in some coding. You’re probably thinking, “I can already use images and stuff from other websites. Do I need CORS?” And you’re right to ask. Most browsers allow simple http requests like get, head, and post without requiring CORS rules to be set in advance. Embedding images from other sites, for example, typically requires a get request to grab that data from a different origin. If that’s all you need, you’re good to go. You can use simple requests to embed images and other data from other websites without worrying about CORS.

But some assets, like fonts or iframes, might not work—then, you can use CORS—but if you’re a casual user, you can probably stop here.

Coding Explainer: What Is an http Request?

An http request is the way you, the client, use code to talk to a server. A complete http request includes a request line, request headers, and a message body if necessary. The request line specifies the method of the request. There are generally eight types:

  • get: “I want something from the server.”
  • head: “I want something from the server, but only give me the headers, not the content.”
  • post: “I want to send something to the server.”
  • put: “I want to send something to the server that replaces something else.”
  • delete: …self-explanatory.
  • patch: “I want to change something on the server.”
  • options: “Is this request going to go through?” (This one is important for CORS!)
  • trace: “Show me what you just did.” Useful for debugging.

After the method, the request line also specifies the path of the URL the method applies to as well as the http version.

The request headers communicate some specifics around how you want to receive the information. There are usually a whole bunch of these. (Wikipedia has a good list.) They’re typically formatted thusly: name:value. For example:

accept:text/plain means you want the response to be in text format.

Finally, the message body contains anything you might want to send. For example, if you use the method post, the message body would contain what you want to post.

Do I Need CORS With Cloud Storage?

People use cloud storage for all manner of data storage purposes, and most do not need to use CORS to access resources stored in a cloud instance. For example, you can make API calls to Backblaze B2 from any computer to use the resources you have stored in your storage buckets. If you’re running a mobile application and transferring data back and forth to Backblaze B2, for instance, you don’t need CORS. The mobile application doesn’t rely on a web browser.

You only need CORS if you’re specifically running code inside of a web browser and you need to make API calls from the browser to Backblaze B2. For example, if you’re using an in-browser video player and want to play videos stored in Backblaze B2.

Fortunately, if you do need CORS, Backblaze B2 allows you to configure CORS to your exact specifications while other cloud providers may have completely open CORS policies. Why is that important? An open CORS policy makes you vulnerable to CSRF attacks. To continue with the video example, let’s say you’re storing a bunch of videos that you want to make available on your website. If they’re stored with a cloud provider that has an open CORS policy, you have two choices—open or closed. You pick open so that your website visitors can call up those videos on demand, but that leaves you vulnerable to a CSRF that could allow a bad actor to download your videos. With Backblaze, you can specify the exact CORS rules you need.

If you are using Backblaze B2 to store data that will be displayed in a browser, or you’re just curious, read on to learn more about using CORS. CORS has saved developers lots of time and money by reducing maintenance effort and code complexity.

How Does CORS Work?

Unlike simple get, head, and post requests, some types of requests can alter the origin’s data. These include requests like delete, put, and patch. Any type of request that could alter the origin’s data will trigger CORS, as will simple requests that have non-standard http headers or requests in certain programming languages like AJAX. When CORS is triggered, the browser sends what’s called a preflight request to see if the CORS rules allow the request.

What Is a Preflight Request?

A preflight request, also known as an options request, asks the server if it’s okay to make the CORS request. If the preflight request comes back successfully, then the browser will complete the actual request. Few other systems in computing do this by default, so it’s important to understand when using CORS.

A preflight request has the following headers:

  • origin: Identifies the origin from which the CORS request originates.
  • access-control-request-method: Identifies the method of the CORS request.
  • access-control-request-headers: Lists the headers that will be included in the CORS request.

The web server then responds with the following headers:

  • access-control-allow-origin: Confirms the origin is allowed.
  • access-control-allow-method: Confirms the methods are allowed.
  • access-control-allow-headers: Confirms the headers are allowed.

The values that follow these headers must match the values specified in the preflight request. If so, the browser will permit the actual CORS request to come through.

Setting CORS Up: An Example

To provide an example for setting CORS up, we’ll use Backblaze B2. By default, the Backblaze B2 servers will say “no” to preflight requests. Adding CORS rules to your bucket tells Backblaze B2 which preflight requests to approve. You can enable CORS in the Backblaze B2 UI if you only need to allow one, specific origin or if you want to be able to share the bucket with all origins.

Click the CORS rules link to configure CORS.
In the CORS rules pop-up, you can choose how you want to configure CORS rules.

If you need more specificity than that, you can select the option for custom rules and use the Backblaze B2 command line tool.

When a CORS preflight or cross-origin download is requested, Backblaze B2 evaluates the CORS rules on the file’s bucket. Rules may be set at the time you create the bucket with b2_create_bucket or updated on an existing bucket using b2_update_bucket.

CORS rules only affect Backblaze B2 operations in their “allowedOperations” list. Every rule must specify at least one in their allowedOperations.

CORS Rule Structure

Each CORS rule may have the following parameters:

Required:

  • corsRuleName: A name that humans can recognize to identify the rule.
  • allowedOrigins: A list of the origins you want to allow.
  • allowedOperations: A list that specifies the operations you want to allow, including:
    • B2 Native API Operations:
    • B2_download_file_by_name
    • B2_download_file_by_id
    • B2_upload_file
    • B2_upload_part
    • S3 Compatible Operations:
    • S3_delete
    • S3_get
    • S3_head
    • S3_post
    • S3_put

Optional:

  • allowedHeaders: A list of headers that are allowed in a preflight request’s Access-Control-Request-Headers value.
  • exposeHeaders: A list of headers that may be exposed to an application inside the client.
  • maxAgeSeconds: The maximum number of seconds that a browser can cache the response to a preflight request.

The following sample configuration allows downloads, including range requests, from any https origin and will tell browsers that it’s okay to expose the ‘x-bz-content-sha1’ header to the web page.

[
{
"corsRuleName": "downloadFromAnyOrigin",
"allowedOrigins": [
"https"
],
"allowedHeaders": ["range"],
"allowedOperations": [
"b2_download_file_by_id",
"b2_download_file_by_name"
],
"exposeHeaders": ["x-bz-content-sha1"],
"maxAgeSeconds": 3600
}
]

You may add up to 100 CORS rules to each of your buckets. Backblaze B2 uses the first rule that matches the request. A CORS preflight request matches a rule if the origin header matches one of the rule’s allowedOrigins, if the operation is in the rule’s allowedOperations, and if every value in the Access-Control-Request-Headers is in the rule’s allowedHeaders.

Using CORS: Examples in Action

Using your browser’s console, you can copy and paste the following examples to see CORS requests succeed or fail. As a handy guide for you, the text files we’ll be requesting include the bucket configuration of the Backblaze B2 buckets we’re calling.

In the first example, we’ll make a request to get the text file bucket_info.txt from a bucket named “cors-allow-none” that does not allow CORS requests:

fetch(
'https://f000.backblazeb2.com/file/cors-allow-none/bucket_info.txt',
{
method: 'GET'
}
).then(resp => resp.text()).then(console.log)

As you can see, this request returns a CORS error:

Next, we’ll try the same request on a bucket named “cors-allow-all” that allows CORS with any origin, but only specific headers.

fetch(
'https://f000.backblazeb2.com/file/cors-allow-all/bucket_info.txt',
{
method: 'GET'
}
).then(resp => resp.text()).then(console.log)

When you run the code, you will see some text output to the console indicating that, indeed, the bucket allows CORS with all origins, but specific headers:

We didn’t include any headers in our request, so the request was successful and the text file we wanted—bucket_info.txt—appears below the text output in the console. As you can see in the text output, the bucket is configured with an asterisk “*,” also known as a “wildcard,” to allow all origins (more on that later).

Next, we’ll try the same thing on the bucket that allows CORS with all origins, but this time triggers a pre-flight check for a header that is not allowed:

fetch(
'https://f000.backblazeb2.com/file/cors-allow-all/bucket_info.txt',
{
method: 'GET',
headers: { 'X-Fake-Header': 'breaking-cors-for-fun' }
}
).then(resp => resp.text()).then(console.log)

Our bucket is configured to only allow the headers authorization and range, but we’ve included the header X-Fake-Header with the value breaking-cors-for-fun—definitely not allowed—in the request.

When we run this request, we can see another type of failure:

Below the request, but above the CORS errors, you’ll see that the browser sent an options request. As we mentioned earlier, this is the pre-flight request that asks the server if it’s okay to make the get request. In this case, the pre-flight request failed.

However, this request will succeed if we change our bucket settings to allow all headers.

fetch(
'https://f000.backblazeb2.com/file/cors-allow-all/bucket_info.txt',
{
method: 'GET',
headers: { 'X-Fake-Header': 'breaking-cors-for-fun' }
}
).then(resp => resp.text()).then(console.log)

Below, you can see the text output “This bucket allows CORS with all origins and any header values.”

The request was successful, and the text file we requested appears in the console.

At this point, it’s important to note that when configuring your own buckets, you should use caution when using the wildcard “*” to allow any origin or header. It’s probably best to avoid the wildcard if possible. It’s okay to allow any origin to access your bucket, but, if so, you’ll probably want to enumerate the headers that matter to avoid CSRF attacks.

For more information on using CORS with Backblaze B2, including some tips on using CORS with the Backblaze S3 Compatible API, check out our documentation here.

Stay on CORS

Ah, another inevitable CORS pun. Did you see it coming? I hope so. In conclusion, here are a few things to remember about CORS and how you can use it to avoid CORS errors in the future:

  • The same-origin policy was developed to make websites less vulnerable to threats, and it prevents requests between websites with different origins.
  • CORS bypasses the same-origin policy so that you can share and use data from different origins.
  • You only need to configure CORS rules for your Backblaze B2 data if you are making calls to Backblaze B2 from code within a web browser.
  • By setting CORS rules, you can specify which origins are allowed to request data from your Backblaze B2 buckets.

Are you using CORS? Do you have any other questions? Let us know in the comments.

The post Crash CORS: A Guide for Using CORS appeared first on Backblaze Blog | Cloud Storage & Cloud Backup.

Security updates for Wednesday

Post Syndicated from original https://lwn.net/Articles/873462/rss

Security updates have been issued by Debian (ffmpeg, smarty3, and strongswan), Fedora (udisks2), openSUSE (flatpak, strongswan, util-linux, and xstream), Oracle (redis:5), Red Hat (java-1.8.0-openjdk, java-11-openjdk, openvswitch2.11, redis:5, redis:6, and rh-redis5-redis), SUSE (flatpak, python-Pygments, python3, strongswan, util-linux, and xstream), and Ubuntu (linux, linux-aws, linux-aws-5.11, linux-azure, linux-azure-5.11, linux-gcp, linux-gcp-5.11, linux-hwe-5.11, linux-kvm, linux-raspi and strongswan).

The collective thoughts of the interwebz