How to Back Up Yahoo and AOL Data

Post Syndicated from Barry Kaufman original https://www.backblaze.com/blog/how-to-back-up-yahoo-and-aol-data/

In case you missed it, we recently showed you how to back up your old email accounts, focusing on Outlook emails and Gmail. But what of those of us who remember the Wild Wild West days of the internet? Some of us have decades worth of emails gathering digital dust in AOL and Yahoo inboxes, and we want to back those up as well.

Let’s go through preserving these vintage emails with a little walk down memory lane.
The year was 1994. The White House had just launched its very first website; Katie Couric was famously asking, “What is the internet?” on the “Today” show; and everywhere, there was the sense that this so-called “information superhighway” might just be here to stay.

And one blog writer had just signed up for his very first America Online email address. Lured by the promises contained within each CD that arrived in his mailbox and welcomed to the digital ether by the screeching cacophony of a blazing fast 14.4K modem, he began his journey on the internet.

Looking back on those times now, I’m suddenly realizing what a time capsule I inadvertently created in my AOL inbox. The first emails I ever sent to high school friends after they went to college. Those first awkward exchanges between myself and my wife. My first dozen or so rejection letters from employers as I entered the “real world.” All locked up behind a password that I set when I was just 14.

These memories are too precious to trust to my AOL inbox, so as I look back on my digital life so far, I realize I need to preserve those moments in a backup I can trust. Join me, as I back up both my AOL and Yahoo accounts, savoring the embarrassing memories along the way.

How to Back Up Your Digital Life

Check out our series of guides to help you protect content across many different platforms—including social media, sync services, and more. This list is always a work in progress—please comment below if you’d like to see another platform covered.

How to Download Yahoo Data

We’ll start with my Yahoo Account, which should be easy since I only ever used this email address as a way to sign up for things online that I didn’t necessarily want tied to my main inbox. And since the message board for fans of the FX drama “The Shield” that I signed up for with this address has long since folded, my inbox currently sits empty. (It’s even free of spam, which is pretty impressive.)

So, I’ll simply send myself an email from an address I do use to get the ball rolling.

All I need to do is send myself my credit card number to secure my lottery winnings!

Step One: Finding Your Data

All of your Yahoo data can be found in your Privacy Dashboard, which can be tricky to find using the menus Yahoo offers, so we’ll just cut to the chase and give you the link.

This page gives you a few options, but when it comes to your inbox, it’s not as straightforward as simply downloading an MBOX file. Yahoo only gives you the option of configuring an Outlook, Mac Mail, or Thunderbird inbox using IMAP, downloading all of your data to a third-party app which you can then use to store your emails as files.

You can also use the links on the previous screen to download individual elements of your Yahoo account, from contacts and email preferences to usage and activity. However, Yahoo forces you to send a request to download this data, which they warn can take up to 30 days.

Two emails?! Look at Mr. Popularity over here.

Step Two: Getting Your Data

Your mileage may vary, but the gist of what you want to do here is to set your third-party inbox to download and store your Yahoo emails. To do that, simply configure your IMAP settings to:

Incoming Mail (IMAP) Server
Server: export.imap.mail.yahoo.com
Port: 993
Requires SSL: Yes

Outgoing Mail (SMTP) Server
Server: smtp.mail.yahoo.com
Port: 465 or 587
Requires SSL: Yes
Requires authentication: Yes

Every email client is different, but if you’re using Outlook you can find the steps to download your emails in our previous post.

How to Download AOL Data

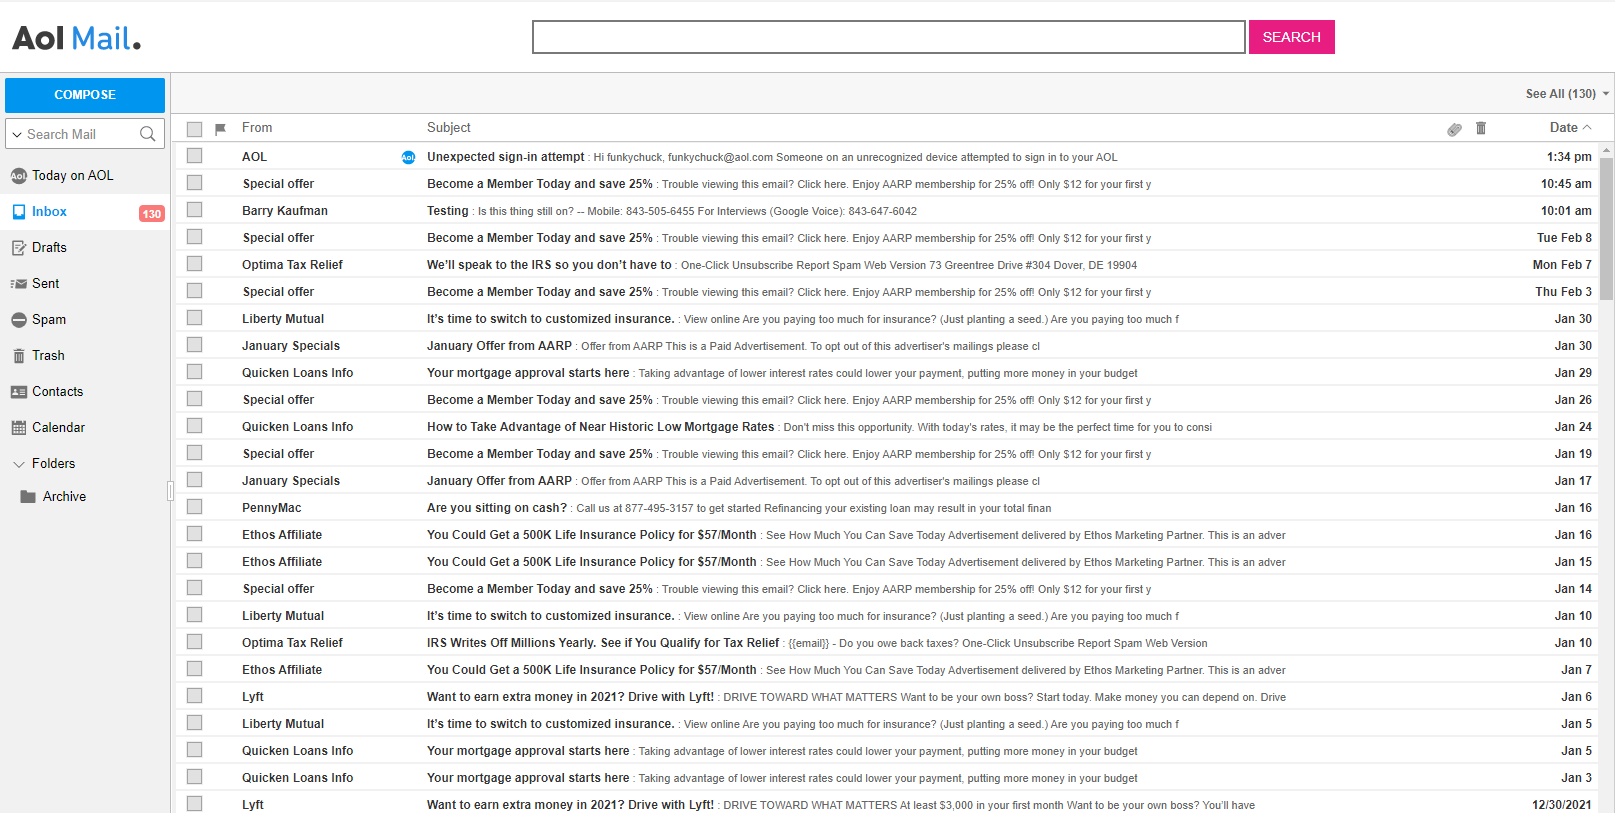
Much to my dismay, when I logged onto my AOL account I found that all of my old emails, nearly 30 years of correspondence, were simply gone. Ah well, it’s hard to blame AOL for clearing up some space. After all, by my reckoning it had been at least 10 years since I opened this inbox. But it certainly underscores the need for backups, right?

My high school friends may not email me anymore, but the spammers do. The spammers never forget about me.

Regardless, I do have 130 emails in there so I can at least walk you through how you’d go about downloading them. Now there is always the print to PDF method, outlined in our previous post, which would certainly work here for individual emails. But if you’re looking to do a mass backup, fortunately you are not alone. Enough people have faced the same situation that a company called SysTools created an app specifically for backing up AOL emails.

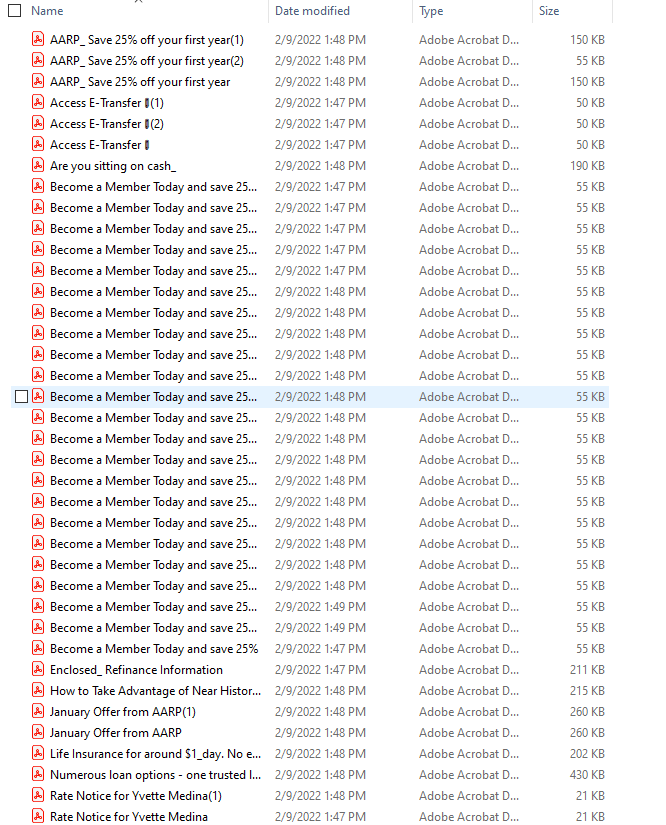
Simply download the app, then either log in using your AOL credentials or by generating a one-time app password from your Account Security settings. The free version of the software will back up 100 emails, but you can purchase a license for $49 if you need to back up more. Whichever works for you, once you’re in, you’ll have four different email file formats to choose from: .EML, .MSG, .MBOX or .PST. You can also choose to save your emails as PDFs so they can be viewed across platforms.

Ah, all those precious memories, preserved forever.

And now we have all the emails in our inbox, saved on our computer in whichever file format floats our inbox, and we’re ready to move on to the next step. Your computer is just as fallible as AOL, and probably more so, so it’s time to move these into the cloud.

Backing Up Emails: To Sync or Not?

Now that we’ve rescued our emails from the digital ether, it’s time to put them somewhere a little more secure. If you use an automated backup service like Backblaze Personal Backup (and let’s be honest, you should), then it will be a pretty straightforward process consisting of two steps:

Step one: Do nothing.

Step two: Continue to do nothing, because Backblaze Personal Backup already did it for you.

Pretty easy, right?

If you want to keep archival data on the computer you use every day, you can of course use Backblaze B2 Cloud Storage to archive data. Check out our post here for all the nitty-gritty.

The post How to Back Up Yahoo and AOL Data appeared first on Backblaze Blog | Cloud Storage & Cloud Backup.

New US Law to Require Cyber Incident Reports

Post Syndicated from Harley Geiger original https://blog.rapid7.com/2022/03/10/new-us-laws-to-require-cyber-incident-reports/

New US Law to Require Cyber Incident Reports

On March 9, 2022, the US Congress passed the Cyber Incident Reporting for Critical Infrastructure Act of 2022. Once signed by the President, it will become law. The law will require critical infrastructure owners and operators to report cyber incidents and ransomware payments. The legislation was developed in the wake of the SolarWinds supply chain attack and recently gained additional momentum from the Russia-Ukraine conflict. This post will walk through highlights from the law.

Rapid7 supports efforts to increase transparency and information sharing in order to strengthen awareness of the cybersecurity threat landscape and prepare for cyberattacks. We applaud passage of the Cyber Incident Reporting for Critical Infrastructure Act.

What’s this law about?

The Cyber Incident Reporting for Critical Infrastructure Act will require critical infrastructure owners and operators — such as water and energy utilities, health care organizations, some IT providers, etc. — to submit reports to the Cybersecurity and Infrastructure Security Agency (CISA) for cybersecurity incidents and ransomware payments. The law will provide liability protections for submitting reports to encourage compliance, but noncompliance can result in a civil lawsuit. The law will also require the government to analyze, anonymize, and share information from the reports to provide agencies, Congress, companies, and the public with a better view of the cyber threat landscape.

An important note about the timeline: The requirements do not take effect until CISA issues a clarifying regulation. The law will require CISA to issue this regulation within 42 months (though CISA may take less time), so the requirements may not be imminent. In the meantime, the Cyber Incident Reporting for Critical Infrastructure Act provides information on what CISA’s future rule must address.

We detail these items from the law below.

Requiring reporting of cyber incidents and ransom payments

  • Report requirement. Critical infrastructure owners and operators must report substantial cybersecurity incidents to CISA, as well as any ransom payments. (However, as described below, this requirement does not come into effect until CISA issues a regulation.)
  • Type of incident. The types of cyber incidents that must be reported shall include actual breaches of sensitive information and attacks that disrupt business or operations. Mere threats or failed attacks do not need to be reported.
  • Report timeline. For a cyber incident, the report must be submitted within 72 hours after the affected organization determines the incident is substantial enough that it must be reported. For ransom payments, the report must be submitted within 24 hours after the payment is made.
  • Report contents. The reports must include a list of information, including attacker tactics and techniques. Information related to the incident must be preserved until the incident is fully resolved.
  • Enforcement. If an entity does not comply with reporting requirements, CISA may issue a subpoena to compel entities to produce the required information. The Justice Department may initiate a civil lawsuit to enforce the subpoena. Entities that do not comply with the subpoena may be found in contempt of court.

CISA rule to fill in details

  • Rule requirement. CISA is required to issue a regulation that will establish details on the reporting requirements. The reporting requirements do not take effect until this regulation is final.
  • Rule timeline. CISA has up to 42 months to finalize the rule (but the agency can choose to take less time).
  • Rule contents. The rule will establish the types of cyber incidents that must be reported, the types of critical infrastructure entities that must report, the content to be included in the reports, the mechanism for submitting the reports, and the details for preserving data related to the reports.

Protections for submitting reports

  • Not used for regulation. Reports submitted to CISA cannot be used to regulate the activities of the entity that submitted the report.
  • Privileges preserved. The covered entity may designate the reports as commercial and proprietary information. Submission of a report shall not be considered a waiver of any privilege or legal protection.
  • No liability for submitting. No court may maintain a cause of action against any person or entity on the sole basis of submitting a report in compliance with this law.
  • Cannot be used as evidence. Reports, and material used to prepare the reports, cannot be received as evidence or used in discovery proceedings in any federal or state court or regulatory body.

What the government will do with the report information

  • Authorized purposes. The federal government may use the information in the reports cybersecurity purposes, responding to safety or serious economic threats, and preventing child exploitation.
  • Rapid response. For reports on ongoing threats, CISA must rapidly disseminate cyber threat indicators and defensive measures with stakeholders.
  • Information sharing. CISA must analyze reports and share information with other federal agencies, Congress, private sector stakeholders, and the public. CISA’s information sharing must include assessment of the effectiveness of security controls, adversary tactics and techniques, and the national cyber threat landscape.

What’s Rapid7’s view of the law?

Rapid7 views the Cyber Incident Reporting for Critical Infrastructure Act as a positive step. Cybersecurity is essential to ensure critical infrastructure is safe, and this law would give federal agencies more insight into attack trends, and would potentially help provide early warnings of major vulnerabilities or attacks in progress before they spread. The law carefully avoids requiring reports too early in the incident response process and provides protections to encourage companies to be open and transparent in their reports.

Still, the Cyber Incident Reporting for Critical Infrastructure Act does little to ensure critical infrastructure has safeguards that prevent cyber incidents from occurring in the first place. This law is unlikely to change the fact that many critical infrastructure entities are under-resourced and, in some cases, have security maturity that is not commensurate with the risks they face. The law’s enforcement mechanism (a potential contempt of court penalty) is not especially strong, and the final reporting rules may not be implemented for another 3.5 years. Ultimately, the law’s effect may be similar to state breach notification laws, which raised awareness but did not prompt widespread adoption of security safeguards for personal information until states implemented data security laws.

So, the Cyber Incident Reporting for Critical Infrastructure Act is a needed and helpful improvement — but, as always, there is more to be done.

NEVER MISS A BLOG

Get the latest stories, expertise, and news about security today.

[$] Toward a better list iterator for the kernel

Post Syndicated from original https://lwn.net/Articles/887097/

Linked lists are conceptually straightforward; they tend to be taught
toward the beginning of entry-level data-structures classes. It might thus
be surprising that the kernel community is concerned about its longstanding
linked-list implementation and is not only looking for ways to solve some
problems, but has been struggling to find that solution. It now appears
that some improvements might be at hand: after more than 30 years, the kernel
developers may have found a better way to safely iterate through a linked list.

Security updates for Thursday

Post Syndicated from original https://lwn.net/Articles/887484/

Security updates have been issued by Debian (firefox-esr and kernel), Fedora (cyrus-sasl, mingw-protobuf, and thunderbird), Mageia (kernel-linus), openSUSE (firefox, kernel, and libcaca), Oracle (.NET 6.0, kernel, kernel-container, and ruby:2.5), Slackware (mozilla-thunderbird), and SUSE (firefox, mariadb, and tomcat).

Building serverless multi-Region WebSocket APIs

Post Syndicated from James Beswick original https://aws.amazon.com/blogs/compute/building-serverless-multi-region-websocket-apis/

This post is written by Ben Freiberg, Senior Solutions Architect, and Marcus Ziller, Senior Solutions Architect.

Many modern web applications use the WebSocket protocol for bidirectional communication between frontend clients and backends. The fastest way to get started with WebSockets on AWS is to use WebSocket APIs powered by Amazon API Gateway.

This serverless solution allows customers to get started with WebSockets without having the complexity of running a WebSocket API. WebSocket APIs are a Regional service bound to a single Region, which may affect latency and resilience for some workloads.

This post shows how to build a multi-regional WebSocket API for a global real-time chat application.

Overview of the solution

This solution uses AWS Cloud Development Kit (CDK). This is an open source software development framework to model and provision cloud application resources. Using the CDK can reduce the complexity and amount of code needed to automate the deployment of resources.

This solution uses AWS Lambda, Amazon API Gateway, Amazon DynamoDB, and Amazon EventBridge.

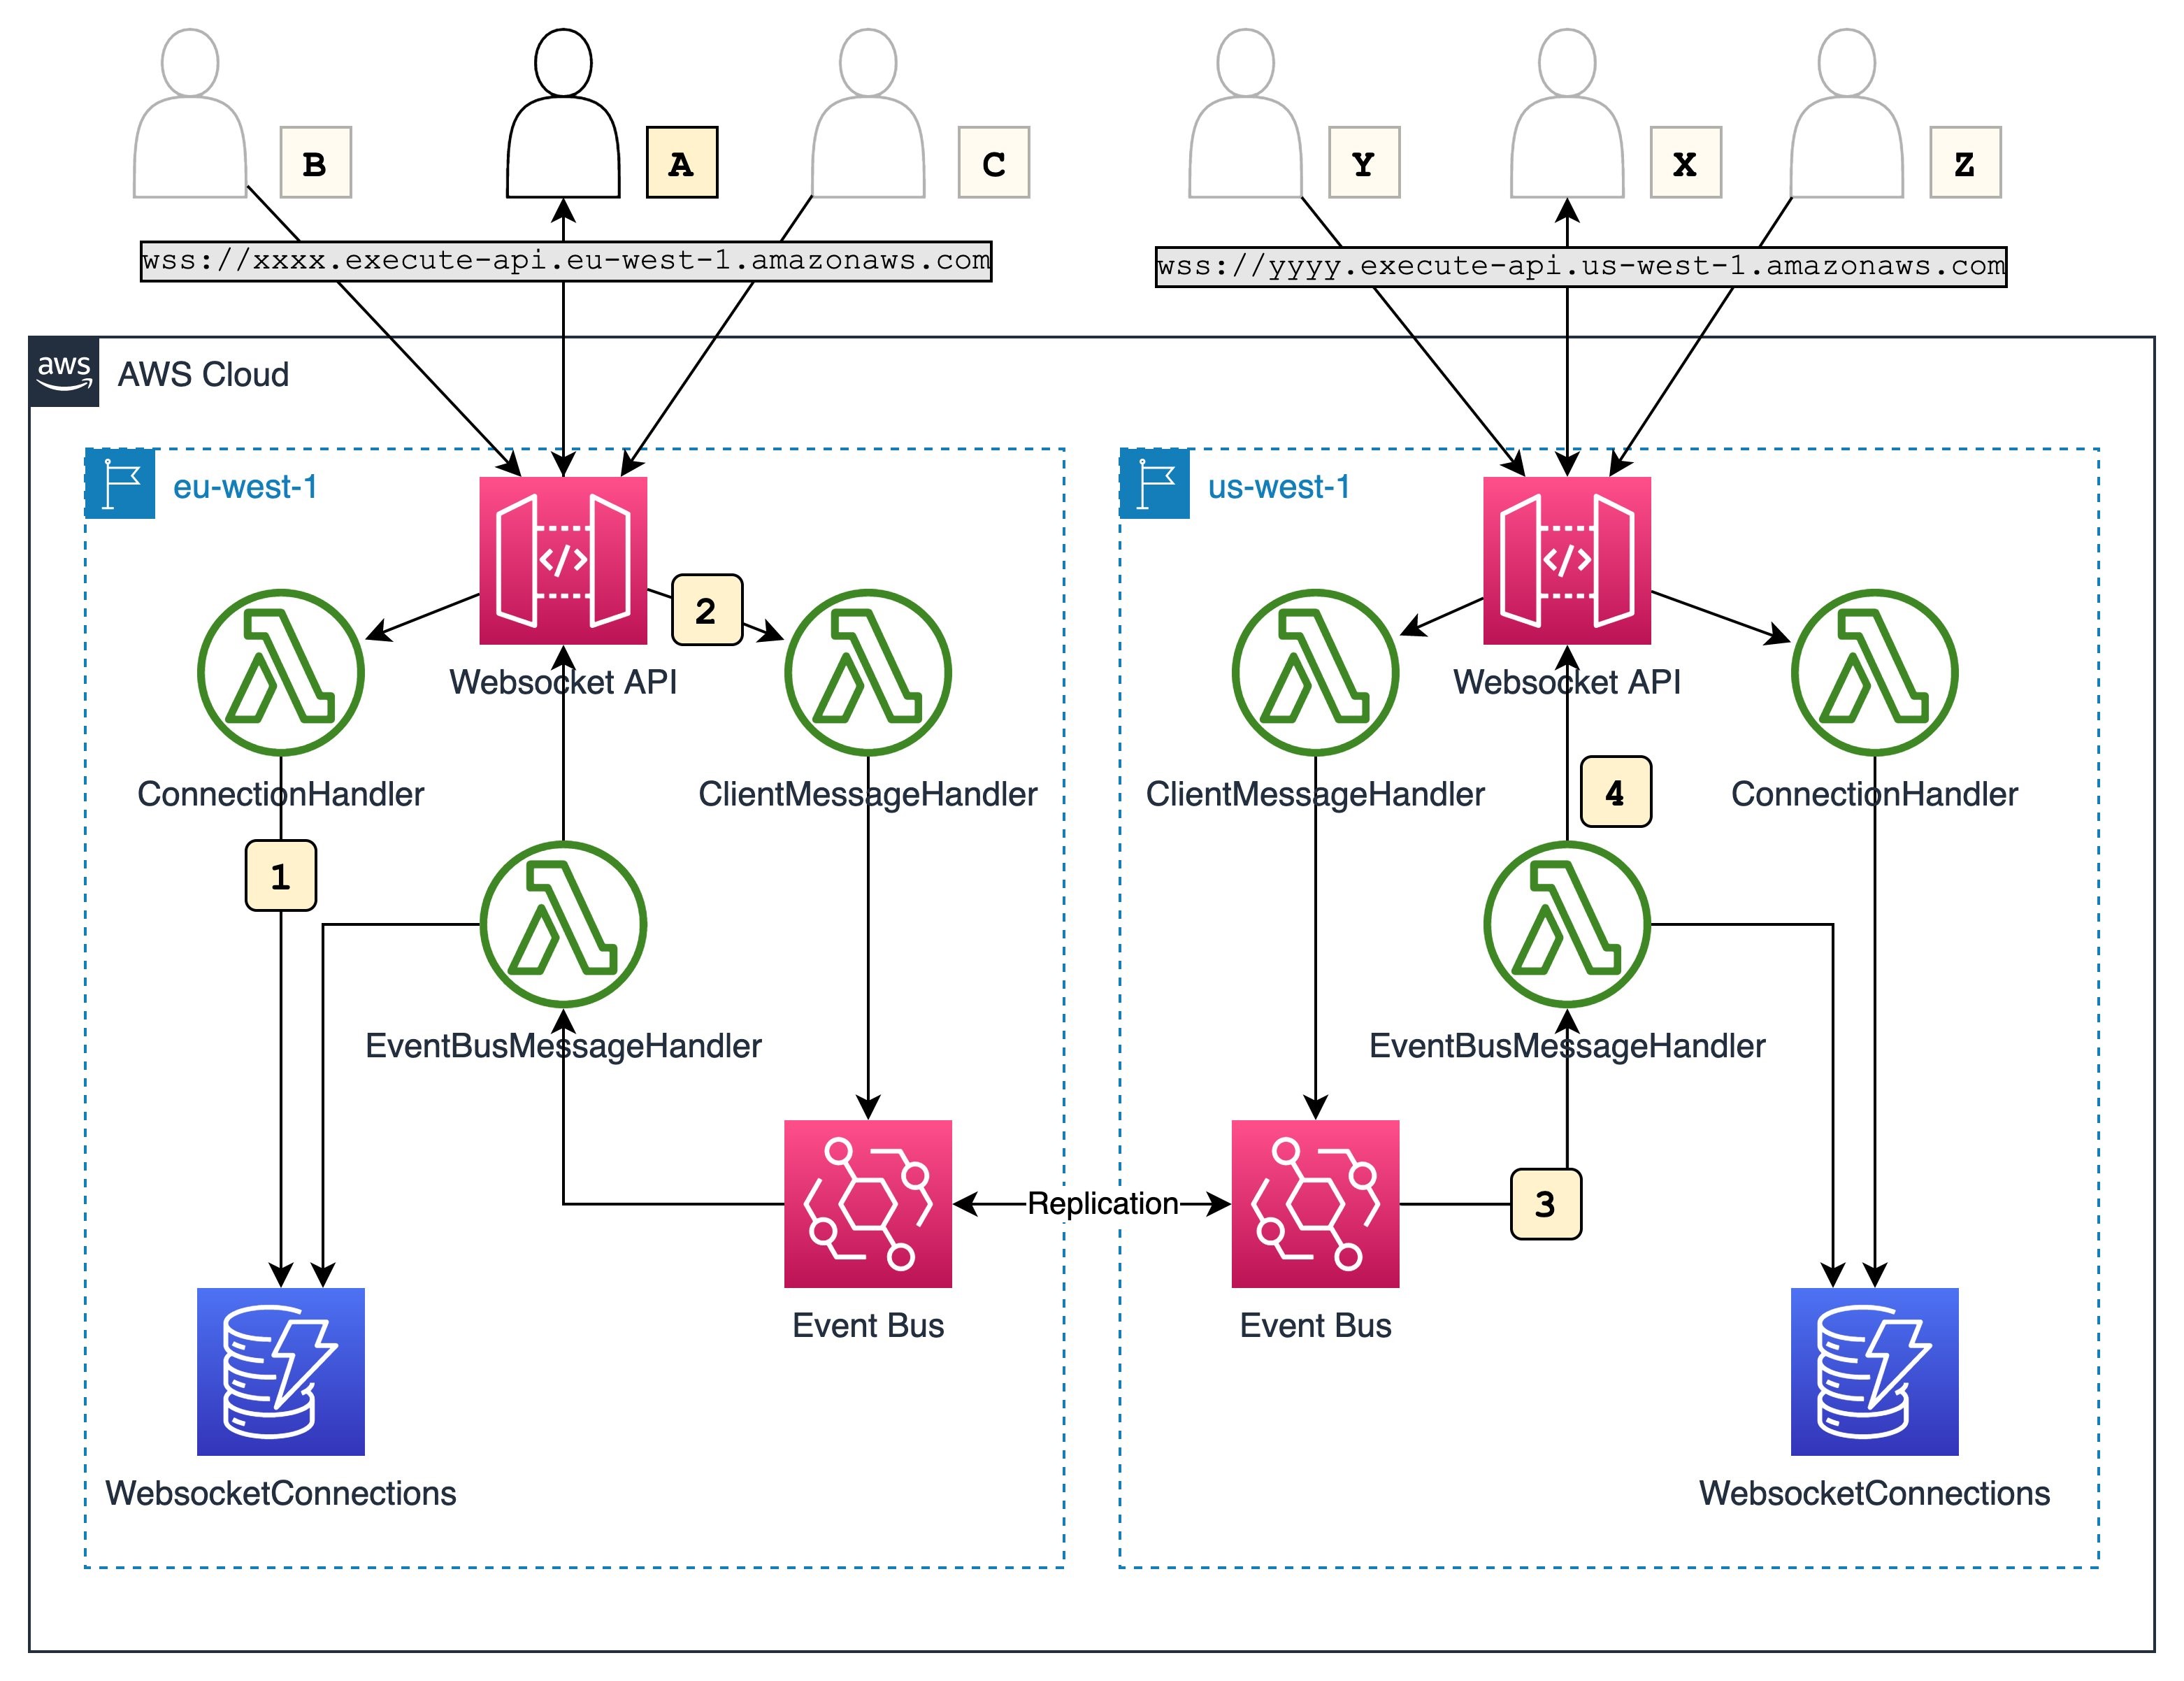
This diagram outlines the workflow implemented in this blog:

Solution architecture

  1. Users across different Regions establish WebSocket connections to an API endpoint in a Region. For every connection, the respective API Gateway invokes the ConnectionHandler Lambda function, which stores the connection details in a Regional DynamoDB table.
  2. User A sends a chat message via the established WebSocket connection. The API Gateway invokes the ClientMessageHandler Lambda function with the received message. The Lambda function publishes an event to an EventBridge event bus that contains the message and the connectionId of the message sender.
  3. The event bus invokes the EventBusMessageHandler Lambda function, which pushes the received message to all other clients connected in the Region. It also replicates the event into us-west-1.
  4. EventBusMessageHandler in us-west-1 receives and send it out to all connected clients in the Region via the same mechanism.

Walkthrough

The following walkthrough explains the required components, their interactions and how the provisioning can be automated via CDK.

For this walkthrough, you need:

Checkout and deploy the sample stack:

  1. After completing the prerequisites, clone the associated GitHub repository by running the following command in a local directory:
    git clone [email protected]/aws-samples/multi-region-websocket-api
  2. Open the repository in your preferred editor and review the contents of the src and cdk folder.
  3. Follows the instructions in the README.md to deploy the stack.

The following components are deployed in your account for every specified Region. If you didn’t change the default, the Regions are eu-west-1 and us-west-1.

API Gateway for WebSocket connectivity

API Gateway is a fully managed service that makes it easier for developers to create, publish, maintain, monitor, and secure APIs at any scale. APIs act as the “front door” for applications to access data, business logic, or functionality from your backend services. Using API Gateway, you can create RESTful APIs and WebSocket APIs that enable real-time two-way communication applications.

WebSocket APIs serve as a stateful frontend for an AWS service, in this case AWS Lambda. A Lambda function is used for the WebSocket endpoint that maintains a persistent connection to handle message transfer between the backend service and clients. The WebSocket API invokes the backend based on the content of the messages that it receives from client apps.

There are three predefined routes that can be used: $connect, $disconnect, and $default.

const connectionLambda = new lambda.Function(..);
const requestHandlerLambda = new lambda.Function(..);

const webSocketApi = new apigwv2.WebSocketApi(this, 'WebsocketApi', {
      apiName: 'WebSocketApi',
      description: 'A regional Websocket API for the multi-region chat application sample',
      connectRouteOptions: {
        integration: new WebSocketLambdaIntegration('connectionIntegration', connectionLambda.fn),
      },
      disconnectRouteOptions: {
        integration: new WebSocketLambdaIntegration('disconnectIntegration', connectionLambda.fn),
      },
      defaultRouteOptions: {
        integration: new WebSocketLambdaIntegration('defaultIntegration', requestHandlerLambda.fn),
      },
});

const websocketStage = new apigwv2.WebSocketStage(this, 'WebsocketStage', {
      webSocketApi,
      stageName: 'dev',
      autoDeploy: true,
});

$connect and $disconnect are used by clients to initiate or end a connection with the API Gateway. Each route has a backend integration that is invoked for the respective event. In this example, a Lambda function gets invoked with details of the event. The following code snippet shows how you can track each of the connected clients in an Amazon DynamoDB table. Amazon DynamoDB is a fully managed, serverless, key-value NoSQL database designed to run high-performance applications at any scale.

// Simplified example for brevity
// Visit GitHub repository for complete code

function connectionHandler(event: APIGatewayEvent) {
  if (eventType === 'CONNECT') {
    await dynamoDbClient.put({
      Item: {
        connectionId,
        chatId: 'DEFAULT',
        ttl: Math.round(Date.now() / 1000 + 3600) // TTL of one hour
      },
    });
  }

  if (eventType === 'DISCONNECT') {
    await dynamoDbClient.delete({
      TableName: process.env.TABLE_NAME!,
      Key: {
        connectionId,
        chatId: 'DEFAULT',
      },
    })
  }

  return ..
}

The $default route is used when the route selection expression produces a value that does not match any of the other route keys in your API routes. For this post, we use it as a default route for all messages sent to the API Gateway by a client. For each message, a Lambda function is invoked with an event of the following format.

{
     "requestContext": {
         "routeKey": "$default",
         "messageId": "GXLKJfX4FiACG1w=",
         "eventType": "MESSAGE",
         "messageDirection": "IN",
         "connectionId": "GXLKAfX1FiACG1w=",
         "apiId": "3m4dnp0wy4",
         "requestTimeEpoch": 1632812813588,
         // some fields omitted for brevity   
         },
     "body": "{ .. }",
     "isBase64Encoded": false
}

EventBridge for cross-Region message distribution

The Lambda function uses the AWS SDK to publish the message data in event.body to EventBridge. EventBridge is a serverless event bus that makes it easier to build event-driven applications at scale. It delivers a stream of real-time data from event sources to targets. You can set up routing rules to determine where to send your data to build application architectures that react in real time to your data sources with event publishers and consumers decoupled.

The following CDK code defines routing rules on the event bus that is applied for every event with source ChatApplication and detail type ChatMessageReceived.

    new events.Rule(this, 'ProcessRequest', {
      eventBus,
      enabled: true,
      ruleName: 'ProcessChatMessage',
      description: 'Invokes a Lambda function for each chat message to push the event via websocket and replicates the event to event buses in other regions.',
      eventPattern: {
        detailType: ['ChatMessageReceived'],
        source: ['ChatApplication'],
      },
      targets: [
        new LambdaFunction(processLambda.fn),
        ...additionalEventBuses,
      ],
    });

Intra-Region message delivery

The first target is a Lambda function that sends the message out to clients connected to the API Gateway endpoint in the same Region where the message was received.

To that end, the function first uses the AWS SDK to query DynamoDB for active connections for a given chatId in its AWS Region. It then removes the connectionId of the message sender from the list and calls postToConnection(..) for the remaining connection ids to push the message to the respective clients.

export async function handler(event: EventBridgeEvent<'EventResponse', ResponseEventDetails>): Promise<any> {
  const connections = await getConnections(event.detail.chatId);
  connections
    .filter((cId: string) => cId !== event.detail.senderConnectionId)
    .map((connectionId: string) => gatewayClient.postToConnection({
      ConnectionId: connectionId,
      Data: JSON.stringify({ data: event.detail.message }),
    })
}

Inter-Region message delivery

To send messages across Regions, this solution uses EventBridge’s cross-Region event routing capability. Cross-Region event routing allows you to replicate events across Regions by adding an event bus in another Region as the target of a rule. In this case, the architecture is a mesh of event buses in all Regions so that events in every event bus are replicated to all other Regions.

A message sent to an event bus in a Region is replicated to the event buses in the other Regions and trigger the intra-region workflow that I described earlier. However, to avoid infinite loops the EventBridge service implements circuit breaker logic that prevents infinite loops of event buses sending messages back and forth. Thus, only ProcessRequestLambda is invoked as a rule target. The function receives the message via its invocation event and looks up the active WebSocket connections in its Region. It then pushes the message to all relevant clients.

This process happens in every Region so that the initial message is delivered to every connected client with at-least-once semantics.

Improving resilience

The architecture of this solution is resilient to service disruptions in a Region. In such an event, all clients connected to the affected Region reconnect to an unaffected Region and continue to receive events. Although this isn’t covered in the CDK code, you can also set up Amazon Route 53 health checks to automate DNS failover to a healthy Region.

Testing the workflow

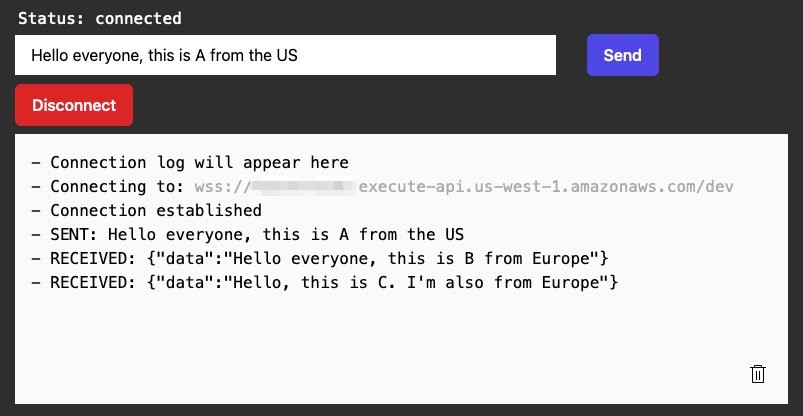
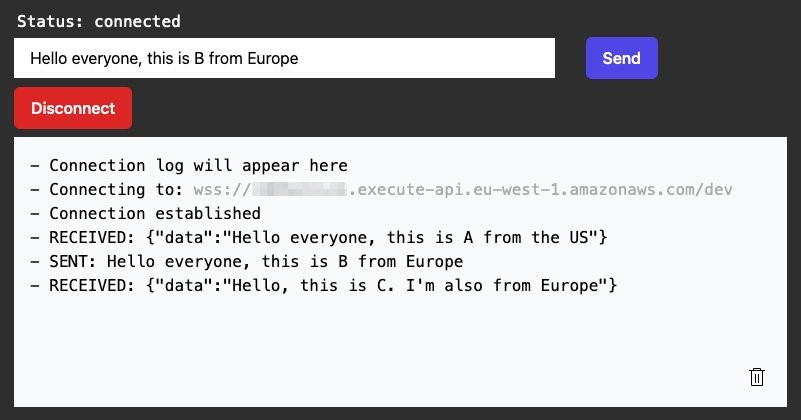
You can use any WebSocket client to test the application. Here you can see three clients, one connected to the us-west-1 API Gateway endpoint and two connected to the eu-west-1 endpoint. Each one sends a message to the application and every other client receives it, regardless of the Region it is connected to.

Testing

Testing

Testing

Cleaning up

Most services used in this blog post have an allowance in the AWS Free Tier. Be sure to check potential costs of this solution and delete the stack if you don’t need it anymore. Instructions on how to do this are included inside the README in the repository.

Conclusion

This blog post shows how to use the AWS serverless platform to build a multi-regional chat application over WebSockets. With the cross-Region event routing of EventBridge the architecture is resilient as well as extensible.

For more resources on how to get the most out of the AWS serverless platform, visit Serverless Land.

Where’s the Russia-Ukraine Cyberwar?

Post Syndicated from Bruce Schneier original https://www.schneier.com/blog/archives/2022/03/wheres-the-russia-ukraine-cyberwar.html

It has been interesting to notice how unimportant and ineffective cyber operations have been in the Russia-Ukraine war. Russia launched a wiper against Ukraine at the beginning, but it was found and neutered. Near as I can tell, the only thing that worked was the disabling of regional KA-SAT SATCOM terminals.

It’s probably too early to reach any conclusions, but people are starting to write about this, with varying theories.

I want to write about this, too, but I’m waiting for things to progress more.

EDITED TO ADD (3/12): Two additional takes.

Create 3D worlds with code on our first-ever Unity livestream

Post Syndicated from Janina Ander original https://www.raspberrypi.org/blog/unity-introduction-livestream/

We are super excited to host a livestream to introduce young coders to creating 3D worlds with Unity. Tune in at 18:30 GMT on Thursday 24 March 2022 on YouTube to find out all about our free online learning path for getting started with Unity.

If you know young coders who love gaming, digital art, or storytelling and need a new programming challenge, this is the event for them. So mark your calendars!

Our free Unity project path, in partnership with Unity Technologies

In January, we launched an all-new online learning path of Unity projects, in partnership with Unity. With this path, youth who enjoy writing code will learn how to start using the free Unity Real-Time Development Platform to build their own digital 3D games and worlds.

A teenage girl presenting a digital making project on a tablet

Professional developers are using Unity to create well-known games such as Mario Kart Tour and Pokémon Mystery Dungeon: Rescue Team DX. We’ve partnered with Unity to offer any young person, anywhere, the opportunity to take their first steps in creating virtual worlds using real-time 3D. The five-part Unity path we offer is educational and shows young people that if they can imagine something, then they can create it digitally with Unity. 

Who is the Unity livestream for? Why should young people join?

For young people, coding in Unity can be a fun experience of creating their own 3D worlds. And it also helps them learn skills that can be useful and desirable in the tech sector.

Unity is a step up for young people who have coded in a text-based language before and are interested in creating interactive 3D games and stories. In Unity, they’ll write code in the programming language C# — pronounced ‘cee sharp’. It’s a great opportunity to build on their existing coding and problem-solving skills.

Four young coders show off their tech project for Coolest Projects.

Introducing young people to Unity means that they will begin to use the same tools as professional 3D developers. Maybe attending the Unity livestream is going to be your coders’ first step towards creating the next videogame sensation.

What will happen on the livestream? 

The livestream will run for around 45 minutes. It will be the perfect introduction to Unity and our project path for you and your experienced coders.  

The livestream will include: 

  1. A ‘question and answer’ section with Unity expert Thomas Winkley. Thomas is a Unity Certified Programmer and product evangelist. He’s passionate about helping others learn new skills and follow their interests. Thomas will be answering your questions about Unity and what you can do with it, as well as talking about some of the cool creations he’s made. 
  2. An introduction to the Unity project path with Liz from our team: You’ll get to ask your questions about our Unity project path, and you’ll learn what you can make with each project and see an example of a final project — like what you’ll create by completing the project path. 
  3. A live coding section with Rebecca and Mr C: Your young people get to join in coding their first characters and objects in the 3D environment of Unity.  

By joining the livestream, your young people will: 

  • Learn more about Unity and get inspired to start creating
  • See what our free online Unity learning path is all about and understand what they’ll get from completing it
  • Have the chance to see what it’s like to make their own creations with Unity, and code along if they want to      

Do you need to do anything before the livestream? 

The livestream takes place on Thursday 24 March at 18:30 GMT on our YouTube channel. Everyone can tune in without signing up, wherever you are in the world. If you have a Google account, you can click the ‘Set a reminder’ button to make sure you and your keen coders don’t miss a thing.

Unity is free for anyone to use. If your young people want to code along during the livestream, they need to prepare by downloading and installing all the free software beforehand. Young people will need to:

We cannot wait for you to join us and our special guests on our Unity livestream!

Share Unity creations at Coolest Projects Global

Whatever your young people create with Unity — or other digital tech —, they can register to share it for the world to see in the online gallery of Coolest Projects Global. This is our free and completely online tech showcase, for young people up to age 18 all over the world.

Coolest Projects logo.

Registering to showcase their tech creation means young people will get cool swag, feedback on what they’ve made, and a chance to win recognition from our special judges. And above all, they’ll become part of a worldwide community of young tech creators who celebrate and inspire each other.

Find out more at coolestprojects.org.

The post Create 3D worlds with code on our first-ever Unity livestream appeared first on Raspberry Pi.

Институционалната немощ на Държавната агенция за бежанците

Post Syndicated from Венелина Попова original https://toest.bg/institutsionalnata-nemosht-na-durzhavnata-agentsiya-za-bezhantsite/

Българите не обичат бежанците, особено ако са тъмнокожи мъже от Африка или Близкия изток. В съзнанието на мнозина битуват пропагандните клишета, че голяма част от бежанците са терористи, които идват в Европа, за да организират атентати, да изнасилват белите жени и да се възползват от благата на социалните системи на богатия Запад. Затова кабинетът на Борисов, с участието на националистите в него, издигна мрежа по границата ни с Турция след първата голяма мигрантска вълна от Сирия, а мъже с мозъци на примати тръгнаха на лов за бежанци.

Бежанците от Украйна са различни, това каза и премиерът Кирил Петков. Те са бели, православни и говорят език, близък до нашия. БЧК, неправителствени организации, бизнеси и доброволци (включително хора с украински, руски и бесарабски произход, живеещи в България) се самоорганизираха и поеха грижата за транспортирането на бежанците и временното им настаняване.

Но дали този ентусиазъм и гражданска енергия ще са достатъчни при увеличаване на бежанската вълна?

Две седмици след началото на руската военна агресия в Украйна от страната са избягали над 2 млн. души, а Европа е изправена пред най-тежката хуманитарна криза след Втората световна война. За да облекчи страните от тежките процедури на Дъблинския регламент за получаване на бежански статут, Европейският съюз задейства Директива на Съвета на ЕС от 2001 г. за предоставяне на временна закрила. В нея са изброени задълженията на приемащите бежанци държави членки, сред които най-важните са предоставяне на подходящо жилищно настаняване или средства за това, възможност за намиране на работа, социално подпомагане на нуждаещите се, медицинско обслужване и медицинска помощ при спешни случаи, образователни права за възрастни, достъп на деца до образователната ни система и др. Правилата за временна закрила започнаха да действат на 4 март и може да се прилагат във всички европейски държави без приемане на допълнително законодателство и актове на правителството.

Кризата от COVID-19 се управлява от Министерството на здравеопазването, а правителството сформира специален щаб, който всеки ден на специални пресконференции през първата година от епидемията информираше как се развива тя. Бежанската криза най-логично следва да се управлява от Държавната агенция за бежанците (ДАБ), която има внушителна структура от шест дирекции – „Международна дейност“, „Качество на процедурата за международна закрила“, „Социална дейност и адаптация“, „Административно-правно обслужване и човешки ресурси“, „Управление на собствеността и обществени поръчки“ и „Финансово-счетоводни дейности“, както и регистрационно-приемателни центрове в София, с. Баня (общ. Нова Загора) и Харманли и един транзитен център в с. Пъстрогор (общ. Свиленград).

Общият капацитет на тези центрове е за малко над 5000 души.

Към днешна дата в тях има бежанци предимно от Афганистан и Сирия, а половината места са свободни. Но ако решите да потърсите на интернет страницата на ДАБ информация за бежанската криза в Украйна, ще откриете едно-единствено съобщение от 28 февруари. В него е описана процедурата за предоставяне на международна закрила, според която всеки желаещ да я получи трябва да се яви лично за регистрация в някой от трите приемателни центъра в кв. „Овча купел“ в София, в с. Баня или в Харманли.

След влизането в сила от 4 март на Директивата за временна закрила обаче, неправителствените организации, поели основно грижата за настаняването на украинците, получават противоречива информация как да ги регистрират – за временна или за международна закрила, защото при двата варианта условията и правата, които бежанците ще получат, са различни – и къде да настанят хора в крайна нужда, на които не са успели да намерят временно убежище. В устна комуникация ръководствата на трите бежански центъра препоръчват на неправителствените организации да насочват украинските бежанци единствено към столичния център в кв. „Овча купел“.

От Фондация „Мисия Криле“ в Стара Загора си задават въпроса

дали пък държавата не се опитва да скрие истината за тези центрове у нас,

за условията на живот на настанените в тях бежанци от Африка и Близкия изток, за качеството на храната, особено на детската, и за прочее нелицеприятни факти, които биха представили страната ни в лоша светлина. Как ли би се почувствала току-що пристигналата в офиса на фондацията млада украинка от Харков с две деца на 2- и 7-годишна възраст, ако бъдат настанени в някой от тези центрове, запитах се и аз след краткия си разговор с нея.

Бежанският поток от Украйна е силно уязвим, защото тук пристигат основно жени с децата си, оставили съпрузите си да воюват срещу агресора. Правителството предвижда отпускането на 50 млн. лв., с дневен лимит по 40 лв. на човек за нощувка и храна, за настаняване на украински бежанци в базите на дружества на НОИ, в държавни болници за рехабилитация и балнеолечебни центрове, почивни станции на министерства и ведомства, както и в хотели и къщи за гости, вписани в Националния туристически регистър. Но тези пари ще стигнат най-много за два месеца, а някои бизнесмени, приели бежанци в хотелите си, вече ги затварят за тях, защото не могат да поемат режийните разноски.

Обърнах се към ДАБ с въпроси дали имат стратегия за управлението на кризата и на каква подкрепа могат да разчитат бежанците от Украйна. Зададох ги по телефона на главния секретар Евгени Цветков и на зам.-председателя Даниел Инджиев. Преди да ме отпрати към пресцентъра, зам.-председателят изрази учудването си, че очаквам от ДАБ да управлява криза, с която няма капацитет да се справи. По думите му,

това е проблем на правителството,

което вече е сформирало Национална оперативна координационна група. (Впрочем подробна информация за такава група не се открива никъде в публичното пространство.) Тя ще ръководи граничното пропускане, транспорта, настаняването, медицинското обслужване и другите дейности, които уреждат временната закрила на бежанците от Украйна. На този етап те били настанявани извън регистрационно-приемателните центрове, които нямали капацитет да поемат хилядите украинци, потърсили убежище в България, обяснява Инджиев. Той определи като ангажимент на правителството и евентуалното изграждане на нови бежански центрове в България.

На въпроса ми за разликата в правата на бежанците при кандидатстване за временна или за международна закрила, главният секретар Евгени Цветков с надменен и поучителен тон ми препоръча да прочета регламентите за двата вида закрила. Според него в момента бежанците от Украйна се регистрират като туристи, затова не могат да кандидатстват за бежански или хуманитарен статут. В ДАБ очакват акт на Министерския съвет, който ще организира цялостната дейност около украинската бежанска криза. Попитах главния секретар какво правят сега, а краткият му отговор беше: „Работим – и денем, и нощем!“

Дадох си сметка, че този институционален хаос и чиновническо безхаберие не ме учудват ни най-малко. Но вероятно много неправителствени организации, които всекидневно се сблъскват с подобно отношение, си задават въпроса:

Не трябва ли премиерът Кирил Петков да преосмисли оставането на това ръководство на Държавната агенция за бежанците?

Също и възможностите за повишаване на нейния капацитет. Защото кризи като сегашната оголват уязвимите ѝ места. В сегашния си вид тази агенция видимо не може да посрещне адекватно украинската бежанска криза и да отговори на обществените очаквания към нея.

Заглавна снимка: Бежанци чакат на границата между Полша и Украйна © Николай Дюлгеров

Източник

Дипломация в опасност. Ефектът на пеперудата от войната в Украйна

Post Syndicated from Мирослав Зафиров original https://toest.bg/diplomatsiya-v-opasnost/

Две седмици след началото на войната в Украйна немалко експерти и обикновени наблюдатели намериха поле за изява в медийното пространство и социалните мрежи. Усещането е за информационна какофония, създавана от хора, чиито източници на информация са същите като на тяхната публика, само че „фактите“ са представени с маниер.

Всевъзможни теории, версии и разсъждения за случващото се не само не помагат за разбирането на кризата, но водят неволно или умишлено до объркване у потребителите на информационния поток. Това от своя страна е пагубно за изграждането или съхраняването на обществената устойчивост, така необходима в условията на война в непосредствена близост. Точно сега трезвата мисъл и спокойствие трябва да бъдат запазени.

Настъпи радикална, немислима доскоро промяна в световния дневен ред – война в Европа.

Една ненужна и ужасна авантюра на Владимир Путин. На полето на международните отношения, наред със съкрушителните санкции срещу руската икономика, започна процес, който почти няма аналог след 1945 г. Особено по отношение на държава членка на Съвета за сигурност на ООН – най-високия международен орган, призван да крепи тялото на световния ред след Втората световна война.

На седмия ден след началото на войната в рамките на ООН започна промяна на начина, по който се прави международната политика. С огромно мнозинство членовете на Общото събрание на ООН осъдиха действията на Русия в Украйна. Преди това с 11 гласа „за“ и само три „въздържал се“ членовете на Съвета за сигурност на ООН приеха резолюция, която закрепи за Русия дефиницията „държава агресор“. Въз основа на тази резолюция по-късно в Общото събрание на ООН дори държави, които по принцип се смятат за част от зоната на влияние на Москва, се въздържаха или не присъстваха в залата, с което лишиха Русия от подкрепата си.

Русия остана изолирана.

Всеобщото осъждане на войната срещу Украйна се проявява както във всички сфери на обществения живот (например в културата и спорта), така и в лишаването на Русия от възможността пълноценно да участва в редица организации, комитети и работни групи. Включително там, където от години руските дипломати или имат водеща роля, или са сред основните действащи лица. Трябва да вземем предвид всичко това, когато правим оценка на случващото се.

Промяната в принципите на водене на международните отношения под натиска на кризисните обстоятелства може да създаде редица проблеми в световен план, което допълнително ще затвърди усещането за трайна и цялостна ерозия на съществуващата архитектура на сигурност и на основните принципи в дипломацията, закрепени в Устава на ООН.

Дали Русия трябва да понесе отговорността си за извършваната военна агресия? Безусловно да. Тя и всяка друга държава, която е нарушила международното право. Но за да излезем извън полето на теорията и неекспертното говорене за войната в Украйна, нека се спрем на

последиците за определящия съдбата на Близкия изток конфликт – този между Израел и Палестина.

По-конкретно – на възможната промяна на баланса, основан на релевантните резолюции на ООН и споразуменията за мир от 1994 г. в Осло. Всички тези решения очертават законовата рамка, която предвижда чрез преговори страните в конфликта – Израел и Палестинската автономна власт – да постигнат съгласие и взаимно признаване като две независими държави, живеещи една до друга в условия на мир и сигурност. За хода на преговорите и за самия процес отговорност носи т.нар. Квартет за Близкия изток – обединение между САЩ, Русия, ООН и ЕС.

След 2018 г., вследствие на политиката на администрацията на американския президент Доналд Тръмп и най-вече на решението да бъде признат град Йерусалим за неделима столица на Израел, перспективите за постигане на трайно решение в процеса между палестинците и израелците заглъхнаха значително. Обвиненията от страна на Палестинската власт към Израел и САЩ, че нарушават резолюциите на ООН и нормите на международното право, традиционно срещат разбирането на по-голямата част от световната общност, а решението на американския президент не бе прието в рамките на Квартета нито от ООН, нито от ЕС или Русия.

И все пак от страна на Вашингтон беше направен опит да се действа от позицията на свършения факт. Решението на САЩ на практика блокира работата на Квартета, но бе предпоставка и за по-сериозна тенденция –

маргинализирането на Палестинската власт като законен представител на палестинския народ.

Това бързо бе използвано от радикалните палестински групировки и най-вече от „Хамас“, които в тон с пропагандната си реторика, че договореното в Осло е акт на национално предателство, призоваха за борба срещу Израел. Помним кризата от май 2021 г. – тя започна, след като „Хамас“ изстреля ракета срещу Йерусалим в „отговор“ на сблъсъците в Стария град, поемайки главната роля в „борбата за защита на Светите места“ в града.

В условията на политически, а и икономически ступор Палестинската власт засега остава на краката си единствено за сметка на подкрепата на традиционните си донори и политически съюзници, сред които ЕС, неговите държави членки и ООН играят основна роля. Допълнителен удар върху имиджа на мирния процес бяха и подписаните мирни споразумения между Израел и редица арабски държави, познати като Abraham Accords. Мирните договори на практика накараха много хора да си зададат въпроса:

Дали в крайна сметка фактите не надделяха над принципите и логиката на международното право?

И не наблюдаваме ли края на процеса? Доколко палестинска държава въобще е възможна? И ако не е възможна, то какво следва?

Опитите на участниците в Квартета да поддържат неговото съществуване в периода „Тръмп“ са белязани с много усилия, като едва след изборите в САЩ и встъпването в длъжност на новия държавен глава Джо Байдън форматът беше реанимиран. Връщането му на сцената на дипломацията обаче се оказа трудна задача. Политиката на свършените факти, за която стана дума по-горе, и процесите между Израел и арабските му съюзници продължиха да изместват фокуса от същината на проблема.

Членовете на Квартета търсеха начини да балансират между принципите, върху които почива форматът, и интересите на своите столици. Разговорите за среща на ниво министри и ръководители на Квартета бяха в ход. До 24 февруари 2022 г., когато решението на Москва да нахлуе в Украйна на практика сложи точка – и то за дълъг период – на този международно признат механизъм.

Русия е де факто изключена от участие в Квартета.

Определени столици смятат, че смисълът на това обединение е изчерпан и поради обстоятелствата и отсъствието на Русия следва то да бъде преформулирано или дори закрито. Съмнително е дали такова решение може да се вземе без санкцията на органа, създал Квартета – Съвета за сигурност, където едва ли Русия ще гласува „за“. Но това, че международната общност през очите на водещи държави е в настроение да приеме „политика на свършените факти“, би могло да доведе до сериозни последици.

Не може да не се признае обаче, че с началото на войната в Украйна Квартетът се намира в нова фаза на фактическа нефункционалност. Няма никаква възможност страните участнички да се съберат на една маса. Макар и това да бе единственият формат, който обединяваше Русия и САЩ по въпроса, че мирът в Близкия изток може да бъде постигнат единствено чрез преговори между засегнатите страни, независимо от опитите на трети страни да намерят начин да се наместят в процеса чрез алтернативни инициативи. Въпреки усилията на Франция, Египет, Йордания и Германия, идеята, известна като „Мюнхенски формат“, не успя да набере скорост и беше бламирана от самите Израел и Палестина.

Единственият член на Квартета, който има естествената роля и привилегия да е в контакт с враждуващите в момента Русия, ЕС и САЩ, е ООН.

Това е тежка и изключително отговорна задача. От първостепенна важност за офиса на ООН, воден от специалния представител на генералния секретар, е да запази принципите, заради които е създаден Квартетът, за да може той да продължи да функционира дори в условията на изолация на Москва. По този начин се съхранява идеята за ненарушимост на международно договорените принципи между основните участници в мирния процес. По въпроса за мира между Израел и Палестинската власт ООН има историческата отговорност да осигури континуитета във воденето на дипломация, за да се предотврати пренасянето на случващото се в Украйна върху други въпроси, свързани с мира, сигурността и стабилността в останалите точки на света.

Авторитетът на международните посредници не трябва да бъде поставян под съмнение, защото особено сега, след 24 февруари, светът се нуждае изключително много от него. Нито войната в Украйна, нито продължаващият вече 70 години конфликт в Близкия изток ще намерят своето решение с военни средства. Отделни представители в региона вече обсъждат по-директен подход, който евентуално ще канализира контактите директно с Израел и Палестина и ще привлече Египет и Йордания на масата на преговорите. Без ЕС и в отсъствието на ООН. Подобна инициатива е осъдена на неуспех.

В системата на международните отношения правото е основополагащ елемент, за да съществува ред. А центърът на тази система е ООН и неговите решения.

Относно перспективите пред един нов подход за разрешаване на кризата в Близкия изток трябва да се споменат само няколко детайла. За различията между Кайро и Аман по отношение на палестинския въпрос може много да се говори. Често се твърди, че Газа е грижа на Египет, а за Йордания остава Западният бряг. От друга страна, Палестинската власт едва ли ще  седне на масата на преговорите само с Израел. Палестинското правителство и президент се чувстват изключително некомфортно в момента и търсят мнението на традиционните си партньори. Те разбират, че при така стеклите се обстоятелства Москва не може да бъде контрапункт на никакви евентуални решения, насочени срещу интересите на палестинците. На среща с посланиците от Г7, състояла се преди дни в палестинската столица, прозвуча предупреждение: Палестинската власт трябва да знае, че връзките с Русия са нежелателни.

В Рамала се страхуват, че изкушението на израелското правителство да продължи с политиката на свършените факти би могло да нарасне, а с това – и перспективите за нова, много по-мащабна война с Израел. Кризата от май 2021 г., а и войните с радикалните палестински групировки и особено с „Хамас“ от 2006 г. насам биха могли да ни се сторят прелюдия към една много по-сериозна криза. Мнозина от палестинските лидери смятат, че на практика не е останала база за преговори. Усещането, че воюващите са водени от убеждението за „всичко или нищо“, не е само привилегия на войната в Украйна.

Подобен сценарий не може да бъде допускан.

Пренебрегването на дипломацията за сметка на аргументите на силата ще има пагубни последици. Историята на Европа нееднократно е доказвала това. Цената винаги е била и ще бъде непосилна.

Състоянието на мирния процес в Близкия изток може да е само частен случай, но ако се вгледаме в геополитическата карта на света след 1945 г., ще открием множество такива примери. В момента много хора анализират например възможните сценарии между страните в Южнокитайско море. Или относно съдбата на т.нар. Иранска сделка. И някак политическите шеги в сегашната ситуация не звучат смешно. Не е смешно и в Палестина.

Усещането за ерозия в механизма, заложен след 1945 г. чрез Съвета за сигурност на ООН и петте постоянни страни членки, се задълбочава. Още преди няколко години в анализ на една от тези членки се стига до извода, че от 2000 г. насам балансът на силите, в който от едната страна стоят САЩ и Великобритания, а от другата – Русия, е нарушен. Ако това е така, то необходимостта от изкуството на дипломацията е по-голяма от всякога.

Заглавна снимка: Пано от улична фотографска изложба до „Чекпойнт Чарли“, 6 март 2022 г. © Мирослав Зафиров. На оригиналната снимка (© LAB) са външните министри на ФРГ, ГДР, САЩ, Великобритания, СССР и Франция, както и двамата кметове на Източен и Западен Берлин по време на церемонията по демонтиране на известния контролно-пропускателен пункт в Берлин на 22 юни 1990 г. 

Източник

Save Cost and Improve Lambda Application Performance with Proactive Insights from Amazon DevOps Guru

Post Syndicated from Venkata Moparthi original https://aws.amazon.com/blogs/devops/save-cost-and-improve-lambda-application-performance-with-proactive-insights-from-amazon-devops-guru/

AWS customers, regardless of size and market segment, constantly seek to improve application performance while reducing operational costs. Today, Amazon DevOps Guru generates proactive insights that enable you to reduce the cost and improve the performance of your AWS Lambda application. By proactively analyzing your application and making these cost-saving and/or performance-improving recommendations, DevOps Guru frees up your operations team to focus on other value-adding activities.

DevOps Guru is a machine learning (ML)-powered service that helps you effectively monitor your application by ingesting application metrics, learning your application’s behavior over time, and then detecting operational anomalies. Once an anomaly is detected, DevOps Guru generates insights that include specific recommendations of how to fix the underlying problem.

To make sure that AWS customers remain ahead of potential issues, DevOps Guru detects some applications issues proactively and provides recommendations that let customers correct them before customer-impacting events actually occur. These Proactive Insights are created by analyzing operational data and application metrics with ML algorithms that can identify early signals that are linked with future operational issues.

In this post, we’ll review a scenario in which the provisioned concurrency capacity for a Lambda function was set too low. This put the customer at risk of dropped requests (throttling), which degrade application performance and deliver poor user experience during traffic spikes.

Prerequisites

In the scenario under review, we have an account with DevOps Guru set up to monitor a Lambda-based application stack. Enabling DevOps Guru and setting it up to monitor a Lambda function is straightforward, and you can refer to this post to see how this is done. For the Lambda function in this account, we have set the provisioned concurrency set too low. This Lambda documentation page covers how to estimate the appropriate concurrency levels for your function.

Architecture Overview

The reference architecture for our scenario can be seen in the following image.

In this simple serverless architecture, the Lambda-based application vends the metrics to Amazon CloudWatch. Then, DevOps Guru ingests the metrics from CloudWatch for analysis.

Architecture diagram explained in post.

By default, DevOps Guru ingests vended metrics via CloudWatch at no cost to customers.

Baselining

The first time that you enable and configure DevOps Guru to monitor resources, it starts baselining your resources to determine your application’s normal behavior. Unlike rule-based alarming systems, DevOps Guru utilizes dynamic thresholds that are controlled by ML algorithms and calibrated to the specifics of your application to reduce noise. For a simple serverless stack, baselining can be completed in two hours. However, in a production environment baselining can take up to 24-hours depending upon the number of resources being monitored. After initial baselining, analysis becomes continuous and baselining is no longer required.

Proactive Insight Generation

Once baselining is complete, DevOps Guru analyzes the baselined operational and generates insights where present. These insights can be found on the Insights page of the DevOps Guru console. To view the available insights, navigate to Insights, and select the Proactive Insights or Reactive Insights. In this scenario, we’re reviewing a Proactive Insight.

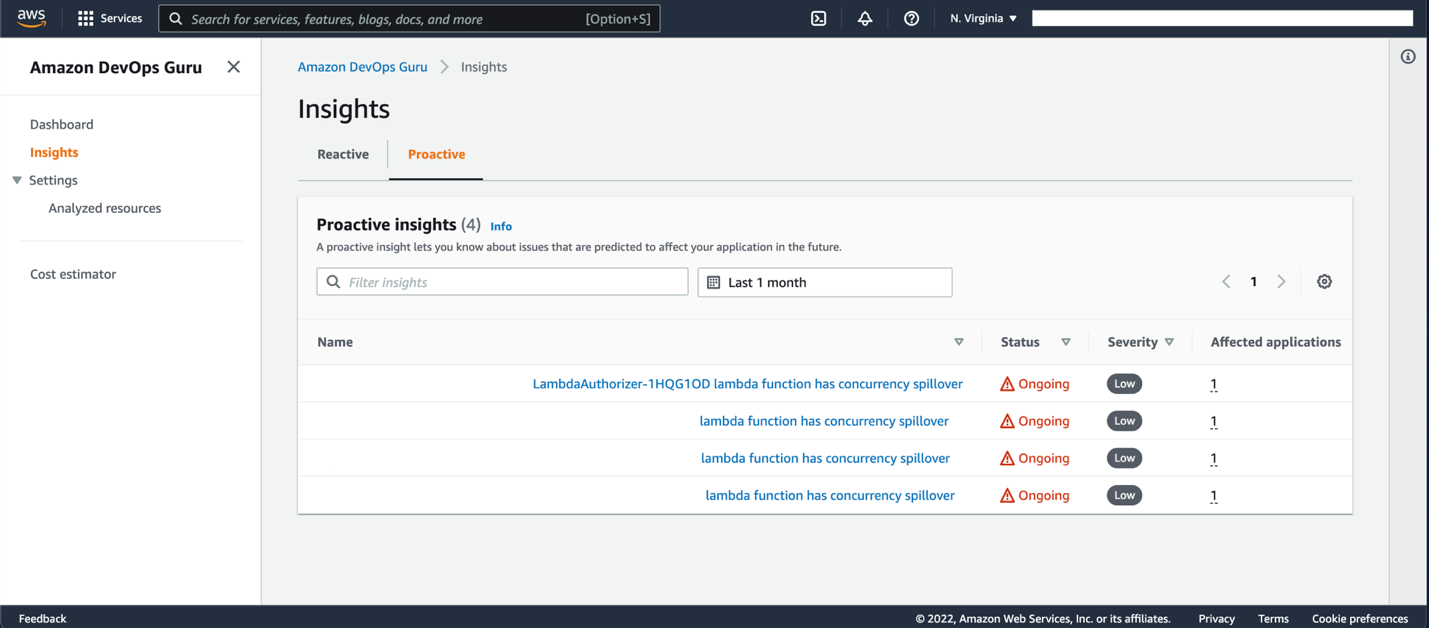
Devops guru Insights page. Four proactive insights with status of ongoing

On this tab, note that the LambdaAuthorizer -1HQG1OD function has a concurrency spillover invocation. For a given Lambda function, concurrency spillover is invoked when the number of concurrent requests reaches the provisioned concurrency limit. When this occurs, Lambda either begins to run on unreserved concurrency (leading to cold starts) or rejects additional incoming requests, depending on your function scaling configuration.

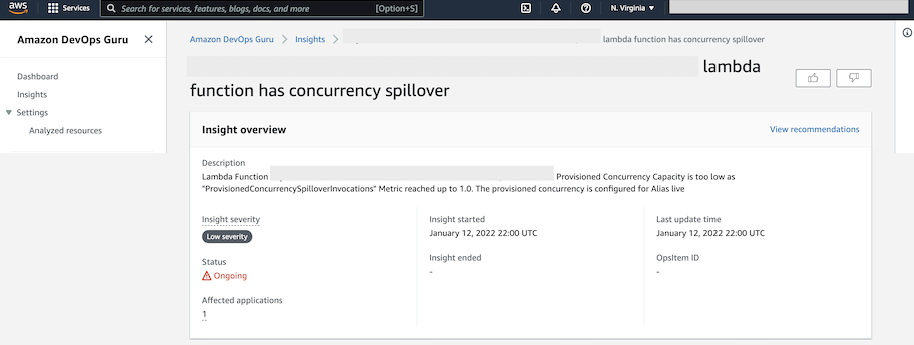
By selecting the relevant insight from the list, we open the insight detail page. The insight overview card provides an overview of the insight, with high-level information such as insight description, severity, status, and the number of affected applications as shown in the following screenshot.

Insight detail page. Shows insight overview, previously explained in post.

The metrics card presents a graph plotted against time. In this case, provisioned concurrency invocation, which toggles from 0 to 1 when concurrency spillover occurs, was triggered because the Lambda function received more concurrent requests than were provisioned for.

Metric card with graph plotted against time.

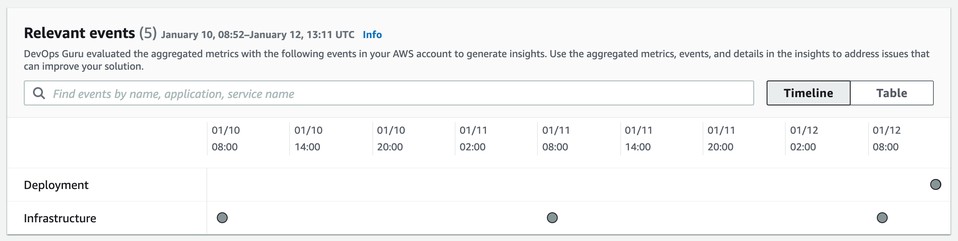
The relevant events card is useful in situations where more than one application is affected, or when the initial event triggers additional events. This card plots all of the events from different related applications on a time axis. Therefore, we can pinpoint which event triggered the chain of events.

Relevent events card, previously explained in post.

Recommendations

The recommendation section of the insight page provides specific and actionable guidance on what actions customers should take to fix the underlying cause of the issue. In this case, DevOps Guru recommends that the customer set the provisioned concurrency to 264 to keep the utilization balanced at 65%. Providing such specific guidance takes away any ambiguity and significantly reduces troubleshooting time.

Recommendations section previously explained in post.

Other Lambda-related Proactive Insights

While this scenario alerts customers to an issue that impacts application performance, DevOps Guru also provides alerts for cost-optimization issues. Some additional cost and performance-related issues that DevOps Guru identifies include:

  • Lambda Provisioned with No Autoscaling, which is triggered when autoscaling isn’t enabled, thereby putting the application at risk of degraded performance when requests are throttled during a traffic spike.
  • Low Lambda Provision Concurrency Utilization, which is triggered when provisioned concurrency is consistently higher than required, driving unnecessary cloud spend.
  • Over-provisioned Amazon DynamoDB Stream Shards, which is triggered when provisioned Amazon DynamoDB stream shards is consistently higher than required, driving unnecessary cloud spend.

DevOps Guru continues to expand its library of proactive insight use cases to deliver cost and performance improvements continuously to AWS customers.

Conclusion

As seen in the example above, DevOps Guru can proactively detect issues with your Lambda applications, tie these issues to related events, and provide precise remedial actions using its pre-trained ML models. As a customer, you can start leveraging these capabilities to improve the performance of your Lambda applications by simply enabling DevOps Guru—a process that requires minimal configuration and no previous ML expertise.

Start using DevOps Guru to monitor your Lambda Applications today!

About the authors

Mohit Gadkari

Mohit Gadkari is a Solutions Architect at Amazon Web Services (AWS) supporting SMB customers. He has been professionally using AWS since 2015 specializing in DevOps and Cloud Security and currently he is using this experience to help customers navigate the cloud.

Venkata Moparthi

Venkata Moparthi is a Cloud Infrastructure Architect at Amazon Web Services. He helps customers on their cloud adoption journey. He is passionate about technology and enjoys collaborating with customers architecting and implementing highly scalable and secure solutions.

[$] Fedora considers curl-minimal

Post Syndicated from original https://lwn.net/Articles/887313/

The curl utility is a command-line
program (and associated library) for interacting with various network protocols; it is commonly used
to do things like transferring data from a remote server over HTTP or HTTPS
using a URL. But curl also supports a lot more protocols, some of which
are probably rarely used, obsolete, deprecated, or all three. As a recent
discussion on the Fedora devel mailing list shows, though, it is hard to
find agreement that support for only some of those protocols should be installed by default,
while others might be left in an optional package for those who need them.

CVE-2022-0847: Arbitrary File Overwrite Vulnerability in Linux Kernel

Post Syndicated from Caitlin Condon original https://blog.rapid7.com/2022/03/09/cve-2022-0847-arbitrary-file-overwrite-vulnerability-in-linux-kernel/

CVE Disclosure AttackerKB IVM Content Patching Urgency Blog’s Last Update
CVE-2022-0847 Original disclosure AttackerKB March 9, 2022 When practical March 9, 2022 5:30 PM EST

CVE-2022-0847: Arbitrary File Overwrite Vulnerability in Linux Kernel

On March 7, 2022, CM4all security researcher Max Kellermann published technical details on CVE-2022-0847, an arbitrary file overwrite vulnerability in versions 5.8+ of the Linux kernel. Nicknamed “Dirty Pipe,” the vulnerability arises from incorrect Unix pipe handling, where unprivileged processes can corrupt read-only files. Successful exploitation allows local attackers to escalate privileges by modifying or overwriting typically inaccessible files — potentially including root passwords and SUID binaries.

CVE-2022-0847 affects Linux kernel versions since 5.8. Read Rapid7’s full technical analysis of the vulnerability in AttackerKB, including PoC and patch analysis.

While CVSS is not yet available, CVE-2022-0847 will likely carry a “High” severity rating rather than a “Critical” one given the authentication requirement. Multiple public exploits are available, including a proof of concept from the original disclosure and a Metasploit module. We are not aware of any reports of exploitation in the wild as of March 9, 2022.

This is a “patch, but no need to panic” situation. With that said, a few factors make this bug stand out a bit more than the average local privilege escalation (LPE) vuln. First and foremost, this is a simple attack to execute once initial access has been obtained, and it offers adversaries broad avenues for privileged operations after sensitive files (like root passwords) have been modified. Security researchers have also demonstrated that in some cases, public exploit code can be used to escape containers in that files modified inside the container also get modified on the host. Finally, the lingering specter of Log4Shell means that there may be a higher chance that attackers already have local access required to execute a privilege escalation attack on Linux systems.

Updates to Linux distributions have been trickling out. Organizations should apply the latest patches as soon as they are available and reboot systems.

Rapid7 customers

Upcoming content releases for InsightVM and Nexpose customers will provide checks for CVE-2022-0847 as supported Linux vendors publish distribution-specific security advisories and updated packages. Checks for Debian and Ubuntu are expected March 9, with SUSE to follow later in the week. Red Hat has not yet published any errata at this time.

NEVER MISS A BLOG

Get the latest stories, expertise, and news about security today.

Build and deploy custom connectors for Amazon Redshift with Amazon Lookout for Metrics

Post Syndicated from Chris King original https://aws.amazon.com/blogs/big-data/build-and-deploy-custom-connectors-for-amazon-redshift-with-amazon-lookout-for-metrics/

Amazon Lookout for Metrics detects outliers in your time series data, determines their root causes, and enables you to quickly take action. Built from the same technology used by Amazon.com, Lookout for Metrics reflects 20 years of expertise in outlier detection and machine learning (ML). Read our GitHub repo to learn more about how to think about your data when setting up an anomaly detector.

In this post, we discuss how to build and deploy custom connectors for Amazon Redshift using Lookout for Metrics.

Introduction to time series data

You can use time series data to measure and monitor any values that shift from one point in time to another. A simple example is stock prices over a given time interval or the number of customers seen per day in a garage. You can use these values to spot trends and patterns and make better decisions about likely future events. Lookout for Metrics enables you to structure important data into a tabular format (like a spreadsheet or database table), to provide historical values to learn from, and to provide continuous values of data.

Connect your data to Lookout for Metrics

Since launch, Lookout for Metrics has supported providing data from the following AWS services:

It also supports external data sources such as Salesforce, Marketo, Dynatrace, ServiceNow, Google Analytics, and Amplitude, all via Amazon AppFlow.

These connectors all support continuous delivery of new data to Lookout for Metrics to learn to build a model for anomaly detection.

Native connectors are an effective option to get started quickly with CloudWatch, Amazon S3, and via Amazon AppFlow for the external services. Additionally, these work great for your relational database management system (RDBMS) data if you have stored your information in a singular table, or you can create a procedure to populate and maintain that table going forward.

When to use a custom connector

In cases where you want more flexibility, you can use Lookout for Metrics custom connectors. If your data is in a state that requires an extract, transform, and load (ETL) process, such as joining from multiple tables, transforming a series of values into a composite, or performing any complex postprocessing before delivering the data to Lookout for Metrics, you can use custom connectors. Additionally, if you’re starting with data in an RDBMS and you wish to provide a historical sample for Lookout for Metrics to learn from first, you should use a custom connector. This allows you to feed in a large volume of history first, bypassing the coldstart requirements and achieving a higher quality model sooner.

For this post, we use Amazon Redshift as our RDBMS, but you can modify this approach for other systems.

You should use custom connectors in the following situations:

  • Your data is spread over multiple tables
  • You need to perform more complex transformations or calculations before it fits to a detector’s configuration
  • You want to use all your historical data to train your detector

For a quicker start, you can use built-in connectors in the following situations:

  • Your data exists in a singular table that only contains information used by your anomaly detector
  • You’re comfortable using your historical data and then waiting for the coldstart period to elapse before beginning anomaly detection

Solution overview

All content discussed in this post is hosted on the GitHub repo.

For this post, we assume that you’re storing your data in Amazon Redshift over a few tables and that you wish to connect it Lookout for Metrics for anomaly detection.

The following diagram illustrates our solution architecture.

Solution Architecture

At a high level, we start with an AWS CloudFormation template that deploys the following components:

  • An Amazon SageMaker notebook instance that deploys the custom connector solution.
  • An AWS Step Functions workflow. The first step performs a historical crawl of your data; the second configures your detector (the trained model and endpoint for Lookout for Metrics).
  • An S3 bucket to house all your AWS Lambda functions as deployed (omitted from the architecture diagram).
  • An S3 bucket to house all your historical and continuous data.
  • A CloudFormation template and Lambda function that starts crawling your data on a schedule.

To modify this solution to fit your own environment, update the following:

  • A JSON configuration template that describes how your data should look to Lookout for Metrics and the name of your AWS Secrets Manager location used to retrieve authentication credentials.
  • A SQL query that retrieves your historical data.
  • A SQL query that retrieves your continuous data.

After you modify those components, you can deploy the template and be up and running within an hour.

Deploy the solution

To make this solution explorable from end to end, we have included a CloudFormation template that deploys a production-like Amazon Redshift cluster. It’s loaded with sample data for testing with Lookout for Metrics. This is a sample ecommerce dataset that projects roughly 2 years into the future from the publication of this post.

Create your Amazon Redshift cluster

Deploy the provided template to create the following resources in your account:

  • An Amazon Redshift cluster inside a VPC
  • Secrets Manager for authentication
  • A SageMaker notebook instance that runs all the setup processes for the Amazon Redshift database and initial dataset loading
  • An S3 bucket that is used to load data into Amazon Redshift

The following diagram illustrates how these components work together.

Production Redshift Setup

We provide Secrets Manager with credential information for your database, which is passed to a SageMaker notebook’s lifecycle policy that runs on boot. Once booted, the automation creates tables inside your Amazon Redshift cluster and loads data from Amazon S3 into the cluster for use with our custom connector.

To deploy these resources, complete the following steps:

  1. Choose Launch Stack:
  2. Choose Next.
    Setup step described by text
  3. Leave the stack details at their default and choose Next again.Setup step described by text
  4. Leave the stack options at their default and choose Next again.Setup step described by text
  1. Select I acknowledge that AWS CloudFormation might create IAM resources, then Choose Create stack.Setup step described by text

The job takes a few minutes to complete. You can monitor its progress on the AWS CloudFormation console.

CloudFormation Status

When the status changes to CREATE_COMPLETE, you’re ready to deploy the rest of the solution.

Stack Complete

Data structure

We have taken our standard ecommerce dataset and split it into three specific tables so that we can join them later via the custom connector. In all probability, your data is spread over various tables and needs to be normalized in a similar manner.

The first table indicates the user’s platform, (what kind of device users are using, such as phone or web browser).

ID Name
1 pc_web

The next table indicates our marketplace (where the users are located).

ID Name
1 JP

Our ecommerce table shows the total values for views and revenue at this time.

ID TS Platform Marketplace Views Revenue
1 01/10/2022 10:00:00 1 1 90 2458.90

When we run queries later in this post, they’re against a database with this structure.

Deploy a custom connector

After you deploy the previous template, complete the following steps to deploy a custom connector:

  1. On the AWS CloudFormation console, navigate to the Outputs tab of the template you deployed earlier.
    Outputs Link
  2. Note the value of RedshiftCluster and RedshiftSecret, then save them in a temporary file to use later.
    Output Values
  3. Choose Launch stack to deploy your resources with AWS CloudFormation:
  4. Choose Next.
    CloudFormation Setup
  5. Update the value for the RedshiftCluster and RedshiftSecret with the information you copied earlier.
  6. Choose Next.CloudFormation Setup
  7. Leave the stack options at their default and choose Next.Cloudformation Setup
  8. Select I acknowledge that AWS CloudFormation might create IAM resources, then choose Create stack.Cloudformation Setup

The process takes 30–40 minutes to complete, after which you have a fully deployed solution with the demo environment.

View your anomaly detector

After you deploy the solution, you can locate your detector and review any found anomalies.

  1. Sign in to the Lookout for Metrics console in us-east-1.
  2. In the navigation pane, choose Detectors.Lookout for Metrics Detectors Link

The Detectors page lists all your active detectors.

  1. Choose the detector l4m-custom-redshift-connector-detector.

Now you can view your detector’s configuration, configure alerts, and review anomalies.

To view anomalies, either choose Anomalies in the navigation page or choose View anomalies on the detector page.
View Anomalies Link

After a period of time, usually no more than a few days, you should see a list of anomalies on this page. You can explore them in depth to view how the data provided seemed anomalous. If you provided your own dataset, the anomalies may only show up after an unusual event.

Anomalies List

Now that you have the solution deployed and running, let’s discuss how this connector works in depth.

How a custom connector works

In this section, we discuss the connector’s core components. We also demonstrate how to build a custom connector, authenticate to Amazon Redshift, modify queries, and modify the detector and dataset.

Core components

You can run the following components and modify them to support your data needs:

When you deploy ai_ops/l4m-redshift-solution.yaml, it creates the following:

  • An S3 bucket for storing all Lambda functions.
  • A role for a SageMaker notebook that has access to modify all relevant resources.
  • A SageMaker notebook lifecycle config that contains the startup script to clone all automation onto the notebook and manage the params.json file. And runs the shell script (ai_ops/deploy_custom_connector.sh) to deploy the AWS SAM applications and further update the params.json file.

ai_ops/deploy_custom_connector.sh starts by deploying ai_ops/template.yaml, which creates the following:

  • An S3 bucket for storing the params.json file and all input data for Lookout for Metrics.
  • An S3 bucket policy to allow Lookout for Metrics to communicate with Amazon S3.
  • A Lambda function that is invoked on the bucket when the params.json file is uploaded and starts the Step Functions state machine.
  • An AWS Identity and Access Management (IAM) role to run the state machine.
  • A shared Lambda layer of support functions.
  • A role for Lookout for Metrics to access data in Amazon S3.
  • A Lambda function to crawl all historical data.
  • A Lambda function to create and activate a Lookout for Metrics detector.
  • A state machine that manages the flow between creating that historical dataset and the detector.

After ai_ops/deploy_custom_connector.sh creates the first batch of items, it updates the params.json file with new relevant information from the detector and the IAM roles. It also modifies the Amazon Redshift cluster to allow the new role for Lookout for Metrics to communicate with the cluster. After sleeping for 30 seconds to facilitate IAM propagation, the script copies the params.json file to the S3 bucket, which invokes the state machine deployed already.

Then the script deploys another AWS SAM application defined in l4m-redshift-continuous-crawl.yaml. This simple application defines and deploys an event trigger to initiate the crawling of live data on a schedule (hourly for example) and a Lambda function that performs the crawl.

Both the historical crawled data and the continuously crawled data arrives in the same S3 bucket. Lookout for Metrics uses the information first for training, then as inference data, where it’s checked for anomalies as it arrives.

Each Lambda function also contains a query.sql file that provides the base query that is handed to Amazon Redshift. Later the functions append UNLOAD to each query and deliver the data to Amazon S3 via CSV.

Build a custom connector

Start by forking this repository into your own account or downloading a copy for private development. When making substantial changes, make sure that the references to this particular repository in the following files are updated and point to publicly accessible endpoints for Git:

  • README.md – This file, in particular the Launch stack buttons, assumes you’re using the live version you see in this repository only
  • ai_ops/l4m-redshift-solution.yaml – In this template, a Jupyter notebook lifecycle configuration defines the repository to clone (deploys the custom connector)
  • sample_resources/redshift/l4m-redshift-sagemakernotebook.yaml – In this template, a Amazon SageMaker Notebook lifecycle configuration defines the repository to clone (deploys the production Amazon Redshift example).

Authenticate to Amazon Redshift

When exploring how to extend this into your own environment, the first thing to consider is the authentication to your Amazon Redshift cluster. You can accomplish this by using the Amazon Redshift Data API and by storing the credentials inside AWS Secrets Manager.

In Secrets Manager, this solution looks for the known secret name redshift-l4mintegration and contains a JSON structure like the following:

{
  "password": "DB_PASSWORD",
  "username": "DB_USERNAME",
  "dbClusterIdentifier": "REDSHIFT_CLUSTER_ID",
  "db": "DB_NAME",
  "host": "REDSHIFT_HOST",
  "port": 8192
}

If you want to use a different secret name than the one provided, you need to update the value in ai_ops/l4m-redshift-solution.yaml. If you want to change the other parameters’ names, you need to search for them in the repository and update their references accordingly.

Modify queries to Amazon Redshift

This solution uses the Amazon Redshift Data API to allow for queries that can be run asynchronously from the client calling for them.

Specifically, it allows a Lambda function to start a query with the database and then let the DB engine manage everything, including the writing of the data in a desired format to Amazon S3. Because we let the DB engine handle this, we simplify the operations of our Lambda functions and don’t have to worry about runtime limits. If you want to perform more complex transformations, you may want to build out more Step Functions-based AWS SAM applications to handle that work, perhaps even using Docker containers over Lambda.

For most modifications, you can edit the query files stored in the two Lambda functions provided:

Pay attention to the continuous crawl to make sure that the date ranges coincide with your desired detection interval. For example:

select ecommerce.ts as timestamp, ecommerce.views, ecommerce.revenue, platform.name as platform, marketplace.name as marketplace
from ecommerce, platform, marketplace
where ecommerce.platform = platform.id
	and ecommerce.marketplace = marketplace.id
    and ecommerce.ts < DATEADD(hour, 0, getdate())
    and ecommerce.ts > DATEADD(hour, -1, getdate())

The preceding code snippet is our demo continuous crawl function and uses the DATEADD function to compute data within the last hour. Coupled with the CloudWatch Events trigger that schedules this function for hourly, it allows us to stream data to Lookout for Metrics reliably.

The work defined in the query.sql files is only a portion of the final computed query. The full query is built by the respective Python files in each folder and appends the following:

  • IAM role for Amazon Redshift to use for the query
  • S3 bucket information for where to place the files
  • CSV file export defined

It looks like the following code:

unload ('select ecommerce.ts as timestamp, ecommerce.views, ecommerce.revenue, platform.name as platform, marketplace.name as marketplace
from ecommerce, platform, marketplace
where ecommerce.platform = platform.id
	and ecommerce.marketplace = marketplace.id
    and ecommerce.ts < DATEADD(hour, 0, getdate())
    and ecommerce.ts > DATEADD(hour, -1, getdate())') 
to 's3://BUCKET/ecommerce/live/20220112/1800/' 
iam_role 'arn:aws:iam::ACCOUNT_ID:role/custom-rs-connector-LookoutForMetricsRole-' header CSV;

As long as your prepared query can be encapsulated by the UNLOAD statement, it should work with no issues.

If you need to change the frequency for how often the continuous detector function runs, update the cron expression in ai_ops/l4m-redshift-continuous-crawl.yaml. It’s defined in the last line as Schedule: cron(0 * * * ? *).

Modify the Lookout for Metrics detector and dataset

The final components focus on Lookout for Metrics itself, mainly the detector and dataset configurations. They’re both defined in ai_ops/params.json.

The included file looks like the following code:

{
  "database_type": "redshift",  
  "detector_name": "l4m-custom-redshift-connector-detector",
    "detector_description": "A quick sample config of how to use L4M.",
    "detector_frequency": "PT1H",
    "timestamp_column": {
        "ColumnFormat": "yyyy-MM-dd HH:mm:ss",
        "ColumnName": "timestamp"
    },
    "dimension_list": [
        "platform",
        "marketplace"
    ],
    "metrics_set": [
        {
            "AggregationFunction": "SUM",
            "MetricName": "views"
        },
        {
            "AggregationFunction": "SUM",
            "MetricName": "revenue"
        }
    ],
    "metric_source": {
        "S3SourceConfig": {
            "FileFormatDescriptor": {
                "CsvFormatDescriptor": {
                    "Charset": "UTF-8",
                    "ContainsHeader": true,
                    "Delimiter": ",",
                    "FileCompression": "NONE",
                    "QuoteSymbol": "\""
                }
            },
            "HistoricalDataPathList": [
                "s3://id-ml-ops2-inputbucket-18vaudty8qtec/ecommerce/backtest/"
            ],
            "RoleArn": "arn:aws:iam::ACCOUNT_ID:role/id-ml-ops2-LookoutForMetricsRole-IZ5PL6M7YKR1",
            "TemplatedPathList": [
                    ""
                ]
        }
    },
    "s3_bucket": "",
    "alert_name": "alerter",
    "alert_threshold": 1,
    "alert_description": "Exports anomalies into s3 for visualization",
    "alert_lambda_arn": "",
    "offset": 300,
    "secret_name": "redshift-l4mintegration"
}

ai_ops/params.json manages the following parameters:

  • database_type
  • detector_name
  • detector_description
  • detector_frequency
  • timestamp_column and details
  • dimension_list
  • metrics_set
  • offset

Not every value can be defined statically ahead of time; these are updated by ai_ops/params_builder.py:

  • HistoricalDataPathList
  • RoleArn
  • TemplatedPathList
  • s3_bucket

To modify any of these entities, update the file responsible for them and your detector is modified accordingly.

Clean up

Follow the steps in this section to clean up all resources created by this solution and make sure you’re not billed after evaluating or using the solution.

  1. Empty all data from the S3 buckets that were created from their respective templates:
    1. ProductionRedshiftDemo – S3ContentBucket
    2. CustomRedshiftConnector – S3LambdaBucket
    3. custom-rs-connector – InputBucket
  2. Delete your detector via the Lookout for Metrics console.
  3. Delete the CloudFormation stacks in the following order (wait for one to complete before moving onto the next):
    1. custom-rs-connector-crawl
    2. custom-rs-connector
    3. CustomRedshiftConnector
    4. ProductionRedshiftDemo

Conclusion

You have now seen how to connect an Amazon Redshift database to Lookout for Metrics using the native Amazon Redshift Data APIs, CloudWatch Events, and Lambda functions. This approach allows you to create relevant datasets based on your information in Amazon Redshift to perform anomaly detection on your time series data in just a few minutes. If you can draft the SQL query to obtain the information, you can enable ML-powered anomaly detection on your data. From there, your anomalies should showcase anomalous events and help you understand how one anomaly may be caused or impacted by others, thereby reducing your time to understanding issues critical to your business or workload.


About the Authors

Chris King is a Principal Solutions Architect in Applied AI with AWS. He has a special interest in launching AI services and helped grow and build Amazon Personalize and Amazon Forecast before focusing on Amazon Lookout for Metrics. In his spare time he enjoys cooking, reading, boxing, and building models to predict the outcome of combat sports.

Alex Kim is a Sr. Product Manager for Amazon Forecast. His mission is to deliver AI/ML solutions to all customers who can benefit from it. In his free time, he enjoys all types of sports and discovering new places to eat.
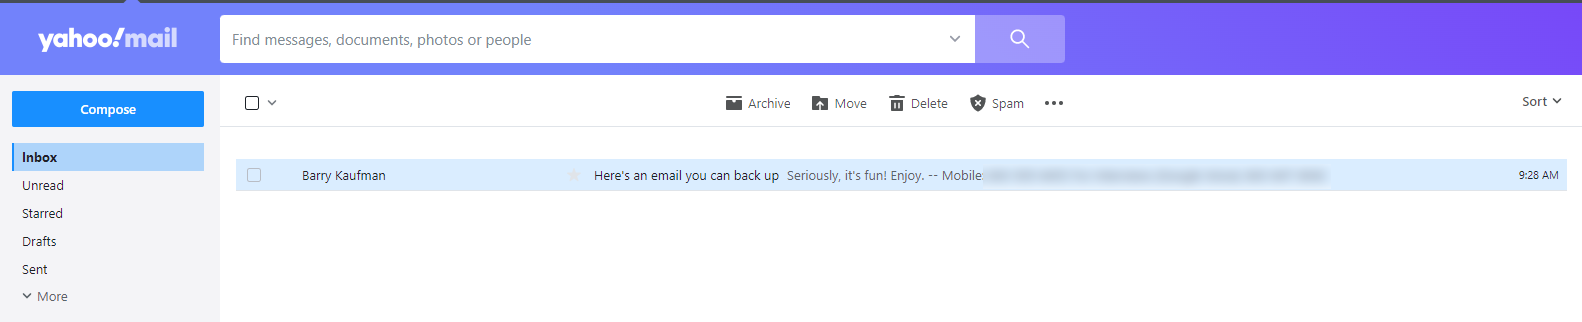
Query and visualize Amazon Redshift operational metrics using the Amazon Redshift plugin for Grafana

Post Syndicated from Sergey Konoplev original https://aws.amazon.com/blogs/big-data/query-and-visualize-amazon-redshift-operational-metrics-using-the-amazon-redshift-plugin-for-grafana/

Grafana is a rich interactive open-source tool by Grafana Labs for visualizing data across one or many data sources. It’s used in a variety of modern monitoring stacks, allowing you to have a common technical base and apply common monitoring practices across different systems. Amazon Managed Grafana is a fully managed, scalable, and secure Grafana-as-a-service solution developed by AWS in collaboration with Grafana Labs.

Amazon Redshift is the most widely used data warehouse in the cloud. You can view your Amazon Redshift cluster’s operational metrics on the Amazon Redshift console, use AWS CloudWatch, and query Amazon Redshift system tables directly from your cluster. The first two options provide a set of predefined general metrics and visualizations. The last one allows you to use the flexibility of SQL to get deep insights into the details of the workload. However, querying system tables requires knowledge of system table structures. To address that, we came up with a consolidated Amazon Redshift Grafana dashboard that visualizes a set of curated operational metrics and works on top of the Amazon Redshift Grafana data source. You can easily add it to an Amazon Managed Grafana workspace, as well as to any other Grafana deployments where the data source is installed.

This post guides you through a step-by-step process to create an Amazon Managed Grafana workspace and configure an Amazon Redshift cluster with a Grafana data source for it. Lastly, we show you how to set up the Amazon Redshift Grafana dashboard to visualize the cluster metrics.

Solution overview

The following diagram illustrates the solution architecture.

Architecture Diagram

The solution includes the following components:

  • The Amazon Redshift cluster to get the metrics from.
  • Amazon Managed Grafana, with the Amazon Redshift data source plugin added to it. Amazon Managed Grafana communicates with the Amazon Redshift cluster via the Amazon Redshift Data Service API.
  • The Grafana web UI, with the Amazon Redshift dashboard using the Amazon Redshift cluster as the data source. The web UI communicates with Amazon Managed Grafana via an HTTP API.

We walk you through the following steps during the configuration process:

  1. Configure an Amazon Redshift cluster.
  2. Create a database user for Amazon Managed Grafana on the cluster.
  3. Configure a user in AWS Single Sign-On (AWS SSO) for Amazon Managed Grafana UI access.
  4. Configure an Amazon Managed Grafana workspace and sign in to Grafana.
  5. Set up Amazon Redshift as the data source in Grafana.
  6. Import the Amazon Redshift dashboard supplied with the data source.

Prerequisites

To follow along with this walkthrough, you should have the following prerequisites:

  • An AWS account
  • Familiarity with the basic concepts of the following services:
    • Amazon Redshift
    • Amazon Managed Grafana
    • AWS SSO

Configure an Amazon Redshift cluster

If you don’t have an Amazon Redshift cluster, create a sample cluster before proceeding with the following steps. For this post, we assume that the cluster identifier is called redshift-demo-cluster-1 and the admin user name is awsuser.

  1. On the Amazon Redshift console, choose Clusters in the navigation pane.
  2. Choose your cluster.
  3. Choose the Properties tab.

Redshift Cluster Properties

To make the cluster discoverable by Amazon Managed Grafana, you must add a special tag to it.

  1. Choose Add tags. Redshift Cluster Tags
  2. For Key, enter GrafanaDataSource.
  3. For Value, enter true.
  4. Choose Save changes.

Redshift Cluster Tags

Create a database user for Amazon Managed Grafana

Grafana will be directly querying the cluster, and it requires a database user to connect to the cluster. In this step, we create the user redshift_data_api_user and apply some security best practices.

  1. On the cluster details page, choose Query data and Query in query editor v2.Query Editor v2
  2. Choose the redshift-demo-cluster-1 cluster we created previously.
  3. For Database, enter the default dev.
  4. Enter the user name and password that you used to create the cluster.
  5. Choose Create connection.Redshift SU
  6. In the query editor, enter the following statements and choose Run:
CREATE USER redshift_data_api_user PASSWORD '&lt;password&gt;' CREATEUSER;
ALTER USER redshift_data_api_user SET readonly TO TRUE;
ALTER USER redshift_data_api_user SET query_group TO 'superuser';

The first statement creates a user with superuser privileges necessary to access system tables and views (make sure to use a unique password). The second prohibits the user from making modifications. The last statement isolates the queries the user can run to the superuser queue, so they don’t interfere with the main workload.

In this example, we use service managed permissions in Amazon Managed Grafana and a workspace AWS Identity and Access Management (IAM) role as an authentication provider in the Amazon Redshift Grafana data source. We create the database user redshift_data_api_user using the AmazonGrafanaRedshiftAccess policy.

Configure a user in AWS SSO for Amazon Managed Grafana UI access

Two authentication methods are available for accessing Amazon Managed Grafana: AWS SSO and SAML. In this example, we use AWS SSO.

  1. On the AWS SSO console, choose Users in the navigation pane.
  2. Choose Add user.
  3. In the Add user section, provide the required information.

SSO add user

In this post, we select Send an email to the user with password setup instructions. You need to be able to access the email address you enter because you use this email further in the process.

  1. Choose Next to proceed to the next step.
  2. Choose Add user.

An email is sent to the email address you specified.

  1. Choose Accept invitation in the email.

You’re redirected to sign in as a new user and set a password for the user.

  1. Enter a new password and choose Set new password to finish the user creation.

Configure an Amazon Managed Grafana workspace and sign in to Grafana

Now you’re ready to set up an Amazon Managed Grafana workspace.

  1. On the Amazon Grafana console, choose Create workspace.
  2. For Workspace name, enter a name, for example grafana-demo-workspace-1.
  3. Choose Next.
  4. For Authentication access, select AWS Single Sign-On.
  5. For Permission type, select Service managed.
  6. Chose Next to proceed.AMG Workspace configure
  7. For IAM permission access settings, select Current account.AMG permission
  8. For Data sources, select Amazon Redshift.
  9. Choose Next to finish the workspace creation.Redshift to workspace

You’re redirected to the workspace page.

Next, we need to enable AWS SSO as an authentication method.

  1. On the workspace page, choose Assign new user or group.SSO new user
  2. Select the previously created AWS SSO user under Users and Select users and groups tables.SSO User

You need to make the user an admin, because we set up the Amazon Redshift data source with it.

  1. Select the user from the Users list and choose Make admin.
  2. Go back to the workspace and choose the Grafana workspace URL link to open the Grafana UI.AMG workspace
  3. Sign in with the user name and password you created in the AWS SSO configuration step.

Set up an Amazon Redshift data source in Grafana

To visualize the data in Grafana, we need to access the data first. To do so, we must create a data source pointing to the Amazon Redshift cluster.

  1. On the navigation bar, choose the lower AWS icon (there are two) and then choose Redshift from the list.
  2. For Regions, choose the Region of your cluster.
  3. Select the cluster from the list and choose Add 1 data source.Choose Redshift Cluster
  4. On the Provisioned data sources page, choose Go to settings.
  5. For Name, enter a name for your data source.
  6. By default, Authentication Provider should be set as Workspace IAM Role, Default Region should be the Region of your cluster, and Cluster Identifier should be the name of the chosen cluster.
  7. For Database, enter dev.
  8. For Database User, enter redshift_data_api_user.
  9. Choose Save & Test.Settings for Data Source

A success message should appear.

Data source working

Import the Amazon Redshift dashboard supplied with the data source

As the last step, we import the default Amazon Redshift dashboard and make sure that it works.

  1. In the data source we just created, choose Dashboards on the top navigation bar and choose Import to import the Amazon Redshift dashboard.Dashboards in the plugin
  2. Under Dashboards on the navigation sidebar, choose Manage.
  3. In the dashboards list, choose Amazon Redshift.

The dashboard appear, showing operational data from your cluster. When you add more clusters and create data sources for them in Grafana, you can choose them from the Data source list on the dashboard.

Clean up

To avoid incurring unnecessary charges, delete the Amazon Redshift cluster, AWS SSO user, and Amazon Managed Grafana workspace resources that you created as part of this solution.

Conclusion

In this post, we covered the process of setting up an Amazon Redshift dashboard working under Amazon Managed Grafana with AWS SSO authentication and querying from the Amazon Redshift cluster under the same AWS account. This is just one way to create the dashboard. You can modify the process to set it up with SAML as an authentication method, use custom IAM roles to manage permissions with more granularity, query Amazon Redshift clusters outside of the AWS account where the Grafana workspace is, use an access key and secret or AWS Secrets Manager based connection credentials in data sources, and more. You can also customize the dashboard by adding or altering visualizations using the feature-rich Grafana UI.

Because the Amazon Redshift data source plugin is an open-source project, you can install it in any Grafana deployment, whether it’s in the cloud, on premises, or even in a container running on your laptop. That allows you to seamlessly integrate Amazon Redshift monitoring into virtually all your existing Grafana-based monitoring stacks.

For more details about the systems and processes described in this post, refer to the following:


About the Authors

Sergey Konoplev is a Senior Database Engineer on the Amazon Redshift team. Sergey has been focusing on automation and improvement of database and data operations for more than a decade.

Milind Oke is a Data Warehouse Specialist Solutions Architect based out of New York. He has been building data warehouse solutions for over 15 years and specializes in Amazon Redshift.

Build a serverless pipeline to analyze streaming data using AWS Glue, Apache Hudi, and Amazon S3

Post Syndicated from Nikhil Khokhar original https://aws.amazon.com/blogs/big-data/build-a-serverless-pipeline-to-analyze-streaming-data-using-aws-glue-apache-hudi-and-amazon-s3/

Organizations typically accumulate massive volumes of data and continue to generate ever-exceeding data volumes, ranging from terabytes to petabytes and at times to exabytes of data. Such data is usually generated in disparate systems and requires an aggregation into a single location for analysis and insight generation. A data lake architecture allows you to aggregate data present in various silos, store it in a centralized repository, enforce data governance, and support analytics and machine learning (ML) on top of this stored data.

Typical building blocks to implement such an architecture include a centralized repository built on Amazon Simple Storage Service (Amazon S3) providing the least possible unit cost of storage per GB, big data ETL (extract, transform, and load) frameworks such as AWS Glue, and analytics using Amazon Athena, Amazon Redshift, and Amazon EMR notebooks.

Building such systems involves technical challenges. For example, data residing in S3 buckets can’t be updated in-place using standard data ingestion approaches. Therefore, you must perform constant ad-hoc ETL jobs to consolidate data into new S3 files and buckets.

This is especially the case with streaming sources, which require constant support for increasing data velocity to provide faster insights generation. An example use case might be an ecommerce company looking to build a real-time date lake. They need their solution to do the following:

  • Ingest continuous changes (like customer orders) from upstream systems
  • Capture tables into the data lake
  • Provide ACID properties on the data lake to support interactive analytics by enabling consistent views on data while new data is being ingested
  • Provide schema flexibility due to upstream data layout changes and provisions for late arrival of data

To deliver on these requirements, organizations have to build custom frameworks to handle in-place updates (also referred as upserts), handle small files created due to the continuous ingestion of changes from upstream systems (such as databases), handle schema evolution, and compromise on providing ACID guarantees on its data lake.

A processing framework like Apache Hudi can be a good way solve such challenges. Hudi allows you to build streaming data lakes with incremental data pipelines, with support for transactions, record-level updates, and deletes on data stored in data lakes. Hudi is integrated with various AWS analytics services, like AWS Glue, Amazon EMR, Athena, and Amazon Redshift. This helps you ingest data from a variety of sources via batch streaming while enabling in-place updates to an append-oriented storage system such as Amazon S3 (or HDFS). In this post, we discuss a serverless approach to integrate Hudi with a streaming use case and create an in-place updatable data lake on Amazon S3.

Solution overview

We use Amazon Kinesis Data Generator to send sample streaming data to Amazon Kinesis Data Streams. To consume this streaming data, we set up an AWS Glue streaming ETL job that uses the Apache Hudi Connector for AWS Glue to write ingested and transformed data to Amazon S3, and also creates a table in the AWS Glue Data Catalog.

After the data is ingested, Hudi organizes a dataset into a partitioned directory structure under a base path pointing to a location in Amazon S3. Data layout in these partitioned directories depends on the Hudi dataset type used during ingestion, such as Copy on Write (CoW) and Merge on Read (MoR). For more information about Hudi storage types, see Using Athena to Query Apache Hudi Datasets and Storage Types & Views.

CoW is the default storage type of Hudi. In this storage type, data is stored in columnar format (Parquet). Each ingestion creates a new version of files during a write. With CoW, each time there is an update to a record, Hudi rewrites the original columnar file containing the record with the updated values. Therefore, this is better suited for read-heavy workloads on data that changes less frequently.

The MoR storage type is stored using a combination of columnar (Parquet) and row-based (Avro) formats. Updates are logged to row-based delta files and are compacted to create new versions of columnar files. With MoR, each time there is an update to a record, Hudi writes only the row for the changed record into the row-based (Avro) format, which is compacted (synchronously or asynchronously) to create columnar files. Therefore, MoR is better suited for write or change-heavy workloads with a lesser amount of read.

For this post, we use the CoW storage type to illustrate our use case of creating a Hudi dataset and serving the same via a variety of readers. You can extend this solution to support MoR storage via selecting the specific storage type during ingestion. We use Athena to read the dataset. We also illustrate the capabilities of this solution in terms of in-place updates, nested partitioning, and schema flexibility.

The following diagram illustrates our solution architecture.

Create the Apache Hudi connection using the Apache Hudi Connector for AWS Glue

To create your AWS Glue job with an AWS Glue custom connector, complete the following steps:

  1. On the AWS Glue Studio console, choose Marketplace in the navigation pane.
  2. Search for and choose Apache Hudi Connector for AWS Glue.
  3. Choose Continue to Subscribe.

  4. Review the terms and conditions and choose Accept Terms.
  5. Make sure that the subscription is complete and you see the Effective date populated next to the product, then choose Continue to Configuration.
  6. For Delivery Method, choose Glue 3.0.
  7. For Software Version, choose the latest version (as of this writing, 0.9.0 is the latest version of the Apache Hudi Connector for AWS Glue).
  8. Choose Continue to Launch.
  9. Under Launch this software, choose Usage Instructions and then choose Activate the Glue connector for Apache Hudi in AWS Glue Studio.

You’re redirected to AWS Glue Studio.

  1. For Name, enter a name for your connection (for example, hudi-connection).
  2. For Description, enter a description.
  3. Choose Create connection and activate connector.

A message appears that the connection was successfully created, and the connection is now visible on the AWS Glue Studio console.

Configure resources and permissions

For this post, we provide an AWS CloudFormation template to create the following resources:

  • An S3 bucket named hudi-demo-bucket-<your-stack-id> that contains a JAR artifact copied from another public S3 bucket outside of your account. This JAR artifact is then used to define the AWS Glue streaming job.
  • A Kinesis data stream named hudi-demo-stream-<your-stack-id>.
  • An AWS Glue streaming job named Hudi_Streaming_Job-<your-stack-id> with a dedicated AWS Glue Data Catalog named hudi-demo-db-<your-stack-id>. Refer to the aws-samples github repository for the complete code of the job.
  • AWS Identity and Access Management (IAM) roles and policies with appropriate permissions.
  • AWS Lambda functions to copy artifacts to the S3 bucket and empty buckets first upon stack deletion.

To create your resources, complete the following steps:

  1. Choose Launch Stack:
  2. For Stack name, enter hudi-connector-blog-for-streaming-data.
  3. For HudiConnectionName, use the name you specified in the previous section.
  4. Leave the other parameters as default.
  5. Choose Next.
  6. Select I acknowledge that AWS CloudFormation might create IAM resources with custom names.
  7. Choose Create stack.

Set up Kinesis Data Generator

In this step, you configure Kinesis Data Generator to send sample data to a Kinesis data stream.

  1. On the Kinesis Data Generator console, choose Create a Cognito User with CloudFormation.

You’re redirected to the AWS CloudFormation console.

  1. On the Review page, in the Capabilities section, select I acknowledge that AWS CloudFormation might create IAM resources.
  2. Choose Create stack.
  3. On the Stack details page, in the Stacks section, verify that the status shows CREATE_COMPLETE.
  4. On the Outputs tab, copy the URL value for KinesisDataGeneratorUrl.
  5. Navigate to this URL in your browser.
  6. Enter the user name and password provided and choose Sign In.

Start an AWS Glue streaming job

To start an AWS Glue streaming job, complete the following steps:

  1. On the AWS CloudFormation console, navigate to the Resources tab of the stack you created.
  2. Copy the physical ID corresponding to the AWS::Glue::Job resource.
  3. On the AWS Glue Studio console, find the job name using the physical ID.
  4. Choose the job to review the script and job details.
  5. Choose Run to start the job.
  6. On the Runs tab, validate if the job is successfully running.

Send sample data to a Kinesis data stream

Kinesis Data Generator generates records using random data based on a template you provide. Kinesis Data Generator extends faker.js, an open-source random data generator.

In this step, you use Kinesis Data Generator to send sample data using a sample template using the faker.js documentation to the previously created data stream created at one record per second rate. You sustain the ingestion until the end of this tutorial to achieve reasonable data for analysis while performing the remaining steps.

  1. On the Kinesis Data Generator console, for Records per second, choose the Constant tab, and change the value to 1.
  2. For Record template, choose the Template 1 tab, and enter the following code sample into the text box:
    {
     "name" : "{{random.arrayElement(["Person1","Person2","Person3", "Person4"])}}",  
     "date": "{{date.utc(YYYY-MM-DD)}}",
     "year": "{{date.utc(YYYY)}}",
     "month": "{{date.utc(MM)}}",
     "day": "{{date.utc(DD)}}",
     "column_to_update_integer": {{random.number(1000000000)}},
     "column_to_update_string": "{{random.arrayElement(["White","Red","Yellow", "Silver"])}}" 
    }

  3. Choose Test template.
  4. Verify the structure of the sample JSON records and choose Close.
  5. Choose Send data.
  6. Leave the Kinesis Data Generator page open to ensure sustained streaming of random records into the data stream.

Continue through the remaining steps while you generate your data.

Verify dynamically created resources

While you’re generating data for analysis, you can verify the resources you created.

Amazon S3 dataset

When the AWS Glue streaming job runs, the records from the Kinesis data stream are consumed and stored in an S3 bucket. While creating Hudi datasets in Amazon S3, the streaming job can also create a nested partition structure. This is enabled through the usage of Hudi configuration properties hoodie.datasource.write.partitionpath.field and hoodie.datasource.write.keygenerator.class in the streaming job definition.

In this example, nested partitions have been created by name, year, month, and day. The values of these properties are set as follows in the script for the AWS Glue streaming job.

For further details on how CustomKeyGenerator works to generate such partition paths, refer to Apache Hudi Key Generators.

The following screenshot shows the nested partitions created in Amazon S3.

AWS Glue Data Catalog table

A Hudi table is also created in the AWS Glue Data Catalog and mapped to the Hudi datasets on Amazon S3. See the following code in the AWS Glue streaming job.

The following table provides more details on the configuration options.

hoodie.datasource.hive_sync.enable Indicates if the table is synced to Apache Hive Metastore.
hoodie.datasource.hive_sync.sync_as_datasource Avoids breaking changes introduced with HUDI-1415 (JIRA).
hoodie.datasource.hive_sync.database The database name for your Data Catalog.
hoodie.datasource.hive_sync.table The table name in your Data Catalog.
hoodie.datasource.hive_sync.use_jdbc Uses JDBC for Hive synchronization. For more information, see the GitHub repo.
hoodie.datasource.write.hive_style_partitioning Creates partitions with <partition_column_name>=<partition_value> format.
hoodie.datasource.hive_sync.partition_extractor_class Required for nested partitioning.
hoodie.datasource.hive_sync.partition_fields Columns in the table to use for Hive partition columns.

The following screenshot shows the Hudi table in the Data Catalog and the associated S3 bucket.

Read results using Athena

Using Hudi with an AWS Glue streaming job allows us to have in-place updates (upserts) on the Amazon S3 data lake. This functionality allows for incremental processing, which enables faster and more efficient downstream pipelines. Apache Hudi enables in-place updates with the following steps:

  1. Define an index (using columns of the ingested record).
  2. Use this index to map every subsequent ingestion to the record storage locations (in our case Amazon S3) ingested previously.
  3. Perform compaction (synchronously or asynchronously) to allow the retention of the latest record for a given index.

In reference to our AWS Glue streaming job, the following Hudi configuration options enable us to achieve in-place updates for the generated schema.

The following table provides more details of the highlighted configuration options.

hoodie.datasource.write.recordkey.field Indicates the column to be used within the ingested record for the Hudi index.
hoodie.datasource.write.operation Defines the nature of operation on the Hudi dataset. In this example, it’s set to upsert for in-place updates.
hoodie.datasource.write.table.type Indicates the Hudi storage type to be used. In this example, it’s set to COPY_ON_WRITE.
hoodie.datasource.write.precombine.field When two records have the same key value, Apache Hudi picks the one with the largest value for the precombined field.

To demonstrate an in-place update, consider the following input records sent to the AWS Glue streaming job via Kinesis Data Generator. The record identifier highlighted indicates the Hudi record key in the AWS Glue configuration. In this example, Person3 receives two updates. In first update, column_to_update_string is set to White; in the second update, it’s set to Red.

The streaming job processes these records and creates the Hudi datasets in Amazon S3. You can query the dataset using Athena. In the following example, we get the latest update.

Schema flexibility

The AWS Glue streaming job allows for automatic handling of different record schemas encountered during the ingestion. This is specifically useful in situations where record schemas can be subject to frequent changes. To elaborate on this point, consider the following scenario:

  • Case 1 – At time t1, the ingested record has the layout <col 1, col 2, col 3, col 4>
  • Case 2 – At time t2, the ingested record has an extra column, with new layout <col 1, col 2, col 3, col 4, col 5>
  • Case 3 – At time t3, the ingested record dropped the extra column and therefore has the layout <col 1, col 2, col 3, col 4>

For Case 1 and 2, the AWS Glue streaming job relies on the built-in schema evolution capabilities of Hudi, which enables an update to the Data Catalog with the extra column (col 5 in this case). Additionally, Hudi also adds an extra column in the output files (Parquet files written to Amazon S3). This allows for the querying engine (Athena) to query the Hudi dataset with an extra column without any issues.

Because Case 2 ingestion updates the Data Catalog, the extra column (col 5) is expected to be present in every subsequent ingested record. If we don’t resolve this difference, the job fails.

To overcome this and achieve Case 3, the streaming job defines a custom function named evolveSchema, which handles the record layout mismatches. The method queries the AWS Glue Data Catalog for each to-be-ingested record and gets the current Hudi table schema. It then merges the Hudi table schema with the schema of the to-be-ingested record and enriches the schema of the record before exposing with the Hudi dataset.

For this example, the to-be-ingested record’s schema <col 1, col 2, col 3, col 4> is modified to <col 1, col 2, col 3, col 4, col 5>, where the value of the extra col 5 is set to NULL.

To illustrate this, we stop the existing ingestion of Kinesis Data Generator and modify the record layout to send an extra column called new_column:

{
 "name" : "{{random.arrayElement(["Person1","Person2","Person3", "Person4"])}}",  
 "date": "{{date.utc(YYYY-MM-DD)}}",
 "year": "{{date.utc(YYYY)}}",
 "month": "{{date.utc(MM)}}",
 "day": "{{date.utc(DD)}}",
 "column_to_update_integer": {{random.number(1000000000)}},
 "column_to_update_string": "{{random.arrayElement(["White","Red","Yellow", "Silver"])}}",
 "new_column": "{{random.number(1000000000)}}" 
}

The Hudi table in the Data Catalog updates as follows, with the newly added column (Case 2).

When we query the Hudi dataset using Athena, we can see the presence of a new column.

We can now use Kinesis Data Generator to send records with an old schema—without the newly added column (Case 3).

In this scenario, our AWS Glue job keeps running. When we query using Athena, the extra added column gets populated with NULL values.

If we stop Kinesis Data Generator and start sending records with a schema containing extra columns, the job keeps running and the Athena query continues to return the latest values.

Clean up

To avoid incurring future charges, delete the resources you created as part of the CloudFormation stack.

Summary

This post illustrated how to set up a serverless pipeline using an AWS Glue streaming job with the Apache Hudi Connector for AWS Glue, which runs continuously and consumes data from Kinesis Data Streams to create a near-real-time data lake that supports in-place updates, nested partitioning, and schema flexibility.

You can also use Apache Kafka and Amazon Managed Streaming for Apache Kafka (Amazon MSK) as the source of a similar streaming job. We encourage you to use this approach for setting up a near-real-time data lake. As always, AWS welcomes feedback, so please leave your thoughts or questions in the comments.


About the Authors

Nikhil Khokhar is a Solutions Architect at AWS. He joined AWS in 2016 and specializes in building and supporting data streaming solutions that help customers analyze and get value out of their data. In his free time, he makes use of his 3D printing skills to solve everyday problems.

Dipta S Bhattacharya is a Solutions Architect Manager at AWS. Dipta joined AWS in 2018. He works with large startup customers to design and develop architectures on AWS and support their journey on the cloud.

Let’s Architect! Tools for Cloud Architects

Post Syndicated from Luca Mezzalira original https://aws.amazon.com/blogs/architecture/lets-architect-tools-for-cloud-architects/

This International Women’s Day, we’re featuring more than a week’s worth of posts that highlight female builders and leaders. We’re showcasing women in the industry who are building, creating, and, above all, inspiring, empowering, and encouraging everyone—especially women and girls—in tech.


A great way for cloud architects to learn is to experiment with the tools that our teams are using or could consider for the future. This allows us to learn new technologies, become familiar with the latest trends, and understand the entire cycle of our solutions.

Amazon Web Services (AWS) provides several tools for architects, including resources that can analyze your environment for creating a visual diagram and a community of builders who can answer your technical questions.

Today we’re excited to share  tools and methodologies that you should be aware of. In honor of the Architecture Blog’s International Women’s Day, half of these tools have been developed with and by women.

AWS Perspective

One of the main challenges for every architect is making sure their documentation is up to date. Recently, we’ve seen the rise of “architecture as code” tools for deriving architecture diagrams directly from the code in production.

In that vein, AWS developed AWS Perspective, a diagramming tool solution that helps you represent your live workload.

AWS Perspective analyzes your environment and creates a diagram with all your cloud components

AWS Perspective analyzes your environment and creates a diagram with all your cloud components

Chaos Testing with AWS Fault Injection Simulator and AWS CodePipeline

Chaos engineering is the process of testing a distributed computing system to ensure that it can withstand unexpected disruptions.

This blog post shows an architecture pattern for automating chaos testing as part of your continuous integration/continuous delivery (CI/CD) process. By automating the implementation of chaos experiments inside CI/CD pipelines, complex risks and modeled failure scenarios can be tested against application environments with every deployment

This high-level architecture shows how to automate chaos engineering in your environment

This high-level architecture shows how to automate chaos engineering in your environment

AWS re:Post – A Reimagined Q&A Experience for the AWS Community

Often when architecting we run into different design choices, issues, and roadblocks. What service should you use? What is the best way to implement this? Who do you ask?

AWS re:Post is a new question-and-answer service (think Stack Overflow specifically for AWS). It is monitored by the community who answers your questions, and then employees and official partners review these answers to ensure accuracy.

AWS re:Post is public. There is a wide community of AWS experts ready to answer your questions

AWS re:Post is public. There is a wide community of AWS experts ready to answer your questions

Establishing Feedback Loops Based on the AWS Well-Architected Framework Review

In 2018, AWS released the Well-Architected Framework, a mechanism for reviewing and/or improving your workloads that provides recommendations based on best practices in different areas such as security, costs optimization, or reliability. This article shows you how to improve iteratively your systems in the cloud using the Well-Architected Framework.

Creating a healthy feedback loop will enhance your architecture over time

Creating a healthy feedback loop will enhance your architecture over time

See you next time!

Thanks for reading! If you’re looking for more ways tools to architect your workload, check out the AWS Architecture Center.

See you in a couple of weeks when we discuss blockchain!

Other posts in this series

3 Reasons to Join Rapid7’s Cloud Security Summit

Post Syndicated from Ben Austin original https://blog.rapid7.com/2022/03/09/3-reasons-to-join-rapid7s-cloud-security-summit/

3 Reasons to Join Rapid7’s Cloud Security Summit

The world of the cloud never stops moving — so neither can cloud security. In the face of rapidly evolving technology and a constantly changing threat landscape, keeping up with all the latest developments, trends, and best practices in this emerging practice is more vital than ever.

Enter Rapid7’s third annual Cloud Security Summit, which we’ll be hosting this year on Tuesday, March 29. This one-day virtual event is dedicated to cloud security best practices and will feature industry experts from Rapid7, as well as Amazon Web Services (AWS), Snyk, and more.

While the event is fully virtual and free, we know that the time commitment can be the most challenging part of attending a multi-hour event during the workday. With that in mind, we’ve compiled a short list of the top reasons you’ll definitely want to register, clear your calendar, and attend this event.

Reason 1: Get a sneak peak at some original cloud security research

During the opening session of this year’s summit, two members of Rapid7’s award-winning security research team will be presenting some never-before-published research on the current state of cloud security operations, the most common misconfigurations in 2021, Log4j, and more.

Along with being genuinely interesting data, this research will also give you some insights and benchmarks that will help you evaluate your own cloud security program, and prioritize the most commonly exploited risks in your organization’s environment.

Reason 2: Learn from industry experts, and get CPE credits

Along with a handful of team member’s from Rapid7’s own cloud security practice, this year’s summit includes a host of subject matter experts from across the industry. You can look forward to hearing from Merritt Baer, Principal in the Office of the CISO at Amazon Web Services; Anthony Seto, Field Director for Cloud Native Application Security at Snyk; Keith Hoodlet, Code Security Architect at GitHub; and more. And that doesn’t even include the InsightCloudSec customers who will be joining to share their expert perspectives as well.

While learning and knowledge gain are clearly the most important aspects here, it’s always great to have something extra to show for the time you devoted to an event like this. To help make the case to your management that this event is more than worth the time you’ll put in, we’ve arranged for all attendees to earn 3.5 continuing professional education (CPE) credits to go toward maintaining or upgrading security certifications, such as CISSP, CISM, and more.

Reason 3: Be the first to hear exciting Rapid7 announcements

Last but not least, while the event is primarily focused on cloud security research, strategies, and thought leadership, we are also planning to pepper in some exciting news related to InsightCloudSec, Rapid7’s cloud-native security platform.

We’ll end the day with a demonstration of the product, so you can see some of our newest capabilities in action. Whether you’re already an InsightCloudSec customer, or considering a new solution for uncovering misconfigurations, automating cloud security workflows, shifting left, and more, this is the best way to get a live look at one of the top solutions available in the market today.  

So what are you waiting for? Come join us, and let’s dive into the latest and greatest in cloud security together.

Join our 2022 Cloud Security Summit

Register Now

Additional reading

The collective thoughts of the interwebz