Backblaze Drive Stats for Q1 2025

Post Syndicated from Drive Stats Team original https://www.backblaze.com/blog/backblaze-drive-stats-for-q1-2025/

A decorative image showing the title Backblaze Q1 2025 Drive Stats.

Welcome to the first Drive Stats of 2025. In case you missed it, the 2024 Drive Stats report was the last for long-time Drive Stats guru, Andy Klein, who is happily retired—off putting the “green” in greener pastures by working on his golf game. We–being Backblaze staff writer Stephanie Doyle and Chief Technical Evangelist Pat Patterson–are picking up where Andy left off, bringing you the metrics and analysis you know and love. Now, on to the numbers! 

As of March 31, 2025, we had 312,831 drives under management. Of that total, there were 3,970 boot drives and 308,861 data drives. We’ll review their annualized failure rates (AFRs) as of Q1 2025, and we’ll dig into the average age of drive failure by model, drive size, and more. Along the way, we’ll share our observations and insights on the data presented and, this time around, we’ve got some exciting updates to share about how we produce Drive Stats. (Stay tuned, fellow Snowflake fans.) 

As always, we look forward to your thoughts—we’ll see you in the comments section. 

Sign up for the Drive Stats LinkedIn Live

Ready to dive deeper into the data? Tune in Thursday, May 15, 2025 at 10:00 a.m. PT, to query the new Drive Stats team, Stephanie Doyle and Pat Patterson. Feel free to drop us a line with any questions you want us to answer.

Sign Up for the LinkedIn Live ➔

Q1 2025 hard drive failure rates

As mentioned above, at the end of Q1 2025, we were running 312,831 drives. During the quarter as a whole, however, we were monitoring a total of 318,426 drives; this count includes those that were taken out of service during the quarter, either because they failed or were only used temporarily. 

We’ll discuss the criteria we used in the next section of this report. Removing these drives leaves us with 317,833 hard drives to analyze. The table below shows the annualized failure rates (AFR) for Q1 2025 for this collection of drives.

Backblaze Hard Drive Failure Rates for Q1 2025

Reporting period January 1, 2025–March 31, 2025 inclusive
Drive models with drive count > 100 as of March 31, 2025 and drive days > 10,000 in Q1 2025. 

Notes and observations

  • The 4TB drives are hanging on and finishing strong. Good news: We have another quarter’s worth of data on our beloved 4TB drives (though the planned migration is well underway). True to their history, the 4TB drives showed wonderfully low failure rates, with yet another quarter of zero failures from model HMS5C4040ALE640 and 0.34% AFR from model HMS5C4040BLE640. 
  • Keeping an eye on the 20TB+ pool. The 24TB Seagate (model ST24000NM002H) no longer has a perfect record, with eight failures for the quarter. Still, the drives put up a respectable 1.00% AFR. Meanwhile, the 20TB+ drives as a pool are averaging a 0.72% AFR, coming in lower than the overall failure rates—always a promising sign. 
  • Zero failures for the quarter. Four drives get a gold star for zero failures this quarter:
    • The 4TB HGST (model HMS5C4040ALE640) 
    • The Seagate 8TB (model ST8000NM000A) 
    • Seagate 12TB (model ST12000NM000J)
    • Seagate 14TB (model ST14000NM000J) 

Three out of the four also had zero failures last quarter, all but the Seagate 12TB. 

  • The quarterly failure rate is slightly higher. The quarterly failure rate went up from 1.35% to 1.42%. As with the zero-failure club, our higher-end outlier AFRs show some of the usual suspects:
    • Seagate 10TB (model ST10000NM0086). Q4 2024: 5.72%. Q1 2025: 4.72%.
    • HGST 12TB (model HUH721212ALN604). Q4 2024: 5.15%. Q1 2025: 4.97%.
    • Seagate 12TB (model ST12000NM0007). Q4 2024: 8.72%. Q1 2025: 9.47%.
    • Seagate 14TB (model ST14000NM0138). Q4 2024: 5.95%. Q1 2025: 6.82%.

Drive model criteria

We noted earlier we removed 593 drives from consideration when we produced the table above covering Q4 2024. There are two primary reasons we did not consider these drive models.

  • Testing. These are drives of a given model that we monitor and collect Drive Stats data on, but are not considered production drives at this time. For example, drives undergoing certification testing to determine if they are performant enough for our environment are not included in our Drive Stats calculations.
  • Insufficient data points. When we calculate the annualized failure rate for a drive model for a given period of time (quarterly, annual, or lifetime), we want to ensure we have enough data to reliably do so. Therefore we have defined criteria for a drive model to be included in the tables and charts for the specified period of time. Models that do not meet these criteria are not included in the tables and charts for the period in question.

Regardless of whether or not a given drive model is included in the charts and tables, all of the data for all of the drives we use is included in our Drive Stats dataset which you can download by visiting our Drive Stats page.

As with the Q4 quarterly results, we will apply these criteria to the annual and lifetime charts that follow in this report.

Lifetime hard drive failure rates

As of the end of Q1 2025, we were tracking 312,831 data hard drives. To be considered for the lifetime review, a drive model was required to have 500 or more drives as of the end of Q1 2025 and have over 100,000 accumulated drive days during their lifetime. When we removed those drive models which did not meet the lifetime criteria, we had 312,493 drives grouped into 26 models remaining for analysis as shown in the table below.

Backblaze Lifetime Hard Drive Failure Rates 

Reporting period ending March 31, 2025 inclusive
Drive models with > 500 drives and > 100,000 lifetime drive days

Notes and observations

The lifetime AFR remains steady, despite some drives having significant change. We see virtually no change in our overall lifetime AFR, which we last tracked at 1.31% in the 2024 Year-End Drive Stats Report. But, with some drive models showing significant change in year-over-year AFR, it’s worth digging in a little deeper. 

Statistically significant improved AFRs: 

  • Both the 12TB and the 14TB had the same number of failures (or nearly so). Meanwhile, the Toshiba 20TB and WDC 22TB had more failures, but added a significant number of drives to the fleet. Both of these activities increase the number of drive days we tracked for the model’s drive pool, so these results are unsurprising. 

Statistically significant worsened AFRs:

  • Meanwhile, we have a few things happening for the significantly worsened AFRs. The WDC drive models are all top performers from a failure perspective, even a change from .45 to .48 shows up in the numbers. 
  • That leaves us with two HGST 12TB drives. Both come in above the average failure rate, at 1.45% (model: HUH721212ALE604) and 2.06% (model: HUH721212ALN604). We can give HUH721212ALE604 a pass—with the drive pool showing an average age of 67.1 months, or about five and a half years, it’s firmly on track with the expected pattern defined by the bathtub curve
  • Where does that leave us with model HUH721212ALE604? We’ll keep an eye on it. Given that its AFR rate isn’t too far off from the total AFR of the Backblaze drive fleet, it’s not hugely concerning unless we see the rate of change continue. 

What’s new with Drive Stats?

In taking on this report, our main focus was to ensure continuity with our decades-old dataset. That said, we also saw some opportunities to streamline the process of data collection, a continuation of the work that David Winings talked about in Overload to Overhaul: How We Upgraded the Drive Stats Data and Drive Stats Data Deep Dive: The Architecture. All of these things set us up for not just an easier time generating this report, but some bigger plans in the future. (We won’t tip our hand yet—but stay tuned.) 

Drive Stats gets a Snowflake upgrade

When we first started tracking Drive Stats way back in 2013, data collection was very ad hoc. For the first few years, when Brian Beach was at the helm, we published stats once a year. When Andy took over in 2015, he moved to publishing quarterly data (starting in 2016). As the dataset grew, and Andy’s collection of lightweight desktop apps started to run out of steam, it became apparent that we needed to upgrade to more capable analytical tooling. For a variety of operational reasons, Andy was gamely running SQL queries against CSV data imported into a MySQL instance running on his laptop—and having to do a ton of manual data cleanup to boot. (Pun obviously intended.) 

This year, with the help of our colleagues on the database engineering team (shoutout to Tom Roden—thanks so much!), we were able to get the Drive Stats data included in the Backblaze Snowflake instance. Gone are the days of us bugging folks for exports that take hours to process! We can run lightweight queries against a cached, structured table.

We started from Andy’s SQL queries and tweaked them a bit to match the logic and nomenclature of Snowflake fields. Once we had that worked out, the first thing we did was validate our methodology by running the Q4 Drive Stats numbers and comparing them to Andy’s—success. 

It helps that Pat has experimented with our Drive Stats dataset in Trino and other analytical tools like Apache Iceberg, so it’s certainly not the first time he’s considered methodology and tooling for this problem. Going forward, we may further refine the process, but for now, the migration to Snowflake saved us a ton of time and manual data cleanup.

The Hard Drive Stats data

The complete dataset used to create the tables and charts in this report is available on our Hard Drive Test Data page. You can download and use this data for free for your own purpose. All we ask are three things: 1) you cite Backblaze as the source if you use the data, 2) you accept that you are solely responsible for how you use the data, and 3) you do not sell this data itself to anyone; it is free.

Good luck, and let us know if you find anything interesting.

The post Backblaze Drive Stats for Q1 2025 appeared first on Backblaze Blog | Cloud Storage & Cloud Backup

Кого не пази Законът за защита от домашно насилие?

Post Syndicated from original https://www.toest.bg/kogo-ne-pazi-zakonut-za-zashtita-ot-domashno-nasilie/

Кого не пази Законът за защита от домашно насилие?

В началото на 2023 г. със съквартирантките ми решихме да гледаме обсъждането на измененията в Закона за защита от домашно насилие (ЗЗДН) в Народното събрание. Очаквахме интересна дискусия, но уви, станахме свидетели само на скандали, невежество и тук-там реч на омразата. Това, което не можахме да проумеем с 21-годишните си мозъци, беше: защо дебатът не се концентрира около защитата от домашно насилие, при положение че всеки се изказва колко е против него и колко е загрижен за пострадалите?

Вместо това обаче се говореше за „джендър идеология“ (каквото и да означава това), а Десислава Атанасова и Корнелия Нинова открито се хвалеха, че техните парламентарни групи са спрели ратифицирането на Конвенцията на Съвета на Европа за превенция и борба с насилието над жени и домашното насилие, по-известна като Истанбулската конвенция. И тези хвалби – на фона на нарастващите случаи на брутално насилие над жени и бездействието от страна на държавата. 

Предположихме, че голяма част от депутатите може да се страхуват – да не би случайно да дадат права и защита на една група граждани. Народният представител от БСП Иван Ченчев беше възмутен, че законопроектът на Надежда Йорданова и група народни представители предвижда замяна на термина „фактическо съпружеско съжителство“ с „интимна връзка“, тъй като второто е по-широко понятие и ще може да предостави защита на всички двойки (такова предложение в законопроекта към онзи момент нямаше). Ченчев едва ли е предполагал, че няколко месеца по-късно Народното събрание ще се опитва да дефинира понятието „интимна връзка“, за да може законът да предоставя адекватна защита и на пострадалите в хетеросексуални отношения. Защото в опити да не се дадат права на едните, пострадаха и другите, както показа случаят с Дебора Михайлова, обезобразена от мъж, с когото не е съжителствала. Това даде тласък на включването на интимните връзка в закона.

Въпреки заявката на правителството да се бори с домашното насилие, все още не са изградени ключови механизми за справяне с проблема. 

Домашното насилие, на което са изложени ЛГБТИ+ хората в България днес

Две години по-късно ЗЗДН все още не защитава еднополовите двойки. А тези връзки не са имунизирани от насилие. Изследване на Фондация „Билитис“ по проблема с домашното насилие сред ЛГБТИ+ двойки, в което са се включили 91 респонденти, констатира, че една трета от интервюираните са преживели насилие от страна на партньор, а две трети – от страна на родител.

Осъзнаването обаче, че това, през което пострадалите преминават, е домашно насилие, идва доста по-късно, споделя Робин Златаров, проектен мениджър във Фондация „Билитис“. Нито един от респондентите в проучването не е докладвал в полицията, че е подложен на някакъв вид тормоз. Пострадалите не са сметнали, че ще ги вземат на сериозно, обясни Златаров.

И има защо. Адвокат Силвия Петкова, която и е официална сътрудничка на „Билитис“, разказа пред „Тоест“ за случай на насилие между гей мъже, продължило година и половина след прекратяване на връзката. В един от случаите при подаден сигнал до тел. 112 патрул не е изпратен с аргумента, че полицията не се занимава с „педерастки работи“. 

Пострадалите не търсят полиция от страх, че ще станат обект на дискриминация и че тя няма да си свърши работата. Това потвърждава и Робин Златаров: 

„Когато хората се обръщат към нас за каквото и да е насилие, те не знаят към кого [другиго – б.р.] да се обърнат. Те ни се доверяват като ЛГБТИ+ хора, които имат нужда от някакъв вид подкрепа, ние сме първата инстанция и първият праг на доверие.“ 

Къде може да се потърси помощ?

„Билитис“ поддържа чат линия за подкрепа, която е активна всеки делничен ден между 18:00 и 22:00 часа. Доброволците в нея са поне в четвъртата си година на обучение по психология и получават допълнителна подготовка от страна на фондацията, а работата им се наблюдава от сътрудник на „Билитис“. Доброволците се опитват „с въпроси, с побутване“, по думите на Златаров, да разберат от каква помощ има нужда пострадалият, за да го пренасочат към психотерапевт, адвокат или към по-подходяща за конкретния случай организация.

По-често подавани сигнали към организации като „Билитис“ и Single step са за тормоз от страна на родител. ЛГБТИ+ хората могат да търсят закрила по ЗЗДН, ако са подложени на системен тормоз от страна на членове на семейството, а децата между 14 и 18 години имат право да поискат от съда издаване на ограничителна заповед без подпис на родител. Неясно е какво би станало с деца, чийто родител или осиновител е във връзка с човек от същия пол. Според закона извършител на домашно насилие може да бъде съпруг или партньор на родителя, но ако държавата не признава съществуването на еднополови връзки, как може да се докаже, че детето е пострадало в условията на домашно насилие? 

Една от известните организации, които оказват помощ при домашно насилие, е Фондация „Асоциация Анимус“. Оттам обаче уточниха пред „Тоест“, че рядко ги търсят ЛГБТИ+ хора. В „Билитис“ сигнали за домашно насилие от страна на партньор почти липсват, макар данните от проведеното от фондацията изследване да сочат, че такова насилие съществува. 

На теория всеки ЛГБТИ+ човек би трябвало да може да потърси защита в кризисен център. Но в много общини няма такъв, а в наличните местата са крайно недостатъчни. По-сложна е ситуацията с транс жените, които не могат да бъдат настанени в център за жени, защото по документи са мъже. Това е и общността, която докладва най-малко случаи на насилие. 

Спорната дефиниция на „интимна връзка“

Домашното насилие не е феномен само за хетеросексуалните двойки, но те получават защита от закона, а останалите – не. „Причината за това се състои във формулировките „семейна връзка“ и „фактическо съпружеско съжителство“ – понятия, които българското национално право тълкува стеснително, считайки, че обхващат семейството в тесен смисъл (брачна връзка)“, разяснява адв. Петкова в доклада на „Билитис“ за насилието в ЛГБТИ+ двойки. 

През август 2023 г. Народното събрание се опитваше да дефинира „интимна връзка“, като защитата на ЛГБТИ+ хората отново беше пренебрегната и интимната връзка си остана запазена само за хетеросексуални двойки. Въпреки законовото ограничение обаче понятието все още има двойствено значение. 

В цитирания доклад Петкова изказва мнението, че макар в тесния смисъл дефиницията за интимна връзка да включва само лицата в разнополови двойки, е възможно и по-широко тълкуване. Основанието за него е, че формулировката в закона изключва интерсекс хората, а техният пол не може да се определи еднозначно като мъжки или женски. Тя стига до извода: 

„При това по-широко тълкуване може да се приеме, че нововъведената възможност за закрила от домашно насилие обхваща както интимната връзка между две лица от мъжки и женски пол, така и интимната връзка между две лица от мъжки пол и две лица от женски пол.“ 

Ето един пример, от който става по-ясно как понякога и за държавата не е лесно да определи дали става въпрос за хетеросексуални, или хомосексуални отношения:

Има интерсекс хора, които са записани като жени при раждането си, тъй като тялото им прилича на женско, но впоследствие се оказва, че имат мъжки хромозоми и полови органи. На много от тях им е извършена т.нар. „нормализираща“ операция за „утвърждаване“ на пола, за да продължат да живеят като жени, само че Конституционният съд и Върховният касационен съд приемат, че полът може да бъде единствено биологичен. Тези хора са жени по документи, но мъже според двете съдилища. И ако имат връзка с мъж и във връзката има насилие, то ще бъде ли насилие при еднополова двойка, или не?

Възможността за двойствено тълкуване би довела до противоречива съдебна практика, но тъй като такава все още няма, не може да се заведе и тълкувателно дело.

От описаното по-горе обаче възникват три въпроса.

Първият е къде попадат интерсекс хората, тъй като те не могат да бъдат категоризирани в мъжки или женски пол. 

Вторият въпрос е не следва ли да подлежат на закрила по Закона за защита от домашно насилие еднополови двойки със сключен в чужбина брак.

И третият важен въпрос е започната ли е процедура по създаване на правна рамка за признаване на еднополови връзки, както предвижда решение срещу България на Европейския съд по правата на човека от 2023 г. И ако не, защо?

Компетентно да отговори на тези въпроси е Министерството на правосъдието. На 31 март 2025 г. отправих питане към него по електронната поща. В началото на април се свързах с Министерството по телефона и получих уверение, че имейлът ми е пристигнал. До редакционното приключване на статията не съм получила отговор на въпросите си. 

Какво пише в Наказателния кодекс?

Макар законът да изключва ЛГБТИ+ хората, Наказателният кодекс (НК) би могъл да обхване еднополови връзки. В него липсва уточнението, че домашното насилие трябва да е между мъж и жена. Според чл. 93, т. 31 от НК престъплението е извършено в „условията на домашно насилие“, ако то е физическо, сексуално, икономическо или психическо и е осъществено спрямо член на семейството или някого, с когото насилникът живее в едно домакинство. 

Домашното насилие само по себе си не е престъпление, уточни Силвия Петкова за „Тоест“. С други думи, човек може да бъде съден не просто за домашно насилие, а че е извършил нещо в условията на домашно насилие. То може да бъде утежняващо вината обстоятелство за някои престъпления и съответно те да подлежат на по-тежко наказание. 

Според ЗЗДН при нанасяне на средна телесна повреда на съпруг наказателното производство се извършва само при сигнал на пострадалия до прокуратурата. Българската Конституция обаче приема, че „съпругът“ може да е само лице с противоположен пол. Ако се позовем на дефиницията в НК, насилие в еднополова връзка ще се преследва по общия наказателен ред и независимо от волята на пострадалия (тоест без да се налага жертвата да подава сигнал до прокуратурата), което пък предоставя по-добра защита на лица от един и същ пол, които са в интимна връзка. 

Адв. Петкова обобщи ситуацията така: ако се позовем на НК, пострадал от насилие може да бъде човек, който живее или е живял с извършител от същия пол. В този случай пострадалият може да сезира прокуратурата, която трябва да се заеме с разследването. „Друг е въпросът вече доколко ще се осъществи качествено разследване, така че да се стигне до реално предаване на съд на извършител на престъпление в условията на домашно насилие и до реалното му осъждане. При всички положения, когато се намираме в условията на наказателно производство, съдът се позовава на дефинициите в НК“, заключи Петкова. 

Тя допълни и че при престъпления, извършени в условията на домашно насилие, се търси закрила и по двата закона. Ограничителната заповед се издава в срок от 24 часа след подаване на искането по ЗЗДН, докато издаването на такава забрана по НК изисква привличане на лице като „обвиняем“. За да има обаче „обвиняем“, са нужни достатъчно доказателства, чието събиране може да отнеме месеци или години. 

Недоверие в институциите

Във всеки случай, при непосредствена опасност за живота трябва да се звъни на 112, съветва адв. Петкова. Тя обаче обръща внимание, че диспечерът на телефонната линия винаги задава въпроса дали пострадалият и извършителят се познават. И ако разбере, че са в еднополова връзка, има риск да не изпрати патрул. 

Това обяснява притесненията на ЛГБТИ+ хората да звънят на 112, които е констатирал Робин Златаров. Той разказа, че пострадалите обикновено питат за други алтернативи в чата на „Билитис“. 

Златаров уточни, че е напълно възможно да има позитивни примери на добро отношение от страна на полицията към пострадал, но в практиката си се е сблъсквал най-вече със сигнали за негативно отношение.

Както гражданите имат задължение да спазват законите на държавата, така и държавата би следвало да защитава гражданите си безусловно. Случаите на пострадали и дори убити в условията на домашно насилие няма да намалеят, докато институциите не започнат да приемат сериозно всеки сигнал за пострадал.

Всеки, преживял домашно насилие, следва да може да получи защита. Законът обаче оставя една уязвима група без подкрепа, като не припознава съществуването на еднополови връзки. Домашно насилие сред ЛГБТИ+ двойките има, но липсата на доверие в институциите кара много от пострадалите да не търсят помощ. Тези случаи остават скрити за държавата, което повдига въпроса: може ли да се борим ефективно с проблема, ако не знаем действителните му измерения?

Court Rules Against NSO Group

Post Syndicated from Bruce Schneier original https://www.schneier.com/blog/archives/2025/05/court-rules-against-nso-group.html

The case is over:

A jury has awarded WhatsApp $167 million in punitive damages in a case the company brought against Israel-based NSO Group for exploiting a software vulnerability that hijacked the phones of thousands of users.

I’m sure it’ll be appealed. Everything always is.

What do we even mean by digital literacy?

Post Syndicated from Rachel Arthur original https://www.raspberrypi.org/blog/what-do-we-even-mean-by-digital-literacy/

’Digital literacy’ is a term that seems to pop up everywhere. In the early 2000s, it was the next big thing; some even suggested it might replace traditional literacy and numeracy. But, like many educational trends, it soon faded from the spotlight, and became something that schools ‘should’ do, or something left to the lone teacher who had been handed the role of IT coordinator. 

For many teachers, at least in the UK, digital literacy meant booking a set of laptops (and hoping the last class had remembered to charge them) and ticking off history learning objectives by making a PowerPoint about Henry VIII’s wives. It became a bit of an afterthought. 

More recently, digital literacy seems to have been rebranded as ‘digital skills’, often framed as the capabilities young people need for the workplace of tomorrow. But I don’t think that tells the full story. 

Digital literacy beyond employability

Digital literacy isn’t just about employability; it’s about fairness and access. It’s about more than just learning to use spreadsheets (though my love for Excel remains strong); it’s about ensuring that all young people have the knowledge and confidence to navigate the digital world we live in today.

Digital literacy is about understanding the digital tools we rely on every day, securely accessing online services, making informed decisions about sharing personal information, and critically evaluating the endless stream of news and misinformation online. 

It’s also about artificial intelligence: not just playing with the latest tools, but understanding how they work, the biases built into them, and the ways they shape our lives.

Three ways to help students learn about the impact of technology

True digital literacy empowers young people to engage with technology thoughtfully, critically, and confidently. And that’s something worth making space for. To truly ensure that young people have fair access to the digitally enabled world we live in, we must equip them with the skills to understand and use technology effectively. This means making space for digital literacy within the curriculum and ensuring that all teachers feel confident in delivering it.

Digital literacy as a core part of teaching

Every teacher has a role to play in helping students develop these essential skills. This requires high-quality curriculum resources that integrate digital tools meaningfully into different subjects, as well as comprehensive teacher training to ensure every educator feels empowered to teach digital literacy as part of their everyday practice. 

So, let’s not treat digital literacy like that forgotten box of tangled charging cables in the staffroom (important, but nobody is quite sure what to do with it). Instead, let’s make it a core part of teaching, just like reading, writing, and knowing how to keep a straight face when a student asks if they really need to save their work.

Two girls code at a desktop computer while a female mentor observes them.

If we get this right, we’re not just preparing young people for the jobs of tomorrow, we’re making sure they can navigate today’s digital world safely, confidently, and with the critical thinking skills to tell fact from fiction (because let’s face it, the internet isn’t exactly short on absolute nonsense). 

Now, who’s up for making a PowerPoint about Henry VIII’s wives? 

More on digital literacy

You can discover our free teacher training and classroom resources, and read about how we’ve integrated digital literacy in The Computing Curriculum.

A version of this article appears in the newest issue of Hello World magazine, which is all about digital literacy. Explore issue 26 and download your free PDF copy today.

You can also listen to our recent Hello World podcast episode exploring three teachers’ digital literacy tips for the classroom.

The post What do we even mean by digital literacy? appeared first on Raspberry Pi Foundation.

Optimizing Incident Management with Zabbix and PagerDuty

Post Syndicated from Zabbix LatAm original https://blog.zabbix.com/optimizing-incident-management-with-zabbix-and-pagerduty/30114/

When monitoring environments, we sometimes need to rely on third-party tools to better manage functionality and optimize responses to alerts. Let’s explore how to integrate Zabbix with PagerDuty, a real-time incident management solution designed to improve the reliability of digital services, including best practices and configuration details.

What is PagerDuty?

PagerDuty is a real-time incident management platform designed to help IT teams react quickly to critical events. The tool helps organizations automate and manage incident response through a system of alerts, escalation, and coordination between teams. When a problem is detected in the system, PagerDuty notifies the responsible individuals and ensures that corrective action is taken quickly. This reduces downtime and improves operational efficiency. Integration with monitoring tools such as Zabbix makes it easy to identify issues before they impact users.

Some of PagerDuty’s key features include:

• Integration with monitoring tools (such as Zabbix)
• Notifications in multiple channels (email, SMS, calls)
• Automatic escalation of incidents to ensure agile responses
• Event analysis to improve the detection of recurring problems

How to integrate PagerDuty with Zabbix

In PagerDuty, go to “Services” and click on “Service Directory.” Create a new service.

Give it a proper name and description.

Accept the escalation terms and click “Next.”

On the next screen, select “Intelligent” and the “Auto-pause incident notifications” option, then click “Next.”

The next step is to add the Zabbix Webhook service, which will allow integration with Zabbix, and then click “Next.”

In Services > Service Directory, select the name of the service. In the “Integrations” tab, copy the integration token that is generated.

It is important to note that the PagerDuty webhook only shows the option of Zabbix versions 5.0 to 5.2, but it works correctly in later versions such as Zabbix 7.2, which was tested without any issues.

On Zabbix Server, go to Alerts > Media types > PagerDuty. Enter the integration token, the Zabbix URL, and select “Update.”

Send a test message to confirm that the integration is working correctly.

In the PagerDuty application, verify that the test alert was received.

To send notifications, you need to grant permissions to a user in Zabbix. Go to Users > Create User. In the “Media” tab, select PagerDuty as the notification method. Set the severity of the alerts you want to receive.

Subsequently, set up a Trigger Action in Alerts > Actions > Trigger Actions to define what types of alerts will be received (either by item or trigger) according to the needs of your team.

Best practices for integrating Zabbix and PagerDuty

Customize notifications: Set rules to send only truly critical alerts, avoiding unnecessary notifications.
Optimize escalations: Set up escalation rules so that alerts reach the right people at the right time.
Monitor key metrics: Measure incident response times and adjust workflows as needed.
Automate incident responses: Use PagerDuty’s capabilities to perform automated tasks in response to specific events.
Notify about service failures: Use PagerDuty to start running recovery scripts, send notifications to the responsible teams, or even escalate the problem to a higher level if there is no solution in a stipulated length of time.

Conclusion

Zabbix’s integration with PagerDuty allows you to monitor the status of critical services in real time, even outside of working hours. This facilitates rapid incident response and improves your IT team’s ability to react.

This combination not only optimizes incident management but also helps minimize downtime, improve operational efficiency, and ensure the reliability of monitored systems.

With proper configuration and best practices, integrating Zabbix with PagerDuty can become essential for the proactive management of your technological infrastructure.


The post Optimizing Incident Management with Zabbix and PagerDuty appeared first on Zabbix Blog.

Multiple security issues in Screen

Post Syndicated from jzb original https://lwn.net/Articles/1020901/

The SUSE Security Team has published
an article detailing several security
issues
it has uncovered with GNU Screen. This includes
a local root exploit when Screen is shipped setuid-root, as it is in
some Linux and BSD distributions. The security team also reports problems
in coordinating disclosure
with the upstream Screen project.

We are not satisfied with how this coordinated disclosure developed,
and we will try to be more attentive to such problematic situations
early on in the future. This experience also sheds light on the
overall situation of Screen upstream. It looks like it suffers from a
lack of manpower and expertise, which is worrying for such a
widespread open source utility. We hope this publication can help to
draw attention to this and to improve this situation in the future.

The article includes a table
of operating systems, screen versions, and which vulnerabilities they
may be affected by.

Enhance governance with asset type usage policies in Amazon SageMaker

Post Syndicated from Pradeep Misra original https://aws.amazon.com/blogs/big-data/enhance-governance-with-asset-type-usage-policies-in-amazon-sagemaker/

Amazon SageMaker Catalog, part of the next generation of Amazon SageMaker, now supports authorization policy for asset type usage — a new governance capability that gives organizations fine-grained control over who can create and manage custom assets based on specific asset types. This enhancement brings scalable, policy-driven governance to enterprise data publishing workflows across diverse business domains.

Challenge: Scaling governance across diverse asset types

In large organizations, teams often define custom asset templates (also known as asset types) to standardize how specific business data is cataloged, discovered, and governed. For example, a life sciences company might define a ClinicalStudyAsset template to capture trial metadata, while a financial institution could use a FinancialReportAsset template for regulatory filings.

However, as usage of custom asset types grows across departments and teams, organizations face new governance challenges:

  • Who should be allowed to create assets using certain templates?
  • How can sensitive or business-specific templates be restricted to specific users or projects?
  • How do you avoid template misuse, duplication, or accidental exposure of critical data formats?

Without built-in enforcement, asset governance relies heavily on user knowledge or manual oversight—both error-prone and difficult to scale.

Solution: Authorization policies for asset type usage

To address this, SageMaker Catalog now enables domain administrators, project owners and domain unit owners to define authorization policies that control which asset types can be used by specific project users. These policies allow organizations to enforce usage boundaries for sensitive or business-critical templates, aligning asset publishing with security and compliance requirements. For example:

  • A life sciences organization can restrict the ClinicalStudyAsset template to R&D users only, ensuring clinical trial data is handled in controlled environments.
  • A financial services firm can limit the use of the FinancialReportAsset template to audit and compliance teams, safeguarding regulatory disclosures.

With this capability, customers can:

  • Define policies at the asset type level to allow or deny creation of assets using specific templates.
  • Apply policies to project members (users or groups) — supporting flexible governance at scale.
  • Maintain centralized oversight while empowering decentralized teams to operate within clear, enforceable boundaries.

Customer Spotlight

As a large-scale organization with diverse data needs, Amazon’s Business Data Technologies (BDT) team manages thousands of assets. BDT team wants to ensure that these asset types can be used by specific groups responsible for those assets.

BDT team would use asset type usage policies in Amazon SageMaker Catalog. These policies enable them to control which teams can use specific Andes asset types to create and govern these assets in the catalog.

“This new addition is instrumental in helping us scale data onboarding across business units without compromising governance. By enforcing who can use specific Andes asset templates to create assets in the SageMaker Catalog, we’re able to accelerate consolidation of siloed data across the company while maintaining tight control over ownership and governance. This not only strengthens compliance, but also reduces duplication, prevents mismanagement, and enables us to move fast with confidence.”

— Eunji Kang, Principal Product Manager Tech, Business Data Technologies, Amazon.com

Key Benefits

The introduction of asset type usage policies in Amazon SageMaker Catalog delivers meaningful governance at scale—especially for organizations managing hundreds of teams, projects, and templates. Here’s how this capability adds value:

  • Enforce authorization policies for cataloging asset. With asset type usage policies, governance shifts from after-the-fact audits to proactive controls. By defining who can create assets using a specific template, organizations prevent accidental or unauthorized use of sensitive formats. This ensures the right teams are working with the right templates—aligned with compliance, domain policies, or business criticality.
  • Minimize asset sprawl and reduce duplication. Without controls, teams may clone or re-create similar templates across business units, leading to inconsistencies and catalog clutter. By standardizing usage boundaries, asset type usage policies promote template reuse and ensure data is structured consistently across businesses.
  • Strengthen compliance and audit posture. In regulated environments (e.g., financial reporting, healthcare data management), template misuse can lead to compliance violations. Usage policies enforce access controls automatically—helping security and audit teams ensure that critical templates are used in accordance with internal and external standards.
  • Accelerate onboarding while preserving control. Central data teams can define and expose approved templates to relevant users without opening the door to misuse. This allows new teams to onboard quickly, using standardized asset types, while still operating within clearly defined governance boundaries.

Solution overview : Asset type usage policy

In the following sections, we walk through how to create a custom asset and associate a usage policy with it. In this scenario, the marketing team from AnyCompany.com creates a custom asset MarketingMetric asset type, which only users from projects in the Marketing domain unit can use. Users using projects associated with the Sales domain unit can’t create a MarketingMetric custom asset.

Prerequisites

To follow this post, you should have an Amazon SageMaker Unified Studio domain set up with domain owner privileges. Create two domain units, Sales and Marketing, and have a project associated with each domain unit. For instructions, refer to the following Getting started guide.

Create a metadata form in the Marketing domain unit

Complete the following steps to create a metadata form in the Marketing domain unit:

  1. On the SageMaker Unified Studio console, choose the project in the Marketing domain unit where you want to create the custom asset.
  2. Choose Metadata entities in the navigation pane.
  3. Choose Create metadata form.

In this solution, we create a custom asset type of MarketingMetric, which only users belonging to projects in the Marketing domain can use to create assets.

  1. Provide details about the form and choose Create metadata form.

In this form, we create two fields: Calculation and Dashboard Link.

  1. Choose Create field.
  2. Create Dashboard Link as the first field.
  3. Choose Create field to create the second field.
  4. Provide details for the Calculation field.
  5. Turn on Enabled to enable the metadata form.

Create a custom asset using the metadata form and associate the usage policy

Complete the following steps to create a custom asset (MarketingMetric) using the metadata form you created and associate the usage policy:

  1. On the project page, choose Metadata entities in the navigation pane.
  2. On the Asset types tab, choose Create asset type.

Project owners or domain unit owners can have permissions to create assets of this selected asset type, and usage permissions can be provided to:

    • All projects – Any project in the domain can create an asset using this asset type
    • Owning project – Only the project creating this asset type can create assets
    • Selected projects or domain units – Specific projects or domain units can create assets using this asset type
  1. For Name, enter a name (for this example, MarketingMetric).
  2. For Metric, select Required and add the metadata form you created.
  3. For Usage Permission, select Selected projects or domain units.
  4. Choose Add usage permission.
  5. Select all projects in the Marketing domain unit and choose Add policy grant.
  6. Choose Create to create the asset type.

The MarketingMetric asset type is created.

Create a marketing metric from a project associated to the Marketing domain unit

For this step, we use project publish-1, which belongs to the Marketing domain unit, to create a new marketing metric. Complete the following steps:

  1. On your project page, choose Assets in the navigation pane.
  2. On the Create menu, choose Create asset.
  3. Provide a metric name and description, then choose Next.
  4. For Asset type, choose MarketingMetric.
  5. Provide details for the metadata form and choose Apply.
  6. Choose Create.

The asset Conversion Rate Metric with asset type MarketingMetric is created.

Test the asset type usage policy

When a user tries to create a marketing metric from a project associated with the Sales domain unit, they will get an error.

As defined in the usage policy, only projects associated with the Marketing domain unit can create MarketingMetric assets.

Clean up

To avoid incurring additional charges, delete the SageMaker domain. Refer to Delete domains for instructions.

Conclusion

In this post, we introduced authorization policies for custom asset types—a new governance capability in Amazon SageMaker that gives organizations fine-grained control over who can create and manage assets using specific templates. This feature enhances data governance by allowing teams to enforce usage policies that align with business and security requirements across the organization.

Asset type usage policies are available in all AWS Commercial Regions where Amazon SageMaker is supported.

To get started, refer to the user guide and begin defining policies for your custom asset types today.


About the Authors

Pradeep Misra PicPradeep Misra is a Principal Analytics Solutions Architect at AWS. He works across Amazon to architect and design modern distributed analytics and AI/ML platform solutions. He is passionate about solving customer challenges using data, analytics, and AI/ML. Outside of work, Pradeep likes exploring new places, trying new cuisines, and playing board games with his family. He also likes doing science experiments, building LEGOs and watching anime with his daughters.

Ramesh H Singh is a Senior Product Manager Technical (External Services) at AWS in Seattle, Washington, currently with the Amazon SageMaker team. He is passionate about building high-performance ML/AI and analytics products that enable enterprise customers to achieve their critical goals using cutting-edge technology. Connect with him on LinkedIn.

Harsh Singh is a Software Dev. Engineer at AWS based in the Bay Area. He currently works with the Amazon DataZone team, enhancing security for Amazon DataZone and SageMaker Unified Studio while developing features that help customers achieve their data, analytics, and AI goals faster. With a background in building ML and analytics systems at scale, Harsh enjoys solving complex problems in data engineering, AI/ML, and security. Outside of work, he can be found hiking the west coast trails and exploring new cuisines.

Monitoring and optimizing the cost of the unused access analyzer in IAM Access Analyzer

Post Syndicated from Oscar Diaz original https://aws.amazon.com/blogs/security/monitoring-and-optimizing-the-cost-of-the-unused-access-analyzer-in-iam-access-analyzer/

AWS Identity and Access Management (IAM) Access Analyzer is a feature that you can use to identify resources in your AWS organization and accounts that are shared with external entities and to identify unused access. In this post, we explore how the unused access analyzer in IAM Access Analyzer works, dive into the cost implications, and share practical approaches to manage and optimize how you use it with a primary focus on cost optimization.

Note: While security best practices for managing AWS Identity and Access Management (IAM) resources are critical, this post emphasizes cost-saving strategies rather than detailed security guidance. We don’t cover step-by-step implementation details for the recommendations here; instead, we provide links to resources that you can use as guides for the process.

Understanding the unused access analyzer in IAM Access Analyzer

IAM Access Analyzer has two capabilities to generate findings:

  • External access analysis (no additional charge): Identifies resources shared with external entities. It requires one analyzer per AWS Region where you have resources.
  • Unused access analysis (paid): Detects unused roles, access keys, and permissions. It requires only one analyzer per AWS account and analyzes IAM roles and users across Regions from a single analyzer.

Both external access analysis and unused access analysis support AWS Organizations and you can create a single analyzer per organization (in the case of external access analysis, per organization per Region).

IAM Access Analyzer unused access analysis costs $0.20 per IAM role or user analyzed each month. The charges for existing roles and users happen at the beginning of the month. As new roles and users are added throughout the month, they are analyzed and charged at a rate of $0.20 per role or user. To help avoid duplicate charges, create only one unused access analyzer per account if using an account-level analyzer, or one unused access analyzer for the entire organization if using an organizational-level analyzer. You should avoid deleting and recreating an analyzer. If you recreate an analyzer, you will be charged again for the analysis.

Reviewing and optimizing your usage

Before taking any actions to reduce costs, it’s crucial to understand your current usage. You can use the AWS Cost and Usage Report (AWS CUR) to identify how many unused access analyzers you have in your environment. To learn more, see Querying Cost and Usage Reports using Amazon Athena.

Use the following Athena query on your CUR data to identify the unused access analyzers within your organization. Replace <CUR_TABLE> with the name of your CUR table.

SELECT
line_item_usage_type,
product_region,
line_item_resource_id,
bill_payer_account_id,
line_item_usage_account_id,
SUM(line_item_unblended_cost)
FROM <CUR_TABLE>
WHERE line_item_product_code = 'AWSIAMAccessAnalyzer'
AND line_item_line_item_type = 'Usage'
GROUP BY
line_item_usage_type,
product_region,
line_item_resource_id,
bill_payer_account_id,
line_item_usage_account_id

This query will give you a comprehensive view of your IAM Access Analyzer usage across your organization, including the cost per analyzer.

Now, let’s walk through four things that you can do today to optimize your IAM Access Analyzer unused access analysis costs.

Consolidate unused analyzers

Review your AWS CUR analysis results to identify opportunities for consolidation. If you’re using an organizational unused access analyzer, you should use a single analyzer. If you’re using an unused access analyzer per account, make sure a single account doesn’t have more than one analyzer.

Use tags to exclude some roles or users

Consider using tags to exclude certain roles or users from analysis. This approach can help scope your analysis and reduce costs by avoiding roles and users that you don’t want to analyze. To do this, you’ll need to implement a tagging strategy for your IAM roles and users, identifying principals that might not require regular access analysis. Then, when creating or modifying an analyzer, use exclusion to skip analysis of tagged IAM roles and users. Regularly review your exclusion strategy to validate that it aligns with your organization’s security policies and compliance requirements.

For a deeper dive into this process, including step-by-step guidance and practical examples, see Customize the scope of IAM Access Analyzer unused access analysis.

Regular clean-up of IAM roles and users

Periodically review and remove unnecessary IAM roles and users. Because IAM Access Analyzer unused access analysis charges are based on the number of roles and users analyzed, removing unused roles and users will help reduce unused access findings cost. This is also a security best practice for IAM.

Monitor and adjust

Set up AWS Budgets or AWS Cost Anomaly Detection to track your IAM Access Analyzer unused access analysis costs. Create alerts for when costs exceed expected thresholds. By using the proactive approach, you can quickly identify and address unexpected cost increases.

Conclusion

IAM Access Analyzer is a valuable tool for improving your organization’s security posture by detecting unused IAM roles, unused access keys for IAM users, unused passwords for IAM users, and unused services and actions for active IAM roles and users. You can then act based on those findings and support your effort to achieve least privilege access. By understanding the billing model and implementing these cost optimization strategies, you can maximize benefits while keeping costs under control. Remember, cost optimization is an ongoing process. Regularly review your usage and adjust your strategy as your needs evolve.

To learn more about IAM Access Analyzer and its pricing, see Getting started with AWS Identity and Access Management Access Analyzer. We’re here to help you optimize your AWS environment, so reach out to AWS Support and your AWS account team if you need further assistance.

If you have feedback about this post, submit comments in the Comments section below.

Oscar Diaz

Oscar Diaz Cordovez

Oscar is a Senior Technical Account Manager specializing in cloud operations and security. His passion for technology and innovation drives his expertise in cloud-native architectures, DevOps practices, and automation.

Avi Harari

Avi Harari

Avi is a Senior Technical Account Manager at AWS supporting Enterprise customers with the adoption and use of AWS services. He is part of the AWS Cloud Operations technical community, focusing on Cloud governance and compliance on AWS.

AWS Weekly Roundup: South America expansion, Q Developer in OpenSearch, and more (May 12, 2025)

Post Syndicated from Micah Walter original https://aws.amazon.com/blogs/aws/aws-weekly-roundup-south-america-expansion-q-developer-in-opensearch-and-more-may-12-2025/

I’ve always been fascinated by how quickly we’re able to stand up new Regions and Availability Zones at AWS. Today there are 36 launched Regions and 114 launched Availability Zones. That’s amazing!

This past week at AWS was marked by significant expansion to our global infrastructure. The announcement of a new Region in the works for South America means customers will have more options for meeting their low latency and data residency requirements. Alongside the expansion, AWS announced the availability of numerous instance types in additional Regions.

In addition to the infrastructure expansion, AWS is also expanding the reach of Amazon Q Developer into Amazon OpenSearch Service.

Last week’s launches

Instance announcements

AWS expanded instance availability for an array of instance types across additional Regions.

Additional updates

Upcoming events

We are in the middle of AWS Summit season! AWS Summits run throughout the summer in cities all around the world. Be sure to check the calendar to find out when a AWS Summit is happening near you. Here are the remaining Summits for May, 2025.


How is the News Blog doing? Take this 1 minute survey!

(This survey is hosted by an external company. AWS handles your information as described in the AWS Privacy Notice. AWS will own the data gathered via this survey and will not share the information collected with survey respondents.)

Petabyte-scale data migration made simple: AppsFlyer’s best practice journey with Amazon EMR Serverless

Post Syndicated from Roy Ninio original https://aws.amazon.com/blogs/big-data/petabyte-scale-data-migration-made-simple-appsflyers-best-practice-journey-with-amazon-emr-serverless/

This post is co-written with Roy Ninio from Appsflyer.

Organizations worldwide aim to harness the power of data to drive smarter, more informed decision-making by embedding data at the core of their processes. Using data-driven insights enables you to respond more effectively to unexpected challenges, foster innovation, and deliver enhanced experiences to your customers. In fact, data has transformed how organizations drive decision-making, but historically, managing the infrastructure to support it posed significant challenges and required specific skill sets and dedicated personnel. The complexity of setting up, scaling, and maintaining large-scale data systems impacted agility and pace of innovation. This reliance on experts and intricate setups often diverted resources from innovation, slowed time-to-market, and hindered the ability to respond to changes in industry demands.

AppsFlyer is a leading analytics and attribution company designed to help businesses measure and optimize their marketing efforts across mobile, web, and connected devices. With a focus on privacy-first innovation, AppsFlyer empowers organizations to make data-driven decisions while respecting user privacy and compliance regulations. AppsFlyer provides tools for tracking user acquisition, engagement, and retention, delivering actionable insights to enhance ROI and streamline marketing strategies.

In this post, we share how AppsFlyer successfully migrated their massive data infrastructure from self-managed Hadoop clusters to Amazon EMR Serverless, detailing their best practices, challenges to overcome, and lessons learned that can help guide other organizations in similar transformations.

Why AppsFlyer embraced a serverless approach for big data

AppsFlyer manages one of the largest-scale data infrastructures in the industry, processing 100 PB of data daily, handling millions of events per second, and running thousands of jobs across nearly 100 self-managed Hadoop clusters. The AppsFlyer architecture is comprised of many data engineering open source technologies, including but not limited to Apache Spark, Apache Kafka, Apache Iceberg, and Apache Airflow. Although this setup has powered operations for years, the growing complexity of scaling resources to meet fluctuating demands, coupled with the operational overhead of maintaining clusters, prompted AppsFlyer to rethink their big data processing strategy.

EMR Serverless is a modern, scalable solution that alleviates the need for manual cluster management while dynamically adjusting resources to match real-time workload requirements. With EMR Serverless, scaling up or down happens within seconds, minimizing idle time and interruptions like spot terminations.

This shift has freed engineering teams to focus on innovation, improved resilience and high availability, and future-proofed the architecture to support their ever-increasing demands. By only paying for compute and memory resources used during runtime, AppsFlyer also optimized costs and minimized charges for idle resources, marking a significant step forward in efficiency and scalability.

Solution overview

AppsFlyer’s previous architecture was built around self-managed Hadoop clusters running on Amazon Elastic Compute Cloud (Amazon EC2) and handled the scale and complexity of the data workflows. Although this setup supported operational needs, it required substantial manual effort to maintain, scale, and optimize.

AppsFlyer orchestrated over 100,000 daily workflows with Airflow, managing both streaming and batch operations. Streaming pipelines used Spark Streaming to ingest real-time data from Kafka, writing raw datasets to an Amazon Simple Storage Service (Amazon S3) data lake while simultaneously loading them into BigQuery and Google Cloud Storage to build logical data layers. Batch jobs then processed this raw data, transforming it into actionable datasets for internal teams, dashboards, and analytics workflows. Additionally, some processed outputs were ingested into external data sources, enabling seamless delivery of AppsFlyer insights to customers across the web.

For analytics and fast queries, real-time data streams were ingested into ClickHouse and Druid to power dashboards. Additionally, Iceberg tables were created from Delta Lake raw data and made accessible through Amazon Athena for further data exploration and analytics.

With the migration to EMR Serverless, AppsFlyer replaced its self-managed Hadoop clusters, bringing significant improvements to scalability, cost-efficiency, and operational simplicity.

Spark-based workflows, including streaming and batch jobs, were migrated to run on EMR Serverless and take advantage of the elasticity of EMR Serverless, dynamically scaling to meet workload demands.

This transition has significantly reduced operational overhead, alleviating the need for manual cluster management, so teams can focus more on data processing and less on infrastructure.

The following diagram illustrates the solution architecture.

This post reviews the main challenges and lessons learned by the team at AppsFlyer from this migration.

Challenges and lessons learned

Migrating a large-scale organization like AppsFlyer, with dozens of teams, from Hadoop to EMR Serverless was a significant challenge—especially because many R&D teams had limited or no prior experience managing infrastructure. To provide a smooth transition, AppsFlyer’s Data Infrastructure (DataInfra) team developed a comprehensive migration strategy that empowered the R&D teams to seamlessly migrate their pipelines.

In this section, we discuss how AppsFlyer approached the challenge and achieved success for the entire organization.

Centralized preparation by the DataInfra team

To provide a seamless transition to EMR Serverless, the DataInfra team took the lead in centralizing preparation efforts:

  • Clear ownership – Taking full responsibility for the migration, the team planned, guided, and supported R&D teams throughout the process.
  • Structured migration guide – A detailed, step-by-step guide was created to streamline the transition from Hadoop, breaking down the complexities and making it accessible to teams with limited infrastructure experience.

Building a strong support network

To make sure the R&D teams had the resources they needed, AppsFlyer established a robust support environment:

  • Data community – The primary resource for answering technical questions. It encouraged knowledge sharing across teams and was spearheaded by the DataInfra team.
  • Slack support channel – A dedicated channel where the DataInfra team actively responded to questions and guided teams through the migration process. This real-time support significantly reduced bottlenecks and helped teams resolve issues quickly.

Infrastructure templates with best practices

Recognizing the complexity of the team’s migration, the DataInfra team had standardized templates to help teams start quickly and efficiently:

  • Infrastructure as code (IaC) templates – They developed Terraform templates with best practices for building applications on EMR Serverless. These templates included code examples and real production workflows already migrated to EMR Serverless. Teams could quickly bootstrap their projects by using these ready-made templates.
  • Cross-account access solutions – Operating across multiple AWS accounts required managing secure access between EMR Serverless accounts (where jobs run) and data storage accounts (where datasets reside). To streamline this, a step-by-step module was developed for setting up cross-account access using Assume Role permissions. Additionally, a dedicated repository was created, so teams can define and automate role and policy creation, providing seamless and scalable access management.

Airflow integration

As AppsFlyer’s primary workflow scheduler, Airflow plays a critical role, making it essential to provide a seamless transition for its users.

AppsFlyer developed a dedicated Airflow operator for executing Spark jobs on EMR Serverless, carefully designed to replicate the functionality of the existing Hadoop-based Spark operator. In addition, a Python package was made available across all Airflow clusters with the relevant operators. This approach minimized code changes, allowing teams to transition seamlessly with minimal modifications.

Solving common permission challenges

To streamline permissions management, AppsFlyer developed targeted solutions for frequent use cases:

  • Comprehensive documentation – Provided detailed instructions for handling permissions for services like Athena, BigQuery, Vault, GIT, Kafka, and many more.
  • Standardized Spark defaults configuration for teams to apply to their applications – Included built-in solutions for collecting lineage from Spark jobs running on EMR Serverless, providing accountability and traceability.

Continuous engagement with R&D teams

To promote progress and maintain alignment across teams, AppsFlyer introduced the following measures:

  • Weekly meetings – Weekly status meetings to review the status of each team’s migration efforts. Teams shared updates, challenges, and commitments, fostering transparency and collaboration.
  • Assistance – Proactive assistance was provided for issues raised during meetings to minimize delays. This made sure that the teams were on track and had the support they needed to meet their commitments.

By implementing these strategies, AppsFlyer transformed the migration process from a daunting challenge into a structured and well-supported journey. Key outcomes included:

  • Empowered teams – R&D teams with minimal infrastructure experience were able to confidently migrate their pipelines.
  • Standardized practices – Infrastructure templates and predefined solutions provided consistency and best practices across the organization.
  • Reduced downtime – The custom Airflow operator and detailed documentation minimized disruptions to existing workflows.
  • Cross-account compatibility – With seamless cross-account access, teams could run jobs and access data efficiently.
  • Improved collaboration – The data community and Slack support channel fostered a sense of collaboration and shared responsibility across teams.

Migrating an entire organization’s data workflows to EMR Serverless is a complex task, but by investing in preparation, templates, and support, AppsFlyer successfully streamlined the process for all R&D teams in the company.

This approach can serve as a model for organizations undertaking similar migrations.

Spark application code management and deployment

For AppsFlyer data engineers, developing and deploying Spark applications is a core daily responsibility. The Data Platform team focuses on identifying and implementing the right set of tools and safeguards that would not only simplify the migration to EMR Serverless, but also streamline ongoing operations.

There are two different approaches available for running Spark code on EMR Serverless: custom container images and JARs or Python files. At the beginning of the exploration, custom images looked promising because it allows greater customization than JARs, which should allow the DataInfra team smoother migration for existing workloads. After deeper research, it was realized that custom images have great power, but come with a cost that in large scale would need to be evaluated. Custom images presented the following challenges:

  • Custom images are supported as of version 6.9.0, but some of AppsFlyer’s workloads used earlier versions.
  • EMR Serverless resources run from the moment EMR Serverless begins downloading the image until workers are stopped. This means a payment is done for aggregate vCPU, memory, and storage resources during the image download phase.
  • They required a different continuous integration and delivery (CI/CD) approach than compiling a JAR or Python file, leading to operational work that should be minimized as much as possible.

AppsFlyer decided to go all in with JARs and allow only in unique cases, where the customization required the use of custom images. Eventually, it was realized that using non-custom images was suitable for AppsFlyer use cases.

CI/CD perspective

From a CI/CD perspective, AppsFlyer’s DataInfra team decided to align with AppsFlyer’s GitOps vision, making sure that both infrastructure and application code are version-controlled, built, and deployed using Git operations.

The following diagram illustrates the GitOps approach AppsFlyer adopted.

JARs continuous integration

For CI, the process in charge of building the application artifacts, several options have been explored. The following key considerations drove the exploration process:

  • Use Amazon S3 as the native JAR source for EMR Serverless
  • Support different versions for the same job
  • Support staging and production environments
  • Allow hotfixes, patches, and rollbacks

Using AppsFlyer’s current external package repository led to challenges, because it required them to build a custom delivery into Amazon S3 or a complex runtime ability to fetch the code externally.

Using Amazon S3 directly also had several alternative approaches:

  • Buckets – Use single vs. separated buckets for staging and production
  • Versions – Use Amazon S3 native object versioning vs. uploading a new file
  • Hotfix – Override the same job’s JAR file vs. uploading a new one

Finally, the decision was to go with immutable builds for consistent deployment across the environments.

Each Spark job git repository pushes to the main branch, triggers a CI process to validate the semantic versioning (semver) assignment, compiles the JAR artifact, and uploads it to Amazon S3. Each artifact is uploaded to three different paths according to the version of the JAR, and also include a version tag for the S3 object:

  • <BucketName>/<SparkJobName>/<major>"."<minor>"."<patch>/app.jar
  • <BucketName>/<SparkJobName>/<major>"."<minor>"/app.jar
  • <BucketName>/<SparkJobName>/<major>/app.jar

AppsFlyer can now have deep granularity and assign each EMR Serverless job to a pinpointed version. Some jobs can run with the latest major version, and other stability and SLA sensitive jobs require a lock to a specific patch version.

EMR Serverless continuous deployment

Uploading the files to Amazon S3 was the final step in the CI process, which then leads to a different CD process.

CD is done by changing the infrastructure code, which is Terraform based, to point to the new JAR that was uploaded to Amazon S3. Then the staging or production application can start using the newly uploaded code and the process can be considered deployed.

Spark application rollbacks

If they need an application rollback, AppsFlyer points the EMR Serverless job IaC configuration from the current impaired JAR version to the previous stable JAR version in the relevant Amazon S3 path.

AppsFlyer believes that every automation impacting production, like CD, requires a breaking glass mechanism for an emergency situation. In such cases, AppsFlyer can manually override the needed S3 object (JAR file) while still using Amazon S3 versions in order to have better visibility and manual version control.

Single-job vs. multi-job applications

When using EMR Serverless, one important architectural decision is whether to create a separate application for each Spark job or use an automatic scaling application shared across multiple Spark jobs. The following table summarizes these considerations.

Aspect Single-Job Application Multi-Job Application
Logical Nature Dedicated application for each job. Shared application for multiple jobs.
Shared Configurations Limited shared configurations; each application is independently configured. Allows shared configurations through spark-defaults, including executors, memory settings, and JARs.
Isolation Maximum isolation; each job runs independently. Maintains job-level isolation through distinct IAM roles despite sharing the application.
Flexibility Flexible for unique configurations or resource requirements. Reduces overhead by reusing configurations and using automatic scaling.
Overhead Higher setup and management overhead due to multiple applications. Lower administrative overhead but requires careful resource contention management.
Use Cases Suitable for jobs with unique requirements or strict isolation needs. Ideal for related workloads that benefit from shared settings and dynamic scaling.

By balancing these considerations, AppsFlyer tailored its EMR Serverless usage to efficiently meet the demands of diverse Spark workloads across their teams.

Airflow operator: Simplifying the transition to EMR Serverless

Before the migration to EMR Serverless, AppsFlyer’s teams relied on a custom Airflow Spark operator created by the DataInfra team.

This operator, packaged as a Python library, was integrated into the Airflow environment and became a key component of the data workflows.

It provided essential capabilities, including:

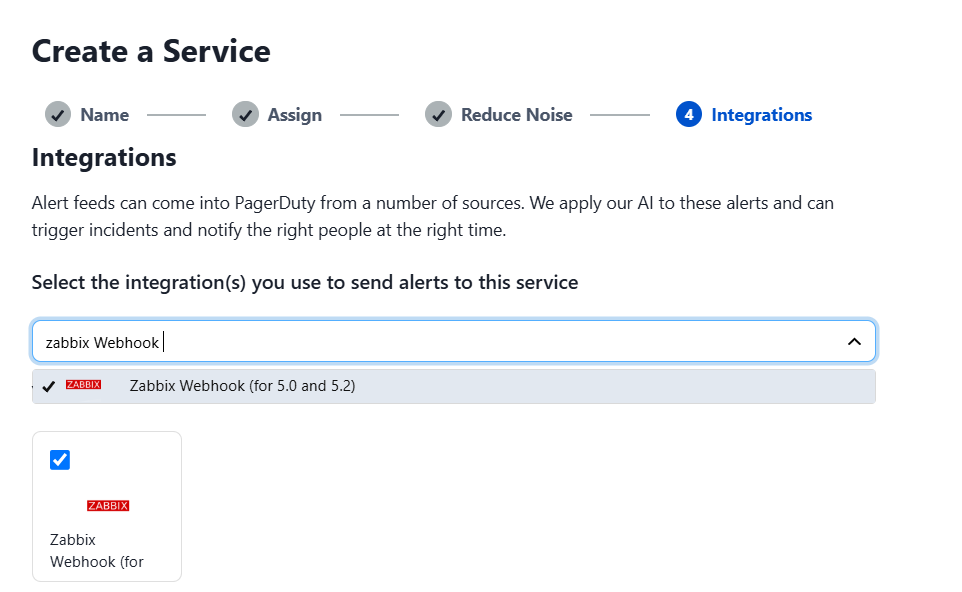
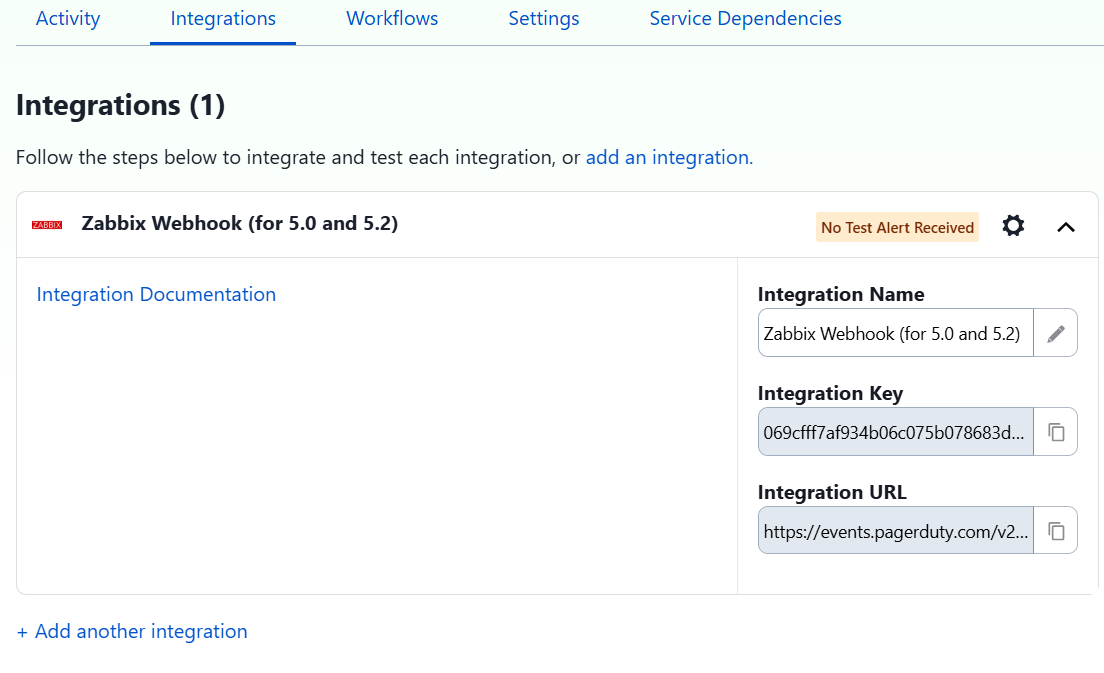
  • Retries and alerts – Built-in retry logic and PagerDuty alert integration
  • AWS role-based access – Automatic fetching of AWS permissions based on role names
  • Custom defaults – Setting Spark configurations and package defaults tailored for each job
  • State management – Job state tracking

This operator streamlined running Spark jobs on Hadoop and was highly tailored to AppsFlyer’s requirements.

When moving to EMR Serverless, the team chose to build a custom Airflow operator to align with their existing Spark-based workflows. They already had dozens of Directed Acyclic Graphs (DAGs) in production, so with this approach, they could maintain their familiar interface, including custom handling for retries, alerting, and configurations—all without requiring broad changes across the board.

This abstraction provided a smoother migration by preserving the same development patterns and minimizing the migration efforts of adapting to the native operator semantics.

The DataInfra team developed a dedicated, custom, EMR Serverless operator to support the following goals:

  • Seamless migration – The operator was designed to closely mimic the interface of the existing Spark operator on Hadoop. This made sure that teams could migrate with minimal code changes.
  • Feature parity – They added the features missing from the native operator:
    • Built-in retry logic.
    • PagerDuty integration for alerts.
    • Automatic role-based permission fetching.
    • Default Spark configurations and package support for each job.
  • Simplified integration – It’s packaged as a Python library available in Airflow clusters. Teams could use the operator just like they did with the previous Spark operator.

The custom operator abstracts some of the underlying configurations required to submit jobs to EMR Serverless, aligning with AppsFlyer’s internal best practices and adding essential features.

The following is from an example DAG using the operator:

return SparkBatchJobEmrServerlessOperator(
    task_id=task_id,  # Unique task identifier in the DAG

    jar_file=jar_file,  # Path to the Spark job JAR file on S3
    main_class="<main class path>",

    spark_conf=spark_conf,

    app_id=default_args["<emr_serverless_application_id>"],  # EMR Serverless app ID
    execution_role=default_args["<job_execution_role_arn>"],  # IAM role for job execution

    polling_interval_sec=120,  # How often to poll for job status
    execution_timeout=timedelta(hours=1),  # Max allowed runtime

    retries=5,  # Retry attempts for failed jobs
    app_args=[],  # Arguments to pass to the Spark job

    depends_on_past=True,  # Ensure sequential task execution

    tags={'owner': '<team_tag>'},  # Metadata for ownership
    aws_assume_role="<my_aws_role>",  # Role for cross-account access

    alerting_policy=ALERT_POLICY_CRITICAL.with_slack_channel(sc),  # Alerting integration
    owner="<team_owner>",

    dag=dag  # DAG this task belongs to
)

Cross-account permissions on AWS: Simplifying EMRs workflows

AppsFlyer operates across multiple AWS accounts, creating a need for secure and efficient cross-account access. EMR Serverless jobs are executed in the production account, and the data they process resides in a separate data account. To enable seamless operation, Assume Role permissions are used to verify that EMR Serverless jobs running in the production account can access the data and services in the data account. The following diagram illustrates this architecture.

Below is a diagram demonstrating the cross-account permissions AppsFlyer adopted:

Role management strategy

To manage cross-account access efficiently, three distinct roles were created and maintained:

  • EMR role – Used for executing and managing EMR Serverless applications in the production account. Integrated directly into Airflow workers to make it available for the DAGs on the dedicated team Airflow cluster.
  • Execution role – Assigned to the Spark job running on EMR Serverless. Passed by the EMR role in the DAG code to provide seamless integration.
  • Data role – Resides in the data account and is assumed by the execution role to access data stored in Amazon S3 and other AWS services.

To enforce access boundaries, each role and policy is tagged with team-specific identifiers.
This makes sure that teams can only access their own data and roles, minimizing unauthorized access to other teams’ resources.

Simplifying Airflow migration

A streamlined process to make cross-account permissions transparent for teams migrating their workloads to EMR Serverless was developed:

  1. The EMR role is embedded into Airflow workers, making it available for DAGs in the dedicated Airflow cluster for each team:
{
   "Version":"2012-10-17",
   "Statement":[
      "..."{
         "Effect":"Allow",
         "Action":"iam:PassRole",
         "Resource":"arn:aws:iam::account-id:role/execution-role",
         "Condition":{
            "StringEquals":{
               "iam:ResourceTag/Team":"team-tag"
            }
         }
      }
   ]
}
  1. The EMR role automatically passes the execution role to the job within the DAG code:
{
  "Version": "2012-10-17",
  "Statement": [
    {
      "Effect": "Allow",
      "Action": "sts:AssumeRole",
      "Resource": "arn:aws:iam::data-account-id:role/data-role",
      "Condition": {
        "StringEquals": {
          "iam:ResourceTag/Team": "team-tag"
        }
      }
    }
  ]
}
  1. The execution role assumes the data role dynamically during job execution to access the required data and services in the data account:

Allows the Execution Role in the Production account to assume the Data Role.

{
  "Version": "2012-10-17",
  "Statement": [
    {
      "Effect": "Allow",
      "Principal": {
        "AWS": "arn:aws:iam::production-account-id:role/execution-role"
      },
      "Action": "sts:AssumeRole"
    }
  ]
}
  1. Policies, trust relationships, and role definitions are managed in a dedicated GitLab repository. GitLab CI/CD pipelines automate the creation and integration of roles and policies, providing consistency and reducing manual overhead.

Benefits of AppsFlyer’s approach

This approach offered the following benefits:

  • Seamless access – Teams no longer need to handle cross-account permissions manually because these are automated through preconfigured roles and policies, providing seamless and secure access to resources across accounts.
  • Scalable and secure – Role-based and tag-based permissions provide security and scalability across multiple teams and accounts. By using roles and tags, it alleviates the need to create separate hardcoded policies for each team or account. Instead, they can define generalized policies that scale automatically as new resources, accounts, or teams are added.
  • Automated management – GitLab CI/CD streamlines the deployment and integration of policies and roles, reducing manual effort while enhancing consistency. It also minimizes human errors, improves change transparency, and simplifies version management.
  • Flexibility for teams – Teams have the flexibility to use their own or native EMR Serverless operators while maintaining secure access to data.

By implementing a robust, automated cross-account permissions system, AppsFlyer has enabled secure and efficient access to data and services across multiple AWS accounts. This makes sure that teams can focus on their workloads without worrying about infrastructure complexities, accelerating their migration to EMR Serverless.

Integrating lineage into EMR Serverless

AppsFlyer developed a robust solution for column-level lineage collection to provide comprehensive visibility into data transformations across pipelines. Lineage data is stored in Amazon S3 and subsequently ingested into DataHub, AppsFlyer’s lineage and metadata management environment.

Currently, AppsFlyer collects column-level lineage from a variety of sources, including Amazon Athena, BigQuery, Spark, and more.

This section focuses on how AppsFlyer collects Spark column-level lineage specifically within the EMR Serverless infrastructure.

Collecting Spark lineage with Spline

To capture lineage from Spark jobs, AppsFlyer uses Spline, an open source tool designed for automated tracking of data lineage and pipeline structures.

AppsFlyer modified Spline’s default behavior to output a customized Spline object that aligns with AppsFlyer’s specific requirements. AppsFlyer adapted the Spline integration into both legacy and modern environments. In the pre-migration phase, they injected the Spline agent into Spark jobs through their customized Airflow Spark operator. In the post-migration phase, they integrated Spline directly into EMR Serverless applications.

The lineage workflow consists of the following steps:

  1. As Spark jobs execute, Spline captures detailed metadata about the queries and transformations performed.
  2. The captured metadata is exported as Spline object files to a dedicated S3 bucket.
  3. These Spline objects are processed into column-level lineage objects customized to fit AppsFlyer’s data architecture and requirements.
  4. The processed lineage data is ingested into DataHub, providing a centralized and interactive view of data dependencies.

The following figure is an example of a lineage diagram from DataHub.

Challenges and how AppsFlyer addressed them

AppsFlyer encountered the following challenges:

  • Supporting different EMR Serverless applications – Each EMR Serverless application has its own Spark and Scala version requirements.
  • Diverse operator usage – Teams often use custom or native EMR Serverless operators, making uniform Spline integration challenging.
  • Confirming universal adoption – They need to make sure Spark jobs across multiple accounts use the Spline agent for lineage tracking.

AppsFlyer addressed these challenges with the following solutions:

  • Version-specific Spline agents – AppsFlyer created a dedicated Spline agent for each EMR Serverless application version to match its Spark and Scala versions. For example, EMR Serverless application version 7.0.1 and Spline.7.0.1.
  • Spark defaults integration – They integrated the Spline agent into EMR Serverless application Spark defaults to verify lineage collection for jobs executed on the application—no job-specific modifications needed.
  • Automation for compliance – This process consists of the following steps:
    • Detect a newly created EMR Serverless application across accounts.
    • Verify that Spline is properly defined in the application’s Spark defaults.
    • Send a PagerDuty alert to the dedicated team if misconfigurations are detected.

Example integration with Terraform

To automate Spline integration, AppsFlyer used Terraform and local-exec to define Spark defaults for EMR Serverless applications. With Amazon EMR, you can set unified Spark configuration properties through spark-defaults, which are then applied to Spark jobs.

This configuration makes sure the Spline agent is automatically applied to every Spark job without requiring modifications to the Airflow operator or the job itself.

This robust lineage integration provides the following benefits:

  • Full visibility – Automatic lineage tracking provides detailed insights into data transformations
  • Seamless scalability – Version-specific Spline agents provide compatibility with EMR Serverless applications
  • Proactive monitoring – Automated compliance checks verify that lineage tracking is consistently enabled across accounts
  • Enhanced governance – Ingesting lineage data into DataHub provides traceability, supports audits, and fosters a deeper understanding of data dependencies

By integrating Spline with EMR Serverless applications, AppsFlyer has provided comprehensive and automated lineage tracking, so teams can understand their data pipelines better while meeting compliance requirements. This scalable approach aligns with AppsFlyer’s commitment to maintaining transparency and reliability throughout their data landscape.

Monitoring and observability

When embarking on a large migration, and as a day-to-day best-practice process, monitoring and observability are key parts of being able to run workloads successfully for stability, debugging, and cost.

AppsFlyer’s DataInfra team set several KPIs for monitoring and observability in EMR Serverless:

  • Monitor infrastructure-level metrics and logs:
    • EMR Serverless resource usage, including cost
    • EMR Serverless API usage
  • Monitor Spark application-level metrics and logs:
    • stdout and stderr logs
    • Spark engine metrics
  • Centralized observability over the existing environments, Datadog

Metrics

Using EMR Serverless native metrics, AppsFlyer’s DataInfra team set up several dashboards to support tracking both the migration and the day-to-day usage of EMR Serverless across the company. The following are the main metrics that were monitored:

  • Service quota usage metrics:
    • vCPU usage tracking (ResourceCount with vCPU dimension)
    • API usage tracking (API actual usage vs. API limits)
  • Application status metrics:
    • RunningJobs, SuccessJobs, FailedJobs, PendingJobs, CancelledJobs
  • Resource limits tracking:
    • MaxCPUAllowed vs. CPUAllocated
    • MaxMemoryAllowed vs. MemoryAllocated
    • MaxStorageAllowed vs. StorageAllocated
  • Worker-level metrics:
    • WorkerCpuAllocated vs. WorkerCpuUsed
    • WorkerMemoryAllocated vs. WorkerMemoryUsed
    • WorkerEphemeralStorageAllocated vs. WorkerEphemeralStorageUsed
  • Capacity allocation tracking:
    • Metrics filtered by CapacityAllocationType (PreInitCapacity vs. OnDemandCapacity)
    • ResourceCount
  • Worker type distribution:
    • Metrics filtered by WorkerType (SPARK_DRIVER vs. SPARK_EXECUTORS)
  • Job success rates over time:
    • SuccessJobs vs. FailedJobs ratio
    • SubmitedJobs vs. PendingJobs

The following screenshot shows an example of the tracked metrics.

Logs

For logs management, AppsFlyer’s DataInfra team explored several options:

Streamlining EMR Serverless log shipping to Datadog

Because AppsFlyer decided to keep their logs in an external logging environment, the DataInfra team aimed to reduce the number of components involved in the shipping process and minimize maintenance overhead. Instead of managing a Lambda based log shipper, they developed a custom Spark plugin that seamlessly exports logs from EMR Serverless to Datadog.

Companies already storing logs in Amazon S3 or CloudWatch Logs can take advantage of EMR Serverless native support for those environments. However, for teams needing a direct, real-time integration with Datadog, this approach alleviates the need for extra infrastructure, providing a more efficient and maintainable logging solution.

The custom Spark plugin offers the following capabilities:

  • Automated log export – Streams logs from EMR Serverless to Datadog
  • Fewer extra components – Alleviates the need for Lambda based log shippers
  • Secure API key management – Uses Vault instead of hardcoding credentials
  • Customizable logging – Supports custom Log4j settings and log levels
  • Full integration with Spark – Works on both driver and executor nodes

How the plugin works

In this section, we walk through the components of how the plugin works and provide a pseudocode overview:

  • Driver pluginLoggerDriverPlugin runs on the Spark driver to configure logging. The plugin fetches EMR job metadata, calls Vault to retrieve the Datadog API key, and configures logging settings.
initialize() {
  if (user provided log4j.xml) {
     Use custom log configuration
  } else {
     Fetch EMR job metadata (application name, job ID, tags)
     Retrieve Datadog API key from Vault
     Apply default logging settings
  }
}
  • Executor plugin – LoggerExecutorPlugin provides consistent logging across executor nodes. It inherits the driver’s log configuration and makes sure the executors use consistent logging
initialize() {
   fetch logging config from Driver
   apply log settings (log4j, log levels)
}
  • Main plugin – LoggerSparkPlugin registers the driver and executor plugins in Spark. It serves as the entry point for Spark and applies custom logging settings dynamically.
function registerPlugin() {
  return (driverPlugin, executorPlugin);
}
loginToVault(role, vaultAddress) {
    create AWS signed request
    authenticate with Vault
    return vault token
}

getDatadogApiKey(vaultToken, secretPath) {
    fetch API key from Vault
    return key
}

Set up the plugin

To set up the plugin, complete the following steps:

  1. Add the following dependencies to your project:
<dependency>
  <groupId>com.AppsFlyer.datacom</groupId>
  <artifactId>emr-serverless-logger-plugin</artifactId>
  <version><!-- insert version here --></version>
</dependency>
  1. Configure the Spark plugin. The following code enables the custom Spark plugin and assigns the Vault role to access the Datadog API key:

--conf "spark.plugins=com.AppsFlyer.datacom.emr.plugin.LoggerSparkPlugin"

--conf "spark.datacom.emr.plugin.vaultAuthRole=your_vault_role"

  1. Use a custom or default Log4j configuration:

--conf "spark.datacom.emr.plugin.location=classpath:my_custom_log4j.xml"

  1. Set the environment variables for different log levels. This adjusts the logging for specific packages.

--conf "spark.emr-serverless.driverEnv.ROOT_LOG_LEVEL=WARN"

--conf "spark.executorEnv.ROOT_LOG_LEVEL=WARN"

--conf "spark.emr-serverless.driverEnv.LOG_LEVEL=DEBUG"

--conf "spark.executorEnv.LOG_LEVEL=DEBUG"

  1. Configure the Vault and Datadog API key and verify secure Datadog API key retrieval.

By adopting this plugin, AppsFlyer was able to significantly simplify log shipping, reducing the number of moving parts while maintaining real-time log visibility in Datadog. This approach provides reliability, security, and ease of maintenance, making it an ideal solution for teams using EMR Serverless with Datadog.

Summary

Through their migration to EMR Serverless, AppsFlyer achieved a significant transformation in team autonomy and operational efficiency. Individual teams now have greater freedom to choose and build their own resources without depending on a central infrastructure team, and can work more independently and innovatively. The minimization of spot interruptions, which were common in their previous self-managed Hadoop clusters, has substantially improved stability and agility in their operations. Thanks to this autonomy and reliability, combined with the automatic scaling capabilities of EMR Serverless, the AppsFlyer teams can focus more on data processing and innovation rather than infrastructure management. The result is a more efficient, flexible, and self-sufficient development environment where teams can better respond to their specific needs while maintaining high performance standards.

Ruli Weisbach, AppsFlyer EVP of R&D, says,

“EMR-Serverless is a game changer for AppsFlyer; we are able to save significantly our cost with remarkably lower management overhead and maximal elasticity.”

If the AppsFlyer approach sparked your interest and you are thinking about implementing a similar solution in your organization, refer to the following resources:

Migrating to EMR Serverless can transform your organization’s data processing capabilities, offering a fully managed, cloud-based experience that automatically scales resources and eases the operational complexity of traditional cluster management, while enabling advanced analytics and machine learning workloads with greater cost-efficiency.


About the authors

Roy Ninio is an AI Platform Lead with deep expertise in scalable data platform and cloud-native architectures. At AppsFlyer, Roy led the design of a high-performance Data Lake handling PB of daily events, driven the adoption of EMR Serverless for dynamic big data processing, and architected lineage and governance systems across platforms.

Avichay Marciano is a Sr. Analytics Solutions Architect at Amazon Web Services. He has over a decade of experience in building large-scale data platforms using Apache Spark, modern data lake architectures, and OpenSearch. He is passionate about data-intensive systems, analytics at scale, and it’s intersection with machine learning.

Eitav Arditti is AWS Senior Solutions Architect with 15 years in AdTech industry, specializing in Serverless, Containers, Platform engineering, and Edge technologies. Designs cost-efficient, large-scale AWS architectures that leverage the cloud-native and edge computing to deliver scalable, reliable solutions for business growth.

Yonatan Dolan is a Principal Analytics Specialist at Amazon Web Services. Yonatan is an Apache Iceberg evangelist, helping customers design scalable, open data lakehouse architectures and adopt modern analytics solutions across industries.

Implement event-driven invoice processing for resilient financial monitoring at scale

Post Syndicated from Grey Newell original https://aws.amazon.com/blogs/architecture/implement-event-driven-invoice-processing-for-resilient-financial-monitoring-at-scale/

Processing high volumes of invoices efficiently while maintaining low latency, high availability, and business visibility is a challenge for many organizations. A customer recently consulted us on how they could implement a monitoring system to help them process and visualize large volumes of invoice status events.

This post demonstrates how to build a Business Event Monitoring System (BEMS) on AWS that handles over 86 million daily events with near real-time visibility, cross-Region controls, and automated alerts for stuck events. You might deploy this system for business-level insights into how events are flowing through your organization or to visualize the flow of transactions in real time. Downstream services also will have the option to process and respond to events originating within the system or not.

Business challenge

For our use case, a global enterprise wants to deploy a monitoring system for their invoice event pipeline. The pipeline processes millions of events per period, projected to surge 40% within 18 months. Each invoice must navigate a four-stage journey while making sure every event is visible within 2 minutes. End-of-month invoice surges reach 60,000 events per minute or up to 86 million per day. With payment terms spanning from standard 30-day windows to year-long arrangements, the architecture demands zero tolerance for missing events. Finance executives require near real-time visibility through dashboards, and auditors demand comprehensive historical retrieval.

Solution overview

The architecture implements a serverless event-driven system broken into independently deployable Regional cells, as illustrated in the following diagram.

The solution uses the following key services:

  • Amazon API Gateway – Clients want to send events into our solution using HTTPS calls to a REST API. API Gateway was selected due to its support for REST, event-based integrations with other AWS services, and its support for throttling to prevent individual callers from creating a system overload.
  • Amazon EventBridge – Events created by API Gateway need to be routed to downstream consumers and archived where events can be replayed later. EventBridge provides a custom event bus that defines rules to intelligently route events based on their contents.
  • Amazon Simple Notification Service (Amazon SNS) – To keep EventBridge rules simple, events are routed by type to one or more destinations for fanout. SNS topics are used as routing targets to activate fanout to a variety of downstream consumers with optional subscription filters to control which events are received by consumers.
  • Amazon Simple Queue Service (Amazon SQS) – Each SNS topic fans out by sending a copy of each message to each consumer subscribed to the topic. Consumers receive messages through Amazon SQS, which decouples event processing compute and provides dead-letter queues (DLQs) for storing messages that fail to process. EventBridge custom event buses and SNS FIFO (First-In-First-Out) topics can also use DLQs powered by Amazon SQS.
  • AWS Lambda – The Lambda architecture aligns with short-lived processing tasks, spinning up when needed and disappearing afterward without incurring idle resource costs. This integration between Lambda and Amazon SQS delivers an economical processing system that automatically scales with demand, allowing developers to focus on business logic rather than infrastructure orchestration, and the pay-per-execution model provides financial efficiency.
  • Amazon Timestream – Timestream offers a purpose-built architecture that addresses the unique challenges of time series data, auto scaling to ingest millions of events while maintaining fast query performance for responsive dashboard visualizations. Its intelligent tiered storage system automatically transitions data between memory and cost-effective long-term storage without sacrificing analytics capabilities, enabling organizations to maintain both real-time operational visibility and historical trending insights through a single, unified platform that integrates with QuickSight.
  • Amazon QuickSight – QuickSight transforms event streams into visual narratives through its intuitive interface, empowering business users to discover actionable insights without specialized data science expertise. Its serverless architecture scales to accommodate millions of users while offering machine learning (ML)-powered anomaly detection and forecasting capabilities, all within a pay-per-session pricing model that activates sophisticated analytics that would otherwise require significant resources. QuickSight dashboards can either directly query from a Timestream table or cache records in-memory with SPICE periodically.

Events flow through the layers of this architecture in four stages:

  • Event producers – API Gateway for receiving client events through a REST API
  • Event routing – EventBridge routes events to SNS topics for fanout
  • Event consumers – SQS queues with Lambda or Fargate consumers
  • Business intelligence – Timestream and QuickSight for dashboards

Design tenets

The solution adheres to three key architectural principles:

  • Cellular architecture – In a cellular architecture, your workload scales through independent deployment units like the one depicted in the previous section. Each unit operates as a self-contained cell, and more cells can be deployed to different AWS Regions or AWS accounts to further increase throughput. Cellular design activates independent scaling of resources based on local load and limits the area of effect of failures.
  • Serverless architecture – In a serverless architecture, operational overhead of scaling is minimized by using managed services. We use Lambda for compute-intensive tasks like fanning out messages to thousands of micro-consumers or employing container-based services (AWS Fargate) for longer-running processes.
  • Highly available design – We maintain the availability of our overall financial system through Multi-AZ resilience at every layer. Automatic failover and disaster recovery procedures can be implemented without altering the architecture. We also use replication, archival, and backup strategies to prevent data loss in the event of cell failure.

Scaling constraints

Our solution will experience the following scaling bottlenecks with quotas sampled from the us-east-1 Region:

We can safely scale a single account to 10,000 requests per second (600,000 per minute, 864 million per day) without increasing service quotas in the us-east-1 Region. Default quotas will vary per Region and the values can be increased by raising a support ticket. The architecture scales even further by deploying independent cells into multiple Regions or AWS accounts.

Scaling of QuickSight and Timestream depends on the computational complexity of analysis, the window of time being analyzed, and the number of users concurrently analyzing the data, which was not a scaling bottleneck in our use case.

Prerequisites

Before implementing this solution, make sure you have the following:

  • An AWS account with administrator access
  • The AWS Command Line Interface (AWS CLI) version 2.0 or later installed and configured
  • Appropriate AWS service quotas confirmed for high-volume processing

In the following sections, we walk through the steps for our implementation strategy.

Decide on partitioning strategies

First, you must decide how your solution will partition requests between cells. In our use case, dividing cells by Region allows us to offer low-latency local processing for events while keeping each cell fully independent from one another.

Inside of each cell, traffic flow is roughly evenly divided between the four stages of invoice processing. Our solution breaks each cell into four logical partitions or flows by invoice status (authorization, reconciliation, and so on). Partitioning offers the ability to fan out and scale resources independently based on traffic patterns specific to each partition.

To partition your cellular architecture, consider the volume, distribution, and access pattern of the events that will flow through each cell. You must allow independent scaling within your cells without encountering global service limits. Choose a strategy that allows each cell to be broken into 1–99 roughly equivalent partitions based on predictable attributes.

Implement the event routing layer

The event routing layer combines EventBridge for intelligent routing with Amazon SNS for efficient fanout.

EventBridge custom event bus configuration

Create a custom event bus with rules to route events based on your partitioning strategy:

  • Use content-based filtering to direct events to appropriate SNS topics
  • Implement an archive to replay events from history if processing fails

Define a standard event schema for common metadata, including:

  • Invoice ID, amount, currency, status, timestamp
  • Vendor information and payment terms
  • Processing metadata (Region, account ID, and so on)

SNS topic structure

Create SNS topics for each logical partition:

  • invoice-ingestion
  • invoice-reconciliation
  • invoice-authorization
  • invoice-posting

Implement message filtering at the subscription level for granular control of which messages subscribing consumers see. Each topic can fan out to a large variety of downstream consumers that are also waiting for events that match the EventBridge custom event bus rules. Delivery failures will be retried automatically up to a configurable limit.

Implement event producers

Configure API Gateway to receive events from existing systems with built-in throttling and error handling.

API design

Create a RESTful API with resources and a path for each logical partition inside your cell:

  • /invoices/ingestion (POST)
  • /invoices/reconciliation (POST)
  • /invoices/authorization (POST)
  • /invoices/posting (POST)

Implement request validation using a JSON schema for each endpoint. Use API Gateway request transformations to standardize incoming data and provide well-formatted error messages and response codes to clients in the event of failures.

Security and throttling

Implement API keys and usage plans for client authentication and rate limiting to prevent a talkative upstream from bringing down the system. Configure AWS WAF rules to protect against common attacks against API endpoints. Set up throttling to handle burst traffic (60,000 events/minute) at the account level and the method level.

Monitoring and logging

Our partitioned event producer strategy allows your solution to independently monitor each event type by:

  • Enabling Amazon CloudWatch Logs for API Gateway with log retention policies
  • Setting up AWS X-Ray tracing for end-to-end request analysis
  • Implementing custom metrics for monitoring API performance and usage patterns

Implement event consumers

Implement durable processing using SQS queues with DLQs attached and serverless Lambda consumers.

SQS queue structure

Create SQS queues in front of each consumer to decouple message delivery and processing, in our case one per partition:

  • invoice-ingestion.fifo
  • invoice-reconciliation.fifo
  • invoice-authorization.fifo
  • invoice-posting.fifo

Set up DLQs for each main queue:

  • Configure maximum receives before moving to the DLQ
  • Implement alerting for stuck messages in the DLQ

Lambda consumers

Attach Lambda functions to each queue for custom processing of events:

  • InvoiceIngestionProcessor
  • InvoiceReconciliationProcessor
  • InvoiceAuthorizationProcessor
  • InvoicePostingProcessor

Functions handle necessary transformations, call downstream services, and load events into Timestream. Double-check concurrency limits and provisioned concurrency to cover peak and sustained load, respectively.

Error handling and retry logic

Develop a custom retry mechanism for business logic failures and exponential backoff for transient errors. Create an operations dashboard with alerts and metrics for monitoring stuck events to redrive.

Build the business intelligence dashboard

Use Timestream and QuickSight to create real-time financial event dashboards.

Timestream data model

When modeling real-time invoice events in Timestream, using multi-measure records provides optimal efficiency by designating invoice ID as a dimension while storing processing timestamps, amounts, and status as measures within single records. This approach creates a cohesive time series view of each invoice’s lifecycle while minimizing data fragmentation.

Multi-measure modeling is preferable because it significantly reduces storage requirements and query complexity, enabling more efficient time-based analytics. The resulting performance improvements are particularly valuable for dashboards that need to visualize invoice processing metrics in real time, because they can retrieve complete invoice histories with fewer operations and lower latency, ultimately delivering a more responsive monitoring solution.

Real-time data ingestion

Create a Lambda function to push metrics to Timestream:

  • Trigger on every status change in the invoice lifecycle
  • Batch writes for improved performance during high-volume periods

QuickSight dashboard design

Develop interactive QuickSight dashboards for different user personas:

  • Executive overview – High-level KPIs and trends
  • Operations dashboard – Detailed processing metrics and bottlenecks
  • Finance dashboard – Cash flow projections and payment analytics

Don’t forget to implement ML-powered anomaly detection for identifying unusual patterns in your events.

Monitoring and alerting

Set up CloudWatch alarms for key metrics:

  • Processing latency exceeding Service-Level Agreements (SLAs)
  • Error rates above expected percentage for any processing stage
  • Queue depth exceeding predefined thresholds

Configure SNS topics for alerting finance teams and operations:

  • Use different topics for varying alert severities
  • Implement automated escalation for critical issues

Develop custom CloudWatch dashboards for system-wide monitoring:

  • End-to-end processing visibility
  • Regional performance comparisons

Security

Add permissions in a least privilege manner for each required service listed in the architecture:

  • Create separate execution roles for each Lambda function
  • Implement role assumption for cross-account operations

Encrypt data at rest and in transit:

Set up AWS Config rules to maintain compliance with internal policies:

  • Monitor for unapproved resource configurations
  • Automate remediation for common violations

Use AWS CloudTrail for comprehensive auditing:

  • Enable organization-wide trails
  • Implement log analysis for detecting suspicious activities

Conclusion

The serverless event-driven architecture presented in this post enables processing of over 86 million daily invoices while maintaining near real-time visibility, strict compliance with internal policies, cellular scaling capabilities, and minimal operational overhead. This solution provides a robust foundation for modernizing financial operations, enabling organizations to handle the complexities of high-volume invoice processing with confidence and agility.

For further enhancements, consider exploring:

  • Machine learning for predictive analytics on event patterns
  • Implementing AWS Step Functions for complex, multi-stage workflows
  • Integrating with AWS Lake Formation for centralized data governance and analytics

About the author

The collective thoughts of the interwebz