Post Syndicated from Explosm.net original https://explosm.net/comics/road-beer
New Cyanide and Happiness Comic
Post Syndicated from Explosm.net original https://explosm.net/comics/road-beer
New Cyanide and Happiness Comic
Post Syndicated from Jerry Sha original https://www.backblaze.com/blog/one-simple-change-that-made-our-exabyte-scale-storage-faster/

When you’re moving exabytes of data, every network request, every CPU cycle, every byte matters. Recently, I had the chance to revisit a part of our system that’s been quietly humming along for years. With one small rethink, we helped give our download performance a serious boost.
The idea was almost laughably simple: combine two separate requests into one. But when you’re operating at massive scale, even a “simple” change can make a huge difference.
From our new series on engineering innovations, check out Analyzing Performance at Exabyte Scale and What Powers the Performance of Backblaze for a deeper dive into the engineering principles that drive our storage platform.
Before the change, downloading a file meant:
That meant 40 separate requests just to get the ball rolling on every download.
At some point, it clicked for me: why were we doing this in two steps? The original setup only pulled the bare minimum of data. But what if we just grabbed everything we needed at once? There wasn’t a good reason not to. So I refactored the process so that a pod could grab both the shard header and the data in a single request.
Now:
After the fix, we’re still reading the same amount of data from disk, so disk I/O remains unchanged, but network performance improved significantly. Instead of kicking off 40 network operations, we’re down to about half that. Less traffic, less overhead, faster performance.
It was a simple fix, but the project required a significant amount of software engineering work as well. By shifting responsibilities to the “receiving pod” the coordinator needed to learn to perform lots of just-in-time reasoning about the nature of the download, which required rethinking how we architected portions of the download code.
If you’re thinking, “shouldn’t that make downloads twice as fast?”—not quite.
Here’s why: Big files get broken into “stripes” during download, and my change only optimizes the first stripe request. Smaller files (a big chunk of our traffic) see the full benefit because they often fit into a single stripe. For larger files, though, the improvement only affects a small part of the overall download, so the impact is more limited.
Measuring the real-world effect turned out to be trickier than I expected. Our download traffic isn’t steady; it’s spiky. Under normal conditions, our system wasn’t hitting capacity limits which made it hard to clearly see changes in download performance.
But in our dedicated performance testing environment, where we could send a controlled load of downloads, the improvement was crystal clear. With this change, our system could handle a much higher peak load—great news for handling things like backup surges, AI training runs, and large enterprise downloads.
One of the coolest side effects? This doesn’t just help customer downloads. It also speeds up internal operations like vault recomputing data drives and server-side copies.
By freeing up CPU cycles that used to be wasted on multiple requests, we open the door for better performance everywhere. And hey, maybe even some minor energy savings—less CPU load means less heat, less power.
When you’re trying to optimize a massive system, it’s tempting to chase performance with complicated solutions: more threads, smarter caches, fancier hardware.
But sometimes, the real win is just about thinking differently. Questioning assumptions. Asking, “Wait, why are we doing it this way?”
For me, this project was a great reminder that even at exabyte scale, the simplest solution can be the most impactful.
The post One Simple Change That Made Our Exabyte-Scale Storage Faster appeared first on Backblaze Blog | Cloud Storage & Cloud Backup
Post Syndicated from Crosstalk Solutions original https://www.youtube.com/watch?v=I-jjxWYV-HE
Post Syndicated from The Atlantic original https://www.youtube.com/watch?v=FGVjYkEUsYE
Post Syndicated from Rapid7 original https://blog.rapid7.com/2025/05/06/key-takeaways-from-the-take-command-summit-2025-from-zero-to-hero-building-the-perfect-defense/

At Take Command 2025, bold ideas and fresh thinking took center stage — in particular in our opening talk From Zero to Hero: Building the Perfect Defense.
Led by Ted Harrington, Executive Partner at ISE, and hosted by Thom Langford, EMEA CTO at Rapid7, this session challenged security leaders to think beyond traditional defenses and imagine a future where cybersecurity is smarter, faster, and proactive by design.
Here’s a quick look at the key insights from the conversation.
Ted kicked things off with a fundamental question: if we could rebuild cybersecurity from scratch, what would we do differently?
Instead of layering on more tools or chasing compliance checklists, today’s most resilient organizations are rethinking their architectures, embedding security principles like Zero Trust from the ground up, and designing systems to stop threats before they strike.
The best defenders don’t just react, they anticipate. Ted emphasized the importance of adopting a hacker mindset within security teams. Creativity, curiosity, and a willingness to question assumptions are critical to staying ahead of adversaries who constantly innovate.
Security strategies must evolve to disrupt attacker workflows, not just patch known vulnerabilities.
One of the biggest missed opportunities in cybersecurity is the failure to connect security outcomes to business success.
Ted encouraged security leaders to speak the language of the boardroom, framing security initiatives as drivers of trust, resilience, and competitive advantage — not just cost centers or necessary evils.
Ted didn’t shy away from real talk about the internal challenges many security teams face.
Burnout, underfunded initiatives, and misaligned CISO roles are slowing progress across the industry.
Organizations must empower security leadership with proper funding, executive visibility, and a seat at the table if they want to build truly resilient programs.
Ted’s message was clear: the future of cybersecurity won’t be built on incremental improvements. It will be shaped by organizations bold enough to rethink, reframe, and rebuild from a position of strength.
Want to dive deeper? Catch the full session on demand and explore how you can take command of your defenses today.
Post Syndicated from Sophie Ashford original https://www.raspberrypi.org/blog/celebrating-young-innovators-at-coolest-projects-usa/
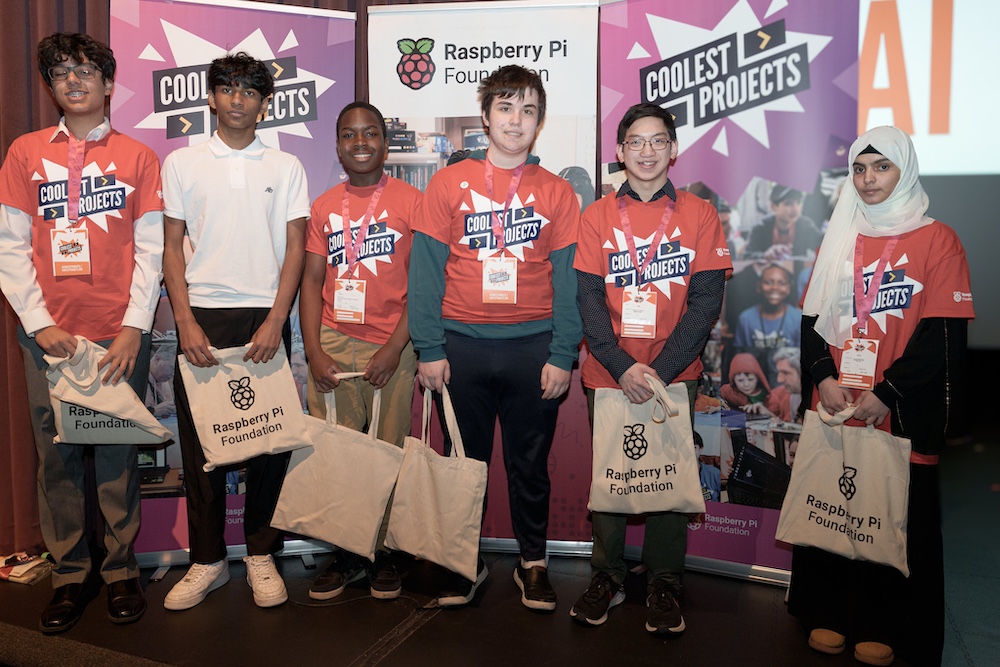
Last month, the Science Museum of Minnesota buzzed with excitement as young tech creators from across the country came together for Coolest Projects USA in a celebration of creativity, curiosity, and coding.
Around 40 young people showcased their projects on the day, sharing their work with friends, family, and the wider coding community. With hands-on tech activities, project demonstrations, fun swag, and certificates of achievement, the day was packed with energy and enthusiasm.

Coolest Projects is all about empowering young people to show off what they’ve built, no matter their skill level or experience. From first-time coders to budding engineers, everyone was welcomed and learnt something from the day.
One of the standout moments was the presentation of the Broadcom Foundation Coding with Commitment® special recognition, which highlights a project that uses code to solve real-world problems.
The award went to Kaila for her project, Car vs Road, a self-driving car simulation designed to explore how natural disasters like hurricanes, floods, and tornadoes might impact autonomous vehicle technology.

“My project was inspired by Waymo. After hearing about Coolest Projects through the Minnesota State Science and Engineering Fair, I decided to attend — and absolutely loved it! The atmosphere was welcoming, the judges were so involved, and the entire experience was truly unforgettable.” – Kaila, 2025 Coding with Commitment® recipient
Broadcom Foundation’s partnership with Coolest Projects USA highlights how coding can be a powerful tool for tackling global challenges, from health to climate change, and champions digital literacy for all youth.
With seven categories available for entries, the judges had their work cut out for them choosing their favourite projects. Here are some that captured their attention on the day:
Mila | Sports Compilation, Scratch
Mila’s project, Sports Compilation, tells a story through animated sports scenes that inspire people to try new things and embrace their rebellious side.
“I wanted to show my mom that I could code — even though I’m not a ‘full-time coder’. I kept working on my original sports scene and added more to create something bigger.”

“My biggest challenge was making it reset automatically. At first, I didn’t understand the instructions I found online, but then I figured out how to use timing and broadcasts to make it work.”
“Coolest Projects was so fun, my teacher hyped it up, and it lived up to the excitement!”
Ethan | Coding AI to Enhance Speech Therapy
Ethan’s project was inspired by his experience with speech therapy. He used machine learning to help people identify and correct different types of incorrect pronunciations of the /s/ sound. Ethan shared his motivations behind attending:
“I went to Coolest Projects USA to get the opportunity to present my work and receive feedback from a large audience of judges, participants, and other viewers on how to improve my project and the presentation of it.”
“I had fun at Coolest Projects USA, seeing the different ways that young people like me are taking advantage of technology to try and help the lives of others, and also seeing the creativity and determination that we have.”
We want to say a huge thank you to every young creator who presented a project, to the families who cheered them on, and to our amazing volunteers and partners. We also want to give a special shoutout to our sponsors, Broadcom Foundation and Best Buy Inc., for their incredible support. We couldn’t have done it without you.
Thank you for making Coolest Projects USA 2025 such a special day!

If you missed the event or are feeling inspired, there are still ways to join the Coolest Projects global community!
Partner events are held around the world — head to the Coolest Projects website to find out more.
The post Celebrating young innovators at Coolest Projects USA appeared first on Raspberry Pi Foundation.
Post Syndicated from Bruce Schneier original https://www.schneier.com/blog/archives/2025/05/fake-student-fraud-in-community-colleges.html
Reporting on the rise of fake students enrolling in community college courses:
The bots’ goal is to bilk state and federal financial aid money by enrolling in classes, and remaining enrolled in them, long enough for aid disbursements to go out. They often accomplish this by submitting AI-generated work. And because community colleges accept all applicants, they’ve been almost exclusively impacted by the fraud.
The article talks about the rise of this type of fraud, the difficulty of detecting it, and how it upends quite a bit of the class structure and learning community.
Slashdot thread.
Post Syndicated from corbet original https://lwn.net/Articles/1020222/
Security updates have been issued by Fedora (chromium and kappanhang), Red Hat (osbuild-composer and thunderbird), SUSE (chromedriver), and Ubuntu (c-ares, corosync, mysql-8.0, mysql-8.4, openjdk-17, openjdk-21, openjdk-24, openjdk-8, and openjdk-lts).
Post Syndicated from The Atlantic original https://www.youtube.com/watch?v=1htaJoczjSE
Post Syndicated from corbet original https://lwn.net/Articles/1020203/
AUTOSEL is a tool that is used to find kernel patches that should be
considered for backporting into the stable releases. Sasha Levin has announced a new and completely
rewritten version of AUTOSEL for those who would like to play with it.
Unlike the previous version that relied on word statistics and
older neural network techniques, AUTOSEL leverages modern large
language models and embedding technology to provide significantly
more accurate recommendations.
Post Syndicated from Michael Kammer original https://blog.zabbix.com/build-a-culture-of-monitoring-and-get-buy-in-with-zabbix/30085/
In today’s fast-paced, interconnected IT world, simply waiting for something to fail before fixing it isn’t good enough. A proactive approach to monitoring, which aims to identify and address potential issues before they escalate into major disruptions, is a necessity rather than a luxury.
Here at Zabbix, we’ve got plenty of reason to believe that we offer the most flexible monitoring solution available on the market today. However, choosing the best monitoring tool for your organization’s needs is only half the battle – you also need to get buy-in from team members who may not understand the need for monitoring, may be fearful of and resistant to change, and may not be familiar with the technologies behind monitoring.
In this post, we’ll take a look at a few strategies you can use to help win over lukewarm or hesitant colleagues and build a culture of monitoring. We’ll also explore how choosing Zabbix for your monitoring needs can make each strategy a bit easier to implement.
Table of Contents
One of the first questions that you can anticipate during any change initiative is simply, “what for?” The ethos of “don’t fix what isn’t broken” runs strong in the tech community, and unless you go above and beyond to explain why monitoring matters, your team will remain skeptical.
Zabbix can help you make your case by providing you with the evidence you need to bolster your case. We’ve got plenty of testimonials available from tech communities worldwide (including PeerSpot, Gartner, and Capterra), and no matter what field you’re in or how big your team is, we’ve most likely got a case study or two available that shows how monitoring with Zabbix was a game changer for a company like yours.
All of this should help you explain the rationale for the change in an open and transparent way. When it comes to monitoring, sharing details on costs, expected benefits, and what will happen if no change is made will build understanding around why monitoring is necessary and why monitoring with Zabbix is the right answer for your team’s needs.
One of the most effective ways to get employee buy-in for monitoring is by highlighting the benefits it will bring to individual employees. Show how monitoring can simplify their tasks, improve efficiency, and enhance their work experience, and give them concrete examples of how the technology can make their jobs easier or help them to deliver better results.
We recently had a large managed services provider (MSP) use our monitoring solution as a true “force multiplier”, allowing them to monitor their systems, automate tasks based on real-time events, and provide immediate responses to issues without manual intervention. Thanks to Zabbix, their engineers report higher job satisfaction thanks to no longer having to be “on call” at all hours to solve simple issues, while management has seen productivity skyrocket thanks to their team’s newfound ability to find potential issues before they become real problems.
Determine who monitoring will impact and who needs to be kept informed. This might be team leaders, IT staff, end users, and/or an executive sponsor. Getting input from these groups early on will help you anticipate needs and concerns, and you’ll also want to identify influential employees who are enthusiastic about monitoring and get them to help you promote it.
A great way to help them do so is by encouraging them to attend one (or more) Zabbix events – we’ve got free meetings, online meetups, regional conferences, or even our yearly Summit in Latvia. No matter where you happen to be located, there’s a pretty good chance that we’ll soon be bringing your key people a chance to network with like-minded professionals from multiple industries, expand their knowledge, get answers to their questions, and explore how Zabbix can work for them.
Equipping employees with the skills and knowledge they need to get the most out of a monitoring system means gaining a solid understanding of their current capabilities and then finding out which gaps you most urgently need to fill. Chances are, you’ll need to provide guidance, documentation, hands-on demonstrations, and access to experts – and this is another area where Zabbix has you covered.
Zabbix Certified trainings are designed to help your people learn Zabbix inside and out, giving them the practical knowledge they’ll need to increase their productivity and performance. When you explore our training options, you’ll find a wide variety of courses, everything from one-day sessions that cover the basics to week-long sessions that guarantee users the ability to tackle any Zabbix challenge on their own.
In addition, we’ve got plenty of other free resources available to teams and individuals looking to upskill, including our famously active forum, blog, webinars, and newsletter.
Building a culture of monitoring requires commitment from every level of an organization. By choosing Zabbix as the guide to your monitoring journey and following the strategies outlined in this article, you and your team can successfully implement and maintain a robust monitoring strategy that will help you achieve your organization’s IT goals.
To learn more about what Zabbix can do for you, visit our website.
The post Build a Culture of Monitoring and Get Buy-In with Zabbix appeared first on Zabbix Blog.
Post Syndicated from Cliff Robinson original https://www.servethehome.com/nvidia-rtx-pro-6000-blackwell-family-for-workstations-and-servers/
The NVIDIA RTX Pro 6000 Blackwell family spans three different styles and application scenarios for AI and graphics workloads
The post NVIDIA RTX Pro 6000 Blackwell Family for Workstations and Servers appeared first on ServeTheHome.
Post Syndicated from The History Guy: History Deserves to Be Remembered original https://www.youtube.com/watch?v=B7cuXv6D06g
Post Syndicated from Brian Beach original https://aws.amazon.com/blogs/devops/amazon-q-developer-agentic-coding-experience/
Back in March, I wrote about the new agentic coding experience within the Amazon Q Developer CLI. Recently, Amazon Q Developer announced that it has added a similar experience to the integrated development environement (IDE). Agentic coding in the IDE allows you to work with Amazon Q Developer to read and write files locally, run bash commands, build code, and more in near real-time through natural language conversations. The new experience redefines how you write, modify, and maintain code by leveraging natural language understanding to seamlessly execute complex workflows. The new agentic coding experience is now available in VS Code with support in other IDEs coming soon.
Before I explain the new agentic coding experience, let’s take a minute to review the existing chat capabilities within the Amazon Q Developer IDE. As the name implies, the traditional chat allows me to have a conversation with Q Developer. This is a great option when I’m learning and planning. It provides a natural back-and-forth dialogue. Personally, I like the traditional chat during the planning phase of the Software Development Lifecycle (SDLC). I can chat with Q Developer to discuss my architecture and the various tradeoffs of different designs before I start working.
However, once I move into the build phase of the SDLC, I prefer the new agentic coding experience. In this new experience, Q Developer can do so much more than just have a conversation. It can directly interact with the development environment, reading and writing files, using various development tools, and even querying AWS resources. This allows for a far more dynamic, hands-on coding workflow compared to the traditional chat interface.
Rather than just discussing requirements, the agentic agent can take direct action to implement them. It can scaffold new projects, update existing code, and provide step-by-step summaries of its progress – all through a seamless, conversational interface right within the IDE. The great news is that I now have both options available to me. I can simply toggle between a traditional chat in the planning phase, and the new agentic coding in the build phase.
Let’s walk through a simple example using the AWS Cloud Development Kit (CDK). I love CDK, and I use it all the time in my role. However, let’s assume that I don’t have a lot of experience, and want to learn more about CDK before I start using it. Since I just want to learn, I’ll start in the traditional chat experience, and ask Q Developer “How do I create an new CDK app?” As you can see in the following image, Q Developer starts to teach me about CDK. Along with the instructions, Q provides commands that I could copy and paste into my shell to get started.

While this is a great, I am already familiar with CDK. I don’t need to learn how to create a new application. I am ready to start building! Therefore, I will toggle from traditional chat to agentic coding by clicking on the angle bracket pair in the bottom left corner of the chat window. Then, I will ask Q Developer to “Create a new CDK app in this folder using TypeScript.” First, notice that I am not asking a question like I did previously, but I am giving a command. In the following image, you can see that Q Developer is acting on my command rather that teaching me what to do.

This is the power of the new agentic coding. It is not simply teaching me how to create a CDK app. Amazon Q Developer is creating the app for me. There are a few important things that I want to call out here. First, Amazon Q Developer can use tools when it is running agentic coding mode. In this example, Q is using a series of shell commands — mkdir, cd, npx, npm, etc. — to create the CDK app. I will discuss other tools later in this post. Second, Q Developer is asking my permission before it runs these commands. This allows me to retain control over the development process. I’ll click the Run button and allow Q to create the new application resulting in the following project structure.

It’s easy to overlook the power of allowing Q Developer to use tools. By using shell commands, it was able to generate the project using the latest template, and install dependencies for me. Running shell commands is just one of many changes with the agentic coding experience. Next, let’s look at how code generation works in agentic coding.
Amazon Q Developer has been generating code since it first launched in June of 2022. Since then, Amazon Q Developer has evolved, adding new features over time. Code generation began with inline suggestions, followed by chat, and the agent for software development. The new agentic coding, reinvents the code generation experience again. In the following example, I am going to add a Lambda function to the CDK stack that Q Developer created earlier. I ask Q Developer to “Add a new Lambda function that is triggered from the arrival of a file in an existing S3 bucket.”

Multiple important things happened in this example that I want to explain. First, notice that Q Developer edited the CDK Stack to add the new AWS Lambda function. Second, Q Developer used a shell command to create a new folder. Third, Q created a new file for the Lambda function. Forth, it updated the README file. Q took all four of these actions in response to a single prompt. In addition, note that Q Developer is providing a diff for each change, making it easy for me to review the changes. You can see an example of the changes it make to the README.md in the following image. Finally, note that I can undo any of the changes that Q Developer made along the way.

This is a big improvement over the traditional chat experience. Now let’s look at how Q Developer can describe my AWS resources.
Remember that I am building an application that is triggered by the arrival of a file in an existing Amazon Simple Storage Service (Amazon S3) bucket. In the prior example, you can see that I need to pass the name of the bucket in the ExistingBucketName parameter when deploying the stack.
Let’s assume that I have forgotten the name of the bucket I want to use. The new agentic coding experience can help me with this too. In the following example, I ask Q to “List my S3 buckets in the ca-central-1 region?” Once again, Q Developer asks for permission to use the shell. After I accept, Q Developer uses the AWS CLI and lists the buckets I have available in Canada (ca-central-1).

With the name of the bucket, I am ready to deploy my stack. Of course, there still more work to do, but I’ll leave that for another post.
The new agentic coding experience within the Amazon Q Developer IDE represents a significant step forward in integrating powerful AI-driven capabilities directly into the developer’s workflow. By enabling the coding agent to read, write, and execute code locally, access tools, and interact with AWS resources, Q Developer promises to dramatically streamline and enhance the coding process. You can visit the Amazon Q Developer User Guide to install the IDE and start leveraging the new agent chat for free. Give it a try and let me know what you think!
Post Syndicated from The Atlantic original https://www.youtube.com/watch?v=dJancaBuyMQ
Post Syndicated from corbet original https://lwn.net/Articles/1018494/
The disclosure of the Spectre
class of hardware vulnerabilities created a lot of pain for kernel
developers (and many others). That pain was especially acutely felt in the
BPF community. While an attacker might have to painfully search the kernel
code base for exploitable code, an attacker using BPF can simply write and
load their own speculation gadgets, which is a much more efficient way of
operating. The BPF community reacted by, among other things, disallowing
the loading of programs that may include speculation gadgets. Luis
Gerhorst would like to change that situation with this patch
series that takes a more direct approach to the problem.
Post Syndicated from Anton Aleksandrov original https://aws.amazon.com/blogs/compute/monitoring-network-traffic-in-aws-lambda-functions/
Network monitoring provides essential visibility into cloud application traffic patterns across large organizations. It enables security and compliance teams to detect anomalies and maintain compliance, while allowing development teams to troubleshoot issues, optimize performance, and track costs in multi-tenant software as a service (SaaS) environments. Implementing robust network monitoring allows organizations to effectively manage their security, compliance, and operational requirements while continuously enhancing their applications.
In this post, you will learn methods for network monitoring in AWS Lambda functions and how to apply them to your scenarios.
Lambda is a secure and highly scalable serverless compute service where each function operates in an isolated execution environment with strict security boundaries. This architecture delivers key advantages, such as enhanced security, automatic compute capacity scaling, and minimal operational overhead. Minimizing infrastructure management allows Lambda to enable organizations to redirect their focus from managing servers to other critical aspects, such as performance optimization and network traffic analysis. In turn, these enable organizations to build more secure and efficient applications.
Lambda network monitoring addresses diverse organizational needs, such as compliance requirements for audit logs and anomaly detection, business needs for traffic metering and customer billing, and development needs for troubleshooting network issues. Traditional agent-based or host-based monitoring methods often aren’t compatible with the strongly isolated, ephemeral execution environment of Lambda, which necessitates alternative approaches to meet these critical requirements.
You can use AWS-native, integrated network monitoring solutions, such as Amazon Virtual Private Cloud (Amazon VPC) Flow Logs, or build your own custom solution, as detailed in this post. Each solution offers distinct capabilities with varying levels of granularity and real-time visibility. When choosing an approach, you must evaluate key factors such as the desired data granularity, operational complexity, latency tolerance, and cost implications.
VPC Flow Logs is the AWS-recommended tool for network activity monitoring. If your scenario necessitates monitoring of the network activity of Lambda functions, then you can attach these functions to a VPC and enable Flow Logs. This captures detailed network traffic data, such as source and destination IPs, ports, protocols, and traffic volume for all traffic flowing through the network interfaces used by your functions.
When you attach your functions to a VPC, the Lambda service automatically creates an Elastic Network Interface (ENI) for functions to communicate with VPC-based resources. By default, VPC-attached functions can only access private resources within the VPC. If you need your functions to communicate with other AWS services, then you should use VPC Endpoints. If your function needs to communicate with the public internet, then you should use an NAT Gateway for egress traffic. The following diagram shows how you can use VPC Flow Logs for Lambda functions.

Flow Logs provide detailed insights into the IP traffic flowing to and from the network interfaces within a VPC, offering valuable data for network audits and activity monitoring. This approach promotes a clear separation of concerns between application and networking layers, with VPC constructs typically managed by a dedicated operations or infrastructure team.
VPC Flow Logs provides a robust network monitoring solution. However, when using it with Lambda functions, you should evaluate the following considerations:
The following sections explore Lambda network monitoring methods that can either be augmented with VPC Flow Logs for better granularity or used without attaching your functions to a VPC.
You can configure the Lambda runtime to route egress network traffic through a side-car proxy that runs as a Lambda layer within the Lambda execution environment and logs network activity. The proxy layer should be agnostic to the language runtime. AWS recommends that you use compiled languages such as Rust or Golang for maximum reusability and minimal added latency. The following diagram shows emitting logs from a network proxy layer.

Applying proxy configuration differs across language runtimes. In Python you set proxy_http and proxy_https environment variables. Java uses JVM flags. Node.js doesn’t provide a native way to configure proxy using command line flags or environment variables. Therefore, you need to make code changes, such as configuring a proxy for your AWS SDK or using a third-party open source libraries such as global-agent or Interceptors.
The proxy approach is most suitable if you’re okay with making function code or configuration changes that might vary across runtimes. Furthermore, adding a network proxy server process inside the execution environment consumes resources shared with the function code, which can add network latency.
Refer to the post Enhancing runtime security and governance with the AWS Lambda Runtime API proxy extension for ways to intercept inbound requests/responses between the Lambda Runtime API and Runtime process.
Following techniques use the fact that the Lambda execution environment is a Linux-based micro-VM. Lambda runtimes operate within a restricted user space that prevents the use of traditional OS-level monitoring tools needing elevated privileges, such as tcpdump, iptables, ptrace, or eBPF. The following techniques are specifically designed to work under these user space constraints, allowing their use without needing elevated privileges.
Use this method when you need to obtain the OS-level information, such as metering transferred bytes, or see all open connections. You can use it to implement tenant chargebacks or detect network traffic pattern changes. The method is based on the proc pseudo-filesystem (also known as procfs) available in Linux OS, which provides an interface to kernel data and allows you to read OS-level information. For example, /proc/cpuinfo and /proc/meminfo pseudo-files provide information about current CPU and memory usage, while /proc/net/* provides you with network layer information. Reading /proc/net/tcp and /proc/net/udp gives you a list of active TCP/UDP connections, such as remote IP addresses and ports. Reading /proc/net/dev provides the list of network devices with detailed usage statistics, such as bytes transferred and received.
“The procfs method provides a simple but powerful way to collect critical network telemetry data from Lambda functions, such as up-to-date network statistics and file descriptor counts, which enables us to monitor outbound connections from Lambda functions. Better yet, it enables us to support multiple Lambda runtimes with a single implementation in our Rust-based, next-generation Lambda Extension”—AJ Stuyvenberg, Staff Engineer at Datadog.
The sample project provides the LambdaNetworkMonitor-Procfs stack to show this technique. For every invocation, the function reads /proc/net/dev, and sends network statistics to log and Amazon CloudWatch Metrics, as shown in the following figure.

Reading the /proc/net/dev pseudo-file is a simple and effective way to monitor Lambda functions networking without adding latency. However, it doesn’t capture DNS names and the IP addresses to which they resolve.
Low-level network operations in Linux, such as DNS lookup and connection creation, are managed by the C Standard Library (libc). You can intercept libc function calls made by Lambda runtimes to monitor network traffic at the OS level. This is a significantly more advanced and complex mechanism, enabling visibility into OS-level activities, as shown in the following figure.

Intercepting libc function calls, such as getaddrinfo (DNS lookup) and connect, allows you to log details such as DNS name, IP addresses, ports, and protocols at a granular level, as shown in the following figure. This method allows you to capture comprehensive information about DNS queries and initiated network connections. It can provide precise per-function and per-invoke network monitoring, such as hostnames and IP addresses.

The following is a simplified flow:
To implement this technique, you need to use a language that compiles to a shared object (.so) file. To implement libc method signatures you should use a language such as C, C++, or Rust. The following sample code uses Rust for its strong safety guarantees and implements overriding the getaddrinfo libc function (DNS lookup).
The following should be considered:
When compiled to an .so file, you must package it as a Lambda layer, attach the layer to your functions, and configure the execution environment to use it through the Linux dynamic linker capability called preloading. Set the LD_PRELOAD environment variable to point to your .so file to instruct the OS to preload it before it loads any other library, such as libc. You can configure this either as a function environment variable or through a wrapper script, as shown in the following figure.
This technique allows you to get detailed connection-level monitoring such as DNS lookups, resolved IP addresses, ports, protocols, and count bytes transferred. Depending on your requirements, it can be adapted to track further network-related information as needed.
The sample project provides the LambdaNetworkMonitor-LdPreload stack to show this technique, as shown in the following figure. For every invocation, the function prints intercepted libc functions, DNS names, and connection IP addresses.

Monitoring network traffic in Lambda functions is a common requirement for many organizations. In case you need to audit IP-level network logs, AWS recommends that you to attach your functions to a VPC and use Flow Logs. If you need per-function or per-invoke granularity, then you can augment it with techniques described in this post.
These techniques provide valuable insights for debugging, auditing, and monitoring, but they also necessitate a solid understanding of Linux fundamentals and careful implementation. They offer a practical solution for organizations that need Lambda network monitoring, allowing them to troubleshoot issues and maintain compliance.
To learn more about Serverless architectures and asynchronous Lambda invocation patterns, go to Serverless Land.
Post Syndicated from Crosstalk Solutions original https://www.youtube.com/watch?v=_lQXbEno-A8
Post Syndicated from Donnie Prakoso original https://aws.amazon.com/blogs/aws/aws-weekly-roundup-amazon-nova-premier-amazon-q-developer-amazon-q-cli-amazon-cloudfront-aws-outposts-and-more-may-5-2025/
Last week I went to Thailand to attend the AWS Summit Bangkok. It was an energizing and exciting event. We hosted the Developer Lounge, where developers can meet, discuss ideas, enjoy lightning talks, win SWAGs at AWS Builder ID Prize Wheel, take a challenge at Amazon Q Developer Coding Challenge, or learn Generative AI at Learn Amazon Bedrock booth.
Here’s a quick look:

Thank you to AWS Heroes, AWS Community Builders, AWS User Group leaders and developers for your collaboration.
Coming up next in ASEAN is AWS Summit Singapore—make sure you don’t miss it by registering now.
Last Week’s Launches
Here are some launches last week that caught my attention:


From Community.AWS
Here’s my personal favorites posts from community.aws:
Upcoming AWS events
Check your calendars and sign up for these upcoming AWS events:
You can browse all upcoming in-person and virtual events.
That’s all for this week. Check back next Monday for another Weekly Roundup!
How is the News Blog doing? Take this 1 minute survey!
(This survey is hosted by an external company. AWS handles your information as described in the AWS Privacy Notice. AWS will own the data gathered via this survey and will not share the information collected with survey respondents.)
Post Syndicated from Matheus Guimaraes original https://aws.amazon.com/blogs/aws/amazon-q-developer-in-github-now-in-preview-with-code-generation-review-and-legacy-transformation-capabilities/
Starting today, you can now use Amazon Q Developer in GitHub in preview! This is fantastic news for the millions of developers who use GitHub on a daily basis, whether at work or for personal projects. They can now use Amazon Q Developer for feature development, code reviews, and Java code migration directly within the GitHub interface.
To demonstrate, I’m going to use Amazon Q Developer to help me create an application from zero called StoryBook Teller. I want this to be an ASP.Core website using .NET 9 that takes three images from the user and uses Amazon Bedrock with Anthropic’s Claude to generate a story based on them.
Let me show you how this works.
Installation
The first thing you need to do is install the Amazon Q Developer application in GitHub, and you can begin using it immediately without connecting to an AWS account.
You’ll then be presented with a choice to add it to all your repositories or select specific ones. In this case, I want to add it to my storybook-teller-demo repo, so I choose Only selected repositories and type in the name to find it.

This is all you need to do to make the Amazon Q Developer app ready to use inside your selected repos. You can verify that the app is installed by navigating to your GitHub account Settings and the app should be listed in the Applications page.

You can choose Configure to view permissions and add Amazon Q Developer to repositories or remove it at any time.
Now let’s use Amazon Q Developer to help us build our application.
Feature development
When Amazon Q Developer is installed into a repository, you can assign GitHub issues to the Amazon Q development agent to develop features for you. It will then generate code using the whole codebase in your repository as context as well as the issue’s description. This is why it’s important to list your requirements as accurately and clearly as possible in your GitHub issues, the same way that you should always strive for anyway.
I have created five issues in my StoryBook Teller repository that cover all my requirements for this app, from creating a skeleton .NET 9 project to implementing frontend and backend.
![]()
Let’s use Amazon Q Developer to develop the application from scratch and help us implement all these features!
To begin with, I want Amazon Q Developer to help me create the .NET project. To do this, I open the first issue, and in the Labels section, I find and select Amazon Q development agent.

That’s all there is to it! The issue is now assigned to Amazon Q Developer. After the label is added, the Amazon Q development agent automatically starts working behind the scenes providing progress updates through the comments, starting with one saying, I'm working on it.

As you might expect, the amount of time it takes will depend on the complexity of the feature. When it’s done, it will automatically create a pull request with all the changes.

The next thing I want to do is make sure that the generated code works, so I’m going to download the code changes and run the app locally on my computer.
I go to my terminal and type git fetch origin pull/6/head:pr-6 to get the code for the pull request it created. I double-check the contents and I can see that I do indeed have an ASP.Core project generated using .NET 9, as I expected.
I then run dotnet run and open the app with the URL given in the output.

Brilliant, it works! Amazon Q Developer took care of implementing this one exactly as I wanted based on the requirements I provided in the GitHub issue. Now that I have tested that the app works, I want to review the code itself before I accept the changes.
Code review
I go back to GitHub and open the pull request. I immediately notice that Amazon Q Developer has performed some automatic checks on the generated code.

This is great! It has already done quite a bit of the work for me. However, I want to review it before I merge the pull request. To do that, I navigate to the Files changed tab.

I review the code, and I like what I see! However, looking at the contents of .gitignore, I notice something that I want to change. I can see that Amazon Q Developer made good assumptions and added exclusion rules for Visual Studio (VS) Code files. However, JetBrains Rider is my favorite integrated development environment (IDE) for .NET development, so I want to add rules for it, too.
You can ask Amazon Q Developer to reiterate and make changes by using the normal code review flow in the GitHub interface. In this case, I add a comment to the .gitignore code saying, add patterns to ignore Rider IDE files. I then choose Start a review, which will queue the change in the review.

I select Finish your review and Request changes.

Soon after I submit the review, I’m redirected to the Conversation tab. Amazon Q Developer starts working on it, resuming the same feedback loop and encouraging me to continue with the review process until I’m satisfied.
Every time Q Developer makes changes, it will run the automated checks on the generated code. In this case, the code was somewhat straightforward, so it was expected that the automatic code review wouldn’t raise any issues. But what happens if we have more complex code?
Let’s take another example and use Amazon Q Developer to implement the feature for enabling image uploads on the website. I use the same flow I described in the previous section. However, I notice that the automated checks on the pull request flagged a warning this time, stating that the API generated to support image uploads on the backend is missing authorization checks effectively allowing direct public access. It explains the security risk in detail and provides useful links.

It then automatically generates a suggested code fix.

When it’s done, you can review the code and choose to Commit changes if you’re happy with the changes.

After fixing this and testing it, I’m happy with the code for this issue and move on applying the same process to other ones. I assign the Amazon Q development agent to each one of my remaining issues, wait for it to generate the code, and go through the iterative review process asking it to fix any issues for me along the way. I then test my application at the end of that software cycle and am very pleased to see that Amazon Q Developer managed to handle all issues, from project setup, to boilerplate code, to more complex backend and frontend. A true full-stack developer!

I did notice some things that I wanted to change along the way. For example, it defaulted to using the Invoke API to send the uploaded images to Amazon Bedrock instead of the Converse API. However, because I didn’t state this in my requirements, it had no way of knowing. This highlights the importance of being as precise as possible in your issue’s titles and descriptions to give Q Developer the necessary context and make the development process as efficient as possible.
Having said that, it’s still straightforward to review the generated code on the pull requests, add comments, and let the Amazon Q Developer agent keep working on changes until you’re happy with the final result. Alternatively, you can accept the changes in the pull request and create separate issues that you can assign to Q Developer later when you’re ready to develop them.
Code transformation
You can also transform legacy Java codebases to modern versions with Q Developer. Currently, it can update applications from Java 8 or Java 11 to Java 17, with more options coming in future releases.
The process is very similar to the one I demonstrated earlier in this post, except for a few things.
First, you need to create an issue within a GitHub repository containing a Java 8 or Java 11 application. The title and description don’t really matter in this case. It might even be a short title such as “Migration,” leaving the description empty. Then, on Labels, you assign the Amazon Q transform agent label to the issue.
![]()
Much like before, Amazon Q Developer will start working immediately behind the scenes before generating the code on a pull request that you can review. This time, however, it’s the Amazon Q transform agent doing the work which is specialized in code migration and will take all the necessary steps to analyze and migrate the code from Java 8 to Java 17.
![]()
Notice that it also needs a workflow to be created, as per the documentation. If you don’t have it enabled yet, it will display clear instructions to help you get everything set up before trying again.
![]()
As expected, the amount of time needed to perform a migration depends on the size and complexity of your application.
Conclusion
Using Amazon Q Developer in GitHub is like having a full-stack developer that you can collaborate with to develop new features, accelerate the code review process, and rely on to enhance the security posture and quality of your code. You can also use it to automate migration from Java 8 and 11 applications to Java 17 making it much easier to get started on that migration project that you might have been postponing for a while. Best of all, you can do all this from the comfort of your own GitHub environment.
Now available
You can now start using Amazon Q Developer today for free in GitHub, no AWS account setup needed.
Amazon Q Developer in GitHub is currently in preview.
— Matheus Guimaraes | codingmatheus
How is the News Blog doing? Take this 1 minute survey!
(This survey is hosted by an external company. AWS handles your information as described in the AWS Privacy Notice. AWS will own the data gathered via this survey and will not share the information collected with survey respondents.)