Post Syndicated from Explosm.net original https://explosm.net/comics/hay-girl
New Cyanide and Happiness Comic
Post Syndicated from Explosm.net original https://explosm.net/comics/hay-girl
New Cyanide and Happiness Comic
Post Syndicated from Adam Barnett original https://www.rapid7.com/blog/post/ve-patch-tuesday-windows-backwards-compatibility-challenge
If you received an email with the subject “I LOVE YOU” and an attachment called “LOVE-LETTER-FOR-YOU.TXT”, would you open it? Probably not, but back in the year 2000, plenty of people did exactly that. The internet learned a hard lesson about the disproportionate power available to a university dropout with some VBScript skills, and millions of ordinary people suffered the anguish of deleted family photos or even reputational damage as the worm propagated itself across their entire Outlook address book.
In the quarter century since ILOVEYOU rampaged across global networks, cybersecurity has moved from a niche topic to an “everyone” problem, and many users are wary of all sorts of threats. In recent years, the increasing ubiquity and urgency of AI adoption across the business landscape has attracted the attention of both security researchers and threat actors.
Of course, recency bias and shiny object fixation are real. Even as AI and automation continue to drive down time to known exploitation (TTKE), an attacker who abuses a traditional exploit chain to achieve SYSTEM privileges on a sensitive server still has the keys to the kingdom.
Wormable remote code execution (RCE) vulnerabilities remain rare, but well over half of the 25 exploited-in-the-wild zero-day vulnerabilities published by Microsoft during 2025 provided attackers with elevation of privilege opportunities on Windows assets. Some of those flaws are older than the iPhone, let alone ChatGPT.
Microsoft’s decades-long commitment to backwards compatibility creates a conveyor belt supply of déjà vu vulnerabilities. Ultimately, the most pressing threats faced by defenders managing Microsoft estates remain essentially unchanged. Rather than a new wave of AI-related flaws, the chief danger stems from the towering tech debt within core Windows components.
If we really want to know which Microsoft vulnerabilities will provide the most value to attackers in 2026, we should ask a threat actor. Since that might prove difficult to arrange, we’ll do the next best thing: review vulnerabilities exploited in the wild during 2025.
⠀
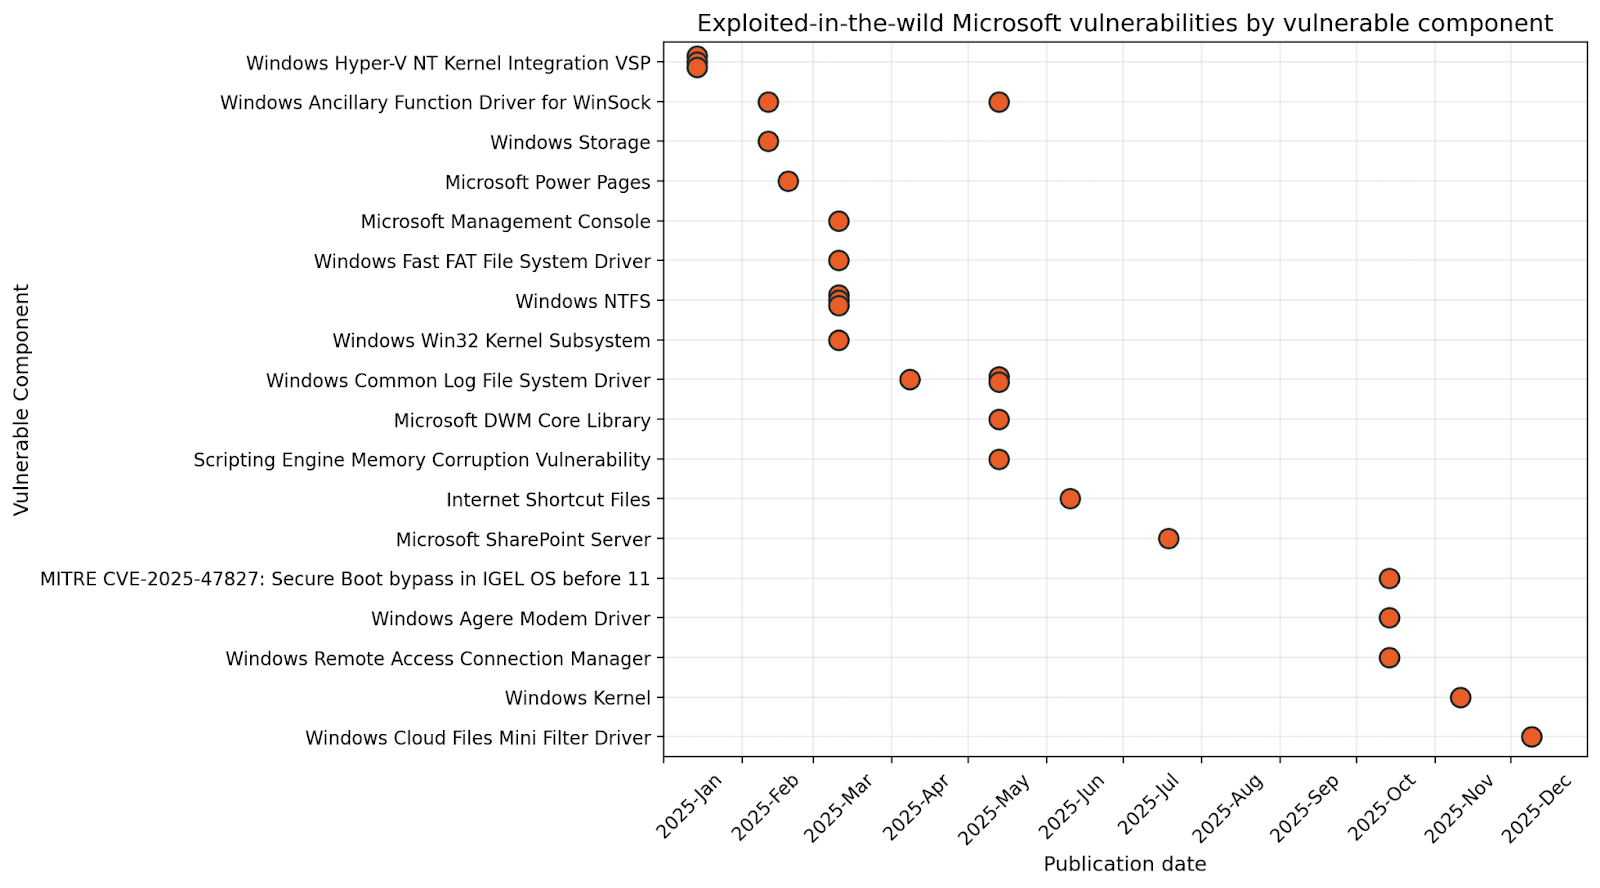
The vast Microsoft ecosystem has something for everyone, whether customer or threat actor. Patch Tuesday January 2025 brought us a trio of exploited-in-the-wild Hyper-V kernel vulnerabilities. By September 2025, at least one plausible public proof-of-concept (PoC) for CVE-2025-21333 was published by a vulnerability researcher who apparently shares a name with a Kazakhstani Olympic gymnast. The only safe assumption is that a well-resourced threat actor could develop a private exploit far in advance of that.
Starting from a child VM or Windows Sandbox, exploitation first requires setting out a banquet of benign requests for the hypervisor, delivered via the Hyper-V Virtualization Service Provider (VSP). The goal: mass-allocating objects to arrange large swathes of hypervisor memory in a predictable pattern (aka “heap feng shui”). Next, the attacker sends a malicious request with an oversized buffer, which an unpatched VSP merrily copies into kernel memory, overwriting the header of the adjacent object, whose relative position is now easily surmised. Once the kernel subsequently references the artfully corrupted sibling object, execution as SYSTEM jumps to a portion of memory where the attacker has planted shellcode to exfiltrate a token. The compromised hypervisor could be anything from a developer laptop running a malicious container all the way up to enterprise private cloud infrastructure.
So far, January 2025 is the only time that Microsoft has ever published vulnerabilities in the Hyper-V VSP. Generally speaking, a significant degree of sophistication is required to develop successful exploits of this nature. This goes double if the name of the game is stealth and stability, since a wave of unexplained BSOD events on critical production infrastructure tends to attract blue team attention. Still, once a viable proof of concept hits the public internet, ransomware crews will fold it into their toolkits, and someone, somewhere, is either sitting on an unknown Hyper-V VSP exploit, or hard at work creating the next one.
It’s hard to imagine a modern computer without storage or networking capabilities. In fact, it’s hard to imagine a computer from several decades ago without storage or networking. Microsoft is now middle-aged, and that means that buried deep within your shiny new PC are a variety of architectural decisions and logic paths born in the 1980s. If this sounds far-fetched, take a minute to find yourself a fully-patched Windows 11 25H2 machine, and then try to rename any file or directory CON, NUL or PRN. I’ll wait.
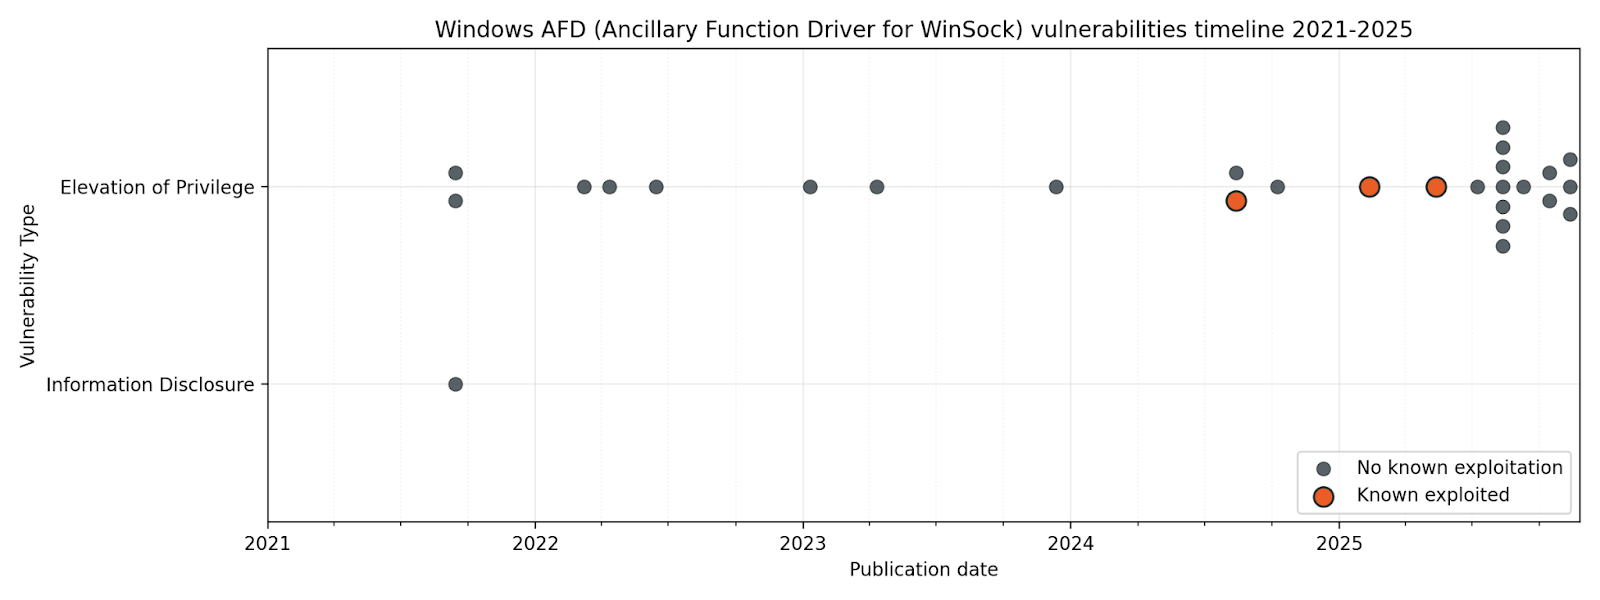
Generally speaking, user-mode applications are prevented from wreaking havoc on the kernel through a careful separation of concerns. On Windows, when a user mode application wants to communicate over the network, it talks to WinSock, which in turn talks to the ancillary function driver (AFD), which sits on the kernel side, and coordinates with the kernel network drivers which handle the actual traffic. The AFD is a security boundary between user space and kernel space, and it must be universally accessible to local processes, because even a browser tab in a sandbox needs to make network calls. Any defect in the way AFD parses input from user space can thus provide a way to influence the kernel in unexpected ways. A number of advanced exploit development courses, including offerings from SANS and OffSec, cover AFD in detail.
⠀
⠀
Patch Tuesday February 2025 brought us CVE-2025-21418, which Microsoft credited to Anonymous. We don’t know whether the unnamed tipster provided evidence of exploitation in the wild, or whether Microsoft threat hunters subsequently tracked down their own trail of suspicious bread crumbs, but notorious threat actors such as North Korea’s Lazarus are known to be enthusiastic students of AFD exploits. With several high-profile zero-day vulnerabilities emerging from AFD from late 2024 onwards, it tracks that Microsoft subsequently published and patched a cluster of AFD vulnerabilities in the latter half of 2025.
Any defenders who had enjoyed a quieter start to the year were rudely awakened by Patch Tuesday March 2025, when six exploited-in-the-wild vulnerabilities all dropped at once. Exploitation of most of the zero-day vulnerabilities published in March starts with the user mounting a malicious Virtual Hard Disk (VHD) image or plugging in a malicious USB stick so that the attacker can exploit a weakness in a filesystem driver, including NTFS and FastFAT.
Remember that information security training which asked you to imagine finding a USB stick with an “IMPORTANT (CONFIDENTIAL)” label on the floor outside the office? The one which asked if you would A) plug the mystery stick into your work PC B) use your boss’ personal laptop in case the files are business critical C) try it in all the PCs in the office until someone asks you to stop or D) report it immediately to the security officer? This is why.
Meanwhile, the true villain of the month was almost certainly CVE-2025-24983, a no-user-interaction-required elevation of privilege vulnerability in the Win32 kernel subsystem. At the time, we pondered why Windows 11 and Server 2019 onwards didn’t receive patches for what looks like a fairly severe vulnerability, but since Microsoft is gradually reimplementing portions of the kernel in memory-safe Rust, we can hope that the vulnerability simply doesn’t exist in modern Windows.
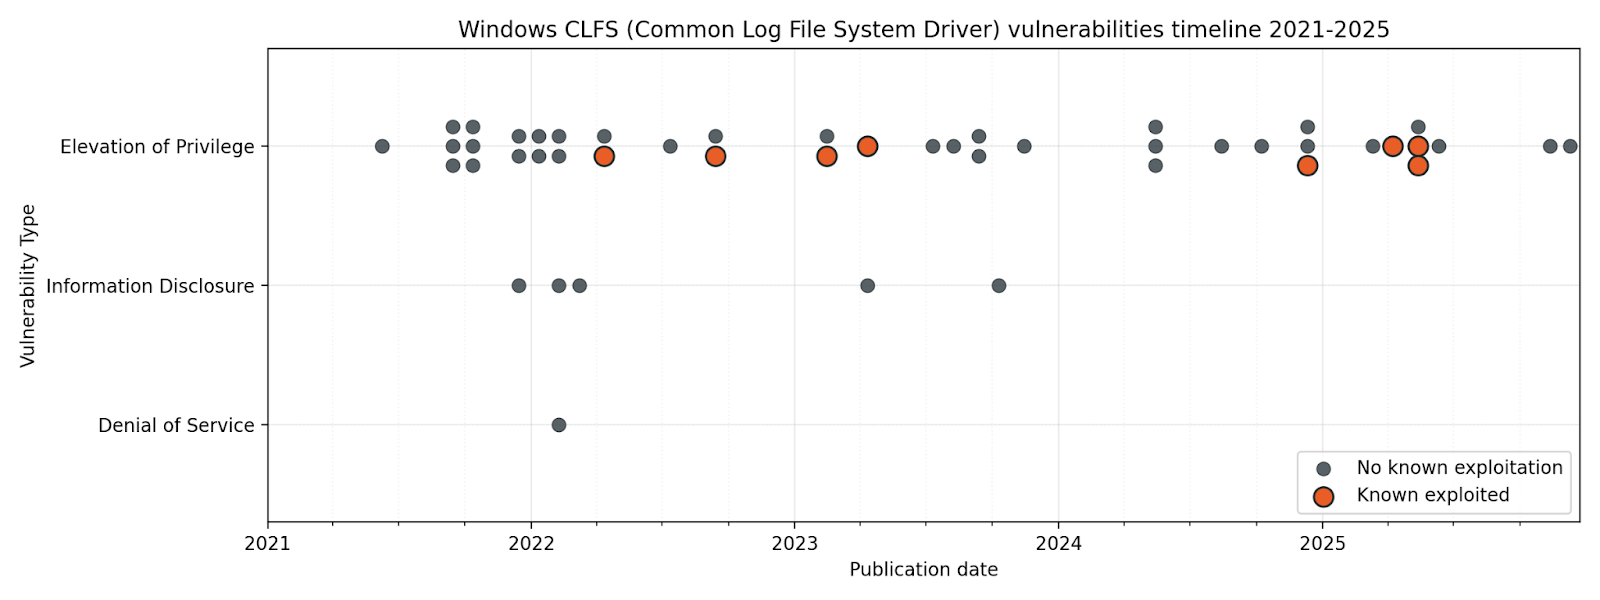
If anyone ever corners you at a party and talks at length about the Ancillary Function Driver as a bounteous source of elevation of privilege vulnerabilities, you will probably have to concede that they are technically correct. While your options include “doing a lap” and then climbing out of the bathroom window, the power move here is to hold your ground, and point to the Common Log File System driver as a far richer vein of exploitable goodness.
As of Patch Tuesday April 2025, CLFS boasts almost twice the number of total vulnerabilities over the past five years vs. AFD, and more than double the number of known-exploited zero-day vulnerabilities. It really is the gift which keeps on giving.
⠀
⠀
It makes sense that something like the Ancillary Function Driver lives in kernel space. After all, something has to sit inside the perimeter to marshall all those network requests from dozens of Chrome tabs. What about the Common Log File System driver though?
It would be tempting to imagine that anything which simply handles log files shouldn’t need direct kernel access at all. When exploring this concept, it’s useful to understand that not only was CLFS designed a long time ago, when high performance in user mode was harder to achieve than it is today, but also that CLFS is much more than simply a means to interact with log files. CLFS is the home of still-essential building blocks like Transactional NTFS (TxF), first introduced almost 25 years ago in Windows Vista, which provides a means for applications to guarantee the integrity of data on disk.
For the past several years, Microsoft has strongly recommended that developers avoid the use of TxF, and while Microsoft is gradually providing modern alternatives to TxF functionality, essential Windows functions such as Windows Update still rely on it to manage critical file integrity. Moreover, CLFS is more than just TxF, and is so tightly integrated into Windows that it’s here to stay for the foreseeable future.
A few days after Patch Tuesday May 2025, Satya Nadella took to the stage at Microsoft Build 2025 to pitch his vision of the open agentic web, although exactly who this version of the future would be open to remains an open question, like: What if a cloud email service was vulnerable to a zero-click prompt injection attack, but could also now buy things with your credit card?
While critical reception for the open agentic web has been mixed, threat actors will be glad of the new attack surface. Meanwhile, defenders worried about in-the-wild exploitation were hard at work patching some more frequent fliers, including another pair of CLFS vulnerabilities and an MSHTML/Trident arbitrary code execution bug. That last one will be familiar to regular Patch Tuesday watchers, but it might come as a surprise to anyone who thought Internet Explorer had gone to live on a nice farm upstate years ago.
The Ancillary Function Driver made another appearance, although it couldn’t quite summon the same main character energy this time around. The May 2025 episode of “AFD vulns exploited in the wild” offered elevation to Administrator, rather than SYSTEM, and a lower exploit code maturity rating. We can always be grateful for small mercies.
[1]: With apologies to Emily Brontë.
Windows archeologists and internet users of a certain age may remember WebDAV, a standard originally dreamed up to support interactivity on the web. It was employed by versions of Microsoft Exchange up to and including 2010 to handle interactions with mailboxes and public folders.
Surprising no-one, Windows still more or less supports WebDAV, and it was only a matter of time before that turned out to be a bit of a problem, in the form of CVE-2025-33053 published as part of Patch Tuesday June 2025. Microsoft acknowledged Check Point Research (CPR) on the advisory; CPR in turn attributes exploitation to an APT (Advanced Persistent Threat), which they track as the objectively cool-sounding Stealth Falcon, an established threat actor with a long-running interest in governments and government-adjacent entities across the Middle East and beyond.
June 2025 also saw the publication of CVE-2025-32711, a critical information disclosure vulnerability in Microsoft 365 Copilot. Microsoft is not aware of exploitation in the wild. The researchers named it EchoLeak, describing it as “the first real-world zero-click prompt injection exploit in a production LLM system,” although other researchers arguably got there first.
EchoLeak relies on hidden white-text-on-white-background instructions in an email, which are then ingested into the LLM via RAG (Retrieval-Augmented Generation) when the user asks an entirely pedestrian question (e.g. “Summarize my emails from the past two days”) which requires Copilot to scan the inbox. The malicious instructions have two parts: First, dig up some juicy info, and then retrieve an image from an attacker-controlled server with the sensitive data exfiltrated as a URL parameter.
EchoLeak circumvented Copilot’s Content Security Policy by making the request via a trusted Microsoft service: a now-patched Teams image preview proxy. History suggests that attackers will find other ways out of the walled garden. The Microsoft advisory makes a virtue of minimalism by providing almost no information about the nature of the vulnerability, although Microsoft is surely to be commended for assigning CVEs for cloud service vulnerabilities.
When Patch Tuesday July 2025 came and went without a single exploited-in-the-wild vulnerability published, many people may have breathed a sigh of relief. Possibly this was a valid move, at least for anyone not responsible for a SharePoint instance.
SharePoint defenders will remember July as the month of ToolShell, an actively-exploited vulnerability chain in SharePoint which Microsoft published out of band ten days after Patch Tuesday. Out of band patches for Microsoft flagship products are rare, since they inevitably cause downstream disruption. Once MSTIC publicly attributes exploitation to two Chinese nation-state actors, that line has been crossed.
The vulnerability described by the out-of-band CVE-2025-53770 turned out to be a bypass for the patch introduced by CVE-2025-49704 earlier in the month, which was itself a response to a successful Pwn2Own Berlin entry from May.
Microsoft was not aware of exploitation in the wild for any of the vulnerabilities published as part of Patch Tuesday August 2025. SharePoint admins may have been dealing with the fallout from last month’s ToolShell and bracing for a possible repeat, but August might otherwise have made for an eerily quiet month. Still, the Windows implementation of Kerberos managed to cough up a publicly-disclosed elevate-to-domain-admin vulnerability.
Separately, we learned that simply saving a JPEG could be enough to hand an attacker RCE capabilities, because the internet never sleeps. If the vulnerable codepath had been within JPEG decoding, rather than encoding, this one could have been the biggest vuln of the year.
Patch Tuesday September 2025 was the second month in a row with no known-exploited vulnerabilities, but vuln spotters will appreciate that this month saw the publication of a fairly rare beast: a Microsoft vulnerability with a perfect(?) CVSS v3 base score of 10.0, albeit a cloud service vulnerability discovered by Microsoft and patched prior to publication. No customer action required, but also no customer verification possible, and since the impacted cloud service was Azure Networking, the blast radius could have been stupendous.
These days, there are plenty of seasoned IT professionals who don’t even know what a dialup modem negotiation song sounds like, simply because broadband has been around for that long. For younger readers, “broadband” is what we used to call “internet fast enough that you don’t have to wait to download a single email attachment”.
By this point, we all know where this is going: Windows still ships with modem capabilities well beyond their sell-by date, and someone found a good old elevation of privilege vulnerability. The vulnerable fax modem driver was developed almost 30 years ago by a long-defunct third party, and Microsoft has now taken uncharacteristically bold action by removing it from Windows altogether, perhaps recognizing that traditional landlines are no longer available at all in many places. Are there other fax modem drivers still lurking in Windows? You betcha.
Patch Tuesday October 2025 also marked the end of Windows 10, unless you count the cash-for-patches Extended Security Updates (ESU) program.
Patch Tuesday November 2025 included an exploited-in-the-wild vulnerability in the Windows kernel itself. While the advisory was light with details, exploitation of CVE-2025-62215 led to elevation to SYSTEM, presumably via a complex bit of memory management three card monte. Those kernel Rust rewrites can’t come soon enough.
After a year filled with variations of the same old exploitable vulns, it might almost be refreshing to consider the altogether more modern-sounding exploited-in-the-wild vulnerability published on Patch Tuesday December 2025. CVE-2025-62221 describes an elevation of privilege vulnerability in the Windows Cloud Files Mini Filter Driver.
On Windows, a file or directory can contain a reparse point, a collection of user-controlled metadata designed to be interpreted by a file filter driver. An example would be a file which appears present in a local folder, but where the actual contents of the file are stored remotely on OneDrive. The user double-clicks on the file, the file filter driver intercepts the request, reads the metadata, and calls out to OneDrive, while the user gets the experience of opening the file as though it had been stored locally. Of course, the file filter driver needs kernel access to perform its duties. Find an exploitable flaw in the way a file filter driver parses the metadata, and you can trick it into doing things like overwriting protected system files.
As Rapid7 has observed repeatedly, time to known exploitation for widely-exploited vulnerabilities has been shrinking year-on-year. By 2022, the time to exploitation after public disclosure for some of the most notable security vulnerabilities was as low as 24 hours. With exploit development now widely augmented by automation and AI, there is every reason to suppose that the window will continue to shrink further.
A wormable unauthenticated RCE vulnerability remains the scariest scenario, but mercifully these are historically rare. The one-two combo of minimally-privileged initial access and local privilege escalation presents a much more clear and present danger in most modern threat models. Sure, you could parachute in from a helicopter, abseil down from the roof, and crawl through an air vent to steal the diamond, but why bother when you could simply tailgate a delivery driver, and then distract a maintenance worker while you swipe their all-access keycard?
In 2026, Microsoft will regularly publish AI-related vulnerabilities, and AI-wielding threat actors will hammer Microsoft’s cloud services. Blue teams managing significant Windows estates will still spend more time worrying about on-prem vulnerabilities where the root cause is a classic software engineering snafu.
Arguably the biggest takeaway from 2025 is that the more things change, the more they stay the same. The scariest Microsoft vulnerabilities tend to emerge from the same few familiar places: core Windows components with codebases older than many of the humans who rely on them.
Microsoft’s wildly successful business model is founded on a decades-long insistence on ironclad backwards compatibility. Why? Enterprise customers with deep pockets and deeper catalogues of ancient business applications. These retro capabilities come at a high price: a supervolcano of tech debt potentially unmatched in all of human history, and a seemingly endless supply of sort-of-new but depressingly familiar vulnerabilities.
For anyone responsible for defending a significant Microsoft footprint in 2026, tomorrow’s biggest problem remains today’s secrets exposed by yesterday’s software design choices.
Post Syndicated from Aaron Winston original https://github.blog/engineering/from-pixels-to-characters-the-engineering-behind-github-copilot-clis-animated-ascii-banner/
Most people think ASCII art is simple, and a nostalgic remnant of the early internet. But when the GitHub Copilot CLI team asked for a small entrance banner for the new command-line experience, they discovered the opposite: An ASCII animation in a real-world terminal is one of the most constrained UI engineering problems you can take on.
Part of what makes this even more interesting is the moment we’re in. Over the past year, CLIs have seen a surge of investment as AI-assisted and agentic workflows move directly into the terminal. But unlike the web—where design systems, accessibility standards, and rendering models are well-established—the CLI world is still fragmented. Terminals behave differently, have few shared standards, and offer almost no consistent accessibility guidelines. That reality shaped every engineering decision in this project.
Different terminals interpret ANSI color codes differently. Screen readers treat fast-changing characters as noise. Layout engines vary. Buffers flicker. Some users override global colors for accessibility. Others throttle redraw speed. There is no canvas, no compositor, no consistent rendering model, and no standard animation framework.
So when an animated Copilot mascot flying into the terminal appeared, it looked playful. But behind it was serious engineering work, unexpected complexity, a custom design toolchain, and a tight pairing between a designer and a long-time CLI engineer.
That complexity only became fully visible once the system was built. In the end, animating a three-second ASCII banner required over 6,000 lines of TypeScript—most of it dedicated not to visuals, but to handling terminal inconsistencies, accessibility constraints, and maintainable rendering logic.
This is the technical story of how it came together.
Before diving into the build process, it’s worth calling out why this problem space is more advanced than it looks.
Unlike browsers (DOM), native apps (views), or graphics frameworks (GPU surfaces), terminals treat output as a stream of characters. There’s no native concept of:
Because of this, every “frame” has to be manually repainted using cursor movements and redraw commands. There’s no compositor smoothing anything over behind the scenes. Everything is stdout writes + ANSI control sequences.
ANSI escape codes like \x1b[35m (bright magenta) or \x1b[H (cursor home) behave differently across terminals—not just in how they render, but in whether they’re supported at all. Some environments (like Windows Command Prompt or older versions of PowerShell) have limited or no ANSI support without extra configuration.
But even in terminals that do support ANSI, the hardest part isn’t the cursor movement. It’s the colors.
When you’re building a CLI, you realistically have three approaches:
For the Copilot CLI animation, this meant treating color as a semantic system, not a literal one: Instead of committing specific RGB values, the team mapped high-level “roles” (eyes, goggles, shadow, border) to ANSI colors that degrade gracefully across different terminals and accessibility settings.
Terminals are used by developers with a wide range of visual abilities—not just blind users with screen readers, but also low-vision users, color-blind users, and anyone working in high-contrast or customized themes.
That means:
This is also why the Copilot CLI animation ended up behind an opt-in flag early on—accessibility constraints shaped the architecture from the start.
These constraints guided every decision in the Copilot CLI animation. The banner had to work when colors were overridden, when contrast was limited, and even when the animation itself wasn’t visible.
Ink lets you build terminal interfaces using React components, but:
Which meant animation logic had to be handcrafted.
There are tools for ASCII art, but virtually none for:
Even existing ANSI preview tools don’t simulate how different terminals remap colors or handle cursor updates, which makes accurate design iteration almost impossible without custom tooling. So the team had to build one.
Cameron Foxly (@cameronfoxly), a brand designer at GitHub with a background in animation, was asked to create a banner for the Copilot CLI.
“Normally, I’d build something in After Effects and hand off assets,” Cameron said. “But engineers didn’t have the time to manually translate animation frames into a CLI. And honestly, I wanted something more fun.”
He’d seen the static ASCII intro in Claude Code and knew Copilot deserved more personality.
The 3D Copilot mascot flying in to reveal the CLI logo felt right. But after attempting to create just one frame manually, the idea quickly ran into reality.
“It was a nightmare,” Cameron said. “If this is going to exist, I need to build my own tool.”
Cameron opened an empty repository in VS Code, and began asking GitHub Copilot for help scaffolding an animation MVP that could:
Within an hour, he had a working prototype that was monochrome, but functional.
Below is a simplified example variation of the frame loop logic Cameron prototyped:
import fs from "fs";
import readline from "readline";

/**
 * Load ASCII frames from a directory.
 */
const frames = fs
  .readdirSync("./frames")
  .filter(f => f.endsWith(".txt"))
  .map(f => fs.readFileSync(`./frames/${f}`, "utf8"));

let current = 0;

function render() {
  // Move cursor to top-left of terminal
  readline.cursorTo(process.stdout, 0, 0);

  // Clear the screen below the cursor
  readline.clearScreenDown(process.stdout);

  // Write the current frame
  process.stdout.write(frames[current]);

  // Advance to next frame
  current = (current + 1) % frames.length;
}

// 75ms = ~13fps. Higher can cause flicker in some terminals.
setInterval(render, 75);
This introduced the first major obstacle: color. The prototype worked in monochrome, but the moment color was added, inconsistencies across terminals—and accessibility constraints—became the dominant engineering problem.
The Copilot brand palette is vibrant and high-contrast, which is great for web but exceptionally challenging for terminals.
ANSI terminals support:
Even in 256-color mode, terminals remap colors based on:
Which means you can’t rely on exact hues. You have to design with variability in mind.
Cameron needed a way to paint characters with ANSI color roles while previewing how they look in different terminals.
He took a screenshot of the Wikipedia ANSI table, handed it to Copilot, and asked it to scaffold a palette UI for his tool.
A simplified version:
function applyColor(char, color) {
  // Minimal example: real implementation needed support for roles,
  // contrast testing, and multiple ANSI modes.
  const codes = {
    magenta: "\x1b[35m",
    cyan: "\x1b[36m",
    white: "\x1b[37m"
  };

  return `${codes[color]}${char}\x1b[0m`; // Reset after each char
}
This enabled Cameron to paint ANSI-colored ASCII like you would in Photoshop, one character at a time.
But now he had to export it into the real Copilot CLI codebase.
Ink is a React renderer for building CLIs using JSX components. Instead of writing to the DOM, components render to stdout.
Cameron asked Copilot to help generate an Ink component that would:
import React from "react";
import { Box, Text } from "ink";

/**
 * Render a single ASCII frame.
 */
export const CopilotBanner = ({ frame }) => (
  <Box flexDirection="column">
    {frame.split("\n").map((line, i) => (
      <Text key={i}>{line}</Text>
    ))}
  </Box>
);
And a minimal animation wrapper:
export const AnimatedBanner = () => {
  const [i, setI] = React.useState(0);

  React.useEffect(() => {
    const id = setInterval(() => setI(x => (x + 1) % frames.length), 75);
    return () => clearInterval(id);
  }, []);

  return <CopilotBanner frame={frames[i]} />;
};
This gave Cameron the confidence to open a pull request (his first engineering pull request in nine years at GitHub).
“Copilot filled in syntax I didn’t know,” Cameron said. “But I still made all the architectural decisions.”
Now it was time for the engineering team to turn a prototype into something production-worthy.
Andy Feller (@andyfeller), a long-time GitHub engineer behind the GitHub CLI, partnered with Cameron to bring the animation into the Copilot CLI codebase.
Unlike browsers—which share rendering engines, accessibility APIs, and standards like WCAG—terminal environments are a patchwork of behaviors inherited from decades-old hardware like the VT100. There’s no DOM, no semantic structure, and only partial agreement on capabilities across terminals. This makes even “simple” UI design problems in the terminal uniquely challenging, especially as AI-driven workflows push CLIs into daily use for more developers.
“There’s no framework for terminal animations,” Andy explained. “We had to figure out how to do this without flickering, without breaking accessibility, and across wildly different terminals.”
Andy broke the engineering challenges into four broad categories:
Most terminals repaint the entire viewport when new content arrives. At the same time, CLIs come with a strict usability expectation: when developers run a command, they want to get to work immediately. Any animation that flickers, blocks input, or lingers too long actively degrades the experience.
This created a core tension the team had to resolve: how to introduce a brief, animated banner without slowing startup, stealing focus, or destabilizing the terminal render loop.
In practice, this was complicated by the fact that terminals behave differently under load. Some:
To avoid flicker while keeping the CLI responsive across popular terminals like iTerm2, Windows Terminal, and VS Code, the team had to carefully coordinate several interdependent concerns:
The result was an animation treated as a non-blocking, best-effort enhancement—visible when it could be rendered safely, but never at the expense of startup performance or usability.
“ANSI color consistency simply doesn’t exist,” Andy said.
Most modern terminals support 8-bit color, allowing CLIs to choose from 256 colors. However, how those colors are actually rendered varies widely based on terminal themes, OS settings, and user accessibility overrides. In practice, CLIs can’t rely on exact hues—or even consistent contrast—across environments.
The Copilot banner introduced an additional complexity: although it’s rendered using text characters, the block-letter Copilot logo functions as a graphical object, not readable body text. Under accessibility guidelines, non-text graphical elements have different contrast requirements than text, and they must remain perceivable without relying on fine detail or precise color matching.
To account for this, the team deliberately chose a minimal 4-bit ANSI palette—one of the few color modes most terminals allow users to customize—to ensure the animation remained legible under high-contrast themes, low-vision settings, and color overrides.
This meant the team had to:
Rather than encoding brand colors directly, the animation maps semantic roles—such as borders, eyes, highlights, and text—to ANSI color slots that terminals can reinterpret safely. This allows the banner to remain recognizable without assuming control over the user’s color environment.
Cameron’s prototype was a great starting point for Andy to incorporate into the Copilot CLI but it wasn’t without its challenges:
First, the animation was broken down into distinct animation elements that could be used to create separate light and dark themes:
type AnimationElements =
    | "block_text"
    | "block_shadow"
    | "border"
    | "eyes"
    | "head"
    | "goggles"
    | "shine"
    | "stars"
    | "text";

type AnimationTheme = Record<AnimationElements, ANSIColors>;

const ANIMATION_ANSI_DARK: AnimationTheme = {
    block_text: "cyan",
    block_shadow: "white",
    border: "white",
    eyes: "greenBright",
    head: "magentaBright",
    goggles: "cyanBright",
    shine: "whiteBright",
    stars: "yellowBright",
    text: "whiteBright",
};

const ANIMATION_ANSI_LIGHT: AnimationTheme = {
    block_text: "blue",
    block_shadow: "blackBright",
    border: "blackBright",
    eyes: "green",
    head: "magenta",
    goggles: "cyan",
    shine: "whiteBright",
    stars: "yellow",
    text: "black",
};
Next, the overall animation and subsequent frames would capture content, color, duration needed to animate the banner:
interface AnimationFrame {
    title: string;
    duration: number;
    content: string;
    colors?: Record<string, AnimationElements>; // Map of "row,col" positions to animation elements
}

interface Animation {
    metadata: {
        id: string;
        name: string;
        description: string;
    };
    frames: AnimationFrame[];
}
Then, each animation frame was captured to separate frame content from stylistic and animation details, resulting in over 6,000 lines of TypeScript to safely animate three seconds of the Copilot logo across terminals with wildly different rendering and accessibility behaviors:
    const frames: AnimationFrame[] = [
        {
            title: "Frame 1",
            duration: 80,
            content: `
┌┐
││


││
└┘`,
            colors: {
                "1,0": "border",
                "1,1": "border",
                "2,0": "border",
                "2,1": "border",
                "10,0": "border",
                "10,1": "border",
                "11,0": "border",
                "11,1": "border",
            },
        },
        {
            title: "Frame 2",
            duration: 80,
            content: `
┌──     ──┐
│         │
 █▄▄▄
 ███▀█
 ███ ▐▌
 ███ ▐▌
   ▀▀█▌
   ▐ ▌
    ▐
│█▄▄▌     │
└▀▀▀    ──┘`,
            colors: {
                "1,0": "border",
                "1,1": "border",
                "1,2": "border",
                "1,8": "border",
                "1,9": "border",
                "1,10": "border",
                "2,0": "border",
                "2,10": "border",
                "3,1": "head",
                "3,2": "head",
                "3,3": "head",
                "3,4": "head",
                "4,1": "head",
                "4,2": "head",
                "4,3": "goggles",
                "4,4": "goggles",
                "4,5": "goggles",
                "5,1": "head",
                "5,2": "goggles",
                "5,3": "goggles",
                "5,5": "goggles",
                "5,6": "goggles",
                "6,1": "head",
                "6,2": "goggles",
                "6,3": "goggles",
                "6,5": "goggles",
                "6,6": "goggles",
                "7,3": "goggles",
                "7,4": "goggles",
                "7,5": "goggles",
                "7,6": "goggles",
                "8,3": "eyes",
                "8,5": "head",
                "9,4": "head",
                "10,0": "border",
                "10,1": "head",
                "10,2": "head",
                "10,3": "head",
                "10,4": "head",
                "10,10": "border",
                "11,0": "border",
                "11,1": "head",
                "11,2": "head",
                "11,3": "head",
                "11,8": "border",
                "11,9": "border",
                "11,10": "border",
            },
        },
Finally, each animation frame is rendered building segments of text based on consecutive color usage with the necessary ANSI escape codes:
           {frameContent.map((line, rowIndex) => {
                const truncatedLine = line.length > 80 ? line.substring(0, 80) : line;
                const coloredChars = Array.from(truncatedLine).map((char, colIndex) => {
                    const color = getCharacterColor(rowIndex, colIndex, currentFrame, theme, hasDarkTerminalBackground);
                    return { char, color };
                });

                // Group consecutive characters with the same color
                const segments: Array<{ text: string; color: string }> = [];
                let currentSegment = { text: "", color: coloredChars[0]?.color || theme.COPILOT };

                coloredChars.forEach(({ char, color }) => {
                    if (color === currentSegment.color) {
                        currentSegment.text += char;
                    } else {
                        if (currentSegment.text) segments.push(currentSegment);
                        currentSegment = { text: char, color };
                    }
                });
                if (currentSegment.text) segments.push(currentSegment);

                return (
                    <Text key={rowIndex} wrap="truncate">
                        {segments.map((segment, segIndex) => (
                            <Text key={segIndex} color={segment.color}>
                                {segment.text}
                            </Text>
                        ))}
                    </Text>
                );
})}The engineering team approached the banner with the same philosophy as the GitHub CLI’s accessibility work:
“CLI accessibility is under researched,” Andy noted. “We’ve learned a lot from users who are blind as well as users with low vision, and those lessons shaped this project.”
Because of this, the animation is opt-in and gated behind its own flag—so it’s not something developers see by default. And when developers run the CLI in –screen-reader mode, the banner is automatically skipped so no decorative characters or motion are sent to assistive technologies.
By the end of the refactor, the team had:
This pattern—storing frames as plain text, layering semantic roles, and applying themes at runtime—isn’t specific to Copilot. It’s a reusable approach for anyone building terminal UIs or animations.
A “simple ASCII banner” turned into:
“The most rewarding part was stepping into open source for the first time,” Cameron said. “With Copilot, I was able to build out my MVP ASCII animation tool into a full open source app at ascii-motion.app,. Someone fixed a typo in my README, and it made my day.”
As Andy pointed out, building accessible experiences for CLIs is still largely unexplored territory and far behind the tooling and standards available for the web.
Today, developers are already contributing to Cameron’s ASCII Motion tool, and the Copilot CLI team can ship new animations without rebuilding the system.
This is what building for the terminal demands: deep understanding of constraints, discipline around accessibility, and the willingness to invent tooling where none exists.
The GitHub Copilot CLI brings AI-assisted workflows directly into your terminal — including commands for explaining code, generating files, refactoring, testing, and navigating unfamiliar projects.
The post From pixels to characters: The engineering behind GitHub Copilot CLI’s animated ASCII banner appeared first on The GitHub Blog.
Post Syndicated from Crosstalk Solutions original https://www.youtube.com/shorts/Hz-0KQboBI8
Post Syndicated from The Atlantic original https://www.youtube.com/watch?v=d3klLJ5-E4s
Post Syndicated from BeardedTinker original https://www.youtube.com/watch?v=Yoi7Hf0K4vE
Post Syndicated from corbet original https://lwn.net/Articles/1056354/
PC Gamer has run an
amusing review of the scx_horoscope
scheduler for Linux, which uses astrology to optimize scheduling
decisions.
The scheduler is full of bizarre features, like its ability to
perform real planetary calculations based on accurate geocentric
planetary positions, lunar phase scheduling (the full moon gives a
1.4x boost to tasking, apparently) and “zodiac-based task
classification”.That latter feature is easily one of my favourite bits. Specific
planetary bodies “rule” over specific system tasks, so the Sun is
in charge of critical system processes, the Moon (tied to emotions,
of course) rules over interactive tasks, and Jupiter is assigned to
memory-heavy applications, among others.
Post Syndicated from jzb original https://lwn.net/Articles/1055539/
Creating fair governance models for open-source projects is not
easy; defining criteria for participants to receive membership and
voting rights is a particularly thorny problem for projects that have
elections for representative bodies. The Fedora
Council, the project’s top-level governance body, is wrestling
with that conundrum now. This was triggered by a Fedora special-interest
group (SIG) granting temporary membership to at least one person for the
sole purpose of allowing them to vote in the most recent Fedora
Engineering Steering Council (FESCo) election. That opened a large can
of worms about what it means to be a contributor and how contributors
can be identified for voting purposes.
Post Syndicated from Rapid7 original https://www.rapid7.com/blog/post/etr-multiple-critical-solarwinds-web-help-desk-vulnerabilities-cve-2025-40551-40552-40553-40554
On January 28, 2026, SolarWinds published an advisory for multiple new vulnerabilities affecting their Web Help Desk product. Web Help Desk is an IT help desk ticketing and asset management software solution. Of the six new CVEs disclosed in the advisory, four are critical, and allow a remote attacker to either achieve unauthenticated remote code execution (RCE) or bypass authentication.
As of this writing, there is currently no known in-the-wild exploitation occurring. However, we expect this to change as and when technical details become available. Notably, this product has been featured on CISA’s Known Exploited Vulnerabilities (KEV) list twice in the past, circa 2024, indicating that it is a target for real-world attackers.
The six vulnerabilities are summarized below.
⠀
|
CVE |
CVSSv3 |
CWE |
|
9.8 (Critical) |
Deserialization of Untrusted Data (CWE-502) |
|
|
9.8 (Critical) |
Weak Authentication (CWE-1390) |
|
|
9.8 (Critical) |
Deserialization of Untrusted Data (CWE-502) |
|
|
9.8 (Critical) |
Weak Authentication (CWE-1390) |
|
|
8.1 (High) |
Protection Mechanism Failure (CWE-693) |
|
|
7.5 (High) |
Use of Hard-coded Credentials (CWE-798) |
Both CVE-2025-40551 and CVE-2025-40553 are critical deserialization of untrusted data vulnerabilities that allow a remote unauthenticated attacker to achieve RCE on a target system and execute payloads such as arbitrary OS command execution. RCE via deserialization is a highly reliable vector for attackers to leverage, and as these vulnerabilities are exploitable without authentication, the impact of either of these two vulnerabilities is significant.
The other two critical vulnerabilities, CVE-2025-40552 and CVE-2025-40554, are authentication bypasses that allow a remote unauthenticated attacker to execute actions or methods on a target system which are intended to be gated by authentication. Based upon the vendor supplied CVSS scores for these two authentication bypass vulnerabilities, the impact is equivalent to the two RCE deserialization vulnerabilities, likely meaning they can also be leveraged for RCE.
In addition to the four critical vulnerabilities, two high severity vulnerabilities were also disclosed. CVE-2025-40536 is an access control bypass vulnerability, allowing an attacker to access functionality on the target system that is intended to be restricted to authenticated users. Separately, CVE-2025-40537 may, under certain conditions, allow access to some administrative functionality on the target system due to the existence of hardcoded credentials.
A vendor supplied update is available to remediate all six vulnerabilities: CVE-2025-40551, CVE-2025-40552, CVE-2025-40553, CVE-2025-40554, CVE-2025-40536, and CVE-2025-40537. The following product versions are affected:
SolarWinds Web Help Desk versions 12.8.8 Hotfix 1 and below.
Customers are advised to update to the latest Web Help Desk version, 2026.1, on an urgent basis outside of normal patching cycles.
For the latest mitigation guidance for SolarWinds Web Help Desk, please refer to the vendor’s security advisory.
Exposure Command, InsightVM, and Nexpose customers can assess their exposure to CVE-2025-40551, CVE-2025-40552, CVE-2025-40553 and CVE-2025-40554 with remote vulnerability checks expected to be available in today’s (28 Jan) content release.
Post Syndicated from The Atlantic original https://www.youtube.com/shorts/JzilhMi_o-I
Post Syndicated from jzb original https://lwn.net/Articles/1056330/
Security updates have been issued by AlmaLinux (java-1.8.0-openjdk), Debian (openssl), Fedora (assimp, chromium, curl, freerdp, gimp, and harfbuzz), Mageia (glibc, haproxy, iperf, and python-pyasn1), Red Hat (image-builder, openssl, and osbuild-composer), Slackware (mozilla), SUSE (avahi, cups, gio-branding-upstream, google-osconfig-agent, java-11-openjdk, java-17-openjdk, java-21-openjdk, kernel-firmware, libmatio-devel, libopenjp2-7, nodejs22, php8, python-python-multipart, python311-urllib3_1, qemu, and xen), and Ubuntu (ffmpeg, jaraco.context, openssl, and openssl, openssl1.0).
Post Syndicated from The History Guy: History Deserves to Be Remembered original https://www.youtube.com/watch?v=zMwNfQp06kA
Post Syndicated from Home Assistant original https://www.youtube.com/watch?v=EohxnoGc3pg
Post Syndicated from Idriss Laouali Abdou original https://aws.amazon.com/blogs/devops/aws-cloudformation-2025-year-in-review/
AWS CloudFormation enables you to model and provision your cloud application infrastructure as code-base templates. Whether you prefer writing templates directly in JSON or YAML, or using programming languages like Python, Java, and TypeScript with the AWS Cloud Development Kit (CDK), CloudFormation and CDK provide the flexibility you need. For organizations adopting multi-account strategies, CloudFormation StackSets offers a powerful capability to deploy resources across multiple regions and accounts in parallel.
In 2025, we delivered a comprehensive set of major enhancements focused on three core areas: reducing dev-test cycle through early validation, improving deployment safety with improved configuration drift management, and integrating IaC context to AI-powered development tools.
These launches address common pain points in infrastructure development workflows, from catching deployment errors before resource provisioning to managing configuration drift systematically. The features span the entire development lifecycle, from template authoring in your IDE to multi-account deployments at scale.
This blog provides an overview of the key capabilities we launched in 2025 and how they improve your infrastructure development workflow.
CloudFormation now validates your templates during change set (preview of infrastructure changes before deployment) creation, catching common deployment errors before resource provisioning begins. The validation checks for invalid property syntax, resource name conflicts with existing resources in your account, and S3 bucket emptiness constraints on delete operations.
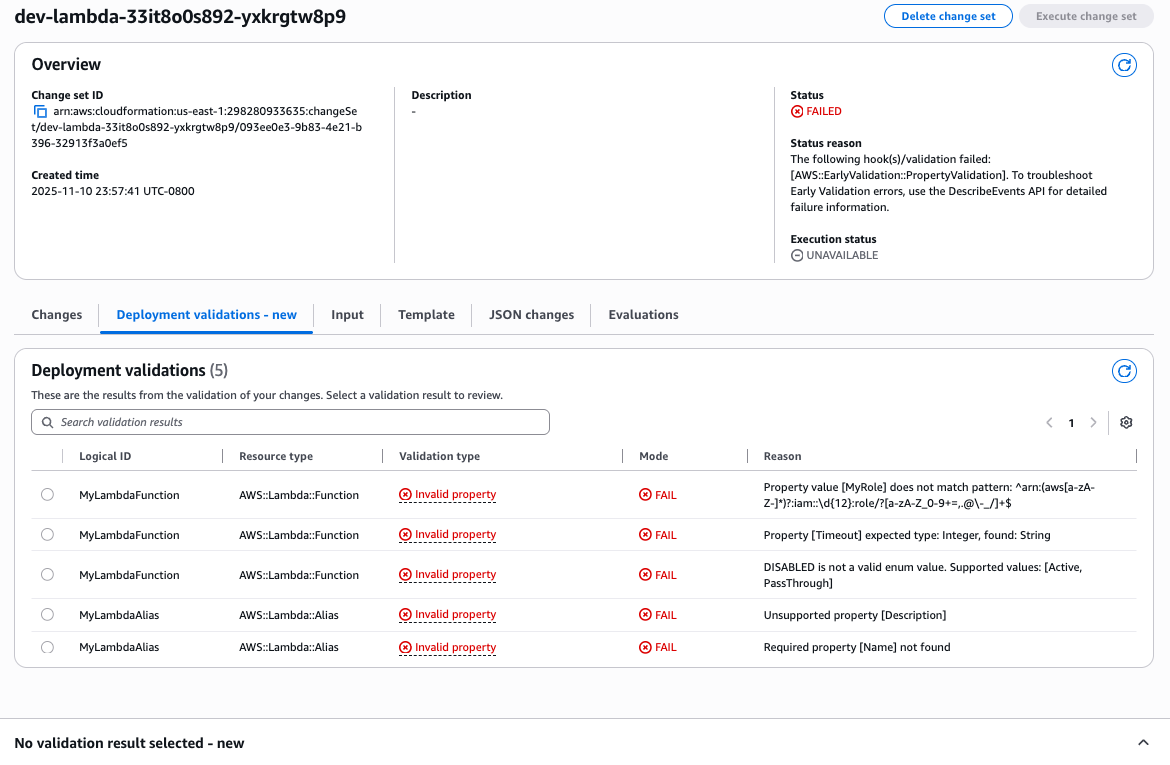
Figure 1: Pre-deployment validations view
When validation fails, the change set status shows ‘FAILED’ with detailed information about each issue, including the property path where problems occur. This early feedback helps you fix issues faster rather than waiting for deployment failures.
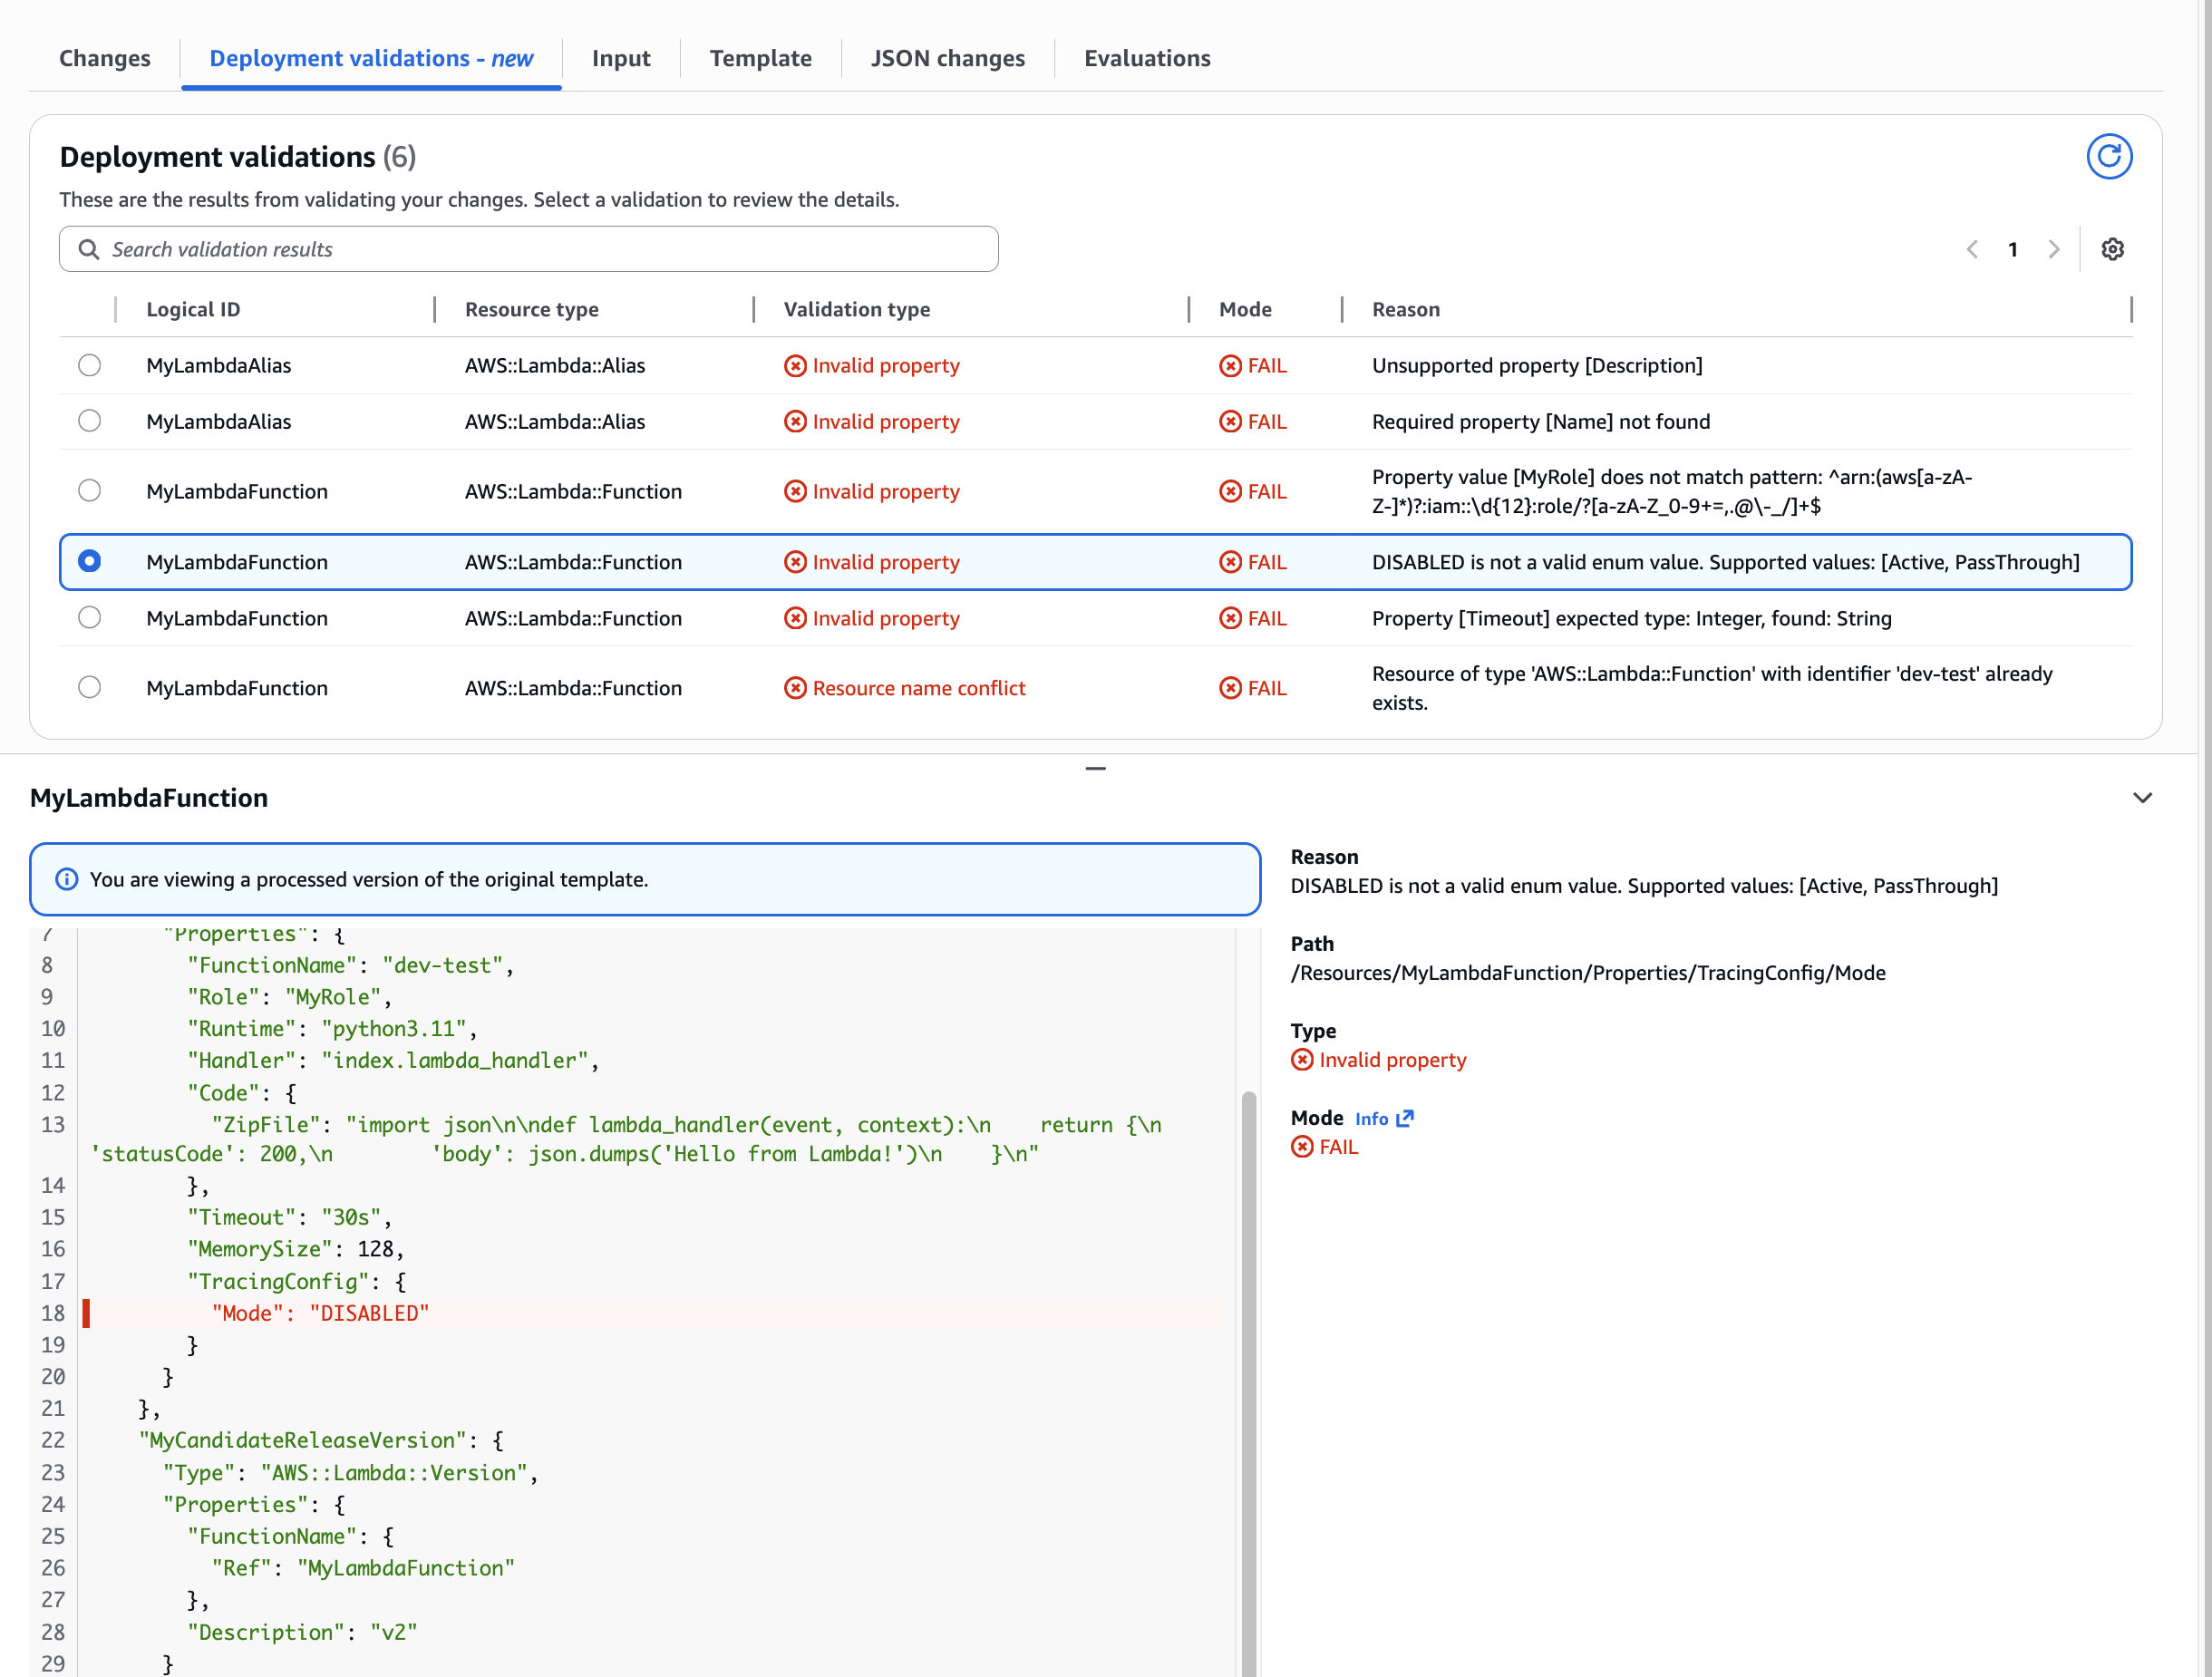
Figure 2: Validation of Invalid ENUM value for nested property
For runtime errors that occur during deployment, every stack operation now receives a unique operation ID. You can filter stack events by operation ID to quickly identify root causes, reducing troubleshooting time from minutes to seconds. The new describe-events API provides grouped access to events. You can query events for a specific operation, filter to FAILED status events, and extract the root cause without parsing through the entire stack event history.
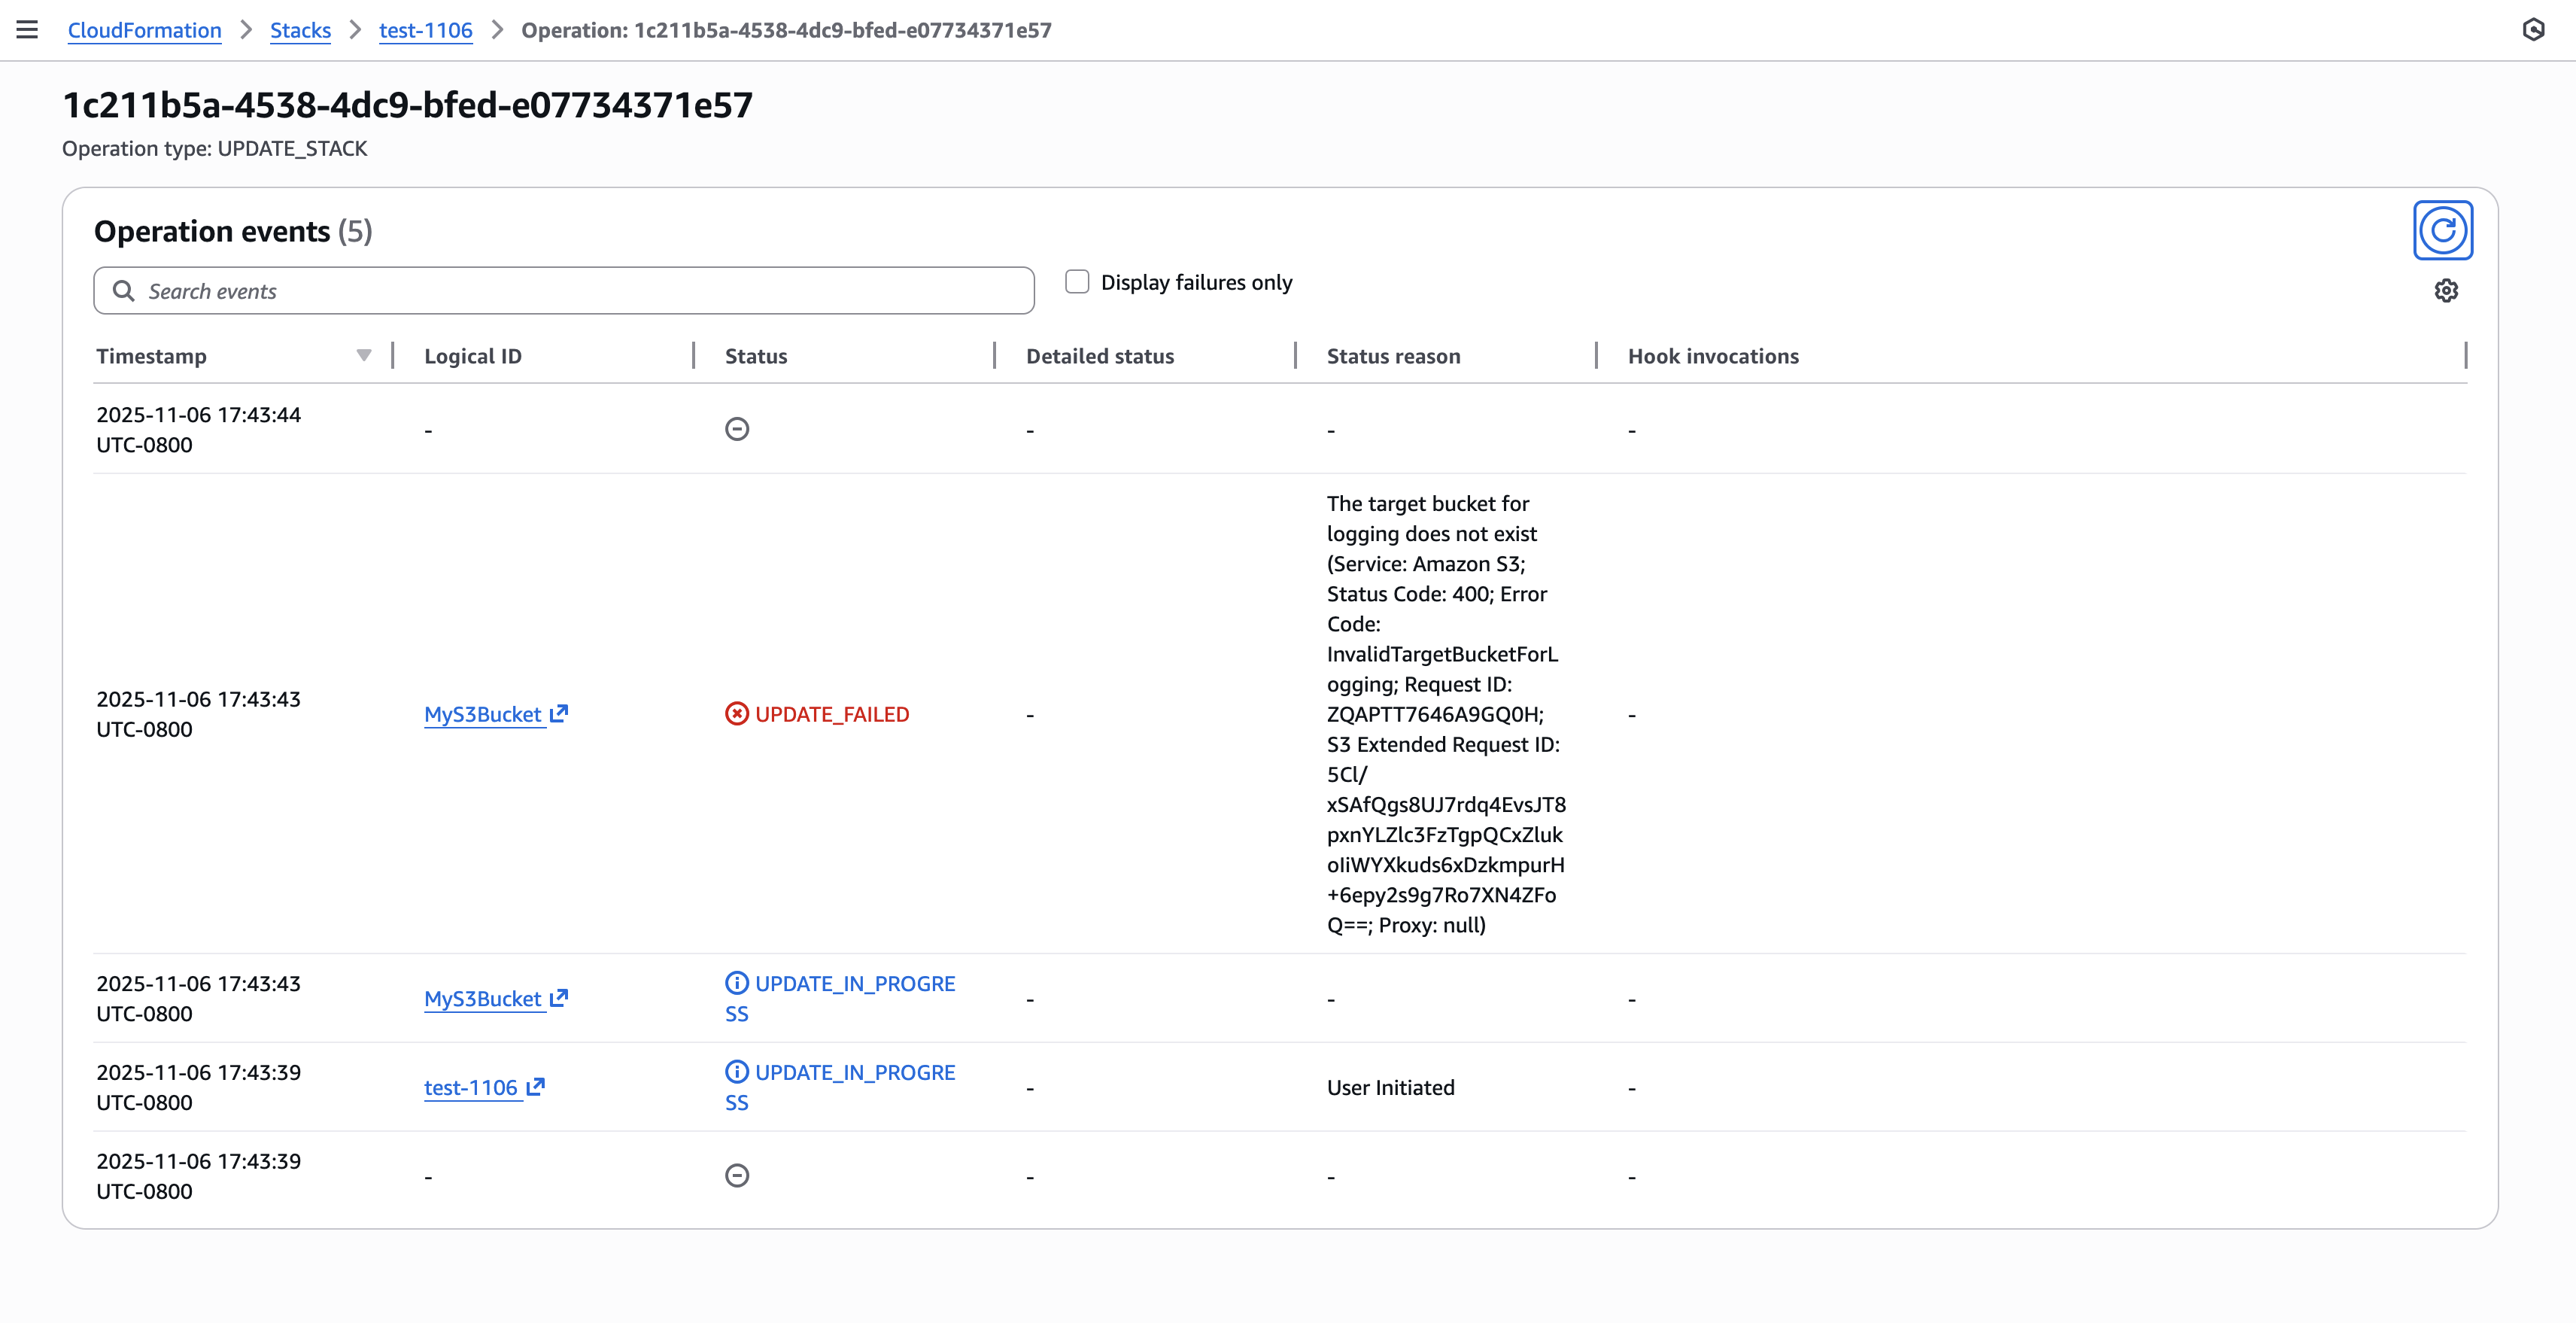 Figure 3: New CloudFormation stack operation page
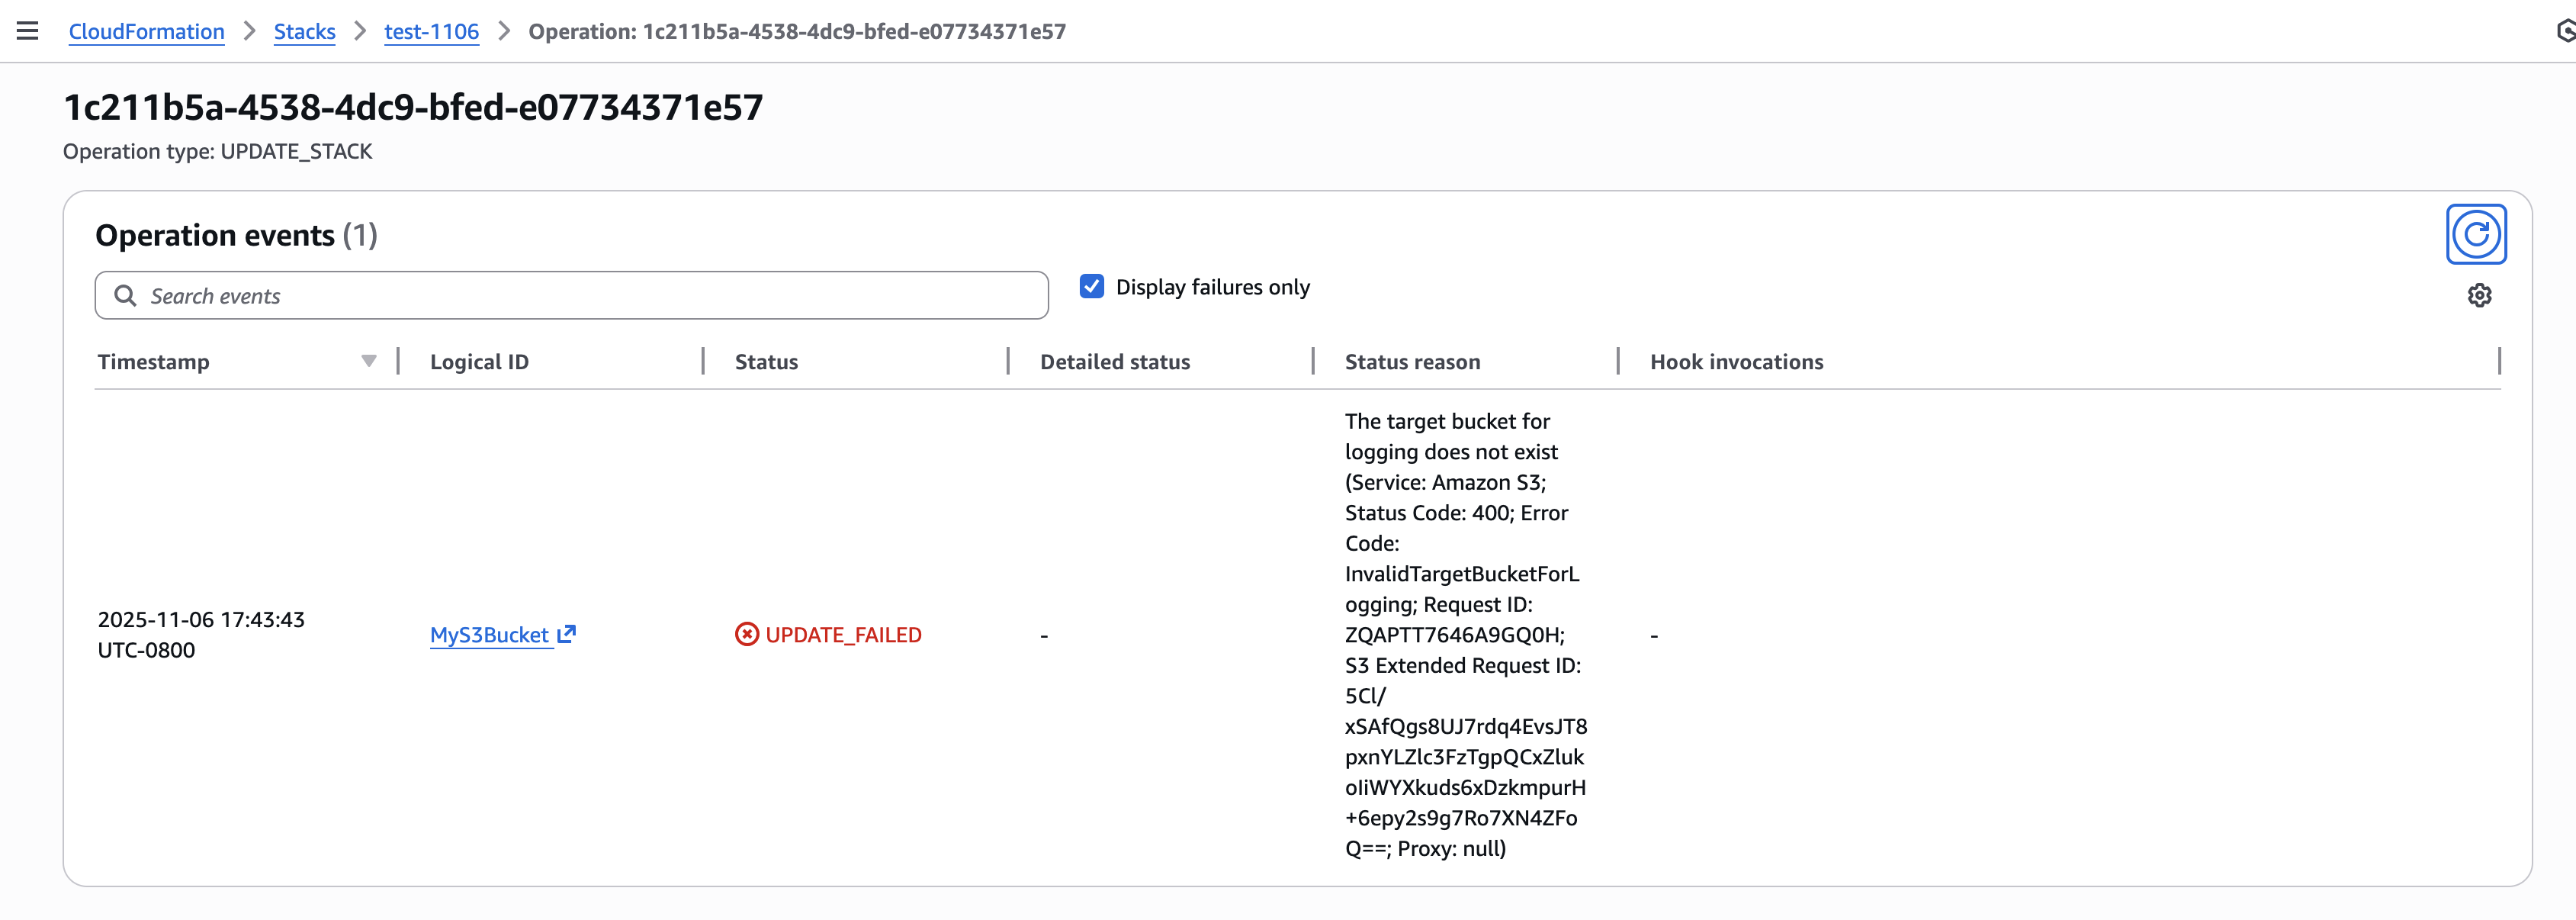
Figure 4: Filter operation failure root causes
Learn more:
We launched the AWS CloudFormation Language Server, bringing end-to-end infrastructure development directly into your IDE. Available through the AWS Toolkit for Visual Studio Code, Kiro, and other compatible IDEs, this capability transforms how you author CloudFormation templates.
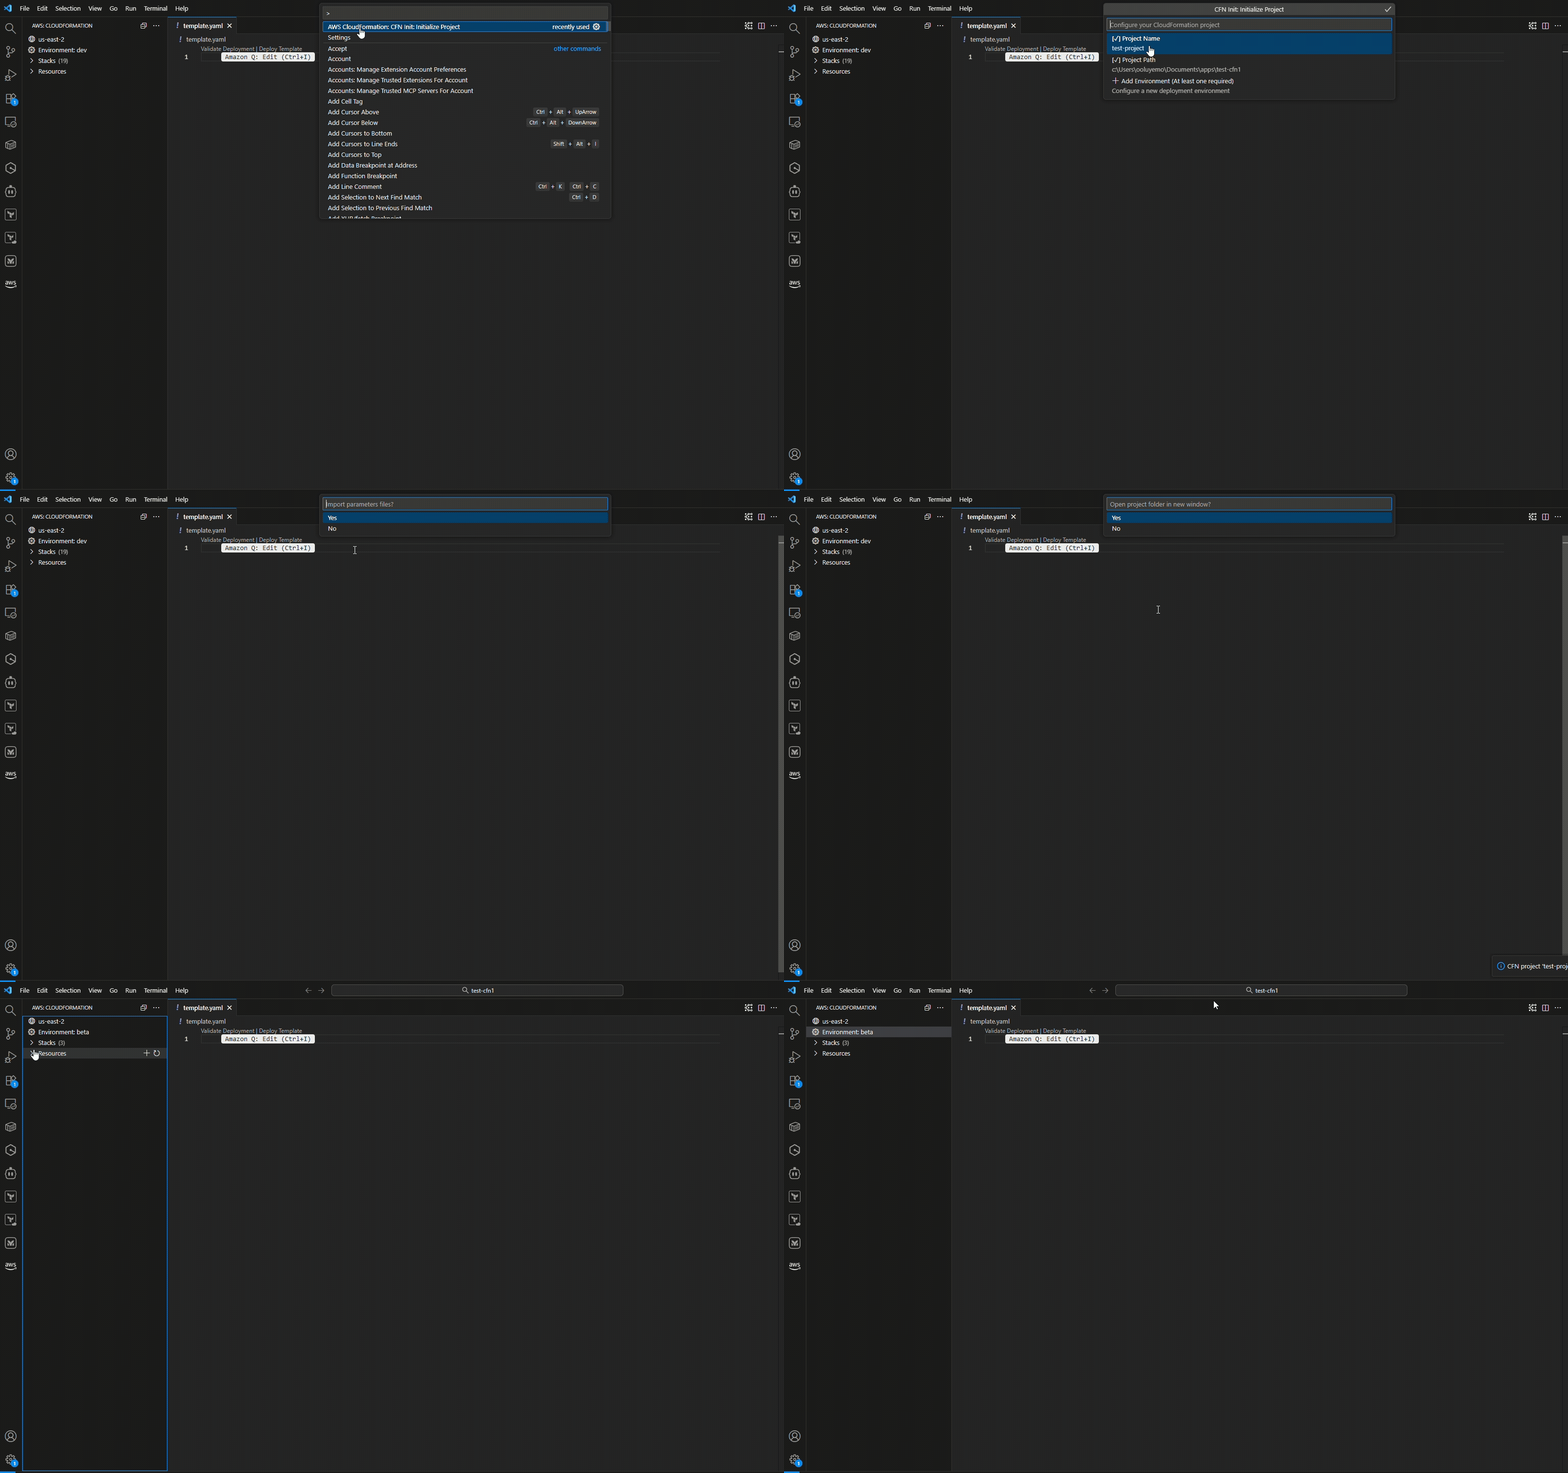
Figure 1: Initializing a CloudFormation project with environment configuration
The Language Server provides context-aware auto-completion that understands CloudFormation semantics. When you define resources, it suggests only required properties automatically, while optional properties appear on hover. Built-in validation catches issues before deployment integrating early validation capabilities, flagging invalid resource properties, missing IAM permissions, and security policy violations using CloudFormation Guard.
Figure 2: Hover information displaying optional properties and their documentation
The drift-aware deployment view highlights differences between your template and deployed infrastructure, helping you spot configuration changes made outside CloudFormation. The Language Server also provides semantic navigation features, go-to-definition for logical IDs, find-all-references for resource dependencies, and hover documentation that pulls from the CloudFormation resource specification. These features work across intrinsic functions like !Ref, !GetAtt, and !Sub, understanding the CloudFormation template structure. By integrating validation and real-time feedback directly into your authoring experience, the Language Server keeps you in flow state, reducing context switching between your IDE, AWS Console, and documentation.
Figure 3: Type-aware completions for intrinsic functions like !GetAtt & !Ref
Learn more:
Stack Refactoring enables you to reorganize your CloudFormation and CDK infrastructure without disrupting deployed resources. You can move resources between stacks, rename logical IDs, and decompose monolithic stacks into focused components while maintaining resource stability and operational state.
Whether you’re modernizing legacy stacks, aligning infrastructure with evolving architectural patterns, or improving long-term maintainability, Stack Refactoring adapts your CloudFormation and CDK organization to changing requirements. The console and CDK experience, launched this year, extends the earlier CLI capability, making refactoring accessible through your preferred interface.
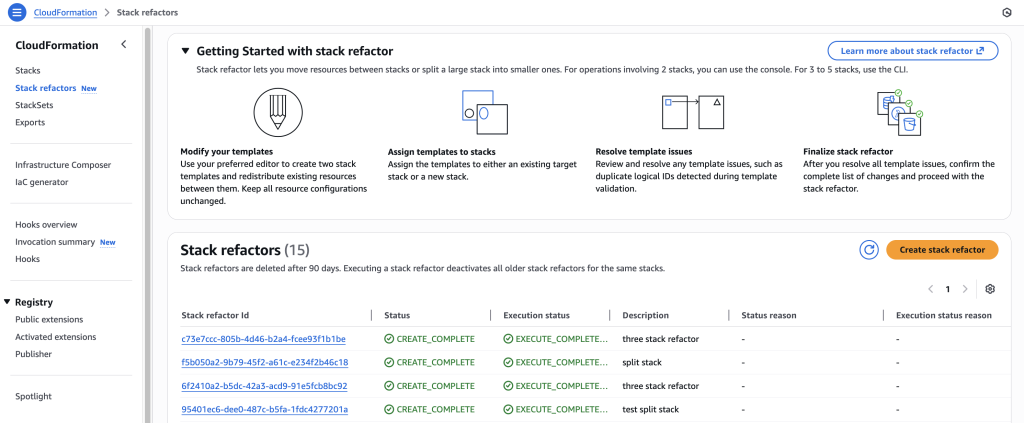
Learn more:
– Blog Post – Refactor CloudFormation from Console
– Blog Post – Refactor CDK
Configuration drift occurs when infrastructure managed by CloudFormation is modified through the AWS Console, SDK, or CLI. Drift-aware change sets address this challenge by providing a three-way comparison between your new template, last-deployed template, and actual infrastructure state.
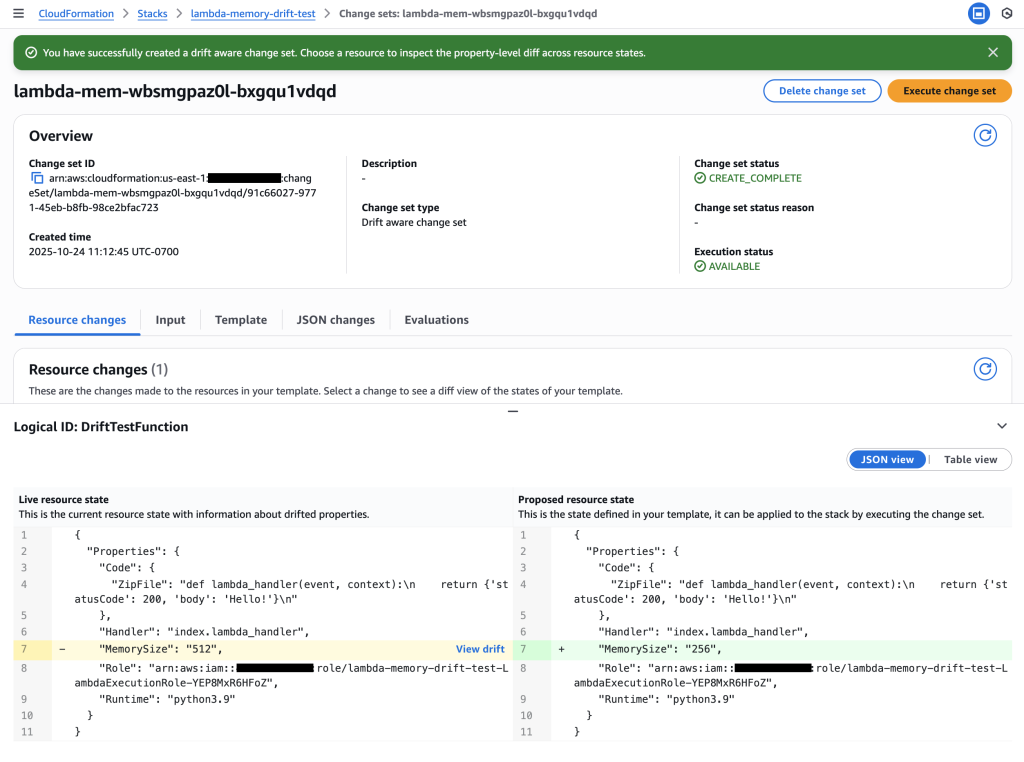
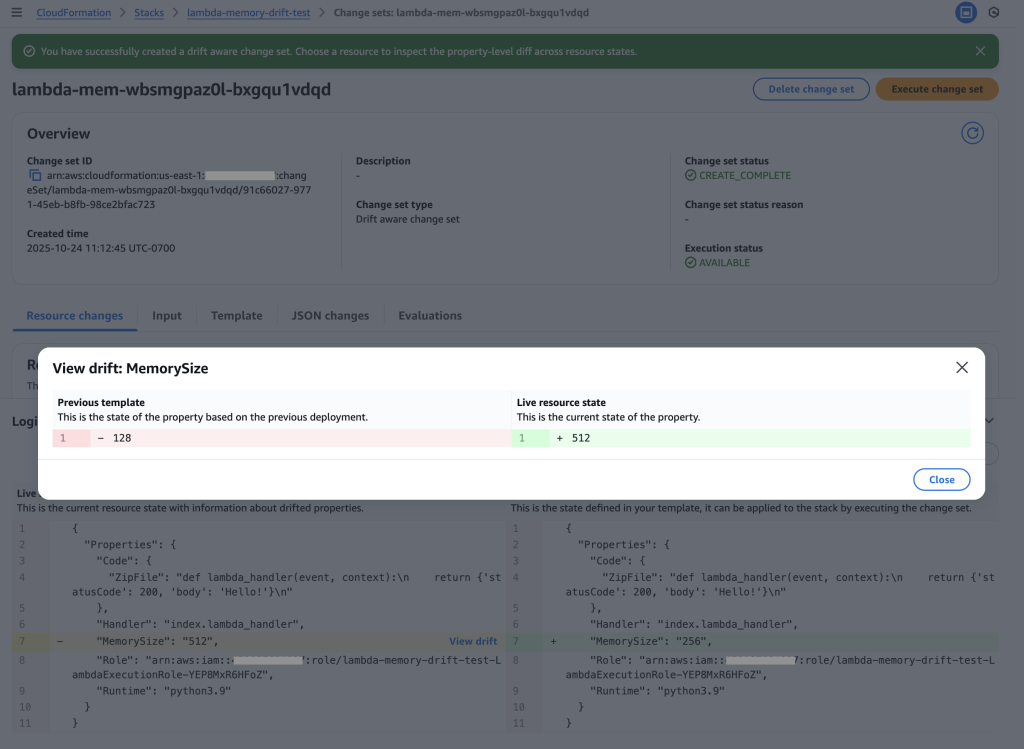
Figure 4: Examine the drift-aware change set to see the dangerous memory reduction that would occur
This capability helps you prevent unexpected overwrites of drift. If your change set preview shows unintended changes, you can update your template values and recreate the change set before deployment. During execution, CloudFormation matches resource properties with template values and recreates resources deleted outside of CloudFormation.
Drift-aware change sets enable you to systematically revert drift and keep infrastructure in sync with templates, strengthening reproducibility for testing and disaster recovery while maintaining your security posture.
Learn more:
AWS CloudFormation Hooks now supports managed proactive controls, enabling customers to validate resource configurations against AWS best practices without writing custom Hooks logic. Customers can select controls from the AWS Control Tower Controls Catalog and apply them during CloudFormation operations. When using CloudFormation, customers can configure these controls to run in warn mode, allowing teams to test controls without blocking deployments and giving them the flexibility to evaluate control behavior before enforcing policies in production. This significantly reduces setup time, eliminates manual errors, and ensures comprehensive governance coverage across your infrastructure.
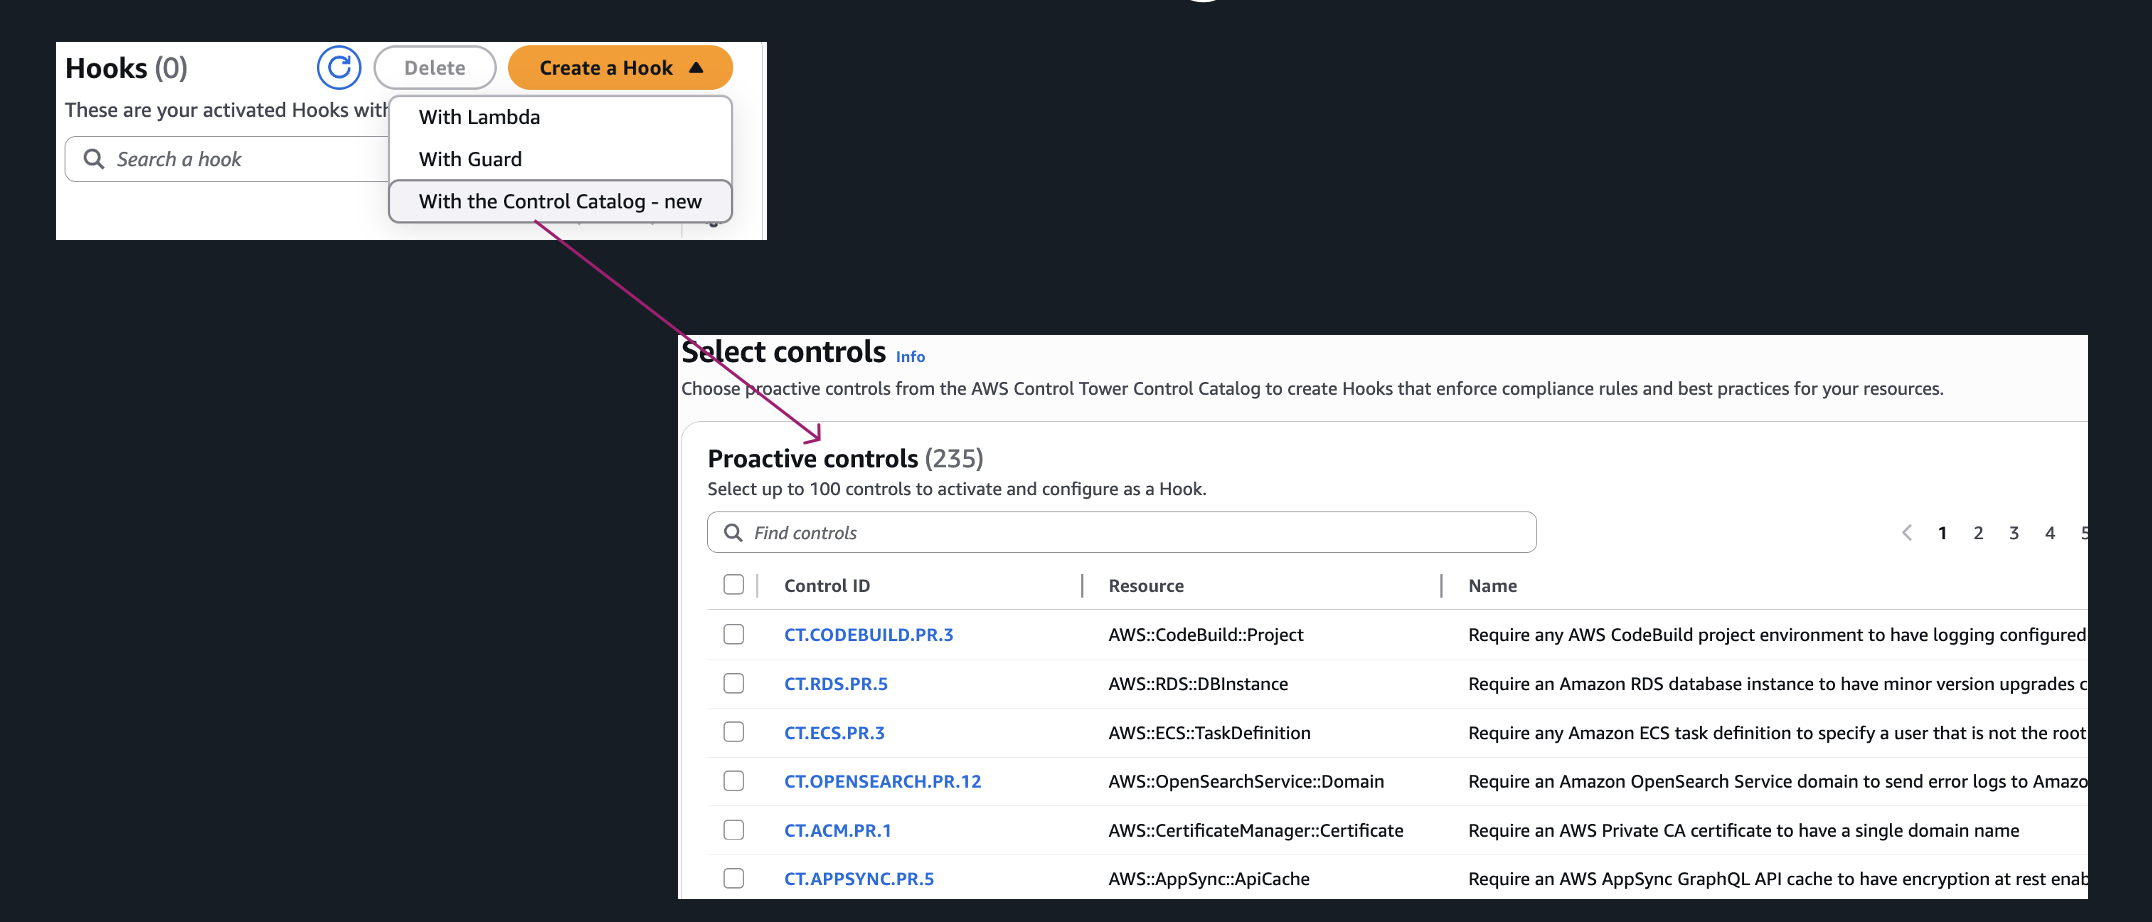
AWS also introduced a new Hooks Invocation Summary page in the CloudFormation console. This centralized view provides a complete historical record of Hooks activity, showing which controls were invoked, their execution details, and outcomes such as pass, warn, or fail. This simplifies compliance reporting issues faster.
With this launch, customers can now leverage AWS-managed controls as part of their provisioning workflows, eliminating the overhead of writing and maintaining custom logic. These controls are curated by AWS and aligned with industry best practices, helping teams enforce consistent policies across all environments. The new summary page delivers essential visibility into Hook invocation history, enabling faster issue resolution and streamlined compliance reporting.
Learn more:
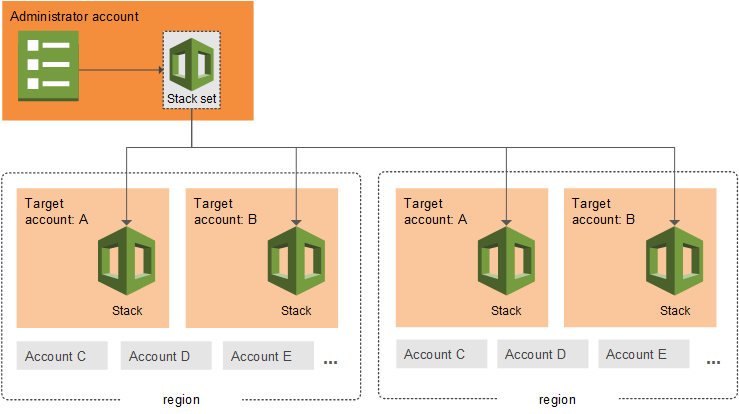
CloudFormation StackSets now supports deployment ordering for auto-deployment mode, enabling you to define the sequence in which stack instances automatically deploy across accounts and regions. This capability coordinates complex multi-stack deployments where foundational infrastructure must be provisioned before dependent application components.
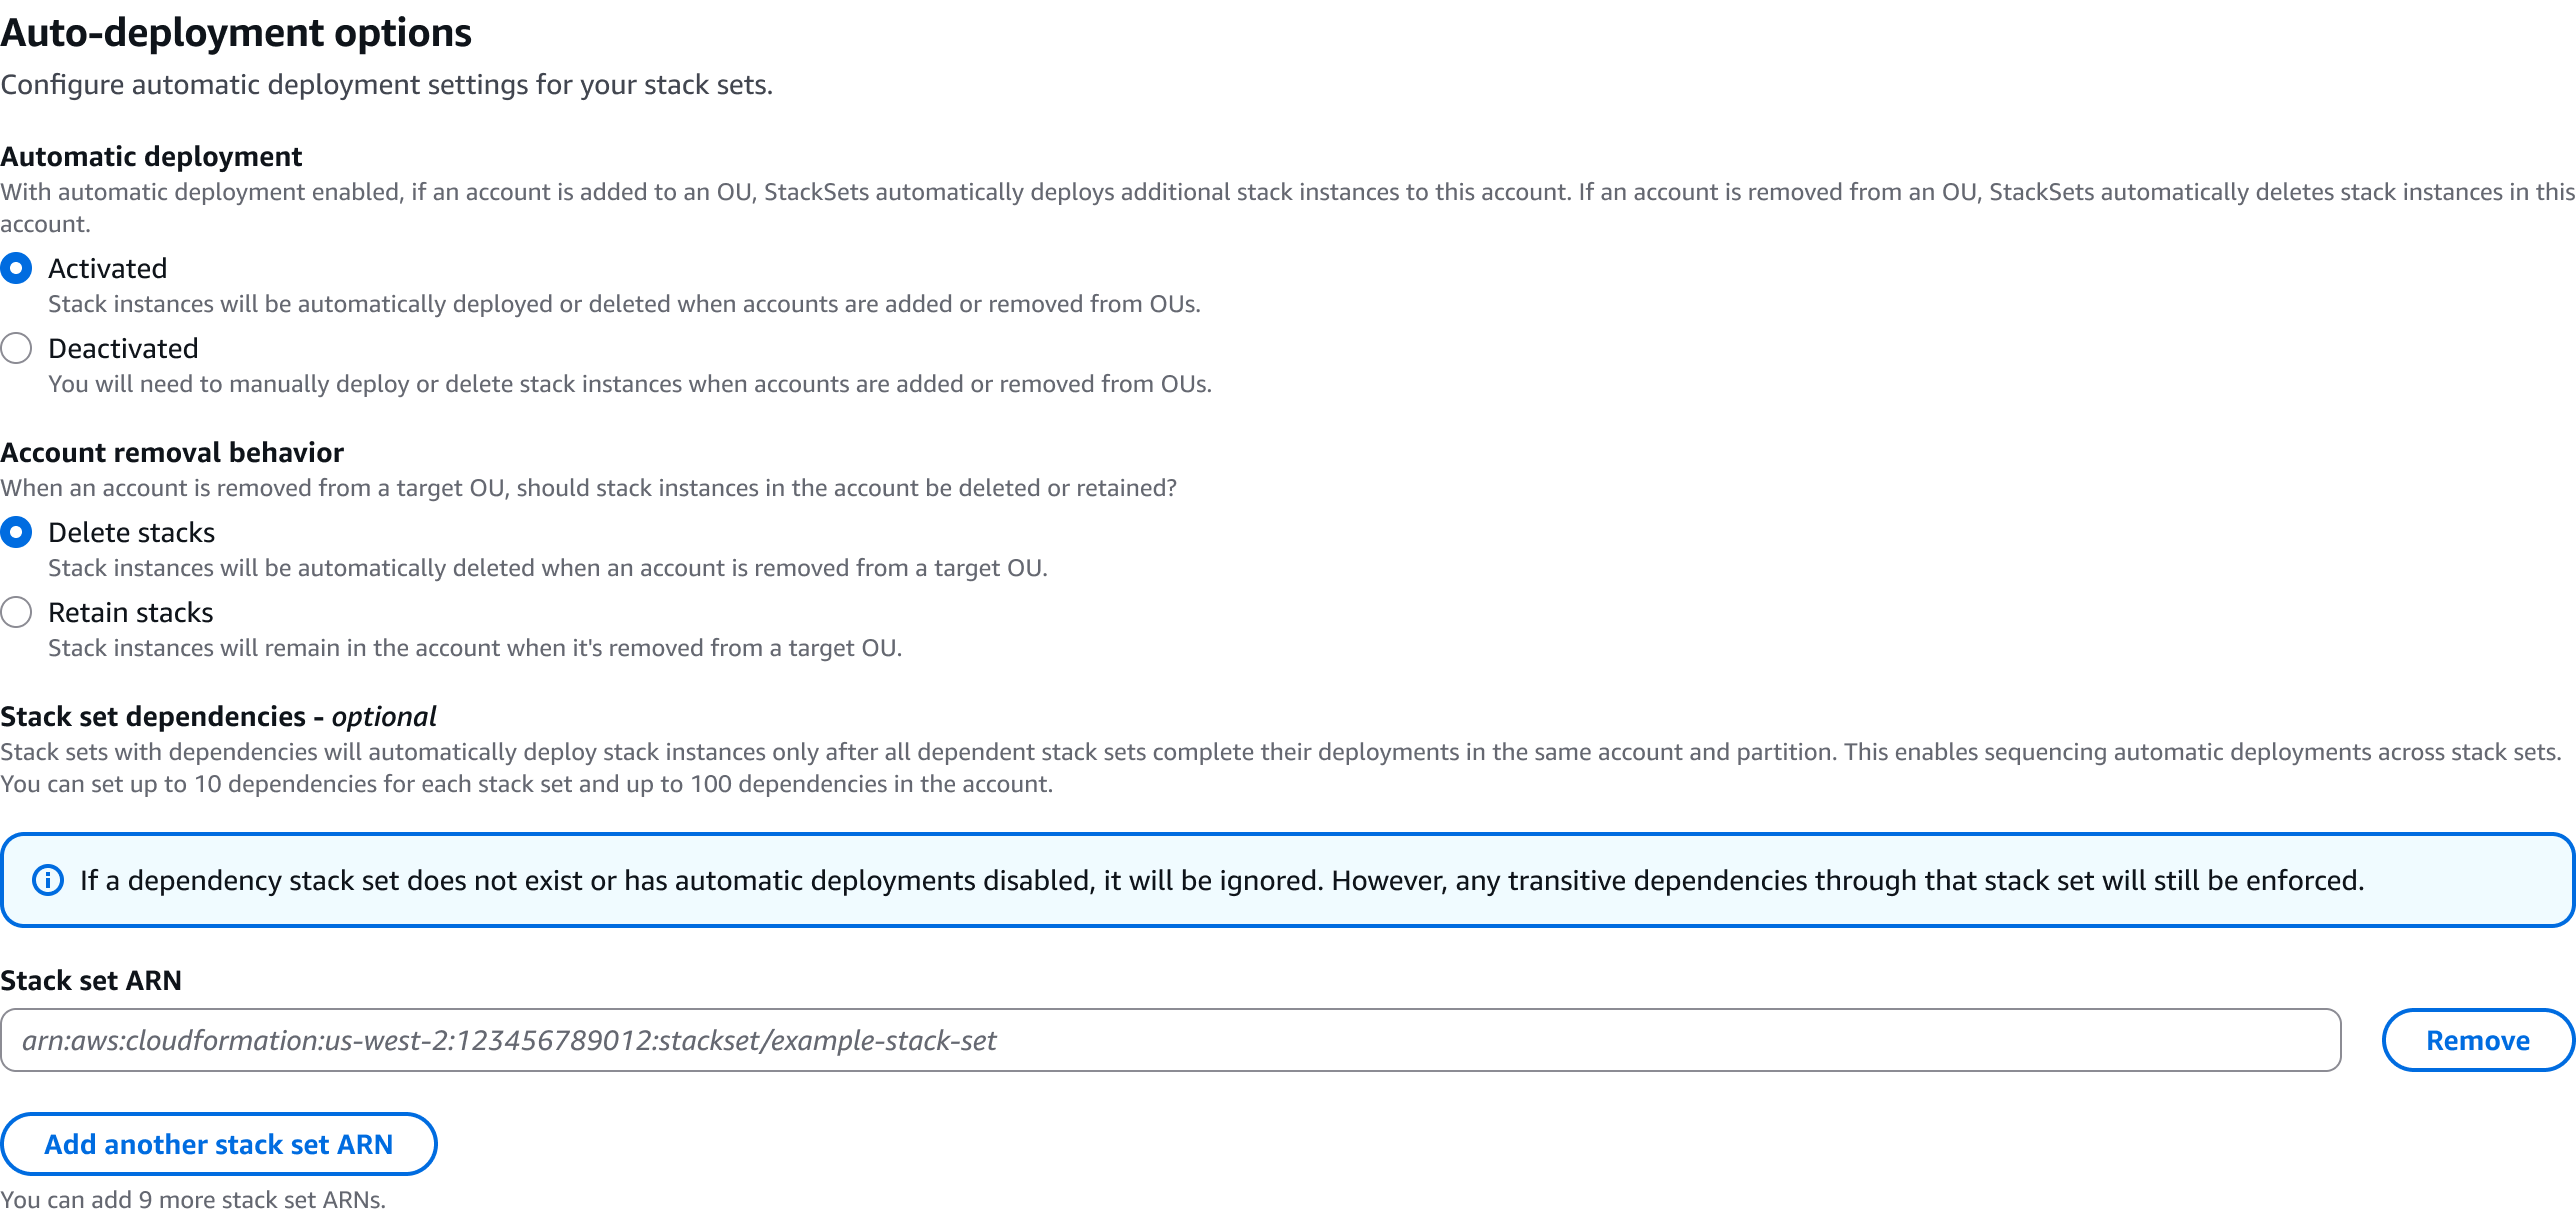
When creating or updating a StackSet, you can specify up to 10 dependencies per stack instance using the DependsOn parameter in the AutoDeployment configuration. StackSets automatically orchestrates deployments based on your defined relationships. For example, you can ensure networking and security stack instances complete deployment before application stack instances begin, preventing deployment failures due to missing dependencies.
StackSets includes built-in cycle detection to prevent circular dependencies and provides error messages to help resolve configuration issues. This feature is available at no additional cost in all AWS Regions where CloudFormation StackSets is available.
Learn more:
We introduced the AWS Infrastructure-as-Code (IaC) MCP Server, bridging AI assistants with your AWS infrastructure development workflow. Built on the Model Context Protocol (MCP), this server enables AI assistants like Kiro CLI, Claude, or Cursor to help you search CloudFormation and CDK documentation, validate templates, troubleshoot deployments, and follow best practices, all while maintaining the security of local execution.
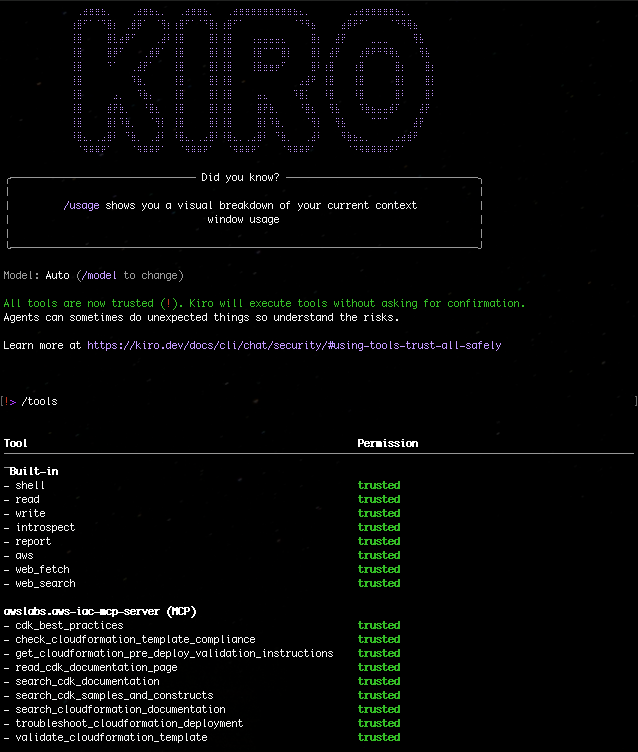
Figure 1: Kiro-CLI with AWS IaC MCP server
The IaC MCP Server provides nine specialized tools organized into two categories. Remote documentation search tools connect to AWS knowledge bases to retrieve up-to-date information about CloudFormation resources, CDK APIs, and implementation guidance. Local validation and troubleshooting tools run entirely on your machine, performing syntax validation with cfn-lint, security checks with CloudFormation Guard, and deployment failure analysis with integrated CloudTrail events.
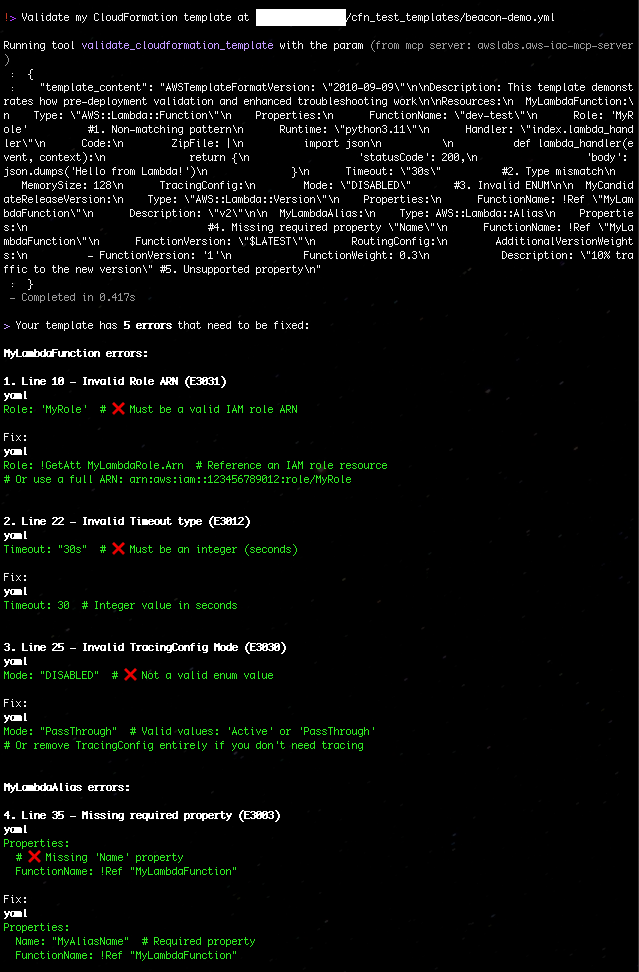
Figure 4: Validate my CloudFormation template with AWS IaC MCP Server
Instead of manually searching through documentation, ask your AI assistant natural language questions:
“How do I create an S3 bucket with encryption enabled in CDK?”
The server searches CDK best practice and samples, returning relevant code examples and explanations.
2. Proactive Template Validation
Before deploying infrastructure changes:
User: “Validate my CloudFormation template and check for security issues”
AI Agent: [Uses validate_cloudformation_template and check_cloudformation_template_compliance]
“Found 2 issues: Missing encryption on EBS volumes,
and S3 bucket lacks public access block configuration”
3. Rapid Deployment Troubleshooting
When a stack deployment fails:
User: “My stack ‘stack_03’ in us-east-1 failed to deploy. What happened?”
AI Agent: [Uses troubleshoot_stack_deployment with CloudTrail integration]
“The deployment failed due to insufficient IAM permissions.
CloudTrail shows AccessDenied for ec2:CreateVpc.
You need to add VPC permissions to your deployment role.”
4. Learning and Exploration
New to AWS CDK? The server helps you discover constructs and patterns:
User: “Show me how to build a serverless API”
AI Agent: [Searches CDK constructs and samples]
“Here are three approaches using API Gateway + Lambda…”
Learn more: Detailed Blog Post
Here are some resources to help you get started learning and using CloudFormation to manage your cloud infrastructure:
As we begin 2026, our focus remains on making infrastructure deployment faster, safer, and more manageable. The launches in 2025 reflect our commitment to solving real customer challenges and improving the CloudFormation developer experience. From intelligent IDE integrations to AI-powered assistance, these capabilities help you build infrastructure with greater confidence and efficiency.
We encourage you to try these features and share your feedback. For detailed information about any of these launches, visit our documentation or check out the AWS DevOps Blog.
Post Syndicated from xkcd.com original https://xkcd.com/3200/
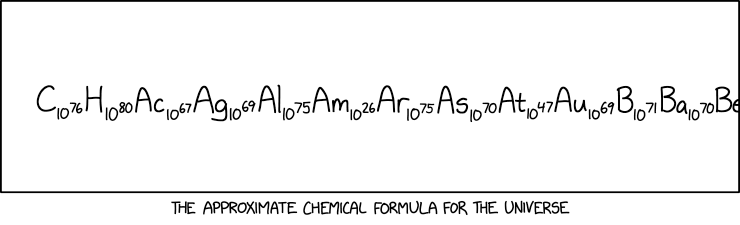
Post Syndicated from Patrick Kennedy original https://www.servethehome.com/asrock-rack-4uxgm-gnr2-cx8-review-featuring-a-new-nvidia-pcie-architecture/
In our ASRock Rack 4UXGM-GNR2 CX8 review, we see what one of the coolest new AI servers offers with high-end NVIDIA ConnectX-8 networking
The post ASRock Rack 4UXGM-GNR2 CX8 Review Featuring a New NVIDIA PCIe Architecture appeared first on ServeTheHome.
Post Syndicated from Siddharth Gupta original https://aws.amazon.com/blogs/big-data/get-started-faster-with-one-click-onboarding-serverless-notebooks-and-ai-agents-in-amazon-sagemaker-unified-studio/
Data teams today struggle with fragmented tools, complex infrastructure provisioning, and hours spent writing boilerplate code to connect to data sources. This forces analysts, data scientists, and engineers to work in separate environments, which slows collaboration and time to insight. Since our launch of Amazon SageMaker Unified Studio in March 2025, leading companies such as Bayer, NatWest, and Carrier have adopted it to bring their data teams into one collaborative workspace with unified tools, straightforward infrastructure provisioning, and fast connections to data sources.
Continuing our mission to provide faster time-to-value for customers, in November 2025, we announced Amazon SageMaker notebooks, a serverless workspace with a built-in AI agent in Amazon SageMaker Unified Studio. You can now launch a notebook in seconds, generate code from natural language prompts, and connect automatically to data across Amazon Simple Storage Service (Amazon S3), Amazon Redshift, third-party databases, and more from a single environment without needing to pre-provision or tune data processing infrastructure. Inside these serverless notebooks, analysts can perform SQL queries, data scientists can execute Python code, and data engineers can process large-scale data jobs in Spark within a single workspace. Together with the new one-click onboarding available for SageMaker Unified Studio, customers can go from their existing AWS data to running analytics and machine learning workloads much faster, spending their time on analysis rather than setup and configuration.
In this post, we walk you through how these new capabilities in SageMaker Unified Studio can help you consolidate your fragmented data tools, reduce time to insight, and collaborate across your data teams. Here’s a short demo of the new capabilities:
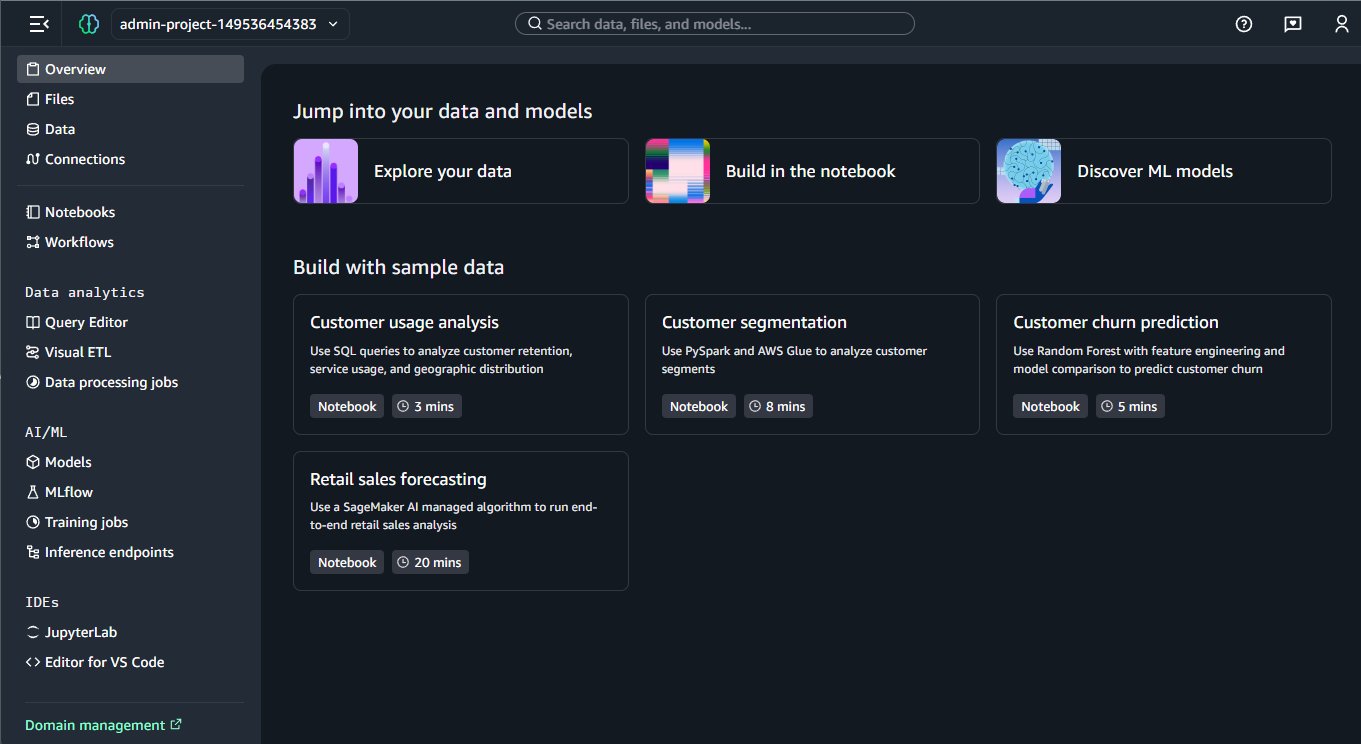
Get started exploring your data with one-click onboarding that provisions and configures environments in minutes instead of weeks. The new onboarding experience can reuse existing AWS Identity and Access Management (IAM) roles to provide access to SageMaker Unified Studio, automatically connecting to data sources across S3 buckets, S3 Tables, AWS Glue Data Catalog, and AWS Lake Formation policies, removing the need for additional data permission setup. Under the covers, a new IAM-based domain and project are created with default notebook and compute resources preconfigured. When complete, you enter SageMaker Unified Studio with all your tools available in the left-side navigation along with built-in samples to accelerate first use, as seen in the following screenshot.
“New features with Amazon Sagemaker will unlock a new paradigm of innovation, allowing Codex to significantly accelerate time-to-value for our customers, and transform them from aging to agentic in weeks, not months.“
– Abhinav Sharma, Chief Data Officer, Codex
You can start directly from Amazon SageMaker, Amazon Athena, Amazon Redshift, or Amazon S3 Tables, giving them a fast path from their existing tools and data to the unified experience in SageMaker Unified Studio. After you choose Get Started and specify an IAM role, SageMaker automatically creates a project with the existing data permissions intact from Data Catalog, Lake Formation, and Amazon S3. As a result, teams can immediately discover and act on their data using the existing data permissions and infrastructure.
For more information, see New one-click onboarding and notebooks with a built-in AI agent in Amazon SageMaker Unified Studio
The fully managed, web-based notebooks in SageMaker Unified Studio support multiple programming languages, letting you write Python, SQL, and Spark code in the same notebook. The infrastructure adjusts automatically based on your workload, while built-in libraries create charts and insights directly in your workflow. When your analysis scales beyond interactive queries to large-scale data processing, Amazon Athena for Apache Spark engine delivers optimized performance, integrating with the serverless notebook experience to execute analytical workloads efficiently. This serverless approach eliminates the need to provision clusters or maintain servers, reducing the time from question to insight.
“The new SageMaker interface brings clarity and speed to the entire ML lifecycle. Its developer-friendly design has made our experimentation and delivery significantly faster,“
– Sachin Mittal, Product Manager at Deloitte.
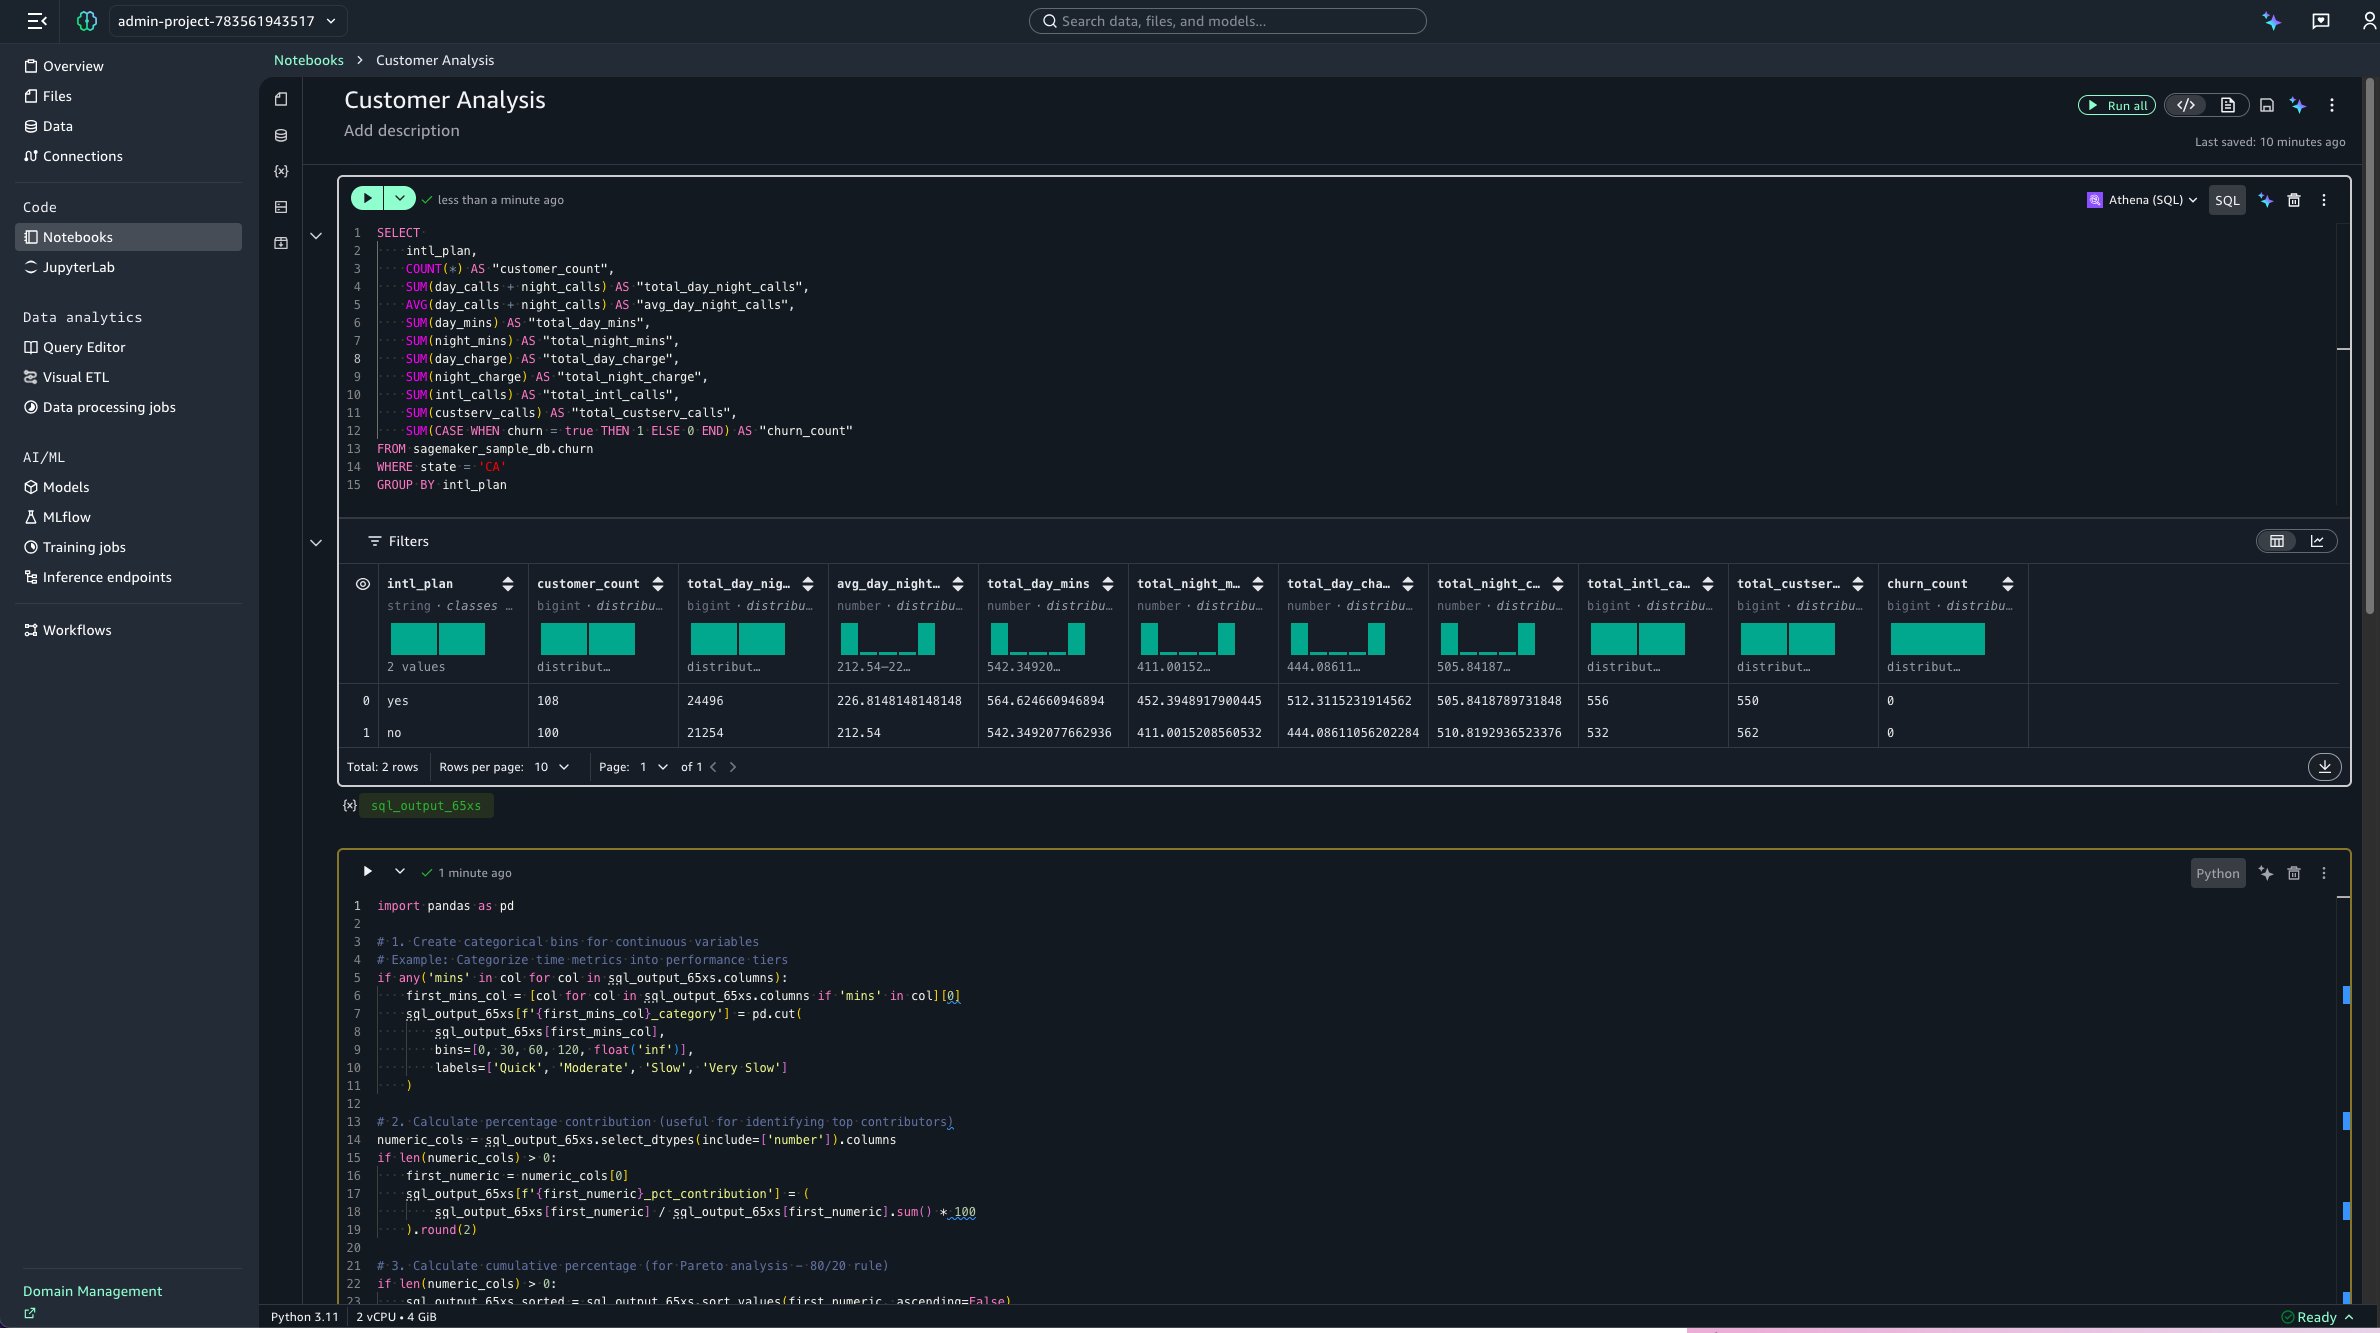
As shown in the preceding image, the notebook gives data engineers, analysts, and data scientists one place to perform SQL queries, execute Python code, process large-scale data jobs, run machine learning workloads, and create visualizations without having to switch between tools.
To accelerate development further, the new SageMaker Data Agent helps create SQL, Python, or Spark code using natural language prompts. Instead of spending hours writing boilerplate code to connect to your data sources and understand schemas, you can describe what you want to accomplish. The agent analyzes data catalog metadata about your available datasets, schemas, and relationships to provide context-aware assistance.
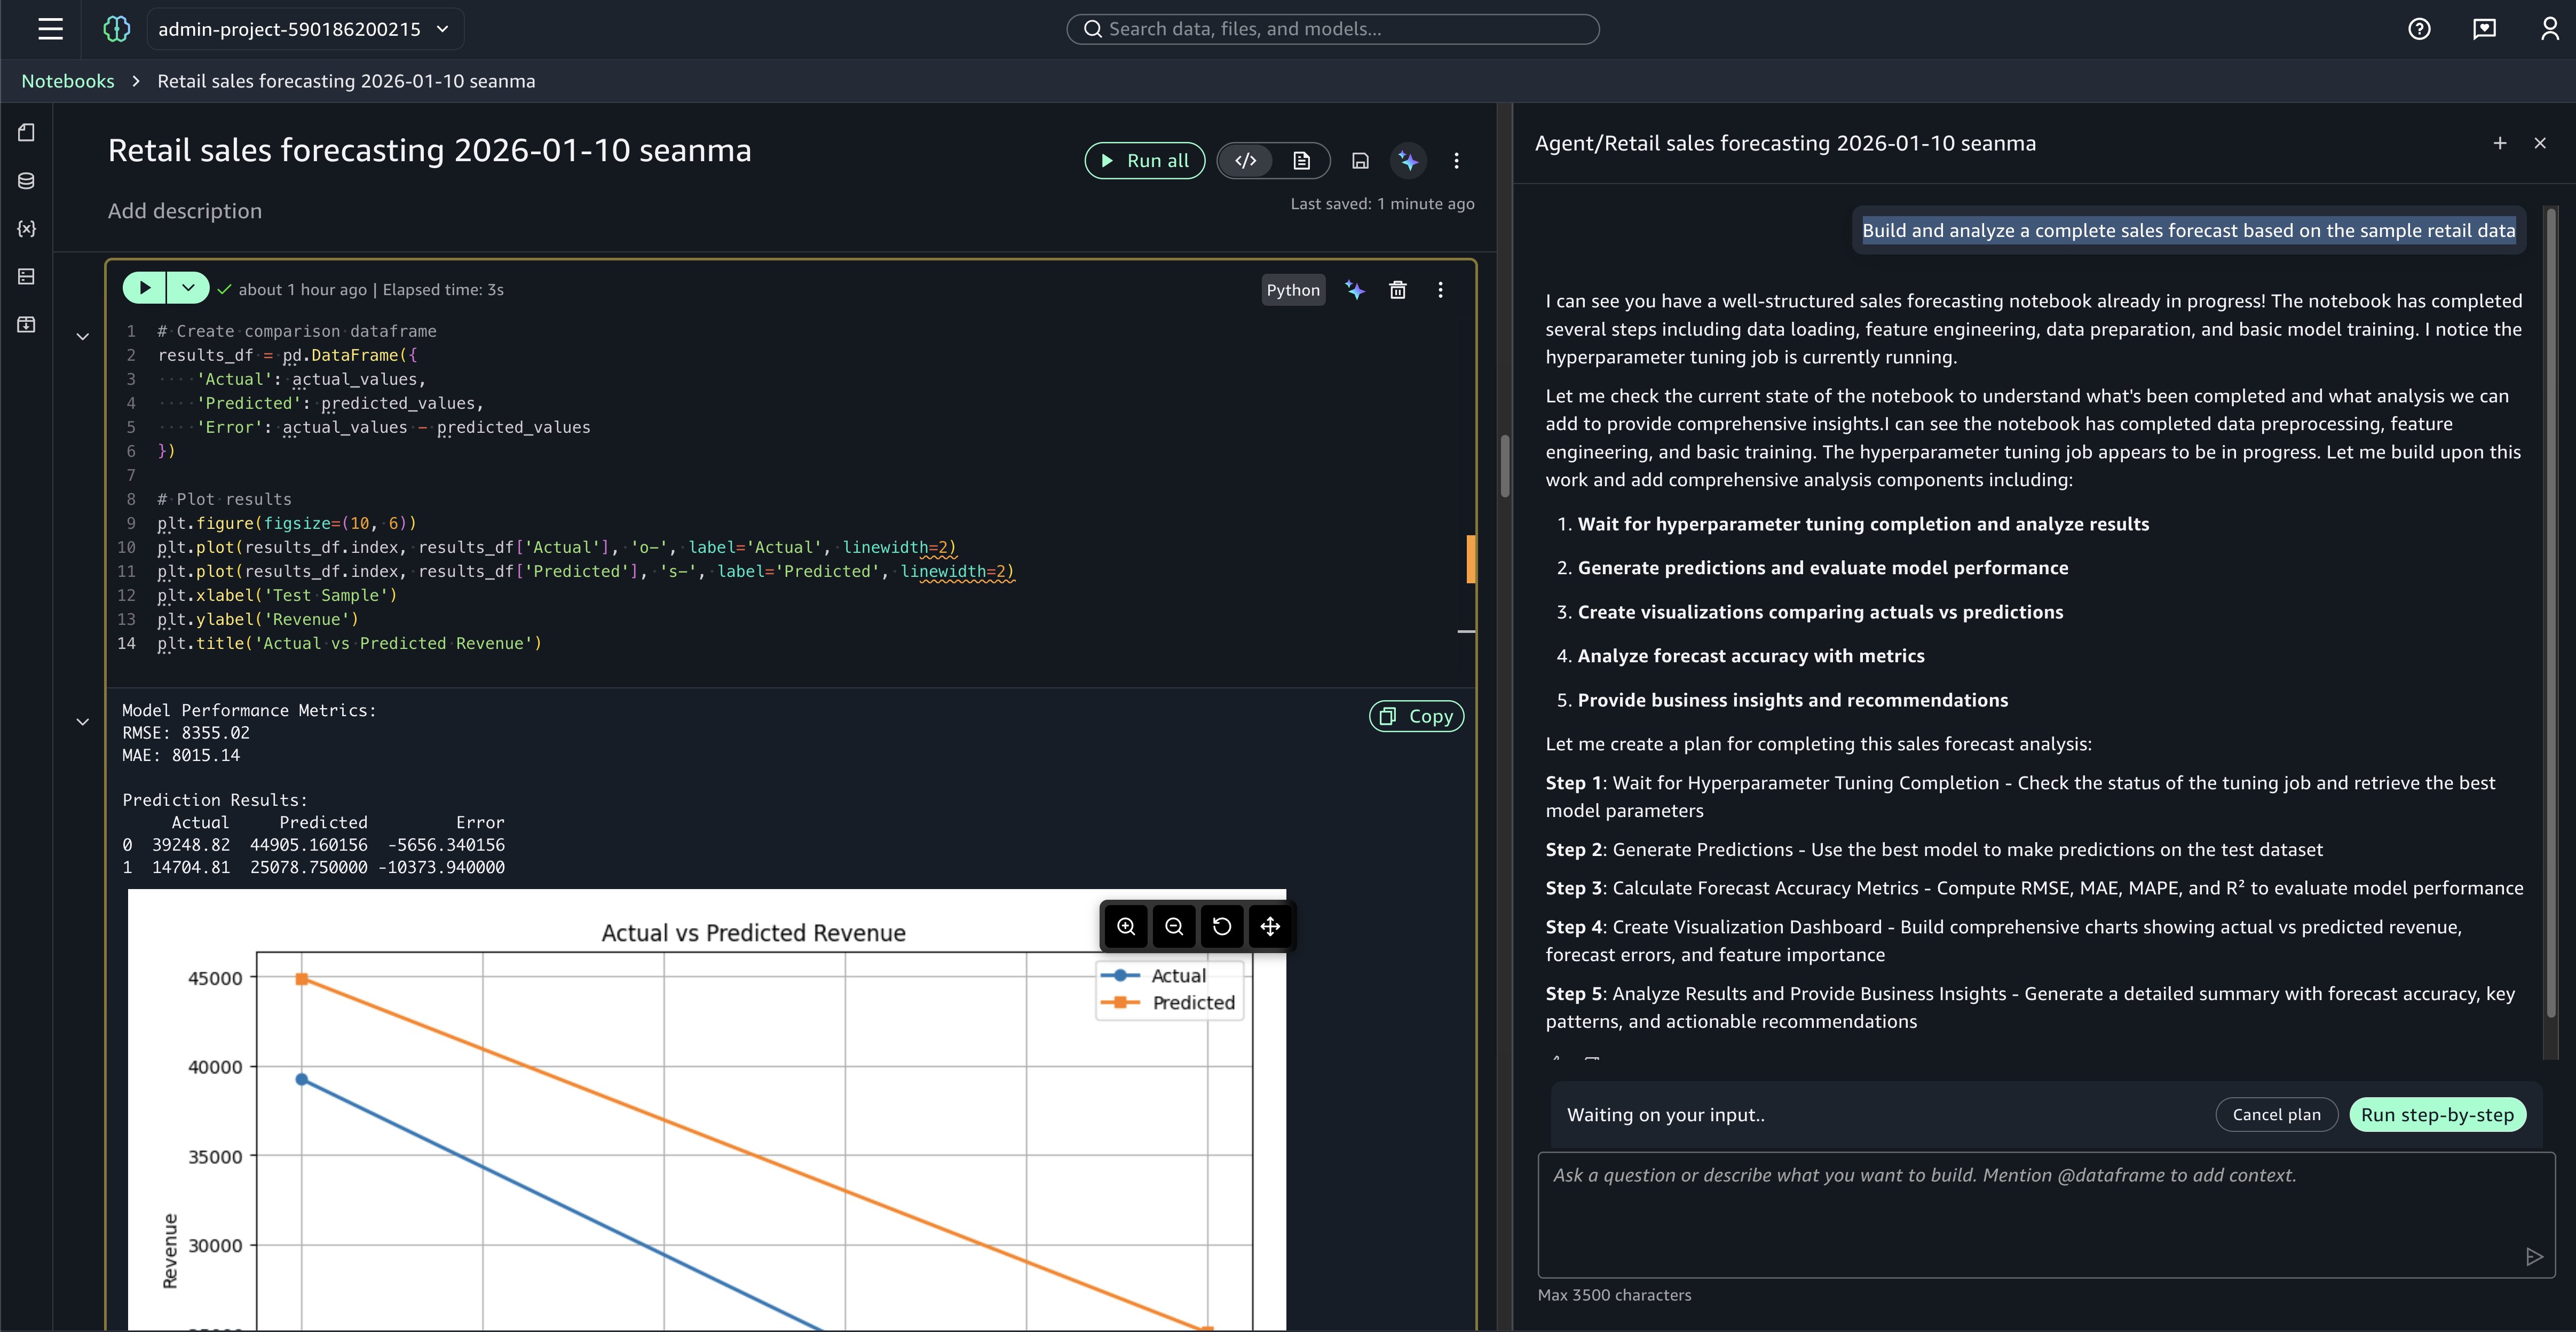
In the preceding example image, if you prompt Build and analyze a complete sales forecast based on the sample retail data, the agent helps identify the relevant tables and suggests the appropriate joins and analysis approach, transforming what might take hours into minutes. To try this yourself, navigate to the Overview tab in your SageMaker Studio environment and look for the Retail Sales Forecasting with SageMaker XGBoost notebook in the sample notebooks collection—these examples are automatically available when you first set up SageMaker Studio. The agent breaks down complex analytical workflows into manageable, executable steps, so you can move from question to insight faster.
In this post, we focused on three new SageMaker Unified Studio capabilities recently made available, but they’re a fraction of the more than 40 launches last year. Here’s a list of videos of re:Invent sessions and the measurable results from leading organizations adopting SageMaker Unified Studio, including:
Using Amazon SageMaker Unified Studio serverless notebooks, AI-assisted development, and unified governance, you can speed up your data and AI workflows across data team functions while maintaining security and compliance. To learn more visit the SageMaker product page or get started in the SageMaker console.
Post Syndicated from Adam Nemeth original https://aws.amazon.com/blogs/security/file-integrity-monitoring-with-aws-systems-manager-and-amazon-security-lake/
Customers need solutions to track inventory data such as files and software across Amazon Elastic Compute Cloud (Amazon EC2) instances, detect unauthorized changes, and integrate alerts into their existing security workflows.
In this blog post, I walk you through a highly scalable serverless file integrity monitoring solution. It uses AWS Systems Manager Inventory to collect file metadata from Amazon EC2 instances. The metadata is sent through the Systems Manager Resource Data Sync feature to a versioned Amazon Simple Storage Service (Amazon S3) bucket, storing one inventory object for each EC2 instance. Each time a new object is created in Amazon S3, an Amazon S3 Event Notification triggers a custom AWS Lambda function. This Lambda function compares the latest inventory version with the previous one to detect file changes. If a file that isn’t expected to change has been created, modified, or deleted, the function creates an actionable finding in AWS Security Hub. Findings are then ingested by Amazon Security Lake in a standard OCSF format, which centralizes and normalizes the data. Finally, the data can be analyzed using Amazon Athena for one-time queries, or by building visual dashboards with Amazon QuickSight and Amazon OpenSearch Service. Figure 1 summarizes this flow:
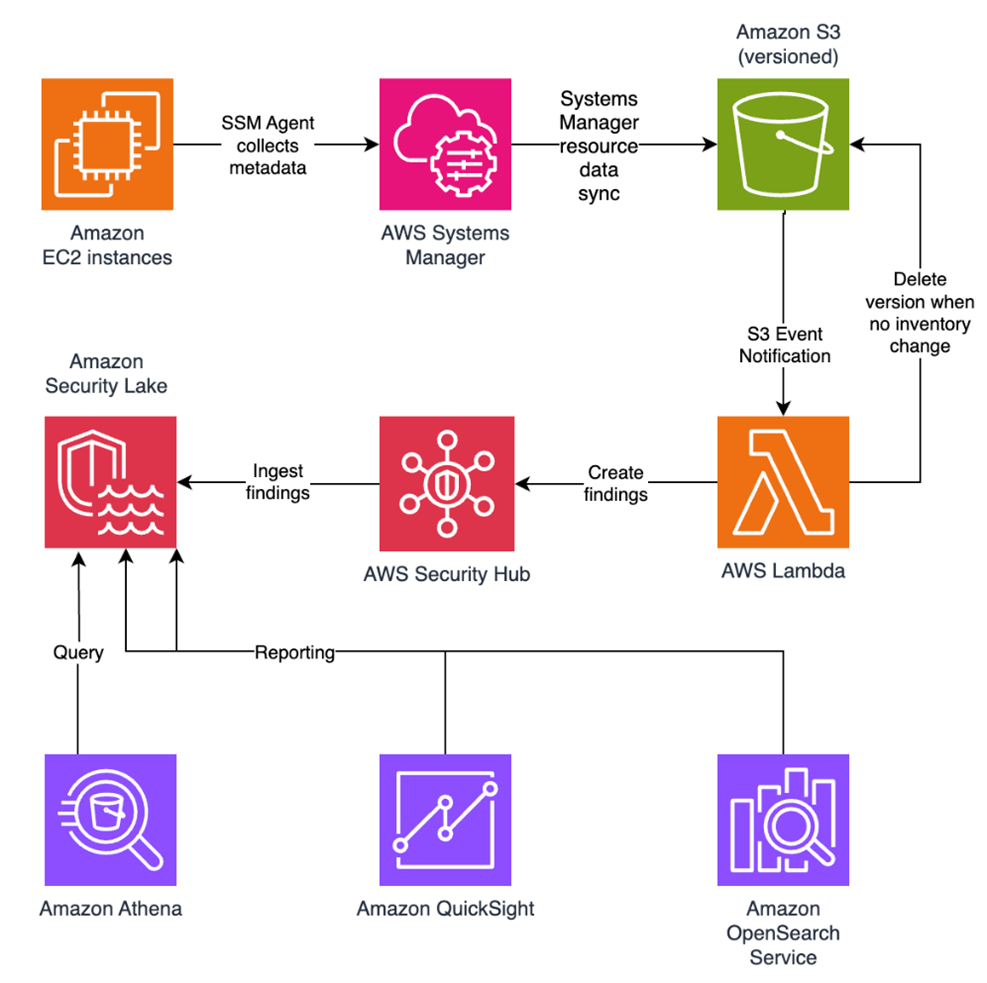
Figure 1: File integrity monitoring workflow
This integration offers an alternative to the default AWS Config and Security Hub integration, which relies on limited data (for example, no file modification timestamps). The solution presented in this post provides control and flexibility to implement custom logic tailored to your operational needs and support security-related efforts.
This flexible solution can also be used with other Systems Manager Inventory metadata, such as installed applications, network configurations, or Windows registry entries, enabling custom detection logic across a wide range of operational and security use cases.
Now let’s build the file integrity monitoring solution.
Before you get started, you need an AWS account with permissions to create and manage AWS resources such as Amazon EC2, AWS Systems Manager, Amazon S3, and Lambda.
Start by launching an EC2 instance and creating a file that you will later modify to simulate an unauthorized change.
Create an AWS Identity and Access Management (IAM) role to allow the EC2 instance to communicate with Systems Manager:
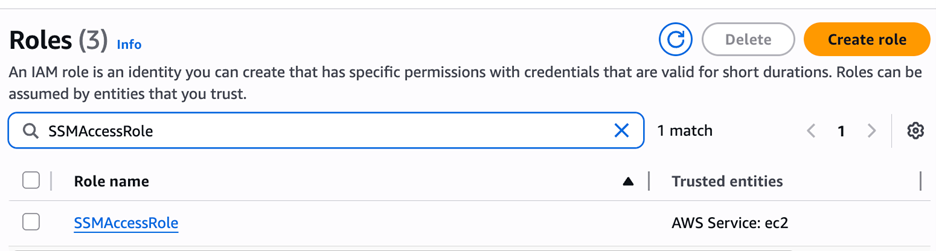
Figure 2: Create an IAM role for communication with Systems Manager
Start an EC2 instance:
/etc/paymentapp/ folder on the EC2 instance. Later, you will modify it to demonstrate a file-change event for integrity monitoring. To create this file during EC2 startup, copy and paste the following script into User data.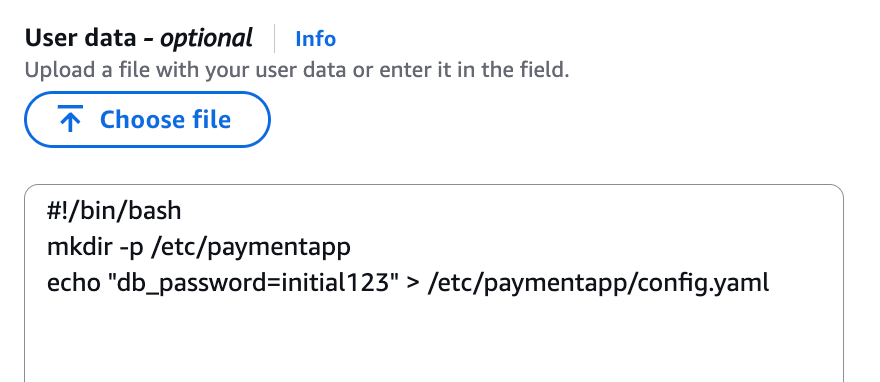
Figure 3: Adding the application configuration file
If Security Hub and Security Lake are already enabled, you can skip to Step 3.
To start, enable Security Hub, which collects and aggregates security findings. AWS Security Hub CSPM adds continuous monitoring and automated checks against best practices.
Note: For this demo, you don’t need the Security standards options and can clear them.
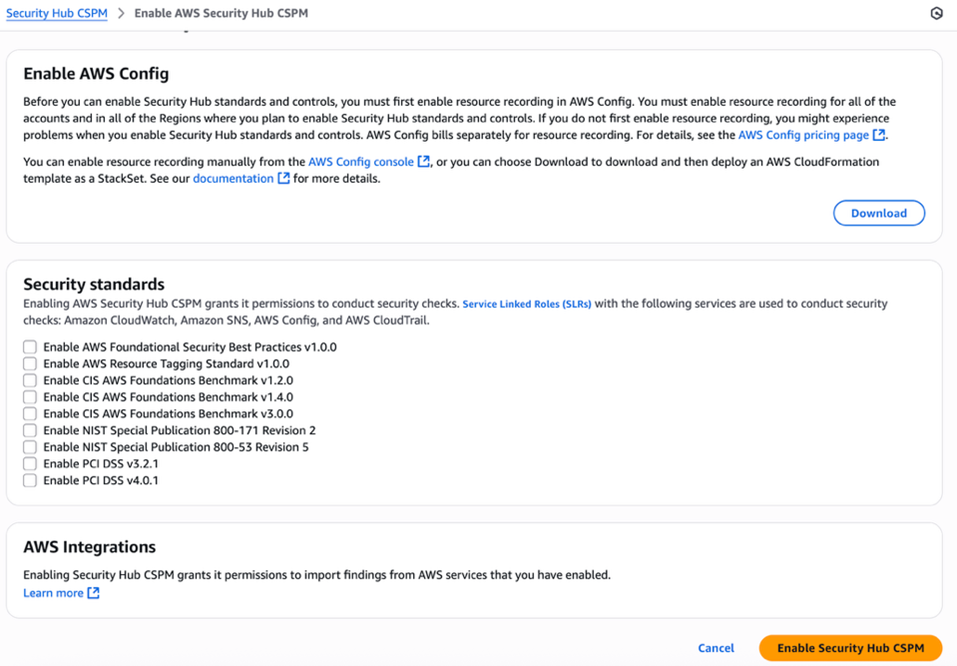
Figure 4: Enable Security Hub CSP
Next, activate Security Lake to start collecting actionable findings from Security Hub:
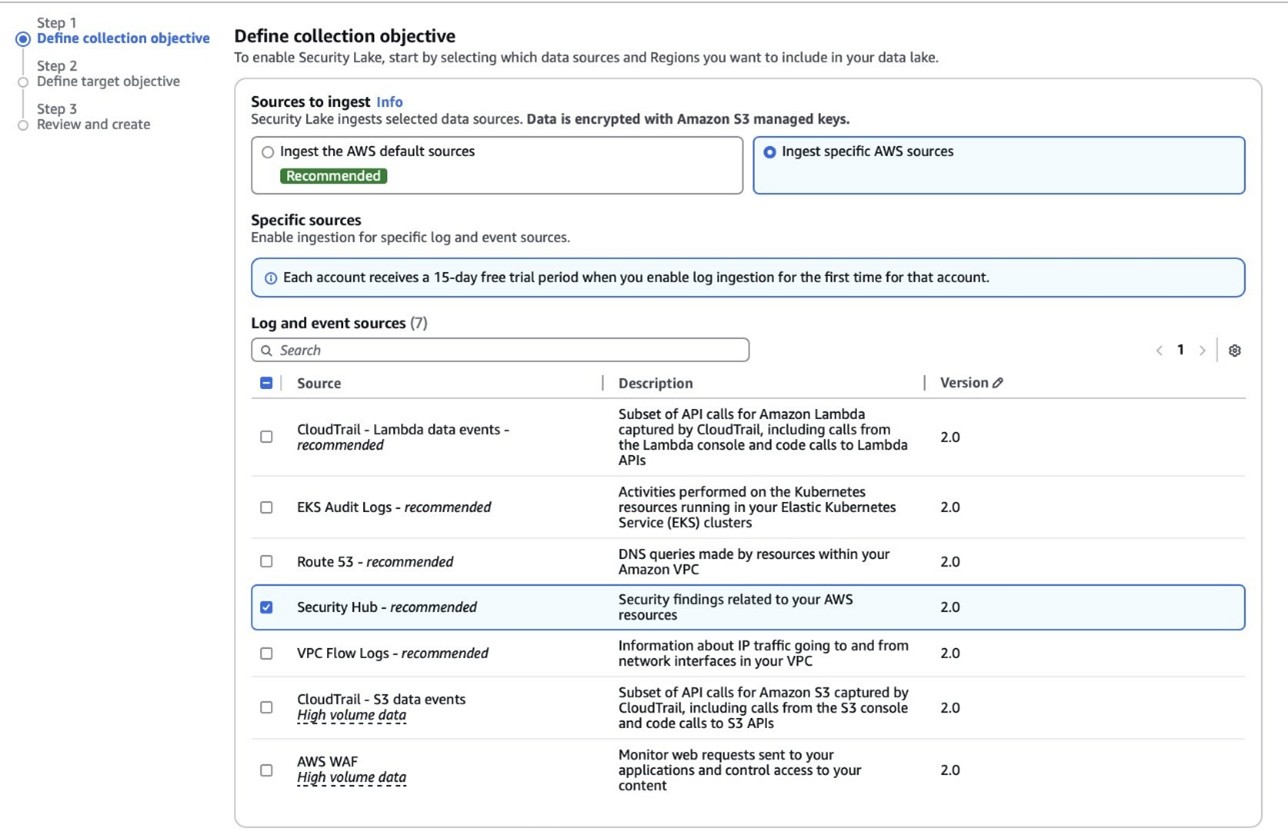
Figure 5: Select log and event sources
With Security Hub and Security Lake enabled, the next step is to enable Systems Manager Inventory to collect file metadata and configure a Resource Data Sync to export this data to S3 for analysis.
Note: In production, enable S3 server access logging on the inventory bucket to keep an audit trail of access requests, enforce HTTPS-only access, and enable CloudTrail data events for S3 to record who accessed or modified inventory files.
The next step is to enable Systems Manager Inventory and set up the resource data sync:
/etc/paymentapp/.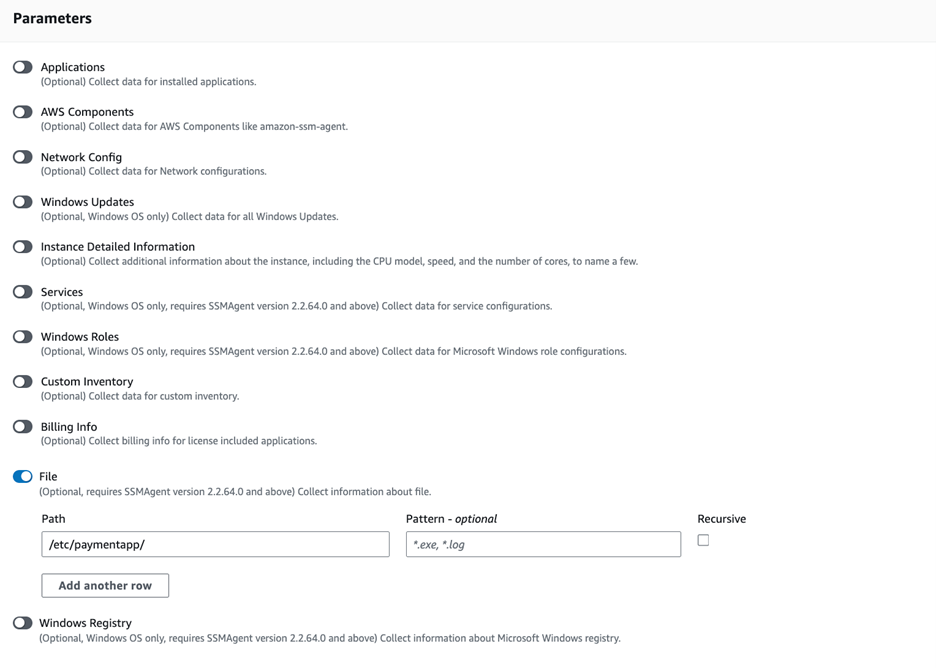
Figure 6: Set the parameters and path
Next, complete the setup to detect changes and create findings. Each time Systems Manager Inventory writes a new object to Amazon S3, an S3 Event Notification triggers a Lambda function that compares the latest and previous object versions. If it finds created, modified, or deleted files, it creates a security finding. To accomplish this, you will create the Lambda function, set its environment variables, add the helper layer, and attach the required permissions.
The following is an example finding generated in AWS Security Finding Format (ASFF) and sent to Security Hub. In this example, you see a notification about a file change on the EC2 instance listed under the Resources section.
This function detects file changes, reports findings, and removes unused Amazon S3 object versions to reduce costs.
fim-change-detector.Note: In production, set Lambda reserved concurrency to prevent unbounded scaling, configure a dead letter queue (DLQ) to capture failed invocations, and optionally attach the function to an Amazon VPC for network isolation.
Configure the two required environment variables in the Lambda console. These two variables (one for critical paths to monitor and one for security finding severity) must be set or the function will fail.
^/etc/paymentapp/config.*$ as the value.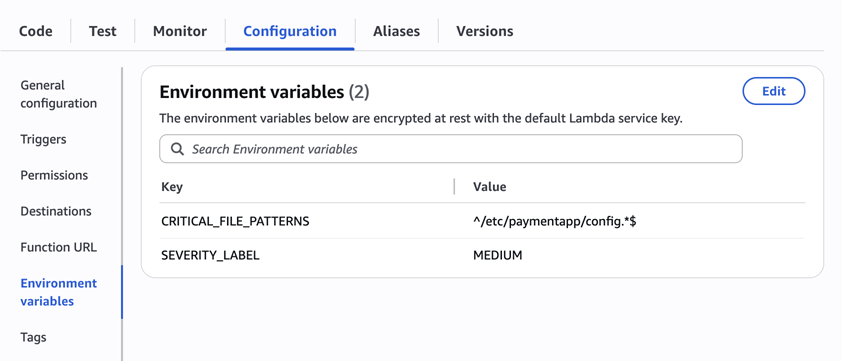
Figure 7: CRITICAL_FILE_PATTERNS and SEVERITY_LABEL configuration
The next step is to attach permissions to the Lambda function
<bucket-name> with the name of your S3 bucket, and you also update <region> and <account-id> with your AWS Region and Account ID:For better modularity, add some helper functions to a Lambda layer. These functions are already referenced in the import section of the preceding Lambda function’s Python code. The helper functions check critical paths, load file metadata, compare modification times, and extract the EC2 instance ID.
Open AWS CloudShell from the top-right corner of the AWS console header, then copy and paste the following script and press Enter. It creates the helper layer and attaches it to your Lambda function.
Finally, set up S3 Event Notifications to trigger the Lambda function when new inventory data arrives.
AWS%3AFile/ to limit Lambda triggers to file inventory objects only.%3A.In this example, inventory collection runs every 30 minutes (48 times each day) but can be adjusted based on security requirements to optimize costs. The Lambda function is triggered once for each instance whenever a new inventory object is created. You can further reduce event volume by filtering EC2 instances through S3 Event Notification prefixes, enabling focused monitoring of high-value instances.
Now that the EC2 instance is running and the sample configuration file /etc/paymentapp/config.yaml has been initialized, you’re ready to simulate an unauthorized change to test the file integrity monitoring setup.
echo “db_password=hacked456" | sudo tee /etc/paymentapp/config.yaml
This simulates a configuration tampering event. During the next Systems Manager Inventory run, the updated metadata will be saved to Amazon S3.
To manually trigger this:
AWS:File folder and review the inventory object and its versions.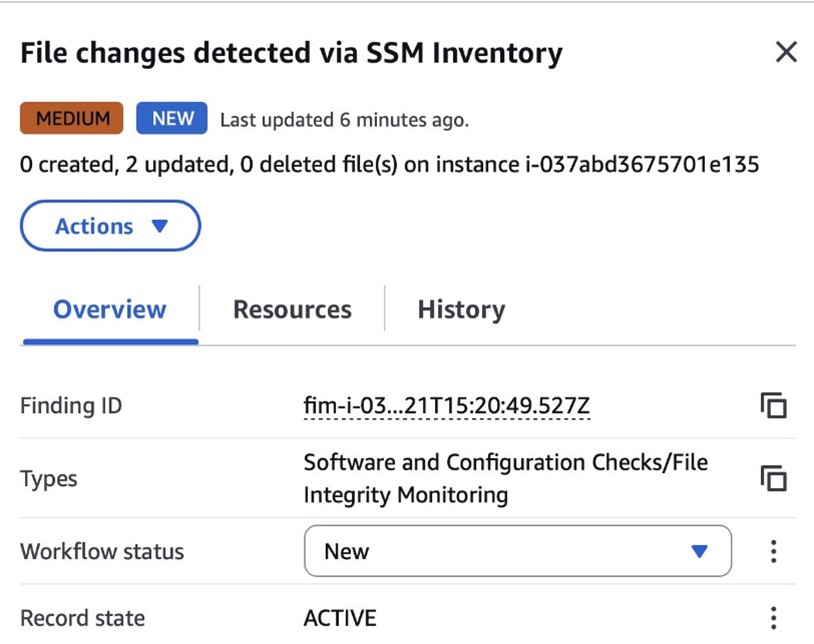
Figure 8: View file change findings
While Security Hub provides a centralized view of findings, you can deepen your analysis using Amazon Athena to run SQL queries directly on the normalized Security Lake data in Amazon S3. This data follows the Open Cybersecurity Schema Framework (OCSF), which is a vendor-neutral standard that simplifies integration and analysis of security data across different tools and services.
The following is an example Athena query:
Note: Be sure to adjust the FROM clause for other Regions. Security Lake processes findings before they appear in Athena, so expect a short delay between ingestion and data availability.
You will see a similar result for the preceding query, shown in Figure 9:

Figure 9: Athena query result in the Amazon Athena query editor
Security Lake classifies this finding as an OCSF 2004 Class, Detection Finding. You can explore the full schema definitions at OCSF Categories. For more query examples, see the Security Lake query examples.
For visual exploration and real-time insights, you can integrate Security Lake with OpenSearch Service and QuickSight, both of which now offer extensive generative AI support. For a guided walkthrough using QuickSight, see How to visualize Amazon Security Lake findings with Amazon QuickSight.
After testing the step-by-step guide, make sure to clean up the resources you created for this post to avoid ongoing costs.
In this post, you learned how to use Systems Manager Inventory to track file integrity, report findings to Security Hub, and analyze them using Security Lake.
You can access the full sample code to set up this solution in the AWS Samples repository.
While this post uses a single-account, single-Region setup for simplicity, Security Lake supports collecting data across multiple accounts and Regions using AWS Organizations. You can also use a Systems Manager resource data sync to send inventory data to a central S3 bucket.
Getting Started with Amazon Security Lake and Systems Manager Inventory provides guidance for enabling scalable, cloud-centric monitoring with full operational context.
Post Syndicated from Colin Carson original https://aws.amazon.com/blogs/big-data/create-a-customizable-cross-company-log-lake-part-ii-build-and-add-amazon-bedrock/
In Part I, we introduced the business background behind Log Lake. In this post, we describe how to build it, and how to add model invocation logs from Amazon Bedrock.
The original use case of Log Lake was to join AWS CloudTrail logs (with StartSession API calls) with Amazon CloudWatch logs (with session keystrokes from within Session Manager, a capability of AWS Systems Manager), to help a manager review an employee’s use of elevated permissions to determine if the use was appropriate. Because there might be only one event of elevated privileges in millions or billions of rows of log data, finding the right row to review was like looking for a needle in a haystack.
Log Lake is not just for Session Manager, but also general purpose CloudTrail and CloudWatch logs. After adding CloudWatch and CloudTrail logs to raw tables at scale, you can set up AWS Glue jobs to process the many tiny JSON files of raw tables into bigger binary files for “readready” tables. Then, these readready tables could be queried with different filters to answer questions for many use cases, such as legal or regulatory reviews for compliance, deep forensic investigations for security, or auditing. Log Lake is an answer to the question “Are there logs, and if so, how do I get them?”
Log Lake is a data lake for compliance-related use cases, uses CloudTrail and CloudWatch as data sources, has separate tables for writing (original in raw JSON file format) and reading (read-optimized readready in transformed Apache ORC file format), and gives you control over the components so you can customize it for yourself.
The following diagram shows the system architecture.
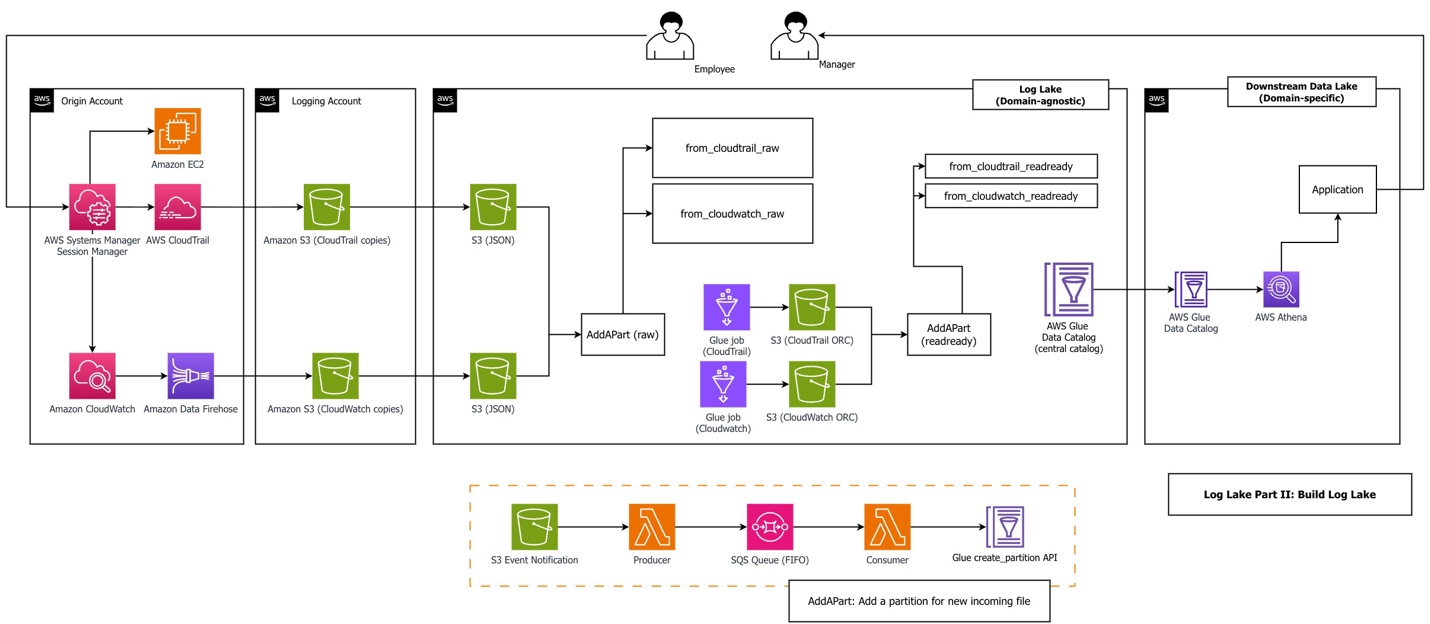
The workflow consists of the following steps:
sts:SetSourceIdentity in the role trust policy). Our AWS Glue jobs filtered on this field to reduce cost and improve performance.StartSession) and CloudWatch records session data from within the service (sessionData). Sample CloudTrail and CloudWatch log files are in the GitHub repository, generated from a real Systems Manager session. We recommend you upload these files in your first deployment, but alternatively, you can generate your own data files.eventsource='ssm.amazonaws.com') were copied to generate a total population of JSON files over 500 GB. First, a JSON table was created. Then two additional tables were created using Athena CTAS: one for ORC ZLIB, and one for Parquet Snappy. Tests compared three subsequent query durations for three different workloads across ORC vs. Parquet.Log Lake uses multiple services together:
The architecture of Log Lake includes the following design choices:
The concept of raw and readready tables represents two distinct approaches to data storage and processing, each serving different purposes in a data architecture:
Part I contains our comparison of performance, cost, and convenience of both table layers.
Log Lake uses an event-based, asynchronous invocation approach to add partitions to raw tables. We call this approach “AddAPart with LoLLs” (Lots of Little Lambdas). It is optimized for adding new incoming files in text format to existing Hive tables as fast as possible, with the following assumptions:
The AddAPart function consists of five steps:
The following are some ways we have used AddAPart:
Both Log Lake jobs are what we call “many view” AWS Glue jobs, which use createOrReplaceTempView from Spark, using code like the following:
We have used this approach to address the following antipatterns:
You can tell AWS Glue jobs to look at a maximum of n days or n rows with custom bounds, which we implement using Spark Data Frames as follows:
Also, jobs can prune data using table partitions (and use partition indexes). This helps you prepare routine mechanisms up front that are ready to run and recover from missing data by running relative backfill jobs until data is up to date.
Complete the following prerequisite steps to implement this solution:
log_lake to the S3 bucket.To build Log Lake, follow the deployment steps in the how_to_deploy.md file in the repo.
After deployment is complete, you can upload demo data files and run the AWS Glue jobs to demo how to answer the question, “Who did what in session manager?” For this, switch over to the how_to_demo.md file and follow the steps.
When you are done, you should see the following tables in the Data Catalog:
You can view them on the AWS Glue console or query them directly in Athena. The following is a sample query from the repository that shows how to join both tables to get API activity from CloudTrail and join it to session data (keystrokes) from CloudWatch:
Adding Bedrock model invocation logs to Log Lake is important to enable human review of agent actions with elevated permissions. Some examples of the need for human oversight are tool use, computer use, agentic misalignment, and high impact AI in federal agencies. If you have not considered this use case and are using LLMs, we urge you to review Amazon Bedrock logs and consider either a managed product or a self-built data lake like Log Lake.
In this post, we use “agentic” and “agent” to refer to a large language model (LLM) using tools with some autonomy to iterate toward a goal.
To generate model invocation logs for this post, we created a custom Lambda function to ask Anthropic’s Claude 4.5 to list files in a bucket using a tool. We used this as a plausible future scenario where a human might need to review an agent’s actions and logs to decide if an agent’s tool use was appropriate.
The following diagram shows the components involved.
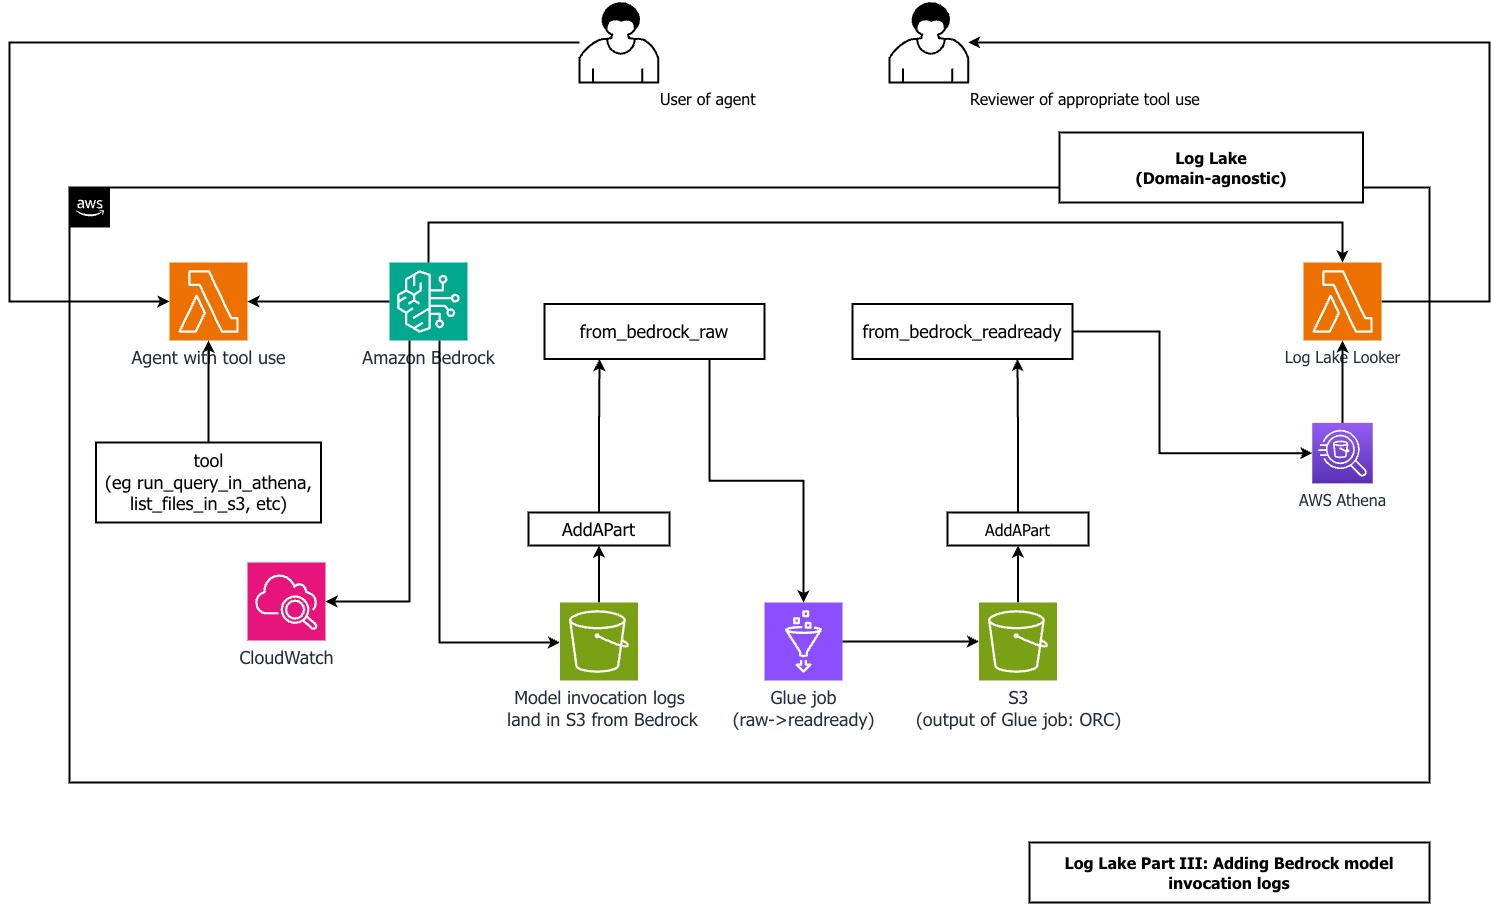
For logging inputs and outputs of LLMs running on Bedrock, refer to Monitor model invocation using CloudWatch Logs and Amazon S3. For simplicity, we avoided CloudWatch logs and set up logging directly to Amazon S3.
For logging API activity for Amazon Bedrock, refer to Monitor Amazon Bedrock API calls using CloudTrail.
We have included examples of the CloudTrail and CloudWatch files from Amazon Bedrock model invocation logs in the repository.
Before you create the model invocation logs, make sure you have created the from_cloudtrail_readready table from the previous steps.
Follow the steps in the GItHub repo to add Amazon Bedrock model invocation logs to Log Lake. When done, you should have the tablereplace_me_with_your_database.from_bedrock_readready.
You can query this table using Athena and join it to from_cloudtrail_readready, using SQL like the following example from the repo:
The predefined query we used in our demo is what we used when we knew the needle in the haystack (tool_use in input messages), but this approach wouldn’t work for new, unknown patterns that require running SQL queries in multiple steps to understand complex data.
Our solution includes a method for an agent in Amazon Bedrock to review an agent in Amazon Bedrock. In this post’s repository, we include a Log Lake Looker Lambda function, which uses an LLM (Anthropic’s Claude) to talk to a database (the Log Lake AWS Glue database).
This pattern is not new. It has been described in 2024 in the paper DB-GPT: Empowering Database Interactions with Private Large Language Models as “a paradigm shift in database interactions, offering a more natural, efficient, and secure way to engage with data repositories.” This is an extension of an older idea from 1998: an interface to data was described in the Distributed Computing Manifesto as “the client is no longer dependent on the underlying data structure or even where the data is located.”
Using an agent to query Log Lake has multiple benefits:
You can ask Log Lake Looker an open-ended question and get an answer without writing a query. Log Lake Looker performs the following actions for you:
from_bedrock_readready table using a system prompt, like the Anthropic SQL sorcerer example.Log Lake Looker looks at small samples from from_bedrock_readready using more than one try. This means the model reflects on its output and can create a follow-up query based on query results. To learn more about this, we recommend reading about reflection and iterative refinement. We have seen useful responses from agents using iterative approaches, especially when context is managed (for example, a specific system prompt using one table only or a limit on conversational turns) and tool results are compacted.
We’ve seen the agent answer simple questions like “can you query my table and tell me what you find?” in less than 60 seconds more than 50% of the time, without optimizing for any specific question. The following are snippets of CloudWatch logs to show you what’s possible, using Anthropic’s Claude Sonnet 4.5:
Log Lake Looker should be reviewed by a human for appropriate tool use, because it has the same risks as the other agents using tools or a human with elevated privileges. Looker can review its own tool use, but human review is still needed.
There are security implications of allowing an agent to review model invocation logs: these logs can contain system prompts, sensitive data in responses, and user input in requests. Also, allowing an agent to generate SQL statements based on user input has additional risks specific to access to structured data, such as prompt injection, improper content, and proliferation of sensitive data.
We recommend a defense in depth (more than one layer) approach for tool use by a model. Log Lake Looker uses multiple layers of defensive measures:
select prior to sending to Athena. Because the query is from an assistant response to a user input (request), this relates to sanitizing and validating user inputs and model responses.glue:Get* actions only (no mutation, such as create, update, delete tables, partitions, or databases), for least-privilege permissions.To avoid incurring future charges, delete the stacks. The repository has shell scripts you can use to delete files in buckets, which is required before deleting buckets.
In this post, we showed you how to deploy Log Lake in a new AWS account to create two tables, from_cloudtrail_readready and from_cloudwatch_readready. These tables can answer the question “What did an employee do in Session Manager?” across large data volumes in seconds using Athena.
Additionally, we showed how to add a data source to an existing Log Lake: Amazon Bedrock model invocation logs in the form of from_bedrock_readready. This shows how Log Lake can be extended to answer questions such as “What tools did an agent use?” and “Was there inappropriate use, and why?”
Finally, we showed how to create and use Log Lake Looker, an agent using Lambda and Amazon Bedrock. Looker can query Log Lake for new unknown patterns as part of human-in-the-loop review, without writing SQL or remembering column names. You can make Log Lake your way. We encourage you to look through the repository and use it as inspiration for your own Log Lake. If you have questions or comments, please let us know!
Post Syndicated from Pinxi Tai original https://aws.amazon.com/blogs/big-data/secure-apache-spark-writes-to-amazon-s3-on-amazon-emr-with-dynamic-aws-kms-encryption/
When processing data at scale, many organizations use Apache Spark on Amazon EMR to run shared clusters that handle workloads across tenants, business units, or classification levels. In such multi-tenant environments, different datasets often require distinct AWS Key Management Service (AWS KMS) keys to enforce strict access controls and meet compliance requirements. At the same time, operational efficiency might drive these organizations to consolidate their data pipelines. Instead of running separate Spark jobs for each dataset, it could be more efficient to run a single job on Amazon EMR that processes inputs once and writes multiple outputs to Amazon Simple Storage Service (Amazon S3), each encrypted with its own KMS key.
Although consolidating multiple datasets in one Spark job reduces orchestration overhead and simplifies code maintenance, you might encounter challenges with encryption configurations. By default, the EMRFS and S3A file system clients cache their settings, which can cause encryption keys to persist incorrectly across writes. This means if you change the encryption key between writes to Amazon S3 in an Apache Hadoop environment, some output files can end up encrypted with unintended keys, leading to possible security and compliance concerns.
In this post, we show how to securely write data to Amazon S3 from Spark jobs running on Amazon EMR, while dynamically managing different KMS keys for encryption. We discuss three approaches to solve this challenge and how to choose the right solution for your use case.
When writing data to Amazon S3 from Amazon EMR, you can choose from multiple server-side encryption options. The two most commonly used options are:
When running Spark jobs on Amazon EMR, data writes to Amazon S3 occur through one of the following file system implementations:
Both implementations provide configuration properties to control server-side encryption. The following tables show how to specify the KMS key for SSE-KMS encryption.
For EMRFS (default in Amazon EMR versions below 7.10.0), refer to the following table.
| Property | Description |
| Enables server-side encryption. Defaults to SSE-S3 if no KMS key is provided. | |
| Specifies the KMS key ID or ARN for SSE-KMS encryption. |
For S3A (default in Amazon EMR starting from 7.10.0), refer to the following table.
| Property | Description |
| Specifies the encryption algorithm. | |
| Specifies the KMS key ID or ARN for SSE-KMS encryption. |
Starting from the Amazon EMR 7.10.0 release, the S3A file system has replaced EMRFS as the default EMR S3 connector. For more information, refer to Migration Guide: EMRFS to S3A Filesystem.
In practice, a unified Spark job might write outputs for multiple tenants or classifications in a single run. In this situation, applying the correct encryption key for each output is critical to maintaining compliance and enforcing isolation in multi-tenant S3 buckets without the complexity of managing separate Spark jobs for each dataset.
When Spark executors write to Amazon S3, they use a file system (EMRFS or S3A) client that is cached and reused for performance optimization. The problem is that each file system instance keeps the encryption settings it was first created with. Each executor’s Java Virtual Machine (JVM) creates and caches a file system (and its underlying S3 client) for a given S3 bucket. This cached instance, along with its encryption configuration, persists throughout the executor’s lifecycle. If you change the encryption key in Spark after some data has been written, the existing cached client can’t pick up the new key.
For example, the following PySpark code first creates a Spark session with S3 server-side encryption enabled. It then writes a DataFrame to two different folders within the same S3 bucket amzn-s3-demo-bucket1, but with different KMS keys. The first write operation writes the data to folder1 using kmsKey1 for encryption, and the second write operation writes to folder2 using kmsKey2.
You might expect files in folder1/ to use kmsKey1 and files in folder2/ to use kmsKey2. But due to caching, the second write can still use the client configured with kmsKey1. This leads to mixed or incorrect encryption key usage across outputs.
Our objective is to achieve correct encryption of each output S3 object with its intended KMS key, even when a single Spark job writes multiple outputs. To implement this, you can use one of the following approaches:
Each method offers a different balance of implementation complexity, performance, and flexibility. The following sections provide detailed implementation steps and considerations for each approach.
Disabling the file system cache forces Spark to create a new S3 client for each write, which applies the updated encryption settings. This can be done using a Spark configuration or EMR cluster settings.
The property name for disabling the cache depends on your URI scheme (s3:// or s3a://), not on your choice of file system (EMRFS or S3A). The following table summarizes which configuration property name you should use to disable the cache.
| Properties for s3:// URI scheme | Properties for s3a:// URI scheme |
To use this method, complete the following steps:
s3:// scheme, you can manually set spark.hadoop.fs.s3.impl.disable.cache=true, for example (PySpark):
Alternatively, you can use the following spark-defaults configuration classification:
For s3a:// scheme, you can manually set spark.hadoop.fs.s3a.impl.disable.cache=true, for example (PySpark):
Alternatively, you can use the following spark-defaults configuration classification:
core-site.xml to disable the file system cache globally at cluster level. You must configure the /etc/hadoop/conf/core-site.xml file on the primary nodes of your EMR cluster. For example, when creating or modifying the cluster, use the following configuration.s3:// scheme:
For s3a:// scheme:
spark.hadoop.fs.s3.enableServerSideEncryption=true for Spark applications only or use the following configuration to enable encryption at cluster level:
For S3A, set spark.hadoop.fs.s3a.encryption.algorithm=SSE-KMS for Spark applications only or use the following configuration to enable encryption at cluster level:
fs.s3.impl.disable.cache=true, you must also disable the EMRFS S3-optimized committer to avoid errors. You can do this by either manually setting spark.sql.parquet.fs.optimized.committer.optimization-enabled=false or using the following spark-defaults configuration classification:
For more information about configuring applications on EMR clusters, refer to Configure applications when you create a cluster and Reconfigure an instance group in a running cluster.
Use this method when you need to write data to an S3 bucket using multiple KMS keys within a single Spark application. This is a quick, straightforward implementation that works well for the following use cases:
Before implementation, consider the following performance impacts:
Although this method provides a pragmatic solution when splitting work into separate Spark applications isn’t feasible, we don’t recommend it for high-throughput or latency-sensitive production workloads. The increased API traffic can lead to higher costs and potential throttling. For production implementations, consider Method 2 and Method 3.
When writing data with multiple encryption keys, use a separate Spark application (or Spark session) for each distinct key. The file system needs to be initialized with the correct encryption key in a fresh JVM context when writing data with different keys. You can achieve this by either submitting a separate Spark application or starting a new Spark session. This enables the S3 client to be created with the intended encryption key.
Complete the following steps:
spark-submit commands. For example:
Use this method when you need a production-grade solution for applying different KMS keys at scale. This approach maintains file system caching benefits and works well for the following use cases:
This method creates fresh S3 clients with each new Spark application or session. Compared to Method 1, it offers several advantages:
Before implementation, consider the following trade-offs:
Choose this method when performance, cost predictability, and security isolation are more important than single-process simplicity.
Where possible, configure S3 bucket-level default encryption (SSE-KMS) with the desired KMS key to automatically encrypt objects written to that bucket.
Complete the following steps:
Use this method when your workloads can use a single KMS key per bucket. This approach works well for the following use cases:
This method provides several advantages:
Before implementation, consider the following limitations:
Choose this method when you need a simple, reliable approach that provides strong security while simplifying operational management.
Choose the method based on your workload’s security requirements, performance needs, and operational constraints:
In this post, we demonstrated how to handle multiple KMS keys when writing to Amazon S3 from Spark jobs on Amazon EMR. When encrypting multiple outputs with different encryption keys in a single Spark application, it’s important to consider the file system caching behavior. We presented several practical solutions with their respective trade-offs. You can start implementing these solutions in your environment by first testing the file system cache-disable method, which provides a straightforward approach to handling multiple encryption keys. As your workload grows, consider evolving to separate Spark sessions or S3 bucket default encryption based on your specific requirements. After implementing a solution, verify that each S3 object’s SSE-KMS key is the intended one (for example, by checking S3 object metadata). We also recommend measuring job performance and S3 API usage, especially for the cache-disable approach.