Security updates have been issued by Debian (firefox-esr), Fedora (firefox and vim), Red Hat (firefox), Slackware (mozilla), SUSE (firefox, firefox-esr, kernel, and podman), and Ubuntu (gpac, kernel, linux, linux-aws, linux-gcp, linux-gcp-5.15, linux-gke, linux-hwe-5.15, and redis).
Generative AI (GenAI) tools like GitHub Copilot and ChatGPT are rapidly changing how programming is taught and learnt. These tools can solve assignments with remarkable accuracy. GPT-4, for example, scored an impressive 99.5% on an undergraduate computer science exam, compared to Codex’s 78% just two years earlier. With such capabilities, researchers are shifting from asking, “Should we teach with AI?” to “How do we teach with AI?”
Leo Porter from UC San Diego
Daniel Zingaro from the University of Toronto
Leo Porter and Daniel Zingaro have spearheaded this transformation through their groundbreaking undergraduate programming course. Their innovative curriculum integrates GenAI tools to help students tackle complex programming tasks while developing critical thinking and problem-solving skills.
Leo and Daniel presented their work at the Raspberry Pi Foundation research seminar in December 2024. During the seminar, it became clear that much could be learnt from their work, with their insights having particular relevance for teachers in secondary education thinking about using GenAI in their programming classes
Practical applications in the classroom
In 2023, Leo and Daniel introduced GitHub Copilot in their introductory programming CS1-LLM course at UC San Diego with 550 students. The course included creative, open-ended projects that allowed students to explore their interests while applying the skills they’d learnt. The projects covered the following areas:
Data science: Students used Kaggle datasets to explore questions related to their fields of study — for example, neuroscience majors analysed stroke data. The projects encouraged interdisciplinary thinking and practical applications of programming.
Image manipulation: Students worked with the Python Imaging Library (PIL) to create collages and apply filters to images, showcasing their creativity and technical skills.
Game development: A project focused on designing text-based games encouraged students to break down problems into manageable components while using AI tools to generate and debug code.
Students consistently reported that these projects were not only enjoyable but also responsible for deepening their understanding of programming concepts. A majority (74%) found the projects helpful or extremely helpful for their learning. One student noted that.
“Programming projects were fun and the amount of freedom that was given added to that. The projects also helped me understand how to put everything that we have learned so far into a project that I could be proud of.“
Core skills for programming with Generative AI
Leo and Daniel emphasised that teaching programming with GenAI involves fostering a mix of traditional and AI-specific skills.
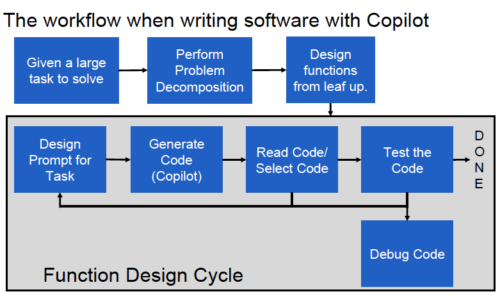
Writing software with GenAI applications, such as Copilot, needs to be approached differently to traditional programming tasks
Their approach centres on six core competencies:
Prompting and function design: Students learn to articulate precise prompts for AI tools, honing their ability to describe a function’s purpose, inputs, and outputs, for instance. This clarity improves the output from the AI tool and reinforces students’ understanding of task requirements.
Code reading and selection: AI tools can produce any number of solutions, and each will be different, requiring students to evaluate the options critically. Students are taught to identify which solution is most likely to solve their problem effectively.
Code testing and debugging: Students practise open- and closed-box testing, learning to identify edge cases and debug code using tools like doctest and the VS Code debugger.
Problem decomposition: Breaking down large projects into smaller functions is essential. For instance, when designing a text-based game, students might separate tasks into input handling, game state updates, and rendering functions.
Leveraging modules: Students explore new programming domains and identify useful libraries through interactions with Copilot. This prepares them to solve problems efficiently and creatively.
Ethical and metacognitive skills: Students engage in discussions about responsible AI use and reflect on the decisions they make when collaborating with AI tools.
Adapting assessments for the AI era
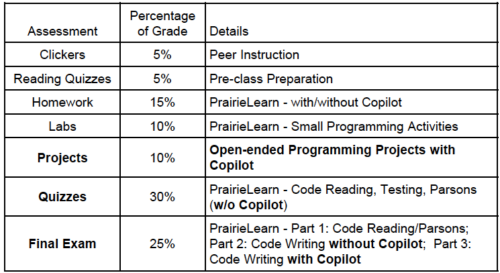
The rise of GenAI has prompted educators to rethink how they assess programming skills. In the CS1-LLM course, traditional take-home assignments were de-emphasised in favour of assessments that focused on process and understanding.
Leo and Daniel chose several types of assessments — some involved having to complete programming tasks with the help of GenAI tools, while others had to be completed without.
Quizzes and exams: Students were evaluated on their ability to read, test, and debug code — skills critical for working effectively with AI tools. Final exams included both tasks that required independent coding and tasks that required use of Copilot.
Creative projects: Students submitted projects alongside a video explanation of their process, emphasising problem decomposition and testing. This approach highlighted the importance of critical thinking over rote memorisation.
Challenges and lessons learnt
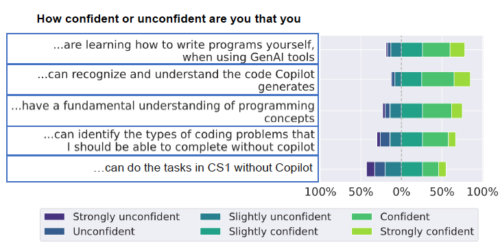
While Leo and Daniel reported that the integration of AI tools into their course has been largely successful, it has also introduced challenges. Surveys revealed that some students felt overly dependent on AI tools, expressing concerns about their ability to code independently. Addressing this will require striking a balance between leveraging AI tools and reinforcing foundational skills.
Additionally, ethical concerns around AI use, such as plagiarism and intellectual property, must be addressed. Leo and Daniel incorporated discussions about these issues into their curriculum to ensure students understand the broader implications of working with AI technologies.
A future-oriented approach
Leo and Daniel’s work demonstrates that GenAI can transform programming education, making it more inclusive, engaging, and relevant. Their course attracted a diverse cohort of students, as well as students traditionally underrepresented in computer science — 52% of the students were female and 66% were not majoring in computer science — highlighting the potential of AI-powered learning to broaden participation in computer science.
By embracing this shift, educators can prepare students not just to write code but to also think critically, solve real-world problems, and effectively harness the AI innovations shaping the future of technology.
If you’re an educator interested in using GenAI in your teaching, we recommend checking out Leo and Daniel’s book, Learn AI-Assisted Python Programming, as well as their course resources on GitHub. You may also be interested in our own Experience AI resources, which are designed to help educators navigate the fast-moving world of AI and machine learning technologies.
Join us at our next online seminar on 11 March
Our 2025 seminar series is exploring how we can teach young people about AI technologies and data science. At our next seminar on Tuesday, 11 March at 17:00–18:00 GMT, we’ll hear from Lukas Höper and Carsten Schulte from Paderborn University. They’ll be discussing how to teach school students about data-driven technologies and how to increase students’ awareness of how data is used in their daily lives.
To sign up and take part in the seminar, click the button below — we’ll then send you information about joining. We hope to see you there.
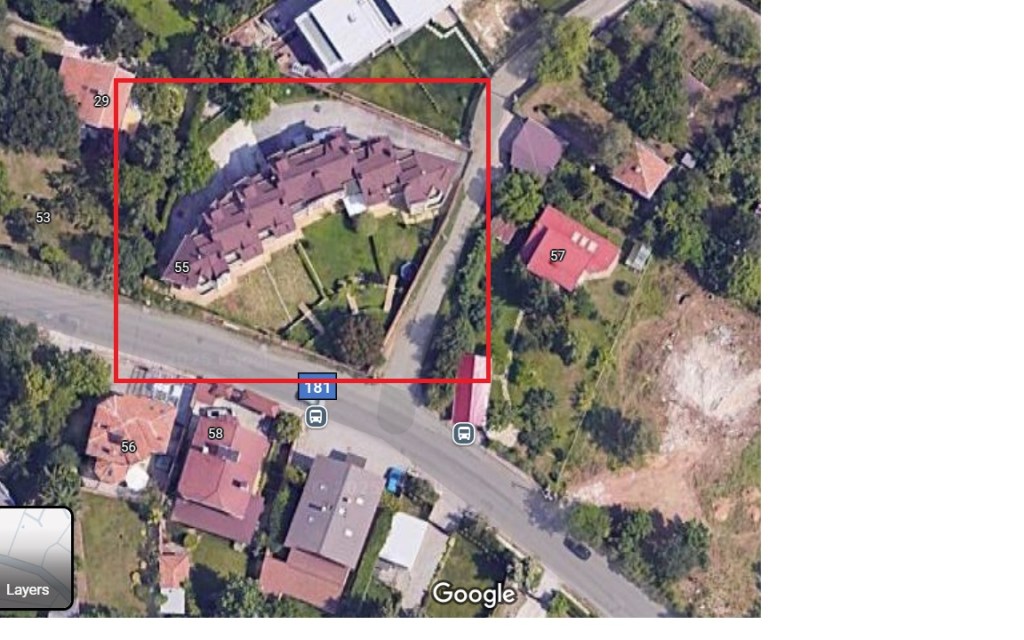
Близо половин милион лева за пропуснати ползи трябва да плати семейство Цанкови на строителна фирма, за това, че същата фирма не е успяла да завърши строежа на жилищни сгради върху…
превод от руски Здравка Петрова, Пловдив: изд. „Жанет 45“, 2022
Свободата може да е спектакъл. Преки свидетели сме на това по света и у нас – от Вашингтон до Владивосток. Демокрацията може и да е добре или зле режисиран театър.„Всички са свободни“ на Михаил Зигар е текст, който играе на границата между
журналистическо разследване, исторически анализ и почти романизирана реконструкция на едно от най-важните събития в постсъветската политика – президентските избори в Русия през 1996 г.
Тези избори, които на повърхността изглеждат като триумф на демокрацията срещу комунистическото минало, всъщност се оказват лабораторен експеримент за симулацията на политическа свобода, която в крайна сметка завършва с идването на Путин на власт.
Тази книга може да се разглежда като своеобразен руски вариант на „Фермата на животните“ на Оруел, но с (истински) хора. Иронията тук е по-горчива, защото участниците не осъзнават ролите си до последния момент. Документалната форма, съчетана с литературни алюзии, превръща текста в нещо повече от хроника. Той е свидетелство за естеството на политическата манипулация не само в Русия, но и навсякъде, където властта е достатъчно хитра, за да контролира демокрацията отвътре.
В предговора Зигар недвусмислено дава да се разбере, че изборите от 1996 г. са фарс с предизвестен край, разигран с патос, интриги и политическа акробатика, достойни за Шекспирова трагедия. Борис Елцин, старият и болен владетел, отказва да се оттегли, подобно на крал Лир, но вместо да разпределя кралството между дъщерите, той трябва да се пребори със собствените си демони – алкохолизъм, сринат рейтинг и съветници, които играят сложна игра, често без неговото знание.
Това сравнение с „Крал Лир“ не е литературна игра – в същността си Елцин е фигура, която вече няма пълен контрол над реалността, но която същевременно отказва да се откаже от трона. Ала вместо екзистенциалната трагедия на Лир Зигар предпочита да представи събитията в духа на „Тримата мускетари“. Като приключенски роман с предателства, съзаклятия и герои, които изглеждат благородни, но защитават една изгнила система.
В този контекст Елцин може да се разглежда като Луи XIII – символично слаб владетел, около когото се въртят реалните играчи:
Александър Коржаков, неговият телохранител и „сив кардинал“, е своеобразен Ришельо – човекът, който дърпа конците в сянка; Анатолий Чубайс и останалите технократи в екипа му са като мускетарите, които на думи защитават демокрацията, но в действителност си служат с корупция и насилие, за да осигурят желаната победа; Генадий Зюганов, комунистическият опонент на Елцин, играе ролята на Бъкингамския дук – официалния враг, който така и не получава реален шанс за победа.
Този наративен подход прави книгата далеч по-завладяваща от сухата последователност на събитията. Той кара читателя да види политическите фигури като персонажи в предопределен сюжет, където финалът е ясен преди първото действие.
Основната теза на Зигар е, че изборите през 1996 г. не са борба между две идеи, а между две версии на една и съща илюзия.
Елцин представя своята победа като победа на демокрацията, но използваните методи – цензура, лъжи, финансов натиск – доказват точно обратното.
Това напомня на политическия механизъм в „1984“ на Оруел (отново, уви), където контролът върху истината е по-важен от самата истина. „Войната е мир“ се превръща в „Свободните избори са контролирани избори“.
Връзката с „Ние“ на Евгений Замятин също е очевидна. Както в антиутопията на Замятин, където хората доброволно се подчиняват на системата и вярват, че тя е в техен интерес, така и в Русия през 1996 г. общественото мнение е управлявано чрез медийна пропаганда, страх и купуване на лоялност.
Книгата помага да се направи и мощен паралел със съвременния западен свят – където изборите се печелят не толкова чрез идеи, колкото чрез контрол над разказа.
В този смисъл историята на Елцин е не само руски феномен – тя е модел на демократична ерозия, който може да наблюдаваме в много други държави.
Зигар показва, че елитите създават политическа реалност по същия начин, по който един автор пише роман – чрез внимателен подбор на събития, цитати и митове. Историята на 1996 година в Русия не е просто история на избори – тя е история за това как демокрацията може да бъде компрометирана и доведена до имплозия.
Подобен разказ откриваме и в „Живот и съдба“ на Василий Гросман, където комунизмът и нацизмът са представени като огледални идеологии. В случая с Русия през 1996 г. борбата между „демократи“ и „комунисти“ е илюзорна – реалните механизми на властта остават същите.
„Всички са свободни“ не е книга за миналото – тя е предупреждение за бъдещето, което е тук и засега не мисли да ходи никъде. Тя показва, че демокрацията може да бъде съхранена като ритуал, но изгубена като съдържание. В този смисъл Зигар прави особено журналистическо разследване – той разказва притча за начина, по който политиката се превръща в спектакъл, а спектакълът – в съдба.
В глобален план днешната политическа реалност показва, че демократичните институции в много държави не са гаранция за свобода, а по-скоро инструмент за легитимиране на нови (или добре забравени стари) форми на автокрация.
След повече от две десетилетия на власт Путин напомня на Елцин в края на мандата му – възрастен лидер, около когото се водят сложни вътрешни борби за наследяване на властта. Ако изборите през 1996 г. бяха критичният момент, в който демокрацията в Русия бе компрометирана, то следващите президентски избори (2030) ще определят дали Русия ще остане хибридна автокрация, или ще мине към открита диктатура.
Америка също преминава през криза на доверието в изборния процес – резултат от години на политическа поляризация, корпоративен контрол върху медийните потоци и нарастващо недоверие към елитите.
Дебатите около Байдън/Харис и Тръмп са подобни на тези между Елцин и Зюганов – изборът е не между две противоположности, а между две вариации на една и съща система, която не функционира по начина, по който се предполага.
Все повече страни в ЕС се сблъскват с популистки лидери, които използват инструментите на демокрацията, за да я подкопават. Орбан в Унгария, Ердоган в Турция и тенденциите в Италия, Франция и Германия показват, че демократичните системи са още по-уязвими на машинации.
В България също можем да проследим подобен политически сценарий. Ако изборите през 1996 г. в Русия бележат началото на демократичната ерозия, то България премина през своите собствени моменти на разочарование – първо с прехода от комунизъм, после с нарастващото влияние на олигархията и с хроничната нестабилност на управлението през последните години.
Както Кремъл организира изборите през 1996 г., за да гарантира, че Елцин ще остане на власт, така и в България изборите често служат за легитимиране на съществуващи политически кръгове. Коалициите, съставяни на принципа „по-малкото зло“, също напомнят на руската логика: „Да подкрепим Елцин, защото иначе комунистите ще се върнат“. Медийната среда често работи по същия начин – създава се усещане, че няма алтернатива на определени политически фигури, а независимите гласове се заглушават или маргинализират.
Ако изборите се свеждат до избор между две злини, значи демокрацията е загубила съдържанието си.
Реалният контрол върху властта изисква работещи институции, свободни медии и гражданска ангажираност. Русия премина от хаотична олигархия при Елцин към централизиран авторитаризъм при Путин. В България политическата власт също се преразпределя между различни обръчи, но реалната промяна остава илюзорна. В страни като България и Русия гражданите често очакват „силна ръка“, която да реши проблемите им. Тази пасивност е основният фактор, който позволява на такива (анти)елити да се възпроизвеждат.
Книгата „Всички са свободни“ ни учи, че демокрацията може да бъде подменена, без дори да го осъзнаем. Днес, когато политическите системи в България, Русия и по света започват да приличат на управляеми спектакли, въпросът е: ще останем ли пасивни зрители, или ще решим да пренапишем сценария?
Истинската демокрация е не в ритуалите, а в реалния контрол на обществото над властта. А това изисква не само избори, но и активна, будна и информирана гражданска позиция. Преди да е умряла, както
през 1996 година кралските мускетари бойко и цинично са постигнали целта си. Те са се стремили към победа. Като в старите романи, когато трябва да победиш на всяка цена и целта оправдава средствата. Но средствата, използвани от мускетарите, са унищожили тяхната цел. Само че в края на този роман умира не Констанс, а Конституцията.
Конституцията умря, да живее Конституцията!
Активните дарители на „Тоест“ получават постоянна отстъпка в размер нa 20% от коричната цена на всички заглавия от каталога на издателство „Жанет 45“, както и на няколко други български издателства в рамките на партньорската програма Читателски клуб „Тоест“. За повече информация прочетете на toest.bg/club.
Никой от нас не чете единствено най-новите книги. Тогава защо само за тях се пише? „На второ четене“ е рубрика, в която отваряме списъците с книги, публикувани преди поне година, четем ги и препоръчваме любимите си от тях. Рубриката е част от партньорската програма Читателски клуб „Тоест“. Изборът на заглавия обаче е единствено на авторите – Стефан Иванов и Антония Апостолова, които биха ви препоръчали тези книги и ако имаше как веднъж на две седмици да се разходите с тях в книжарницата.
At Grab, we’ve been working to perfect our Spark observability tools. Our initial solution, Iris, was developed to provide a custom, in-depth observability tool for Spark jobs. As described in our previous blog post, Iris collects and analyses metrics and metadata at the job level, providing insights into resource usage, performance, and query patterns across our Spark clusters.
Iris addresses a critical gap in Spark observability by providing real-time performance metrics at the Spark application level. Unlike traditional monitoring tools that typically provide metrics only at the EC2 instance level, Iris dives deeper into the Spark ecosystem. It bridges the observability gap by making Spark metrics accessible through a tabular dataset, enabling real-time monitoring and historical analysis. This approach eliminates the need to parse complex Spark event log JSON files, which users are often unable to access when they need immediate insights. Iris empowers users with on-demand access to comprehensive Spark performance data, facilitating quicker decision-making and more efficient resource management.
Iris served us well, offering basic dashboards and charts that helped our teams understand trends, discover issues, and debug their Spark jobs. However, as our needs evolved and usage grew, we began to encounter limitations:
Fragmented user experience and access control: Observability data is split between Grafana (real-time) and Superset (historical), forcing users to switch platforms for a complete view. The complex Grafana dashboards, while powerful, were challenging for non-technical users. The lack of granular permissions hindered wider adoption. We needed a unified, user-friendly interface with role-based access to serve all Grabbers effectively.
Operational overhead: Our data pipeline for offline analytics includes multiple hops and complex transformations.
Data management: We faced challenges managing real-time data in InfluxDB alongside offline data in our data lake, particularly with string-type metadata.
These challenges and the need for a centralised, user-friendly web application prompted us to seek a more robust solution. Enter StarRocks – a modern analytical database that addresses many of our pain points:
Pain points with InfluxDB
StarRocks solution
Limited SQL compatibility: Requires use of Flux query language instead of full SQL
Full MySQL-compatible SQL support, enabling seamless integration with existing tools and skills
Complex data ingestion pipeline: Requires external agents like Telegraf to consume Kafka and insert into InfluxDB
Direct Kafka ingestion, eliminating the need for intermediate agents and simplifying the data pipeline
Limited pre-aggregation capabilities: Aggregation is limited to time windows and indexed columns, not string columns
Flexible materialised views supporting complex aggregations on any column type, improving query performance
Poor support for metadata and joins: Designed primarily for numerical time series data, with slow performance on string data and joins
Efficient handling of both time-series and string-type metadata in a single system, with optimised join performance
Difficult integration with data lake: There is no official way to backup or stream data directly to the datalake, requiring separate pipelines
Native S3 integration for easy backup and direct data lake accessibility, eliminating the need for separate ingestion pipelines
Performance issues with high cardinality data: Indexing unique identifiers (like app\_id) causes huge indexes and slow queries
Optimised for high cardinality data, allowing efficient querying on unique identifiers without performance degradation
In this blog post, we will dive into leveraging StarRocks to build the next generation of the Spark observability platform. We will explore the architecture, data model, and key features that are helping us overcome previous limitations and provide more value to Spark users at Grab.
System architecture overview
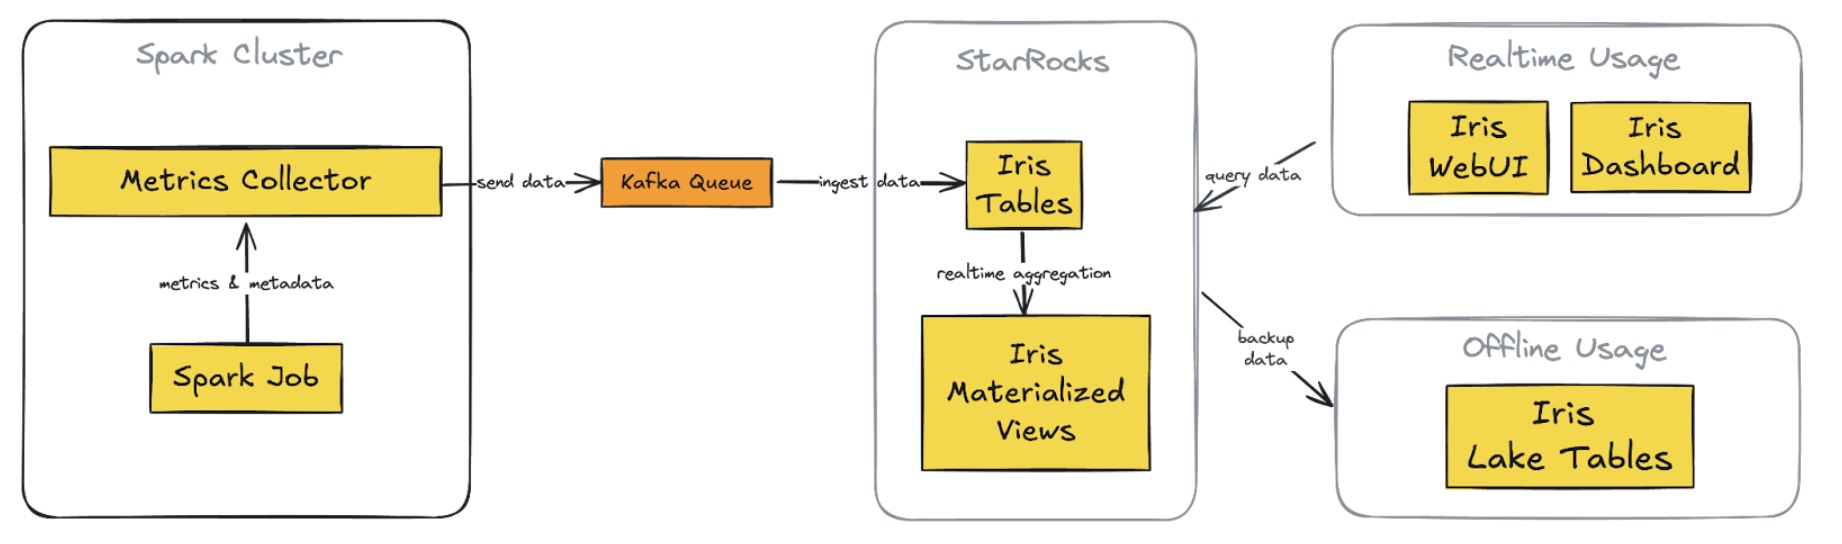
In the journey to enhance user experience, we’ve made substantial changes to the architecture, moving from the Telegraf/InfluxDB/Grafana (TIG) stack to a more streamlined and powerful setup centered around StarRocks. This new architecture addresses the previous challenges and provides a more unified, flexible, and efficient solution.
Figure 1. New Iris architecture with StarRocks integration
Key Components of the new architecture:
1. StarRocks database
Replaces InfluxDB for both real-time and historical data storage
Supports complex queries on metrics and metadata tables
2. Direct Kafka ingestion
StarRocks ingests data directly from Kafka, eliminating Telegraf
3. Custom web application (Iris UI)
Replaces Grafana dashboards
Centralised, flexible interface with custom API
4. Superset integration
Maintained and now connected directly to StarRocks
Provides real-time data access, consistent with the custom web app
5. Simplified offline data process
Scheduled backups from StarRocks to S3 directly
Replaces previous complex data lake pipelines
Key improvements:
1. Unified data store: Single source for real-time and historical data
2. Streamlined data flow: A simplified pipeline reduces latency and failure points
3. Flexible visualisation: Custom web app with intuitive, role-specific interfaces
4. Consistent real-time access: Across both custom app and Superset
5. Simplified backup and data lake integration: Direct S3 backups
Data model and ingestion
The Iris observability system is designed to monitor both job executions and ad-hoc cluster usage, encompassing what we call “cluster observation”. This model accounts for two scenarios:
Adhoc use: Pre-created clusters shared among team users
Job execution: New clusters are created for each job submission
Key design points
For each cluster, we capture both metadata and metrics:
Key point
Description
Linkage
We use worker\_uuid to link metadata with worker metrics app\_id to link metadata with Spark event metrics.
Granularity
Worker metrics are captured every 5 seconds, linked by worker\_uuid. Spark events are captured as they occur, linked by app\_id. Metadata can be captured multiple times.
Flexibility
This schema allows for queries at various levels: Individual worker level, job level, cluster level.
Historical analysis
The design enables insights from historical runs, such as: Auto-scaling behaviour, maximum worker count per job, maximum or average memory usage over time.
We use StarRocks’ routine load feature to ingest data directly from Kafka into our tables. Refer to the StarRocks documentation: Load data using routine load.
Here is a simple example of creating a routine load job for cluster worker metrics:
This configuration sets up continuous data ingestion from the specified Kafka topic into our cluster_worker_metrics table, with JSON parsing.
For monitoring the routine, StarRocks provides built-in tools to monitor the status/error log of routine load jobs. Example query to check load:
    C/C++
    SHOW ROUTINE LOAD WHERE NAME = "iris.routetine_cluster_worker_metrics_raw";
Handle both real-time and historical data in the unified system
The new Iris system uses StarRocks to efficiently manage both real-time and historical data. We have implemented three key features to achieve this:
StarRocks’ routine load enables near real-time data ingestion from Kafka. Multiple load tasks concurrently consume messages from different topic partitions, resulting in data appearing in Iris tables within seconds of collection. This quick ingestion keeps our monitoring capabilities current, providing users with up-to-date information about their Spark jobs.
For historical analysis, StarRocks serves as a persistent dataset, storing metadata and job metrics with a time-to-live of over 30 days. This allows us to perform analysis based on the last 30 days of job runs directly in StarRocks, which is significantly faster than using offline data in our data lake.
We’ve also implemented materialised views in StarRocks to pre-calculate and aggregate data for each job run. These views combine information from metadata, worker metrics, and Spark metrics, creating ready-to-use summary data. This approach eliminates the need for complex join operations when users access the job run summary screen in the UI, improving response times for both SQL queries and API access.
This setup offers substantial improvements over our previous InfluxDB-based system. As a time-series database, InfluxDB makes complex queries and joins challenging. It also lacked support for materialised views, making it difficult to create pre-built job-run summaries. Previously, we had to query our data lake using Spark and Presto to view historical runs for a particular job over the last 30 days, which was slower than directly querying in StarRocks.
By combining real-time ingestion, persistent storage, and materialised views, Iris now provides a unified, efficient platform for both immediate monitoring and in-depth historical analysis of Spark jobs.
Query performance and optimisation
StarRocks has significantly improved our query performance for Spark observability. Here are some key aspects of our optimisation strategy.
Materialised views
As mentioned, we leverage StarRocks’ materialised views to pre-aggregate job run summaries. This approach significantly reduces query complexity and improves response times for common UI operations. Materialised views combine data from metadata, worker metrics, and Spark metrics tables, thus eliminating the need for complex joins during query execution. This is particularly beneficial for our job-run summary screen, where pre-calculated aggregations can be retrieved instantly, improving both speed and user experience.
Here’s an example
    C/C++
    CREATE MATERIALIZED VIEW job_runs_001
    PARTITION BY (`report_date`)
    DISTRIBUTED BY HASH(`report_date`,`platform`)
    REFRESH ASYNC
    PROPERTIES (
        "auto_refresh_partitions_limit" = "3",
        "partition_ttl" = "33 DAY"
    )
    AS
    select m.report_date                                                                     as report_date,
        m.platform,
        m.job_id,
        m.run_id,
        m.app_id,
        m.app_attempt_id,
        ANY_VALUE(COALESCE(m.cluster_id, m.cluster_name))                                 as cluster_id,
        ANY_VALUE(m.cluster_name)                                                         as cluster_name,
        ANY_VALUE(m.job_name)                                                             as job_name,
        ANY_VALUE(m.job_owner)                                                            as job_owner,
        ANY_VALUE(m.job_client)                                                           as job_client,
        ANY_VALUE(CASE WHEN m.worker_role = 'driver' THEN m.spark_ui_url END)             as spark_ui_url,
        ANY_VALUE(CASE WHEN m.worker_role = 'driver' THEN m.spark_history_url END)        as spark_history_url,
        ANY_VALUE(CASE WHEN m.worker_role = 'driver' THEN m.driver_log_location END)      as driver_log_location,
        COUNT(d.worker_uuid)                                                              as total_instances,
        from_unixtime(MIN(d.start_time) / 1000, 'yyyy-MM-dd HH:mm:ss')                    as start_time,
        from_unixtime(MAX(d.end_time) / 1000, 'yyyy-MM-dd HH:mm:ss')                      as end_time,
        COALESCE((((MAX(d.end_time) - MIN(d.start_time)) + 120000) / (1000 * 3600)), 0)   as job_hour,
        SUM(COALESCE(d.machine_hour, 0))                                                  as machine_hour,
        SUM(COALESCE(d.cpu_hour, 0))                                                      as cpu_hour,
        MAX(COALESCE(CASE WHEN d.worker_role = 'driver' THEN d.cpu_utilization END, 0))   as driver_cpu_utilization,
        MAX(COALESCE(CASE WHEN d.worker_role = 'driver' THEN d.memory_utilization END,
                        0))                                                                  as driver_memory_utilization,
        MAX(COALESCE(CASE WHEN d.worker_role = 'executor' THEN d.cpu_utilization END, 0)) as worker_cpu_utilization,
        MAX(COALESCE(CASE WHEN d.worker_role = 'executor' THEN d.memory_utilization END,
                        0))                                                                  as worker_memory_utilization,
        -- other relevant metrics fields
    from iris.cluster_worker_metadata_view_001 m
            left join iris.cluster_worker_metrics_view_006 d
                    on d.report_date >= m.report_date and d.platform = m.platform and d.worker_uuid = m.worker_uuid and
                        d.worker_role = m.worker_role
    where m.job_id is not null
    group by m.report_date,
            m.platform,
            m.job_id,
            m.run_id,
            m.app_id,
            m.app_attempt_id;
StarRocks offers powerful and flexible materialised view capabilities that significantly enhance our query performance and data management in Iris. Here are three key features we leverage:
SYNC and ASYNC
StarRocks supports both SYNC and ASYNC materialised views. We primarily use ASYNC views as they allow us to join multiple underlying tables, which is crucial for our job-run summaries. We can configure these views to refresh:
Immediately when downstream tables are updated.
At set intervals (e.g., every 1 minute). This flexibility allows us to balance data freshness with system performance.
Example setting:
    C/C++
    REFRESH ASYNC START('2022-09-01 10:00:00') EVERY (interval 1 day)
For more details on supported features and settings, refer to the StarRocks documentation: Materialised view.
Partition TTL
We utilise the partition Time To Live (TTL) feature for materialised views. This allows us to control the amount of historical data stored in the views, typically setting it to 33 days. This ensures that the views remain performant and do not consume excessive storage while still providing quick access to recent historical data.
    C/C++
    PROPERTIES (
        "partition_ttl" = "33 DAY"
    )
Selective partition refresh
StarRocks allows us to refresh only specific partitions of a materialised view instead of the entire dataset. We take advantage of this by configuring our views to refresh only the most recent partitions (e.g., the last few days) where new data is typically added. This approach significantly reduces the computational overhead of keeping our materialised views up-to-date, especially for large historical datasets.
Our tables are partitioned by date, allowing for efficient pruning of historical data. This partitioning strategy is crucial for queries that focus on recent job runs or specific time ranges. By quickly eliminating irrelevant partitions, we significantly reduce the amount of data scanned for each query, leading to faster execution times.
    C/C++
    PARTITION BY RANGE(`report_date`)()
    DISTRIBUTED BY HASH(`report_date`,`platform`)
Dynamic partitioning
We utilise StarRocks’ dynamic partitioning feature to automatically manage our partitions. This ensures that new partitions are created as fresh data arrives and old partitions are dropped when data expires. Dynamic partitioning helps maintain optimal query performance over time without manual intervention, which is especially important for our continuous data ingestion process.
Here’s an example of how we configure dynamic partitioning for a 33-day retention period:
To verify that dynamic partitioning is working correctly and to monitor the state of your partitions, you can use the following SQL command:
    C/C++
    SHOW PARTITIONS FROM iris.cluster_worker_metrics_raw;
This command provides a summary of all partitions for the specified table (in this case, iris.cluster_worker_metrics_raw). The output includes valuable information such as:
The total number of partitions
The date range covered by each partition
Row count per partition
Size of each partition
While dynamic partitioning keeps the most recent 33 days of data readily available in StarRocks for fast querying, we’ve implemented a strategy to retain older data for long-term analysis.
We use a daily cron job to back up data older than 30 days to Amazon S3. This ensures we maintain historical data without impacting the performance of our primary StarRocks cluster.
Here’s an example of the backup query we use:
    Python
    INSERT INTO
        FILES(
            "path" = "{s3backUpPath}/{table_name}/",
            "format" = "parquet",
            "compression" = "zstd",
            "partition_by" = "report_date",
            "aws.s3.region" = "ap-southeast-1"
        )
        SELECT * FROM iris.{table_name} WHERE report_date between '{start_date}' and '{end_date}';
After backing up to S3, we map this data to a data lake table, enabling us to query historical data beyond the 33-day window in StarRocks when needed, without affecting the performance of our primary observability system.
    Python
    df_snapshot = spark.read.parquet(f"{s3backUpPath}/{table_name}")

    # do the transformation if needed here

    df_snapshot.write.format("delta").mode("overwrite").option("partitionOverwriteMode", "dynamic").option("mergeSchema", "true").partitionBy("report_date").save(f"{s3SinkPath}/{table_name}")

    %sql
    CREATE TABLE IF NOT EXISTS iris.{table_name}
    USING DELTA
    LOCATION '{s3SinkPath}/{table_name}'
Data replication
StarRocks uses data replication across multiple nodes, which is crucial for both fault tolerance and query performance. This strategy allows parallel query execution speeding up data retrieval. It’s particularly beneficial for our front-end queries, where low latency is crucial for user experience. This approach aligns with best practices seen in other distributed database systems like Cassandra, DynamoDB, and MySQL’s master-slave architecture.
    C/C++
    PROPERTIES (
        "replication_num" = "3",
    );
Unified web application
We’ve developed a comprehensive web application for Iris, consisting of both backend and frontend components. This unified interface offers users a seamless experience for monitoring and analysing Spark jobs.
Backend
Built using Golang, our backend service connects directly to the StarRocks database.
It queries data from both raw tables and materialised views, leveraging the optimised data structures we’ve set up in StarRocks.
The backend handles authentication and authorisation, ensuring that users have appropriate access to job data.
Frontend
The frontend offers several key screens to show:
List of job runs
Job status
Job metadata
Driver log
Spark UI
Statistics on resource usage and cost
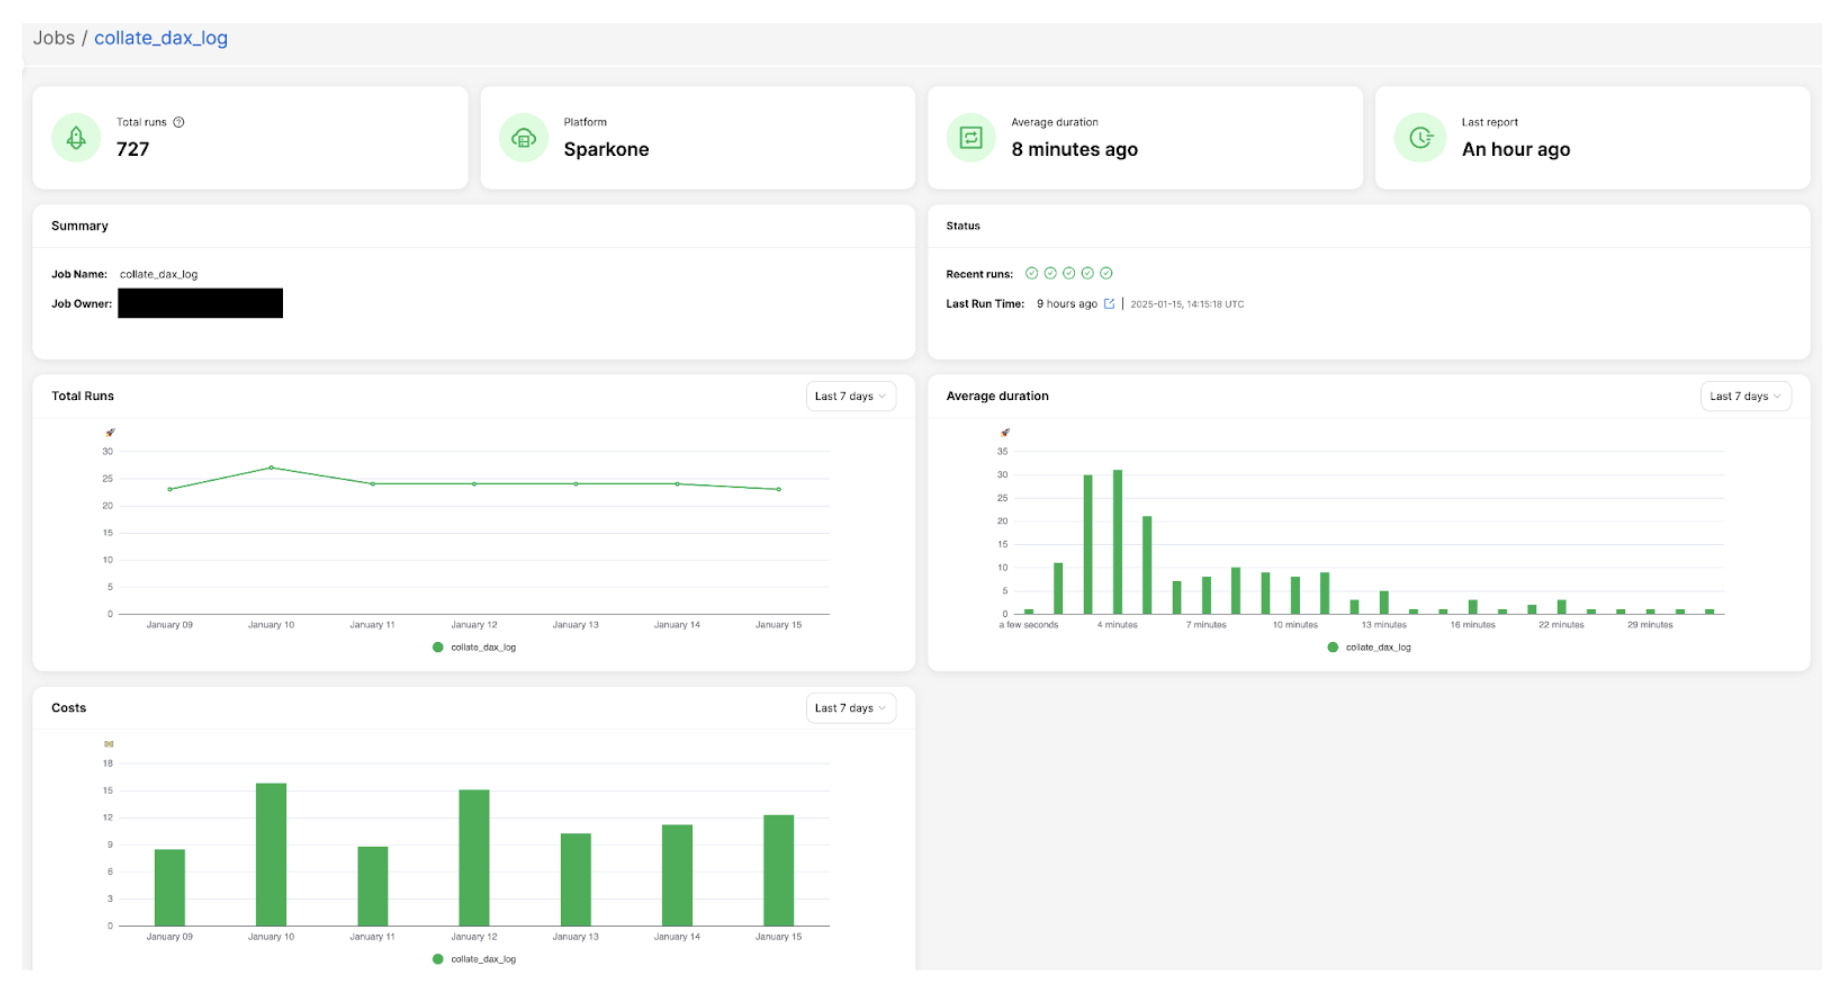
Here is an example of the job overview screen, which displays key summary information: total number of runs, job owner details, performance trends, and cost analysis charts. This comprehensive view provides users with a quick snapshot of their Spark job’s overall health and resource utilisation.
Figure 2: Example of job overview screen
Advanced analytics and insights
One of the key features we’ve implemented in Iris is the ability to perform analytics on historical job runs to capture trends. This feature leverages the power of StarRocks and our data model to provide users with valuable insights and recommendations. Here’s how we’ve implemented it:
Historical run analysis
We’ve created a materialised view that aggregates job run data over the last 30 days. This view likely includes metrics such as count of runs, p95 values for various resource utilisation, etc.
    C/C++
    CREATE MATERIALIZED VIEW job_run_summaries_001
    REFRESH ASYNC EVERY(INTERVAL 1 DAY)
    AS
    select platform,
        job_id,
        count(distinct run_id)                                as count_run,
        ceil(percentile_approx(total_instances, 0.95))        as p95_total_instances,
        ceil(percentile_approx(worker_instances, 0.95))       as p95_worker_instances,
        percentile_approx(job_hour, 0.95)                     as p95_job_hour,
        percentile_approx(machine_hour, 0.95)                 as p95_machine_hour,
        percentile_approx(cpu_hour, 0.95)                     as p95_cpu_hour,
        percentile_approx(worker_gc_hour, 0.95)               as p95_worker_gc_hour,
        ceil(percentile_approx(driver_cpus, 0.95))            as p95_driver_cpus,
        ceil(percentile_approx(worker_cpus, 0.95))            as p95_worker_cpus,
        ceil(percentile_approx(driver_memory_gb, 0.95))       as p95_driver_memory_gb,
        ceil(percentile_approx(worker_memory_gb, 0.95))       as p95_worker_memory_gb,
        percentile_approx(driver_cpu_utilization, 0.95)       as p95_driver_cpu_utilization,
        percentile_approx(worker_cpu_utilization, 0.95)       as p95_worker_cpu_utilization,
        percentile_approx(driver_memory_utilization, 0.95)    as p95_driver_memory_utilization,
        percentile_approx(worker_memory_utilization, 0.95)    as p95_worker_memory_utilization,
        percentile_approx(total_gb_read, 0.95)                as p95_gb_read,
        percentile_approx(total_gb_written, 0.95)             as p95_gb_written,
        percentile_approx(total_memory_gb_spilled, 0.95)      as p95_memory_gb_spilled,
        percentile_approx(disk_spilled_rate, 0.95)            as p95_disk_spilled_rate
    from iris.job_runs
    where report_date >= current_date - interval 30 day
    group by platform, job_id;
Using this aggregated data, we can identify trends in job performance and resource usage over time, such as increasing run times or spikes in resource consumption.
Recommendation API
Based on trend analysis insights, we’ve built a recommendation API that suggests optimizations, such as adjusting resource allocations, identifying potential bottlenecks, or proposing schedule changes to optimise cost and performance.
Frontend integration
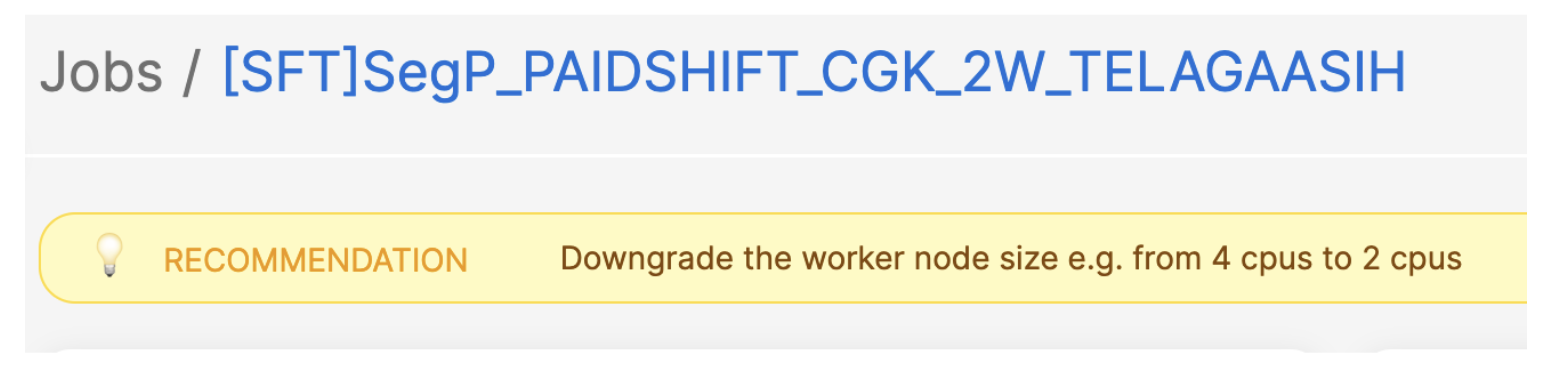
The recommendations generated by our API are integrated into the Iris front end. Users can view these recommendations directly in the job overview or details screens, offering actionable insights to improve Spark jobs.
Here is an example: in a job with consistently low resource utilisation (less than 25% over time), our system suggests reducing the worker size by half to optimise costs.
Figure 3. Example of job with low resource utilisation.
Slackbot integration
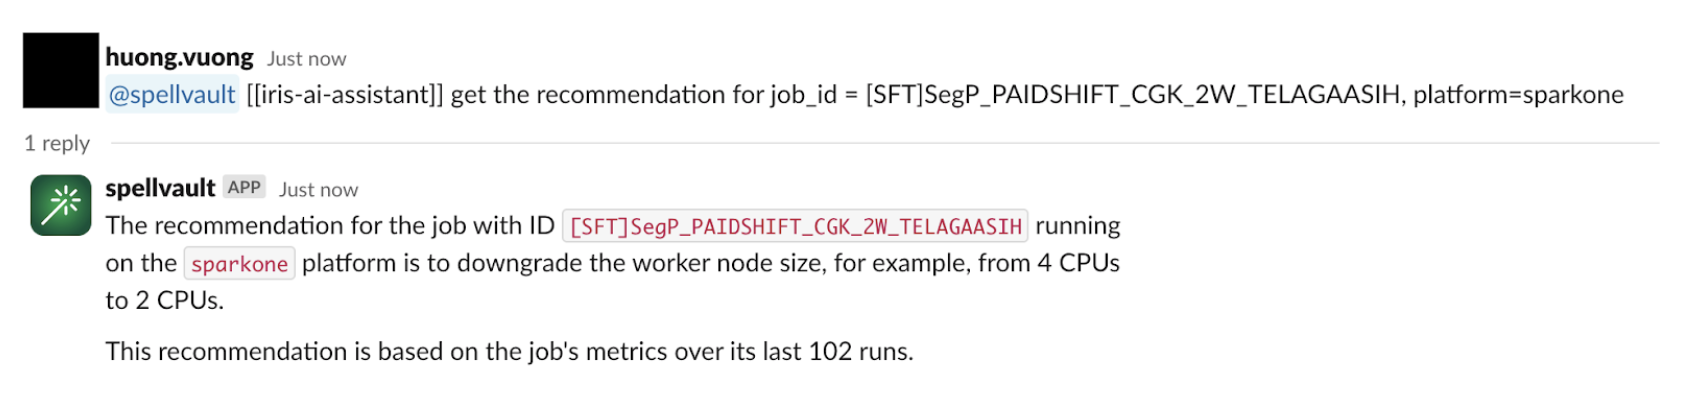
To make these insights more accessible, we’ve integrated the recommendation system with a SpellVault app (a GenAI platform at Grab). This allows users to interact with the recommendation system directly from Slack, allowing them to stay informed about job performance and potential optimisations without constantly checking the Iris web interface.
Figure 4. Example of integration with SpellVault.
Migration and adoption
Migration strategy
Fully migrating real-time CPU/Memory charts from Grafana to the new Iris UI
Will deprecate the Grafana dashboard after migration
Retaining Superset for platform metrics and specific BI needs
User onboarding and feedback
Iris deployed within the One DE app, centralising access to data engineering tools. The feedback button in the UI allows users to submit comments easily.
Lessons learned and future roadmap
Lessons learned
Unified data store: Using StarRocks as a single source for both real-time and historical data has significantly improved query performance and streamlined our architecture.
Materialised views: Leveraging StarRocks’ materialised views for pre-aggregations has significantly enhanced query response times, especially for common UI operations.
Dynamic partitioning: Implementing dynamic partitioning has helped in maintaining optimal performance as data volumes grow, automatically managing data retention.
Direct Kafka ingestion: StarRocks’ ability to ingest data directly from Kafka has streamlined our data pipeline, reducing latency and complexity.
Flexible data model: Compared to the previous time-series-focused InfluxDB, the StarRocks relational model enables more complex queries and simplifies metadata handling.
Future roadmap
Enhanced recommendations: Expand the recommendation system to include more in-depth suggestions, such as identifying potential bottlenecks and recommending Spark configurations to add or remove from jobs. These recommendations, aimed at improving runtime and cost performance, will leverage the detailed Spark metrics and event data we’re already collecting.
Advanced analytics: Leverage the comprehensive Spark metrics data to provide deeper insights into job performance and resource utilisation.
Integration expansion: Enhance Iris integration with other internal tools and platforms to increase adoption and ensure a seamless experience across the data engineering ecosystem.
Machine learning integration: Explore the possibility of incorporating machine learning models for predictive analytics on Spark performance.
Scalability improvements: Continue to optimise the system to handle increasing data volumes and user loads as adoption grows.
User experience enhancements: Continuously improve the Iris application’s UI/UX based on user feedback to make it more intuitive and informative.
Conclusion
The journey of building the Iris web application, powered by StarRocks, has been transformative for our Spark observability capabilities at Grab. This evolution was driven by the need for a user-friendly, centralised platform for Spark monitoring and logging.
By leveraging StarRocks’ capabilities, we’ve created a unified interface that seamlessly handles both real-time and historical data. This has allowed us to consolidate previously fragmented tools like Grafana and Superset into a single, cohesive platform. The ability to capture and analyse job metadata and metrics in one place has been crucial, enabling us to implement effective showback/chargeback mechanisms at the job level.
Looking ahead, we’re excited about the potential for more advanced analytics and machine learning-driven insights. The lessons learned from this project will guide our approach to building robust, scalable, and user-friendly data tools at Grab.
Join us
Grab is a leading superapp in Southeast Asia, operating across the deliveries, mobility and digital financial services sectors. Serving over 800 cities in eight Southeast Asian countries, Grab enables millions of people everyday to order food or groceries, send packages, hail a ride or taxi, pay for online purchases or access services such as lending and insurance, all through a single app. Grab was founded in 2012 with the mission to drive Southeast Asia forward by creating economic empowerment for everyone. Grab strives to serve a triple bottom line – we aim to simultaneously deliver financial performance for our shareholders and have a positive social impact, which includes economic empowerment for millions of people in the region, while mitigating our environmental footprint.
Powered by technology and driven by heart, our mission is to drive Southeast Asia forward by creating economic empowerment for everyone. If this mission speaks to you, join our team today!
The Google Bug Hunters blog has a
detailed description of how a vulnerability in AMD’s microcode-patching
functionality was discovered and exploited; the authors have also released
a set of tools to assist with this kind of research in the future.
Secure hash functions are designed in such a way that there is no
secret key, and there is no way to use knowledge of the
intermediate state in order to generate a collision. However, CMAC
was not designed as a hash function, and therefore it is a weak
hash function against an adversary who has the key. Remember that
every AMD Zen CPU has to have the same AES-CMAC key in order to
successfully calculate the hash of the AMD public key and the
microcode patch contents. Therefore, the key only needs to be
revealed from a single CPU in order to compromise all other CPUs
using the same key. This opens up the potential for hardware
attacks (e.g., reading the key from ROM with a scanning electron
microscope), side-channel attacks (e.g., using Correlation Power
Analysis to leak the key during validation), or other software or
hardware attacks that can somehow reveal the key. In summary, it is
a safe assumption that such a key will not remain secret forever.
Всеки, който някога е гледал спор или дебат с участието на Доналд Тръмп, може да потвърди, че в такива случаи настоящият президент на САЩ прави всичко възможно, за да размаже събеседника си, независимо кой стои пред него. Този скандален шоу стил на Тръмп не е случаен, защото именно в него се крие стратегията, която върна милиардера в Белия дом. За разлика от европейската традиция, която е прокарала ясни червени линии за реториката на политиците, в САЩ нещата не стоят точно така.
От друга страна, да сведем случилото се преди броени дни в Белия дом до някаква обикновена политическа свада, в която са се сблъскали герой и злодей, е наивна стратегия, която няма да ни каже какво всъщност стана на срещата между Доналд Тръмп и Володимир Зеленски. Много идеалисти и идеолози виждат нещата по този начин, защото стават жертва на т.нар. пожелателно мислене, при което нагласите и представите на индивида се формират на базата на неговите желания, а не на обективната реалност. Същевременно отговорът трябва да се търси не на ниво геополитика и даже не на ниво лидерство, а на ниво възприятия или дори на липсата на такива.
Ролята на възприятията и нагласите във външната политика
Всеки експерт в сферата на международните отношения би трябвало да е чел поне веднъж в живота си книгата Perceptions and Misperceptions in International Politics, дело на един от най-великите американски учени Робърт Джървис.
След Кубинската ракетна криза от 1962 г. младият Джървис лесно попада в полезрението на ЦРУ с разработките си и започва работа по няколко научни труда, посветени на ядреното сдържане, на съветската стратегическа култура и на начина, по който политиците вземат решения. Всъщност, ако отворите тази книга, ще си отговорите не просто на въпроса защо Тръмп и Зеленски се скараха, но и защо изобщо се стигна до войната в Украйна. И не, това не са дежурните драсканици на хора, които се опитват да ни убедят колко добър или лош е някой от двата отбора, а е огромен, емпирично аргументиран труд, в който Джървис обяснява как може да предвидим или анализираме ходовете на лидерите.
Важно е да кажем, че теорията за възприятията няма общо с политическата психология, която се старае да покаже как мислят политиците. За разлика от нея, теорията за възприятията в политиката директно отговаря на въпросите как и защо политиците вземат решения. Според нея основните фактори, на базата на които се формират представите на лидерите, са три:
вярванията им;
ценностната система, в която са възпитани;
способността им да опознават околната среда.
Въз основа на тези променливи се различават два типа лидери: рационални политици, които имат ясни вярвания и развита ценностна система и възприемат прагматично околната среда; и други, без ясни вярвания и ценности, което им пречи да бъдат рационални. Много важно уточнение тук е, че един рационален лидер може да се превърне в напълно нерационален, в случай че изгуби реална представа за случващото се около него. Основна причина за това е страхът, който не само Джървис, но и много други изследователи посочват като източник на конфликти и разделение. Съгласно теорията за възприятията този страх може да бъде преодолян, но лекарството в такива случаи е по-лошо от болестта – нужно е въпросният лидер да се постави на мястото на опонента си. А практиката сочи, че това почти никога не се случва, поради което конфликтът е неизбежен.
Казано с други думи, оръжията, санкциите, политиката, идеологията са само едната страна на монетата. Всичко може да се промени, ако нагласите на лидерите се обърнат и те започнат да възприемат другия не като враг, а като партньор. Това обръщане на нагласите като че ли повече ни доближава до случващото се в последните няколко месеца, откакто Доналд Тръмп отново е в Белия дом. Доказателство за съждението, че всичко може да се промени, е неуспехът на много европейски политици и анализатори да предвидят какво ще се случи след спечелването на изборите от Тръмп, както и че той може да стигне до крайности, които завинаги да оставят диря в трансатлантическата солидарност.
Някои си казваха, че „не може да стане по-зле“, а други ни уверяваха, че „ще стане още по-добре“. В крайна сметка това не са прагматични оценки, а ориентири, които, макар и достоверни в някои случаи, не успяват адекватно да подготвят обществото за бурята, която се задава.
Ето защо преди всичко в един такъв анализ е необходимо да се дистанцираме от случващото се в глобалната политика днес. То е нелогично, хаотично, безнадеждно… Всъщност съвсем не – просто така изглежда.
Защо – можем да разберем само ако пренесем анализа си на индивидуално ниво.
От какво се страхува Доналд Тръмп?
Първият и най-важен въпрос е какво е в състояние да уплаши президента на САЩ до такава степен, че той да насочи цялата си съзнателна критика срещу Украйна и срещу нейния лидер. Тук няма да помогнат изводи от рода на „Тръмп е мародер и рекетьор, а Зеленски е нашият герой“ или пък „Тръмп иска траен мир, а Зеленски – безкрайна война“. Подобни твърдения, макар и частично аргументирани, имат не емпиричен, а политико-идеологически характер.
Отговорът е много прост: Тръмп се страхува за три неща и би дал мило и драго да не ги загуби – властта си, сигурността си и парите си. За първото и последното на този етап няма опасност, но ефектът от заплахата срещу тях беше видим след съдебните процеси срещу Тръмп, които го превърнаха в мъченик за избирателите му.
За пръв път обаче от края на Студената война националната сигурност на САЩ е под непосредствена заплаха. И не просто от една трансгранична терористична мрежа, а от две ядрени сили – Русия и Китай. Съюз, който е способен да сложи край на американското глобално лидерство.
Тази заплаха не може да бъде неутрализирана с изпращане на войски зад граница, защото това може да доведе до ядрена война. В нея няма да има победители и тогава Тръмп ще загуби и властта, и парите си. Тук може да се даде един прост пример – думите на Зеленски:
Г-н Президент, ние усещаме това от години. Но ако паднем, и вие ще го усетите.
На тях Тръмп реагира с гневното:
Не знаете това! Не ни казвайте какво ще усетим и какво – не!
Оттук насетне разговорът рязко завива в посока, за която британският премиер заяви, че „никой не би искал да вижда“. Същевременно едва ли има политик в американската история с по-голямо его от Тръмп. Този факт, съчетан със страха от ядрена война и с възхода на Китай, е прекрасна илюстрация на политическата метафора за меда и жилото, чийто автор е Драган Цанков. В този случай Зеленски усети както меда, така и жилото на САЩ.
От какво се страхува Зеленски?
Най-елементарното твърдение, което може да приемем, е, че Зеленски се страхува за живота и властта си. Всъщност, ако беше така, отдавна трябваше да е напуснал Украйна и да живее като един от най-богатите политици в Европа. Същото важи и за аргументите, които правят от Зеленски абсолютен герой или абсолютен злодей.
Да вярваме, че един политик е доброто или лошото момче, е много наивно и такива нагласи неведнъж са изигравали лоша шега на политиците в най-новата ни история.
Затова е най-трудно да дефинираме от какво толкова се страхува Зеленски, че беше готов да спори с президента и вицепрезидента на САЩ. Слухове за подобни спорове между украинския лидер и Байдън се появиха и през 2022 г., когато в телефонен разговор благият демократ изтървава нервите си и призовава Зеленски да бъде малко по-благодарен за оръжията, които получава. Изглежда, че Байдън се е страхувал също толкова, колкото и Тръмп, конфликтът да не ескалира.
За да си отговорим на въпроса какво плаши Зеленски, е добре да се върнем назад и да видим кое е най-силното обещание, с което той печели изборите в Украйна със смазваща преднина пред Петро Порошенко през 2019 г. Тогава Зеленски обещава на украинците две неща: че ще смаже олигархията в страната и че ще промени драстично външнополитическия ѝ курс.
Част от опасенията на украинския лидер включват да не се разочарова от САЩ, защото това би означавало, че предава доверието на избирателите си, тъй като обещаната смяна на външнополитическия курс няма как да се изпълни без САЩ.
Зеленски възприема Америка като великия герой, който ще удари по масата и ще вкара Украйна в НАТО, разгромявайки Русия веднъж завинаги. Тези внушения се засилват с времето под влиянието на много европейски политици, които виждат във войната възможност да ревизират връзките си с Москва. Но нито Зеленски, нито Европа отчетоха, че Великите сили имат само вечни интереси, не и вечни приятели. Студеният прагматизъм на Тръмп сбъдва и най-големия страх на Зеленски – че Америка ще изостави Украйна така, както изостави Афганистан, Виетнам и големи части от Африка. Страх, който все повече започва да се усеща в Европа.
От какво се страхуват европейските политици?
Макар Европа да не е пряк участник в словесната престрелка между Тръмп и Зеленски, тя по всяка вероятност ще бъде пряко потърпевша от нея. Най-объркана от всички, разбира се, е Германия, която, подплатена с мрачните спомени от Втората световна война, години наред се страхува, че ще трябва да воюва отново. Ето че сега ще ѝ се наложи да направи точно това, ако Общността започне да гради своя армия.
Макрон, който на пръв поглед изглежда уверен заради френското ядрено оръжие, си дава ясна сметка, че ядрените триади на Париж и Лондон са ликвидирани след разпада на СССР, което няма да им позволи да опънат ядрен чадър над Стария континент в случай на нужда, а постигането на ядрен паритет с Русия е дълъг и сложен процес, който ще погребе завинаги спокойния живот на французите.
Останалата част от Западна Европа се страхува, че старата архитектура за сигурност вече я няма, а испанци, португалци и скандинавци ще трябва да се вдъхновяват от културното наследство на рицарите и викингите, за да градят армиите си наново.
Най-уплашени обаче са Централна и Източна Европа, тъй като много държави в региона смятат, че те са следващите, ако Украйна падне.
А Британия е уплашена, че Голямата война ще почне отново и Лондон ще трябва да защитава… Европейския съюз, който напусна. За британците в крайна сметка Първата световна война е много по-болезнен спомен, отколкото битката с Хитлер, защото тогава империята губи почти всичките си колонии.
И нека все пак не забравяме, че за част от европейските политици кризата на глобалния либерален ред е шок, а за други – неизбежна реалност. Но най-големият страх на европейските лидери е, че в Овалния кабинет може да ги сполети същото, което сполетя и Зеленски. И то не за друго, а защото един дребен знак на неуважение към Тръмп може да коства на съответната държава всичко в отношенията ѝ със САЩ.
От какво се страхуват Путин и Си Дзинпин?
Всъщност в тази графа могат да бъдат поместени не само Русия и Китай, но и много съюзници на САЩ, които искат да избегнат глобален военен конфликт. Големите страхове на Русия всъщност са свързани с престъпването на червените линии, отвъд които тя би употребила ядрено оръжие срещу Украйна – ако властта на руския президент бъде застрашена или ако самото съществуване на Русия бъде поставено на карта. За администрацията на Путин съществуването ѝ е равносилно на съществуването на руската държава. Последните промени в руската ядрена доктрина го доказват, а нагласите са ясни: ако Русия види, че губи войната, ще използва всички средства, за да го предотврати.
Някой би възразил, че завоюването на територии, чиято инфраструктура е напълно разрушена и обезлюдена, не е никаква победа, но в руското съзнание е точно обратното – достатъчно е тези територии да са руски и е без значение, че гражданите може да бъдат изложени на радиация. Началото на войната в Украйна, в което мнозина се съмняваха, и инцидентът в Чернобил от 1986 г. са историческото доказателство за тези нагласи.
И точно тук идва изходът от уравнението – оказва се, че Тръмп и Путин се страхуват от едно и също. Затова и ходовете им са толкова идентични. Затова и искат едно и също – край на войната на каквато и да е цена.
По аналогичен начин стоят нещата и със страховете на Китай. Си Дзинпин очевидно иска да се запише в китайската история като най-силния лидер от Мао Дзъдун насам. Това може да стане само по два начина – чрез обединение с Тайван или ако Китай успее да задмине САЩ. Една война между големите ще унищожи всякакви перспективи и за двете. Неговите страхове са общи с тези на Путин и Тръмп и затова той е склонен да се договори с тях, но все повече се отдалечава от европейците. Китайската карта на Кисинджър беше позорно проиграна от Европейския съюз, който влоши отношенията си с Китай заради САЩ и сега това започва да се обръща срещу него, като остава сам срещу САЩ, Русия и Китай.
Равносметката
Разгорещеният разговор между Тръмп и Зеленски от 28 февруари на практика доказва, че страховете на САЩ и Европа вече са много различни, за да ги обединяват. Вашингтон, който десетилетия наред беше критикуван от европейците, че се меси в делата им и им пречи, най-сетне реши да намали ангажимента си към Европа. Но това създаде много повече проблеми, отколкото реши. По време на Студената война Ричард Никсън на няколко пъти заплашва европейците, че САЩ няма да воюват с СССР заради тях, а Джими Картър до последно вярва, че мирното съжителство с Москва е възможно и че държавите от Съветския блок следва да са в нейната зона на влияние, за да може суперсилите да живеят в мир.
Парадоксално, тогава страховете на Вашингтон, Москва и Брюксел са общи – да не би в един момент балансът на силите да се наруши така, че да се стигне до Трета световна война. Ето защо автори като Робърт Джървис твърдят, че двуполюсният свят съвсем не е дилема на сигурността, а сблъсък на две системи – социализъм и капитализъм.
Днес обаче страховете на лидерите силно се разминават. Голяма част от европейските елити все още не си дават сметка за реалната опасност от ядрена война, а Русия умишлено използва ядрен шантаж, за да манипулира липсата на рационални възприятия какво може да се случи. Някой би казал, че при Тръмп шантажът работи, а при Европа – не. Трудно можем да отречем обаче, че кризата на политическото представителство е дотолкова повсеместна и дълбока, че кара избирателите в демократични държави да гласуват за лидери, които после проклинат, или пък да се възхищават на авторитарни вождове, които виждат като новите господари на света.
Разговорът между Тръмп и Зеленски в този смисъл е завършеният продукт от кризата на либералната демокрация, в която се сблъскват един от най-богатите президенти на САЩ и лидер, който с помощта на проамериканската оръжейна индустрия се опитва да унищожи проруската олигархия в Украйна и да защитава нападнатата си страна.
В това уравнение не е включена средната класа, а политиците от миналото, които се стремяха да я запазят, вече ги няма, за да формират приемлив за всички консенсус и диалог.
Остава въпросът трябва ли наистина да тестваме готовността на ядрените сили да воюват и до каква степен. Рационалният отговор е, че това не бива да се случва, защото днес във Вашингтон и Москва не стоят Кенеди и Хрушчов, а Тръмп и Путин.
This alignment with DESC requirements demonstrates our continued commitment to adhere to the heightened expectations for CSPs. Government customers of AWS can run their applications in AWS Cloud-certified Regions with confidence.
The independent third-party auditor (BSI) issued the Certificate of Compliance to AWS on behalf of DESC on January 23, 2025. The Certificate of Compliance that illustrates the compliance status of AWS is available through AWS Artifact. AWS Artifact is a self-service portal for on-demand access to AWS compliance reports. Sign in to AWS Artifact in the AWS Management Console, or learn more at Getting Started with AWS Artifact.
The certification includes 11 additional services in scope, for a total of 98 services. This is a 13% year-on-year increase in the number of services in the Middle East (UAE) Region that are in scope of the DESC CSP certification. For up-to-date information, including when additional services are added, see the AWS Services in Scope by Compliance Program webpage and choose DESC CSP.
AWS strives to continuously bring services into the scope of its compliance programs to help you adhere to your architectural and regulatory needs. If you have questions or feedback about DESC compliance, reach out to your AWS account team.
To learn more about our compliance and security programs, see AWS Compliance Programs. As always, we value your feedback and questions; reach out to the AWS Compliance team through the Contact Us page.
If you have feedback about this post, submit comments in the Comments section below.
Functional programming languages have a long association with graphs. In the
1990s, it was even thought that parallel graph-reduction
architectures could make functional programming languages much faster than their
imperative counterparts. Alas, that prediction mostly failed to materialize.
Even though graphs are still used as a theoretical formalism in order to define
and optimize functional languages (such as Haskell’s
spineless tagless graph-machine), they are still mostly compiled down to the same old
non-parallel assembly code that every other language uses. Now, two
projects —
Bend and
Vine — have sprung up attempting to change that, and prove that
parallel graph reduction can be a useful technique for real programs.
Data sharing has become a crucial aspect of driving innovation, contributing to growth, and fostering collaboration across industries. According to this Gartner study, organizations promoting data sharing outperform their peers on most business value metrics. A straightforward data access and sharing mechanism is crucial for enabling effective data sharing across an organization. There are challenges such as complexity in managing cross-account permissions and difficulty in discovering the right data across accounts that organizations face when trying to share data products across AWS accounts. Amazon DataZone is a fully managed data management service that customers can use to catalog, discover, share, and govern data stored across Amazon Web Services (AWS).
In this post, we will cover how you can use Amazon DataZone to facilitate data collaboration between AWS accounts.
Solution overview
This solution provides a streamlined way to enable cross-account data collaboration using Amazon DataZone domain association while maintaining security and governance. This post describes the process of using the business data catalog resource of Amazon DataZone to publish data assets so they’re discoverable by other accounts. After they’ve been published, you can query the published assets from another AWS account using analytical tools such as Amazon Athena and the Amazon Redshift query editor, as shown in the following figure.
In this solution (as shown in the preceding figure), the AWS account that contains the data assets is referred to as the producer account. The AWS account that needs to access or use the data from the producer account is referred to as the consumer account. The Amazon DataZone domain is created and managed within the producer account and then the consumer account is associated with that domain.
As part of Amazon DataZone domain association, Amazon DataZone uses AWS Resource Access Manager (AWS RAM) to share the resource. When the producer and consumer AWS accounts are in the same organization within AWS Organizations, the domain association happens automatically. If the producer and consumer AWS accounts are in different organizations, AWS RAM sends an invitation to the consumer AWS account to accept or reject the resource grant.
This solution presents three Amazon DataZone user personas as:
Data administrators: Account owners in both producer and consumer AWS accounts. The data administrators are responsible for creating Amazon DataZone domains, configuring domain associations, and accepting domain associations within the Amazon DataZone domain.
Data publishers: Users in producer AWS accounts. The data publishers are responsible for creating Amazon DataZone publish projects and environments, producing and publishing data assets, and accepting subscription requests.
Data subscribers: Users in consumer AWS accounts. The data subscribers are responsible for creating Amazon DataZone subscribe projects and environments, searching for and subscribing to data assets, and querying the data and deriving insights.
Prerequisites
To follow along with the instructions, you will need:
Two AWS accounts, one serving as producer and other account serving as consumer. Create new AWS accounts if necessary.
A secret in AWS Secrets Manager storing the master user credentials for the Amazon Redshift cluster or workgroup in the producer and consumer AWS accounts.
The data administrators are responsible for creating secrets.
The data producers and consumers can obtain the Amazon Resource Name (ARN) of the secrets from the data administrators during the environment or environment profile creation steps.
Amazon DataZone uses Amazon Redshift Datashares to share data across clusters and accounts. There are specific requirements and limitations for using Amazon Redshift datashares.
Data sharing is supported only for provisioned ra3 cluster types (ra3.16xlarge, ra3.4xlarge, and ra3.xlplus) and Amazon Redshift Serverless.
Walkthrough:
The following are the high level steps to configure cross-account access. We’ve provided step-by-step instructions in the following sections.
Create an Amazon DataZone domain in the producer account. The data administrator creates an Amazon DataZone domain.
Request Amazon DataZone domain association from the producer account to the consumer account.
Accept the domain association request in the consumer account. The data administrator accepts the domain association.
Add data users to the Amazon DataZone domain.
Create the necessary publish project for AWS Glue and Amazon Redshift in the producer account.
Create AWS Glue and Amazon Redshift environments to publish the data assets in the producer account.
Create and run a data source for AWS Glue and Amazon Redshift to publish assets into the business catalog.
Create subscribe projects for AWS Glue and Amazon Redshift.
Create AWS Glue and Amazon Redshift environment profiles and environments in the subscribe project
Subscribe to AWS Glue and Amazon Redshift tables. Consume the data using Athena and Amazon redshift editors. This step is performed by the data subscriber.
Create the Amazon DataZone domain in the producer account
Amazon DataZone domains serve as high-level organizational units for assets, users, and projects, facilitating cross-team and cross-account collaboration. This step focusses on creating the Amazon DataZone domain in the producer account.
Create an Amazon DataZone domain titled Demo_cross_account_domain using the instructions at create domains.
On the Create domain screen, select Quick setup checkbox to automate several configuration steps, saving time and reducing the potential for setup errors. Quick setup enables two default blueprints and creates the default environment profiles for the data lake and data warehouse default blueprints.
Request Amazon DataZone domain association from the producer account to the consumer account
To associate the Amazon DataZone domain with the consumer account, the producer account requests a domain association. This involves providing necessary information about the consumer account and granting appropriate permissions for data access and management.
Sign in to the Amazon DataZone console of the producer account using the data administrator credentials.
Navigate to the domain detail page, and then scroll down and select the Associated Accounts tab.
Enter the consumer account IDs that you want to request association. Choose Add another account if you want to add more than one account. When you’re satisfied with the list of account IDs, choose Request association.
Use the latest (AWS RAM DataZonePortalReadWrite policy when requesting the account association. This policy allows users in the consumer account to execute Amazon DataZone APIs and to use the data portal interface.
Accept an account association request from an Amazon DataZone domain
This step focuses on accepting the account association request from the Amazon DataZone domain in the consumer account. This allows the consumer account to be linked with the Amazon DataZone domain to enable data sharing and collaboration between the producer and consumer accounts.
Sign in to the consumer account and go to the Amazon DataZone console in the same AWS Region as the domain. On the Amazon DataZone home page, choose View requests.
Select the name of the inviting Amazon DataZone domain and choose Review request.
Choose Accept association, you should see the Demo_cross_account_domain state as associated in the Associated domains screen
Choose the domain for which you want to enable an environment blueprint.
From the Blueprints list, choose either the DefaultDataLake blueprint
On the Permissions and resources page, for enabling the DefaultDataLake blueprint, for Glue Manage Access role, specify a new role that grants Amazon DataZone authorization to ingest and manage access to tables in AWS Glue and AWS Lake Formation.
Repeat steps 4 to 6 to enable the DefaultDataWarehouse blueprint by choosing DefaultDataWarehouse instead of DefaultDataLake
Add data users to the Amazon DataZone domain
To grant access to the Amazon DataZone data portal from the console for data publisher and data Subscriber IAM users, use the following steps to add them in the User Management section of the Amazon DataZone domain. See Manage users in the Amazon DataZone console for additional details.
Select the Amazon DataZone domain and, in the User management section,chooseAddand selectAdd IAM users.
On the Add users page, choose Current account and add the user ARN of the data producer and choose Add users.
Next chooseAssociated account, and enter the data subscriber user’s ARN and add the user by choosing Add users.
Create the publish project for AWS Glue and Amazon Redshift
This step focuses on creating the publish project for AWS Glue and Amazon Redshift in the producer account. The project will be used to publish data from your data sources to the appropriate AWS services.
Select View domains and select the demo_cross_account_domain.
Choose the Open data portal link and sign in to the data portal.
Choose Create New Project and create a project named Glue_Publish_Project for publishing AWS Glue data assets and create the project under demo_cross_account_domain.
Create another project named Redshift_Publish_Project for publishing Amazon Redshift data assets, also under the demo_cross_account_domain.
Create AWS Glue and Amazon Redshift environments to publish the data assets
In this step, you set up AWS Glue and Amazon Redshift environments in the producer account to share data assets. The required infrastructure, such as the AWS Glue Data Catalog and Redshift cluster for storing data, should already be in place. After setup, this will allow the consumer account to access and use the shared data assets. See Create a new environment for detailed instructions on creating a new environment.
Create the AWS Glue environment and a new AWS Glue table
In the same Amazon DataZone domain demo_cross_account_domain, choose Browse Project and select the Glue_Publish_Project and create Glue_Publish_Environment using the default DataLakeProfile.
Leave the producer_glue_db_name, consumer_glue_db_name and Workgroup_name blank.
Choose Create Environment and wait for the process to complete.
After the environment is created, browse the list of available projects and choose Glue_publish_project.
Next, navigate to the Glue_Publish_Environment, and under Analytics tools, choose Amazon Athena to open the Athena query editor
Choose Open Athena and make sure that Glue_Publish_Environment is selected in the Amazon DataZone environment dropdown at the upper right and that in Data on the left, glue_publish_environment_pub_db is selected as the Database.
Create a new AWS Glue table for publishing to Amazon DataZone. Paste the following create table as select (CTAS) query script in the Query window and run it to create a new table named mkt_sls_table. The script creates a table with sample marketing and sales data.
CREATE TABLE mkt_sls_table AS
SELECT 146776932 AS ord_num, 23 AS sales_qty_sld, 23.4 AS wholesale_cost, 45.0 as lst_pr, 43.0 as sell_pr, 2.0 as disnt, 12 as ship_mode,13 as warehouse_id, 23 as item_id, 34 as ctlg_page, 232 as ship_cust_id, 4556 as bill_cust_id
UNION ALL SELECT 46776931, 24, 24.4, 46, 44, 1, 14, 15, 24, 35, 222, 4551
UNION ALL SELECT 46777394, 42, 43.4, 60, 50, 10, 30, 20, 27, 43, 241, 4565
UNION ALL SELECT 46777831, 33, 40.4, 51, 46, 15, 16, 26, 33, 40, 234, 4563
UNION ALL SELECT 46779160, 29, 26.4, 50, 61, 8, 31, 15, 36, 40, 242, 4562
UNION ALL SELECT 46778595, 43, 28.4, 49, 47, 7, 28, 22, 27, 43, 224, 4555
UNION ALL SELECT 46779482, 34, 33.4, 64, 44, 10, 17, 27, 43, 52, 222, 4556
UNION ALL SELECT 46779650, 39, 37.4, 51, 62, 13, 31, 25, 31, 52, 224, 4551
UNION ALL SELECT 46780524, 33, 40.4, 60, 53, 18, 32, 31, 31, 39, 232, 4563
UNION ALL SELECT 46780634, 39, 35.4, 46, 44, 16, 33, 19, 31, 52, 242, 4557
UNION ALL SELECT 46781887, 24, 30.4, 54, 62, 13, 18, 29, 24, 52, 223, 4561
Go to the Tables and Views section and verify that the mkt_sls_table table was successfully created.
Create the Amazon Redshift publish environment and a new Redshift table
Staying in the same Amazon DataZone domain demo_cross_account_domain, choose Browse Project, to create an Amazon Redshift publish environment, select the Redshift_Publish_Project and create Redshift_Publish_Environment using the default data warehouse profile.
To configure environment parameters, enter the name of your Amazon Redshift cluster or workgroup, specify the database name and enter the AWS Secrets Manager secret ARN for the Redshift cluster or workgroup. You need to make sure that the secret in Secrets Manager includes the following tags. These tags help Amazon DataZone implement proper access control so that only authorized users within the correct Amazon DataZone project and domain can access the Amazon Redshift resource:
For Amazon Redshift cluster: DataZone.rs.cluster: <cluster_name:database name>
For Amazon Redshift Serverless workgroup: DataZone.rs.workgroup: <workgroup_name:database_name>
AmazonDataZoneProject:<projectID>
AmazonDataZoneDomain: <domainID>For more information for creating redshift database user secret in secret manager, see Storing database credentials in AWS Secrets Manager.
Note that the database user you provide in Secrets Manager must have superuser permissions. Data publishers should work with the data administrator to get the details of the Redshift cluster or workgroup, database name, and secret ARN.
The schema is optional.
Choose Create Environment and wait for the process to complete.
Verify that the environment is created successfully without errors.
Browse the list of available projects and select Redshift_publish_project. Navigate to Redshift_publish_environment.
Under Analytics tools, choose Amazon Redshift to open the Amazon Redshift query editor.
Select the Redshift cluster that you want to connect, choose Save and then choose Create Connection using temporary credentials with your IAM identity.
Create a new Redshift table. You can use the CTAS query to create a new table named rs_sls_tbl. Use the provided CTAS script, which creates a table with sample sales data in the datazone_env_redshift_publish_environment schema.
CREATE TABLE "datazone_env_redshift_publish_environment"."rs_sls_tbl" AS
SELECT 146776932 AS ord_num, 23 AS sales_qty_sld, 23.4 AS wholesale_cost, 45.0 as lst_pr, 43.0 as sell_pr, 2.0 as disnt, 12 as ship_mode,13 as warehouse_id, 23 as item_id, 34 as ctlg_page, 232 as ship_cust_id, 4556 as bill_cust_id
UNION ALL SELECT 46776931, 24, 24.4, 46, 44, 1, 14, 15, 24, 35, 222, 4551
UNION ALL SELECT 46777394, 42, 43.4, 60, 50, 10, 30, 20, 27, 43, 241, 4565
UNION ALL SELECT 46777831, 33, 40.4, 51, 46, 15, 16, 26, 33, 40, 234, 4563
UNION ALL SELECT 46779160, 29, 26.4, 50, 61, 8, 31, 15, 36, 40, 242, 4562
UNION ALL SELECT 46778595, 43, 28.4, 49, 47, 7, 28, 22, 27, 43, 224, 4555
UNION ALL SELECT 46779482, 34, 33.4, 64, 44, 10, 17, 27, 43, 52, 222, 4556
UNION ALL SELECT 46779650, 39, 37.4, 51, 62, 13, 31, 25, 31, 52, 224, 4551
UNION ALL SELECT 46780524, 33, 40.4, 60, 53, 18, 32, 31, 31, 39, 232, 4563
UNION ALL SELECT 46780634, 39, 35.4, 46, 44, 16, 33, 19, 31, 52, 242, 4557
UNION ALL SELECT 46781887, 24, 30.4, 54, 62, 13, 18, 29, 24, 52, 223, 4561
Make sure that the rs_sls_tbl table is successfully created.
Publish assets into the common business catalog
In this step, you create and run the Amazon DataZone data sources for AWS Glue and Amazon Redshift. You will then publish the data assets from these data sources.
The Amazon DataZone data sources allow you to connect to various data sources, including databases, data warehouses, and data lakes, and ingest metadata into Amazon DataZone. By creating and running these data sources, you can make your data available for analysis, transformation, and sharing within your organization.
After the data sources are set up, you can publish the data assets from these sources to make them accessible to other users and applications. This process involves mapping the data assets to the appropriate business terms and metadata, making sure that the data is properly described and categorized.
Add an AWS Glue data source to publish the new AWS Glue table.
Choose Select project from the top navigation pane and select the Glue_Publish_Project that you want to add the data source to.
Select the Glue_Publish_Environment.
Choose Create data source. Enter glue-publish-datasource as the name.
Under Data source type, choose AWS Glue.
Under Select an environment, select Glue_Publish_Environment.
Under Data selection, select the AWS Glue database glue_publish_environment_pub_db, enter your table selection criteria as “*“, and then and choose Next.
Leave all other setting as default and choose Next.
For Run Preference, select Run on demand to ingest metadata from the specified AWS Glue tables into Amazon DataZone.
Review and choose Create.
After the data source has been created choose Run. The mkt_sls_table will be listed in the inventory and available to publish.
Select the mkt_sls_table table and review the metadata that was generated. Choose Accept All if you’re satisfied with the metadata.
Choose Publish Asset and the mkt_sls_tabletable will be published to the business data catalog, making it discoverable and understandable across your organization.
Add an Amazon Redshift data source to publish the new Amazon Redshift table.
Choose Select project from the top navigation pane and select the Redshift_Publish_Project that you want to add the data source to.
Choose the Redshift_Publish_Environment.
Choose Create data source. Enter rs-publish-datasource as the name.
Under Data source type, select Amazon Redshift.
Under Select an environment, select Redshift_Publish_Environment.
Under Redshift Credentials, enter the Redshift cluster and secret details provided by the data administrator.
Under Data Selection, select the database dev and schema datazone_env_redshift_publish_environment.
Keep other setting as default and choose Next.
For Run Preference, select Run on Demand.
Choose Save. After the data source is created, choose Run. The data source runs and the rs_sls_tblwill be listed in the inventory and available to publish.
Select the rs_sls_tbl table and review the metadata that was generated. Choose Accept All if you are satisfied with the metadata.
Choose Publish Asset and the rs_sls_tabletable will be published to the business data catalog.
Create subscribe projects for AWS Glue and Amazon Redshift
In this step, you create the projects for subscribing to AWS Glue and Amazon Redshift data assets within your Amazon DataZone domain.
Sign in to the Amazon DataZone console as a data subscriber IAM user using the consumer account.
Choose Associated domains and select the demo_cross_account_domain.
Select the Open data portal link and sign in to the data portal.
Choose Create New Project and create a project named Glue_Subscribe_Project for subscribing to the AWS Glue data assets.
Create another project named Redshift_Subscribe_Project for subscribing to the Redshift data assets.
Create AWS Glue and Amazon Redshift environment profiles
In this step, you will set up the environment profiles and environments for AWS Glue and Amazon Redshift in your Amazon DataZone projects. This will allow you to connect and interact with resources across AWS accounts.
The purpose of environment profiles in Amazon DataZone is to streamline the process of environment creation. By using environment profiles, you can preconfigure essential placement information such as AWS account and AWS Region. In this solution, you will configure environment profiles with placement information pointing to your consumer account.
You will also create an Amazon DataZone environment from the profiles you are about to create. This will provision the necessary resources in the consumer account and establish the connections between the Amazon DataZone domain and the consumer account. After the environments are created, you can work with AWS Glue and Amazon Redshift assets seamlessly across different AWS accounts within your Amazon DataZone ecosystem.
Create an AWS Glue profile and environment
Stay signed in the consumer account’s Amazon DataZone console as a data subscriber IAM, select the Environments tab and then choose Create environment profile.
Configure the fields as follows:
Name: Enter glue_subscribe-env-profile.
Owner: The project where the profile is being created is selected by default in this field. Verify that it’s Glue_Subscribe_Project.
Blueprint: Select Default Data Lake.
AWS account parameters: Enter the consumer AWS account number and select the Region.
Authorized projects: Select All projects.
Publishing: Select Publish from any database.
Choose Create Environment Profile.
On the Create environment page, enter the following:
Name: Enter glue_subscribe_environment.
Verify that the Environment profile is set to glue_subscribe-env-profile.
(Optional) Parameters: Enter the Producer glue db name, Consumer glue db name, and Workgroup name.
Choose Create environment.
It takes a few minutes for the environment to be created. Verify that the environment creation is successful without any errors.
Create a Redshift environment profile and environment
Staying in the consumer account’s Amazon DataZone management console as a data subscriber IAM user, navigate to the Redshift_Subscribe_Project you created previously.
Select the Environments tab and then choose Create environment profile.
Configure the fields as follows:
Name: Enter redshift_subscribe-env-profile.
Owner: Verify that Project is set to Redshift_Subscribe_Project.
Blueprint: Select Default Data Warehouse.
Parameter set: Select Enter my own.
AWS account parameters: Enter the consumer AWS account number and select the Region.
Parameters: Select either Amazon Redshift Cluster or Amazon Redshift Serverless in the consumer account.
AWS Secret ARN: Enter the AWS Secrets Manager secret ARN for the Redshift cluster or workgroup. You need to make sure that the secret in Secrets Manager includes the following tags. These tags help Amazon DataZone implement proper access control so that only authorized users within the correct Amazon DataZone project and domain can access the Amazon Redshift resource.
Note that the database user you provide in AWS Secrets Manager must have superuser permissions. Data publishers should work with the data administrator to get the details of the Redshift cluster or workgroup, database name, and secret ARN.
Redshift cluster name: Enter the name of the Amazon Redshift cluster or Amazon Redshift Serverless workgroup.
Database name: Enter the name of the database within the selected Amazon Redshift cluster or Amazon Redshift Serverless workgroup
Authorized projects: Select All projects.
Publishing: Select Publish any schema.
Choose Create environment profile.
Create an environment from this profile: Create an environment from this profile:
Name: Enter redshift_subscribe_environment.
Verify that the Environment profile is set to redshift_subscribe-env-profile.
Choose Create Environment.
It takes a few minutes for the environment to be created. Verify that the environment creation is successful without any errors.
Subscribe to the AWS Glue and Redshift tables
In this step, you will subscribe AWS Glue and Amazon redshift tables published by the data producer.
Subscribe to the AWS Glue table
Sign in to the Amazon DataZone console of the consumer account using the data subscriber credentials and navigate to the Glue_Subscribe_project you created previously.
Search for the Market Sales Table in the Search bar.
Select the Market Sales Table and choose Subscribe.
In the Subscribe pop-up window, provide the following information:
Project: Enter the name of the project that you want to subscribe to the asset. By default this will be Glue_Subscribe_Project.
Enter a justification for your subscription request.
Choose Subscribe.
Switch to the data publisher role to approve the subscription request, then back to data subscriber after choosing Approve.
Select the Glue_subscribe_project and choose Subscribed Assets. Verify that the Market Sales Table is added to your environment.
Navigate to the Amazon Athena query editor using the link in the project’s home page.
Choose OPEN AMAZON ATHENA.
You will now be automatically routed to the Athena console, make sure that the Amazon DataZone Environment is set to glue_subscribe_environment.
For Database, select glue_subscribe_environment_sub_db.
You should see the mkt_sls_table in the Tables list. Preview the table by choosing the three-dot menu next to the table name and selecting Preview Table
Review the table preview results. You will be able to see all the sales related data from the mkt_sls_table
Subscribe to the Redshift table
Stay signed in to the Amazon DataZone management console as the data subscriber, Choose Select project from the top navigation pane and select the Redshift_Subscribe_project.
Search for Sales Table in the search bar, and select the Sales Table.
In the Subscribe pop-up window, provide the following information:
Project: Enter the name of the project that you want to subscribe to the asset. By default this will be Redshift_Subscribe_Project.
Enter a justification for your subscription request.
Choose Subscribe.
Switch back to the data publisher who is the producer of the Market Sales Table choose Approve.
After the subscription request is approved, switch back to data subscriber.
Select the Redshift_subscribe_project and choose Subscribed Assets. After the Sales Table is added to your environment, you can query the data in the table.
Select the Amazon Redshift link in the right side panel of the project home page and navigate to the Amazon Redshift query editor.
Select Open Amazon Redshift and the Redshift query editor v2 will open in a new tab.
In the query editor, right-click your Amazon DataZone environment’s Amazon Redshift cluster and select Create a connection.
Select Temporary credentials using your IAM identity for authentication.
If that authentication method isn’t available, open Account settings by choosing the gear icon in the bottom left corner, choose Authenticate with IAM credentials and choose Save.
Enter the name of the Amazon DataZone environment’s database to create the connection.
Choose Create connection.
You can now view the Redshift table rs_sls_tbl in the datazone_env_redshift_subscribe_environment.
Execute the following query to make sure the data is accessible
SELECT * FROM "dev"."datazone_env_redshift_subscribe_environment"."rs_sls_tbl";
You will be able to preview the rs_sls_tbl which will show the sale data from the table.
Clean up
To avoid unnecessary future charges, follow these steps:
Organizations often face significant challenges when trying to share data products across multiple AWS accounts. These challenges stem from the complexity of configuring proper cross-account access permissions and roles while maintaining robust data governance and security controls.
You can use the solution described in the post to publish and consume data across AWS accounts and make sure that reliable access and consistent data governance is in place. By combining the power of AWS Glue and Amazon Redshift, you can unlock valuable insights and accelerate your data-driven decision-making processes.
In this post, you followed a step-by-step guide to set up cross-account data sharing using Amazon DataZone domain association. You learned how to publish data assets from a producer account. You also learned how to subscribe to and query the published assets from a consumer account. You can optionally use AWS Lake Formation access monitoring to view permissions and data access activities. AWS Lake Formation uses AWS CloudTrail for historical analysis and CloudTrail retains logs for 90 days by default.
Now that you’re familiar with the elements involved in cross-account data sharing using Amazon DataZone and your choice of analytical tool, you’re ready to try it with multiple accounts.
About the Authors
Arun Pradeep Selvaraj is a Senior Solutions Architect at AWS. Arun is passionate about working with his customers and stakeholders on digital transformations and innovation in the cloud while continuing to learn, build and reinvent. He is creative, fast-paced, deeply customer-obsessed, and uses the working backwards process to build modern architectures to help customers solve their unique challenges. Connect with him on LinkedIn.
Piyush Mattoo is a Senior Solution Architect for the Financial Services Data Provider segment at Amazon Web Services. He’s a software technology leader with over a decade of experience building scalable and distributed software systems to enable business value through the use of technology. He has an educational background in Computer Science with a master’s degree in computer and information science from University of Massachusetts. He is based out of Southern California and current interests include camping and nature walks.
Mani Yamaraja is a Senior Customer Solutions Manager for Financial Services Data Provider segment at Amazon Web Services. He has over a decade long experience working with financial services customers enabling their digital transformation journey. Mani adopts a customer centric approach and provides technology solutions working backwards from customer’s business goals. He is passionate about the financial services industry and helps the customers accelerate their cloud based transformation using the proven mechanisms of AWS.
The Xen Project has announced
the release of Xen 4.20. This release adds support for
AMD Zen 5 CPUs, improved compliance with the MISRA C standard,
work on PCI-passthrough on Arm, and more. Xen 4.20 also removes
support for Xeon
Phi CPUs, which were discontinued
in 2018. See the feature
list and release
notes for more information.
The collective thoughts of the interwebz
Manage Consent
To provide the best experiences, we use technologies like cookies to store and/or access device information. Consenting to these technologies will allow us to process data such as browsing behavior or unique IDs on this site. Not consenting or withdrawing consent, may adversely affect certain features and functions.
Functional
Always active
The technical storage or access is strictly necessary for the legitimate purpose of enabling the use of a specific service explicitly requested by the subscriber or user, or for the sole purpose of carrying out the transmission of a communication over an electronic communications network.
Preferences
The technical storage or access is necessary for the legitimate purpose of storing preferences that are not requested by the subscriber or user.
Statistics
The technical storage or access that is used exclusively for statistical purposes.The technical storage or access that is used exclusively for anonymous statistical purposes. Without a subpoena, voluntary compliance on the part of your Internet Service Provider, or additional records from a third party, information stored or retrieved for this purpose alone cannot usually be used to identify you.
Marketing
The technical storage or access is required to create user profiles to send advertising, or to track the user on a website or across several websites for similar marketing purposes.