Post Syndicated from Techmoan original https://www.youtube.com/watch?v=QVc0n0_WrXw
Седмицата (26 февруари – 2 март)
Post Syndicated from Боряна Телбис original https://www.toest.bg/sedmitsata-26-fevruari-2-mart/

Преди 47 години човечеството е успяло да създаде машина, която толкова да го обича, че да се обърне и да му направи една последна снимка от Космоса, преди да изключи камерата за всичко останало завинаги. Става въпрос за космическата сонда „Вояджър 1“, която днес се намира на ръба на Слънчевата система, в безкрайното нищо, на милиарди километри от нас. Освен това леко се е побъркала и данните, които изпраща, са абсолютно неразчетими, но никой не я хули за това. Защото този необичаен пътешественик свърши много повече работа и стигна много по-далече, отколкото изобщо някой някога си е представял. През 1990 г. именно „Вояджър 1“ ни оставя онази прословута снимка на малката синя точка, която изглежда като изгорял пиксел на черен екран. Днес космическите телескопи ни пращат къде-къде по-детайлни изображения, но нищо не може да се сравни с бледосинята пясъчна люспа, която „Вояджър 1“ ни показа за последно. На нея е всичко.
Вече втора седмица поред в „Тоест“ се вълнуваме какво става и какво ще стане с „Вояджър 1“, защото краят на сондата ще бъде и краят на цяла епоха. Миналата седмица за това ни разказа Михаил Ангелов в своите научни новини, а сега публикуваме една изключително емоционална и също толкова информативна статия за „Вояджър 1“, която вкарва по симпатичен начин в исторически контекст целия разказ около изстрелването на сондата и ни подръчква да си позволим да сме малко по-чувствителни и сантиментални, което ние, разбира се, избягваме да правим просто защото няма време за всичко. Статията е на Дъг Мюър, публикуваме я с неговото специално разрешение, а преводът е на Анелия Костова.
Обираме леко патоса и преместваме погледа си от далечния Космос към твърде близката и натопорчена политическа реалност, която на фона на вечността изглежда крайно несъществено. Но понеже предстои така напоително обговаряната ротация, се налага да кажем няколко думи и за нея. Прави го Емилия Милчева в текста си „Осми март, ден първи“, като задава правилните въпроси:
кога и как ще бъде скрепен документално съюзът – ще бъдат ли заложени реформи на основни системи, или ще се ограничат до механизма за назначения, изобщо ще се стигне ли до кооперативно равновесие, от което (и) обществото да има известни ползи?
Дали сглобката ще премине в по-стабилен строеж, предстои да разберем. Междувременно тунел „Железница“ на автомагистрала „Струма“ премина от строителен обект в годна за експлоатация инфраструктурна единица. Оказа се обаче, че самите ние като нация може би не сме съвсем преминали в настоящия век, защото продължаваме да живеем като едни предмодерни българи, които вграждат икони в тунели и невести в мостове, за да сме по-сигурни в стабилността на самото съоръжение. По този въпрос разсъждава в текста си „Икони вместо работещи институции“ Светла Енчева.
От потенциалните външни разпади на мостове, тунели и сглобки минаваме към едни много по-важни и много по-крехки – вътрешните разпади на душата на малки уязвими в самотата си съставни части. На тях е посветена тазседмичната рецензия на Антония Апостолова. Книгата на фокус в рубриката „На второ четене“ е сборникът с разкази „Академия за китове“ от Виолета Златарева, в която се разказва за хората с нестандартна психика и за миговете, в които не са съвсем себе си.
В една Малайзия с лют сос и съкровища ви предлагаме да се оттеглим като за финал на тазседмичния „Тоест“. Това е първата част от пътеписа на Петя Кокудева за живописната азиатска страна, където покрай пътищата растат помело, манго, драконов плод и ананас, макаци могат да ти откраднат телефона само защото го мислят за храна, а ако ти самият искаш нещо да закусиш, съвсем спокойно може да го направиш с един лют ориз.
Приятно четене на новия „Тоест“.
Supermicro AOC-A25G-i2SM 25GbE NIC Review Intel E810-XXVAM2
Post Syndicated from Rohit Kumar original https://www.servethehome.com/supermicro-aoc-a25g-i2sm-25gbe-nic-review-intel-e810-xxvam2/
In our Supermicro AOC-A25G-i2SM review, we see how this dual 25GbE SFP28 NIC performs based on the Intel E810-XXVAM2 controller
The post Supermicro AOC-A25G-i2SM 25GbE NIC Review Intel E810-XXVAM2 appeared first on ServeTheHome.
Comic for 2024.03.02 – Predator
Post Syndicated from Explosm.net original https://explosm.net/comics/predator
New Cyanide and Happiness Comic
Friday Squid Blogging: New Extinct Species of Vampire Squid Discovered
Post Syndicated from Bruce Schneier original https://www.schneier.com/blog/archives/2024/03/friday-squid-blogging-new-extinct-species-of-vampire-squid-discovered.html
Paleontologists have discovered a 183-million-year-old species of vampire squid.
Prior research suggests that the vampyromorph lived in the shallows off an island that once existed in what is now the heart of the European mainland. The research team believes that the remarkable degree of preservation of this squid is due to unique conditions at the moment of the creature’s death. Water at the bottom of the sea where it ventured would have been poorly oxygenated, causing the creature to suffocate. In addition to killing the squid, it would have prevented other creatures from feeding on its remains, allowing it to become buried in the seafloor, wholly intact.
Research paper.
As usual, you can also use this squid post to talk about the security stories in the news that I haven’t covered.
Read my blog posting guidelines here.
Mistral AI models now available on Amazon Bedrock
Post Syndicated from Donnie Prakoso original https://aws.amazon.com/blogs/aws/mistral-ai-models-now-available-on-amazon-bedrock/
Last week, we announced that Mistral AI models are coming to Amazon Bedrock. In that post, we elaborated on a few reasons why Mistral AI models may be a good fit for you. Mistral AI offers a balance of cost and performance, fast inference speed, transparency and trust, and is accessible to a wide range of users.
Today, we’re excited to announce the availability of two high-performing Mistral AI models, Mistral 7B and Mixtral 8x7B, on Amazon Bedrock. Mistral AI is the 7th foundation model provider offering cutting-edge models in Amazon Bedrock, joining other leading AI companies like AI21 Labs, Anthropic, Cohere, Meta, Stability AI, and Amazon. This integration provides you the flexibility to choose optimal high-performing foundation models in Amazon Bedrock.
Mistral 7B is the first foundation model from Mistral AI, supporting English text generation tasks with natural coding capabilities. It is optimized for low latency with a low memory requirement and high throughput for its size. Mixtral 8x7B is a popular, high-quality, sparse Mixture-of-Experts (MoE) model, that is ideal for text summarization, question and answering, text classification, text completion, and code generation.
Here’s a quick look at Mistral AI models on Amazon Bedrock:

Getting Started with Mistral AI Models
To get started with Mistral AI models in Amazon Bedrock, first you need to get access to the models. On the Amazon Bedrock console, select Model access, and then select Manage model access. Next, select Mistral AI models, and then select Request model access.

Once you have the access to selected Mistral AI models, you can test the models with your prompts using Chat or Text in the Playgrounds section.

Programmatically Interact with Mistral AI Models
You can also use AWS Command Line Interface (CLI) and AWS Software Development Kit (SDK) to make various calls using Amazon Bedrock APIs. Following, is a sample code in Python that interacts with Amazon Bedrock Runtime APIs with AWS SDK:
import boto3
import json

bedrock = boto3.client(service_name="bedrock-runtime")

prompt = "<s>[INST] INSERT YOUR PROMPT HERE [/INST]"

body = json.dumps({
    "prompt": prompt,
    "max_tokens": 512,
    "top_p": 0.8,
    "temperature": 0.5,
})

modelId = "mistral.mistral-7b-instruct-v0:2"

accept = "application/json"
contentType = "application/json"

response = bedrock.invoke_model(
    body=body,
    modelId=modelId,
    accept=accept,
    contentType=contentType
)

print(json.loads(response.get('body').read()))
Mistral AI models in action
By integrating your application with AWS SDK to invoke Mistral AI models using Amazon Bedrock, you can unlock possibilities to implement various use cases. Here are a few of my personal favorite use cases using Mistral AI models with sample prompts. You can see more examples on Prompting Capabilities from the Mistral AI documentation page.
Text summarization — Mistral AI models extract the essence from lengthy articles so you quickly grasp key ideas and core messaging.
You are a summarization system. In clear and concise language, provide three short summaries in bullet points of the following essay.

# Essay:
{insert essay text here}
Personalization — The core AI capabilities of understanding language, reasoning, and learning, allow Mistral AI models to personalize answers with more human-quality text. The accuracy, explanation capabilities, and versatility of Mistral AI models make them useful at personalization tasks, because they can deliver content that aligns closely with individual users.
You are a mortgage lender customer service bot, and your task is to create personalized email responses to address customer questions. Answer the customer's inquiry using the provided facts below. Ensure that your response is clear, concise, and directly addresses the customer's question. Address the customer in a friendly and professional manner. Sign the email with "Lender Customer Support."

# Facts
<INSERT FACTS AND INFORMATION HERE>

# Email
{insert customer email here}
Code completion — Mistral AI models have an exceptional understanding of natural language and code-related tasks, which is essential for projects that need to juggle computer code and regular language. Mistral AI models can help generate code snippets, suggest bug fixes, and optimize existing code, accelerating your development process.
[INST] You are a code assistant. Your task is to generate a 5 valid JSON object based on the following properties:
name:
lastname:
address:
Just generate the JSON object without explanations:
[/INST]
Things You Have to Know
Here are few additional information for you:
- Availability — Mistral AI’s Mixtral 8x7B and Mistral 7B models in Amazon Bedrock are available in the US West (Oregon) Region.
- Deep dive into Mistral 7B and Mixtral 8x7B — If you want to learn more about Mistral AI models on Amazon Bedrock, you might also enjoy this article titled “Mistral AI – Winds of Change” prepared by my colleague, Mike.
Now Available
Mistral AI models are available today in Amazon Bedrock, and we can’t wait to see what you’re going to build. Get yourself started by visiting Mistral AI on Amazon Bedrock.
Happy building,
— Donnie
Metasploit Weekly Wrap-Up 03/01/2024
Post Syndicated from Christophe De La Fuente original https://blog.rapid7.com/2024/03/01/metasploit-weekly-wrap-up-03-01-2024/
Connect the dots from authentication bypass to remote code execution
This week, our very own sfewer-r7 added a new exploit module that leverages an authentication bypass vulnerability in ConnectWise ScreenConnect to achieve remote code execution. This vulnerability, CVE-2024-1709, affects all versions of ConnectWise ScreenConnect up to and including 23.9.7.The module creates a new administrator user account on the server, which is used it to upload a malicious extension (.ashx file) and get code execution as the NT AUTHORITY\SYSTEM user on Windows or root user on Linux, depending on the target platform.
New module content (1)
ConnectWise ScreenConnect Unauthenticated Remote Code Execution
Authors: WatchTowr and sfewer-r7
Type: Exploit
Pull request: #18870 contributed by sfewer-r7
Path: multi/http/connectwise_screenconnect_rce_cve_2024_1709
Description: This PR adds an unauthenticated RCE exploit for ConnectWise ScreenConnect (CVE-2024-1709).
Enhancements and features (8)
- #18830 from sjanusz-r7 – Aligns the behavior of the MSSQL, PostgreSQL, and MySQL sessions. This functionality is currently behind a feature flag enabled with the
featurescommand. - #18833 from zeroSteiner – This catches an exception when updating a non-existing session. Prior to this PR, trying to run ‘sessions -k’ after running ‘workspace -D’ would result in a stack trace being printed to the console. This resolves issue #18561.
- #18849 from adfoster-r7 – Adjusts the logic used for the visual indentation of tables.
- #18872 from zgoldman-r7 – Updates the MSSQL modules to support querying database rows that contain boolean bit values.
- #18878 from adfoster-r7 – This updates a number of rspec gems which help improve test suite error messages when string encodings are different.
- #18879 from zeroSteiner – Updates the
auxiliary/admin/kerberos/inspect_ticketmodule with improved error messages and support for printing Kerberos PAC credential information. - #18892 from zeroSteiner – Allows users to leverage the latest ADCS ESC13 technique. These changes are related to the identification of misconfigured certificate templates and workflow documentation.
ldap_esc_vulnerable_cert_finderandldap_querywere also updated to improve usability. - #18893 from sjanusz-r7 – Updates the
helpcommand to visually align command names to the same width to improve readability.
Bugs fixed (2)
- #18873 from cgranleese-r7 – Fixes a regression that caused a
CreateSessionoption to be available for payloads that did not make sense. - #18880 from jmartin-tech – Fixes a bug with the
auxiliary/capture/ldapmodule’s handling of NTLM hashes.
Documentation
You can find the latest Metasploit documentation on our docsite at docs.metasploit.com.
Get it
As always, you can update to the latest Metasploit Framework with msfupdate
and you can get more details on the changes since the last blog post from
GitHub:
If you are a git user, you can clone the Metasploit Framework repo (master branch) for the latest.
To install fresh without using git, you can use the open-source-only Nightly Installers or the
commercial edition Metasploit Pro
How BMO improved data security with Amazon Redshift and AWS Lake Formation
Post Syndicated from Amy Tseng original https://aws.amazon.com/blogs/big-data/how-bmo-improved-data-security-with-amazon-redshift-and-aws-lake-formation/
This post is cowritten with Amy Tseng, Jack Lin and Regis Chow from BMO.
BMO is the 8th largest bank in North America by assets. It provides personal and commercial banking, global markets, and investment banking services to 13 million customers. As they continue to implement their Digital First strategy for speed, scale and the elimination of complexity, they are always seeking ways to innovate, modernize and also streamline data access control in the Cloud. BMO has accumulated sensitive financial data and needed to build an analytic environment that was secure and performant. One of the bank’s key challenges related to strict cybersecurity requirements is to implement field level encryption for personally identifiable information (PII), Payment Card Industry (PCI), and data that is classified as high privacy risk (HPR). Data with this secured data classification is stored in encrypted form both in the data warehouse and in their data lake. Only users with required permissions are allowed to access data in clear text.
Amazon Redshift is a fully managed data warehouse service that tens of thousands of customers use to manage analytics at scale. Amazon Redshift supports industry-leading security with built-in identity management and federation for single sign-on (SSO) along with multi-factor authentication. The Amazon Redshift Spectrum feature enables direct query of your Amazon Simple Storage Service (Amazon S3) data lake, and many customers are using this to modernize their data platform.
AWS Lake Formation is a fully managed service that simplifies building, securing, and managing data lakes. It provides fine-grained access control, tagging (tag-based access control (TBAC)), and integration across analytical services. It enables simplifying the governance of data catalog objects and accessing secured data from services like Amazon Redshift Spectrum.
In this post, we share the solution using Amazon Redshift role based access control (RBAC) and AWS Lake Formation tag-based access control for federated users to query your data lake using Amazon Redshift Spectrum.
Use-case
BMO had more than Petabyte(PB) of financial sensitive data classified as follows:
- Personally Identifiable Information (PII)
- Payment Card Industry (PCI)
- High Privacy Risk (HPR)
The bank aims to store data in their Amazon Redshift data warehouse and Amazon S3 data lake. They have a large, diverse end user base across sales, marketing, credit risk, and other business lines and personas:
- Business analysts
- Data engineers
- Data scientists
Fine-grained access control needs to be applied to the data on both Amazon Redshift and data lake data accessed using Amazon Redshift Spectrum. The bank leverages AWS services like AWS Glue and Amazon SageMaker on this analytics platform. They also use an external identity provider (IdP) to manage their preferred user base and integrate it with these analytics tools. End users access this data using third-party SQL clients and business intelligence tools.
Solution overview
In this post, we’ll use synthetic data very similar to BMO data with data classified as PII, PCI, or HPR. Users and groups exists in External IdP. These users federate for single sign on to Amazon Redshift using native IdP federation. We’ll define the permissions using Redshift role based access control (RBAC) for the user roles. For users accessing the data in data lake using Amazon Redshift Spectrum, we’ll use Lake Formation policies for access control.
Technical Solution
To implement customer needs for securing different categories of data, it requires the definition of multiple AWS IAM roles, which requires knowledge in IAM policies and maintaining those when permission boundary changes.
In this post, we show how we simplified managing the data classification policies with minimum number of Amazon Redshift AWS IAM roles aligned by data classification, instead of permutations and combinations of roles by lines of business and data classifications. Other organizations (e.g., Financial Service Institute [FSI]) can benefit from the BMO’s implementation of data security and compliance.
As a part of this blog, the data will be uploaded into Amazon S3. Access to the data is controlled using policies defined using Redshift RBAC for corresponding Identity provider user groups and TAG Based access control will be implemented using AWS Lake Formation for data on S3.
Solution architecture
The following diagram illustrates the solution architecture along with the detailed steps.

- IdP users with groups like
lob_risk_public,Lob_risk_pci,hr_public, andhr_hprare assigned in External IdP (Identity Provider). - Each users is mapped to the Amazon Redshift local roles that are sent from IdP, and including
aad:lob_risk_pci,aad:lob_risk_public,aad:hr_public, andaad:hr_hprin Amazon Redshift. For example, User1 who is part ofLob_risk_publicandhr_hprwill grant role usage accordingly. - Attach
iam_redshift_hpr,iam_redshift_pcipii, andiam_redshift_publicAWS IAM roles to Amazon Redshift cluster. - AWS Glue databases which are backed on s3 (e.g.,
lobrisk,lobmarket,hrand their respective tables) are referenced in Amazon Redshift. Using Amazon Redshift Spectrum, you can query these external tables and databases (e.g.,external_lobrisk_pci,external_lobrisk_public,external_hr_public, andexternal_hr_hpr), which are created using AWS IAM rolesiam_redshift_pcipii,iam_redshift_hpr,iam_redshift_publicas shown in the solutions steps. - AWS Lake Formation is used to control access to the external schemas and tables.
- Using AWS Lake Formation tags, we apply the fine-grained access control to these external tables for AWS IAM roles (e.g.,
iam_redshift_hpr,iam_redshift_pcipii, andiam_redshift_public). - Finally, grant usage for these external schemas to their Amazon Redshift roles.
Walkthrough
The following sections walk you through implementing the solution using synthetic data.
Download the data files and place your files into buckets
Amazon S3 serves as a scalable and durable data lake on AWS. Using Data Lake you can bring any open format data like CSV, JSON, PARQUET, or ORC into Amazon S3 and perform analytics on your data.
The solutions utilize CSV data files containing information classified as PCI, PII, HPR, or Public. You can download input files using the provided links below. Using the downloaded files upload into Amazon S3 by creating folder and files as shown in below screenshot by following the instruction here. The detail of each file is provided in the following list:
- credit_card_transaction_PCI_public – Contains credit card transactions categorized as public data and visible to principals who has access to public data.
- credit_card_transaction_PCI – Contains credit card numbers and accessed to only principals who has access or clearance to PCI data.
- lob_risk_High_confidential_public – Contains business reports that are accessed or shared by public.
- lob_risk_High_confidential– Contains confidential business reports only selected principals (e.g., head or leader of the line of business has access).
- customers_PII_HPR_public – Contains customer data accessed by the principals with public clearance.
- customers_PII_HPR– Contains personally identifiable information data accessed by HR principals with HPR certain principals.

Register the files into AWS Glue Data Catalog using crawlers
The following instructions demonstrate how to register files downloaded into the AWS Glue Data Catalog using crawlers. We organize files into databases and tables using AWS Glue Data Catalog, as per the following steps. It is recommended to review the documentation to learn how to properly set up an AWS Glue Database. Crawlers can automate the process of registering our downloaded files into the catalog rather than doing it manually. You’ll create the following databases in the AWS Glue Data Catalog:
lobrisklobmarkethr
Example steps to create an AWS Glue database for lobrisk data are as follows:
- Go to the AWS Glue Console.
- Next, select Databases under Data Catalog.
- Choose Add database and enter the name of databases as lobrisk.
- Select Create database, as shown in the following screenshot.

Repeat the steps for creating other database like lobmarket and hr.
An AWS Glue Crawler scans the above files and catalogs metadata about them into the AWS Glue Data Catalog. The Glue Data Catalog organizes this Amazon S3 data into tables and databases, assigning columns and data types so the data can be queried using SQL that Amazon Redshift Spectrum can understand. Please review the AWS Glue documentation about creating the Glue Crawler. Once AWS Glue crawler finished executing, you’ll see the following respective database and tables:
lobrisklob_risk_high_confidential_publiclob_risk_high_confidential
lobmarketcredit_card_transaction_pcicredit_card_transaction_pci_public
hrcustomers_pii_hpr_publiccustomers_pii_hpr
Example steps to create an AWS Glue Crawler for lobrisk data are as follows:
- Select Crawlers under Data Catalog in AWS Glue Console.
- Next, choose Create crawler. Provide the crawler name as
lobrisk_crawlerand choose Next.

Make sure to select the data source as Amazon S3 and browse the Amazon S3 path to the lob_risk_high_confidential_public folder and choose an Amazon S3 data source.

- Crawlers can crawl multiple folders in Amazon S3. Choose Add a data source and include path
S3://<<Your Bucket >>/ lob_risk_high_confidential.

- After adding another Amazon S3 folder, then choose Next.

- Next, create a new IAM role in the Configuration security settings.
- Choose Next.

- Select the Target database as
lobrisk. Choose Next.

- Next, under Review, choose Create crawler.
- Select Run Crawler. This creates two tables :
lob_risk_high_confidential_publicandlob_risk_high_confidentialunder databaselobrisk.

Similarly, create an AWS Glue crawler for lobmarket and hr data using the above steps.
Create AWS IAM roles
Using AWS IAM, create the following IAM roles with Amazon Redshift, Amazon S3, AWS Glue, and AWS Lake Formation permissions.
You can create AWS IAM roles in this service using this link. Later, you can attach a managed policy to these IAM roles:
iam_redshift_pcipii(AWS IAM role attached to Amazon Redshift cluster)AmazonRedshiftFullAccessAmazonS3FullAccess- Add inline policy (Lakeformation-inline) for Lake Formation permission as follows:
iam_redshift_hpr(AWS IAM role attached to Amazon Redshift cluster): Add the following managed:AmazonRedshiftFullAccessAmazonS3FullAccess- Add inline policy (Lakeformation-inline), which was created previously.
iam_redshift_public(AWS IAM role attached to Amazon Redshift cluster): Add the following managed policy:AmazonRedshiftFullAccessAmazonS3FullAccess- Add inline policy (Lakeformation-inline), which was created previously.
LF_admin(Lake Formation Administrator): Add the following managed policy:AWSLakeFormationDataAdminAWSLakeFormationCrossAccountManagerAWSGlueConsoleFullAccess
Use Lake Formation tag-based access control (LF-TBAC) to access control the AWS Glue data catalog tables.
LF-TBAC is an authorization strategy that defines permissions based on attributes. Using LF_admin Lake Formation administrator, you can create LF-tags, as mentioned in the following details:
| Key | Value |
|---|---|
| Classification:HPR | no, yes |
| Classification:PCI | no, yes |
| Classification:PII | no, yes |
| Classifications | non-sensitive, sensitive |
Follow the below instructions to create Lake Formation tags:
- Log into Lake Formation Console (
https://console.aws.amazon.com/lakeformation/) using LF-Admin AWS IAM role. - Go to LF-Tags and permissions in Permissions sections.
- Select Add LF-Tag.

- Create the remaining LF-Tags as directed in table earlier. Once created you find the LF-Tags as show below.

Assign LF-TAG to the AWS Glue catalog tables
Assigning Lake Formation tags to tables typically involves a structured approach. The Lake Formation Administrator can assign tags based on various criteria, such as data source, data type, business domain, data owner, or data quality. You have the ability to allocate LF-Tags to Data Catalog assets, including databases, tables, and columns, which enables you to manage resource access effectively. Access to these resources is restricted to principals who have been given corresponding LF-Tags (or those who have been granted access through the named resource approach).
Follow the instruction in the give link to assign LF-TAGS to Glue Data Catalog Tables:
| Glue Catalog Tables | Key | Value |
|---|---|---|
customers_pii_hpr_public |
Classification | non-sensitive |
customers_pii_hpr |
Classification:HPR | yes |
credit_card_transaction_pci |
Classification:PCI | yes |
credit_card_transaction_pci_public |
Classifications | non-sensitive |
lob_risk_high_confidential_public |
Classifications | non-sensitive |
lob_risk_high_confidential |
Classification:PII | yes |
Follow the below instructions to assign a LF-Tag to Glue Tables from AWS Console as follows:
- To access the databases in Lake Formation Console, go to the Data catalog section and choose Databases.
- Select the lobrisk database and choose View Tables.
- Select lob_risk_high_confidential table and edit the LF-Tags.
- Assign the Classification:HPR as Assigned Keys and Values as Yes. Select Save.

- Similarly, assign the Classification Key and Value as non-sensitive for the
lob_risk_high_confidential_publictable.

Follow the above instructions to assign tables to remaining tables for lobmarket and hr databases.
Grant permissions to resources using a LF-Tag expression grant to Redshift IAM Roles
Grant select, describe Lake Formation permission to LF-Tags and Redshift IAM role using Lake Formation Administrator in Lake formation console. To grant, please follow the documentation.
Use the following table to grant the corresponding IAM role to LF-tags:
| IAM role | LF-Tags Key | LF-Tags Value | Permission |
|---|---|---|---|
iam_redshift_pcipii |
Classification:PII | yes | Describe, Select |
| . | Classification:PCI | yes | . |
iam_redshift_hpr |
Classification:HPR | yes | Describe, Select |
iam_redshift_public |
Classifications | non-sensitive | Describe, Select |
Follow the below instructions to grant permissions to LF-tags and IAM roles:
- Choose Data lake permissions in Permissions section in the AWS Lake Formation Console.
- Choose Grants. Select IAM users and roles in Principals.
- In LF-tags or catalog resources select Key as
Classificationsand values asnon-sensitive.

- Next, select Table permissions as Select & Describe. Choose grants.

Follow the above instructions for remaining LF-Tags and their IAM roles, as shown in the previous table.
Map the IdP user groups to the Redshift roles
In Redshift, use Native IdP federation to map the IdP user groups to the Redshift roles. Use Query Editor V2.
Create External schemas
In Redshift, create External schemas using AWS IAM roles and using AWS Glue Catalog databases. External schema’s are created as per data classification using iam_role.
Verify list of tables
Verify list of tables in each external schema. Each schema lists only the tables Lake Formation has granted to IAM_ROLES used to create external schema. Below is the list of tables in Redshift query edit v2 output on top left hand side.

Grant usage on external schemas to different Redshift local Roles
In Redshift, grant usage on external schemas to different Redshift local Roles as follows:
Verify access to external schema
Verify access to external schema using user from Lob Risk team. User lobrisk_pci_user federated into Amazon Redshift local role rs_lobrisk_pci_role. Role rs_lobrisk_pci_role only has access to external schema external_lobrisk_pci.

On querying table from external_lobmarket_pci schema, you’ll see that your permission is denied.

BMO’s automated access provisioning
Working with the bank, we developed an access provisioning framework that allows the bank to create a central repository of users and what data they have access to. The policy file is stored in Amazon S3. When the file is updated, it is processed, messages are placed in Amazon SQS. AWS Lambda using Data API is used to apply access control to Amazon Redshift roles. Simultaneously, AWS Lambda is used to automate tag-based access control in AWS Lake Formation.

Benefits of adopting this model were:
- Created a scalable automation process to allow dynamically applying changing policies.
- Streamlined the user accesses on-boarding and processing with existing enterprise access management.
- Empowered each line of business to restrict access to sensitive data they own and protect customers data and privacy at enterprise level.
- Simplified the AWS IAM role management and maintenance by greatly reduced number of roles required.
With the recent release of Amazon Redshift integration with AWS Identity center which allows identity propagation across AWS service can be leveraged to simplify and scale this implementation.
Conclusion
In this post, we showed you how to implement robust access controls for sensitive customer data in Amazon Redshift, which were challenging when trying to define many distinct AWS IAM roles. The solution presented in this post demonstrates how organizations can meet data security and compliance needs with a consolidated approach—using a minimal set of AWS IAM roles organized by data classification rather than business lines.
By using Amazon Redshift’s native integration with External IdP and defining RBAC policies in both Redshift and AWS Lake Formation, granular access controls can be applied without creating an excessive number of distinct roles. This allows the benefits of role-based access while minimizing administrative overhead.
Other financial services institutions looking to secure customer data and meet compliance regulations can follow a similar consolidated RBAC approach. Careful policy definition, aligned to data sensitivity rather than business functions, can help reduce the proliferation of AWS IAM roles. This model balances security, compliance, and manageability for governance of sensitive data in Amazon Redshift and broader cloud data platforms.
In short, a centralized RBAC model based on data classification streamlines access management while still providing robust data security and compliance. This approach can benefit any organization managing sensitive customer information in the cloud.
About the Authors
 Amy Tseng is a Managing Director of Data and Analytics(DnA) Integration at BMO. She is one of the AWS Data Hero. She has over 7 years of experiences in Data and Analytics Cloud migrations in AWS. Outside of work, Amy loves traveling and hiking.
 Jack Lin is a Director of Engineering on the Data Platform at BMO. He has over 20 years of experience working in platform engineering and software engineering. Outside of work, Jack loves playing soccer, watching football games and traveling.
 Regis Chow is a Director of DnA Integration at BMO. He has over 5 years of experience working in the cloud and enjoys solving problems through innovation in AWS. Outside of work, Regis loves all things outdoors, he is especially passionate about golf and lawn care.
 Nishchai JM is an Analytics Specialist Solutions Architect at Amazon Web services. He specializes in building Big-data applications and help customer to modernize their applications on Cloud. He thinks Data is new oil and spends most of his time in deriving insights out of the Data.
 Harshida Patel is a Principal Solutions Architect, Analytics with AWS.
 Raghu Kuppala is an Analytics Specialist Solutions Architect experienced working in the databases, data warehousing, and analytics space. Outside of work, he enjoys trying different cuisines and spending time with his family and friends.
„Вояджър 1“: Съдбата на самотния пътешественик
Post Syndicated from Тоест original https://www.toest.bg/voyager-1-sudbata-na-samotniya-puteshestvenik/

Това е текстът на Дъг Муър за един необикновен пътешественик – космическата сонда „Вояджър 1“. Публикуваме статията с разрешението на автора ѝ, а преводът е на Анелия Костова.
На милиарди километри в края на Слънчевата система „Вояджър 1“ е полудял и е започнал да умира. Да започнем с „милиардите километри“. „Вояджър 1“ е изстрелян в началото на септември 1977 г. По същото време Джими Картър е обнадеждаващият нов президент. Югославия и СССР работят на пълен ход, както и American Motors, Pan Am, FW Woolworth, щандовете на Fotomat, книжарниците Borders и Pier 1.
Американците гледат „Щастливи дни“, M*A*S*H и „Ангелите на Чарли“ по телевизията; техните британски братовчеди гледат „Джордж и Милдред“, The Goodies и Том Бейкър като Четвъртия доктор Кой. По радиото Hotel California на The Eagles се редува с Dancing Queen на Abba. Повечето коли все още работят с оловен бензин, телефоните са с шайба, а интернет е странна идея, макар и съвсем близо до работещ прототип. Първият домашен компютър Apple II току-що е пуснат в продажба. Sex Pistols са в студиото и завършват Never Mind The Bollocks. Предстои им да тръгнат на турне само за три месеца и след това да се разделят, а след още една година Сид Вишъс ще умре от свръхдоза хероин.
Барак Обама е ученик в гимназията и живее при баба си и дядо си в Хонолулу, Хавай. Има добри оценки, но прекарва много време с приятелите си – любители на марихуаната. Борис Джонсън е закътан в елитния пансион „Ашдаун Хаус“, докато бракът на родителите му бавно се разпада. Въпреки че е само на 13, младият Борис вече е с характерната си прическа. Елвис е умрял в тоалетната преди няколко седмици. Това е лятото на „Междузвездни войни“. И „Вояджър 1“ се изстрелва, готов за обиколка на Слънчевата система.
Пътешественикът, който надмина всички очаквания
Няма начин да съберете цялата история на „Вояджър 1“ в една публикация. Ето накратко: „Вояджър 1“ е вторият космически кораб, прелетял покрай Юпитер, и първият, направил близки снимки на луните му. Прелетя и покрай Сатурн и изследва неговата луна Титан – единствената с атмосфера. След това полетя напред и още, и още по-нататък – за цели 40 години. Официално напусна Слънчевата система и навлезе в междузвездното пространство през 2012 г. „Вояджър 1“ просто продължи напред в безкрайната празнота. (Знаете за Златната плоча, нали? Стига, де, всички са чували за Златната плоча. Хем е сантиментално и сълзливо, хем невероятно и страхотно*.) „Вояджър 1“ остаря. Никога не е бил проектиран за това. Първоначалната му мисия трябваше да продължи малко повече от три години. Но той се оказа много по-силен, отколкото някой си е представял. И все пак времето побеждава всички ни.
Източникът му на енергия е генератор, пълен с радиоактивни изотопи, които постепенно се разпадат до стабилен изотоп на оловото. Година след година енергията намалява, нивата на мощност безмилостно падат. Година след година НАСА изключва инструментите на „Вояджър 1“, за да запази гаснещото мъждукане. Преди няколко години изключиха вътрешния му нагревател и смятаха, че това може да е краят.
Но инженерите от 70-те години на миналия век са проектирали нещата така, че издържат дълго, затова електрическата верига и вентилите продължиха да работят дори когато температурите паднаха толкова ниско, по-ниско от сух лед, по-студено от течен азот, наближавайки абсолютната нула. („Вояджър 1“ пази вътрешните си данни на дигитален диктофон. Да, диктофон, съхраняващ информация на магнитна лента. Но не е проектиран да функционира при 100 градуса под нулата. Не е проектиран да работи десетилетия, навивайки и пренавивайки лентата, зает с безкрайно пренаписване на данни. Но някак го прави.) „Вояджър 1“ продължи, докато се отдалечи на разстояние над 15 млрд. км. НАСА има страница, на която може да се проследи развитието на мисията му в реално време… докато все още продължава. Със скоростта на светлината Луната се намира приблизително на секунда и половина. Слънцето е на около 8 минути от нас. „Вояджър 1“ е на 22 часа път. Изпратете му радиосигнал на обяд в понеделник и ще получите отговор в сряда сутринта.
Малката синя точка
Бих могъл да продължа да разказвам надълго и нашироко за „Вояджър 1“ — за откритията, които е направил, за Deep Space Network, която е поддържала контакт през десетилетията, за непрекъснато намаляващия екип от застаряващи техници, поддържащи го жив с ограничен бюджет – колко невероятно е всичко това. Но ще се огранича само до бледосинята точка.

През 1990 г., точно преди камерата на „Вояджър 1“ да се изключи завинаги, сондата се обърна и погледна назад. Увеличи мащаба и направи снимка на Земята. Но вече беше толкова далече, че Земята се виждаше само като един бледосин пиксел. Погледнете най-дясната ивица светлина на снимката, малко под средата. Виждате ли това петънце? Не е дефект. Не е нещо изцапано на екрана ви. Това е Земята.
Това е тук. Това е вкъщи. Това сме ние. На него е изживял живота си всеки, когото обичаш, всеки, когото познаваш, всеки, за когото си чувал, всяко човешко същество, което някога е съществувало. Цялата ни радост и страдание, хиляди самонадеяни религии, идеологии и икономически доктрини, всеки ловец и събирач, всеки герой и страхливец, всеки създател и разрушител на цивилизация, всеки крал и селянин, всяка влюбена млада двойка, всяка майка и всеки баща, всяко пълно с надежди дете, всеки изобретател и изследовател, всеки морализатор, всеки корумпиран политик, всяка „суперзвезда“, всеки „върховен лидер“, всеки светец и грешник в историята на нашия вид са живели там – върху прашинка, осветена от слънчев лъч.
Карл Сейгън
„Вояджър 1“ продължи още 34 години след тази снимка. И все още върви. Напуснал е хватката на слънчевата гравитация, така че завинаги ще продължи да лети отвъд.
Мислехме, че знаем какъв ще е краят
Ето малко любопитни факти: „Вояджър 1“ държи рекорда за най-отдалечен активен космически кораб. Единственият друг претендент е малкият му брат – „Вояджър 2“, който имаше различен профил на мисията и изостана на милиарди километри. А всъщност „Вояджър 1“ е изстрелян втори, но брутално изпревари своя брат в космическото пространство.
Ето още малко любопитни факти: ако четете това през 2024 г., е много малко вероятно да доживеете счупването на този рекорд. Има само два други космически кораба извън Слънчевата система – „Вояджър 2“ и „Ню Харайзънс“. И двата ще умрат, преди да стигнат до „Вояджър 1“. И никой – нито НАСА, нито китайците, нито ЕС – в момента не планира да изстреля друг космически кораб на такива разстояния. На теория бихме могли. На практика имаме други приоритети.
Мислехме, че знаем какъв ще е краят „Вояджър 1“. Мощността постепенно, неизбежно ще намалее. Инструментите ще се изключат един по един. Сигналът ще стане по-слаб. Най-накрая или последният инструмент ще се повреди поради липса на мощност, или сигналът ще се изгуби. Но изобщо не очаквахме да полудее. През декември 2023 г. „Вояджър 1“ започна да изпраща обратно безсмислици вместо данни. Софтуерен проблем, макар и вероятно причинен от основен хардуерен проблем – удар на космически лъчи или страничен ефект от ниските температури, или просто стареене на оборудването, причиняващо произволни дефекти.
Проблемът беше, че безсмислиците идваха от софтуера за насочване на полета, който е нещо като операционна система. И нито едно действително функциониращо копие на тази операционна система не е останало на Земята. (Това е проблем, който НАСА отдавна реши. В наши дни всяка изстреляна космическа сонда има перфектен дубликат на Земята. Помните ли в „Марсианецът“ как имаха друго копие на Pathfinder, което стоеше под брезент в склад? Това е стандартна практика от 30 години. Но през 1977 г. никой още не се беше сетил да го направи.)
Контролът на мисията на „Вояджър 1“ представляваше няколко големи стаи, пълни със заети хора, компютри, гигантски екрани. Сега това е една стая в малка офис сграда в долината Сан Габриел, разположена между училище за кучета и „Макдоналдс“. Екипът за контрол на мисията се състои от шепа хора, нито един от които не е млад, а няколко са надхвърлили доста пенсионната възраст. И те се опитват да решат проблема, но в момента нещата не изглеждат добре. Не можеш просто да изтеглиш нова операционна система от 15 милиарда километра.
Ще трябва да открият проблема, да разберат дали е възможно заобиколно решение, и след това да го приложат… Всичко това с време за отиване и връщане от 45 часа за всяка комуникация със сонда, която се отдалечава от нас с милион километри на ден. Да, опитват се, но никой не възлага големи надежди. Така че в един момент – не утре, не следващата седмица, но в някакъв момент през следващите няколко месеца – екипът вероятно ще трябва да признае поражението си. Тогава ще обявят, че „Вояджър 1“ е официално приключил и е дошъл краят на една дълга песен. И това е всичко.
* През 1977 г. известната българска народна песен „Излел е Делю хайдутин“ в изпълнение на Валя Балканска е избрана от авторитетен комитет с председател Карл Сейгън да представлява част от културата на човешката раса пред извънземни цивилизации, както и да запази за идните поколения достиженията на земното наследство. Златната плоча е поставена в космическата станция „Вояджър 1“ и освен „Излел е Делю хайдутин“ съдържа още записи на Моцарт, Бетовен, Бах, автентични звуци и мелодии от различни епохи и култури. – Б.пр.
[$] An alternate pattern-matching conditional for Elisp
Post Syndicated from jake original https://lwn.net/Articles/961682/
One of the outcomes of the (extremely) lengthy discussion about using
Common Lisp features in Emacs Lisp (Elisp), which we looked at back in November, was an effort to
start removing some of those uses from Emacs. The rewrite of some of the
Elisp in Emacs that uses the Common Lisp library (cl-lib) was started by
Richard Stallman as a way to reduce the cognitive load needed for
maintaining Emacs itself. Since then, he has broadened his efforts to
simplify Elisp by adding a new pattern-matching
conditional that would be a competitor to pcase,
which is a longstanding macro that he finds overly complex.
Musl C library releases support for new architectures
Post Syndicated from daroc original https://lwn.net/Articles/964181/
On February 29, the musl project
announced release
1.2.5, including support for loongarch64 and riscv32. This
release also contains support for the
statx(),
preadv2(),
and pwritev2() system calls.
Introducing the AWS WAF traffic overview dashboard
Post Syndicated from Dmitriy Novikov original https://aws.amazon.com/blogs/security/introducing-the-aws-waf-traffic-overview-dashboard/
For many network security operators, protecting application uptime can be a time-consuming challenge of baselining network traffic, investigating suspicious senders, and determining how best to mitigate risks. Simplifying this process and understanding network security posture at all times is the goal of most IT organizations that are trying to scale their applications without also needing to scale their security operations center staff. To help you with this challenge, AWS WAF introduced traffic overview dashboards so that you can make informed decisions about your security posture when your application is protected by AWS WAF.
In this post, we introduce the new dashboards and delve into a few use cases to help you gain better visibility into the overall security of your applications using AWS WAF and make informed decisions based on insights from the dashboards.
Introduction to traffic overview dashboards
The traffic overview dashboard in AWS WAF displays an overview of security-focused metrics so that you can identify and take action on security risks in a few clicks, such as adding rate-based rules during distributed denial of service (DDoS) events. The dashboards include near real-time summaries of the Amazon CloudWatch metrics that AWS WAF collects when it evaluates your application web traffic.
These dashboards are available by default and require no additional setup. They show metrics—total requests, blocked requests, allowed requests, bot compared to non-bot requests, bot categories, CAPTCHA solve rate, top 10 matched rules, and more—for each web access control list (web ACL) that you monitor with AWS WAF.
You can access default metrics such as the total number of requests, blocked requests, and common attacks blocked, or you can customize your dashboard with the metrics and visualizations that are most important to you.
These dashboards provide enhanced visibility and help you answer questions such as these:
- What percent of the traffic that AWS WAF inspected is getting blocked?
- What are the top originating countries for the traffic that’s getting blocked?
- What are common attacks that AWS WAF detects and protects me from?
- How do my traffic patterns from this week compare with last week?
The dashboard has native and out-of-the-box integration with CloudWatch. Using this integration, you can navigate back and forth between the dashboard and CloudWatch; for example, you can get a more granular metric overview by viewing the dashboard in CloudWatch. You can also add existing CloudWatch widgets and metrics to the traffic overview dashboard, bringing your tried-and-tested visibility structure into the dashboard.
With the introduction of the traffic overview dashboard, one AWS WAF tool—Sampled requests—is now a standalone tab inside a web ACL. In this tab, you can view a graph of the rule matches for web requests that AWS WAF has inspected. Additionally, if you have enabled request sampling, you can see a table view of a sample of the web requests that AWS WAF has inspected.
The sample of requests contains up to 100 requests that matched the criteria for a rule in the web ACL and another 100 requests for requests that didn’t match rules and thus had the default action for the web ACL applied. The requests in the sample come from the protected resources that have received requests for your content in the previous three hours.
The following figure shows a typical layout for the traffic overview dashboard. It categorizes inspected requests with a breakdown of each of the categories that display actionable insights, such as attack types, client device types, and countries. Using this information and comparing it with your expected traffic profile, you can decide whether to investigate further or block the traffic right away. For the example in Figure 1, you might want to block France-originating requests from mobile devices if your web application isn’t supposed to receive traffic from France and is a desktop-only application.
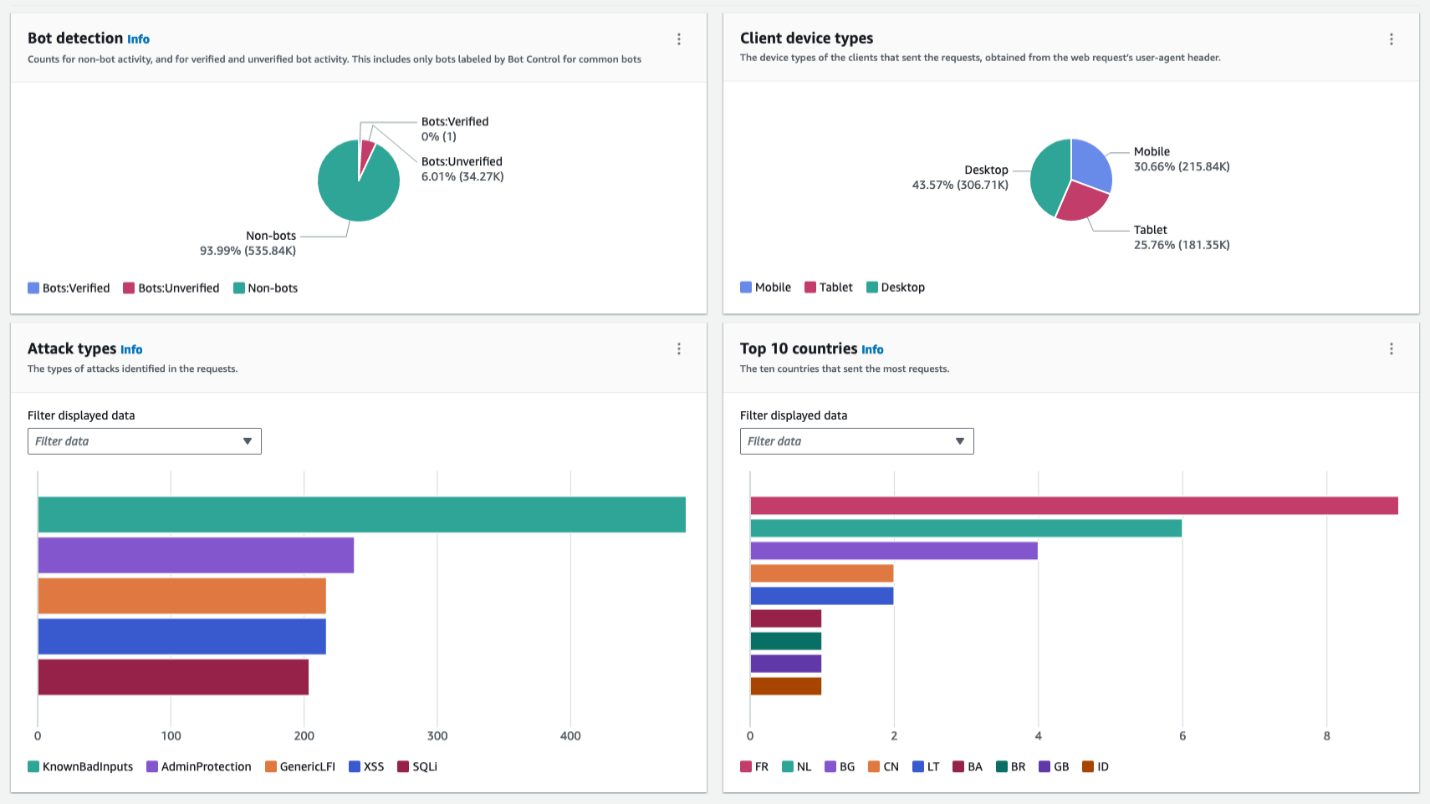
Figure 1: Dashboard with sections showing multiple categories serves as a single pane of glass
Use case 1: Analyze traffic patterns with the dashboard
In addition to visibility into your web traffic, you can use the new dashboard to analyze patterns that could indicate potential threats or issues. By reviewing the dashboard’s graphs and metrics, you can spot unusual spikes or drops in traffic that deserve further investigation.
The top-level overview shows the high-level traffic volume and patterns. From there, you can drill down into the web ACL metrics to see traffic trends and metrics for specific rules and rule groups. The dashboard displays metrics such as allowed requests, blocked requests, and more.
Notifications or alerts about a deviation from expected traffic patterns provide you a signal to explore the event. During your exploration, you can use the dashboard to understand the broader context and not just the event in isolation. This makes it simpler to detect a trend in anomalies that could signify a security event or misconfigured rules. For example, if you normally get 2,000 requests per minute from a particular country, but suddenly see 10,000 requests per minute from it, you should investigate. Using the dashboard, you can look at the traffic across various dimensions. The spike in requests alone might not be a clear indication of a threat, but if you see an additional indicator, such as an unexpected device type, this could be a strong reason for you to take follow-up action.
The following figure shows the actions taken by rules in a web ACL and which rule matched the most.
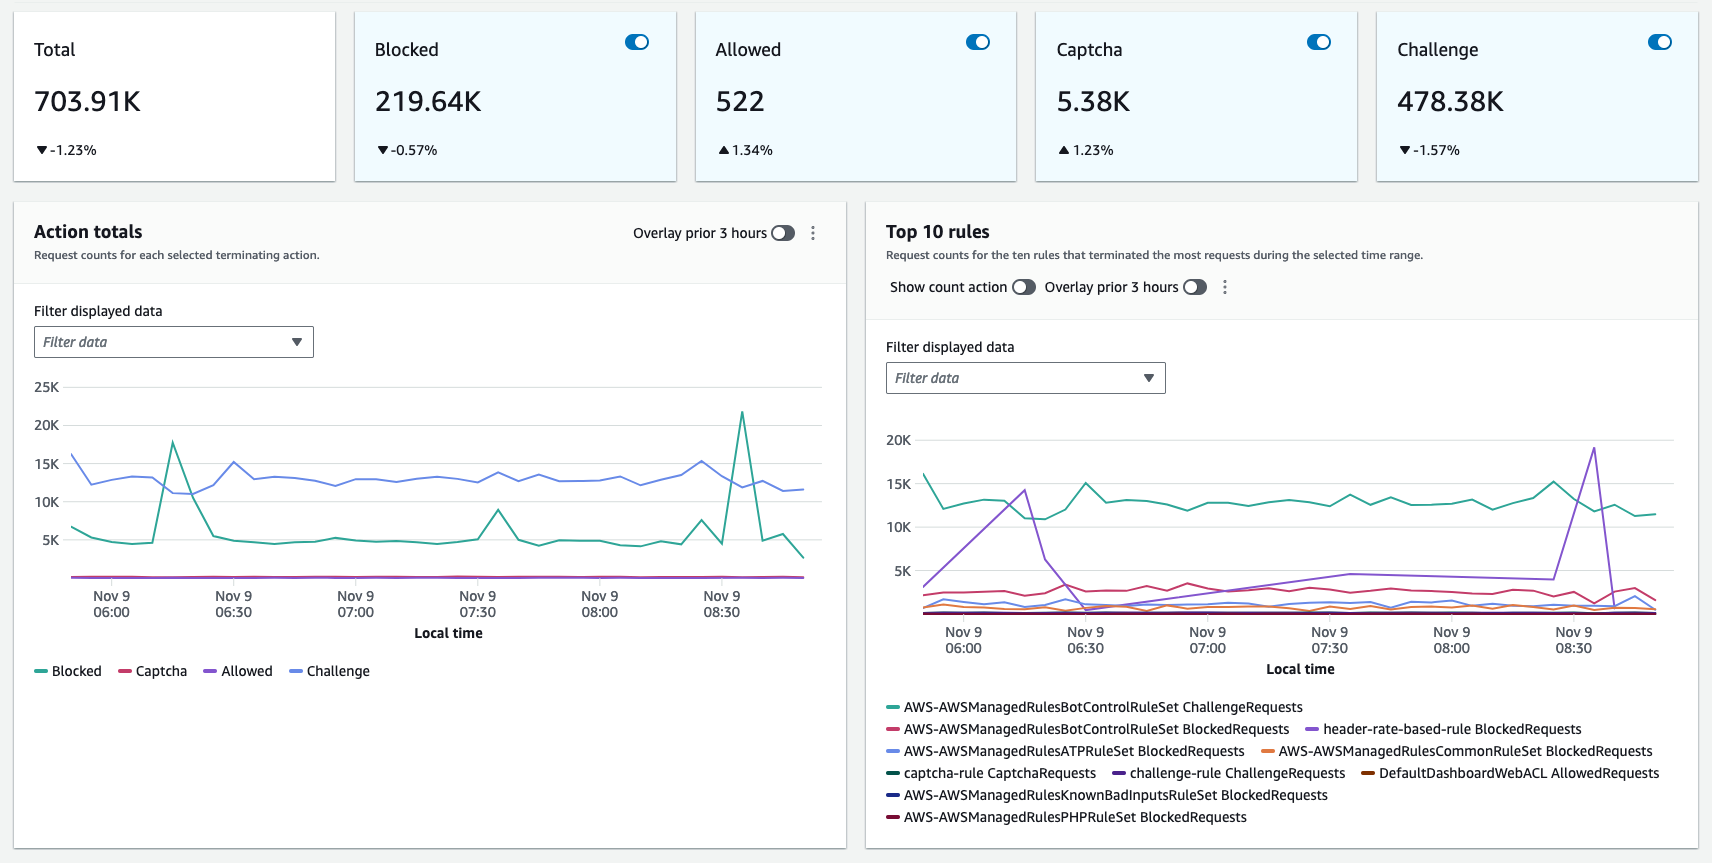
Figure 2: Multidimensional overview of the web requests
The dashboard also shows the top blocked and allowed requests over time. Check whether unusual spikes in blocked requests correspond to spikes in traffic from a particular IP address, country, or user agent. That could indicate attempted malicious activity or bot traffic.
The following figure shows a disproportionately larger number of matches to a rule indicating that a particular vector is used against a protected web application.
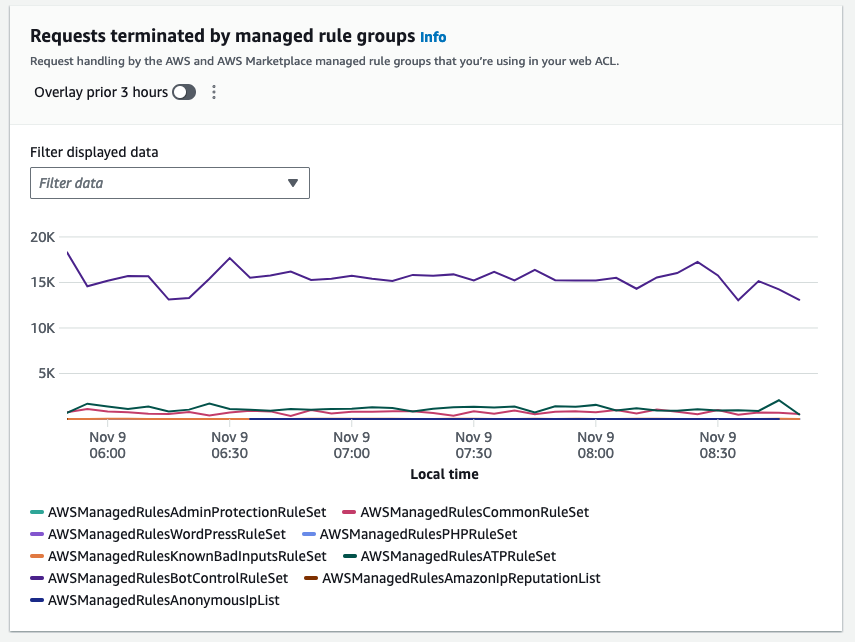
Figure 3: The top terminating rule could indicate a particular vector of an attack
Likewise, review the top allowed requests. If you see a spike in traffic to a specific URL, you should investigate whether your application is working properly.
Next steps after you analyze traffic
After you’ve analyzed the traffic patterns, here are some next steps to consider:
- Tune your AWS WAF rules to better match legitimate or malicious traffic based on your findings. You might be able to fine-tune rules to reduce false positives or false negatives. Tune rules that are blocking legitimate traffic by adjusting regular expressions or conditions.
- Configure AWS WAF logging, and if you have a dedicated security information and event management (SIEM) solution, integrate the logging to enable automated alerting for anomalies.
- Set up AWS WAF to automatically block known malicious IPs. You can maintain an IP block list based on identified threat actors. Additionally, you can use the Amazon IP reputation list managed rule group, which the Amazon Threat Research Team regularly updates.
- If you see spikes in traffic to specific pages, check that your web applications are functioning properly to rule out application issues driving unusual patterns.
- Add new rules to block new attack patterns that you spot in the traffic flows. Then review the metrics to help confirm the impact of the new rules.
- Monitor source IPs for DDoS events and other malicious spikes. Use AWS WAF rate-based rules to help mitigate these spikes.
- If you experience traffic floods, implement additional layers of protection by using CloudFront with DDoS protection.
The new dashboard gives you valuable insight into the traffic that reaches your applications and takes the guesswork out of traffic analysis. Using the insights that it provides, you can fine-tune your AWS WAF protections and block threats before they affect availability or data. Analyze the data regularly to help detect potential threats and make informed decisions about optimizing.
As an example, if you see an unexpected spike of traffic, which looks conspicuous in the dashboard compared to historical traffic patterns, from a country where you don’t anticipate traffic originating from, you can create a geographic match rule statement in your web ACL to block this traffic and prevent it from reaching your web application.
The dashboard is a great tool to gain insights and to understand how AWS WAF managed rules help protect your traffic.
Use case 2: Understand bot traffic during onboarding and fine-tune your bot control rule group
With AWS WAF Bot Control, you can monitor, block, or rate limit bots such as scrapers, scanners, crawlers, status monitors, and search engines. If you use the targeted inspection level of the rule group, you can also challenge bots that don’t self-identify, making it harder and more expensive for malicious bots to operate against your website.
On the traffic overview dashboard, under the Bot Control overview tab, you can see how much of your current traffic is coming from bots, based on request sampling (if you don’t have Bot Control enabled) and real-time CloudWatch metrics (if you do have Bot Control enabled).
During your onboarding phase, use this dashboard to monitor your traffic and understand how much of it comes from various types of bots. You can use this as a starting point to customize your bot management. For example, you can enable common bot control rule groups in count mode and see if desired traffic is being mislabeled. Then you can add rule exceptions, as described in AWS WAF Bot Control example: Allow a specific blocked bot.
The following figure shows a collection of widgets that visualize various dimensions of requests detected as generated by bots. By understanding categories and volumes, you can make an informed decision to either investigate by further delving into logs or block a specific category if it’s clear that it’s unwanted traffic.
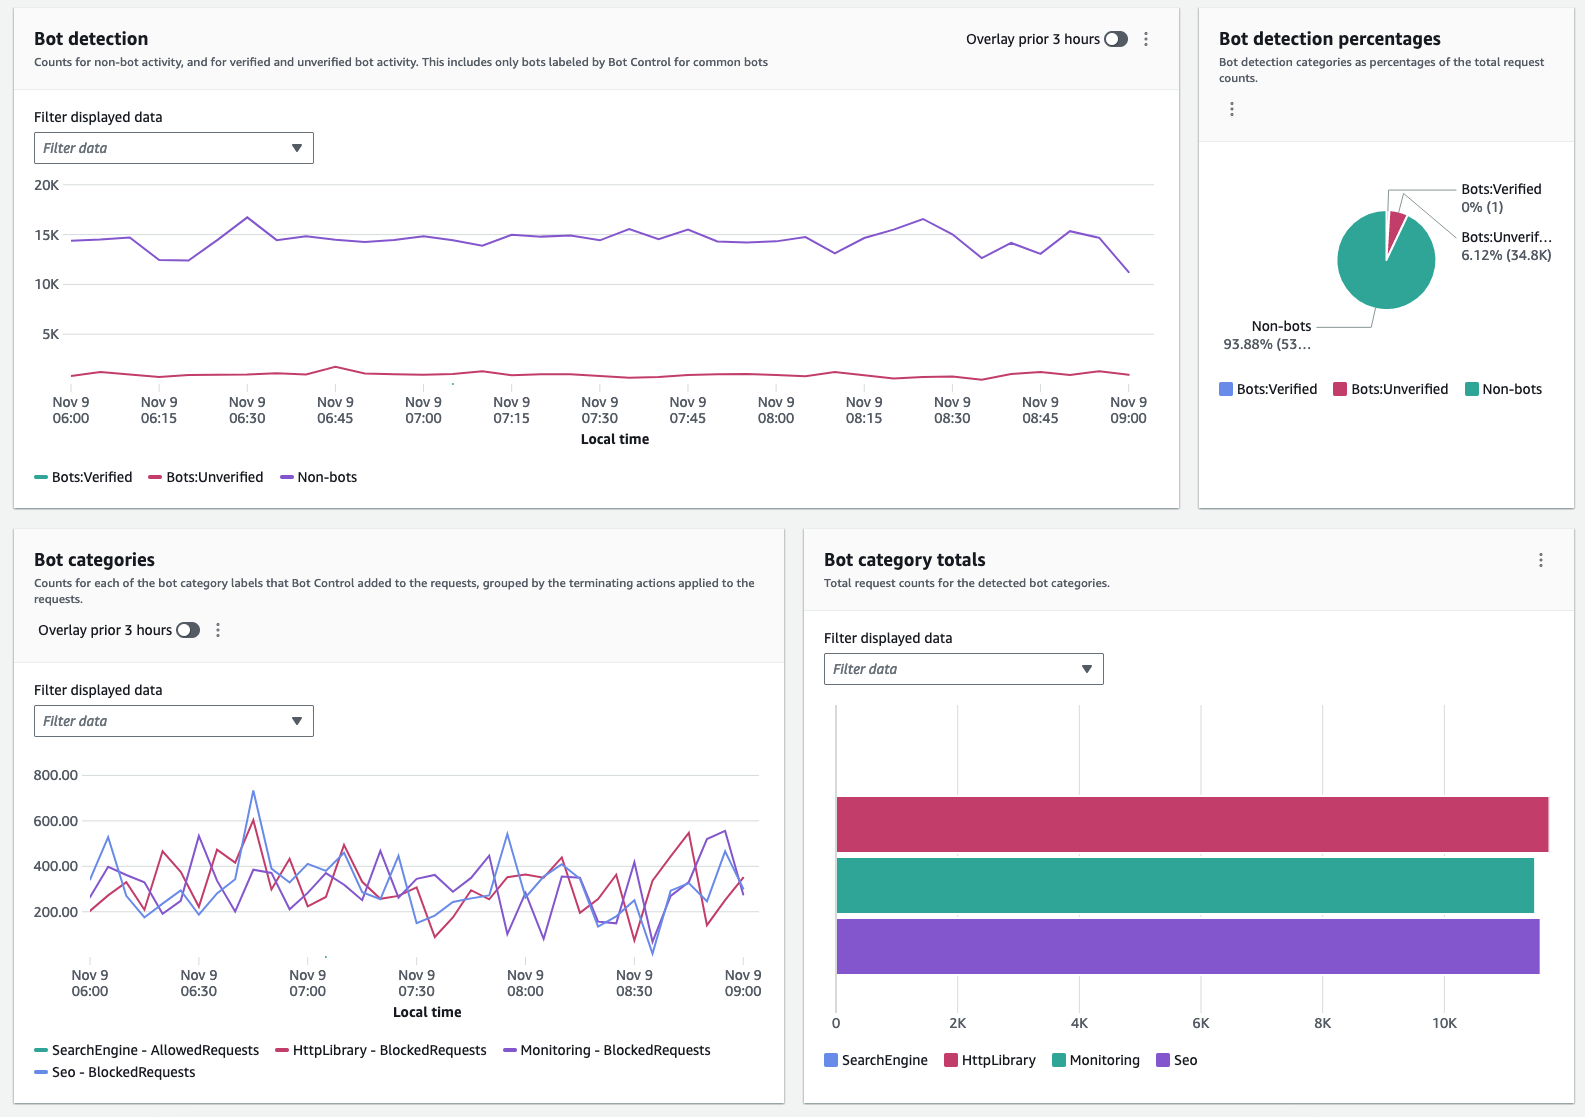
Figure 4: Collection of bot-related metrics on the dashboard
After you get started, you can use the same dashboard to monitor your bot traffic and evaluate adding targeted detection for sophisticated bots that don’t self-identify. Targeted protections use detection techniques such as browser interrogation, fingerprinting, and behavior heuristics to identify bad bot traffic. AWS WAF tokens are an integral part of these enhanced protections.
AWS WAF creates, updates, and encrypts tokens for clients that successfully respond to silent challenges and CAPTCHA puzzles. When a client with a token sends a web request, it includes the encrypted token, and AWS WAF decrypts the token and verifies its contents.
In the Bot Control dashboard, the token status pane shows counts for the various token status labels, paired with the rule action that was applied to the request. The IP token absent thresholds pane shows data for requests from IPs that sent too many requests without a token. You can use this information to fine-tune your AWS WAF configuration.
For example, within a Bot Control rule group, it’s possible for a request without a valid token to exit the rule group evaluation and continue to be evaluated by the web ACL. To block requests that are missing their token or for which the token is rejected, you can add a rule to run immediately after the managed rule group to capture and block requests that the rule group doesn’t handle for you. Using the Token status pane, illustrated in Figure 5, you can also monitor the volume of requests that acquire tokens and decide if you want to rate limit or block such requests.
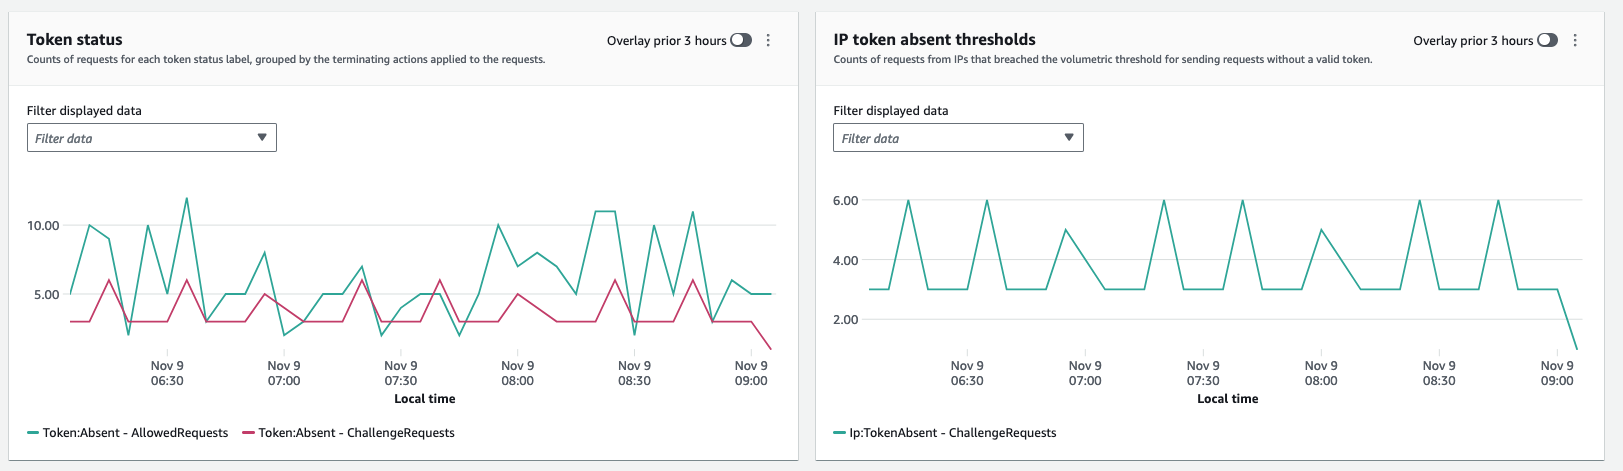
Figure 5: Token status enables monitoring of the volume of requests that acquire tokens
Comparison with CloudFront security dashboard
The AWS WAF traffic overview dashboard provides enhanced overall visibility into web traffic reaching resources that are protected with AWS WAF. In contrast, the CloudFront security dashboard brings AWS WAF visibility and controls directly to your CloudFront distribution. If you want the detailed visibility and analysis of patterns that could indicate potential threats or issues, then the AWS WAF traffic overview dashboard is the best fit. However, if your goal is to manage application delivery and security in one place without navigating between service consoles and to gain visibility into your application’s top security trends, allowed and blocked traffic, and bot activity, then the CloudFront security dashboard could be a better option.
Availability and pricing
The new dashboards are available in the AWS WAF console, and you can use them to better monitor your traffic. These dashboards are available by default, at no cost, and require no additional setup. CloudWatch logging has a separate pricing model and if you have full logging enabled you will incur CloudWatch charges. See here for more information about CloudWatch charges. You can customize the dashboards if you want to tailor the displayed data to the needs of your environment.
Conclusion
With the AWS WAF traffic overview dashboard, you can get actionable insights on your web security posture and traffic patterns that might need your attention to improve your perimeter protection.
In this post, you learned how to use the dashboard to help secure your web application. You walked through traffic patterns analysis and possible next steps. Additionally, you learned how to observe traffic from bots and follow up with actions related to them according to the needs of your application.
The AWS WAF traffic overview dashboard is designed to meet most use cases and be a go-to default option for security visibility over web traffic. However, if you’d prefer to create a custom solution, see the guidance in the blog post Deploy a dashboard for AWS WAF with minimal effort.
If you have feedback about this post, submit comments in the Comments section below. If you have questions about this post, contact AWS Support.
Seven new stable kernel updates
Security updates for Friday
Post Syndicated from daroc original https://lwn.net/Articles/964166/
Security updates have been issued by CentOS (firefox and thunderbird), Debian (gsoap, python-django, and wireshark), Fedora (dotnet7.0 and gifsicle), Mageia (sympa), Oracle (postgresql:10, postgresql:12, thunderbird, and unbound), Red Hat (kpatch-patch, python-pillow, and squid:4), SUSE (nodejs12, nodejs14, nodejs16, nodejs18, and openvswitch3), and Ubuntu (linux-azure, linux-lowlatency, linux-starfive-6.5, php-guzzlehttp-psr7, and php-nyholm-psr7).
Wellington Train Avalanche: 1910
Post Syndicated from The History Guy: History Deserves to Be Remembered original https://www.youtube.com/watch?v=mJfCSVkOBnM
NIST Cybersecurity Framework 2.0
Post Syndicated from Bruce Schneier original https://www.schneier.com/blog/archives/2024/03/nist-cybersecurity-framework-2-0.html
NIST has released version 2.0 of the Cybersecurity Framework:
The CSF 2.0, which supports implementation of the National Cybersecurity Strategy, has an expanded scope that goes beyond protecting critical infrastructure, such as hospitals and power plants, to all organizations in any sector. It also has a new focus on governance, which encompasses how organizations make and carry out informed decisions on cybersecurity strategy. The CSF’s governance component emphasizes that cybersecurity is a major source of enterprise risk that senior leaders should consider alongside others such as finance and reputation.
[…]
The framework’s core is now organized around six key functions: Identify, Protect, Detect, Respond and Recover, along with CSF 2.0’s newly added Govern function. When considered together, these functions provide a comprehensive view of the life cycle for managing cybersecurity risk.
The updated framework anticipates that organizations will come to the CSF with varying needs and degrees of experience implementing cybersecurity tools. New adopters can learn from other users’ successes and select their topic of interest from a new set of implementation examples and quick-start guides designed for specific types of users, such as small businesses, enterprise risk managers, and organizations seeking to secure their supply chains.
This is a big deal. The CSF is widely used, and has been in need of an update. And NIST is exactly the sort of respected organization to do this correctly.
Осми март, ден първи
Post Syndicated from Емилия Милчева original https://www.toest.bg/osmi-mart-den-purvi/

Вредно за държавата е, ако на всеки 9 месеца политиката започва да клокочи за ново споразумяване между управляващите партии заради разпределение на властови позиции. В края на първия 9-месечен период едната от коалициите – ПП–ДБ, предложи да се надгради съюза, известен по занаятчийски като „сглобка“, до меморандум. Партньорът ѝ ГЕРБ-СДС предлага да се надгради до коалиционно споразумение.
Несъмнено ще си стиснат ръцете накрая, тъй като и двете страни разглеждат съвместната си работа в хоризонта на пълен мандат, декларират, че не искат предсрочни избори, а няма да търсят и други коалиционни партньори. Наличните като БСП и „Възраждане“ са неприемливи за заявилите се евроатлантици. Въпросите са кога и как ще бъде скрепен документално съюзът – ще бъдат ли заложени реформи на основни системи, или ще се ограничат до механизма за назначения, изобщо ще се стигне ли до кооперативно равновесие, от което (и) обществото да има известни ползи.
Двете политически сили формират обикновено мнозинство от 132 депутати – ГЕРБ–СДС с 69, а ПП–ДБ – 63. С 36-те на Движението за права и свободи надхвърлят прага от 160 гласа за избор на членове на регулаторите, който записаха в Конституцията. Със същото това квалифицирано мнозинство приеха промените в основния закон.
Между два есемеса
В настоящата ситуация политиката се люшка между есемеси и телефонни разговори на политици, пресичани от арогантни изблици на други политици, чиято политическа сила е в конкубинат с управляващите две. Съпредседателят на ПП Кирил Петков писал есемес на лидера на ГЕРБ Бойко Борисов, Борисов звънял на съпредседателя на ДБ Христо Иванов и така нататък…
Единственото сигурно е, че на 6 март премиерът Николай Денков ще подаде оставка. Но както се разбра от изявление на Борисов, не е ясно кога точката ще влезе в дневния ред на Народното събрание. Председател на 49-тия парламент все още е Росен Желязков (ГЕРБ), тъй като смяната му със съпредседателя на „Демократична България“ Атанас Атанасов е част от ротацията.
Понеже те (ПП–ДБ, б.а.) са много голямо ръководство, нашият документ ще се мъчим да е съвършен и точен, но тогава ще го предоставим на колегите за обсъждане. Никой не ни е забил датата 6 март. Денков си дава оставката, но както каза Христо Иванов, до април имаме време. След това обсъждаме с ПП. Крайният срок за разбирателство е два месеца преди евроизборите.
За България като най-вероятна дата за евроизборите се очертава 9 юни – тоест 9 април е последната възможна дата за разбирателство. На 5 март ГЕРБ ще представи проекта на партията за коалиционно споразумение, на 6-ти ще го представи на коалиционните партньори, следва конгрес на Европейската народна партия. На 8-ми Денков и Габриел ще са привършили оценките на министрите и ако сме се разбрали, вървим напред, ако ли не – гласуваме оставката на Денков и кабинета и отиваме на избори, каза Бойко Борисов.
ПП–ДБ пък не са готови да подпишат коалиционно споразумение, преди да са изминали 9-те месеца управление с премиер Мария Габриел, за да видят какво ще се случи, и едва тогава да продължат напред. Съпредседателят на ПП Кирил Петков не иска да коментира „никакви математики“, но иска да види възможно най-бързо предложението на ГЕРБ и да започнат разговори.
Да видим какво предлагат в съдебната реформа, за регулаторите, за Пепи Еврото и Нотариуса. Ако тази държава се управляваше само от министри, щеше да е процъфтяла. Тази държава се управлява от нереформирани специални служби и регулатори. Управлява се от нереформиран ВСС, който, като му натиснеш enter, гласува с един глас. Нека не отвличаме темата с разпределянето на министрите.
И въпреки че управляват заедно от 9 месеца и са във „фактическо съжителство“, от ПП–ДБ още не искат да произнесат думата „коалиция“. Ако се стигне до коалиционно споразумение обаче, ГЕРБ–СДС ще настояват за разпределение съобразно електоралната тежест, както обясни Борисов.
Първо почваме с министрите – договаряме се с тях пропорционално според електоралната тежест, изразена през депутатите в парламента. Защото сега се оказа, че ДБ имат три министерства – правосъдие, здравеопазване и туризъм. Аз ще предложа на Кирил Петков, докато готвим всичко това, още сега да започнем с КЗК, защото това му вади очите, и регулаторите, които са със 121 гласа, и след това тези, които са със 160 гласа.
По-рано Кирил Петков обяви, че 50 на 50 назначения в регулаторите гарантират взаимен контрол с ГЕРБ (меморандумът предвижда, че номинациите на двете политически сили се обсъждат и одобряват заедно без плаващи мнозинства). Но неговата политическа сила не допуска преговори за позиции в изпълнителната власт, преди да започне и да приключи процесът по избор на членове на регулаторите, на ВСС, на службите и на антикорупционната комисия. От ГЕРБ и ДПС обаче не смятат, че службите трябва да се пипат – работели добре, ловели шпиони. Е, не като във Великобритания, но преди изобщо не се и случваше.
Кога и какво се подписва
Кога ще се подпише „брачното свидетелство“ е съществен за участниците в преговорите въпрос. ПП–ДБ настояват да се случи след най-важните избори – на ръководство на антикорупционната комисия, Висшия прокурорски съвет, ключови регулатори начело с Комисията за защита на конкуренцията (КЗК). Докато ГЕРБ–СДС отрано искат да е бетонирано съгласието до края на мандата и бавят, както могат. Офертата им за коалиционно споразумение е твърде амбициозна – или е отрано написано, или е принципно съгласие за приоритети и назначения, без каквито и да било сериозни реформи. Според Борисов обаче в него ще бъде описано всичко – за регулаторите, за съдебната система и за министрите.
Целият този шум по технологиите на политическата смяна върви паралелно с разкритията за мръсните поръчки в българското правосъдие и изпълнението им от кръговете на Петьо Петров – Еврото, който е в неизвестност, и на Мартин Божанов – Нотариуса, който беше убит. Бившата районна прокурорка на София Невена Зартова не спира да говори, четиримата ѝ заместници – и те. Отново разказаха за рекета Ивайла Бакалова и мъжът ѝ Веселин Денков – този път не пред Антикорупционния фонд, а пред временната парламентарна комисия. Освен репресии като следене, подслушване, проверки на бизнеса им от страна на НАП, която се отчита на спецпрокуратурата какви ревизии прави, Бакалова каза онова, което трудно се изрича.
Прокуратурата е изключително обвързана политически и това го видяхме и при „Барселонагейт“. Всичко това вие го знаете много добре и аз не ви казвам нещо ново. Ако очаквате от мен да си мълча и да ви казвам, че Мартин Нотариуса е най-голямото зло в съдебната система и вече го няма, не мога да ви го кажа. Мартин Божанов беше един изпълнител, който хора от по-високите етажи ползваха за поръчки, и той си изкарваше парите покрай тези неща.
Разкритията за участия на висши прокурори, адвокати и някои съдии в порочни схеми зачестиха и гражданите едва ли ще запомнят имената и аферите. Затова пък затвърждават възприятието си, че съдебната система е нещо много, много мръсно, а мръсотията е потулвана благодарение на чадър от политици и институции, пълни с посочени от ГЕРБ и ДПС кадри.
Но и настоящите усилия не стигат, за да се свали чадърът над Нотариуса. Депутатката от ПП–ДБ Антоанета Цонева поиска разсекретяване на информацията бил ли е Божанов секретен сътрудник на МВР, тъй като от МВР отказват да отговорят – била класифицирана. Но според колегата ѝ Ивайло Мирчев вече навсякъде се знае, че Божанов е бил сътрудник на Трето РПУ в София.
„Ако не положите усилия, ще има още мартинбожановци в тази система“, каза Ивайла Бакалова при изслушването си от временната парламентарна комисия. Кого ще изслушват депутатите на следващото заседание, така и не стана ясно. Може да накарат МВР да се размърда или да поканят политици от собствените си редици, ако не са заети да пишат коалиционно споразумение.
На второ четене: „Академия за китове“
Post Syndicated from original https://www.toest.bg/na-vtoro-chetene-akademiya-za-kitove/
„Академия за китове“ от Виолета Златарева

изд. Scribens, 2021
За странните, чупливите, самотните – изобщо, за хората не по мярка – у нас се пише, макар и не толкова често, а още по-рядко през фантастичното и почти абсурдното. В „Академия за китове“ Виолета Златарева прави още една крачка напред, пишейки за хората с нестандартна психика (ако можем така да се изразим), уловени „в мигове, в които не са съвсем себе си“.
В тринайсетте разказа авторката облича симптоматиката на едно или друго психично разстройство в истории,
които звучат като разгърнати метафори, почти алегорично. И без да е категорична в „диагнозите“, тя се е постарала да „визуализира“ фобии, шизоидни епизоди, депресии, маниакалност, биполярност, дисоциативно разстройство, психопатия, зависимости. По думите ѝ, сборникът е пряко свързан с истинските истории на близки за нея хора, които са преминали или преминават през трудностите и изпитанията на психичните заболявания.
Да, за редовия читател тези проявления едва ли ще бъдат разпознаваеми така, както за професионалиста, ала идеята на книгата все пак не е да следва диагнози по списък. Онова, което обединява повечето герои, е човешката им различност. Няма как да не направи впечатление натрапливото усещане за тяхната капсулираност – всеки протагонист, дори тези, които влизат в някакви взаимоотношения, е като пеперуда, затворена в пашкул, отделен, сам за себе си. Точно както се случва и в живота.
И макар книгата да не дава такава заявка, тя индиректно е жест към важността на психичното здраве и грижа. Едно изречение на героинята в разказа „Жаба“ като че ли обобщава пределно точно отношението към тези хора, подценяването на състоянието им или погрешното му интерпретиране:
Тя му разказа, че има семейство, което гледа на нея като на прокажена, защото е странна и само психоложката ѝ идва на посещения и проявява някакъв вид загриженост.
В „Дух“ също ни се дава лаконично шаблонът, по който се гледа на психично различните:
Саня беше малко смахната от самото си раждане. До 5-годишна възраст говореше на свой собствен език.
В нашето общество все още е тема табу да говорим за проблеми от такова естество на висок глас и посредством разказите исках да загатна съвсем деликатно и магичното, и страшното при тези състояния. Шизоидните епизоди, освен уплах, носят със себе си и срам, а срамът на свой ред – самота,
казва за „Тоест“ Виолета Златарева. В общото усещане за емпатия и близост с героите, които авторката предизвиква у читателя, е разковничето на правилното отношение към тях. На доверието, ако щете.
А то несъмнено е подложено на изпитание. Защото някои от разказите ще се окажат видения, халюцинации, проекции на съзнанието – или каквото друго ги наречем. На този фон нищо от написаното като че ли не притежава устои, не може да бъде надеждно, достоверно. Виолета Златарева подлага читателя именно на това затруднение – той да не може да се довери на нищо докрай. Сюжетът се превръща в ронлива скала под нозете му. Психическата аберация заживява в литературното като хлъзгав конструкт на творческото въображение.
Може би не е случайно, че чувствителните самотници намират допир и разбиране с друго човешко същество именно у себеподобен. Например в „Жаба“ и в „Шепа пръст“ те се събират именно благодарение на чудатостите, халюцинациите, фобиите си. И всъщност намират щастието. По думите на Виолета, в „Жаба“ самото заболяване се изражда в утешител, като носи образите на несъществуващи личности, любови, време, а „това крие в себе си и парадокс, и красота, и въпросът кое е илюзия – гласът в слушалката или това, което той отрича“. В „Дух“ обикновената мечтателност и наивност ще отворят път към събирането на двамата младежи чрез спойката на думите – и те ще са буквално като сродни души извън този живот, съединени от силата на отвъдното.
Впрочем искам да отбележа, че един от често появяващите се символи в разказите е тъкмо този на жабата. Неслучайно сред многото му значения в различните култури е и това, че лекува отчаянието и помага при общуването, особено на хора, на които то трудно им се отдава. Пак в „Жаба“ момичето „с изключително старание подреди новия дом“ на откритото от нея животно (реално или въображаемо), който прави поносима собствената ѝ крепост.
Именно домът е другият основен топос и мотив в разказите. В „Убийци“ например семейство Иванови получава своя дом мечта на осъдима и подсъдна цена. Наистина ли е такава обаче, след като на всяка една цена може да се противопостави друга стойност? Защото макар и пътят към този съвършен дом да е морално недопустим, на практика той води до умножаване на доброто и на добрите хора, както и осигурява среда, в която детето на Иванови да расте щастливо. Убийството, види се, може да е милост, благодеяние, благотворителност. Моралът, изглежда, не е черно-бял, „особено когато е замесена любовта“.

В „Преди да седна под върбата“ героинята също ще извърви своята дълга и объркана инициация извън дома, възприеман като консерва („Всеки от нас беше тръгнал от своята консерва според своите си причини“). Тя обаче ще я доведе обратно именно до него, а знакът за правилността на това решение ще се усети в лекотата на раменете, отърсили се от багажа, от тежестта на понесеното („прокъсаната ми раница така или иначе вече не ми беше нужна и приех загубата ѝ като метафора“). Можем да мислим за завръщането и като за освобождаване.
А „пътуването – както пише Виолета Златарева – невинаги се мери в крачки“.
Разказът „Осем“ пък събира осем незавършени истории, които може да се четат и именно като прекъснати в момента на завършването им. Зависи от гледната точка. От една страна, нито една история не може да бъде приключена докрай, освен от смъртта. От друга, тя може да бъде пренасочена или прекъсната в момента на пресичането си с други истории, обстоятелства, сюжети. Осемте герои са все маргинали, хванати в момента на такава една промяна – в мига, в който с тях се случва (или по-скоро ще се случи – според нашата гледна точка) нещо преломно, решително, смело, различно…
Този път незнайно защо ги сви в юмруци и реши, че ще промени нещата,
казва си един от тях, художник. Сред останалите има самоубийца; възрастен мъж, чийто живот до този миг е бил безупречен и безпрепятствен; клептоман, изправен пред нещо, което наистина го привлича само по себе си, а не само по силата на болестния му импулс, и така нататък. Въпросното „прекосяване на съдбата“ се внася и чисто граматично – посредством съюзите, с които повествованието бива прекъсвано: докато… когато… тогава… миг преди да… но… и тъкмо да… (Тук ми се иска да направя препратка към внушителния граматичен експеримент, който предлага в последната си стихосбирка „Портокал“ и поетът Нинко Кирилов.)
Тази идея за промяната също е особено важна. Ето какво казва за нея един от героите, фотограф:
Когато заемем равновесно положение, ставаме скучни. Заставаме пред обектива и запечатваме анатомията си. Но преходът от радост към тъга, от нежност към жестокост – в него се крие магията. Кратката промяна в пулса е вълнение, продължителната – аритмия. Жалко, че е само миг. Добре, че е само миг.
Три от разказите са писани всъщност не по патологии, а по сънища, от които Виолета споделя, че „се е будила посред нощ“. Също като в съновидение разказът във „Вън“ например следва поредица от отварящи се пред нас нови врати и пространства, привидно несвързани, следващи без преход и логика. И онова усещане, че си изпуснал важното, което е било целта ти през цялото време, заради лутането из лабиринтите, в които си се оказал толкова лесно засмукан!
В „Баба“, който също е по сън, героинята среща мъртвата си роднина, която ще ѝ покаже най-човешките състояния и чувства като лица на възрастни жени, надничащи от далечните прозорци. Единствено смъртта е тази, с която човек лично трябва да се срещне, която трябва да „поздрави“.
Място е оставено и на изоставяните – нима това често само по себе си не е гранично състояние в психологически смисъл?
И както често става, самотата идва лоша,
пише в „Юни“. Във „Вътре“ пък – със съвсем малко художествена измислица, по думите на авторката – е представен ужасът от дисоциативното разстройство, отключен при отхвърлянето и измяната на партньора. Тя казва още:
Все по-често се нормализират разделите, разводите. Приемат се като формално разписване на документи, апатично разочарование и логистично затруднение. А всъщност, за чувствителния индивид, такъв акт води до вътрешни разкъсвания и пропадания, до рухване на представите за самия себе си и света изобщо.
В крайна сметка „решението“ – ако изобщо това е думата – може би е в писането, както при Дани от „Юни“, където то е и вид възмездие, почти отмъщение. А може решението да е и просто в съществуването, в това „Дишай“ от едноименния разказ. Там, в края на земята, няма нищо повече от огромен трамплин, който може би е забравеният лост на Архимед. Към какво е този трамплин – кой знае? Важното е, че точно тук за героя е „мой дом от незапомнени времена“. Той е следван от лудостта – това е и единственият път, когато тази оголена дума се споменава директно:
Не знам дали аз крепя Земята, или тя – мен, но единствено лудостта ме следва по петите и каквото и да правя, не си тръгва, а настоятелно хрипти до ухото ми.
Героят обаче няма да има търпение да дочака някой да сподели самотата му, да сподели дните му „на ръба на вълшебството“, и ще скочи с все сила в края на лоста. Колкото да открие, че Земята няма нужда от тежест, за да бъде повдигната, че тя – напротив – се спихва. Защото истинската тежест е вътре в нас и от нас.
В заключение, ще ви оставя с думите на самата Виолета Златарева, която може би най-добре резюмира посланието на първата си книга, последвана тази година и от стихосбирката „Регистър злополуки“, пак в същото издание:
Общото между всички разкази е, че персонажите в тях са острови. Независимо дали има някой до тях, или не, те са затворници в собствените си глави и само тези, които имат шанс за любов, имат и шанс за оцеляване. В противен случай остават изолирани, докато изчезнат съвсем. Точно по това си приличаме всички – и ние, и те. Иска ми се хората да разберат, че зависимостите, емоционалните дисфункции и т.н. не са проблемът, а симптом на дълбоко нараняване, на липсата на приемане и подкрепа в ключов момент или моменти.
Активните дарители на „Тоест“ получават постоянна отстъпка в размер на 20% от коричната цена на всички заглавия от каталога на издателство Scribens, както и на няколко други български издателства в рамките на партньорската програма Читателски клуб „Тоест“. За повече информация прочетете на toest.bg/club.
Никой от нас не чете единствено най-новите книги. Тогава защо само за тях се пише? „На второ четене“ е рубрика, в която отваряме списъците с книги, публикувани преди поне година, четем ги и препоръчваме любимите си от тях. Рубриката е част от партньорската програма Читателски клуб „Тоест“. Изборът на заглавия обаче е единствено на авторите – Стефан Иванов и Антония Апостолова, които биха ви препоръчали тези книги и ако имаше как веднъж на две седмици да се разходите с тях в книжарницата.
Малайзия с лют сос и съкровища
Post Syndicated from Петя Кокудева original https://www.toest.bg/malaiziya-s-lyut-sos-i-sukrovishta/
(Част първа)
Страната в едри щрихи

Малайзия е малко над eкватора – южно от Тайланд и северно от Сингапур. Западният ѝ бряг очертава прочутия пролив Малака – преди няколко века оттук минава Пътят на подправките. Сезоните са сух и дъждовен, но жегата в съчетание с високата влажност е постоянна величина. Бивша британска колония е, а преди това страната се е казвала Малая. Шофира се отляво, а покрай пътищата растат помело, манго, драконов плод, ананас. Ислямът е официалната религия, но са разрешени всички други и това не е само на хартия. Повечето местни ястия започват с думата нàси – ориз.

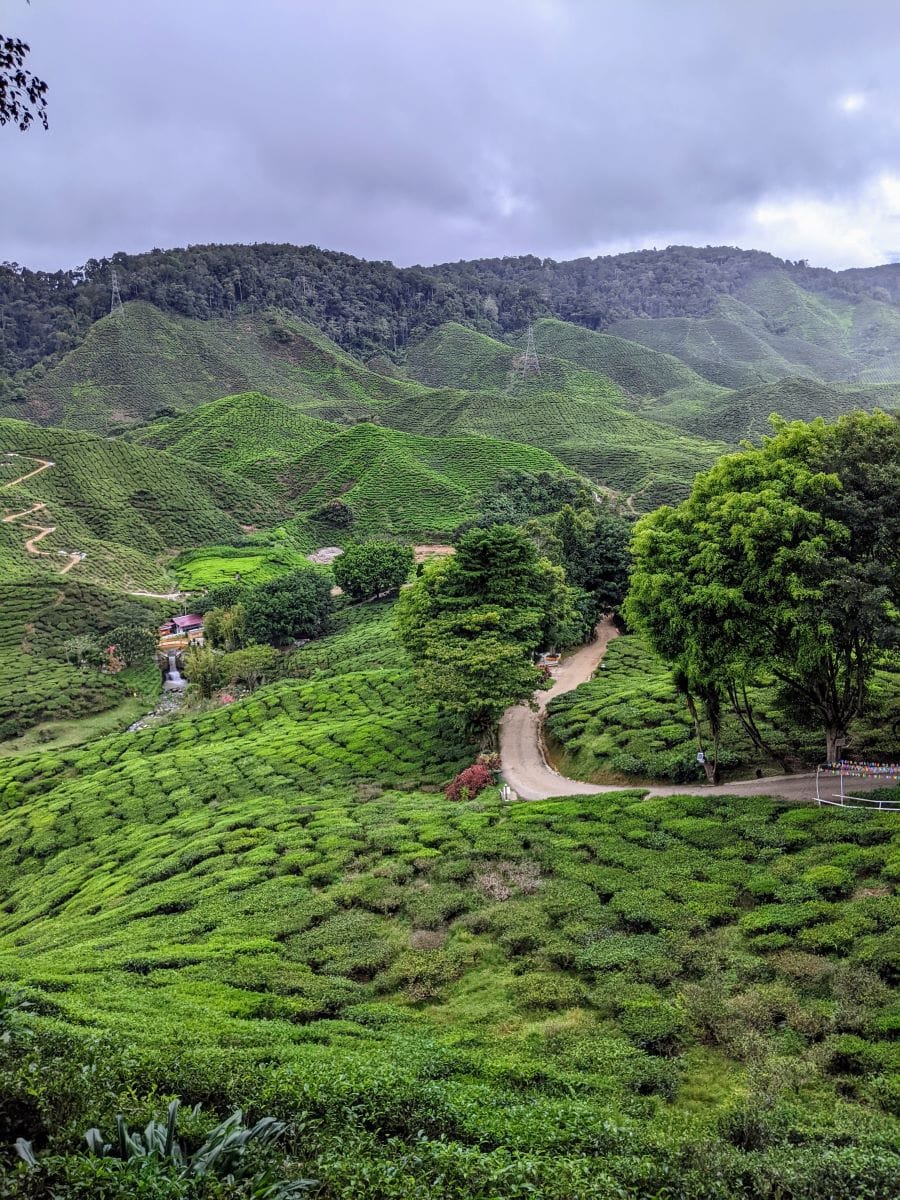
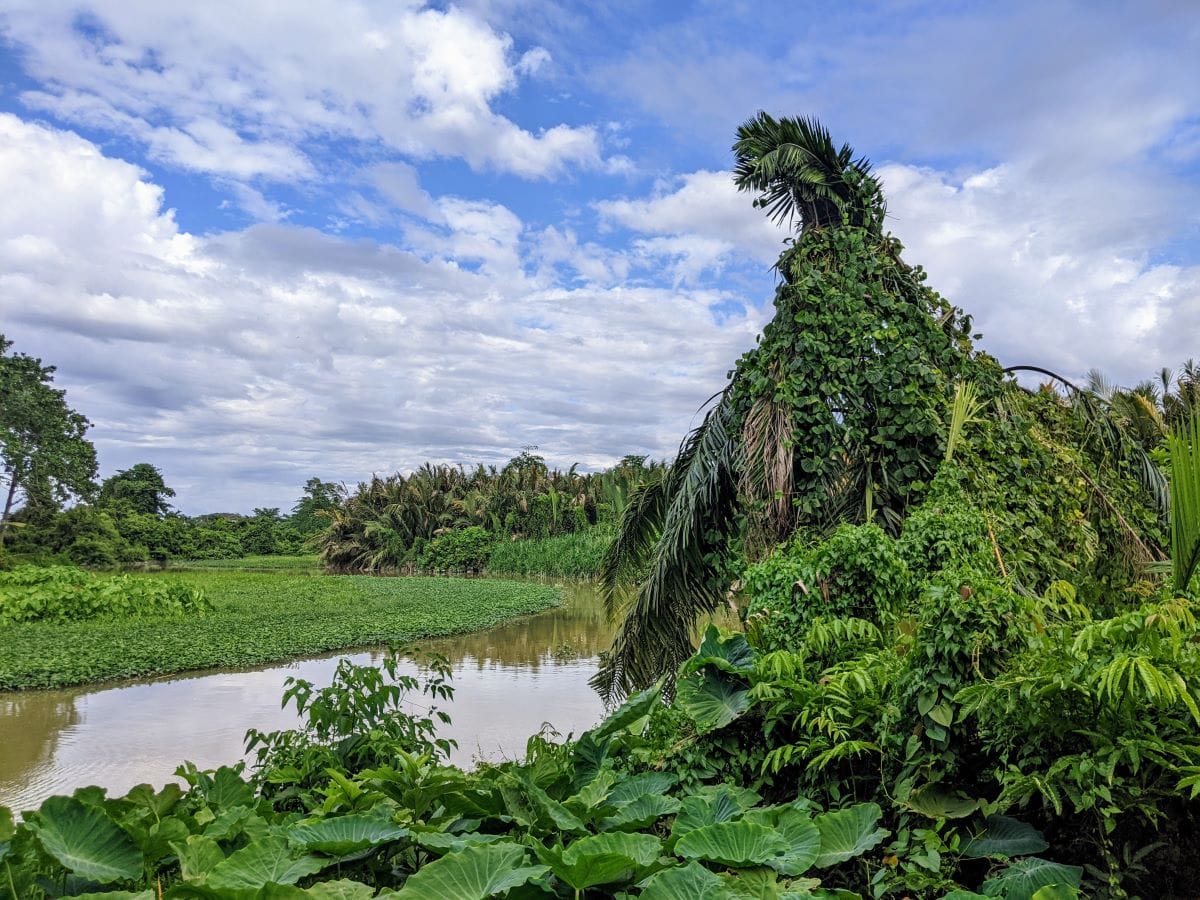
Рибарско селище / Чаена плантация / Джунгла
Коренните жители са 19 различни племена с общото название орàнг àсли – за тях роден дом е джунглата.
Тук се намира Таман Негара – най-старата дъждовна гора в света. По табелите на междуселските пътища ще видите крокодили, тапири и водни биволи, а по дърветата – тукани. Близо девет милиона души живеят в изумителната с размерите си столица Куала Лумпур, а малайското село звучно се нарича кампỳнг.
Земя на шамани и султани, Малайзия е без съмнение най-мултикултурната страна, в която съм се озовавала.
Съседите на Мохи
Селамàт пагù*! Само ви подавам ключа и изчезвам, че бързам. Ви-на-ги да заключвате вратите и прозорците, не просто да ги затваряте! Такива са ми съседите – влизат и не гледат много какво грабят. Чак после гризват телефона и се сещат, че не става за ядене. И айдеее, мятат го в храсталака.
Мохи (съкратено от Мохаммад) е от малко селце в югозападна Малайзия. Понякога му се налага да вземе телефона на жена си и да иде край близкия гъсталак да звъни на собствения си номер. За късмет, често от храстите долита познатата мелодия. Съседите на Мохи са маймуни, по-точно макаци – изкусни крадци и акробати.
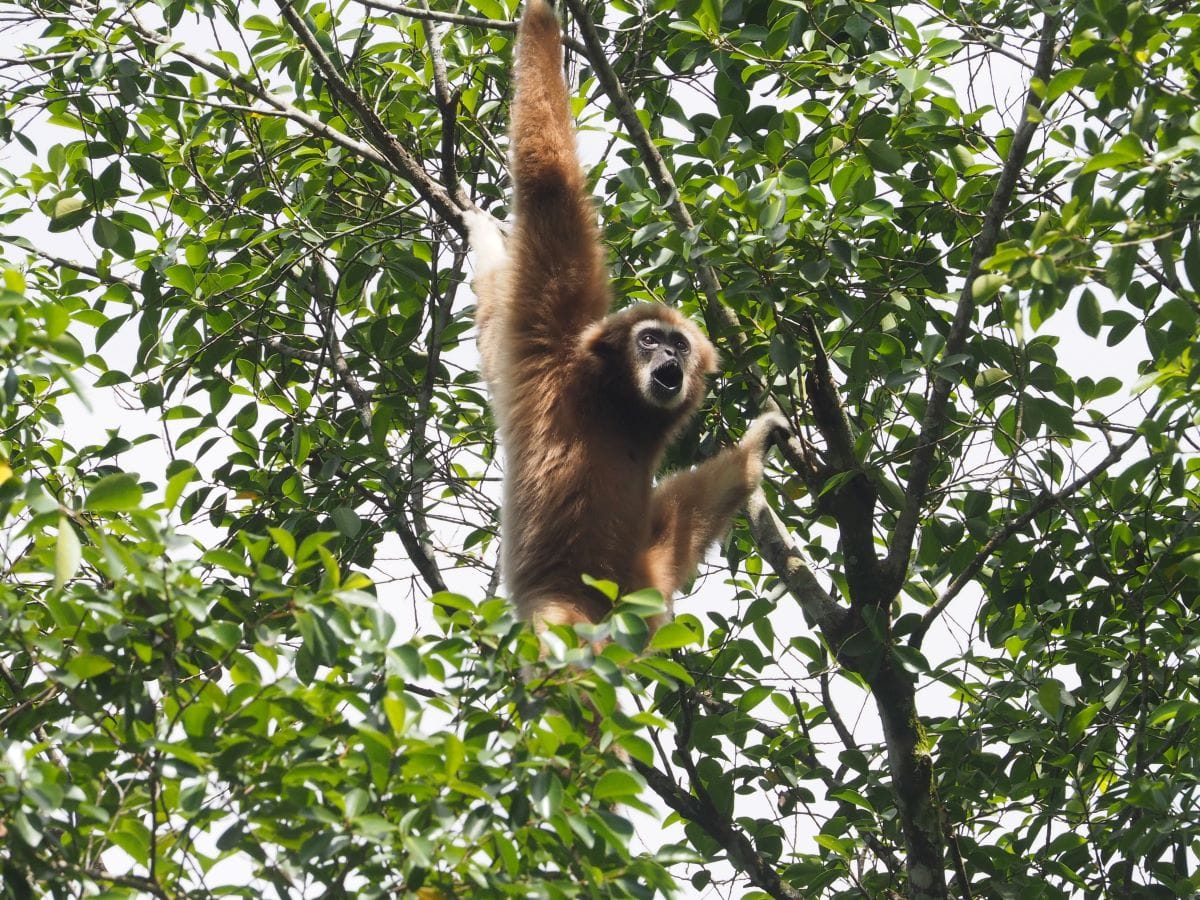


Белоръкият гибон говори / Семейство макаци – най-честата гледка покрай пътищата / Варан – може да се види дори по улиците в големи градове
За един месец, в който обикаляхме страната, се научих отдалеч да познавам къде са – първо чувате звука от мощно пукане на клони и раздрусване на листа, после виждате как някое дърво силно се привежда, а накрая, ето го и него – едър сив макак, който се държи като парашутист за края на клонака и прелита от едно дърво на друго. Белоръкият гибон е още по-живописна гледка – той просто виси като прани гащи и издава особено силен звук, подобен на протяжен лай – така общува с жена си (двойките са моногамни) и скрепява връзката си. Заради този леко комичен лай наричат белоръкия гибон „шоумена на джунглата“.
Време е за копи
Ако се отбиете в някое кафене покрай селския път, малайците ще ви поднесат чаша кòпи. Това е тяхната дума за кафе и повечето хора го пият с лед. Всяка молба за гореща напитка ги обърква и по-вероятно е накрая отново да ви донесат с лед. (Другото упорито разминаване беше лютият сос. Тъй като пътувахме с тригодишната ни дъщеря, а тя не може да яде люто, непрекъснато питахме кое ястие не е. В повечето случаи ни отвръщаха: Ама ето! Това изобщо не е люто. И след секунди то се оказваше огън. Впрочем малайците по традиция си хапват лют ориз даже на закуска, а ако искате да си намажете филия – трудна работа, хлябът не е често срещан.)
Самите кафенета са на открито, под навес – няколко паянтови маси с пластмасови столчета, захабени от ползване. Мястото е почти винаги обгърнато от бухлата тропическа растителност, сред която стърчи малка мивка – за миене на ръце.
Да попаднеш в пълно малайско кафене е като да разгърнеш енциклопедия на народите. Китайци по тениски – на една маса. На втора – мюсюлманки с почти изцяло покрити лица. На трета – индийка с пъстър саронг и бинди, онази тъмночервена точка на челото. Има още араби, потомци на европейски преселници, тамили (от Южна Индия), перанаканци. И разбира се, оранг асли – коренните жители на Малайзия – 19 различни племена със свои езици и идентичност.


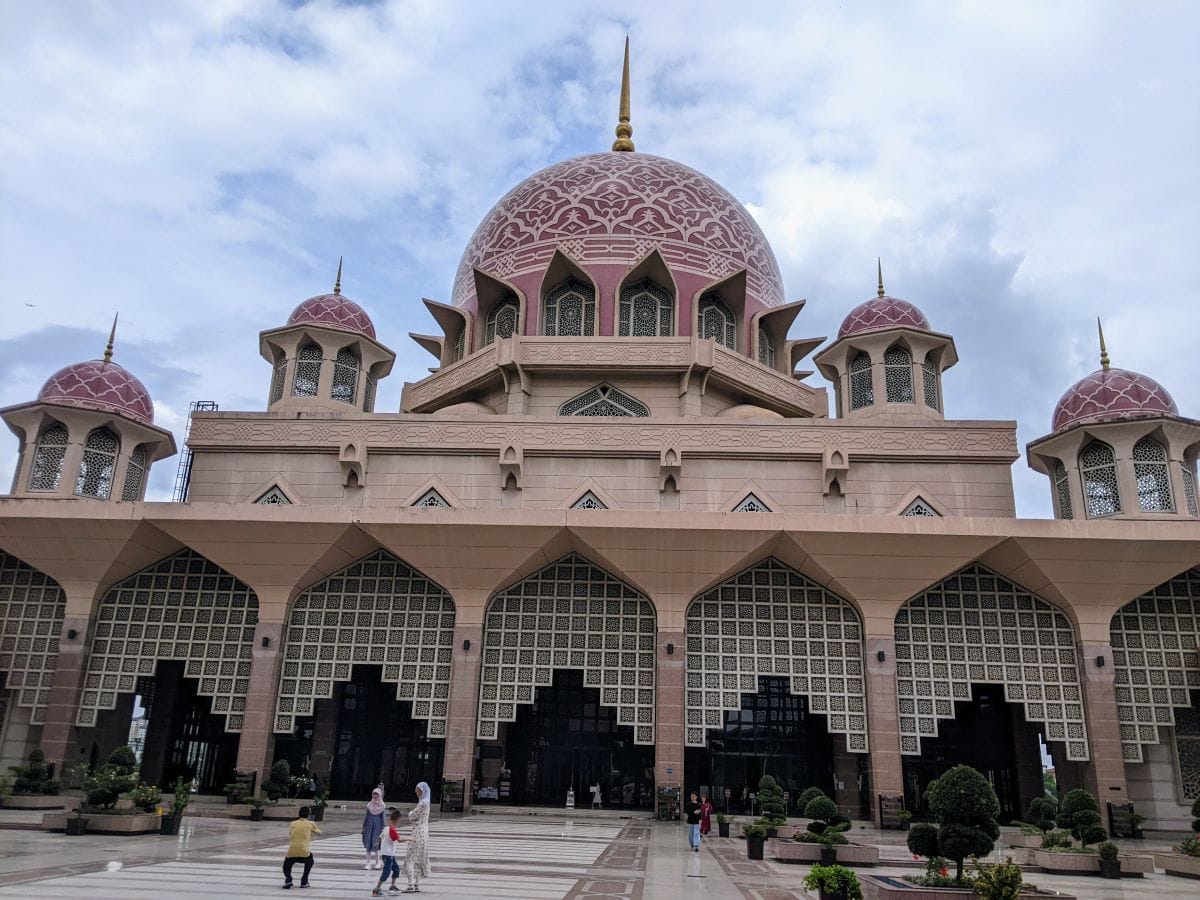

Високопланинският храм Chin Swee, построен от малайско-китайски милиарде / Хиндуисткият храм в чест на бог Муруган при пещерите Бату / Прочутата Розова джамия в Путраджая / Будисткият храм Kek Lok Si на остров Пенанг
Всъщност да пътуваш из Малайзия е като да бъдеш в няколко страни едновременно.
Някои от щатовете в 33-милионната държава – като Келантан и Теренгану – са подчертано мюсюлмански: има религиозна полиция, алкохолът е строго забранен, а от време на време се виждат табели с предупреждение, че ако пропуснеш няколко петъчни молитви в джамията, те чака сурово наказание. Навсякъде другаде в страната мирно съжителстват разнообразни вярвания. Точно както ще видите на Улицата на хармонията в Малака – през няколко метра са: джамията „Кампунг Клинг“, построена през 1748 г.; китайският Храм на зелените облаци, който е на 400 години и е едновременно будистки, даоистки и конфуциански; и индуисткият храм в чест на Ганеша – бога слон, който понякога поставя, а друг път премахва пречките пред вас.
Мизан, принцесата и кокошето àко
Почти всеки втори град в Малайзия започва с Куала. Куала означава „естуар“, или „срещата на две реки“. Столицата Куала Лумпур например значи „калният естуар“. Ние бяхме също и в Куала Ромпин, Куала Теренгану, Куала Селангор…
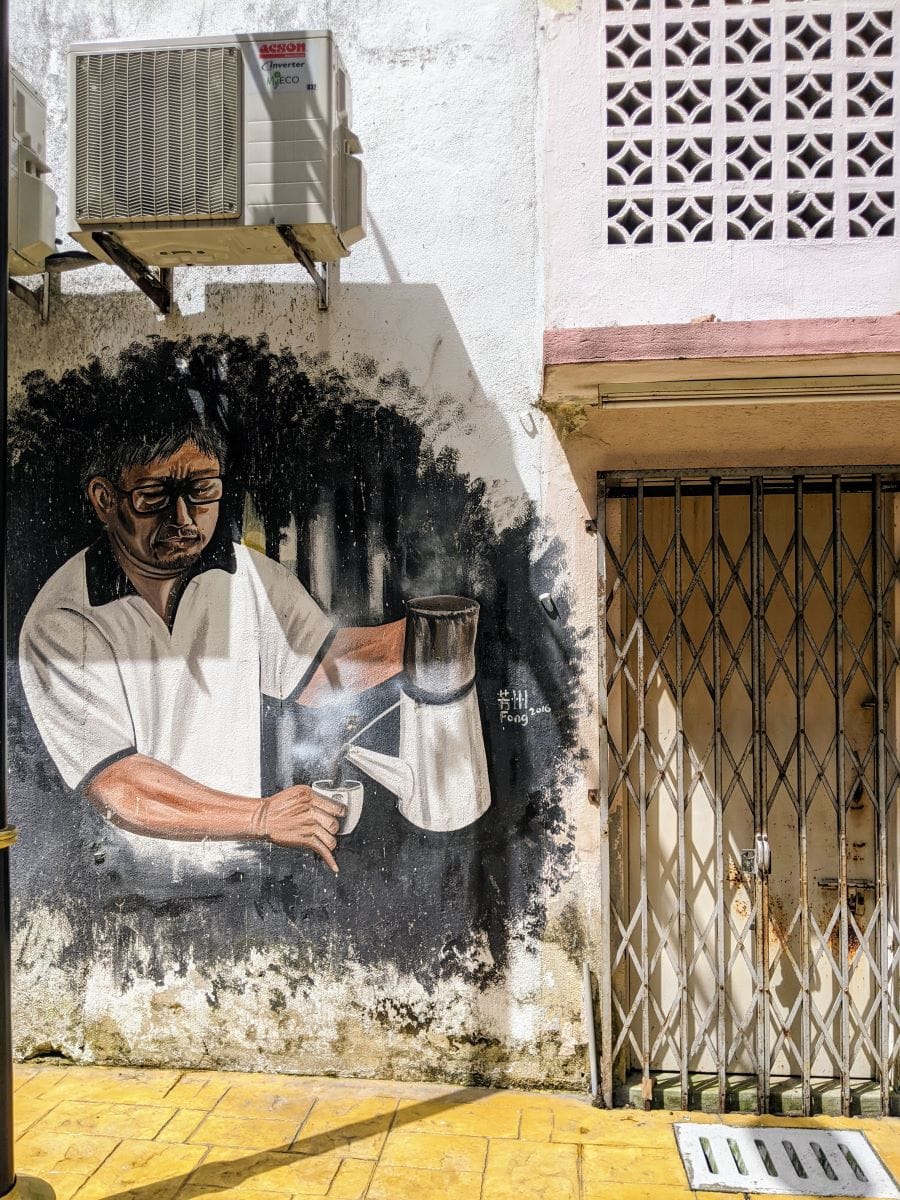
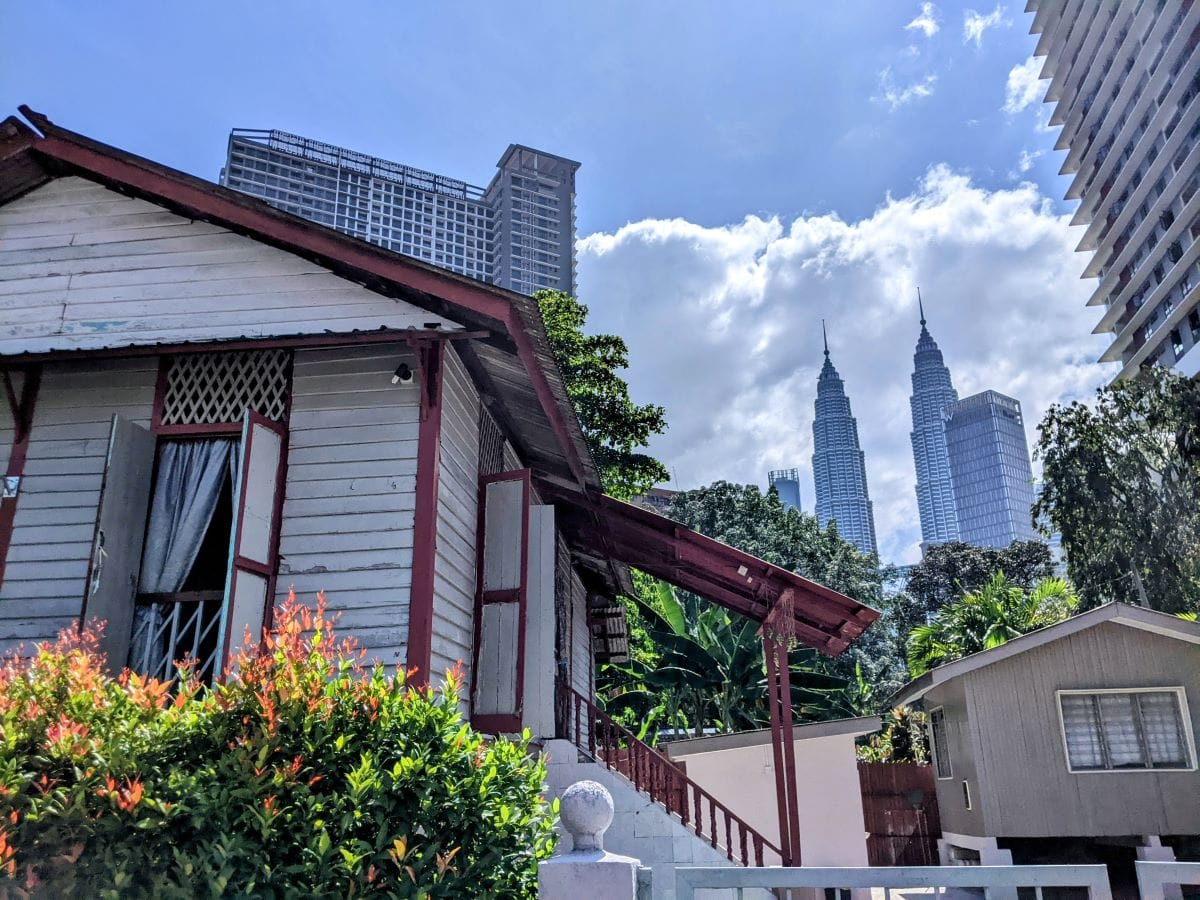
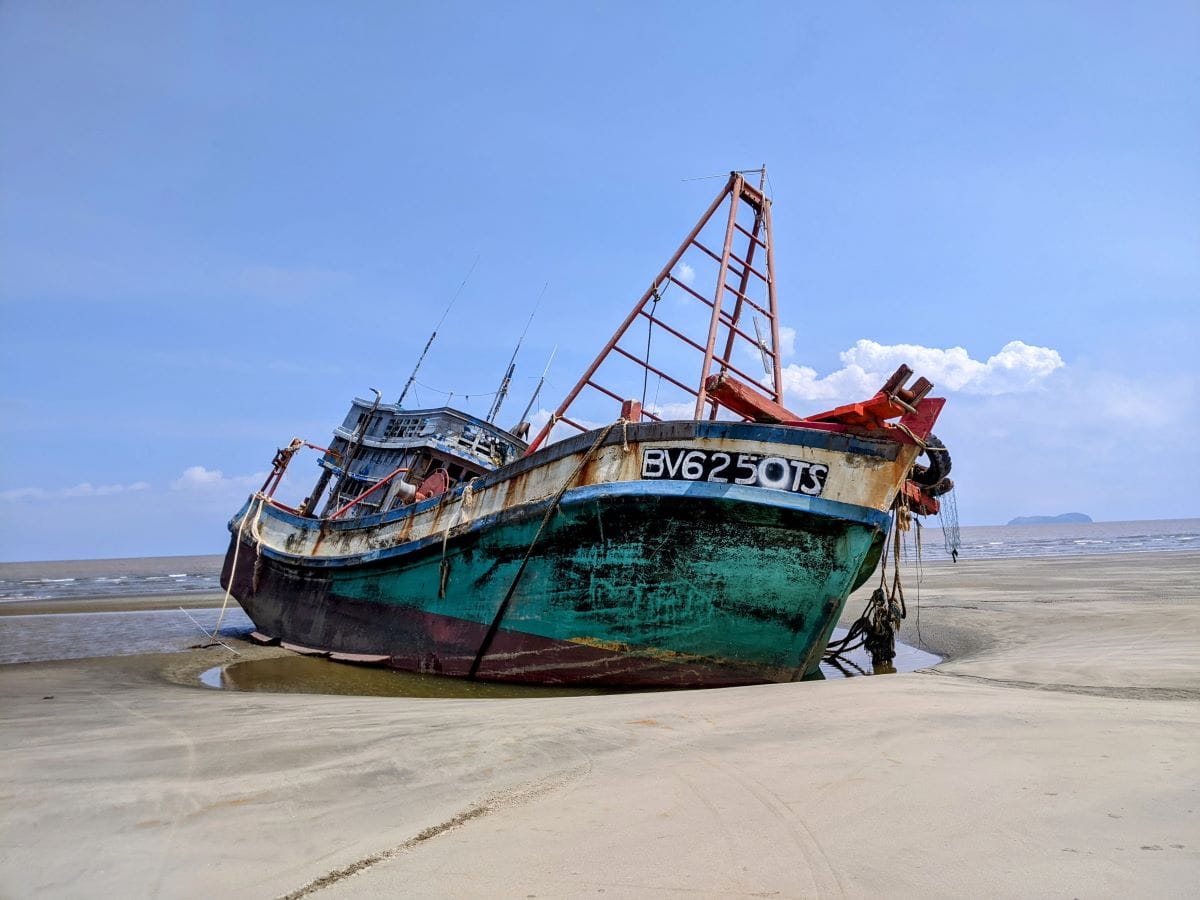
Гледки от три Куала града: Куала Кубу, Куала Лумпур и Куала Ромпин
Срещам Мизан в едно кафене в Куала Кубу. Баща му е местен, а майка му – от Индонезия. Обожава традиционните кифлички с кàя – кокосов мармалад. Мизан е запален читател и като повдигам темата за маларията и комарите, ми разказва една от известните им фолклорни приказки. Султанът се влюбил в красивата принцеса на Малака. За да провери любовта му, девойката го затрупала със седем задачи. Повечето не ги запомних, но на едната прихнах: султанът трябвало да ѝ донесе седем сърца от… комари!
На сбогуване с Мизан, който има чудесно чувство за самоирония, се заговаряме за това кои са недостатъците ни: аз споделям, че съм бъзла и лесно се отчайвам, той пък си се дразни, защото – както казвали малайците – ентусиазмът му бил като кокоше àко: изстивал много бързо. С каквото и да се захванел, бързо му доскучавало.
Съкровищата на баба-ньоня
На Мелиса Чан от Малака обаче не ѝ доскучава това, с което се е захванала. Нарича себе си събирач на бенда хари – неща от ежедневието. Мелиса е от една от най-колоритните общности в Малайзия – перанаканците, или баба-ньоня (мъжете са баба, жените – ньоня).
Те са потомци на китайски търговци, пристигнали в малайските пристанищни градове през ХIV век. Китайците уж нямали намерение да остават, но после създали семейства с малайки. Така се ражда културата на баба-ньоня, изобилна на традиционни занаяти и удивителни вярвания. Като това за Кухненския бог например. Той живее в кухнята, но често се качва да докладва на Великия небесен бог какви ги върши семейството. За да не издава лоши работи, ньоня му приготвят куи бакул – десерт от оризово брашно и захар, който е доста лепкав! Щом го налапа, устата му залепва и Кухненският бог само ломоти – нищо не му се разбира.


Известната улица Jonker в Малака, където са много от къщите и магазинчетата на баба-ньоня / Един от най-възрастните перанакански занаятчии в Джорджтаун, Пенанг
Мелиса Чан съхранява тъкмо такива мъниста от миналото и настоящето на баба-ньоня, но и не само на тази общност – тя прави документални филми за отмиращите рибарски техники на португалските преселници, както и за най-старата лаборатория за зъбни протези, известна като Музея на фалшивите зъби.
В Джорджтаун (остров Пенанг) и в Малака може все още да видите антикварното ателие на майстор на ръчно правени фенери, а също и как се създават прочутите перанакански обувки с цветни мъниста. Тези занаятчии, обучени от бащите и дядовците си, днес нямат чираци – никой не иска да наследи занаятите им, защото изискват твърде много търпение и усилия.
Тъкмо това е мисията на Мелиса Чан, според която
е огромна ценност да познаваме миналото си, а не да се държим за него като удавник за сламка. Да го развием и да се поучим от него, а не просто да е някаква сантиментална носталгия.
От Мелиса научавам и малайската фраза saling mempengaruhi – означава оплитане или взаимно влияние. Това е начинът, по който съжителстват различните култури и идентичности по тия земи.
Никога не ядем сами
За жалост, съжителството има и своите сенчести страни. Нашир и надлъж в Малайзия ще видите твърде симетричните редици маслодайни палми. Тези огромни плантации са основен бизнес на държавата и заемат мястото на изсечени джунгли – домът на много животински видове и на местните племена, днес все по-яростно изтласквани в цивилизацията. Едно от тях са семелай, според които
да нарушаваш природните закони не те прави лош човек – прави те не много умен.

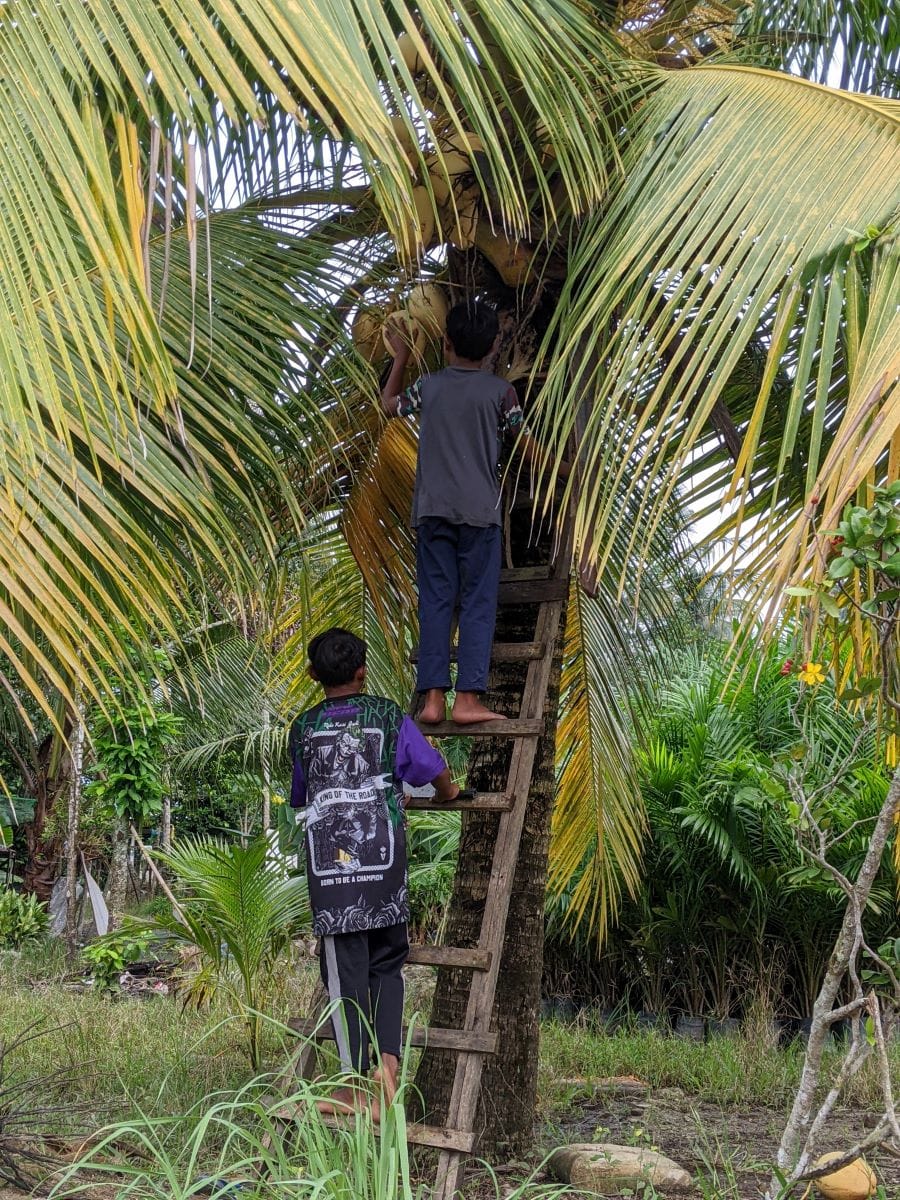

Портрет на местна жена в музея на oранг aсли в Гомбак / Деца от племето мах-мери, които секат кокос с мачете / Носовата флейта на оранг асли
Житейската философия на племето се нарича пунèн, в превод от техния език: „не ям сам“. Върнат ли се от лов и събирачество, семелай поделят всичко намерено с останалите. Идеята да акумулираш богатство и да задържиш нещо изцяло за себе си не е присъща на това общество.
С избутването им по границите на джунглата и града обаче те са принудени да навлязат в модерния начин на живот. Една част са изкушени да купуват храна от магазина, да имат телевизор и малък мотор. Тъкмо тук идва челният сблъсък. В новия свят тяхното социално ДНК за здравословно споделяне започва да изглежда неразумно. А това, на което от поколения са научени – намереното да се яде на момента, както повелява природният закон – ги води до бедност, защото видят ли се с някакви пари, ги пропиляват. Онова, което преди е било логично и мъдро, сега им носи беди и бедност.
Много от тези племена все още имат своите шамани, чиято основна работа е да тъкат нишки. Защото светът на оранг асли се крепи на невидими нишки, които свързват земята, небето и подземния свят. Шаманите имат симпатичен израз за човек, който не познава природата наоколо и е сляп за нишките между всичко. Този – казват – е като жаба под кокосова черупка.
(Следва продължение)
* „Добро утро“ на малайски.
Всички снимки в статията са собственост на авторката.
Android App Size at Scale with Project Bonsai
Post Syndicated from Grab Tech original https://engineering.grab.com/project-bonsai
Grab is Southeast Asia’s leading superapp, providing a suite of services that brings essential needs to users throughout the region. Its offerings include ride-hailing, food delivery, parcel delivery, mobile payments, and more. With safety, efficiency, and user-centered design at heart, Grab remains dedicated to solving everyday issues and improving the lives of millions.
As the app continues to expand with more features, Grab identified the need for a consistent, high-quality experience for new users who may have limited storage space or restricted internet bandwidth. Read to find out more about Project Bonsai and how it reduced app download size and app disk size.
Introduction
In 2020, Google conducted research that highlighted the negative impact of app sizes on conversion rates, revealing a 1% decrease for every 6MB expansion of the app APK size. This finding prompted Grab to ensure new and existing users had a consistently excellent Grab superapp experience, given the prevalence of low-end devices and disparate internet infrastructure in Southeast Asian regions. As a result, Grab initiated Project Bonsai in Q3 2021, with the goal of reducing and optimising the app size while enhancing user experience, reducing installation barriers, and boosting user acquisition.
Understanding the problem
The Grab superapp, with over 4 million lines of code and integration with hundreds of third-party libraries, had a significant app size. Given the prevalence of low-end devices and disparate internet infrastructure in our target region, it is crucial for us to proactively and constantly ensure we are delivering excellence in app-based user experience.
Objectives of the Bonsai project
The Bonsai project focused on these two key metrics:
- App Download Size: This represents the total size of the compressed APK file that users need to download from Google Play when performing a fresh installation.
- App Disk Size: This encompasses the total storage space occupied by the app on user devices, including both the binary and data generated by the app.
In this article, we will share the strategy and solutions that resulted in a successful 26% reduction in App Download Size, while also reducing the App Disk Size.
Status quo
Prior to the Bonsai project, the Grab app project had implemented various measures to achieve optimal app size. Here are some notable highlights:
-
Leveraging App Bundle: Since 2019, Grab has been using the app bundle approach to optimise app delivery. This approach generates smaller APKs tailored to specific device configurations, ensuring users receive optimised APKs. This helps reduce the overall app size and improve installation efficiency.
-
Monitoring: With a team of over 100 Android engineers and multiple collaborative teams, the Grab app undergoes a weekly release process involving hundreds of commits for each release. Closely monitoring app size changes with every commit is essential for our team. The team established debug build (APK file size) monitoring for every commit merged to the master branch. Regular weekly reviews are conducted to stay updated on the app size and identify commits that might lead to changes in app size. However, occasional mismatches may occur due to discrepancies between the debug and release builds.
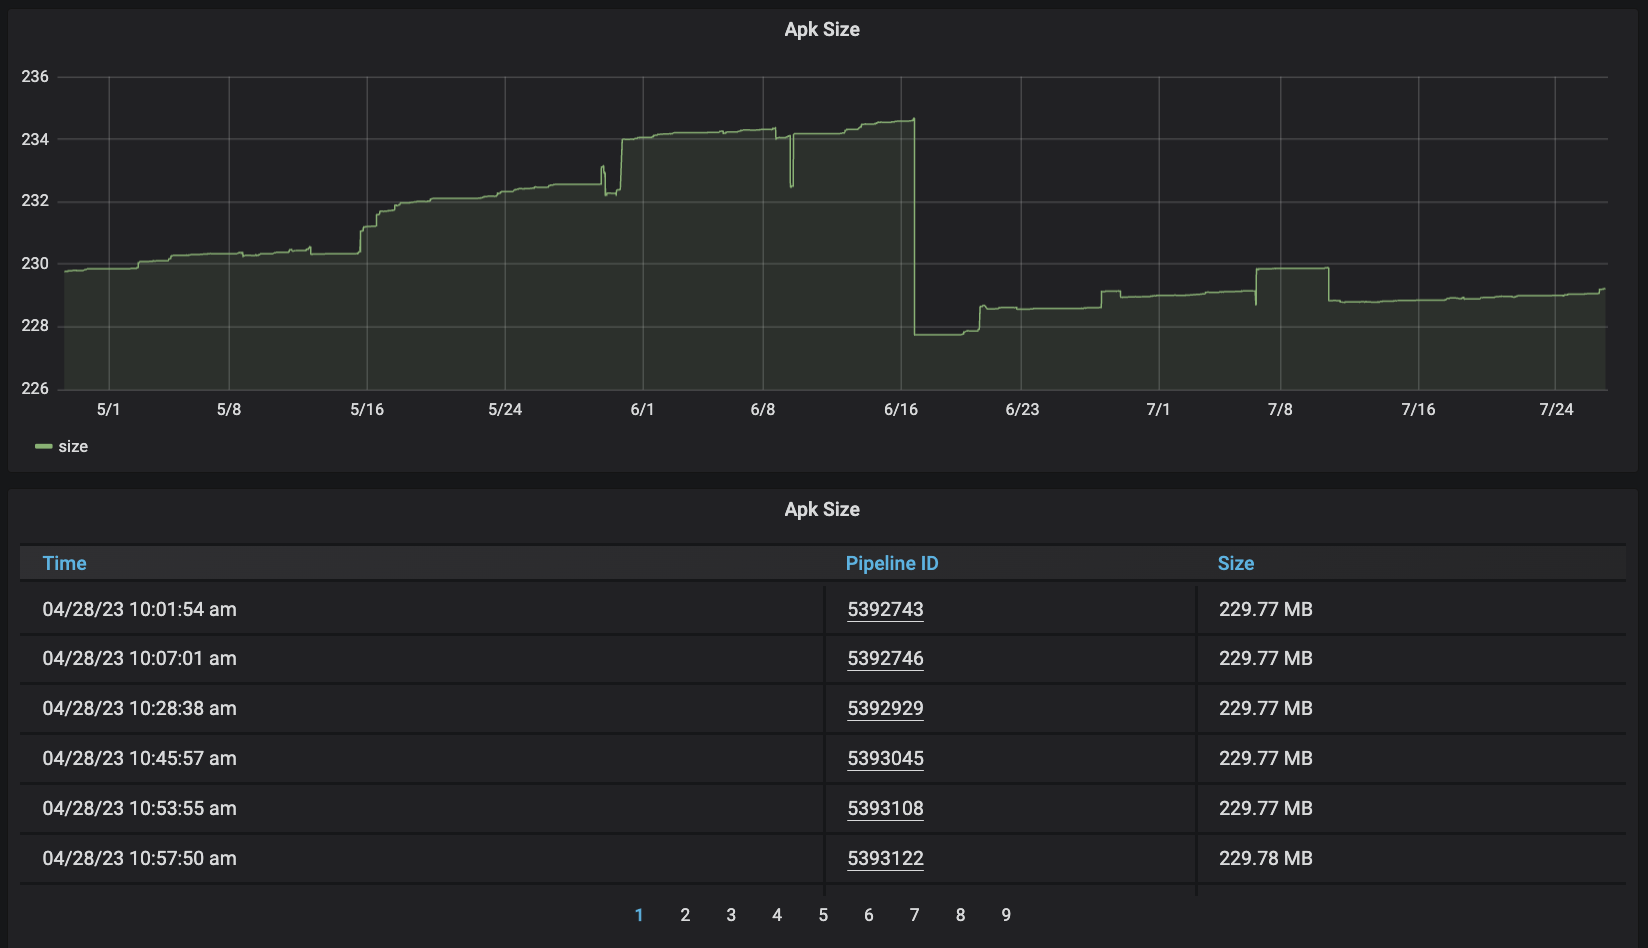
-
R8 Integration: R8/Proguard, known as the code shrinker, obfuscator, and optimiser, has been enabled since the beginning. This powerful tool helps reduce the app’s bytecode and resources, leading to further size optimisation and improved app performance.
-
Resource Optimisation: The team diligently pursued resource optimisation strategies, including:
- Images: Engineers were encouraged to use vector images whenever possible, as they usually have smaller file sizes than raster images. In exceptional cases where raster images were necessary, Grab adopted the webp format instead of png, utilising better image compression to minimise app size.
- Language ResourceConfig: Grab enabled resourceConfig to support only the languages actively used by the Grab app, reducing unnecessary resource overhead and enhancing app efficiency.
-
Third-Party Libraries Review: The team established a review process for third-party libraries, assessing their size impact on the app. This practice ensured that only essential libraries were included, preventing unnecessary bloating of the app size.
Despite the application of these measures and solutions aimed at managing the app size, there was still the potential of significant expansion in magnitude.
Strategy
The Bonsai project revolves around strategic pillars, namely Measurement, Reduction, and Containment.
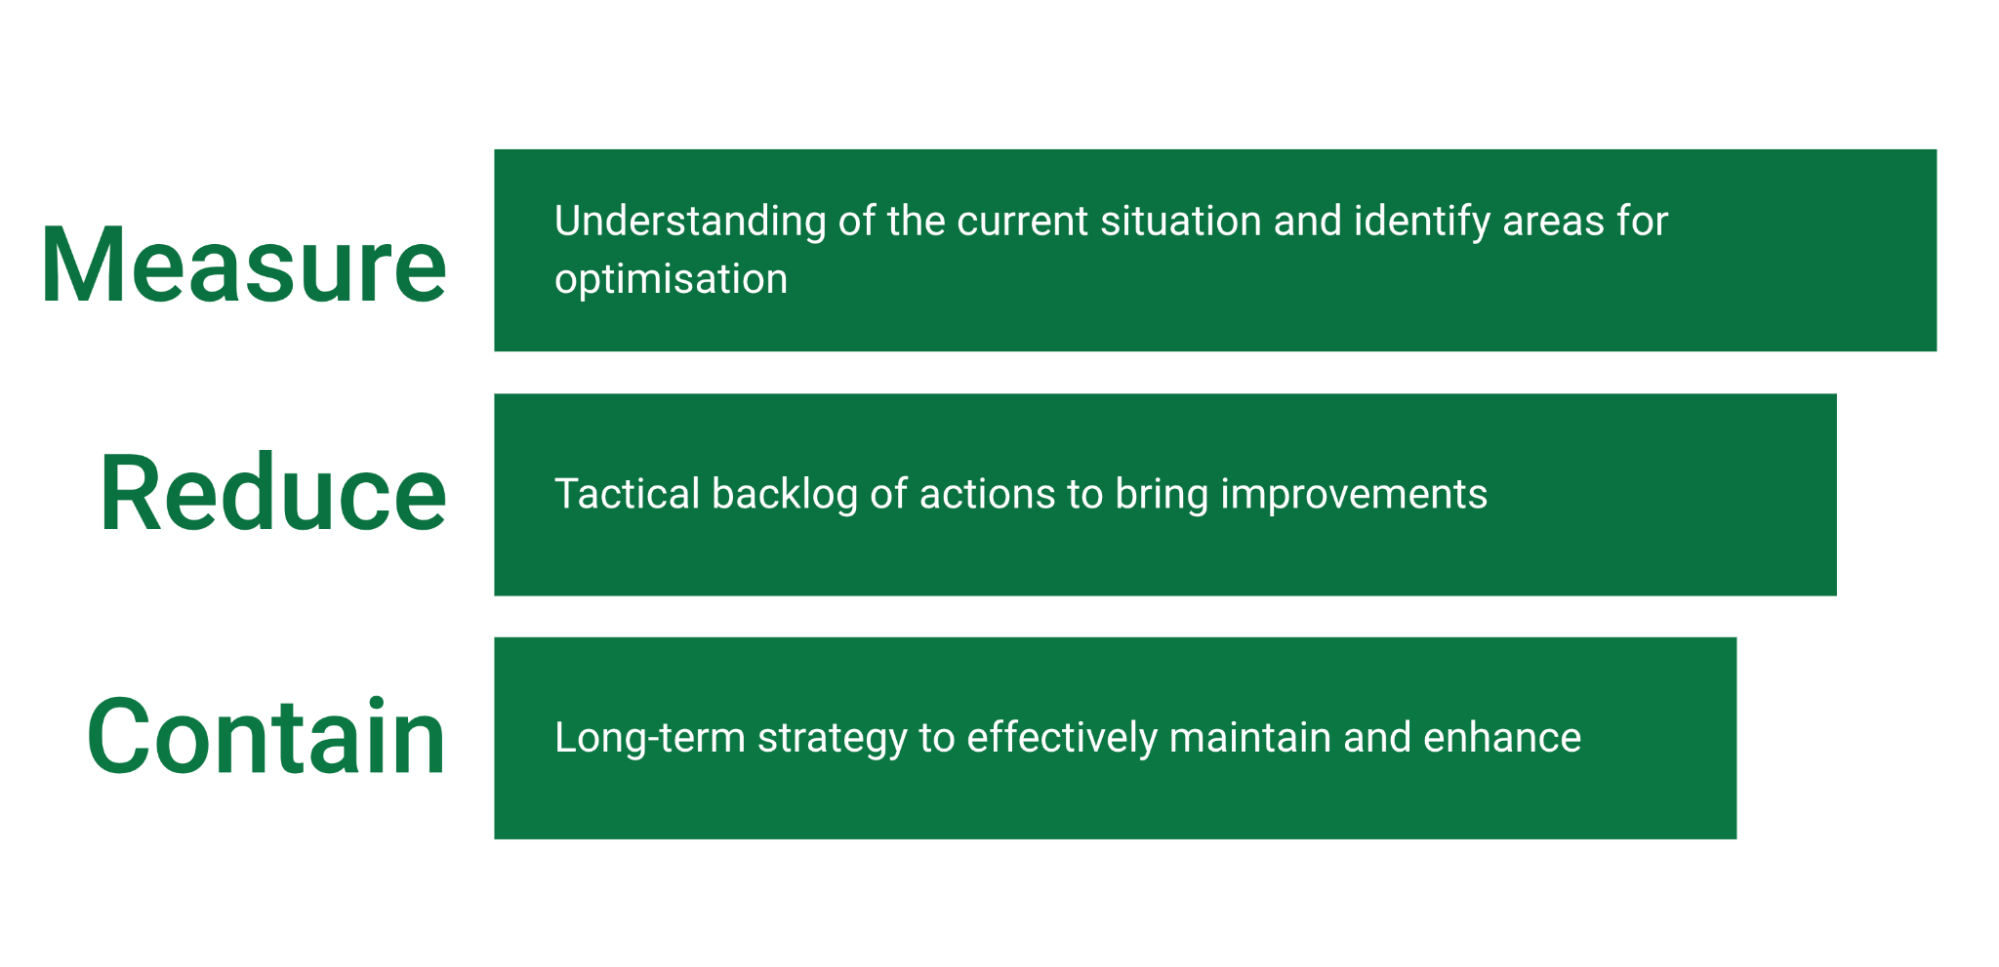
In the Measurement phase, the focus is on providing accurate information on the app’s binary composition and how individual features, modules, libraries impact the overall app size. This allows teams to make informed decisions and gain insights into their components’ influence on the app’s size.
The insights from the Measure phase provided us with a list of actionable items for our backlog. In the Reduction phase, we employ strategic action to tackle this backlog to constantly achieve optimal app size.
Optimising the app size is not a one-time endeavour, especially as more features are added over time, potentially increasing the project’s size. While there may be limited solutions to manage app size, it’s important to find a balance between size and functionality. Else, the effort and trade-offs required may become overwhelming. Therefore, in the Containment phase, we intend to introduce effective long-term strategies and solutions designed to manage the app’s size.
In the remainder of this blog post, we explore the strategic pillars and actions taken to contain the download size.
Measure
The Grab Passenger App Core team actively engages in optimisation projects and recognised the importance of measurement as the foundation for improvement. For example, enhancing the app startup time, pipeline time, build time, and more.
In every optimisation endeavour, we adhere to a crucial principle: “MEASURE” – the first and most critical step for any improvement project. As the famous quote goes, “If you can’t measure it, you can’t improve it.” This emphasises the significance of accurate and comprehensive measurement as the foundation for driving successful optimisation efforts.
In the third quarter of 2021, our team initiated an investigation into existing tools provided by both Google and the broader community. The intention was to employ tools such as APK Analyzer or Android Studio to conduct a thorough analysis of the app binary. However, it soon became evident that these tools were not well-suited to accommodate the extensive scope of our project.
In order to accommodate our discovery, we developed a custom analytics tool called App Sizer. This tool is specifically designed to analyse app binaries from bundle files. Our primary goal was to construct a solution that adheres effectively to our unique needs.
The tool was seamlessly integrated into Grab’s CI system and sends data to a Grafana instance. As a result, the tool collates and transmits daily analytics data from the release candidate branch. It offers the following key functionalities and monitors important aspects such as:
Device-specific App Download Size: Precise information about the app download size for specific devices, focusing on optimising the App Download Size.
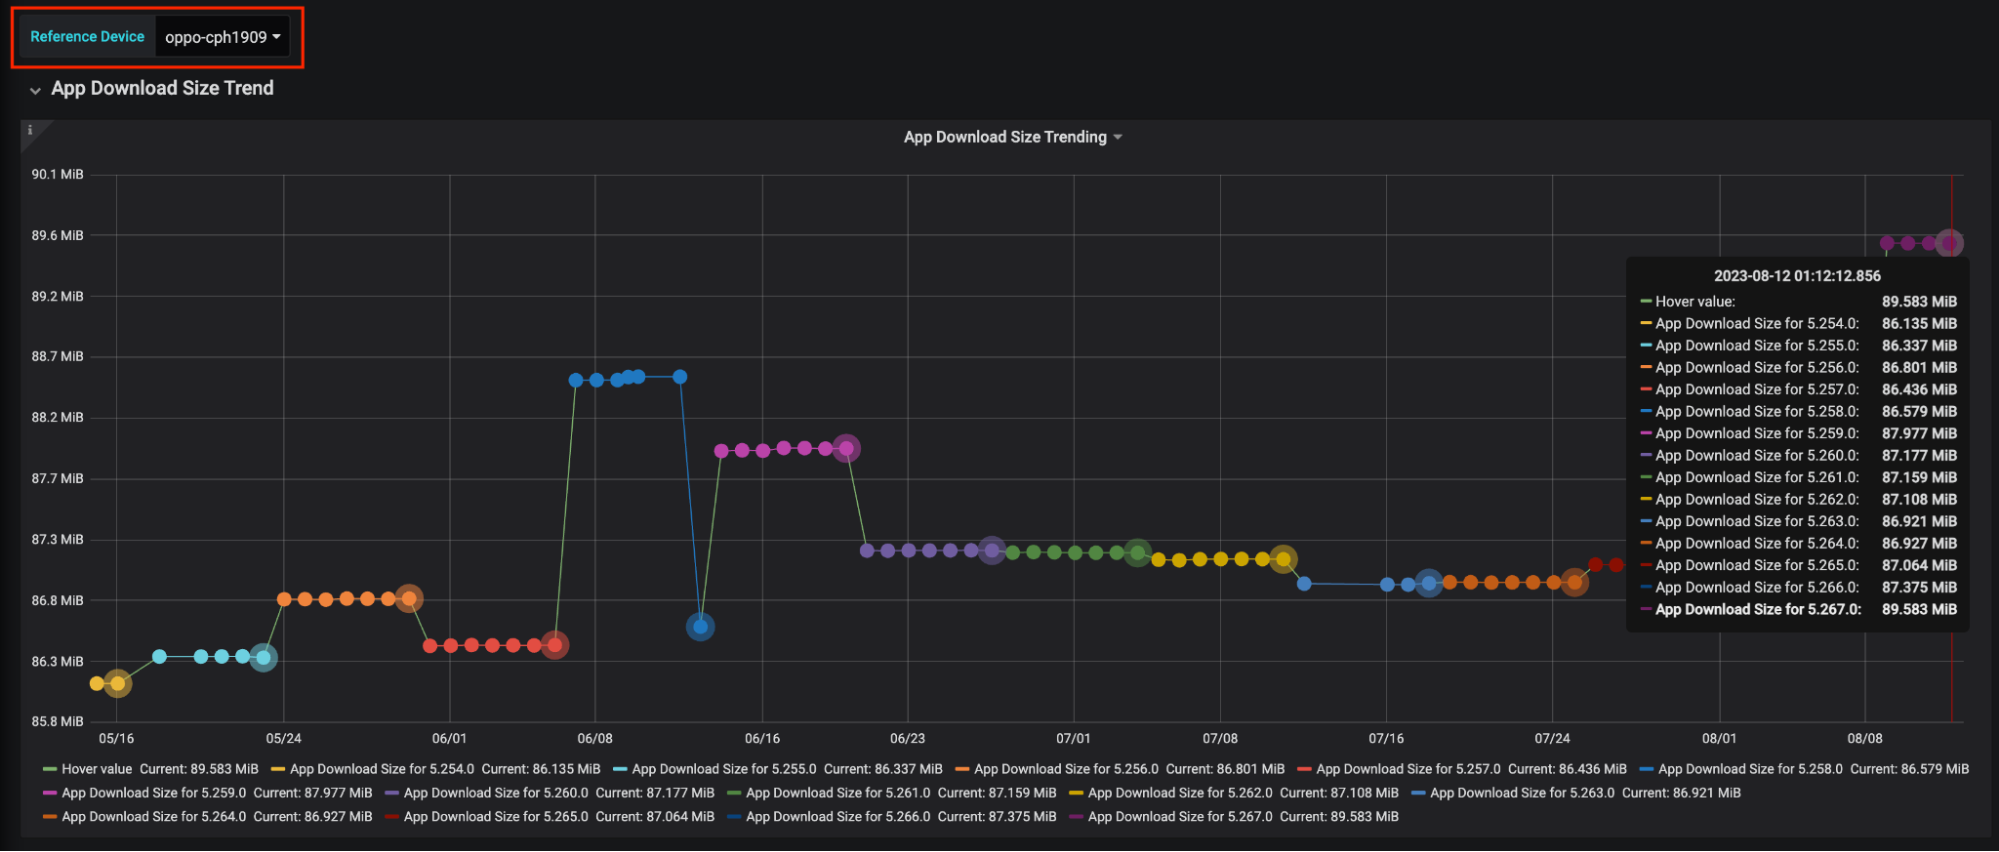
Comprehensive Size Breakdown: A breakdown of the app’s size, including the proportion attributed to the codebase Kotlin/Java, Kotlin/Java-based libraries, native libraries, resources, and other relevant factors.
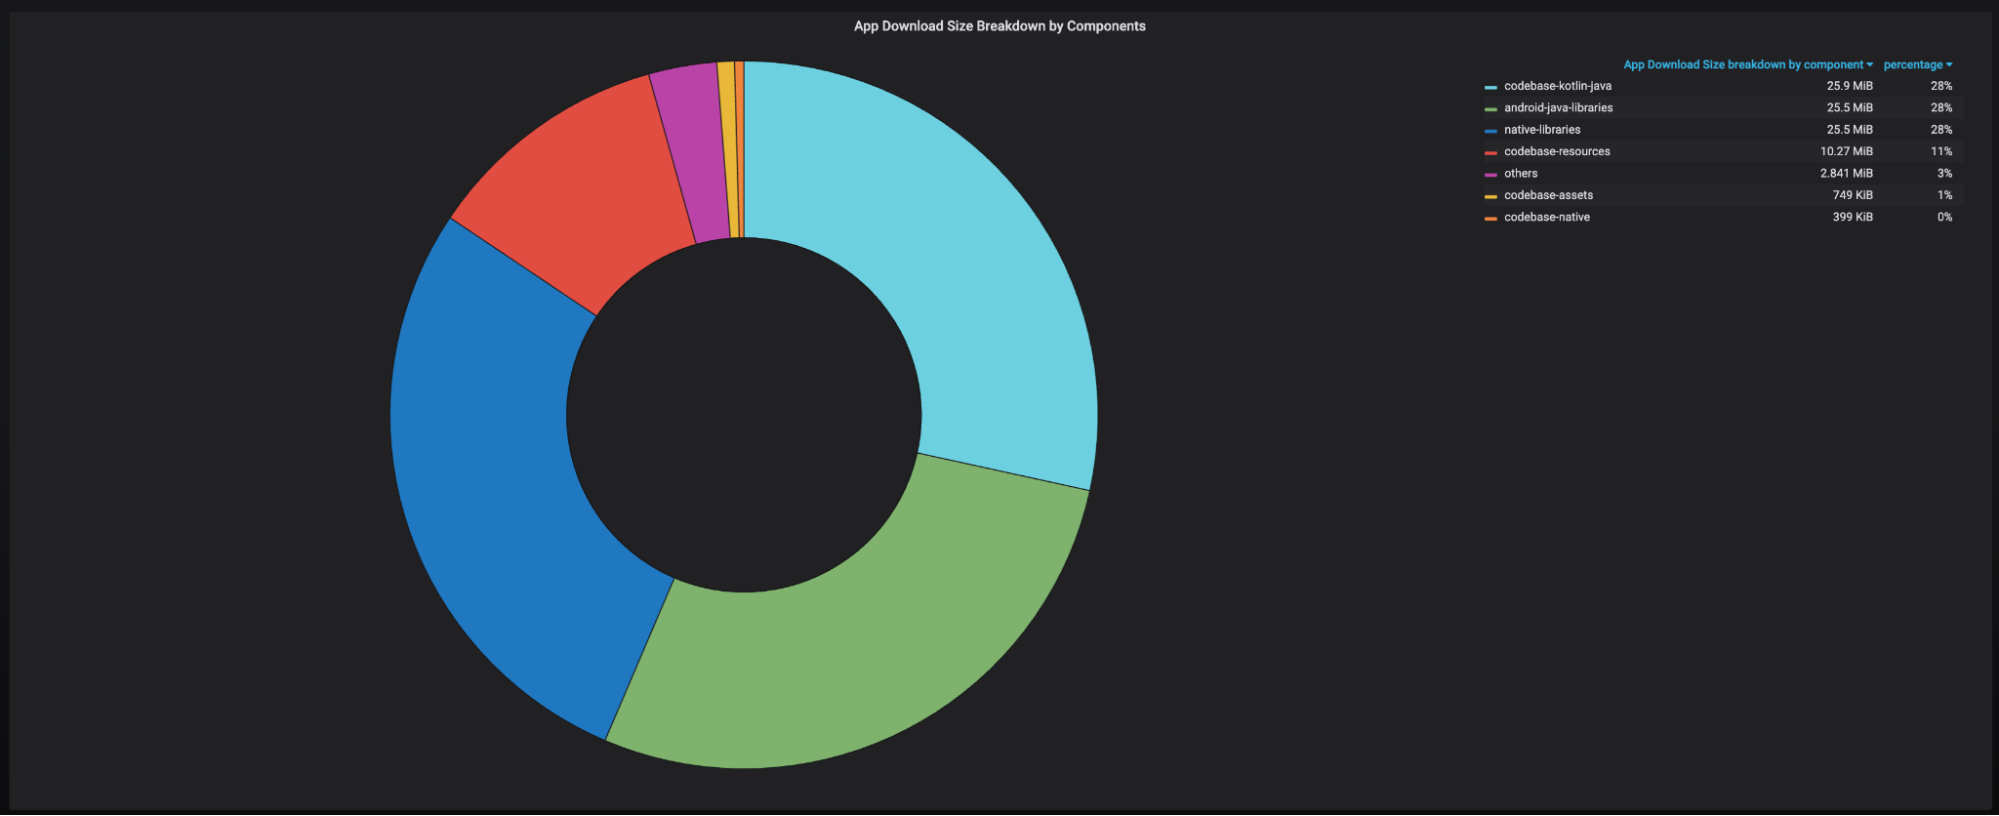
Size Contribution by Teams: Insights into the size contributed by each individual team within the project’s scope.
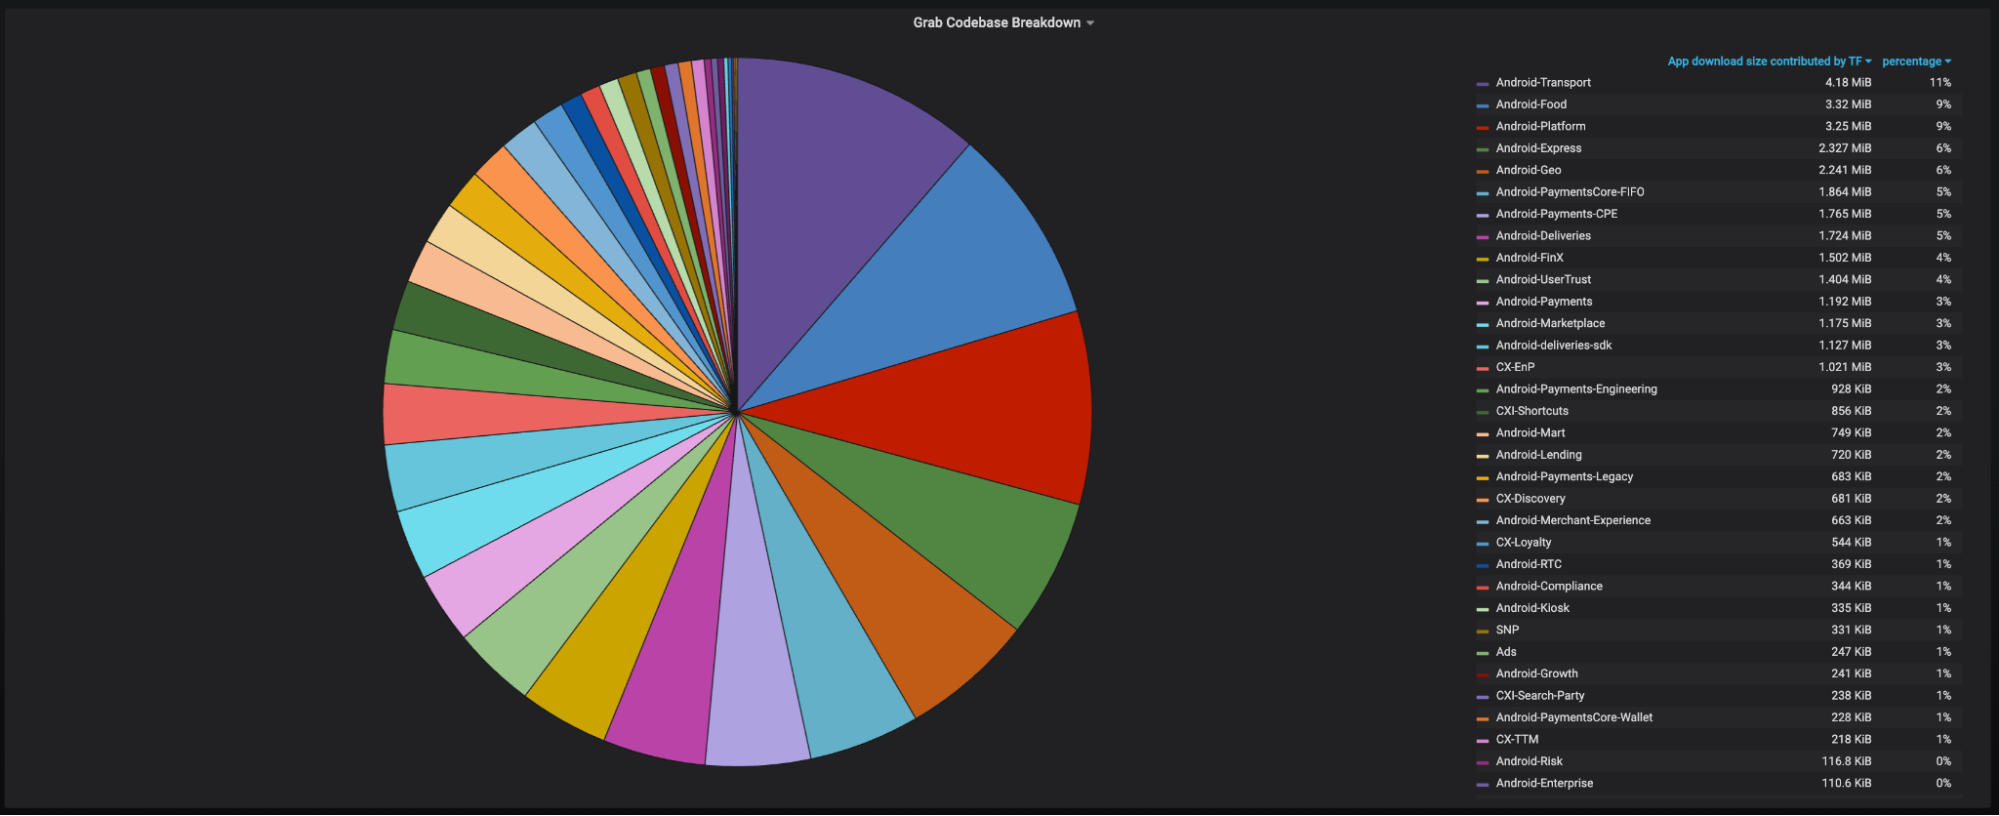
Module-wise Size Contribution: Insights into the size impacted by each module, categorised by team.
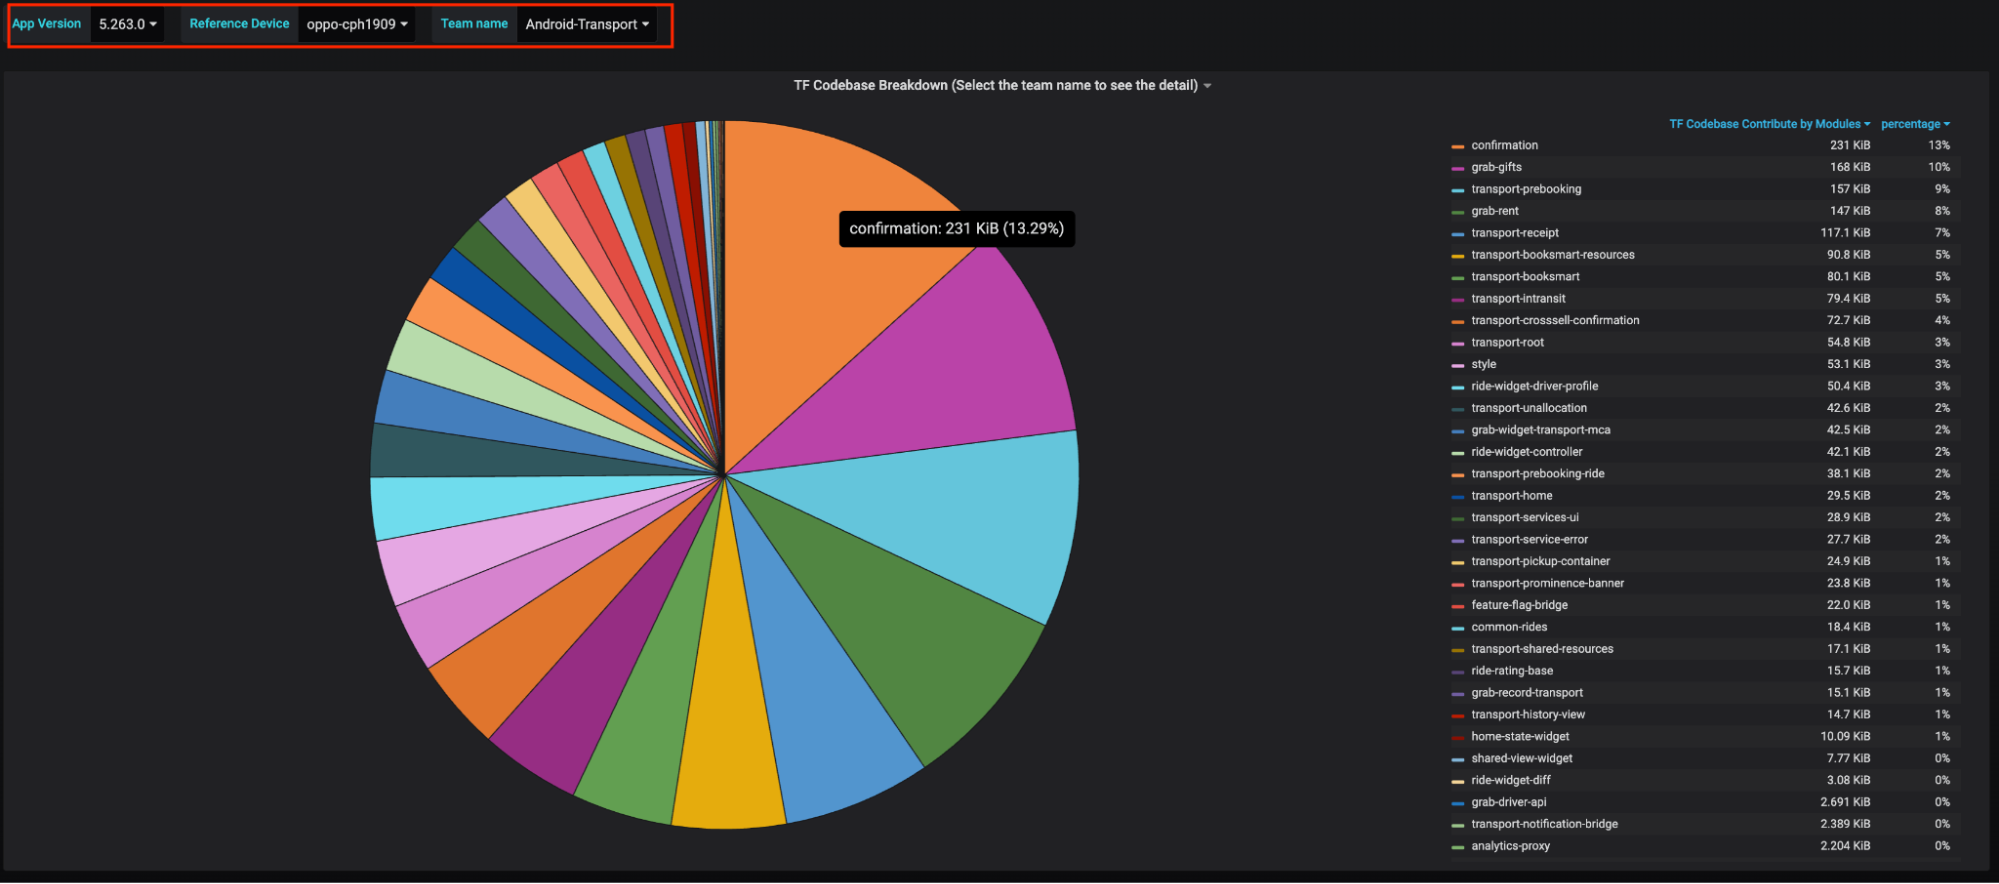
Size Contribution by Third-Party Libraries: Information about the size attributed to each third-party library incorporated within the app.
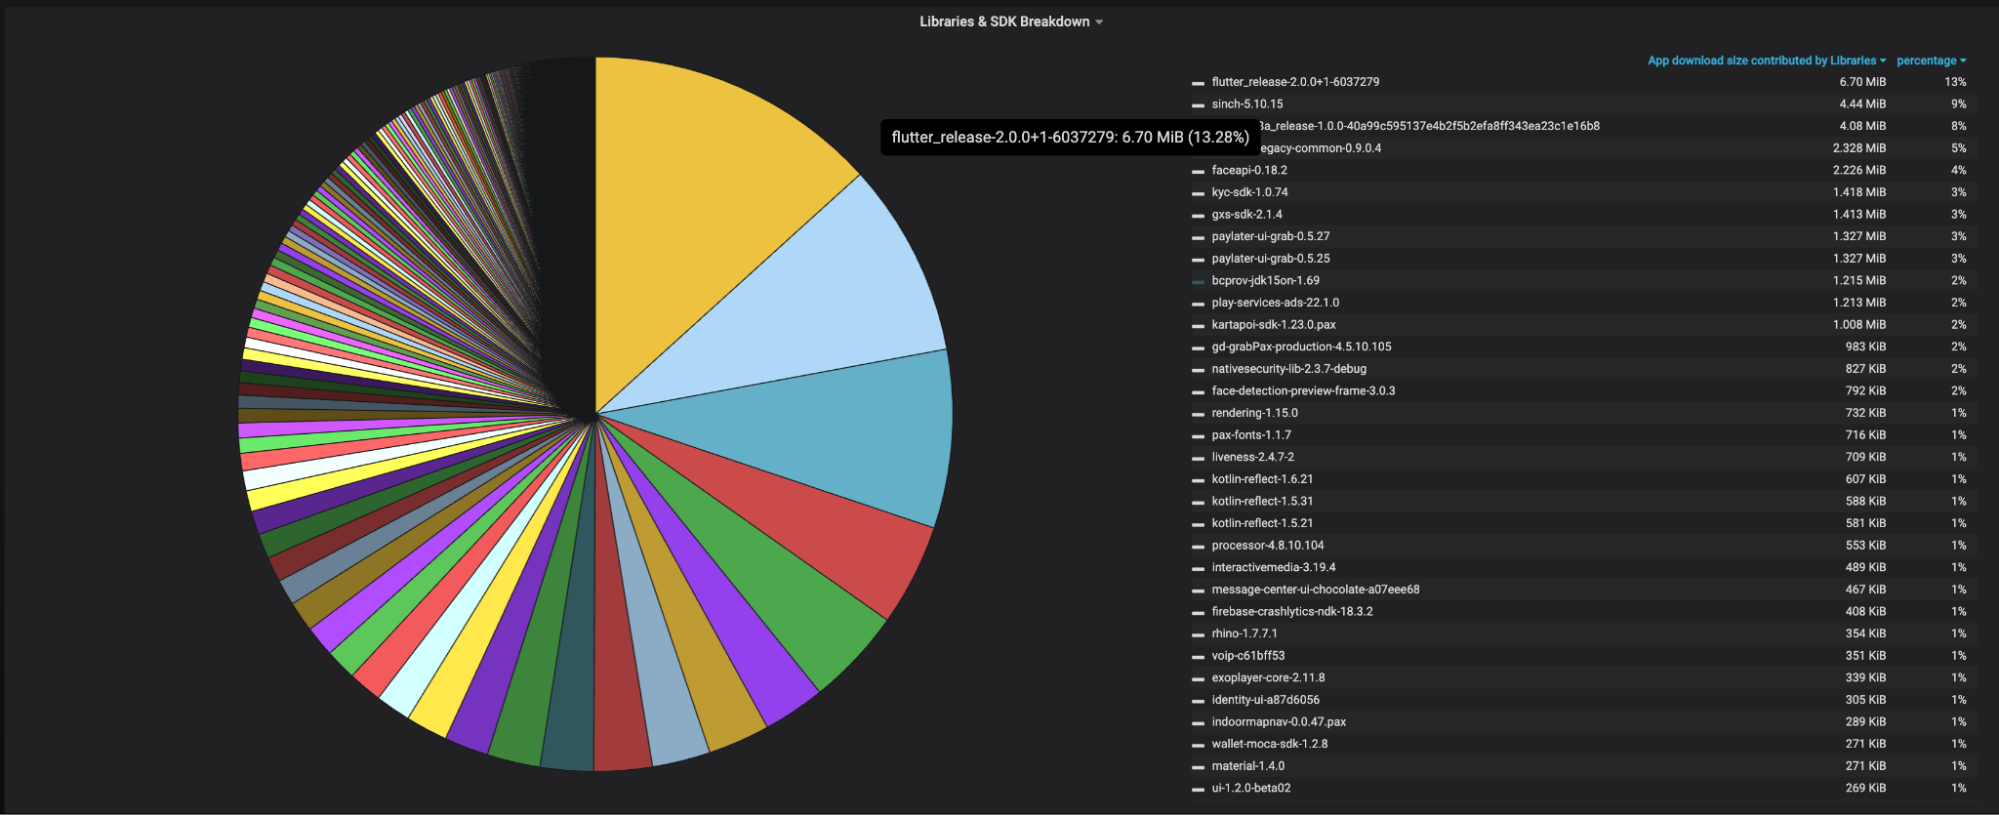
List of Large Files: A categorised list of large files (file size exceeding X value), organised by each respective team.
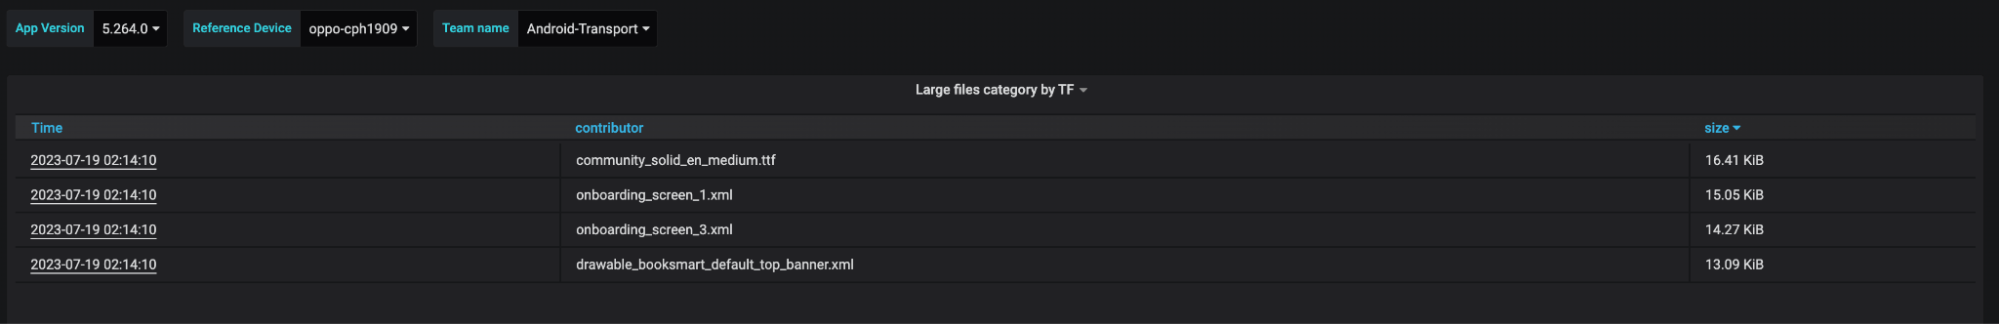
It’s important to note that all the size values presented within these dashboards specifically pertain to the download size, representing the contribution of each item to the overall app download size.
As part of our commitment to the developer community, we plan to open-source this tool in the near future, allowing others to benefit from its capabilities as well.
Reduce
To optimise the app based on the analysis data obtained from the measuring step, we focused on applying common solutions from Google and the suggestions from the community. There were no fancy solutions that we invented. Our concentration centered on optimising the dex file size, refining resources, and eliminating duplication and redundancy.
dex file optimisation (Java/Kotlin)
In our initial findings, it became evident that Java/Kotlin code was the major contributor of app size. Recognising this, we made it our top priority for optimisation.
R classes
During our investigation, we discovered that a proportion of the overall app size was attributable to R classes. Further research unveiled two primary reasons behind this phenomenon:
- Transitive R classes: R classes contained ID references not only to their own resources but also to resources from their transitive dependencies. This meant that if Module A depended on Module B, and Module B in turn, depended on Module C (Module A -> Module B -> Module C), then Module A’s R class included IDs references to resources from Modules B and C, even if Module A didn’t directly utilise these resources. This explained why R classes in a modularised project could accumulate millions of lines of code.
- A spread of Modules and Third-Party Libraries: Our Grab project comprised over 1,500 modules and integrates hundreds of third-party libraries, leading to the generation of significantly large R classes within the project. Furthermore, this discovery also explained instances where our app size monitor exhibited spikes during certain commits despite no significant additions of resources, libraries, or code within those commits. These fluctuations were linked to changes in the dependency graph, further emphasising the impact of Transitive R classes.
It is worth noting that the team had long been cognisant of the challenges posed by Transitive R classes, especially in terms of optimising build times. Consequently, we had already undertaken various initiatives to address this specific challenge related to build times.
However, it wasn’t long before we started wondering why R8 wasn’t removing unused fields from the R classes, which would have resulted in a size reduction for these classes. It turned out that back in mid-2021, we were using Android Gradle Plugin 4.0 along with the default R8 rules. One of these rules was preserving all fields in the R classes:
-keepclassmembers class **.R$* {

   public static <fields>;

}
This rule was the root cause of why unused fields in the R classes were persisting. Google removed this rule in AGP 4.1, and the solution was straightforward: updating AGP to version 4.1.1 (or newer) helped us resolve the issue.
However, due to the project’s unusual size, there was a risk of inadvertently removing non-used R class fields if there were any instances of code accessing R classes through reflection within the codebase or third-party libraries. Since our automation testing did not yet support R8, conducting a full test of the entire project was possible, but would have demanded significant effort from the team. To avoid this substantial effort, we developed a script to search the entire codebase and identify instances where reflections were used, allowing us to assess their usage. For third-party libraries, we decompiled the libraries and applied the same script to the decompiled code.
Fix & Optimise R8 Rules
Subsequently, we conducted a revision of the R8 configuration rules. This involved assessing the compiled R8 configuration file and paying specific attention to any ‘keep’ rules that contained package wildcards. It is crucial to decipher the purpose behind each rule and its reason for existence. Any rules identified as redundant were recommended for removal. Post the thorough scrutiny of the R8 rules, we initiated request tickets urging the respective teams to work on the elimination and optimisation of these rules.
Enable more aggressive optimisations
In 2019, Google began recommending the utilisation of the proguard-android-optimise.txt configuration with code optimisation enabled. However, our project’s origins predate the introduction of Google’s R8, a time when Proguard was the primary tool for code obfuscation and size reduction. Prior to the release of Android Gradle Plugin 3.4.0, there were no explicit recommendations for enabling code optimisations during the minification process. As a result, our project has persisted in using the proguard-android.txt configuration without activating the code optimisation feature.
Our team has considered adopting a more aggressive approach towards optimisation. This approach spans from exploring the optimisation mode to incorporating the R8 full mode. This includes substantial effort required for testing and addressing issues arising from the introduction of these new modes. We encountered a particular challenge wherein the R8 optimisation exhibits instability, an issue that has been reported to Google. A definitive solution remains a work-in-progress.
At present, we have decided to postpone the implementation of a more aggressive R8 mode. However, this remains a high-priority item on our agenda, and we intend to address it in the near future.
Resources optimisation
In addition to optimising the dex file, we also address resource optimisation.
Handling large resources
During the Measure phase, we use the List Of Large Files dashboard to identify large files categorised by teams. For each team, we create request tickets with straightforward guidance. These guidelines encourage the following actions:
- Explore the possibility of removing unnecessary resources.
- Consider offloading the resource to the Internet (server) when feasible. Within Grab, we have the Asset Delivery Kit, which facilitates hosting and downloading resources on the client side.
- Optimise files by converting them to alternative formats or reducing their size. For instance, for images, we recommend utilising vector images and the Webp format, among other optimisations.
Convert PNG to Webp
The Grab app project has a long history, and while the team has recently established guidelines and implemented CI processes to promote the use of vector and Webp images, there are still existing images that have not been optimised. The team has undertaken an initiative to address these images and has converted all PNG images to Webp format wherever a reduction in file size is achievable.
Fonts
Fonts are another group of files that have a notable impact on the project’s size. We collaborate with the teams to:
- Remove fonts that are rarely used in the project.
- Eliminate duplicate fonts.
While the project still contains numerous fonts, we have a project to unify all features and transition to using a single font. Our recommendation is to explore the use of one primary font style, with the flexibility to incorporate different typeface variations in your programming to achieve various typefaces using the same font.
Remove stale features and replace large library
Based on the data, it was discovered that a specific library, which was contributing approximately 8% to the overall app size, had an adverse impact. This library has since been removed from the project. Moreover, through analysing the Size Contribution by Third-Party Libraries dashboard, we identified duplicates in functions and have made efforts to eliminate these redundancies.
Moreover, in Grab, we are using the feature toggle to enable or disable a feature. The feature flags are controlled remotely. It’s very useful for running an experiment or turning off if a feature causes us any problems. So, many features in the project are controlled under a feature flag. In certain cases, even when some features are deactivated, the corresponding code remains included in the binary. We identify these cases and collaborate with teams to remove the redundant code.
After six months of working on the above initiatives, the Bonsai team managed to reduce the Grab app download size by 26%. This is particularly noteworthy, considering that prior to the commencement of the Bonsai Project, the average app size exhibited a monthly increase of approximately 1%.
Containment
After dedicating over a semester to the Reduce phase, we started the transition to the Containment phase. The first step for this phase involved setting up an App Growth Rate dashboard that presents the growth rate of app download size per release. Our goal is to keep this rate as low as possible.
The team has been discovering a few solutions, such as introducing the common UI design components to prevent duplication, and experimenting with Dynamic Delivery Feature. This phase of exploration is still ongoing and we are optimistic that it will help maintain a manageable app download size, or perhaps even contribute to further optimization.
Considering alternative initiatives, the team is contemplating recognising app size as a confined resource of our application. We believe it should be the responsibility of every team to maintain an optimal app size. Based on the measurements we have, which provide an insight into each team’s impact on the total app download size, it could be advantageous to allocate an ‘app size budget’ to each team. This would entail each team taking responsibility for managing and maintaining the size influenced by their work.
Conclusion
Grab’s Project Bonsai demonstrated the company’s commitment to optimising the app experience for users in Southeast Asia. By prioritising code optimisation, resource management, modularisation, and asset bundling, we achieved substantial optimisations in app size while enhancing user experience. These efforts not only addressed the challenges we outlined, but also contributed to increased user acquisition and improved user retention rates.
Join us
Grab is the leading superapp platform in Southeast Asia, providing everyday services that matter to consumers. More than just a ride-hailing and food delivery app, Grab offers a wide range of on-demand services in the region, including mobility, food, package and grocery delivery services, mobile payments, and financial services across 428 cities in eight countries.
Powered by technology and driven by heart, our mission is to drive Southeast Asia forward by creating economic empowerment for everyone. If this mission speaks to you, join our team today!