Searching through log data to find operational or business insights often feels like looking for a needle in a haystack. It usually requires you to manually filter and review individual log records. To help you with that, Amazon CloudWatch has added new capabilities to automatically recognize and cluster patterns among log records, extract noteworthy content and trends, and notify you of anomalies using advanced machine learning (ML) algorithms trained using decades of Amazon and AWS operational data.
Specifically, CloudWatch now offers the following:
The Patterns tab on the Logs Insights page finds recurring patterns in your query results and lets you analyze them in detail. This makes it easier to find what you’re looking for and drill down into new or unexpected content in your logs.
The Compare button in the time interval selector on the Logs Insights page lets you quickly compare the query result for the selected time range to a previous period, such as the previous day, week, or month. In this way, it takes less time to see what has changed compared to a previous stable scenario.
The Log Anomalies page in the Logs section of the navigation pane automatically surfaces anomalies found in your logs while they are processed during ingestion.
Let’s see how these work in practice with a typical troubleshooting journey. I will look at some application logs to find key patterns, compare two time periods to understand what changed, and finally see how detecting anomalies can help discover issues.
Finding recurring patterns in the logs In the CloudWatch console, I choose Logs Insights from the Logs section of the navigation pane. To start, I have selected which log groups I want to query. In this case, I select a log group of a Lambda function that I want to inspect and choose Run query.
In the Pattern tab, I see the patterns that have been found in these log groups. One of the patterns seems to be an error. I can select it to quickly add it as a filter to my query and focus on the logs that contain this pattern. For now, I choose the magnifying glass icon to analyze the pattern.
In the Pattern inspect window, a histogram with the occurrences of the pattern in the selected time period is shown. After the histogram, samples from the logs are provided.
The variable parts of the pattern (such as numbers) have been extracted as “tokens.” I select the Token values tab to see the values for a token. I can select a token value to quickly add it as a filter to the query and focus on the logs that contain this pattern with this specific value.
I can also look at the Related patterns tab to see other logs that typically occurred at the same time as the pattern I am analyzing. For example, if I am looking at an ERROR log that was always written alongside a DEBUG log showing more details, I would see that relationship there.
Comparing logs with a previous period To better understand what is happening, I choose the Compare button in the time interval selector. This updates the query to compare results with a previous period. For example, I choose Previous day to see what changed compared to yesterday.
In the Patterns tab, I notice that there has actually been a 10 percent decrease in the number of errors, so the current situation might not be too bad.
I choose the magnifying glass icon on the pattern with severity type ERROR to see a full comparison of the two time periods. The graph overlaps the occurrences of the pattern over the two periods (now and yesterday in this case) inside the selected time range (one hour).
Errors are decreasing but are still there. To reduce those errors, I make some changes to the application. I come back after some time to compare the logs, and a new ERROR pattern is found that was not present in the previous time period.
My update probably broke something, so I roll back to the previous version of the application. For now, I’ll keep it as it is because the number of errors is acceptable for my use case.
Detecting anomalies in the log I am reassured by the decrease in errors that I discovered comparing the logs. But how can I know if something unexpected is happening? Anomaly detection for CloudWatch Logs looks for unexpected patterns in the logs as they are processed during ingestion and can be enabled at log group level.
I select Log groups in the navigation pane and type a filter to see the same log group I was looking at before. I choose Configure in the Anomaly detection column and select an Evaluation frequency of 5 minutes. Optionally, I can use a longer interval (up to 60 minutes) and add patterns to process only specific log events for anomaly detection.
After I activate anomaly detection for this log group, incoming logs are constantly evaluated against historical baselines. I wait for a few minutes and, to see what has been found, I choose Log anomalies from the Logs section of the navigation pane.
To simplify this view, I can suppress anomalies that I am not interested in following. For now, I choose one of the anomalies in order to inspect the corresponding pattern in a way similar to before.
After this additional check, I am convinced there are no urgent issues with my application. With all the insights I collected with these new capabilities, I can now focus on the errors in the logs to understand how to solve them.
Things to know Amazon CloudWatch automated log pattern analytics is available today in all commercial AWS Regions where Amazon CloudWatch Logs is offered excluding the China (Beijing), the China (Ningxia), and Israel (Tel Aviv) Regions.
The patterns and compare query features are charged according to existing Logs Insights query costs. Comparing a one-hour time period against another one-hour time period is equivalent to running a single query over a two-hour time period. Anomaly detection is included as part of your log ingestion fees, and there is no additional charge for this feature. For more information, see CloudWatch pricing.
Today, I’m happy to announce a new capability, Amazon Managed Service for Prometheus collector, to automatically and agentlessly discover and collect Prometheus metrics from Amazon Elastic Kubernetes Service (Amazon EKS). Amazon Managed Service for Prometheus collector consists of a scraper that discovers and collects metrics from Amazon EKS applications and infrastructure without needing to run any collectors in-cluster.
This new capability provides fully managed Prometheus-compatible monitoring and alerting with Amazon Managed Service for Prometheus. One of the significant benefits is that the collector is fully managed, automatically right-sized, and scaled for your use case. This means you don’t have to run any compute for collectors to collect the available metrics. This helps you optimize metric collection costs to monitor your applications and infrastructure running on EKS.
With this launch, Amazon Managed Service for Prometheus now supports two major modes of Prometheus metrics collection: AWS managed collection, a fully managed and agentless collector, and customer managed collection.
Getting started with Amazon Managed Service for Prometheus Collector Let’s take a look at how to use AWS managed collectors to ingest metrics using this new capability into a workspace in Amazon Managed Service for Prometheus. Then, we will evaluate the collected metrics in Amazon Managed Service for Grafana.
When you create a new EKS cluster using the Amazon EKS console, you now have the option to enable AWS managed collector by selecting Send Prometheus metrics to Amazon Managed Service for Prometheus. In the Destination section, you can also create a new workspace or select your existing Amazon Managed Service for Prometheus workspace. You can learn more about how to create a workspace by following the getting started guide.
Then, you have the flexibility to define your scraper configuration using the editor or upload your existing configuration. The scraper configuration controls how you would like the scraper to discover and collect metrics. To see possible values you can configure, please visit the Prometheus Configuration page.
Once you’ve finished the EKS cluster creation, you can go to the Observability tab on your cluster page to see the list of scrapers running in your EKS cluster.
The next step is to configure your EKS cluster to allow the scraper to access metrics. You can find the steps and information on Configuring your Amazon EKS cluster.
Once your EKS cluster is properly configured, the collector will automatically discover metrics from your EKS cluster and nodes. To visualize the metrics, you can use Amazon Managed Grafana integrated with your Prometheus workspace. Visit the Set up Amazon Managed Grafana for use with Amazon Managed Service for Prometheus page to learn more.
The following is a screenshot of metrics ingested by the collectors and visualized in an Amazon Managed Grafana workspace. From here, you can run a simple query to get the metrics that you need.
Using AWS CLI and APIs Besides using the Amazon EKS console, you can also use the APIs or AWS Command Line Interface (AWS CLI) to add an AWS managed collector. This approach is useful if you want to add an AWS managed collector into an existing EKS cluster or make some modifications to the existing collector configuration.
To create a scraper, you can run the following command:
You can get most of the parameter values from the respective AWS console, such as your EKS cluster ARN and your Amazon Managed Service for Prometheus workspace ARN. Other than that, you also need to define the scraper configuration defined as configurationBlob.
Once you’ve defined the scraper configuration, you need to encode the configuration file into base64 encoding before passing the API call. The following is the command that I use in my Linux development machine to encode sample-configuration.yml into base64 and copy it onto the clipboard.
$ base64 sample-configuration.yml | pbcopy
Now Available The Amazon Managed Service for Prometheus collector capability is now available to all AWS customers in all AWS Regions where Amazon Managed Service for Prometheus is supported.
With this launch, Amazon EFS supports three Regional storage classes:
EFS Standard – Powered by SSD storage and designed to deliver submillisecond latency for active data.
EFS Infrequent Access (EFS IA) – Cost-optimized for data accessed only a few times a quarter, and that doesn’t need the submillisecond latencies of EFS Standard.
EFS Archive – Cost-optimized for long-lived data accessed a few times a year or less and offering similar performance to EFS IA.
All Regional storage classes deliver gigabytes-per-second throughput and hundreds of thousands of IOPS performance and are designed for eleven nines of durability.
You don’t need to manually pick and choose a storage class for your file systems because EFS lifecycle management can automatically migrate files across storage classes based on their access patterns. This allows you to have a single shared file system that contains files processed in very different ways: from active latency-sensitive to cold rarely-accessed data.
Many datasets have subsets of data that are valuable for generating insights but aren’t often used. With EFS Archive, you can store rarely accessed data cost-effectively while keeping it in the same shared file system as other data. This simplified storage approach allows end users and applications to collaborate on large shared datasets in one place, making it easier and quicker to set up and scale analytics workloads.
Using EFS Archive, you can optimize costs for workloads with large file-based datasets that contain a mix of active and inactive data such as user shares, machine learning (ML) training datasets, SaaS applications, and data retained for regulatory compliance like financial transactions and medical records.
Let’s see how this works in practice.
Using EFS Archive storage To use the new EFS Archive storage class, I need to configure lifecycle management for the file system. In the Amazon EFS console, I select one of my file systems and choose Edit. To use EFS Archive storage, the file system Throughput mode must be Elastic. Elastic Throughput is the recommended choice for most workloads because it is designed to provide applications with as much throughput as they need with pay-as-you-use pricing.
Now, I configure Lifecycle management to transition files into EFS IA or EFS Archive based on my workload’s access patterns.
My workloads rarely use files older than one month. Files older than a quarter are not used by normal activities but need to be kept for a longer time. Based on these considerations, I select to automatically transition files to EFS IA after 30 days and to EFS Archive after 90 days since the last access. These are the default settings for new file systems.
When one of my old files is accessed, it’s usually an indicator that is being used in a new analysis, so it’ll become active again for some period. For this reason, I use the option to transition files back to Standard storage on their first access in IA or Archive storage.
I save changes, and that’s it! This file system will now automatically use different storage classes based on how files are being processed by my applications.
Things to know EFS Archive is available today in all AWS Regions where Amazon EFS is offered, excluding those based in China.
To offer a more cost-optimized experience for colder, rarely-accessed files, EFS Archive offers 50 percent lower storage cost than EFS IA with a three times higher request charge when data is accessed. For more information, see Amazon EFS pricing.
You can use EFS Archive with existing file systems by configuring the file system lifecycle policies. New file systems are created by default with a lifecycle policy that automatically transitions files to EFS IA after 30 days and to EFS Archive after 90 days since the last access.
Amazon CloudWatch Logs announces today a new log class called Infrequent Access. This new log class offers a tailored set of capabilities at a lower cost for infrequently accessed logs, enabling customers to consolidate all their logs in one place in a cost-effective manner.
As customers’ applications continue to scale and grow, so does the volume of logs generated. To limit the increase of logging costs, many customers are forced to make hard trade-offs. For example, some customers limit the logs generated by their applications, which can hinder the visibility of the application, or choose a different solution for different log types, which adds complexity and inefficiencies in managing different logging solutions. For instance, customers may send logs needed for real-time analytics and alerting to CloudWatch Logs and send more detailed logs needed for debugging and troubleshooting to a lower-cost solution that doesn’t have as many features as CloudWatch. In the end, these workarounds can impact the observability of the application, because customers need to navigate across multiple solutions to see their logs.
The Infrequent Access log class allows you to build a holistic observability solution using CloudWatch by centralizing all your logs in one place to ingest, query, and store your logs in a cost-efficient way. Infrequent Access is 50 percent lower per GB ingestion price than Standard log class. It provides a tailored set of capabilities for customers that don’t need advanced features like Live Tail, metric extraction, alarming, or data protection that the Standard log class provides. With Infrequent Access, you can still get the benefits of fully managed ingestion, storage, and the ability to deep dive using CloudWatch Logs Insights.
The following table shows a side-by-side comparison of the features that the new Infrequent Access and the Standard log classes have.
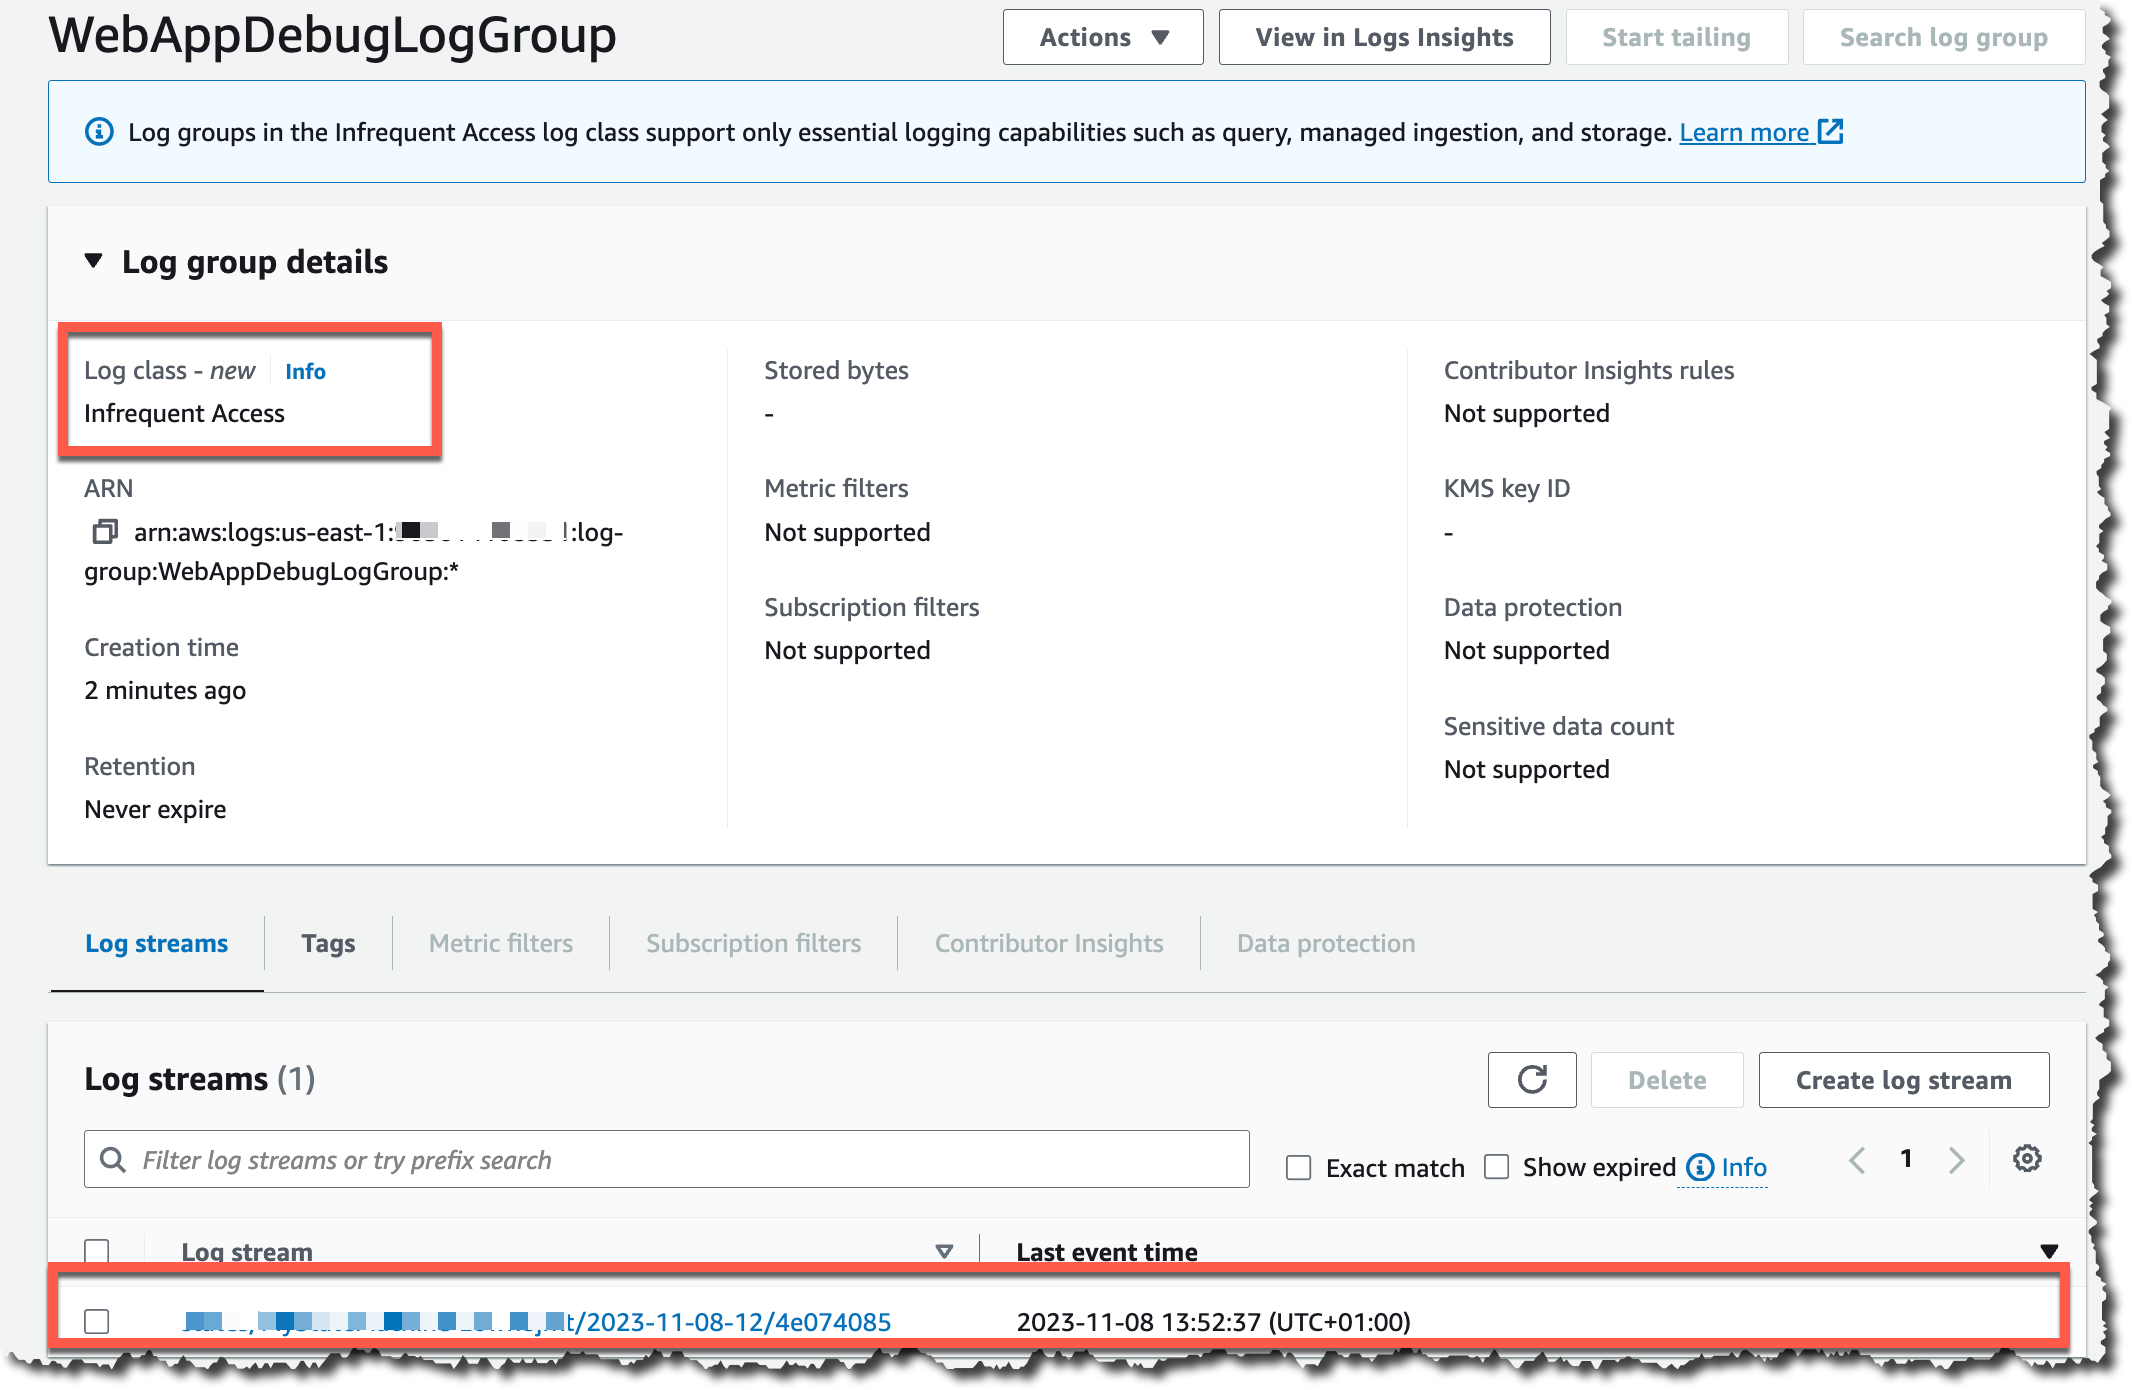
When to use the new Infrequent Access log class Use the Infrequent Access log class when you have a new workload that doesn’t require advanced features provided by the Standard log class. One important consideration is that when you create a log group with a specific log class, you cannot change that log group log class afterward.
The Infrequent Access log class is suitable for debug logs or web server logs because they are quite verbose and rarely require any of the advanced functionality that the Standard log class provides.
Another good workload for the Infrequent Access log class is an Internet of Things (IoT) fleet sending detailed logs that are only accessed for after the fact forensic analysis after the event. In addition, the Infrequent Access log class is a good choice for workloads where logs need to be stored for compliance because they will be queried infrequently.
Once you have the new log group created, you can start using it in your workloads. For this example, I will configure a web application to send debug logs to this log group. After a while of the web application executes for a while, you can go back to the log group, where you see a new log stream.
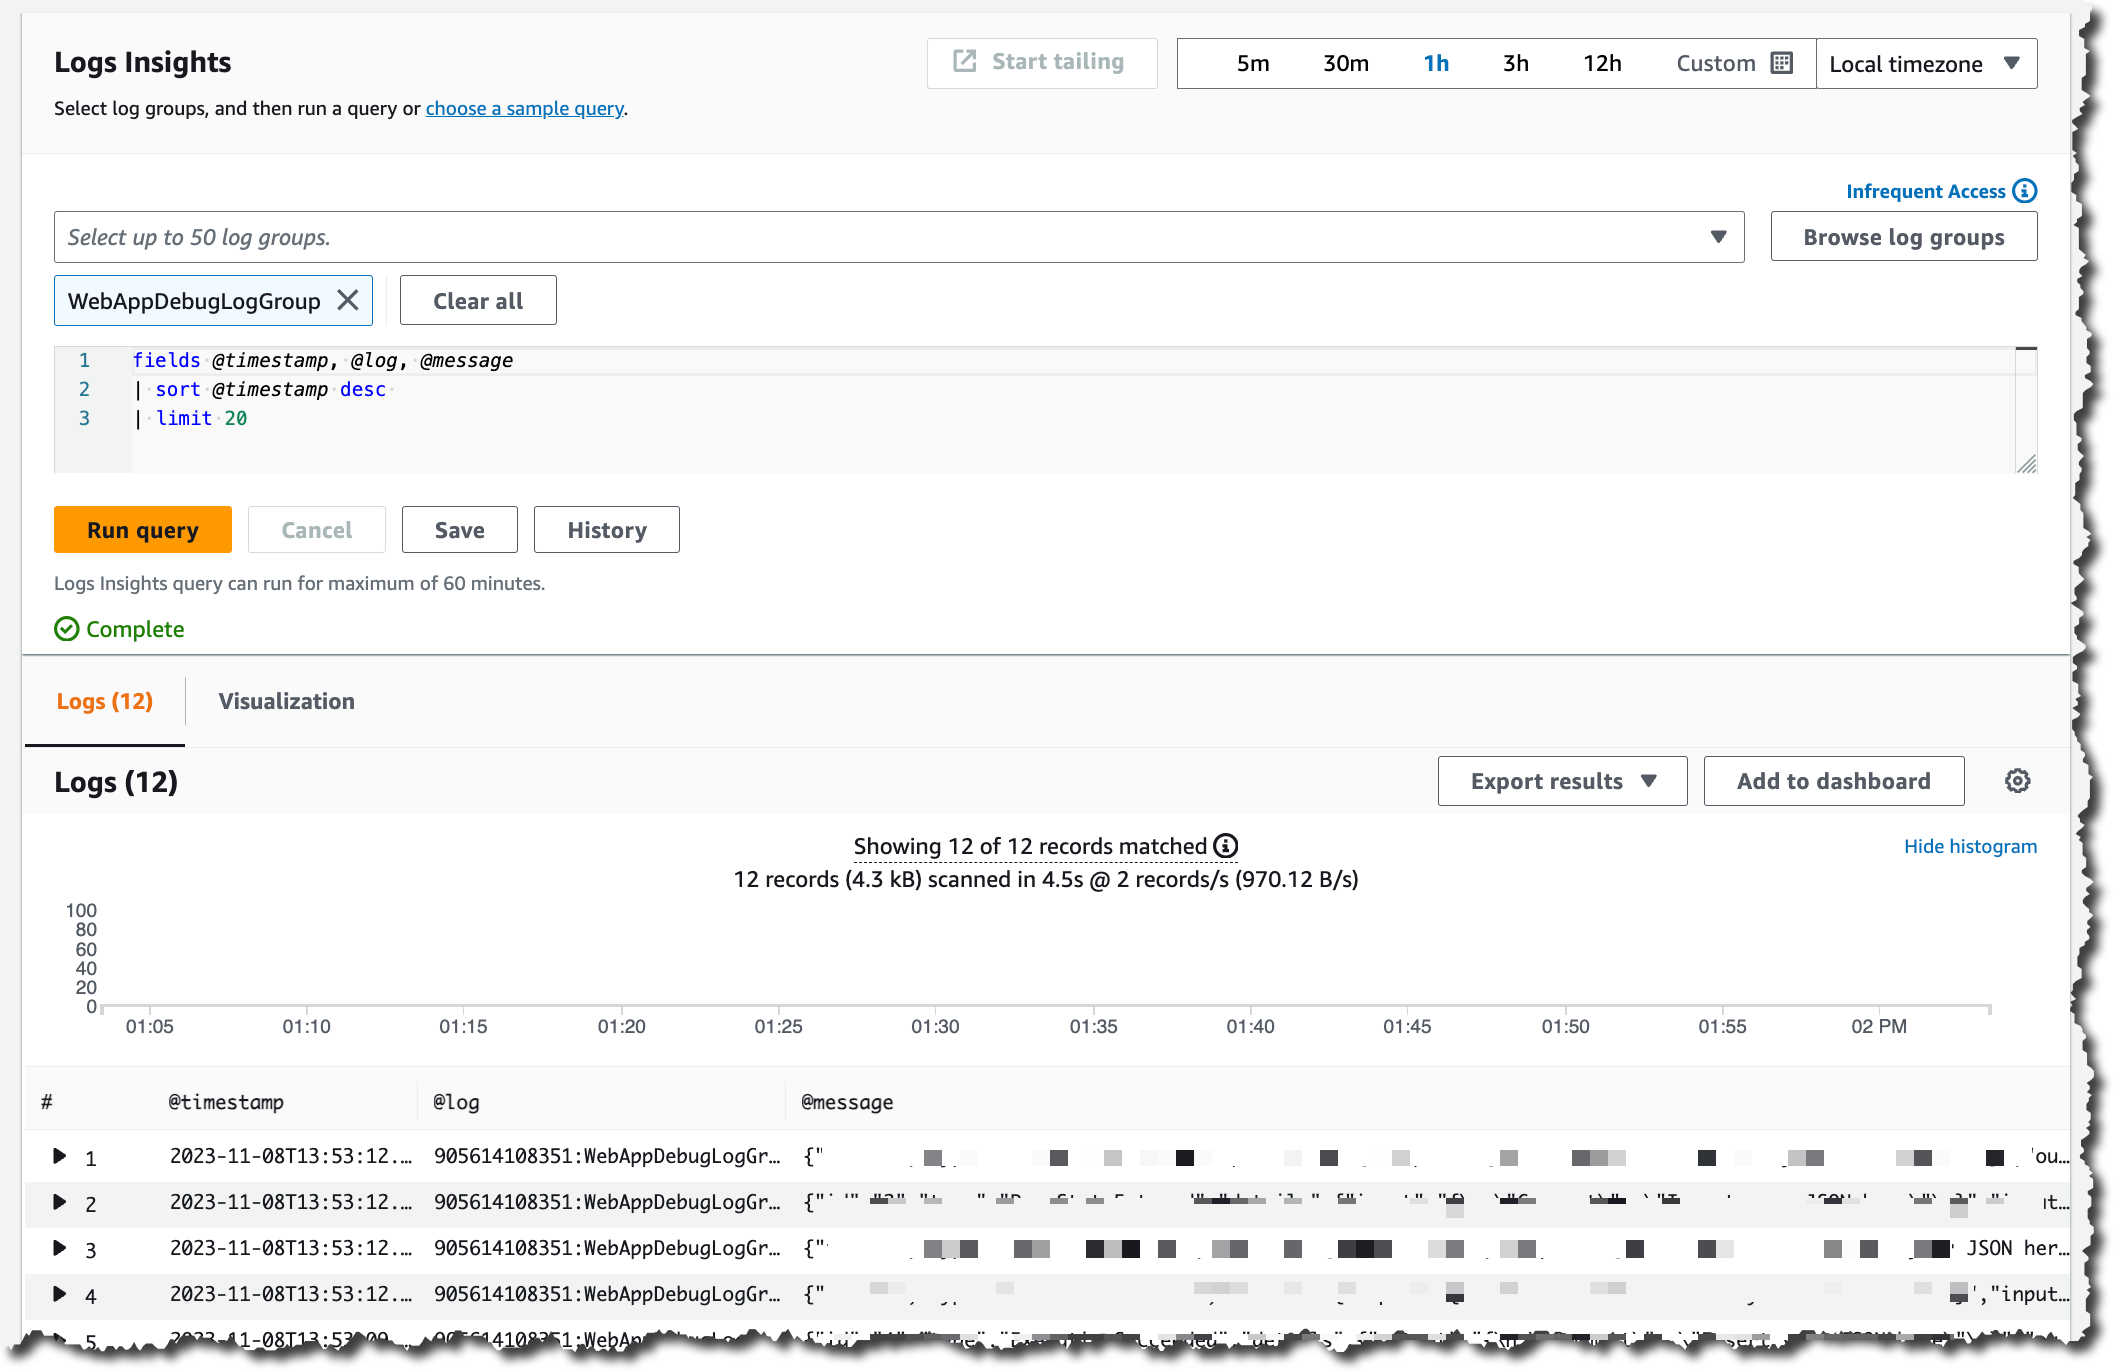
When you select a log stream, you will be directed to CloudWatch Logs Insights.
Using the same familiar CloudWatch Logs Insights experience you get with Standard Class, you can create queries and search those logs to find relevant information, and you can analyze all the logs quickly in one place.
Available now The new Infrequent Access log class is now available in all AWS Regions except the China and GovCloud Regions. You can start using it and enjoy a more cost-effective way to collect, store, and analyze your logs in a fully managed experience.
To learn more about the new log class, you can check the CloudWatch Logs user guide dedicated page for the Infrequent Access log class.
Всяка сутрин се будим в пореден ден, в който едва се диша от барут, кръв и тестостерон. Освен че не се диша, не се и вижда, предвид стелещата се мъгла от всепоглъщащ фейк, в която безтегловно плуват късове недосварени и недосдъвкани факти. На този мътен фон – няколко обнадеждаващи новини за жени, които избистрят бульона и придават разум, яснота и очертания на света.
Да започнем с победата на Антоанета Стефанова, Нургюл Салимова, Гергана Пейчева, Виктория Радева и Белослава Кръстева, които показаха как се печели битка на черно-бялото поле, и извоюваха европейската отборна титла по шахмат в Будва. Не е изненада, че в социалните мрежи изключителните качества на тези жени бяха по балкански подсладено коментирани и през външния им вид – нещо, което у нас продължава да „минава метър“, и то с навирен нос, макар че всъщност отнема от тягата и сериозността на всеки професионален успех, постигнат от жена.
(Коментирах този казус с приятелка по телефона, а тя ми обърна внимание, че докато кибиците в Ганковото кафене на Facebook плакнат зачервени от скролване очи по шахматните шампионки, обективирайки ги в пионки, американското списание за мъжка мода, стил, фитнес и пр. GQ избрало за „Мъж на годината“ Ким Кардашиян. Както викат напоследък и старите, и младите – евала! Същото ще кажа и когато мъж бъде избран за „Жена на годината“ (а не просто номиниран като Боно през 2016-та). И когато приеме титлата, разбира се.)
Продължаваме с жените… Спираща дъха история за борба и изключителна проява на воля, дух и гражданска щедрост четете в статията на Светла Енчева „Жена, която между другото е транс. Защо Габриела Банкова рискува живота си“. Вече повече от десет дни тази вдъхновяваща жена гладува пред Съдебната палата в знак на протест срещу съдебната система, незачитаща правата на гражданите, включително нейните собствени. Или както пише Светла Енчева, Габриела Банкова залага живота си,
за да се състои важният обществен разговор за връзката между правосъдието и правата.
Засега реакцията на онези, които следва да реагират, е нулева.
Друга важна тема в новия брой е близкото бъдеще на образователната система, която в някои отношения все още е в далечното минало. След като бюджетът за образование за 2023 г. беше намален (от 4,5% на 4,1%), а за 2024-та е предвидено леко увеличение (до 4,2 %), въпросът е как ще изглеждат реформите и в какъв времеви хоризонт ще се състоят. Повече за тази ключова за развитието на обществото ни тема четете в интервюто на Надежда Цекулова „Какво да (не) очакваме от образованието през 2024 г. Разговор с Елисавета Белобрадова“.
Темата за образованието косвено е засегната и в текста на Александър Нуцов „Няма хора – няма бизнес“, в който става дума за нарастващия у нас глад както за висококвалифицирани специалисти, така и за неквалифицирани кадри. Неспособността на образователната система да отговори на потребностите на трудовия пазар и на бизнеса в България има много и далечни последствия. Пътната карта за частичното решаване на този проблем минава през създаването на ясни и утъпкани процедури за внос на специалисти отвън, включително от страни извън ЕС.
Както проблемите, свързани с образованието, така и въпросите, отнасящи се до пазара на труда (впрочем и до културата и здравеопазването) изискват дългосрочни политики от страна на правителството, а също и смислено и постоянно сътрудничество между отделните министерства. Доколко възможно изглежда това в момента? Трудно е да се каже, особено след одиозния футболен скандал, в който лъснаха някои неприятни истини за сглобките, снадките и намотките в правителството. Повече за това кой, как, откъде и защо „те така те“ – четете в анализа на Емилия Милчева „Чие е МВР?“.
Но да се върнем към централната сюжетна линия на броя, а именно образованието в най-широк смисъл, като продължаваме с препоръки за четене. В рубриката „По буквите: Данова, Бенбасат“ Зорница Христова ни представя две важни книги за детството – тема, също неглижирана като периферна и второстепенна. Романът на Алберт Бенбасат е автофикция, която ни връща, включително езиково, в мултикултурната махала на ранните спомени. А изследването на Надя Данова се занимава с възпитателните традиции и нагласи по нашите географски ширини.
Време е да преминем и към десерта на броя. В рубриката „Стихотворение на месеца“, в този случай ноември, публикуваме „Това да е стихът“ на един от най-големите съвременни английски поети Филип Ларкин. В него горчиво-смешно, иронично и със замах се отхвърлят семейните „наследства“, а чудесният превод е дело на Кристин Димитрова. Съвсем скоро благодарение на Кристин Димитрова, Георги Пашов и „Издателство за поезия ДА“ ще държим в ръцете си цялата страхотна (четвърта и последна) стихосбирка на Ларкин „Високи прозорци“ (1974) – за пръв път на български език (ура!).
А докато това стане, дръжте „високите си прозорци“ чисти и широко отворени. Светът отвън може да има нужда от вашата щедрост, от вашата грижа.
At Netflix, we want our viewers to easily find TV shows and movies that resonate and engage. Our creative team helps make this happen by designing promotional artwork that best represents each title featured on our platform. What if we could use machine learning and computer vision to support our creative team in this process? Through identifying the components that contribute to a successful artwork — one that leads a member to choose and watch it — we can give our creative team data-driven insights to incorporate into their creative strategy, and help in their selection of which artwork to feature.
We are going to make an assumption that the presence of a specific component will lead to an artwork’s success. We will discuss a causal framework that will help us find and summarize the successful components as creative insights, and hypothesize and estimate their impact.
The Challenge
Given Netflix’s vast and increasingly diverse catalog, it is a challenge to design experiments that both work within an A/B test framework and are representative of all genres, plots, artists, and more. In the past, we have attempted to design A/B tests where we investigate one aspect of artwork at a time, often within one particular genre. However, this approach has a major drawback: it is not scalable because we either have to label images manually or create new asset variants differing only in the feature under investigation. The manual nature of these tasks means that we cannot test many titles at a time. Furthermore, given the multidimensional nature of artwork, we might be missing many other possible factors that might explain an artwork’s success, such as figure orientation, the color of the background, facial expressions, etc. Since we want to ensure that our testing framework allows for maximum creative freedom, and avoid any interruption to the design process, we decided to try an alternative approach.
Figure. Given the multidimensional nature of artwork, it is challenging to design an A/B test to investigate one aspect of artwork at a given time. We could be missing many other possible factors that might explain an artwork’s success, such as figure orientation, the color of the background, facial expressions, etc.
The Causal Framework
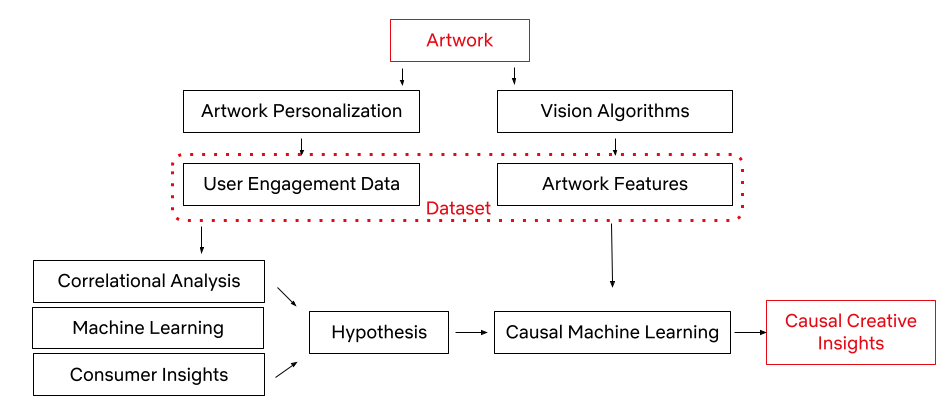
Thanks to our Artwork Personalization System and vision algorithms (some of which are exemplified here), we have a rich dataset of promotional artwork components and user engagement data to build a causal framework. Utilizing this dataset, we have developed the framework to test creative insights and estimate their causal impact on an artwork’s performance via the dataset generated through our recommendation system. In other words, we can learn which attributes led to a title’s successful selection based on its artwork.
Let’s first explore the workflow of the causal framework, as well as the data and success metrics that power it.
We represent the success of an artwork with the take rate: the probability of an average user to watch the promoted title after seeing its promotional artwork, adjusted for the popularity of the title. Every show on our platform has multiple promotional artwork assets. Using Netflix’s Artwork Personalization, we serve these assets to hundreds of millions of members everyday. To power this recommendation system, we look at user engagement patterns and see whether or not these engagements with artworks resulted in a successful title selection.
With the capability to annotate a given image (some of which are mentioned in an earlier post), an artwork asset in this case, we use a series of computer vision algorithms to gather objective image metadata, latent representation of the image, as well as some of the contextual metadata that a given image contains. This process allows our dataset to consist of both the image features and user data, all in an effort to understand which image components lead to successful user engagement. We also utilize machine learning algorithms, consumer insights¹, and correlational analysis for discovering high-level associations between image features and an artwork’s success. These statistically significant associations become our hypotheses for the next phase.
Once we have a specific hypothesis, we can test it by deploying causal machine learning algorithms. This framework reduces our experimental effort to uncover causal relationships, while taking into account confounding among the high-level variables (i.e. the variables that may influence both the treatment / intervention and outcome).
Here are two promotional artwork assets from Unbreakable Kimmy Schmidt. We know that the image on the left performed better than the image on the right. However, the difference between them is not only the presence of a face. There are many other variances, like the difference in background, text placement, font size, face size, etc. Causal Machine Learning makes it possible for us to understand an artwork’s performance based on the causal impact of its treatment.
To make sure our hypothesis is fit for the causal framework, it’s important we go over the identification assumptions.
Consistency: The treatment component is sufficiently well-defined.
We use machine learning algorithms to predict whether or not the artwork contains a face. That’s why the first assumption we make is that our face detection algorithm is mostly accurate (~92% average precision).
Positivity / Probabilistic Assignment: Every unit (an artwork) has some chance of getting treated.
We calculate the propensity score (the probability of receiving the treatment based on certain baseline characteristics) of having a face for samples with different covariates. If a certain subset of artwork (such as artwork from a certain genre) has close to a 0 or 1 propensity score for having a face, then we discard these samples from our analysis.
Individualistic Assignment / SUTVA (stable unit treatment value assumption): The potential outcomes of a unit do not depend on the treatments assigned to others.
Creatives make the decision to create artwork with or without faces based on considerations limited to the title of interest itself. This decision is not dependent on whether other assets have a face in them or not.
Conditional exchangeability (Unconfoundedness): There are no unmeasured confounders.
This assumption is by definition not testable. Given a dataset, we can’t know if there has been an unobserved confounder. However, we can test the sensitivity of our conclusions toward the violation of this assumption in various different ways.
The Models
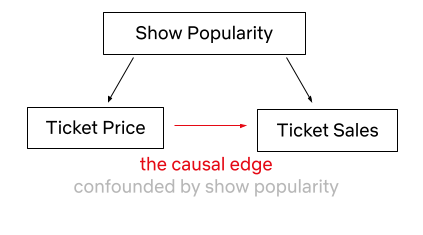
Now that we have established our hypothesis to be a causal inference problem, we can focus on the Causal Machine Learning Application. Predictive Machine Learning (ML) models are great at finding patterns and associations in order to predict outcomes, however they are not great at explaining cause-effect relationships, as their model structure does not reflect causality (the relationship between cause and effect). As an example, let’s say we looked at the price of Broadway theater tickets and the number of tickets sold. An ML algorithm may find a correlation between price increases and ticket sales. If we have used this algorithm for decision making, we could falsely conclude that increasing the ticket price leads to higher ticket sales if we do not consider the confounder of show popularity, which clearly impacts both ticket prices and sales. It is understandable that a Broadway musical ticket may be more expensive if the show is a hit, however simply increasing ticket prices to gain more customers is counter-intuitive.
Causal ML helps us estimate treatment effects from observational data, where it is challenging to conduct clean randomizations. Back-to-back publications on Causal ML, such as Double ML, Causal Forests, Causal Neural Networks, and many more, showcased a toolset for investigating treatment effects, via combining domain knowledge with ML in the learning system. Unlike predictive ML models, Causal ML explicitly controls for confounders, by modeling both treatment of interest as a function of confounders (i.e., propensity scores) as well as the impact of confounders on the outcome of interest. In doing so, Causal ML isolates out the causal impact of treatment on outcome. Moreover, the estimation steps of Causal ML are carefully set up to achieve better error bounds for the estimated treatment effects, another consideration often overlooked in predictive ML. Compared to more traditional Causal Inference methods anchored on linear models, Causal ML leverages the latest ML techniques to not only better control for confounders (when propensity or outcome models are hard to capture by linear models) but also more flexibly estimate treatment effects (when treatment effect heterogeneity is nonlinear). In short, by utilizing machine learning algorithms, Causal ML provides researchers with a framework for understanding causal relationships with flexible ML methods.
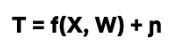
Y : outcome variable (take rate) T : binary treatment variable (presence of a face or not) W: a vector of covariates (features of the title and artwork) X ⊆ W: a vector of covariates (a subset of W) along which treatment effect heterogeneity is evaluated
Let’s dive more into the causal ML (Double ML to be specific) application steps for creative insights.
Build a propensity model to predict treatment probability (T) given the W covariates.
2. Build a potential outcome model to predict Y given the W covariates.
3. Residualization of
The treatment (observed T — predicted T via propensity model)
The outcome (observed Y — predicted Y via potential outcome model)
4. Fit a third model on the residuals to predict the average treatment effect (ATE) or conditional average treatment effect (CATE).
Where 𝜖 and η are stochastic errors and we assume that E[ 𝜖|T,W] = 0 , E[ η|W] = 0.
For the estimation of the nuisance functions (i.e., the propensity score model and the outcome model), we have implemented the propensity model as a classifier (as we have a binary treatment variable — the presence of face) and the potential outcome model as a regressor (as we have a continuous outcome variable — adjusted take rate). We have used grid search for tuning the XGBoosting classifier & regressor hyperparameters. We have also used k-fold cross-validation to avoid overfitting. Finally, we have used a causal forest on the residuals of treatment and the outcome variables to capture the ATE, as well as CATE on different genres and countries.
Mediation and Moderation
ATE will reveal the impact of the treatment — in this case, having a face in the artwork — across the board. The result will answer the question of whether it is worth applying this approach for all of our titles across our catalog, regardless of potential conditioning variables e.g. genre, country, etc. Another advantage of our multi-feature dataset is that we get to deep dive into the relationships between attributes. To do this, we can employ two methods: mediation and moderation.
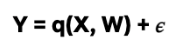
In their classic paper, Baron & Kenny define a moderator as “a qualitative (e.g., sex, race, class) or quantitative (e.g., level of reward) variable that affects the direction and/or strength of the relation between an independent or predictor variable and a dependent or criterion variable.”. We can investigate suspected moderators to uncover Conditional Average Treatment Effects (CATE). For example, we might suspect that the effect of the presence of a face in artwork varies across genres (e.g. certain genres, like nature documentaries, probably benefit less from the presence of a human face since titles in those genres tend to focus more on non-human subject matter). We can investigate these relationships by including an interaction term between the suspected moderator and the independent variable. If the interaction term is significant, we can conclude that the third variable is a moderator of the relationship between the independent and dependent variables.
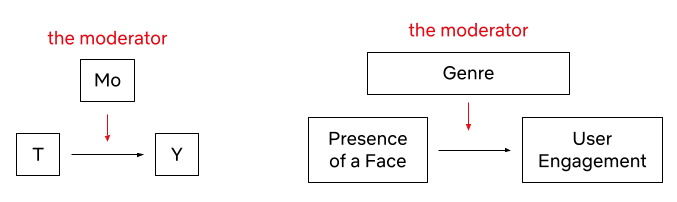
Mediation, on the other hand, occurs when a third variable explains the relationship between an independent and dependent variable. To quote Baron & Kenny once more, “whereas moderator variables specify when certain effects will hold, mediators speak to how or why such effects occur.”
For example, we observed that the presence of more than 3 people tends to negatively impact performance. It could be that higher numbers of faces make it harder for a user to focus on any one face in the asset. However, since face count and face size tend to be negatively correlated (since we fit more information in an image of fixed size, each individual piece of information tends to be smaller), one could also hypothesize that the negative correlation with face count is not driven so much from the number of people featured in the artwork, but rather the size of each individual person’s face, which may affect how visible each person is. To test this, we can run a mediation analysis to see if face size is mediating the effect of face count on the asset’s performance.
The steps of the mediation analysis are as follows: We have already detected a correlation between the independent variable (number of faces) and the outcome variable (user engagement) — in other words, we observed that a higher number of faces is associated with lower user engagement. But, we also observe that the number of faces is negatively correlated with average face size — faces tend to be smaller when more faces are fit into the same fixed-size canvas. To find out the degree to which face size mediates the effect of face count, we regress user engagement on both average face size and the number of faces. If 1) face size is a significant predictor of engagement, and 2) the significance of the predictive contribution of the number of people drops, we can conclude that face size mediates the effect of the number of people in artwork user engagement. If the coefficient for the number of people is no longer significant, it shows that face size fully mediates the effect of the number of faces on engagement.
In this dataset, we found that face size only partially mediates the effect of face count on asset effectiveness. This implies that both factors have an impact on asset effectiveness — fewer faces tend to be more effective even if we control for the effect of face size.
Sensitivity Analysis
As alluded to above, the conditional exchangeability assumption (unconfoundedness) is not testable by definition. It is thus crucial to evaluate how sensitive our findings and insights are to the violation of this assumption. Inspired by prior work, we conducted a suite of sensitivity analyses that stress-tested this assumption from multiple different angles. In addition, we leveraged ideas from academic research (most notably the E-value) and concluded that our estimates are robust even when the unconfoundedness assumption is violated. We are actively working on designing and implementing a standardized framework for sensitivity analysis and will share the various applications in an upcoming blog post — stay tuned for a more detailed discussion!
Finally, we also compared our estimated treatment effects with known effects for specific genres that were derived with other different methods, validating our estimates with consistency across different methods
Conclusion
Using the causal machine learning framework, we can potentially test and identify the various components of promotional artwork and gain invaluable creative insights. With this post, we just started to scratch the surface of this interesting challenge. In the upcoming posts in this series, we will share alternative machine learning and computer vision approaches that can provide insights from a causal perspective. These insights will guide and assist our team of talented strategists and creatives to select and generate the most attractive artwork, leveraging the attributes that these models selected, down to a specific genre. Ultimately this will give Netflix members a better and more personalized experience.
If these types of challenges interest you, please let us know! We are always looking for great people who are inspired by causal inference, machine learning, and computer vision to join our team.
Contributions
The authors contributed to the post as follows.
Billur Engin was the main driver of this blog post, she worked on the causal machine learning theory and its application in the artwork space. Yinghong Lan contributed equally to the causal machine learning theory. Grace Tang worked on the mediation analysis. Cristina Segalin engineered and extracted the visual features at scale from artworks used in the analysis. Grace Tang and Cristina Segalin initiated and conceptualized the problem space that is being used as the illustrative example in this post (studying factors affecting user engagement with a broad multivariate analysis of artwork features), curated the data, and performed initial statistical analysis and construction of predictive models supporting this work.
¹The Consumer Insights team at Netflix seeks to understand members and non-members through a wide range of quantitative and qualitative research methods.
iam:PassRole is an AWS Identity and Access Management (IAM) permission that allows an IAM principal to delegate orpass permissions to an AWS service by configuring a resource such as an Amazon Elastic Compute Cloud (Amazon EC2) instance or AWS Lambda function with an IAM role. The service then uses that role to interact with other AWS resources in your accounts. Typically, workloads, applications, or services run with different permissions than the developer who creates them, and iam:PassRole is the mechanism in AWS to specify which IAM roles can be passed to AWS services, and by whom.
In this blog post, we’ll dive deep into iam:PassRole, explain how it works and what’s required to use it, and cover some best practices for how to use it effectively.
A typical example of using iam:PassRole is a developer passing a role’s Amazon Resource Name (ARN) as a parameter in the Lambda CreateFunction API call. After the developer makes the call, the service verifies whether the developer is authorized to do so, as seen in Figure 1.
Figure 1: Developer passing a role to a Lambda function during creation
The following command shows the parameters the developer needs to pass during the CreateFunction API call. Notice that the role ARN is a parameter, but there is no passrole parameter.
The API call will create the Lambda function only if the developer has the iam:PassRole permission as well as the CreateFunction API permissions. If the developer is lacking either of these, the request will be denied.
Now that the permissions have been checked and the Function resource has been created, the Lambda service principal will assume the role you passed whenever your function is invoked and use the role to make requests to other AWS services in your account.
Understanding IAM PassRole
When we say that iam:PassRole is a permission, we mean specifically that it is not an API call; it is an IAM action that can be specified within an IAM policy. The iam:PassRole permission is checked whenever a resource is created with an IAM service role or is updated with a new IAM service role.
Here is an example IAM policy that allows a principal to pass a role named lambda_role.
The roles that can be passed are specified in the Resource element of the IAM policy. It is possible to list multiple IAM roles, and it is possible to use a wildcard (*) to match roles that begins with the pattern you specify. Use a wildcard as the last characters only when you’re matching a role pattern, to help prevent over-entitlement.
Note: We recommend that you avoid using resource ”*” with the iam:PassRole action in most cases, because this could grant someone the permission to pass any role, opening the possibility of unintended privilege escalation.
The iam:PassRole action can only grant permissions when used in an identity-based policy attached to an IAM role or user, and it is governed by all relevant AWS policy types, such as service control policies (SCPs) and VPC endpoint policies.
When a principal attempts to pass a role to an AWS service, there are three prerequisites that must be met to allow the service to use that role:
The principal that attempts to pass the role must have the iam:PassRole permission in an identity-based policy with the role desired to be passed in the Resource field, all IAM conditions met, and no implicit or explicit denies in other policies such as SCPs, VPC endpoint policies, session policies, or permissions boundaries.
The role that is being passed is configured via the trust policy to trust the service principal of the service you’re trying to pass it to. For example, the role that you pass to Amazon EC2 has to trust the Amazon EC2 service principal, ec2.amazonaws.com.
To learn more about role trust policies, see this blog post. In certain scenarios, the resource may end up being created or modified even if a passed IAM role doesn’t trust the required service principal, but the AWS service won’t be able to use the role to perform actions.
The role being passed and the principal passing the role must both be in the same AWS account.
Best practices for using iam:PassRole
In this section, you will learn strategies to use when working with iam:PassRole within your AWS account.
Place iam:PassRole in its own policy statements
As we demonstrated earlier, the iam:PassRole policy action takes an IAM role for a resource. If you specify a wildcard as a resource in a policy granting iam:PassRole permission, it means that the principals to whom this policy applies will be able to pass any role in that account, allowing them to potentially escalate their privilege beyond what you intended.
To be able to specify the Resource value and be more granular in comparison to other permissions you might be granting in the same policy, we recommend that you keep the iam:PassRole action in its own policy statement, as indicated by the following example.
Use IAM paths or naming conventions to organize IAM roles within your AWS accounts
You can use IAM paths or a naming convention to grant a principal access to pass IAM roles using wildcards (*) in a portion of the role ARN. This reduces the need to update IAM policies whenever new roles are created.
In your AWS account, you might have IAM roles that are used for different reasons, for example roles that are used for your applications, and roles that are used by your security team. In most circumstances, you would not want your developers to associate a security team’s role to the resources they are creating, but you still want to allow them to create and pass business application roles.
You may want to give developers the ability to create roles for their applications, as long as they are safely governed. You can do this by verifying that those roles have permissions boundaries attached to them, and that they are created in a specific IAM role path. You can then allow developers to pass only the roles in that path. To learn more about using permissions boundaries, see our Example Permissions Boundaries GitHub repo.
In the following example policy, access is granted to pass only the roles that are in the /application_role/ path.
You can also protect specific IAM paths by using an SCP.
In the following example, the SCP prevents your principals from passing a role unless they have a tag of “team” with a value of “security” when the role they are trying to pass is in the IAM path /security_app_roles/.
Similarly, you can craft a policy to only allow a specific naming convention or IAM path to pass a role in a specific path. For example, the following SCP shows how to prevent a role outside of the IAM path security_response_team from passing a role in the IAM path security_app_roles.
iam:PassRole does not support using the iam:ResourceTag or aws:ResourceTag condition keys to specify which roles can be passed. However, the IAM policy language supports using variables as part of the Resource element in an IAM policy.
The following IAM policy example uses the aws:PrincipalTag condition key as a variable in the Resource element. That allows this policy to construct the IAM path based on the values of the caller’s IAM tags or Session tags.
If there was no value set for the AllowedRolePath tag, the resource would not match any role ARN, and no iam:PassRole permissions would be granted.
Pass different IAM roles for different use cases, and for each AWS service
As a best practice, use a single IAM role for each use case, and avoid situations where the same role is used by multiple AWS services.
We recommend that you also use different IAM roles for different workloads in your AWS accounts, even if those workloads are built on the same AWS service. This will allow you to grant only the permissions necessary to your workloads and make it possible to adhere to the principle of least privilege.
iam:PassedToService allows you to specify what service a role may be passed to. iam:AssociatedResourceArn allows you to specify what resource ARNs a role may be associated with.
As mentioned previously, we typically recommend that customers use an IAM role with only one AWS service wherever possible. This is best accomplished by listing a single AWS service in a role’s trust policy, reducing the need to use the iam:PassedToService condition key in the calling principal’s identity-based policy. In circumstances where you have an IAM role that can be assumed by more than one AWS service, you can use iam:PassedToService to specify which service the role can be passed to. For example, the following policy allows ExampleRole to be passed only to the Amazon EC2 service.
When you use iam:AssociatedResourceArn, it’s important to understand that ARN formats typically do not change, but each AWS resource will have a unique ARN. Some AWS resources have non-predictable components, such as EC2 instance IDs in their ARN. This means that when you’re using iam:AssociatedResourceArn, if an AWS resource is ever deleted and a new resource created, you might need to modify the IAM policy with a new resource ARN to allow a role to be associated with it.
Most organizations prefer to limit who can delete and modify resources in their AWS accounts, rather than limit what resource a role can be associated with. An example of this would be limiting which principals can modify a Lambda function, rather than limiting which function a role can be associated with, because in order to pass a role to Lambda, the principals would need permissions to update the function itself.
Using iam:PassRole with service-linked roles
If you’re dealing with a service that uses service-linked roles (SLRs), most of the time you don’t need the iam:PassRole permission. This is because in most cases such services will create and manage the SLR on your behalf, so that you don’t pass a role as part of a service configuration, and therefore, the iam:PassRole permission check is not performed.
Some AWS services allow you to create multiple SLRs and pass them when you create or modify resources by using those services. In this case, you need the iam:PassRole permission on service-linked roles, just the same as you do with a service role.
For example, Amazon EC2 Auto Scaling allows you to create multiple SLRs with specific suffixes and then pass a role ARN in the request as part of the ec2:CreateAutoScalingGroup API action. For the Auto Scaling group to be successfully created, you need permissions to perform both the ec2:CreateAutoScalingGroup and iam:PassRole actions.
SLRs are created in the /aws-service-role/ path. To help confirm that principals in your AWS account are only passing service-linked roles that they are allowed to pass, we recommend using suffixes and IAM policies to separate SLRs owned by different teams.
For example, the following policy allows only SLRs with the _BlueTeamSuffix to be passed.
You could attach this policy to the role used by the blue team to allow them to pass SLRs they’ve created for their use case and that have their specific suffix.
AWS CloudTrail logging
Because iam:PassRole is not an API call, there is no entry in AWS CloudTrail for it. To identify what role was passed to an AWS service, you must check the CloudTrail trail for events that created or modified the relevant AWS service’s resource.
In Figure 2, you can see the CloudTrail log created after a developer used the Lambda CreateFunction API call with the role ARN noted in the role field.
Figure 2: CloudTrail log of a CreateFunction API call
PassRole and VPC endpoints
Earlier, we mentioned that iam:PassRole is subject to VPC endpoint policies. If a request that requires the iam:PassRole permission is made over a VPC endpoint with a custom VPC endpoint policy configured, iam:PassRole should be allowed through the Action element of that VPC endpoint policy, or the request will be denied.
Conclusion
In this post, you learned about iam:PassRole, how you use it to interact with AWS services and resources, and the three prerequisites to successfully pass a role to a service. You now also know best practices for using iam:PassRole in your AWS accounts. To learn more, see the documentation on granting a user permissions to pass a role to an AWS service.
The Squid Nebula is shown in blue, indicating doubly ionized oxygen—which is when you ionize your oxygen once and then ionize it again just to make sure. (In all seriousness, it likely indicates a low-mass star nearing the end of its life).
As usual, you can also use this squid post to talk about the security stories in the news that I haven’t covered.
Starting in mid-2024, Amazon Web Services (AWS) will introduce a series of UI improvements to the AWS sign-in pages. Our primary focus is to revamp the UI, especially the root and AWS Identity and Access Management (IAM) user sign-in page and switch role page. With these design updates, we aim to facilitate smoother transitions and provide clearer access to essential sign-in features. In this blog post, we provide an overview of the upcoming changes.
Redesigned root and IAM user sign-in page
When you visit the updated sign-in page for the root and IAM users, you’ll experience a refreshed interface. We’ve provided clearer form labels, more detailed descriptions, and improved tooltip guidance to distinguish between user types. To address customer feedback, we’ve enhanced compatibility with password managers, offering a smoother auto-fill, and refined the layout for more intuitive navigation.
Note: Although you don’t need to take specific actions to benefit from these updates, if your setup depends on the current UI for automated tasks, you might notice some changes. For the most reliable and stable experience, use the AWS supported options to grant programmatic access to your users. For more information, review the programmatic access options in the documentation.
Figure 1: Root and IAM user sign-in page
Additionally, to enhance the resilience of IAM user sign-ins, we will introduce improvements that allow the use of Regional endpoints for direct AWS Management Console sign-in within specific AWS Regions. This enhancement will be available ahead of the scheduled UI refresh. For example, the Regional endpoint for the console in the US West (Oregon) Region looks like this: https://us-west-2.console.aws.amazon.com. For a full list of the console Regional endpoints, see AWS Management Console endpoints and quotas.
To provide console access to people, we recommend that you use AWS IAM Identity Center. For more information, see the IAM Identity Center User Guide. However, when you enable programmatic access, you should create IAM users only if necessary for access keys or service-specific credentials. We recommend that you grant programmatic access through IAM roles or IAM Roles Anywhere.
Figure 2: IAM sign-in page
Refreshed switch role page
To further improve the user experience, we are updating the switch role page to match the look and feel of other AWS pages, providing a consistent navigation experience.
Figure 3: Switch role page
Conclusion
We’re excited to introduce these improvements to the AWS sign-in experience, set to launch in mid-2024. We encourage users who rely on the current UI for automated tasks to familiarize themselves with the changes. By making sure that your systems and process are aligned with the new interface, you can help maintain a smooth transition.
If you have questions or feedback, start a new thread in IAM re:Post or reach out to AWS Support.
Want more AWS Security news? Follow us on Twitter.
Николай Сиджимов е зам.-министър на околната среда и водите в правителството на Николай Денков от квотата на “Зелено движение” и “Демократична България”. Той коментира пред “Биволъ” многобройните проблеми в Министерството…
„Вчера беше потвърдено, и оня ден това нещо за вътрешния министър (Калин Стоянов – б.р.), който е ключов министър. Но (депутатът от ДПС – б.р.) Пеевски си го е запазил…
Overstressed maintainers are a constant topic of conversation throughout
the open-source community. Kernel maintainers have been complaining more
loudly than usual recently about overwork and stress. The problems that
maintainers are facing are clear; what to do about them is rather less so.
A session at the 2023 Maintainers Summit took up the topic yet again with
the hope of finding some solutions; there may be answers, perhaps even
within the kernel community, but a general solution still seems distant.
To provide the best experiences, we use technologies like cookies to store and/or access device information. Consenting to these technologies will allow us to process data such as browsing behavior or unique IDs on this site. Not consenting or withdrawing consent, may adversely affect certain features and functions.
Functional
Always active
The technical storage or access is strictly necessary for the legitimate purpose of enabling the use of a specific service explicitly requested by the subscriber or user, or for the sole purpose of carrying out the transmission of a communication over an electronic communications network.
Preferences
The technical storage or access is necessary for the legitimate purpose of storing preferences that are not requested by the subscriber or user.
Statistics
The technical storage or access that is used exclusively for statistical purposes.The technical storage or access that is used exclusively for anonymous statistical purposes. Without a subpoena, voluntary compliance on the part of your Internet Service Provider, or additional records from a third party, information stored or retrieved for this purpose alone cannot usually be used to identify you.
Marketing
The technical storage or access is required to create user profiles to send advertising, or to track the user on a website or across several websites for similar marketing purposes.