Since the very initial announcement of Cloudflare Workers, we’ve provided a playground. The motivation behind that being a belief that users should have a convenient, low-commitment way to play around with and learn more about Workers.
Over the last few years, while Cloudflare Workers and our Developer Platform have changed and grown, the original playground has not. Today, we’re proud to announce a revamp of the playground that demonstrates the power of Workers, along with new development tooling, and the ability to share your playground code and deploy instantly to Cloudflare’s global network.
A focus on origin Workers
When Workers was first introduced, many of the examples and use-cases centered around middleware, where a Worker intercepts a request to an origin and does something before returning a response. This includes things like: modifying headers, redirecting traffic, helping with A/B testing, or caching. Ultimately the Worker isn’t acting as an origin in these cases, it sits between the user and the destination.
While Workers are still great for these types of tasks, for the updated playground, we decided to focus on the Worker-as-origin use-case. This is where the Worker receives a request and is responsible for returning the full response. In this case, the Worker is the destination, not middle-ware. This is a great way for you to develop more complex use-cases like user interfaces or APIs.
A new editor experience
During Developer Week in May, we announced a new, authenticated dashboard editor experience powered by VSCode. Now, this same experience is available to users in the playground.
Users now have a more robust IDE experience that supports: multi-module Workers, type-checking via JSDoc comments and the `workers-types` package, pretty error pages, and real previews that update as you edit code. The new editor only supports Module syntax, which is the preferred way for users to develop new Workers.
When the playground first loads, it looks like this:
The content you see on the right is coming from the code on the left. You can modify this just as you would in a code editor. Once you make an edit, it will be updated shortly on the right as demonstrated below:
You’re not limited to the starter demo. Feel free to edit and remove those files to create APIs, user interfaces, or any other application that you come up with.
Updated developer tooling
Along with the updated editor, the new playground also contains numerous developer tools to help give you visibility into the Worker.
Playground users have access to the same Chrome DevTools technology that we use in the Wrangler CLI and the Dashboard. Within this view, you can: view logs, view network requests, and profile your Worker among other things.
At the top of the playground, you’ll also see an “HTTP” tab which you can use to test your Worker against various HTTP methods.
Share what you create
With all these improvements, we haven’t forgotten the core use of a playground—to share Workers with other people! Whatever your use-case; whether you’re building a demo to showcase the power of Workers or sending someone an example of how to fix a specific issue, all you need to do is click “Copy Link” in the top right of the Playground then paste the URL in any URL bar.
The unique URL will be shareable and deployable as long as you have it. This means that you could create quick demos by creating various Workers in the Playground, and bookmark them to share later. They won’t expire.
Deploying to the Supercloud
We also wanted to make it easier to go from writing a Worker in the Playground to deploying that Worker to Cloudflare’s global network. We’ve included a “Deploy” button that will help you quickly deploy the Worker you’ve just created.
If you don’t already have a Cloudflare account, you will also be guided through the onboarding process.
Hyperdrive makes accessing your existing databases from Cloudflare Workers, wherever they are running, hyper fast. You connect Hyperdrive to your database, change one line of code to connect through Hyperdrive, and voilà: connections and queries get faster (and spoiler: you can use it today).
In a nutshell, Hyperdrive uses our global network to speed up queries to your existing databases, whether they’re in a legacy cloud provider or with your favorite serverless database provider; dramatically reduces the latency incurred from repeatedly setting up new database connections; and caches the most popular read queries against your database, often avoiding the need to go back to your database at all.
Without Hyperdrive, that core database — the one with your user profiles, product inventory, or running your critical web app — sitting in the us-east1 region of a legacy cloud provider is going to be really slow to access for users in Paris, Singapore and Dubai and slower than it should be for users in Los Angeles or Vancouver. With each round trip taking up to 200ms, it’s easy to burn up to a second (or more!) on the multiple round-trips needed just to set up a connection, before you’ve even made the query for your data. Hyperdrive is designed to fix this.
To demonstrate Hyperdrive’s performance, we built a demo application that makes back-to-back queries against the same database: both with Hyperdrive and without Hyperdrive (directly). The app selects a database in a neighboring continent: if you’re in Europe, it selects a database in the US — an all-too-common experience for many European Internet users — and if you’re in Africa, it selects a database in Europe (and so on). It returns raw results from a straightforward SELECT query, with no carefully selected averages or cherry-picked metrics.
We built a demo app that makes real queries to a PostgreSQL database, with and without Hyperdrive
Throughout internal testing, initial user reports and the multiple runs in our benchmark, Hyperdrive delivers a 17 – 25x performance improvement vs. going direct to the database for cached queries, and a 6 – 8x improvement for uncached queries and writes. The cached latency might not surprise you, but we think that being 6 – 8x faster on uncached queries changes “I can’t query a centralized database from Cloudflare Workers” to “where has this been all my life?!”. We’re also continuing to work on performance improvements: we’ve already identified additional latency savings, and we’ll be pushing those out in the coming weeks.
We’ve been working on Hyperdrive in secret for a short while: but allowing developers to connect to databases they already have — with their existing data, queries and tooling — has been something on our minds for quite some time.
In a modern distributed cloud environment like Workers, where compute is globally distributed (so it’s close to users) and functions are short-lived (so you’re billed no more than is needed), connecting to traditional databases has been both slow and unscalable. Slow because it takes upwards of seven round-trips (TCP handshake; TLS negotiation; then auth) to establish the connection, and unscalable because databases like PostgreSQL have a high resource cost per connection. Even just a couple of hundred connections to a database can consume non-negligible memory, separate from any memory needed for queries.
Our friends over at Neon (a popular serverless Postgres provider) wrote about this, and even released a WebSocket proxy and driver to reduce the connection overhead, but are still fighting uphill in the snow: even with a custom driver, we’re down to 4 round-trips, each still potentially taking 50-200 milliseconds or more. When those connections are long-lived, that’s OK — it might happen once every few hours at best. But when they’re scoped to an individual function invocation, and are only useful for a few milliseconds to minutes at best — your code spends more time waiting. It’s effectively another kind of cold start: having to initiate a fresh connection to your database before making a query means that using a traditional database in a distributed or serverless environment is (to put it lightly) really slow.
To combat this, Hyperdrive does two things.
First, it maintains a set of regional database connection pools across Cloudflare’s network, so a Cloudflare Worker avoids making a fresh connection to a database on every request. Instead, the Worker can establish a connection to Hyperdrive (fast!), with Hyperdrive maintaining a pool of ready-to-go connections back to the database. Since a database can be anywhere from 30ms to (often) 300ms away over a single round-trip (let alone the seven or more you need for a new connection), having a pool of available connections dramatically reduces the latency issue that short-lived connections would otherwise suffer.
Second, it understands the difference between read (non-mutating) and write (mutating) queries and transactions, and can automatically cache your most popular read queries: which represent over 80% of most queries made to databases in typical web applications. That product listing page that tens of thousands of users visit every hour; open jobs on a major careers site; or even queries for config data that changes occasionally; a tremendous amount of what is queried does not change often, and caching it closer to where the user is querying it from can dramatically speed up access to that data for the next ten thousand users. Write queries, which can’t be safely cached, still get to benefit from both Hyperdrive’s connection pooling and Cloudflare’s global network: being able to take the fastest routes across the Internet across our backbone cuts down latency there, too.
Even if your database is on the other side of the country, 70ms x 6 round-trips is a lot of time for a user to be waiting for a query response.
Hyperdrive works not only with PostgreSQL databases — including Neon, Google Cloud SQL, AWS RDS, and Timescale, but also PostgreSQL-compatible databases like Materialize (a powerful stream-processing database), CockroachDB (a major distributed database), Google Cloud’s AlloyDB, and AWS Aurora Postgres.
We’re also working on bringing support for MySQL, including providers like PlanetScale, by the end of the year, with more database engines planned in the future.
The magic connection string
One of the major design goals for Hyperdrive was the need for developers to keep using their existing drivers, query builder and ORM (Object-Relational Mapper) libraries. It wouldn’t have mattered how fast Hyperdrive was if we required you to migrate away from your favorite ORM and/or rewrite hundreds (or more) lines of code & tests to benefit from Hyperdrive’s performance.
The magic behind Hyperdrive is that you can start using it in your existing Workers applications, with your existing queries, just by swapping out your connection string for the one Hyperdrive generates instead.
Creating a Hyperdrive
With an existing database ready to go — in this example, we’ll use a Postgres database from Neon — it takes less than a minute to get Hyperdrive running (yes, we timed it).
If you don’t have an existing Cloudflare Workers project, you can quickly create one:
$ npm create cloudflare@latest
# Call the application "hyperdrive-demo"
# Choose "Hello World Worker" as your template
From here, we just need the database connection string for our database and a quick wrangler command-line invocation to have Hyperdrive connect to it.
# Using wrangler v3.8.0 or above
wrangler hyperdrive databases create a-faster-database --connection-string="postgres://user:[email protected]/neondb"

# This will return an ID: we'll use this in the next step
[[hyperdrive]]
name = "HYPERDRIVE"
database_id = "cdb28782-0dfc-4aca-a445-a2c318fb26fd"
We can now write a Worker — or take an existing Worker script — and use Hyperdrive to speed up connections and queries to our existing database. We use node-postgres here, but we could just as easily use Drizzle ORM.
import { Client } from 'pg';

export interface Env {
	HYPERDRIVE: Hyperdrive;
}

export default {
	async fetch(request: Request, env: Env, ctx: ExecutionContext) {
		console.log(JSON.stringify(env));
		// Create a database client that connects to our database via Hyperdrive
		//
		// Hyperdrive generates a unique connection string you can pass to
		// supported drivers, including node-postgres, Postgres.js, and the many
		// ORMs and query builders that use these drivers.
		const client = new Client({ connectionString: env.HYPERDRIVE.connectionString });

		try {
			// Connect to our database
			await client.connect();

			// A very simple test query
			let result = await client.query({ text: 'SELECT * FROM pg_tables' });

			// Return our result rows as JSON
			return Response.json({ result: result });
		} catch (e) {
			console.log(e);
			return Response.json({ error: JSON.stringify(e) }, { status: 500 });
		}
	},
};
The code above is intentionally simple, but hopefully you can see the magic: our database driver gets a connection string from Hyperdrive, and is none-the-wiser. It doesn’t need to know anything about Hyperdrive, we don’t have to toss out our favorite query builder library, and we can immediately realize the speed benefits when making queries.
Connections are automatically pooled and kept warm, our most popular queries are cached, and our entire application gets faster.
We think Hyperdrive is critical to accessing your existing databases when building on Cloudflare Workers: traditional databases were just never designed for a world where clients are globally distributed.
Hyperdrive’s connection pooling will always be free, for both database protocols we support today and new database protocols we add in the future. Just like DDoS protection and our global CDN, we think access to Hyperdrive’s core feature is too useful to hold back.
During the open beta, Hyperdrive itself will not incur any charges for usage, regardless of how you use it. We’ll be announcing more details on how Hyperdrive will be priced closer to GA (early in 2024), with plenty of notice.
Time to query
So where to from here for Hyperdrive?
We’re planning on bringing Hyperdrive to GA in early 2024 — and we’re focused on landing more controls over how we cache & automatically invalidate based on writes, detailed query and performance analytics (soon!), support for more database engines (including MySQL) as well as continuing to work on making it even faster.
We’re also working to enable private network connectivity via Magic WAN and Cloudflare Tunnel, so that you can connect to databases that aren’t (or can’t be) exposed to the public Internet.
To connect Hyperdrive to your existing database, visit our developer docs — it takes less than a minute to create a Hyperdrive and update existing code to use it. Join the #hyperdrive-beta channel in our Developer Discord to ask questions, surface bugs, and talk to our Product & Engineering teams directly.
Last year, we announced the Browser Rendering API – letting users running Puppeteer, a browser automation library, directly in Workers. Puppeteer is one of the most popular libraries used to interact with a headless browser instance to accomplish tasks like taking screenshots, generating PDFs, crawling web pages, and testing web applications. We’ve heard from developers that configuring and maintaining their own serverless browser automation systems can be quite painful.
The Workers Browser Rendering API solves this. It makes the Puppeteer library available directly in your Worker, connected to a real web browser, without the need to configure and manage infrastructure or keep browser sessions warm yourself. You can use @cloudflare/puppeteer to run the full Puppeteer API directly on Workers!
We’ve seen so much interest from the developer community since launching last year. While the Browser Rendering API is still in beta (sign up to our waitlist to get access), we wanted to share a way to get more out of our current limits by using the Browser Rendering API with Durable Objects. We’ll also be sharing pricing for the Rendering API, so you can build knowing exactly what you’ll pay for.
Building a responsive web design testing tool with the Browser Rendering API
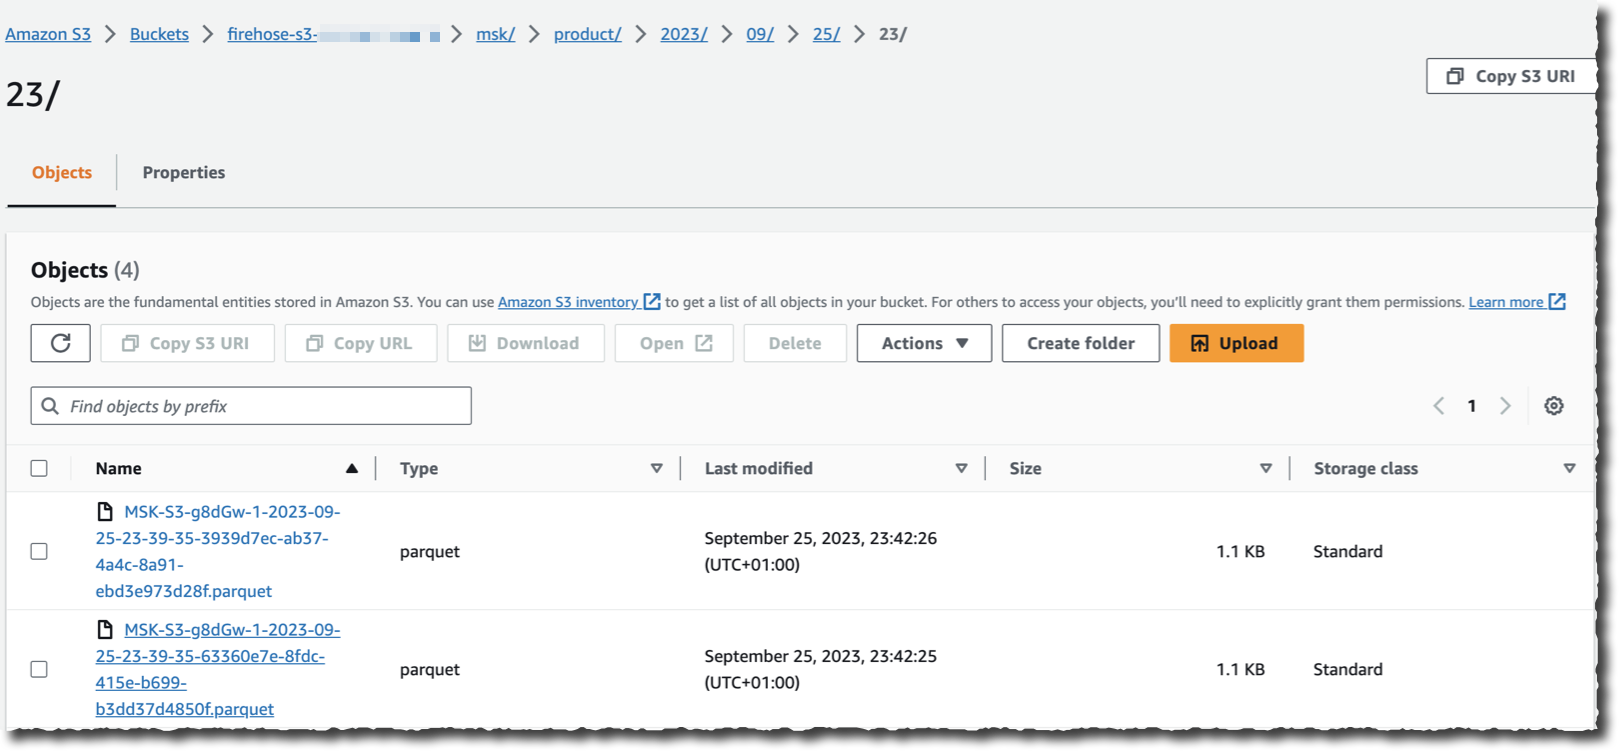
As a designer or frontend developer, you want to make sure that content is well-designed for visitors browsing on different screen sizes. With the number of possible devices that users are browsing on are growing, it becomes difficult to test all the possibilities manually. While there are many testing tools on the market, we want to show how easy it is to create your own Chromium based tool with the Workers Browser Rendering API and Durable Objects.
We’ll be using the Worker to handle any incoming requests, pass them to the Durable Object to take screenshots and store them in an R2 bucket. The Durable Object is used to create a browser session that’s persistent. By using Durable Object Alarms we can keep browsers open for longer and reuse browser sessions across requests.
Let’s dive into how we can build this application:
Create a Worker with a Durable Object, Browser Rendering API binding and R2 bucket. This is the resulting wrangler.toml:
name = "rendering-api-demo"
main = "src/index.js"
compatibility_date = "2023-09-04"
compatibility_flags = [ "nodejs_compat"]
account_id = "c05e6a39aa4ccdd53ad17032f8a4dc10"


# Browser Rendering API binding
browser = { binding = "MYBROWSER" }

# Bind an R2 Bucket
[[r2_buckets]]
binding = "BUCKET"
bucket_name = "screenshots"

# Binding to a Durable Object
[[durable_objects.bindings]]
name = "BROWSER"
class_name = "Browser"

[[migrations]]
tag = "v1" # Should be unique for each entry
new_classes = ["Browser"] # Array of new classes
2. Define the Worker
This Worker simply passes the request onto the Durable Object.
export default {
	async fetch(request, env) {

		let id = env.BROWSER.idFromName("browser");
		let obj = env.BROWSER.get(id);

		// Send a request to the Durable Object, then await its response.
		let resp = await obj.fetch(request.url);
		let count = await resp.text();

		return new Response("success");
	}
};
3. Define the Durable Object class
const KEEP_BROWSER_ALIVE_IN_SECONDS = 60;

export class Browser {
	constructor(state, env) {
		this.state = state;
		this.env = env;
		this.keptAliveInSeconds = 0;
		this.storage = this.state.storage;
	}

	async fetch(request) {
		// screen resolutions to test out
		const width = [1920, 1366, 1536, 360, 414]
		const height = [1080, 768, 864, 640, 896]

		// use the current date and time to create a folder structure for R2
		const nowDate = new Date()
		var coeff = 1000 * 60 * 5
		var roundedDate = (new Date(Math.round(nowDate.getTime() / coeff) * coeff)).toString();
		var folder = roundedDate.split(" GMT")[0]

		//if there's a browser session open, re-use it
		if (!this.browser) {
			console.log(`Browser DO: Starting new instance`);
			try {
			  this.browser = await puppeteer.launch(this.env.MYBROWSER);
			} catch (e) {
			  console.log(`Browser DO: Could not start browser instance. Error: ${e}`);
			}
		  }

		// Reset keptAlive after each call to the DO
		this.keptAliveInSeconds = 0;

		const page = await this.browser.newPage();

		// take screenshots of each screen size
		for (let i = 0; i < width.length; i++) {
			await page.setViewport({ width: width[i], height: height[i] });
			await page.goto("https://workers.cloudflare.com/");
			const fileName = "screenshot_" + width[i] + "x" + height[i]
			const sc = await page.screenshot({
				path: fileName + ".jpg"
			}
			);

			this.env.BUCKET.put(folder + "/"+ fileName + ".jpg", sc);
		  }

		// Reset keptAlive after performing tasks to the DO.
		this.keptAliveInSeconds = 0;

		// set the first alarm to keep DO alive
		let currentAlarm = await this.storage.getAlarm();
		if (currentAlarm == null) {
		console.log(`Browser DO: setting alarm`);
		const TEN_SECONDS = 10 * 1000;
		this.storage.setAlarm(Date.now() + TEN_SECONDS);
		}

		await this.browser.close();
		return new Response("success");
	}

	async alarm() {
		this.keptAliveInSeconds += 10;

		// Extend browser DO life
		if (this.keptAliveInSeconds < KEEP_BROWSER_ALIVE_IN_SECONDS) {
		  console.log(`Browser DO: has been kept alive for ${this.keptAliveInSeconds} seconds. Extending lifespan.`);
		  this.storage.setAlarm(Date.now() + 10 * 1000);
		} else console.log(`Browser DO: cxceeded life of ${KEEP_BROWSER_ALIVE_IN_SECONDS}. Browser DO will be shut down in 10 seconds.`);
	  }

  }
That’s it! With less than a hundred lines of code, you can fully customize a powerful tool to automate responsive web design testing. You can even incorporate it into your CI pipeline to automatically test different window sizes with each build and verify the result is as expected by using an automated library like pixelmatch.
How much will this cost?
We’ve spoken to many customers deploying a Puppeteer service on their own infrastructure, on public cloud containers or functions or using managed services. The common theme that we’ve heard is that these services are costly – costly to maintain and expensive to run.
While you won’t be billed for the Browser Rendering API yet, we want to be transparent with you about costs you start building. We know it’s important to understand the pricing structure so that you don’t get a surprise bill and so that you can design your application efficiently.
You pay based on two usage metrics:
Number of sessions: A Browser Session is a new instance of a browser being launched
Number of concurrent sessions: Concurrent Sessions is the number of browser instances open at once
Using Durable Objects to persist browser sessions improves performance by eliminating the time that it takes to spin up a new browser session. Since it re-uses sessions, it cuts down on the number of concurrent sessions needed. We highly encourage this model of session re-use if you expect to see consistent traffic for applications that you build on the Browser Rendering API.
If you have feedback about this pricing, we’re all ears. Feel free to reach out through Discord (channel name: browser-rendering-api-beta) and share your thoughts.
Get Started
Sign up to our waitlist to get access to the Workers Browser Rendering API. We’re so excited to see what you build! Share your creations with us on Twitter/X @CloudflareDev or on our Discord community.
Today, we’re sharing that we’ve reached a new milestone in the path to making this API available across runtimes — engineers from Cloudflare and Vercel have published a draft specification of the connect() sockets API for review by the community, along with a Node.js compatible implementation of the connect() API that developers can start using today.
This implementation helps both application developers and maintainers of libraries and frameworks:
Maintainers of existing libraries that use the node:net and node:tls APIs can use it to more easily add support for runtimes where node:net and node:tls are not available.
JavaScript frameworks can use it to make connect() available in local development, making it easier for application developers to target runtimes that provide connect().
Why create a new standard? Why connect()?
As we described when we first announced connect(), to-date there has not been a standard API across JavaScript runtimes for creating and working with TCP or UDP sockets. This makes it harder for maintainers of open-source libraries to ensure compatibility across runtimes, and ultimately creates friction for application developers who have to navigate which libraries work on which platforms.
While Node.js provides the node:net and node:tls APIs, these APIs were designed over 10 years ago in the very early days of the Node.js project and remain callback-based. As a result, they can be hard to work with, and expose configuration in ways that don’t fit serverless platforms or web browsers.
The connect() API fills this gap by incorporating the best parts of existing socket APIs and prior proposed standards, based on feedback from the JavaScript community — including contributors to Node.js. Libraries like pg (node-postgres on Github) are already using the connect() API.
The proposed API is Promise-based and reuses existing standards whenever possible. For example, ReadableStream and WritableStream are used for the read and write ends of the socket. This makes it easy to pipe data from a TCP socket to any other library or existing code that accepts a ReadableStream as input, or to write to a TCP socket via a WritableStream.
The entrypoint of the API is the connect() function, which takes a string containing both the hostname and port separated by a colon, or an object with discrete hostname and port fields. It returns a Socket object which represents a socket connection. An instance of this object exposes attributes and methods for working with the connection.
A connection can be established in plain-text or TLS mode, as well as a special “starttls” mode which allows the socket to be easily upgraded to TLS after some period of plain-text data transfer, by calling the startTls() method on the Socket object. No need to create a new socket or switch to using a separate set of APIs once the socket is upgraded to use TLS.
For example, to upgrade a socket using the startTLS pattern, you might do something like this:
import { connect } from "@arrowood.dev/socket"

const options = { secureTransport: "starttls" };
const socket = connect("address:port", options);
const secureSocket = socket.startTls();
// The socket is immediately writable
// Relies on web standard WritableStream
const writer = secureSocket.writable.getWriter();
const encoder = new TextEncoder();
const encoded = encoder.encode("hello");
await writer.write(encoded);
Equivalent code using the node:net and node:tls APIs:
import net from 'node:net'
import tls from 'node:tls'

const socket = new net.Socket(HOST, PORT);
socket.once('connect', () => {
  const options = { socket };
  const secureSocket = tls.connect(options, () => {
    // The socket can only be written to once the
    // connection is established.
    // Polymorphic API, uses Node.js streams
    secureSocket.write('hello');
  }
})
Use the Node.js implementation of connect() in your library
To make it easier for open-source library maintainers to adopt the connect() API, we’ve published an implementation of connect() in Node.js that allows you to publish your library such that it works across JavaScript runtimes, without having to maintain any runtime-specific code.
To get started, install it as a dependency:
npm install --save @arrowood.dev/socket
And import it in your library or application:
import { connect } from "@arrowood.dev/socket"
What’s next for connect()?
The wintercg/proposal-sockets-api is published as a draft, and the next step is to solicit and incorporate feedback. We’d love your feedback, particularly if you maintain an open-source library or make direct use of the node:net or node:tls APIs.
Once feedback has been incorporated, engineers from Cloudflare, Vercel and beyond will be continuing to work towards contributing an implementation of the API directly to Node.js as a built-in API.
Building modern full-stack applications requires connecting to many hosted third party services, from observability platforms to databases and more. All too often, this means spending time doing busywork, managing credentials and writing glue code just to get started. This is why we’re building out the Cloudflare Integrations Marketplace to allow developers to easily discover, configure and deploy products to use with Workers.
Earlier this year, we introduced integrations with Supabase, PlanetScale, Neon and Upstash. Today, we are thrilled to introduce our newest additions to Cloudflare’s Integrations Marketplace – Sentry, Turso and Momento.
Let's take a closer look at some of the exciting integration providers that are now part of the Workers Integration Marketplace.
Improve performance and reliability by connecting Workers to Sentry
When your Worker encounters an error you want to know what happened and exactly what line of code triggered it. Sentry is an application monitoring platform that helps developers identify and resolve issues in real-time.
The Workers and Sentry integration automatically sends errors, exceptions and console.log() messages from your Worker to Sentry with no code changes required. Here’s how it works:
You enable the integration from the Cloudflare Dashboard.
The credentials from the Sentry project of your choice are automatically added to your Worker.
You can configure sampling to control the volume of events you want sent to Sentry. This includes selecting the sample rate for different status codes and exceptions.
Cloudflare deploys a Tail Worker behind the scenes that contains all the logic needed to capture and send data to Sentry.
Like magic, errors, exceptions, and log messages are automatically sent to your Sentry project.
In the future, we’ll be improving this integration by adding support for uploading source maps and stack traces so that you can pinpoint exactly which line of your code caused the issue. We’ll also be tying in Workers deployments with Sentry releases to correlate new versions of your Worker with events in Sentry that help pinpoint problematic deployments. Check out our developer documentation for more information.
Develop at the Data Edge with Turso + Workers
Turso is an edge-hosted, distributed database based on libSQL, an open-source fork of SQLite. Turso focuses on providing a global service that minimizes query latency (and thus, application latency!). It’s perfect for use with Cloudflare Workers – both compute and data are served close to users.
Turso follows the model of having one primary database with replicas that are located globally, close to users. Turso automatically routes requests to a replica closest to where the Worker was invoked. This model works very efficiently for read heavy applications since read requests can be served globally. If you’re running an application that has heavy write workloads, or want to cut down on replication costs, you can run Turso with just the primary instance and use Smart Placement to speed up queries.
The Turso and Workers integration automatically pulls in Turso API credentials and adds them as secrets to your Worker, so that you can start using Turso by simply establishing a connection using the libsql SDK. Get started with the Turso and Workers Integration today by heading to our developer documentation.
Cache responses from data stores with Momento
Momento Cache is a low latency serverless caching solution that can be used on top of relational databases, key-value databases or object stores to get faster load times and better performance. Momento abstracts details like scaling, warming and replication so that users can deploy cache in a matter of minutes.
The Momento and Workers integration automatically pulls in your Momento API key using an OAuth2 flow. The Momento API key is added as a secret in Workers and, from there, you can start using the Momento SDK in Workers. Head to our developer documentation to learn more and use the Momento and Workers integration!
Try integrations out today
We want to give you back time, so that you can focus less on configuring and connecting third party tools to Workers and spend more time building. We’re excited to see what you build with integrations. Share your projects with us on Twitter (@CloudflareDev) and stay tuned for more exciting updates as we continue to grow our Integrations Marketplace!
If you would like to build an integration with Cloudflare Workers, fill out the integration request form and we’ll be in touch.
Between third-party cookies that track your activity across websites, to highly targeted advertising based on your IP address and browsing data, it's no secret that today’s Internet browsing experience isn’t as private as it should be. Here at Cloudflare, we believe everyone should be able to browse the Internet free of persistent tracking and prying eyes.
That’s why we’re excited to announce that we’ve partnered with Microsoft Edge to provide a fast and secure VPN, right in the browser. Users don’t have to install anything new or understand complex concepts to get the latest in network-level privacy: Edge Secure Network VPN is available on the latest consumer version of Microsoft Edge in most markets, and automatically comes with 5 GB of data. Just enable the feature by going to [Microsoft Edge Settings & more (…) > Browser essentials, and click Get VPN for free]. See Microsoft’s Edge Secure Network page for more details.
Cloudflare’s Privacy Proxy platform isn’t your typical VPN
To take a step back: a VPN is a way in which the Internet traffic leaving your device is tunneled through an intermediary server operated by a provider – in this case, Cloudflare! There are many important pieces that make this possible, but among them is the VPNprotocol, which defines the way in which the tunnel is established and how traffic flows through it. You may have heard of some of these protocols: Wireguard, IPsec, and OpenVPN, for example. And while we’re no stranger to these, (Cloudflare’s WireGuard implementation is currently in use by millions of devices that use 1.1.1.1+WARP) – we see our Privacy Proxy Platform as a way to push forward the next frontier of Internet privacy and embrace one of Cloudflare’s core values: open Internet standards.
The Privacy Proxy Platform implements HTTP CONNECT, a method defined in the HTTP standard that proxies traffic by establishing a tunnel and then sending reliable and ordered byte streams through that tunnel. You can read more about this proxying method (and its history!) in our Primer on Proxies.
We also leverage other parts of Cloudflare’s privacy-oriented infrastructure that are already deployed at scale: requests first utilize 1.1.1.1 for DNS, a token proxy based on Privacy Pass for client authentication, and Geo-egress to choose an accurate egress IP address without exposing users’ precise location.
How it works
Let’s dive into the details of these components. For the purposes of this blog, we’ll call the devices people are using to browse the Internet (your phone, tablet or computer) clients, and the websites they’re trying to visit origin sites.
The Privacy Proxy Platform includes three main parts:
Token Proxy: this is the service that checks if you’re an Edge Secure Network user with a legitimate Microsoft account.
Privacy API: based on the above, Cloudflare’s Privacy API issues authentication tokens that clients use for authenticating to the proxy itself.
Privacy Proxy: this is the HTTP CONNECT-based proxy service running on Cloudflare’s network. This service checks that the client presents a valid authentication token, and if so, proxies the encrypted HTTP request to the origin site. It is also responsible for selecting a valid egress IP address to be used.
When Edge Secure Network protections are on – say, when a user connects to an open Wi-Fi network at a coffee shop – our proxy will automatically prompt that client for a token to authenticate. If the client has a token, it will present one. If it doesn’t, it will utilize the token proxy to mint a new pool using the help of an attester and issuer: the attester checks the validity of the client and Microsoft account, and the issuer issues tokens for that client in return. This dance is based on the Privacy Pass protocol. Importantly, it allows Cloudflare to validate that clients are who they say they are without collecting or storing personal information from Microsoft users.
Once the client has presented the proxy server with a valid token, the Privacy Proxy then chooses a valid egress IP address based on a hash of the client’s geolocation. It then uses the DNS record (provided by Cloudflare’s DNS resolver, 1.1.1.1) to open up an encrypted session to the origin website. From there, it’s pretty straightforward: if the user continues to browse on that site, further requests will be sent through that connection, if they stop or close the browser, that connection will close as well.
Because Cloudflare proxies millions of requests per second, many of the operational aspects of the proxy are managed by Oxy, our proxying framework that handles everything from telemetry, graceful restarts, to stream multiplexing and IP fallbacks, and authentication hooks.
Low last-mile latency and geolocation parity thanks to Cloudflare’s Network
Cloudflare’s privacy proxy implementation maximizes user experience without sacrificing privacy. When Edge Secure Network is enabled, users will have search and browsing results relevant to where they’re geographically located. At Cloudflare, we call this the pizza test: people should be able to use any of our privacy proxy products and still be able to get results for “pizza places near me”. We accomplish this by always egressing through a Cloudflare data center that has an IP address that corresponds to the user’s location – we’ve written more about how we did this for 1.1.1.1+WARP.
Unlike your typical VPN operator that has dozens – sometimes hundreds – of servers, Cloudflare has a much larger footprint: data centers in over 300 cities. Because our network is an anycast “every service, everywhere” approach, each of our data centers can accept traffic from an Edge Secure network client. This means that Edge users will automatically detect and connect with a Cloudflare data center geographically very close to them, minimizing last-mile latency. Finally, because Cloudflare also operates a CDN, websites that are already on Cloudflare will be given a “hot-path,” and will load faster.
We at Cloudflare are always striving to bring more privacy options to the open Internet, and we are excited to provide more private and secure browsing to Edge users. To learn more, head to Microsoft’s Edge Secure Network page or Microsoft’s support page. If you’re a partner interested in using a privacy-preserving proxy like this one, fill out this form.
D1 is now in open beta, and the theme is “scale”: with higher per-database storage limits and the ability to create more databases, we’re unlocking the ability for developers to build production-scale applications on D1. Any developers with an existing paid Workers plan don’t need to lift a finger to benefit: we’ve retroactively applied this to all existing D1 databases.
D1 our native serverless database, which we launched into alpha in November last year: the queryable database complement to Workers KV, Durable Objects and R2.
When we set out to build D1, we knew a few things for certain: it needed to be fast, it needed to be incredibly easy to create a database, and it needed to be SQL-based.
That last one was critical: so that developers could a) avoid learning another custom query language and b) make it easier for existing query buildings, ORM (object relational mapper) libraries and other tools to connect to D1 with minimal effort. From this, we’ve seen a huge number of projects build support in for D1: from support for D1 in the Drizzle ORM and Kysely, to the T4 App, a full-stack toolkit that uses D1 as its database.
We also knew that D1 couldn’t be the only way to query a database from Workers: for teams with existing databases and thousands of lines of SQL or existing ORM code, migrating across to D1 isn’t going to be an afternoon’s work. For those teams, we built Hyperdrive, allowing you to connect to your existing databases and make them feel global. We think this gives teams flexibility: combine D1 and Workers for globally distributed apps, and use Hyperdrive for querying the databases you have in legacy clouds and just can’t get rid of overnight.
Larger databases, and more of them
This has been the biggest ask from the thousands of D1 users throughout the alpha: not just more databases, but also bigger databases.
Developers on the Workers paid plan will now be able to grow each database up to 2GB and create 25 databases (up from 500MB and 10).
We’ll be continuing to work on unlocking even larger databases over the coming weeks and months: developers using the D1 beta will see automatic increases to these limits published on D1’s public changelog.
One of the biggest impediments to double-digit-gigabyte databases is performance: we want to ensure that a database can load in and be ready really quickly — cold starts of seconds (or more) just aren’t acceptable. A 10GB or 20GB database that takes 15 seconds before it can answer a query ends up being pretty frustrating to use.
Users on the Workers free plan will keep the ten 500MB databases (changelog) forever: we want to give more developers the room to experiment with D1 and Workers before jumping in.
Time Travel is here
Time Travel allows you to roll your database back to a specific point in time: specifically, any minute in the last 30 days. And it’s enabled by default for every D1 database, doesn’t cost any more, and doesn’t count against your storage limit.
For those who have been keeping tabs: we originally announced Time Travel earlier this year, and made it available to all D1 users in July. At its core, it’s deceptively simple: Time Travel introduces the concept of a “bookmark” to D1. A bookmark represents the state of a database at a specific point in time, and is effectively an append-only log. Time Travel can take a timestamp and turn it into a bookmark, or a bookmark directly: allowing you to restore back to that point. Even better: restoring doesn’t prevent you from going back further.
We think Time Travel works best with an example, so let’s make a change to a database: one with an Order table that stores every order made against our e-commerce store:
# To illustrate: we have 89,185 unique addresses in our order database.
# To illustrate: we have 89,185 unique addresses in our order database.
➜  wrangler d1 execute northwind --command "SELECT count(distinct ShipAddress) FROM [Order]"
┌──────────┐
│ count(*) │
├──────────┤
│ 89185    │
└──────────┘
OK, great. Now what if we wanted to make a change to a specific set of orders: an address change or freight company change?
# I think we might be forgetting something here...
➜  wrangler d1 execute northwind --command "UPDATE [Order] SET ShipAddress = 'Av. Veracruz 38, Roma Nte., Cuauhtémoc, 06700 Ciudad de México, CDMX, Mexico'
Wait: we’ve made a mistake that many, many folks have before: we forgot the WHERE clause on our UPDATE query. Instead of updating a specific order Id, we’ve instead updated the ShipAddress for every order in our table.
# Every order is now going to a wine bar in Mexico City.
➜  wrangler d1 execute northwind --command "SELECT count(distinct ShipAddress) FROM [Order]"
┌──────────┐
│ count(*) │
├──────────┤
│ 1        │
└──────────┘
Panic sets in. Did we remember to make a backup before we did this? How long ago was it? Did we turn on point-in-time recovery? It seemed potentially expensive at the time…
It’s OK. We’re using D1. We can Time Travel. It’s on by default: let’s fix this and travel back a few minutes.
# Let's go back in time.
➜  wrangler d1 time-travel restore northwind --timestamp="2023-09-23T14:20:00Z"

🚧 Restoring database northwind from bookmark 0000000b-00000002-00004ca7-9f3dba64bda132e1c1706a4b9d44c3c9
✔ OK to proceed (y/N) … yes

⚡️ Time travel in progress...
✅ Database dash-db restored back to bookmark 00000000-00000004-00004ca7-97a8857d35583887de16219c766c0785
↩️ To undo this operation, you can restore to the previous bookmark: 00000013-ffffffff-00004ca7-90b029f26ab5bd88843c55c87b26f497
We think that Time Travel becomes even more powerful when you have many smaller databases, too: the downsides of any restore operation is reduced further and scoped to a single user or tenant.
This is also just the beginning for Time Travel: we’re working to support not just only restoring a database, but also the ability to fork from and overwrite existing databases. If you can fork a database with a single command and/or test migrations and schema changes against real data, you can de-risk a lot of the traditional challenges that working with databases has historically implied.
Row-based pricing
Back in May we announced pricing for D1, to a lot of positive feedback around how much we’d included in our Free and Paid plans. In August, we published a new row-based model, replacing the prior byte-units, that makes it easier to predict and quantify your usage. Specifically, we moved to rows as it’s easier to reason about: if you’re writing a row, it doesn’t matter if it’s 1KB or 1MB. If your read query uses an indexed column to filter on, you’ll see not only performance benefits, but cost savings too.
Here’s D1’s pricing — almost everything has stayed the same, with the added benefit of charging based on rows:
As before, D1 does not charge you for “database hours”, the number of databases, or point-in-time recovery (Time Travel) — just query D1 and pay for your reads, writes, and storage — that’s it.
We believe this makes D1 not only far more cost-efficient, but also makes it easier to manage multiple databases to isolate customer data or prod vs. staging: we don’t care which database you query. Manage your data how you like, separate your customer data, and avoid having to fall for the trap of “Billing Based Architecture”, where you build solely around how you’re charged, even if it’s not intuitive or what makes sense for your team.
To make it easier to both see how much a given query charges and when to optimize your queries with indexes, D1 also returns the number of rows a query read or wrote (or both) so that you can understand how it’s costing you in both cents and speed.
For example, the following query filters over orders based on date:
The unindexed query above scans 16,800 rows. Even if we don’t optimize it, D1 includes 25 billion queries per month for free, meaning we could make this query 1.4 million times for a whole month before having to worry about extra costs.
But we can do better with an index:
CREATE INDEX IF NOT EXISTS idx_orders_date ON [Order](ShippedDate)
With the index created, let’s see how many rows our query needs to read now:
The same query with an index on the ShippedDate column reads just 417 rows: not only it is faster (duration is in milliseconds!), but it costs us less: we could run this query 59 million times per month before we’d have to pay any more than what the $5 Workers plan gives us.
D1 also exposes row counts via both the Cloudflare dashboard and our GraphQL analytics API: so not only can you look at this per-query when you’re tuning performance, but also break down query patterns across all of your databases.
D1 for Platforms
Throughout D1’s alpha period, we’ve both heard from and worked with teams who are excited about D1’s ability to scale out horizontally: the ability to deploy a database-per-customer (or user!) in order to keep data closer to where teams access it and more strongly isolate that data from their other users.
Teams building the next big thing on Workers for Platforms — think of it as “Functions as a Service, as a Service” — can use D1 to deploy a database per user — keeping customer data strongly separated from each other.
For example, and as one of the early adopters of D1, RONIN is building an edge-first content & data platform backed by a dedicated D1 database per customer, which allows customers to place data closer to users and provides each customer isolation from the queries of others.
Instead of spinning up and managing countless traditional database instances, RONIN uses D1 for Platforms to offer automatic infinite scalability at the edge. This allows RONIN to focus on providing a sleek, intuitive editing experience for your content & data.
When it comes to enabling “D1 for Platforms”, we’ve thought about this in a few ways from the very beginning:
Support for more than 100,000+ databases for Workers for Platforms users (there’s no limit, but if we said “unlimited” you might not believe us).
D1’s pricing – you don’t pay per-database or for “idle databases”. If you have a range of users, from thousands of QPS down to 1-2 every 10 minutes — you aren’t paying more for “database hours” on the less trafficked databases, or having to plan around spiky workloads across your user-base.
The ability to programmatically configure more databases via D1’s HTTP APIand attach them to your Worker without re-deploying. There’s no “provisioning” delay, either: you create the database, and it’s immediately ready to query by you or your users.
Detailed per-database analytics, so you can understand which databases are being used and how they’re being queried via D1’s GraphQL analytics API.
If you’re building the next big platform on top of Workers & want to use D1 at scale — whether you’re part of the Workers Launchpad program or not — reach out.
What’s next for D1?
We’re setting a clear goal: we want to make D1 “generally available” (GA) for production use-cases by early next year(Q1 2024). Although you can already use D1 without a waitlist or approval process, we understand that the GA label is an important one for many when it comes to a database (and as do we).
Between now and GA, we’re working on some really key parts of the D1 vision, with a continued focus on reliability and performance.
One of the biggest remaining pieces of that vision is global read replication, which we wrote about earlier this year. Importantly, replication will be free, won’t multiply your storage consumption, and will still enable session consistency (read-your-writes). Part of D1’s mission is about getting data closer to where users are, and we’re excited to land it.
We’re also working to expand Time Travel, D1’s built-in point-in-time recovery capabilities, so that you can branch and/or clone a database from a specific point-in-time on the fly.
We’ll also be progressively opening up our limits around per-database storage, unlocking more storage per account, and the number of databases you can create over the rest of this year, so keep an eye on the D1 changelog (or your inbox).
In the meantime, if you haven’t yet used D1, you can get started right now, visit D1’s developer documentation to spark some ideas, or join the #d1-beta channel on our Developer Discord to talk to other D1 developers and our product-engineering team.
Today we are announcing new pricing for Cloudflare Workers and Pages Functions, where you are billed based on CPU time, and never for the idle time that your Worker spends waiting on network requests and other I/O. Unlike other platforms, when you build applications on Workers, you only pay for the compute resources you actually use.
Why is this exciting? To date, all large serverless compute platforms have billed based on how long your function runs — its duration or “wall time”. This is a reflection of a new paradigm built on a leaky abstraction — your code may be neatly packaged up into a “function”, but under the hood there’s a virtual machine (VM). A VM can’t be paused and resumed quickly enough to execute another piece of code while it waits on I/O. So while a typical function might take 100ms to run, it might typically spend only 10ms doing CPU work, like crunching numbers or parsing JSON, with the rest of time spent waiting on I/O.
This status quo has meant that you are billed for this idle time, while nothing is happening.
With this announcement, Cloudflare is the first and only global serverless platform to offer standard pricing based on CPU time, rather than duration. We think you should only pay for the compute time you actually use, and that’s how we’re going to bill you going forward.
Old pricing — two pricing models, each with tradeoffs
New pricing — one simple and predictable pricing model
With the same generous Free plan
Unlike wall time (duration, or GB-s), CPU time is more predictable and under your control. When you make a request to a third party API, you can’t control how long that API takes to return a response. This time can be quite long, and vary dramatically — particularly when building AI applications that make inference requests to LLMs. If a request takes twice as long to complete, duration-based billing means you pay double. By contrast, CPU time is consistent and unaffected by time spent waiting on I/O — purely a function of the logic and processing of inputs on outputs to your Worker. It is entirely under your control.
Starting October 31, 2023, you will have the option to opt in individual Workers and Pages Functions projects on your account to new pricing, and newly created projects will default to new pricing. You’ll be able to estimate how much new pricing will cost in the Cloudflare dashboard. For the majority of current applications, new pricing is the same or less expensive than the previous Bundled and Unbound pricing plans.
If you’re on our Workers Paid plan, you will have until March 1, 2024 to switch to the new pricing on your own, after which all of your projects will be automatically migrated to new pricing. If you’re an Enterprise customer, any contract renewals after March 1, 2024, will use the new pricing. You’ll receive plenty of advance notice via email and dashboard notifications before any changes go into effect. And since CPU time is fully in your control, the more you optimize your Worker’s compute time, the less you’ll pay. Your incentives are aligned with ours, to make efficient use of compute resources on Region: Earth.
The challenge of truly scaling to zero
The beauty of serverless is that it allows teams to focus on what matters most — delivering value to their customers, rather than managing infrastructure. It saves you money by effortlessly scaling up and down all over the world based on your traffic, whether you’re an early stage startup or Shopify during Black Friday.
One of the promises of serverless is the idea of scaling to zero — once those big days subside, you no longer have to pay for virtual machines to sit idle before your autoscaling kicks in, or be charged by the hour for instances that you barely ended up using. No compute = no bills for usage. Or so, at least, is the promise of serverless.
Yet, there’s one hidden cost, where even in the serverless world you will find yourself paying for idle resources — what happens when your function is sitting around waiting on I/O? With pricing based on the duration that a function runs, you’re still billed for time that your service is doing zero work, and just waiting on network requests.
Most applications spend far more time waiting on this I/O than they do using the CPU, often ten times more.
Imagine a similar scenario in your own life — you grab a cab to go to the airport. On the way, the driver decides to stop to refuel and grab a snack, but leaves the meter running. This is not time spent bringing you closer to your destination, but it’s time that you’re paying for. Now imagine for the time the driver was refueling the car, the meter was paused. That’s the difference between CPU time and duration, or wall clock time.
But rather than waiting on the driver to refuel or grab a Snickers bar, what is it that you’re actually paying for when it comes to serverless compute?
Time spent waiting on services you don’t control
Most applications depend on one or many external service providers. Providers of hosted large language models (LLMs) like GPT-4 or Stable Diffusion. Databases as a service. Payment processors. Or simply an API request to a system outside your control. This is where software development is headed — rather than reinventing the wheel and slowly building everything themselves, both fast-moving startups and the Fortune 500 increasingly build using other services to avoid undifferentiated heavy lifting.
Every time an application interacts with one of these external services, it has to send data over the network and wait until it receives a response. And while some services are lightning fast, others can take considerable time, like waiting for a payment processor or for a large media file to be uploaded or converted. Your own application sits idle for most of the request, waiting on services outside your control.
Until today, you’ve had to pay while your application waits. You’ve had to pay more when a service you depend on has an operational issue and slows down, or times out in responding to your request. This has been a disincentive to incrementally move parts of your application to serverless.
Cloudflare’s new pricing: the first serverless platform to truly scale down to zero
The idea of “scale to zero” is that you never have to keep instances of your application sitting idle, waiting for something to happen. Serverless is more than just not having to manage servers or virtual machines — you shouldn’t have to provision and manage the number of compute resources that are available or warm.
Our new pricing takes the “scale to zero” concept even further, and extends it to whether your application is actually performing work. If you’re still paying while nothing is happening, we don’t think that’s truly scale to zero. Your application is idle. The CPU can be used for other tasks. Whether your application is “running” is an old concept lifted from an era before multi-tenant cloud platforms. What matters is if you are actually using compute resources.
Pay less, deploy everywhere, without hidden costs
Let’s compare what you’d pay on new Workers pricing to AWS Lambda, for the following Worker:
One billion requests per month
Seven CPU milliseconds per request
200ms duration per request
The above table is for informational purposes only. Prices are limited to the public fees as of September 20, 2023, and do not include taxes and any other fees. AWS Lambda and Lambda @ Edge prices are based on publicly available pricing in US-East (Ohio) region as published on https://aws.amazon.com/lambda/pricing/
New Workers pricing makes building AI applications dramatically cheaper
Yesterday we announced a new suite of products to let you build AI applications on Cloudflare — Workers AI, AI Gateway, and our new vector database, Vectorize.
Nearly everyone is building new products and features using AI models right now. Large language models and generative AI models are incredibly powerful. But they aren’t always fast — asking a model to create an image, transcribe a segment of audio, or write a story often takes multiple seconds — far longer than a typical API response or database query that we expect to return in tens of milliseconds. There is significant compute work going on behind the scenes, and that means longer duration per request to a Worker.
New Workers pricing makes this much less expensive than it was previously on the Unbound usage model.
Let’s take the same example as above, but instead assume the duration of the request is two seconds (2000ms), because the Worker makes an inference request to a large AI model. With new Workers pricing, you pay the exact same amount, no matter how long this request takes.
No surprise bills — set a maximum limit on CPU time for each Worker
Surprise bills from cloud providers are an unfortunately common horror story. In the old way of provisioning compute resources, forgetting to shut down an instance of a database or virtual machine can cost hundreds of dollars. And accidentally autoscaling up too high can be even worse.
We’re building new safeguards to prevent these kinds of scenarios on Workers. As part of new pricing, you will be able to cap CPU usage on a per-Worker basis.
For example, if you have a Worker with a p99 CPU time of 15ms, you might use this to set a max CPU limit of 40ms — enough headroom to ensure that your worker will run successfully, while ensuring that even if you ship a bug that causes a CPU time to ratchet up dramatically, or have an edge case that causes infinite recursion, you can’t suddenly rack up a giant unexpected bill, or be vulnerable to a denial of wallet attack. This can be particularly helpful if your worker handles variable or user-generated input, to guard against edge cases that you haven’t accounted for.
Alternatively, if you’re running a production service, but want to make sure you stay on top of your costs, we will also be adding the option to configure notifications that can automatically email you, page you, or send a webhook if your worker exceeds a particular amount of CPU time per request. You will be able to choose at what threshold you want to be notified, and how.
New ways to “hibernate” Durable Objects while keeping connections alive
While Workers are stateless functions, Durable Objects are stateful and long-lived, commonly used to coordinate and persist real-time state in chat, multiplayer games, or collaborative apps. And unlike Workers, duration-based pricing fits Durable Objects well. As long as one or more clients are connected to a Durable Object, it keeps state available in memory. Durable Objects pricing will remain duration-based, and is not changing as part of this announcement.
What about when a client is connected to a Durable Object, but no work has happened for a long time? Consider a collaborative whiteboard app built using Durable Objects. A user of the app opens the app in a browser tab, but then forgets about it, and leaves it running for days, with an open WebSocket connection. Just like with Workers, we don’t think you should have to pay for this idle time. But until recently, there hasn’t been an API to signal to us that a Durable Object can be safely “hibernated”.
The recently introduced Hibernation API, currently in beta, allows you to set an automatic response to be used while hibernated and serialize state such that it survives hibernation. This gives Cloudflare the inputs we need in order to maintain open WebSocket connections from clients, while “hibernating” the Durable Object such that it is not actively running, and you are not billed for idle time. The result is that your state is always available in-memory when actually need it, but isn’t unnecessarily kept around when it’s not. As long as your Durable Object is hibernating, even if there are active clients still connected over a WebSocket, you won’t be billed for duration.
Snippets make Cloudflare’s CDN programmable — for free
What if you just want to modify a header, do a country code redirect, or cache a custom query? Developers have relied on Workers to program Cloudflare’s CDN like this for many years. With the announcement of Cloudflare Snippets last year, now in alpha, we’re making it free.
If you use Workers today for these smaller use cases, to customize any of Cloudflare’s application services, Snippets will be the optimal, zero cost option.
A serverless platform without limits
Developers are building ever larger and more complex full-stack applications on Workers each month. Our promise to you is to help you scale in any direction, without worrying about paying for idle time or having to manage and provision compute resources across regions.
This also means not having to worry about limits. Workers already serves many millions of requests per second, and scales and performs so well that we are rebuilding our own CDN on top of Workers. Individual Workers can now be up to 10MB, with a max startup time of 400ms, and can be easily composed together using Service Bindings. Entire platforms are built on top of Workers, with a growing number of companies allowing their own customers to write and deploy custom code and applications via Workers for Platforms. Some of the biggest platforms in the world rely on Cloudflare and the Workers platform during the most critical moments.
New pricing removes limits on the types of applications that could be built cost effectively with duration-based pricing. It removes the ceiling on CPU time from our original request-based pricing. We’re excited to see what you build, and are committed to being the development platform where you’re not constrained by limits on scale, regions, instances, concurrency or whatever else you need to handle to grow and operate globally.
When will new pricing be available?
Starting October 31, 2023, you will have the option to opt in individual Workers and Pages Functions projects on your account to new pricing, and newly created projects will default to new pricing. You will have until March 1, 2024, or the end of your Enterprise contract, whichever comes later, to switch to new pricing on your own, after which all of your projects will be automatically migrated to new pricing. You’ll receive plenty of advance notice via email and dashboard notifications before any changes go into effect.
Between now and then, we want to hear from you. We’ve based new pricing off feedback we’ve heard from developers building serverless applications, and companies estimating and projecting their costs. Tell us what you think of new pricing by sharing your feedback in this survey. We read every response.
Every day across the Amazon Web Services (AWS) cloud infrastructure, we detect and successfully thwart hundreds of cyberattacks that might otherwise be disruptive and costly. These important but mostly unseen victories are achieved with a global network of sensors and an associated set of disruption tools. Using these capabilities, we make it more difficult and expensive for cyberattacks to be carried out against our network, our infrastructure, and our customers. But we also help make the internet as a whole a safer place by working with other responsible providers to take action against threat actors operating within their infrastructure. Turning our global-scale threat intelligence into swift action is just one of the many steps that we take as part of our commitment to security as our top priority. Although this is a never-ending endeavor and our capabilities are constantly improving, we’ve reached a point where we believe customers and other stakeholders can benefit from learning more about what we’re doing today, and where we want to go in the future.
Global-scale threat intelligence using the AWS Cloud
With the largest public network footprint of any cloud provider, our scale at AWS gives us unparalleled insight into certain activities on the internet, in real time. Some years ago, leveraging that scale, AWS Principal Security Engineer Nima Sharifi Mehr started looking for novel approaches for gathering intelligence to counter threats. Our teams began building an internal suite of tools, given the moniker MadPot, and before long, Amazon security researchers were successfully finding, studying, and stopping thousands of digital threats that might have affected its customers.
MadPot was built to accomplish two things: first, discover and monitor threat activities and second, disrupt harmful activities whenever possible to protect AWS customers and others. MadPot has grown to become a sophisticated system of monitoring sensors and automated response capabilities. The sensors observe more than 100 million potential threat interactions and probes every day around the world, with approximately 500,000 of those observed activities advancing to the point where they can be classified as malicious. That enormous amount of threat intelligence data is ingested, correlated, and analyzed to deliver actionable insights about potentially harmful activity happening across the internet. The response capabilities automatically protect the AWS network from identified threats, and generate outbound communications to other companies whose infrastructure is being used for malicious activities.
Systems of this sort are known as honeypots—decoys set up to capture threat actor behavior—and have long served as valuable observation and threat intelligence tools. However, the approach we take through MadPot produces unique insights resulting from our scale at AWS and the automation behind the system. To attract threat actors whose behaviors we can then observe and act on, we designed the system so that it looks like it’s composed of a huge number of plausible innocent targets. Mimicking real systems in a controlled and safe environment provides observations and insights that we can often immediately use to help stop harmful activity and help protect customers.
Of course, threat actors know that systems like this are in place, so they frequently change their techniques—and so do we. We invest heavily in making sure that MadPot constantly changes and evolves its behavior, continuing to have visibility into activities that reveal the tactics, techniques, and procedures (TTPs) of threat actors. We put this intelligence to use quickly in AWS tools, such as AWS Shield and AWS WAF, so that many threats are mitigated early by initiating automated responses. When appropriate, we also provide the threat data to customers through Amazon GuardDuty so that their own tooling and automation can respond.
Three minutes to exploit attempt, no time to waste
Within approximately 90 seconds of launching a new sensor within our MadPot simulated workload, we can observe that the workload has been discovered by probes scanning the internet. From there, it takes only three minutes on average before attempts are made to penetrate and exploit it. This is an astonishingly short amount of time, considering that these workloads aren’t advertised or part of other visible systems that would be obvious to threat actors. This clearly demonstrates the voracity of scanning taking place and the high degree of automation that threat actors employ to find their next target.
As these attempts run their course, the MadPot system analyzes the telemetry, code, attempted network connections, and other key data points of the threat actor’s behavior. This information becomes even more valuable as we aggregate threat actor activities to generate a more complete picture of available intelligence.
Disrupting attacks to maintain business as usual
In-depth threat intelligence analysis also happens in MadPot. The system launches the malware it captures in a sandboxed environment, connects information from disparate techniques into threat patterns, and more. When the gathered signals provide high enough confidence in a finding, the system acts to disrupt threats whenever possible, such as disconnecting a threat actor’s resources from the AWS network. Or, it could entail preparing that information to be shared with the wider community, such as a computer emergency response team (CERT), internet service provider (ISP), a domain registrar, or government agency so that they can help disrupt the identified threat.
As a major internet presence, AWS takes on the responsibility to help and collaborate with the security community when possible. Information sharing within the security community is a long-standing tradition and an area where we’ve been an active participant for years.
In the first quarter of 2023:
We used 5.5B signals from our internet threat sensors and 1.5B signals from our active network probes in our anti-botnet security efforts.
We stopped over 1.3M outbound botnet-driven DDoS attacks.
We shared our security intelligence findings, including nearly a thousand botnet C2 hosts, with relevant hosting providers and domain registrars.
We traced back and worked with external parties to dismantle the sources of 230k L7/HTTP(S) DDoS attacks.
Three examples of MadPot’s effectiveness: Botnets, Sandworm, and Volt Typhoon
Recently, MadPot detected, collected, and analyzed suspicious signals that uncovered a distributed denial of service (DDoS) botnet that was using the domain free.bigbots.[tld] (the top-level domain is omitted) as a command and control (C2) domain. A botnet is made up of compromised systems that belong to innocent parties—such as computers, home routers, and Internet of Things (IoT) devices—that have been previously compromised, with malware installed that awaits commands to flood a target with network packets. Bots under this C2 domain were launching 15–20 DDoS attacks per hour at a rate of about 800 million packets per second.
As MadPot mapped out this threat, our intelligence revealed a list of IP addresses used by the C2 servers corresponding to an extremely high number of requests from the bots. Our systems blocked those IP addresses from access to AWS networks so that a compromised customer compute node on AWS couldn’t participate in the attacks. AWS automation then used the intelligence gathered to contact the company that was hosting the C2 systems and the registrar responsible for the DNS name. The company whose infrastructure was hosting the C2s took them offline in less than 48 hours, and the domain registrar decommissioned the DNS name in less than 72 hours. Without the ability to control DNS records, the threat actor could not easily resuscitate the network by moving the C2s to a different network location. In less than three days, this widely distributed malware and the C2 infrastructure required to operate it was rendered inoperable, and the DDoS attacks impacting systems throughout the internet ground to a halt.
MadPot is effective in detecting and understanding the threat actors that target many different kinds of infrastructure, not just cloud infrastructure, including the malware, ports, and techniques that they may be using. Thus, through MadPot we identified the threat group called Sandworm—the cluster associated with Cyclops Blink, a piece of malware used to manage a botnet of compromised routers. Sandworm was attempting to exploit a vulnerability affecting WatchGuard network security appliances. With close investigation of the payload, we identified not only IP addresses but also other unique attributes associated with the Sandworm threat that were involved in an attempted compromise of an AWS customer. MadPot’s unique ability to mimic a variety of services and engage in high levels of interaction helped us capture additional details about Sandworm campaigns, such as services that the actor was targeting and post-exploitation commands initiated by that actor. Using this intelligence, we notified the customer, who promptly acted to mitigate the vulnerability. Without this swift action, the actor might have been able to gain a foothold in the customer’s network and gain access to other organizations that the customer served.
For our final example, the MadPot system was used to help government cyber and law enforcement authorities identify and ultimately disrupt Volt Typhoon, the widely-reported state-sponsored threat actor that focused on stealthy and targeted cyber espionage campaigns against critical infrastructure organizations. Through our investigation inside MadPot, we identified a payload submitted by the threat actor that contained a unique signature, which allowed identification and attribution of activities by Volt Typhoon that would otherwise appear to be unrelated. By using the data lake that stores a complete history of MadPot interactions, we were able to search years of data very quickly and ultimately identify other examples of this unique signature, which was being sent in payloads to MadPot as far back as August 2021. The previous request was seemingly benign in nature, so we believed that it was associated with a reconnaissance tool. We were then able to identify other IP addresses that the threat actor was using in recent months. We shared our findings with government authorities, and those hard-to-make connections helped inform the research and conclusions of the Cybersecurity and Infrastructure Security Agency (CISA) of the U.S. government. Our work and the work of other cooperating parties resulted in their May 2023 Cybersecurity advisory. To this day, we continue to observe the actor probing U.S. network infrastructure, and we continue to share details with appropriate government cyber and law enforcement organizations.
Putting global-scale threat intelligence to work for AWS customers and beyond
At AWS, security is our top priority, and we work hard to help prevent security issues from causing disruption to your business. As we work to defend our infrastructure and your data, we use our global-scale insights to gather a high volume of security intelligence—at scale and in real time—to help protect you automatically. Whenever possible, AWS Security and its systems disrupt threats where that action will be most impactful; often, this work happens largely behind the scenes. As demonstrated in the botnet case described earlier, we neutralize threats by using our global-scale threat intelligence and by collaborating with entities that are directly impacted by malicious activities. We incorporate findings from MadPot into AWS security tools, including preventative services, such as AWS WAF, AWS Shield, AWS Network Firewall, and Amazon Route 53 Resolver DNS Firewall, and detective and reactive services, such as Amazon GuardDuty, AWS Security Hub, and Amazon Inspector, putting security intelligence when appropriate directly into the hands of our customers, so that they can build their own response procedures and automations.
But our work extends security protections and improvements far beyond the bounds of AWS itself. We work closely with the security community and collaborating businesses around the world to isolate and take down threat actors. In the first half of this year, we shared intelligence of nearly 2,000 botnet C2 hosts with relevant hosting providers and domain registrars to take down the botnets’ control infrastructure. We also traced back and worked with external parties to dismantle the sources of approximately 230,000 Layer 7 DDoS attacks. The effectiveness of our mitigation strategies relies heavily on our ability to quickly capture, analyze, and act on threat intelligence. By taking these steps, AWS is going beyond just typical DDoS defense, and moving our protection beyond our borders.
We’re glad to be able to share information about MadPot and some of the capabilities that we’re operating today. For more information, see this presentation from our most recent re:Inforce conference: How AWS threat intelligence becomes managed firewall rules, as well as an overview post published today, Meet MadPot, a threat intelligence tool Amazon uses to protect customers from cybercrime, which includes some good information about the AWS security engineer behind the original creation of MadPot. Going forward, you can expect to hear more from us as we develop and enhance our threat intelligence and response systems, making both AWS and the internet as a whole a safer place.
If you have feedback about this post, submit comments in the Comments section below. If you have questions about this post, contact AWS Support.
Want more AWS Security news? Follow us on Twitter.
Когато се преместих от София в с. Бойково през 2020г. реших, че ще се опитам да направя нещо за тази община. Председател съм на Фондация Възраждане на българските села и сме дарили компютърни зали на десетки селца (включително и в Украйна), та се замислих дали пък не е редно да направя нещо и за общината, в която ще живея.
Подходих наивно и поисках среща с кмета. Той ни определи среща в с. Първенец, но… не дойде. Нямаше какво повече да очаквам от него и започнах да се свързвам директно с читалищата – Крумово, Ситово, Лилково, Бойково, Белащица, Златитрап, Младежкия клуб в Марково. Така се получи. Много добър прием навсякъде, а и много добри резултати. Бойково си направиха лятна занималя, в Крумово осигуриха безплатен достъп до Уча.се… В Марково обаче се получи най-добре. Може и да се сърдят останалите, но тамошната кметица г-жа Терзиева е най-дейна и най-сърцата. По-скоро ако трябва да бъда честен, това което я отличава от останалите дейни кметове е визията. Визията за бъдещето, която за съжаление липсва на ниво Община. Дори в Младежкия клуб в Марково направихме среща с доста изявени визионери от IT сектора в София и си поговорихме за професиите на бъдещето. Това без подкрепата на г-жа Терзиева не можеше да се случи и това е самата истина! Ако съм на марковци ще си я пазя и къткам, защото надали ще намерят по-добър кмет.
Окрилен от добрите резултати, реших да се загледам в бюджета на Община Родопи. Все пак това ми е работата – финансист съм и си мисля, че разбирам от тия работи. Понеже бях гледал заседания на общинския съвет в Пловдив си помислих, че мога да гледам и тук заседанията онлайн. „Да ама не”, както казваше Петко Бочаров. Общината нямала технологичната възможност да излъчва онлайн.
Tук по-младите ще възкликнат – wtf? Всяко 10 годишно хлапе знае как да стриймва в Youtube или FB. Освен това всички училища от времето на Ковид-а ползваха платформи за онлайн уроци. Няма как Община Родопи да не може да излъчва онлайн. Най-малкото е безплатно. Иска се само желание.
Оказа се че желание няма. От първото заседние, на което присъствах през 2020 и обърнах внимание на този проблем, до ден днешен Община Родопи не направи такива излъчвания.
В интерес на истината г-н Цанков (председателя на общинския съвет и сегашен кандидат кмет) пое ангажимент да „провери как стоят нещата” (имам го на запис), но в крайна сметка едно голямо НИЩО!
За съжаление и кмета г-н Михайлов явно беше ОК и не повдигаше този въпрос. Не мога да допусна, че е от неразбиране, защото както казахме най-лесно е да питаш всяко 10 годишно хлапе как се прави и то ще ти покаже.
Аз нямам друго разумно обяснение защо толкова се опъват на това онлайн излъчване на заседанията освен страха от това, заседанията да станат общодостъпни до всички граждани. Много би било лесно сега в предизборно време да извадиш запис и да се види кой какви ги е творил, но тази възможност е отнета от общинарите.
Понеже любимата „дъвка” в момента е – „дайте предложение за решение на „даден” проблем”, искам да ви кажа, че предложения е имало, но никой не ги е чул и видял. И това е релания проблем. За да се промени нещо, първо трябва да има прозрачност и информираност на населението. Всичко останало е следствие.
Та това е моето предложение за начало на промяна в Община Родопи – да се излъчват заседанията на общинския съвет онлайн. Безплатно е и се прави за 1 ден. Само желание да имат.
Тази седмица приехме на второ четене (т.е. финално) измененията Кодекса на труда, с които отпада трудовата книжка. Данните вместо в нея, ще се вписват в регистър на заетостта в НАП, който ще се появи след като бъде надграден регистъра на трудовите договори, който действа от две десетилетия и където се регистрира всеки трудов договор.
Нека да опитам да обясня какво прихме, защо го приехме и как го приехме.
По въпроса „как“ – през май внесохме законопроект, който предвиждаше създаване на такъв регистър, сканиране на всички настоящи трудови книжки и попълването му с данни от тях. Той мина на първо четене, но трябваше да се направят сериозни редакции, за да може да бъде изпълнен. Създадохме работна група към социалната комисия в парламента (с всички институции, синдикати, работодателски и професионални организации), като между нейните заседания всеки вторник, проведох редица срещи с НАП, НОИ и Министерството на труда и социалната политика, за да изчистим всеки детайл. След това работната група предложи редакции, които социалната комисия прие, а след това и пленарната зала на второ четене с пълен консенсус, за което вече благодарих на всички участващи в процеса.
Приетите изменения имат следните основни моменти:
Срок за бизнес анализ, подготовка на наредба и надграждане на регистъра на НАП – до юни 2025 г.
След влизане в сила, работниците и служителите спират да си носят трудовата книжка при всеки работодател
Трудовата книжка все пак се съхранява, в случай, че трябва да се доказва стаж преди да има регистри на НОИ или про спорове с работодател за правоотношения в последните 20 години
Еднократно, в 8-месечен период, работодателите „оформят“ трудовите книжки на служителите, т.е. вписват данни към 01.06.2025 г в тях, за да не се позволят злоупотреби (напр. служителите сам да си впише извънреден труд или преназначаване на друга категория труд при същия работодател). Периодът е достатъчно дълъг, за да не натовари работодателите с попълване
При постъпване на работа, изменение на договор и напускане на работа, работодателят вписва данни в регистъра на заетостта
Разговорно нареченият „Клас прослужено време“ (допълнително възнаграждение за трудов стаж и професионален опит) ще може да бъде изчислявано на база на данните в регистъра
Служебните книжки на държавните служители ще отпаднат година по късно, като ще се прилага сходен ред. Допълнителният период е предвид повечето специфики на държавната служба (има допълнителни атрибути, дипломатическата служба е подслучай на държавната и т.н.)
Работодателите ще имат достъп до данните за настоящите си работници и служители, но без данни за заплатата от предходни работодатели, което е в защита на интересите на служителите
Служителите ще имат достъп до пълните данни за себе си – за всичките си трудови и служебни правоотношения, т.е. цялата си трудова история, без значение в частния сектор или в държавната администрация
Има няколко важни въпроса, които трябва да получат отговори:
В: Защо остават трудовите книжки да се представят при пенсиониране от служители с трудов стаж преди 98-ма година, вместо да се сканират и историческите данни да се дигитализират?
О: В периода 89-98 г. има много случаи на фалшив трудов стаж, вкл. фалшива категория труд, с цел облагодетелстване на служители. НОИ изследват тези случаи един по един, вкл. с анализ на хартията, мастилото и други характеристики на документа. Няма как такова задължение да бъде вменено на текущия работодател. Още повече – текущите работодатели няма как да носят отговорност за достоверността на данните, въведени от предходни работодатели. Заради тези практически проблеми, старият стаж ще продължава да се доказва с трудова книжка при пенсиониране. Но в рамките на дискусията в работната група се избристри идеята НОИ да уредят процес, при който служителите да могат да предадат трудовта си книжка на НОИ за дигитализация преди да дойде времето за пенсия.
В: Каква е разликата на регистъра на заетостта с регистъра на трудовите договори, който действа в момента?
О: Регистърът на заетостта ще стъпи на регистъра на трудовите договори, като всичко, което се е подавало досега, ще продължи да се подава. В допълниение ще се подават и допълнителни данни, които в момента ги има само в трудовата книжка, ще се включват служебните правоотношения, запорите на заплатата. Ще се вписват и по-актуални данни при допълнителни споразумения към сключени трудови договори, защото в момента напр. заплатата в регистъра на трудовите договори не е актуална.
В: Защо регистърът да бъде в НАП, а не в НОИ или в МТСП?
О: Действително, НАП не е ползвател на тази информация. Но през 2001 г. на НАП е вменено да води регистъра на трудовите договори, а най-логичната следваща стъпка е неговото надграждане. Също така, в НАП има административен капацитет, чрез който да бъде осъществено това надграждане.
Смятам, че с институциите решихме всички висящи казуси, които могат да възникнат при отпадането на трудовата книжка, и че приетият закон е добър. Да, няма да си скъсаме трудовите книжки утре (една толкова вкоренена система не може да се изкорени безрисково за един ден), но ще имаме всички ползи от тяхната липса – и работодателите, и служителите.
I’m excited to announce today a new capability of Amazon Managed Streaming for Apache Kafka (Amazon MSK) that allows you to continuously load data from an Apache Kafka cluster to Amazon Simple Storage Service (Amazon S3). We use Amazon Kinesis Data Firehose—an extract, transform, and load (ETL) service—to read data from a Kafka topic, transform the records, and write them to an Amazon S3 destination. Kinesis Data Firehose is entirely managed and you can configure it with just a few clicks in the console. No code or infrastructure is needed.
Kafka is commonly used for building real-time data pipelines that reliably move massive amounts of data between systems or applications. It provides a highly scalable and fault-tolerant publish-subscribe messaging system. Many AWS customers have adopted Kafka to capture streaming data such as click-stream events, transactions, IoT events, and application and machine logs, and have applications that perform real-time analytics, run continuous transformations, and distribute this data to data lakes and databases in real time.
However, deploying Kafka clusters is not without challenges.
The first challenge is to deploy, configure, and maintain the Kafka cluster itself. This is why we released Amazon MSK in May 2019. MSK reduces the work needed to set up, scale, and manage Apache Kafka in production. We take care of the infrastructure, freeing you to focus on your data and applications. The second challenge is to write, deploy, and manage application code that consumes data from Kafka. It typically requires coding connectors using the Kafka Connect framework and then deploying, managing, and maintaining a scalable infrastructure to run the connectors. In addition to the infrastructure, you also must code the data transformation and compression logic, manage the eventual errors, and code the retry logic to ensure no data is lost during the transfer out of Kafka.
Today, we announce the availability of a fully managed solution to deliver data from Amazon MSK to Amazon S3 using Amazon Kinesis Data Firehose. The solution is serverless–there is no server infrastructure to manage–and requires no code. The data transformation and error-handling logic can be configured with a few clicks in the console.
The architecture of the solution is illustrated by the following diagram.
Amazon MSK is the data source, and Amazon S3 is the data destination while Amazon Kinesis Data Firehose manages the data transfer logic.
When using this new capability, you no longer need to develop code to read your data from Amazon MSK, transform it, and write the resulting records to Amazon S3. Kinesis Data Firehose manages the reading, the transformation and compression, and the write operations to Amazon S3. It also handles the error and retry logic in case something goes wrong. The system delivers the records that can not be processed to the S3 bucket of your choice for manual inspection. The system also manages the infrastructure required to handle the data stream. It will scale out and scale in automatically to adjust to the volume of data to transfer. There are no provisioning or maintenance operations required on your side.
Kinesis Data Firehose delivery streams support both public and private Amazon MSK provisioned or serverless clusters. It also supports cross-account connections to read from an MSK cluster and to write to S3 buckets in different AWS accounts. The Data Firehose delivery stream reads data from your MSK cluster, buffers the data for a configurable threshold size and time, and then writes the buffered data to Amazon S3 as a single file. MSK and Data Firehose must be in the same AWS Region, but Data Firehose can deliver data to Amazon S3 buckets in other Regions.
Kinesis Data Firehose delivery streams can also convert data types. It has built-in transformations to support JSON to Apache Parquet and Apache ORC formats. These are columnar data formats that save space and enable faster queries on Amazon S3. For non-JSON data, you can use AWS Lambda to transform input formats such as CSV, XML, or structured text into JSON before converting the data to Apache Parquet/ORC. Additionally, you can specify data compression formats from Data Firehose, such as GZIP, ZIP, and SNAPPY, before delivering the data to Amazon S3, or you can deliver the data to Amazon S3 in its raw form.
Let’s See How It Works To get started, I use an AWS account where there’s an Amazon MSK cluster already configured and some applications streaming data to it. To get started and to create your first Amazon MSK cluster, I encourage you to read the tutorial.
I select Amazon MSK as a data Source and Amazon S3 as a delivery Destination. For this demo, I want to connect to a private cluster, so I select Private bootstrap brokers under Amazon MSK cluster connectivity.
I need to enter the full ARN of my cluster. Like most people, I cannot remember the ARN, so I choose Browse and select my cluster from the list.
Finally, I enter the cluster Topic name I want this delivery stream to read from.
After the source is configured, I scroll down the page to configure the data transformation section.
On the Transform and convert records section, I can choose whether I want to provide my own Lambda function to transform records that aren’t in JSON or to transform my source JSON records to one of the two available pre-built destination data formats: Apache Parquet or Apache ORC.
Apache Parquet and ORC formats are more efficient than JSON format to query data from Amazon S3. You can select these destination data formats when your source records are in JSON format. You must also provide a data schema from a table in AWS Glue.
These built-in transformations optimize your Amazon S3 cost and reduce time-to-insights when downstream analytics queries are performed with Amazon Athena, Amazon Redshift Spectrum, or other systems.
Finally, I enter the name of the destination Amazon S3 bucket. Again, when I cannot remember it, I use the Browse button to let the console guide me through my list of buckets. Optionally, I enter an S3 bucket prefix for the file names. For this demo, I enter aws-news-blog. When I don’t enter a prefix name, Kinesis Data Firehose uses the date and time (in UTC) as the default value.
Under the Buffer hints, compression and encryption section, I can modify the default values for buffering, enable data compression, or select the KMS key to encrypt the data at rest on Amazon S3.
When ready, I choose Create delivery stream. After a few moments, the stream status changes to available.
Assuming there’s an application streaming data to the cluster I chose as a source, I can now navigate to my S3 bucket and see data appearing in the chosen destination format as Kinesis Data Firehose streams it.
As you see, no code is required to read, transform, and write the records from my Kafka cluster. I also don’t have to manage the underlying infrastructure to run the streaming and transformation logic.
Pricing and Availability. This new capability is available today in all AWS Regions where Amazon MSK and Kinesis Data Firehose are available.
You pay for the volume of data going out of Amazon MSK, measured in GB per month. The billing system takes into account the exact record size; there is no rounding. As usual, the pricing page has all the details.
Using larger block sizes in the kernel for I/O is a recurring topic in
storage and
block-layer circles. The topic came up in discussions
at the Linux Storage, Filesystem, Memory-Management and BPF Summit (LSFMM)
back in
May. One of the participants in those discussions, Hannes Reinecke, gave
a talk at Open Source Summit Europe 2023 with an overview of the reasons
behind using larger blocks for I/O, the current status of that work, and
where it all might lead from here.
Amazon Web Service (AWS) is pleased to announce that it has achieved the QI2/QC2 qualification level, set out by the Italian National Cybersecurity Agency (ACN) in Determination No. 307/2022, for AWS cloud infrastructure and 130 AWS cloud services. The scope of this qualification level includes the management of Critical data and workloads for Italian public administration customers. Customers and partners who manage workloads identified as Critical, according to the rules set out in ACN Determination No. 307/2022, can now benefit from the qualification achieved by AWS.
Qualification of cloud infrastructure and services is an integral part of the Italian Cloud Strategy, issued by the Department for Digital Transformation and ACN. The strategy contains guidelines for migrating data and digital services of the Italian Public Administration to the cloud.
The Italian Cloud Strategy starts from the principle that public administrations manage data and workloads that operate at different levels of criticality. When migrating from an on-premises solution to the cloud, public administrations must identify which risk class their workloads and data belong to.
ACN has identified the following three classes of data in relation to the damage that could be caused to the country in the event of a breach in terms of confidentiality, integrity, and availability.
Ordinary: Data and services whose deterioration does not cause the interruption of the state service nor, in any case, harm the economic and social wellbeing of the country.
Critical: Data and services whose compromise could compromise the maintenance of important functions for society, health, safety, and the economic and social wellbeing of the country.
Strategic: Data and services that, if compromised, can have an impact on national security.
Different levels of criticality require different levels of qualification according to the following scheme.
Figure 1. Different levels of criticality require different levels of qualification
Thanks to the presence of the AWS Europe (Milan) Region since April 2020, and the new QI2/QC2 qualification obtained by AWS, our customers and partners can now feel confident to develop innovative cloud services that manage the critical workloads of the Italian Public Administration that run on AWS cloud infrastructure. The qualification obtained by AWS will be available on the ACN Cloud Market Place in the next weeks.
Our customers can refer to the AWS QI2/QC2 qualification to confirm that the AWS control environment is designed and implemented appropriately. By receiving the qualification to manage Critical workloads, AWS demonstrates our commitment to meet the highest security expectations for cloud service providers set out by ACN.
As always, we value your feedback and questions. Reach out to the AWS Compliance team through the Contact Us page. To learn more about our other compliance and security programs, see AWS Compliance Programs.
If you have feedback about this post, submit comments in the Comments section below. If you have questions about this post, contact AWS Support.
Want more AWS Security news? Follow us on Twitter.
Amazon OpenSearch Serverless is an on-demand, auto-scaling configuration for Amazon OpenSearch Service. OpenSearch Serverless enables a broad set of use cases, such as real-time application monitoring, log analytics, and website search. OpenSearch Serverless lets you use OpenSearch without having to worry about scaling and managing an OpenSearch cluster. A collection can be accessed over the public internet or from your VPC. As you start accessing OpenSearch Serverless from different VPCs and accounts or from on premises, your connectivity patterns may change. In this post, we cover connectivity patterns and Domain Name System (DNS) resolution for your OpenSearch Serverless collection—whether accessed over the internet, within the VPC, within AWS, or from your on-premises location.
Foundational concepts
The following foundational concepts will help you better understand OpenSearch Serverless and DNS resolution.
Network access policy
The network access policy for OpenSearch Serverless determines whether the collection can be accessed over the internet or only through OpenSearch Serverless managed VPC endpoints. A single policy can be attached to multiple collections.
OpenSearch Serverless VPC endpoint
To access OpenSearch Serverless collections and dashboards privately from a VPC without using an internet gateway, you can create a VPC interface endpoint. When you create a VPC endpoint, it creates an elastic network interface (ENI) in each subnet that you enable for the VPC endpoint. These are requester-managed ENIs that serve as the entry point for traffic destined for the OpenSearch Serverless collection. When you create an OpenSearch Serverless VPC endpoint, the private DNS name option is enabled by default. This means that OpenSearch Serverless also creates an Amazon Route 53private hosted zone and associates that with the VPC where the endpoint is created. This private hosted zone has a wildcard DNS record *.<region>.aoss.amazonaws.com pointing to the private DNS of the endpoint.
You create an OpenSearch Serverless VPC endpoint via the OpenSearch Serverless console or the OpenSearch Serverless API. You can’t create an OpenSearch Serverless VPC endpoint from the Amazon Virtual Private Cloud (Amazon VPC) console, although once created, you can see them on the VPC console as well.
Amazon Route 53 Resolver
Let’s understand what Amazon Route 53 Resolver does when an Amazon Elastic Compute Cloud (Amazon EC2) instance queries a DNS name. DNS queries originating from the VPC go to the Route 53 Resolver at the VPC+2 IP address. When a DNS query reaches the resolver, it checks if there are any Route 53 forward rules. If it matches, then it forwards the query to the DNS server provided by that rule. If the query remains unresolved, Route 53 Resolver proceeds to check the private hosted zones associated with the originating VPC. If it still remains unresolved, then it checks for VPC DNS, which helps to resolve EC2 DNS names. Lastly, if the query still isn’t resolved, Route 53 Resolver checks the public DNS. The following diagram illustrates this order or operations.
Route 53 Resolver inbound endpoints
Workloads utilizing resources both in a VPC and on premises need to resolve DNS records hosted on-premises and resources hosted in the VPC. With Route 53 Resolver inbound endpoints, you can resolve DNS queries to your VPC from your on-premises network or another VPC.
In the following sections, we provide an overview of connectivity patterns and DNS resolution.
Access an OpenSearch Serverless collection from Amazon EC2 (via internet gateway)
The following figure demonstrates the connectivity pattern to access an OpenSearch Serverless collection over the internet. The collection has an access type set to public, which allows authorized users to connect to the collection over the internet. An EC2 instance within the VPC can establish a connection to the collection via the internet gateway, and users outside the VPC can also access this collection over the internet.
The workflow has the following steps, as indicated in the preceding diagram:
A. The EC2 instance performs a DNS lookup to Route 53 Resolver at a VPC+2 IP address. Route 53 Resolver returns the public IP addresses of the OpenSearch Serverless collection.
B. The EC2 instance sends a data request via an internet gateway to the OpenSearch Serverless collection using this public IP address.
C. An external client resolves to the public IP addresses of the OpenSearch Serverless collection and reaches it via the internet.
Now let’s perform a dig command for the collection or dashboard URL from the EC2 instance, and we observe that it’s resolving to a public IP address.
The following command uses an OpenSearch Serverless collection:
Now that you have implemented an OpenSearch Serverless collection with a network access policy as public, you can make the same collection accessible privately within the VPC. To achieve this, complete the following steps:
Modify the network access policy of the collection and change the access type to VPC.
Select the option Create VPC endpoints.
Choose the VPC and at least two subnets where you would like to have a VPC endpoint ENI for high availability.
Choose Confirm to create the VPC endpoint.
Lastly, select the VPC endpoint and update the policy.
With the creation of the VPC endpoint, a Route 53 private hosted zone is also created within your account and associated with your VPC. In this setup, a CNAME record *.us-east-1.aoss.amazonaws.com is created to direct to the Regional AWS PrivateLink endpoint, as depicted in the following screenshot.
Due to the private hosted zone associated with the VPC, Route 53 Resolver gives preference to the private hosted zone to resolve any DNS query originating from the VPC. DNS requests for the OpenSearch Serverless collection originating from the EC2 instance get resolved using this associated private hosted zone and resolve to the private IP addresses of the VPC endpoint, which allows Amazon EC2 to connect to the serverless collection via VPC endpoints vs. the internet gateway. We expand on this in the following section.
Access an OpenSearch Serverless collection from Amazon EC2 (via interface VPC endpoints)
The following figure demonstrates the connectivity pattern to access an OpenSearch Serverless collection privately from the VPC. The collection has an access type set to VPC endpoint, restricting access solely from the resources within the VPC via the VPC endpoint and preventing external users from connecting. With the creation of the VPC endpoint, a private hosted zone is also associated with this VPC. An EC2 instance within the VPC can establish a connection with the collection using the VPC endpoint, but resources outside of the VPC don’t have access to this collection because of the network access policy.
The workflow consists of the following steps:
A. The EC2 instance performs a DNS lookup to Route 53 Resolver at a VPC+2 IP address. Route 53 Resolver returns the private IP addresses of the VPC endpoint because there is a private hosted zone associated with the VPC containing a CNAME record.
B. The EC2 instance sends a data request via the VPC interface endpoint to the OpenSearch Serverless collection.
C. An external client resolves to the public IP addresses of the OpenSearch Serverless collection but is unable to reach it because the network policy restricts to the VPC.
Now let’s perform a dig command for the collection or dashboard URL from the EC2 instance, and we observe that it’s resolving to the private IP addresses belonging to the VPC endpoints.
Use the following code for an OpenSearch Serverless collection:
Access an OpenSearch Serverless collection from many VPCs (via interface VPC endpoints) with a VPC endpoint in each VPC
The following figure demonstrates the connectivity pattern to use the same VPC endpoint to connect to multiple OpenSearch Serverless collections. In this scenario, a VPC endpoint is created in each VPC to enable EC2 instances within the VPCs to utilize the VPC endpoint as the connectivity path to OpenSearch Serverless. A private hosted zone is auto generated for each endpoint and associated with the corresponding VPC. Network policies of OpenSearch Serverless collections are updated to allow both VPC Endpoint-1 and VPC Endpoint-2, which allows the EC2 instance in VPC-1 to access both collections via VPC Endpoint-1 and EC2 instances in VPC-2 to access both collections via VPC Endpoint-2.
The workflow consists of the following steps:
A. The EC2 instance performs a DNS lookup to Route 53 Resolver at a VPC+2 IP address. Route 53 Resolver returns the private IP addresses of the VPC endpoint (the EC2 instance in VPC-1 gets the IP address of VPC Endpoint-1 and the EC2 instance in VPC-2 gets the IP address of VPC Endpoint-2), because there is a private hosted zone associated with each of the VPCs containing a CNAME record.
B. The EC2 instance sends a data request via the VPC interface endpoint to the OpenSearch Serverless collection.
Access an OpenSearch Serverless collection from many VPCs (via interface VPC endpoints) with a VPC endpoint in a centralized VPC
In the previous connectivity pattern, we had one endpoint in each VPC through which VPC resources accessed OpenSearch Serverless collections. Many organizations would like to maintain control of these endpoints and keep these in a centralized VPC.
The following figure demonstrates the connectivity pattern to use a centralized VPC endpoint to connect to multiple OpenSearch Serverless collections from multiple VPCs. In this scenario, a VPC interface endpoint is created in a centralized VPC. A private hosted zone is auto generated for this VPC endpoint and associated with the centralized VPC, and then manually associated with VPC-1 and VPC-2. The DNS query for OpenSearch Serverless collections from VPC-1 and VPC-2 gets resolved to the centralized VPC endpoint due to the private hosted zone association. Network policies for both collections allow access from the centralized VPC endpoint only. All three VPCs (centralized, VPC-1, and VPC-2) are connected via AWS Transit Gateway and route tables have routes to direct traffic between VPC-1 and VPC-2 to the centralized VPC and vice versa.
The workflow consists of the following steps:
A. The EC2 instance performs a DNS lookup to Route 53 Resolver at a VPC+2 IP address. Route 53 Resolver returns the private IP addresses of the centralized VPC endpoint, because there is a private hosted zone associated with each VPC containing a CNAME record.
B. The EC2 instance sends a data request to the Transit Gateway ENI in its own VPC. The Transit Gateway route table is checked and the data request is forwarded to the Transit Gateway ENI in the centralized VPC. The Transit Gateway ENI in the centralized VPC sends it to the OpenSearch Serverless collection via the VPC interface endpoint.
Access an OpenSearch Serverless collection from on premises (via AWS Site-to-Site VPN or AWS Direct Connect)
The following figure demonstrates the connectivity pattern for accessing OpenSearch Serverless collections from on premises. You can use either AWS Direct Connect or AWS Site-to-Site VPN to establish connectivity between on-premises and AWS resources. In the following example, Direct Connect is used for the connectivity between AWS and on premises. An OpenSearch Serverless VPC endpoint is created in the VPC, and a private hosted zone is automatically generated and associated with this VPC. The network policy of the OpenSearch Serverless collection is updated to allow connectivity only from the VPC endpoint.
To access these OpenSearch Serverless collections privately from the on-premises environment, resources need to resolve the OpenSearch Serverless collection DNS to the OpenSearch Serverless VPC endpoint IP address. By default, OpenSearch Serverless DNS resolves to the public IP addresses and attempts to access OpenSearch Serverless via the internet. To ensure that OpenSearch Serverless is accessed via the VPC endpoint from on premises, you need to ensure that DNS queries are resolved to a VPC endpoint’s private IP address. Resources inside the VPC use Route 53 Resolver, available at a VPC+2 IP address, to resolve these queries to the VPC endpoint. Route 53 Resolver checks the associated private hosted zone to resolve the query to the VPC endpoint. However, the VPC+2 IP address is not accessible from on premises. To address this, you can utilize the Route 53 Resolver inbound endpoint.
To achieve this, you can create an inbound endpoint in your VPC by following the steps outlined in Configuring inbound forwarding, and then update the on-premises DNS server to forward all the DNS requests for *.<region>.aoss.amazonaws.com to the IP address of the Route 53 Resolver inbound endpoint. When the on-premises client obtains the IP address of the VPC endpoint, it can use Direct Connect or Site-to-Site VPN to establish a private connection to the OpenSearch Serverless collection.
The workflow contains the following steps:
A. The on-premises client sends a DNS lookup to the on-premises DNS resolver. The on-premises DNS resolver forwards this request to the Route 53 Resolver inbound endpoint. The Route 53 Resolver inbound endpoint sends a DNS lookup to Route 53 Resolver at a VPC+2 IP address. Route 53 Resolver returns the private IP addresses of the VPC endpoint, because there is a private hosted zone associated with this VPC containing a CNAME record.
B. The on-premises client sends a data request to the OpenSearch Serverless collection, which routes via Direct Connect or Site-to-site VPN to the VPC interface endpoint and finally to the OpenSearch Serverless collection.
Conclusion
In this post, we showed you various connectivity patterns for OpenSearch Serverless. We covered the use of hybrid DNS and using a Route 53 Resolver inbound endpoint to allow connectivity from on premises for OpenSearch Serverless. You can choose from various centralization models for reaching multiple OpenSearch Serverless collections within the AWS Cloud or from on-premises locations. Get started today by connecting to OpenSearch Serverless from the various network patterns we discussed.
About the authors
Salman Ahmed is a Sr. Technical Account Manager in AWS Enterprise Support. He enjoys working with Enterprise Support customers to help them with design, implementation and supporting cloud infrastructure. He also has a passion for networking services and with 12+ years of experience, he leverages that to help customers with adoption of AWS Transit Gateway, AWS Direct Connect and various other AWS networking services.
Ankush Goyal is Enterprise Support Lead in AWS Enterprise Support who helps enterprise support customers streamline their cloud operations on AWS. He is a results-driven IT professional with over 18 years of experience.
Rohit Aswani is a Senior Specialist Solutions Architect focussed on Networking at AWS, where he helps customers build and design scalable, highly-available, secure, resilient and cost effective networks. He holds a MS in Telecommunication Systems Management from Northeastern University, specializing in Computer Networking. In his spare time, Rohit enjoys hiking, traveling and exploring new coffee places.
Amazon OpenSearch Service is a managed service that makes it simple to secure, deploy, and operate OpenSearch clusters at scale in the AWS Cloud. Amazon OpenSearch clusters are comprised of data nodes and cluster manager nodes. The cluster manager nodes elect a leader among themselves. The leader node is the authority on the metadata in the cluster, which is called cluster state. Any changes to the cluster state are processed by the leader node and broadcasted to all of the nodes in the cluster. The data nodes enqueue a new cluster-level task for any cluster state change like creation of an index, dynamic put-mappings, shard started, etc. in the cluster manager’s unbounded queue. The tasks waiting in this queue are called pending tasks. Because it’s unbounded, alarge number of pending tasks can be queued, which overloads the leader node. This can affect the leader’s performance and may also in turn affect the stability and availability of the whole cluster.
We have introduced a throttling mechanism for cluster manager nodes to provide protection against a large number of pending tasks. It acts during task submission to the leader node. This feature is available for Amazon OpenSearch engine version 1.3 and above in Amazon OpenSearch Service.
Cluster manager task throttling
Cluster manager task throttling is a mechanism to protect the cluster manager against submission of too many resource-intensive cluster state update tasks from other nodes. For tasks like put-mapping, data nodes have an existing throttling mechanism for cluster-state tasks that helps avoid overload of the cluster manager. For example, if the cluster manager can handle 10 K requests and the domain has 10 data nodes, then each data node gets a throttle at 1,000 put-mapping requests. If the domain grows to 100 data nodes, then each data node must throttle at 100 requests. To avoid having to modify these throttle limit whenever the cluster changes the number of data nodes and to support more task types, we ‘ve introduced throttling at cluster manager node for self-protection.
The cluster state update tasks are of different types ( create-index, put-mapping, and more) and this throttling mechanism rejects a task based on its type. For any incoming task, the cluster manager evaluates the total number of tasks of the same type in the pending task queue. If this number exceeds the threshold for a task type, then the cluster manager rejects the incoming task.
Amazon OpenSearch Service configures different throttling thresholds for different task types and throttling acts independently on each task type. Rejecting a particular task doesn’t affect other tasks of a different type. For example, if the cluster manager rejects a put-mapping task, it can still accept a concurrent create-index task.
All of the tasks generated by data plane APIs( _mapping/, _setting/ and more) have been onboarded for throttling and are listed here.
When the cluster manager rejects a task, the data node performs retries with exponential back off to resubmit the task to the cluster manager until it is successfully submitted. If retries are unsuccessful within the timeout period, then Amazon OpenSearch returns a cluster timeout error.
Sample of error
{
  "error" : {
    "type" : "process_cluster_event_timeout_exception",
    "reason" : "failed to process cluster event (indices:admin/mapping/put) within 30s",
    "suppressed" : [
      {
        "type" : "cluster_manager_throttling_exception",
        "reason" : "Throttling Exception : Limit exceeded for put-mapping"
      }
    ]
  },
  "status" : 503
}
Handling time out errors
The throttling exception is acted upon by data nodes; they perform the retries on throttled task. If API times out during throttling period, you’ll get process_cluster_event_timeout_exception , which is a 503 error. This is the same error that was thrown earlier as well when tasks are timing out in the cluster manager node’s queue. You can retry the API calls with timeout errors.
This solution will improve this feature by exposing the throttling exception directly as an API error.
Monitoring throttling
You can monitor the detailed throttling stats using the _nodes/stats API.
You can use the cluster_manager_throttling section in the _nodes/stats response to track, which tasks are getting throttled and how many tasks has been throttled.
In this post, we showed you how a throttling mechanism for task submission to the cluster manager node makes it more resilient to a high number of pending tasks in Amazon OpenSearch Service, where we have fine-tuned the thresholds per cluster.
Cluster manager throttling is available in Amazon OpenSearch, and we are always looking for external contributions. You can refer to the RFC (Request For Comment) to get started.
About the Authors
Dhwanil Patel is a Software Developer Engineer working on Amazon OpenSearch Service. He likes to contribute to open-source software development, and is passionate about distributed systems.
Shweta Thareja is a Principal Engineer working on Amazon OpenSearch Service. She is interested in building distributed and autonomous systems. She is a maintainer and an active contributor to OpenSearch.
Jon Handler is a Senior Principal Solutions Architect at Amazon Web Services based in Palo Alto, CA. Jon works closely with OpenSearch and Amazon OpenSearch Service, providing help and guidance to a broad range of customers who have search and log analytics workloads that they want to move to the AWS Cloud. Prior to joining AWS, Jon’s career as a software developer included 4 years of coding a large-scale, ecommerce search engine. Jon holds a Bachelor of the Arts from the University of Pennsylvania, and a Master of Science and a PhD in Computer Science and Artificial Intelligence from Northwestern University.
To provide the best experiences, we use technologies like cookies to store and/or access device information. Consenting to these technologies will allow us to process data such as browsing behavior or unique IDs on this site. Not consenting or withdrawing consent, may adversely affect certain features and functions.
Functional
Always active
The technical storage or access is strictly necessary for the legitimate purpose of enabling the use of a specific service explicitly requested by the subscriber or user, or for the sole purpose of carrying out the transmission of a communication over an electronic communications network.
Preferences
The technical storage or access is necessary for the legitimate purpose of storing preferences that are not requested by the subscriber or user.
Statistics
The technical storage or access that is used exclusively for statistical purposes.The technical storage or access that is used exclusively for anonymous statistical purposes. Without a subpoena, voluntary compliance on the part of your Internet Service Provider, or additional records from a third party, information stored or retrieved for this purpose alone cannot usually be used to identify you.
Marketing
The technical storage or access is required to create user profiles to send advertising, or to track the user on a website or across several websites for similar marketing purposes.

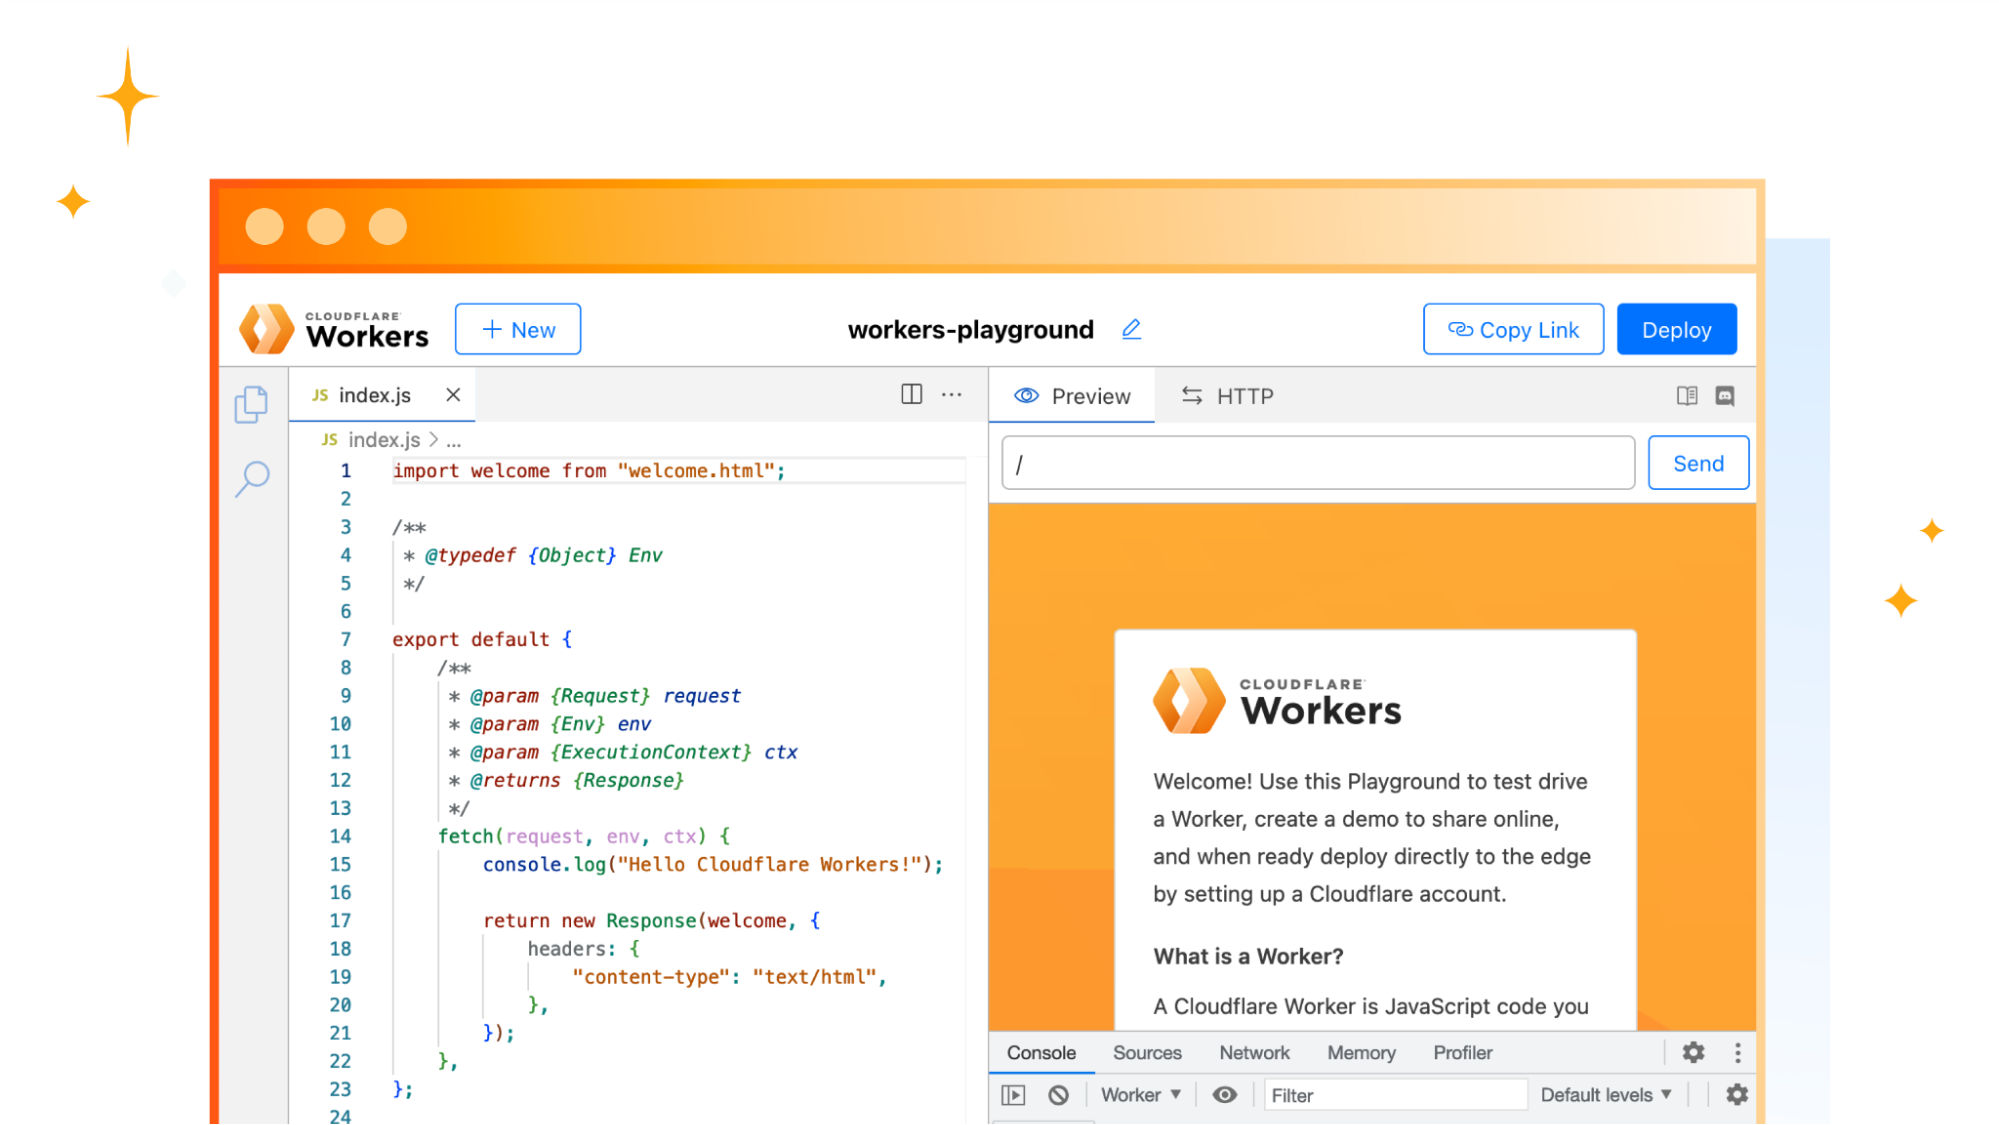
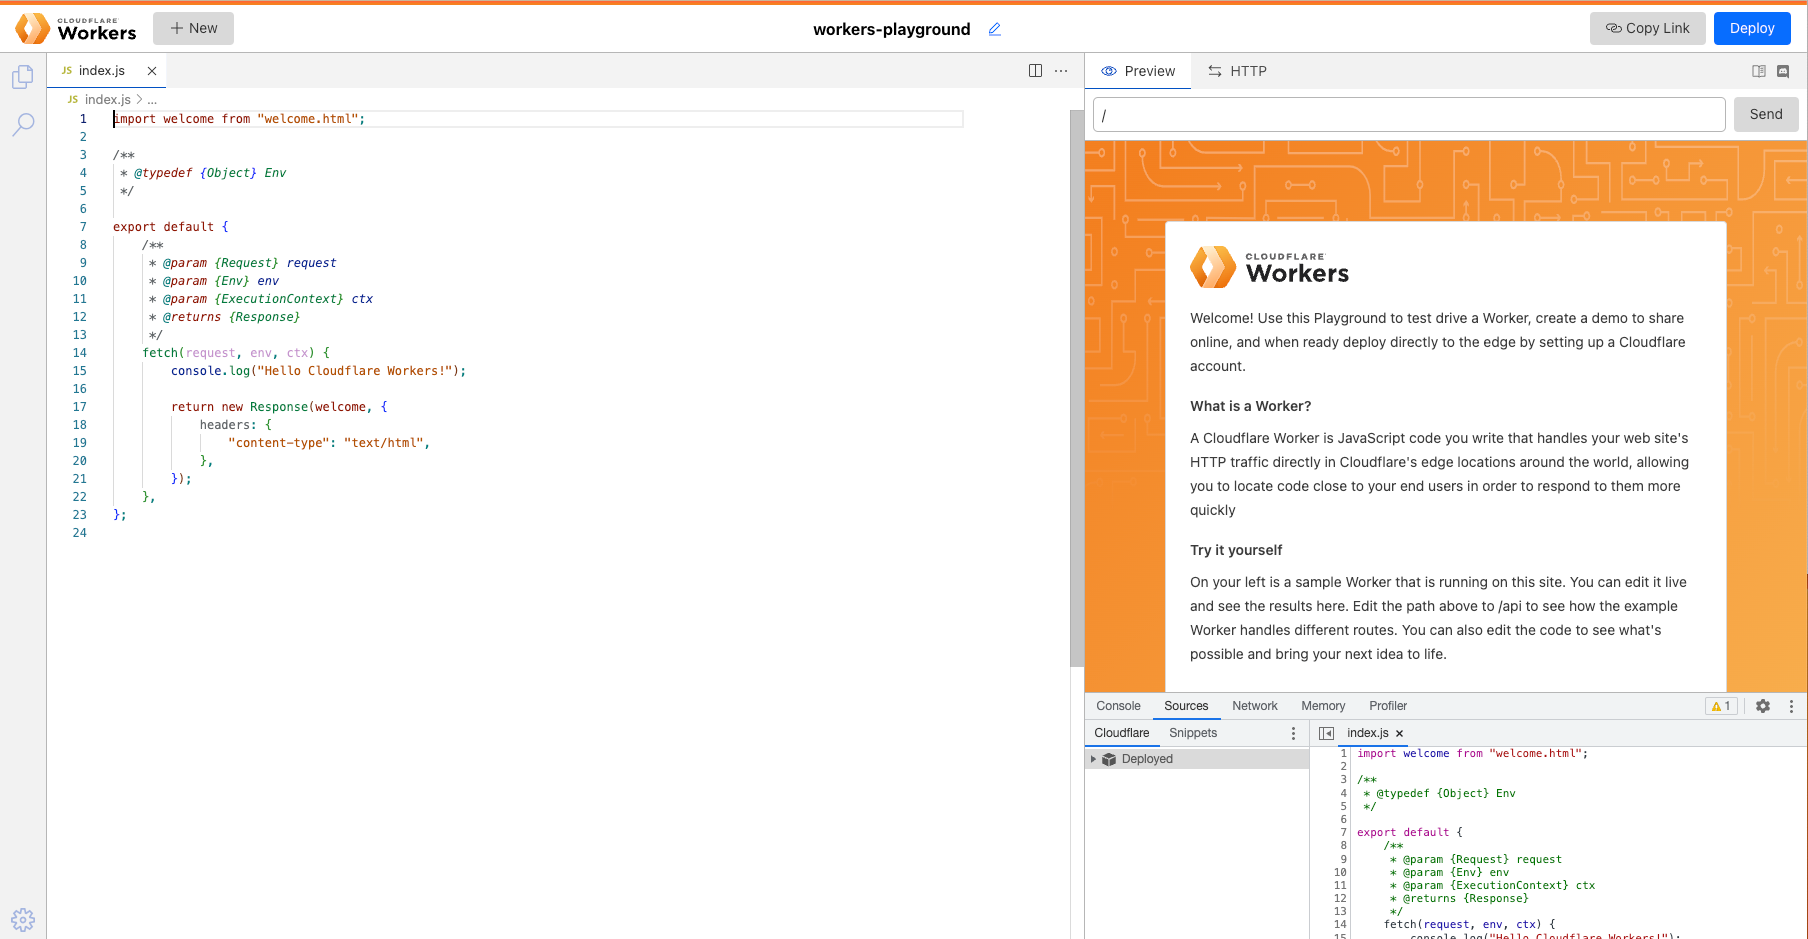
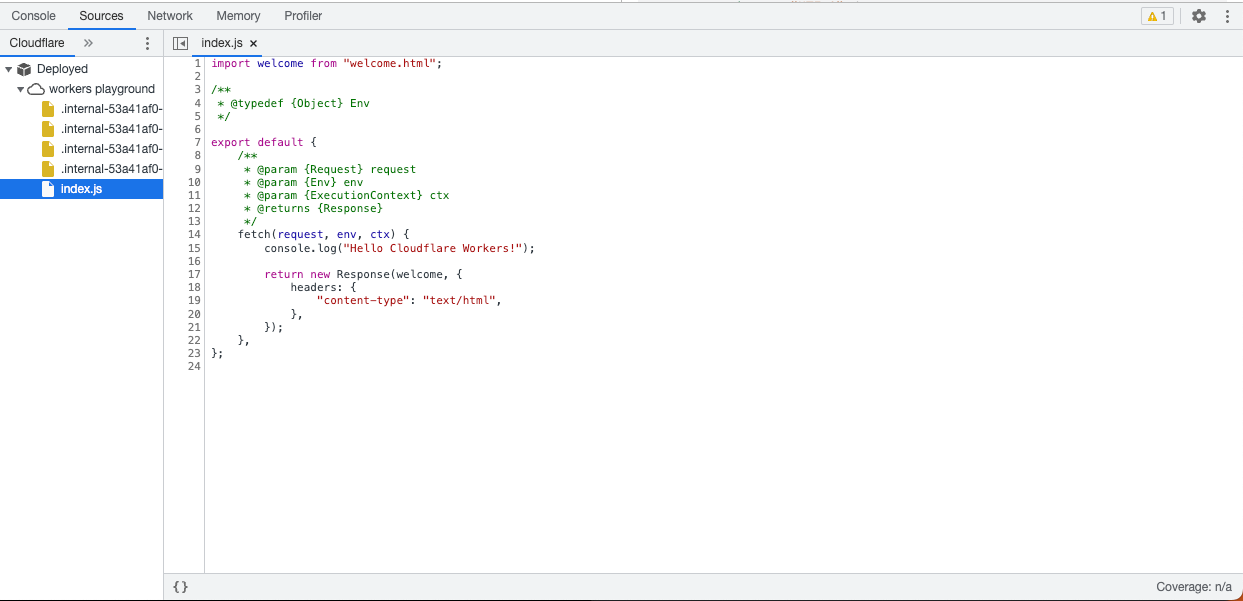
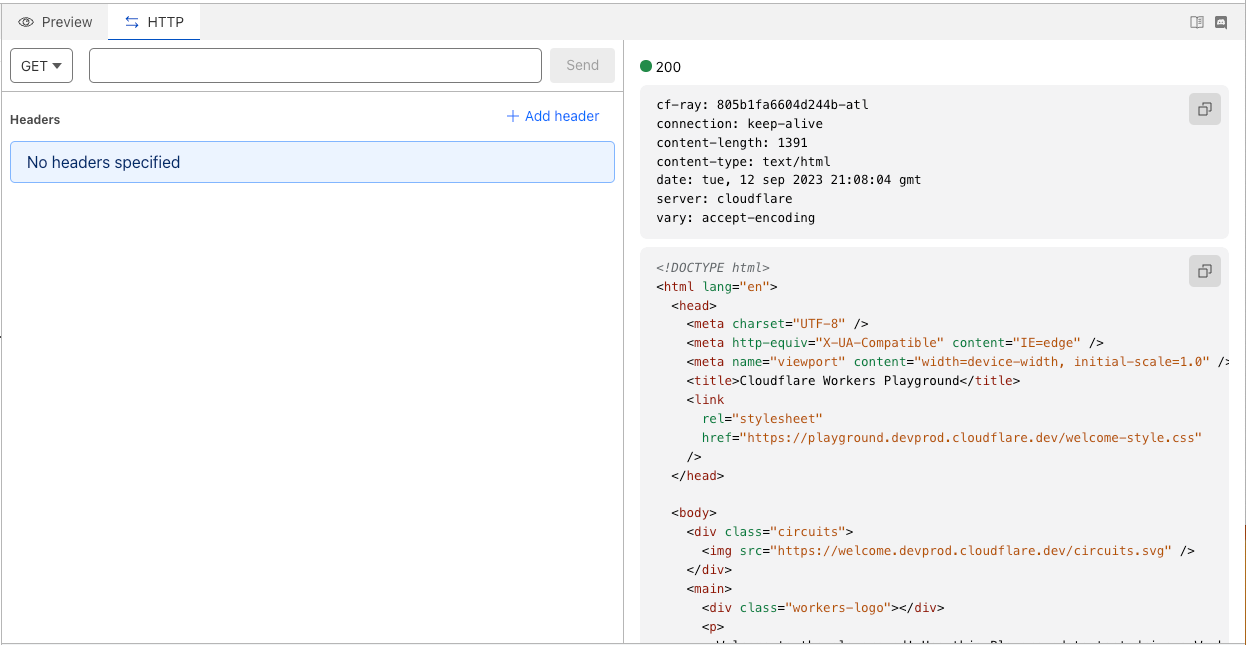

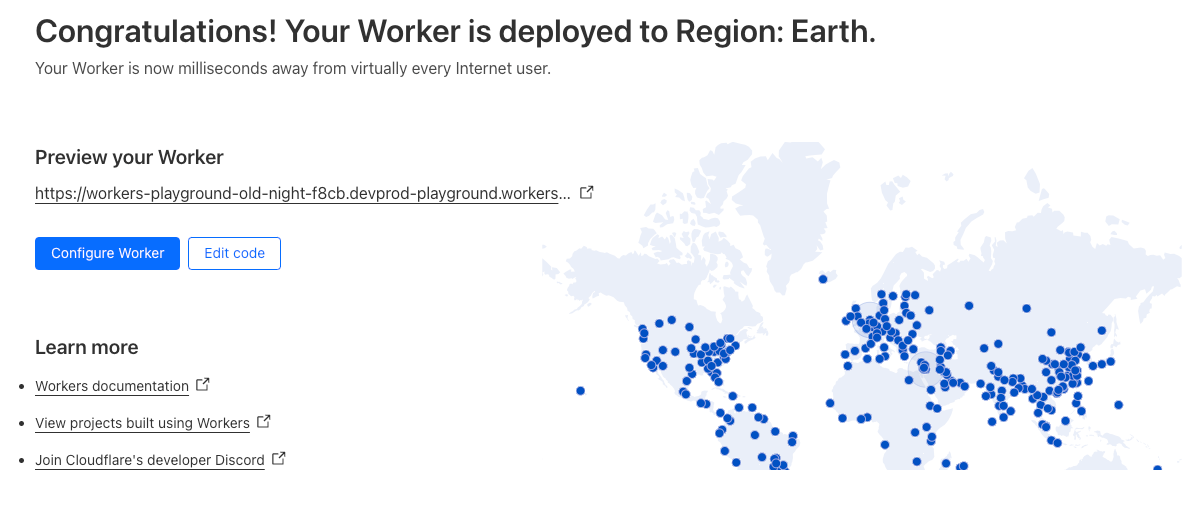


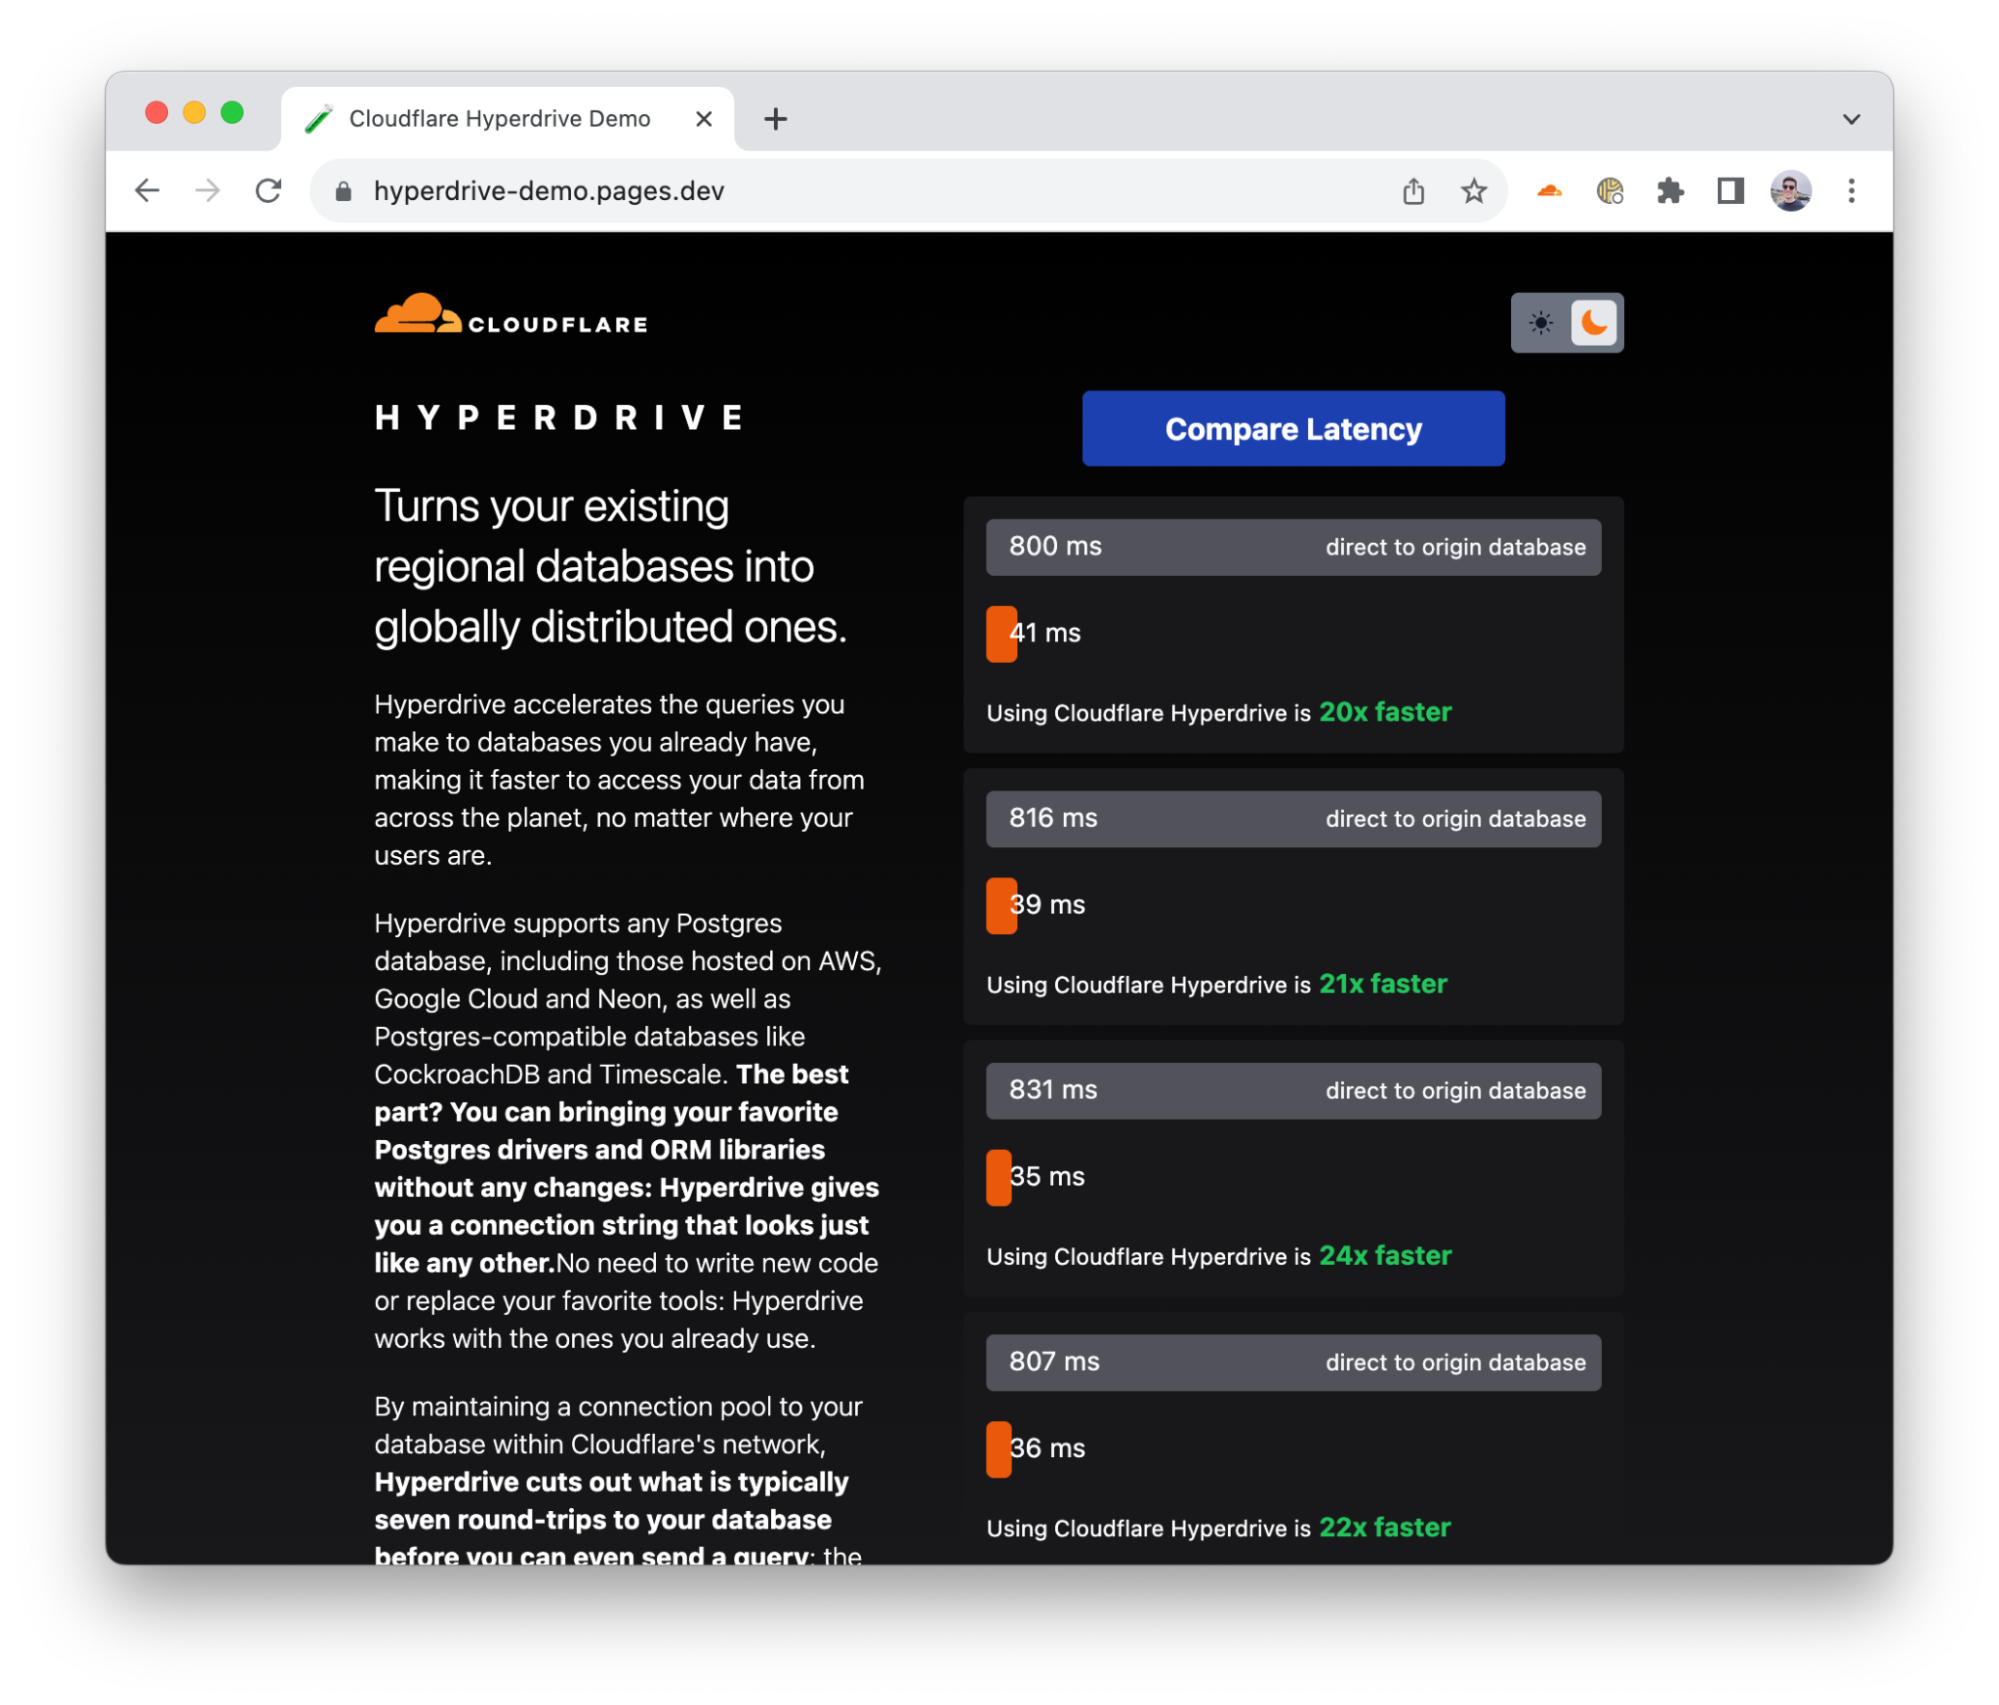
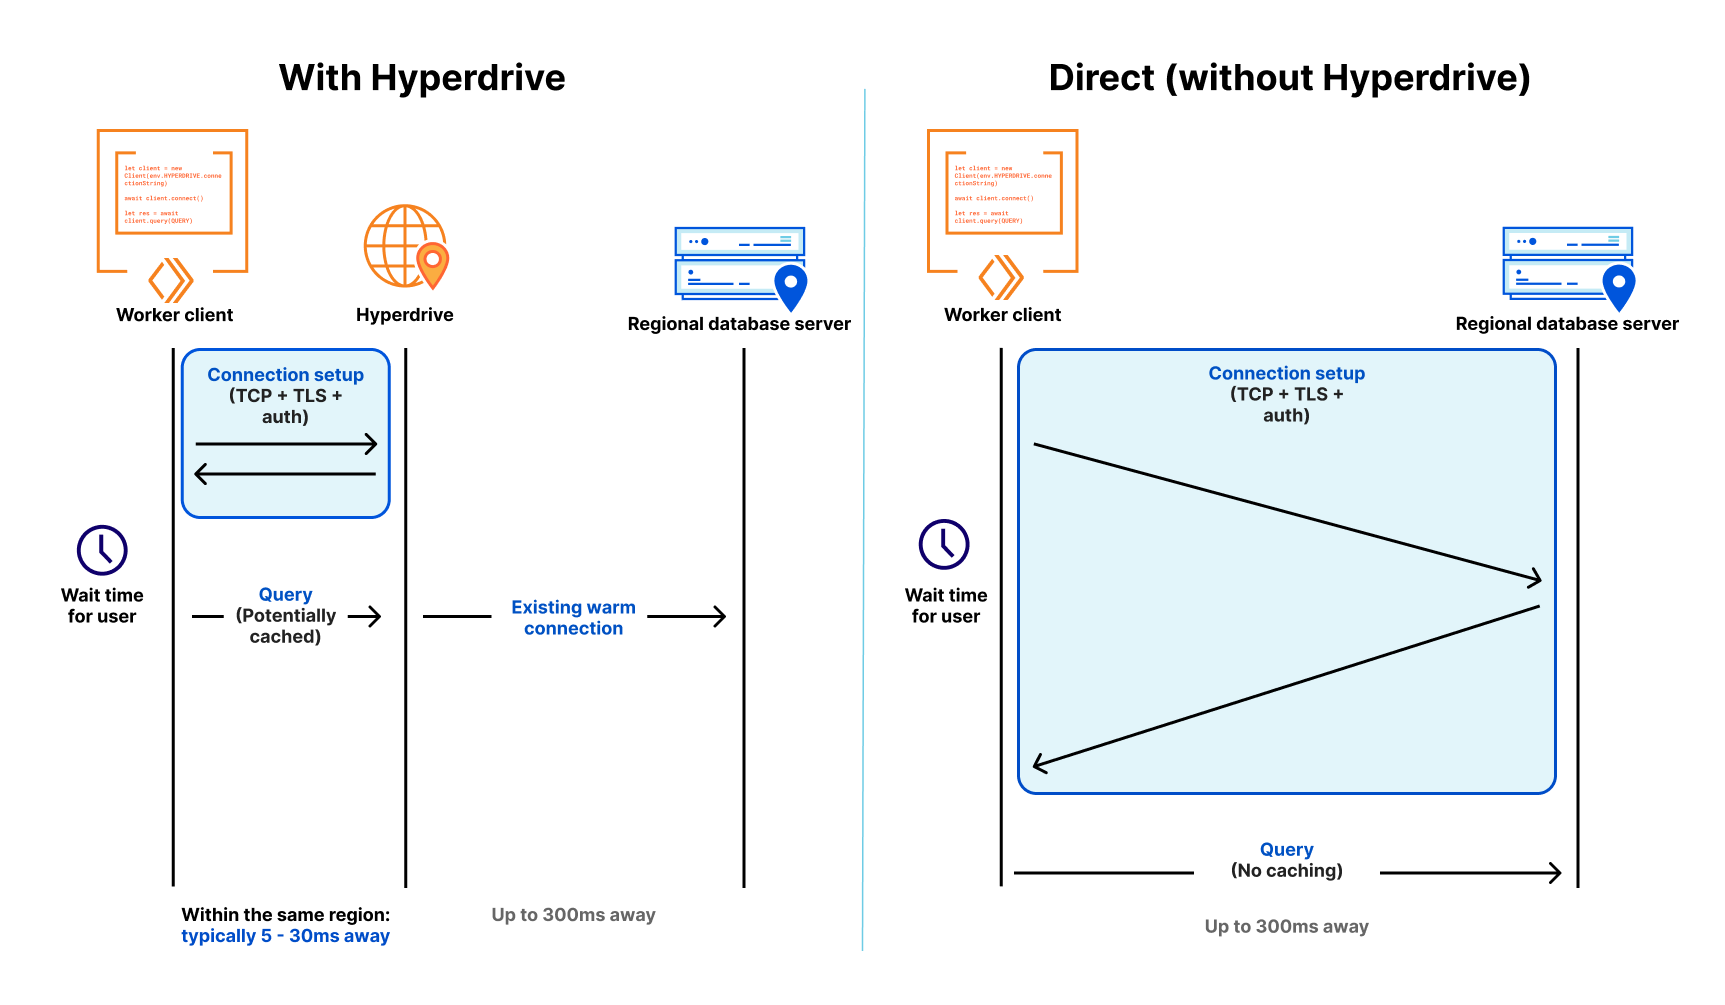


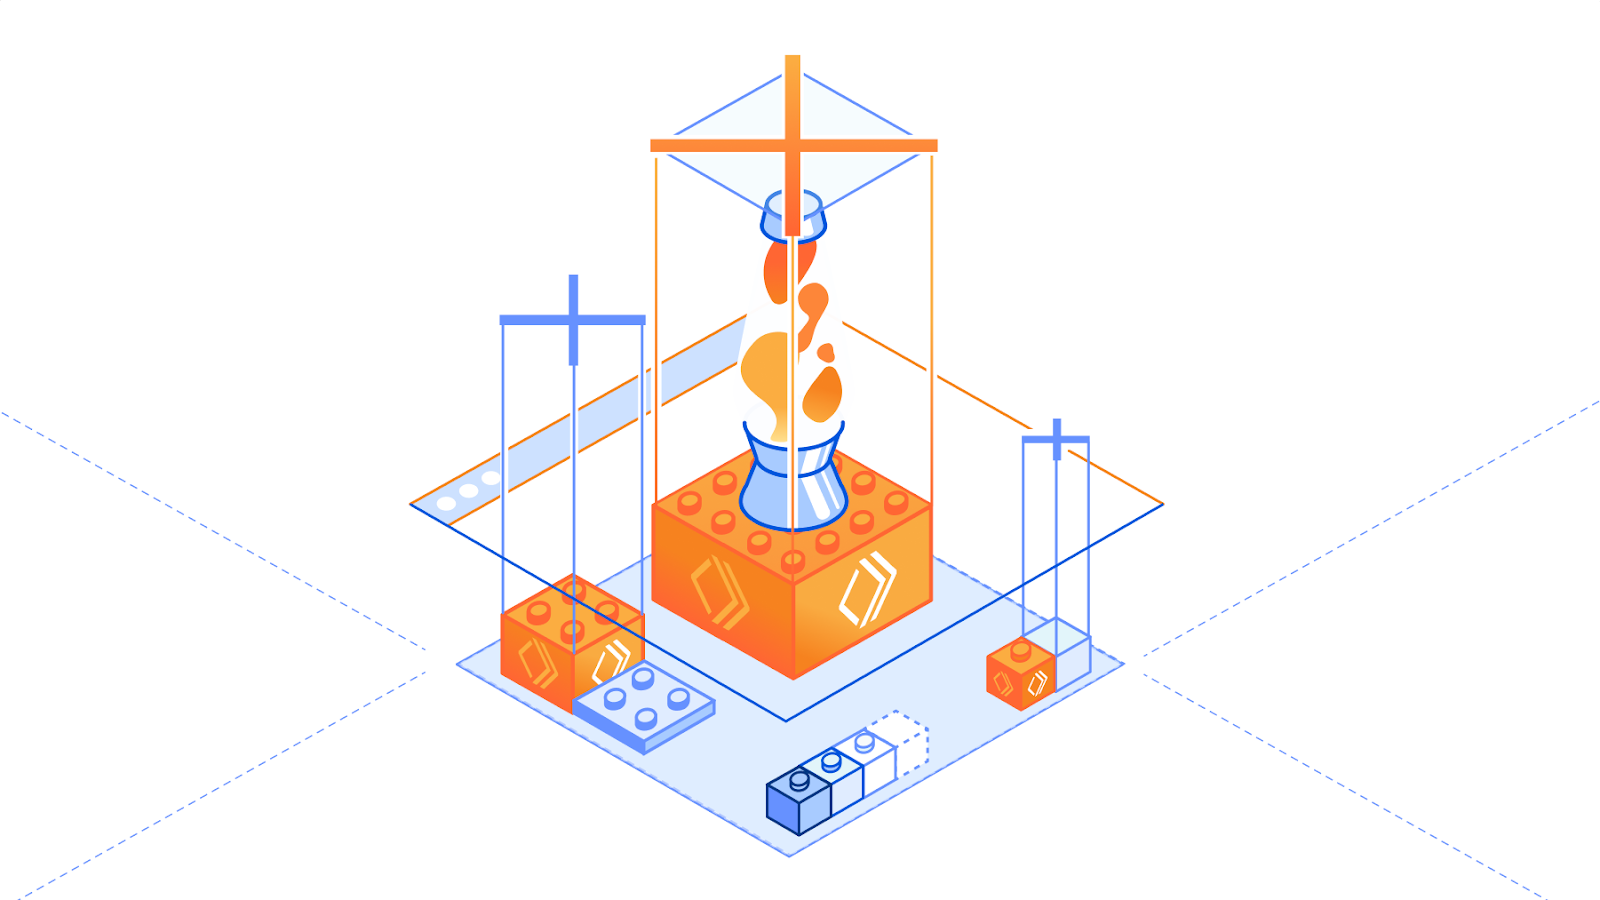
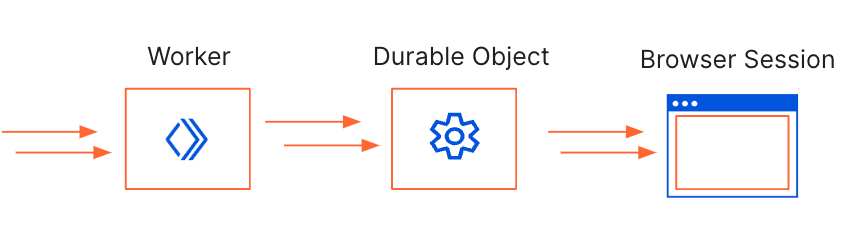
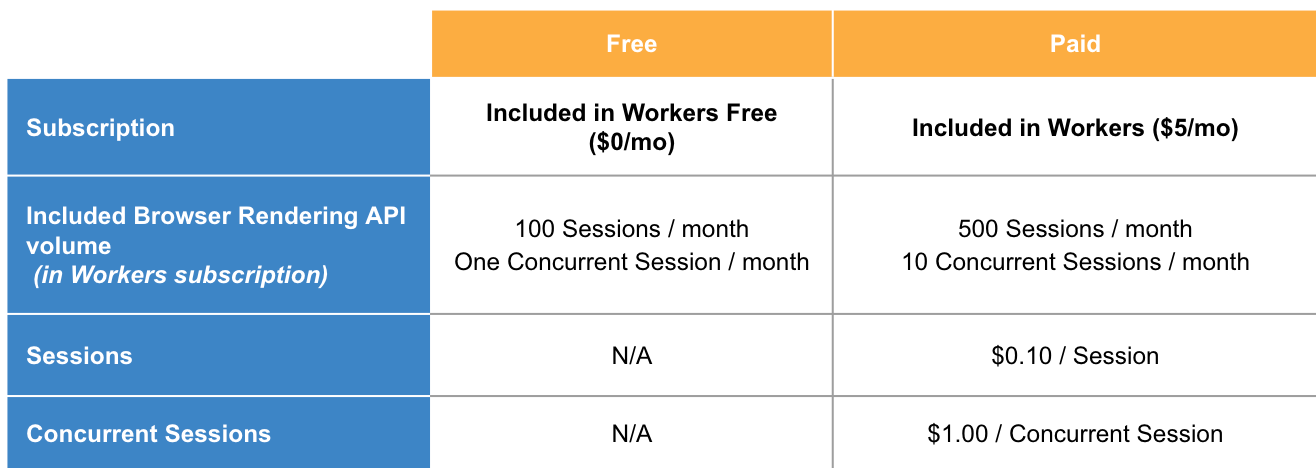


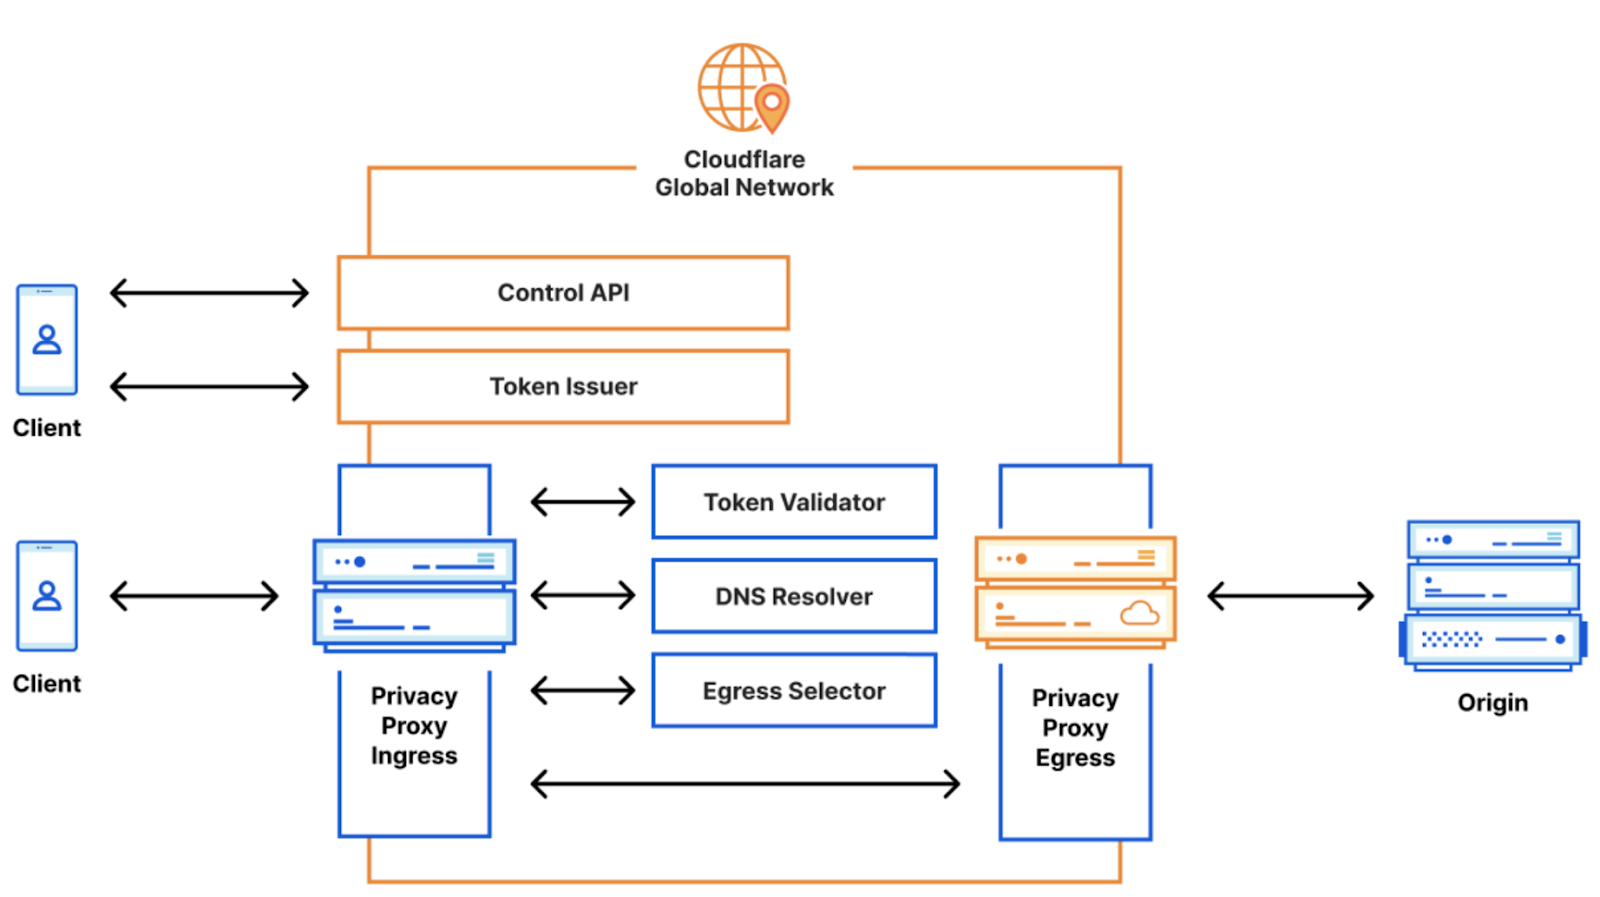


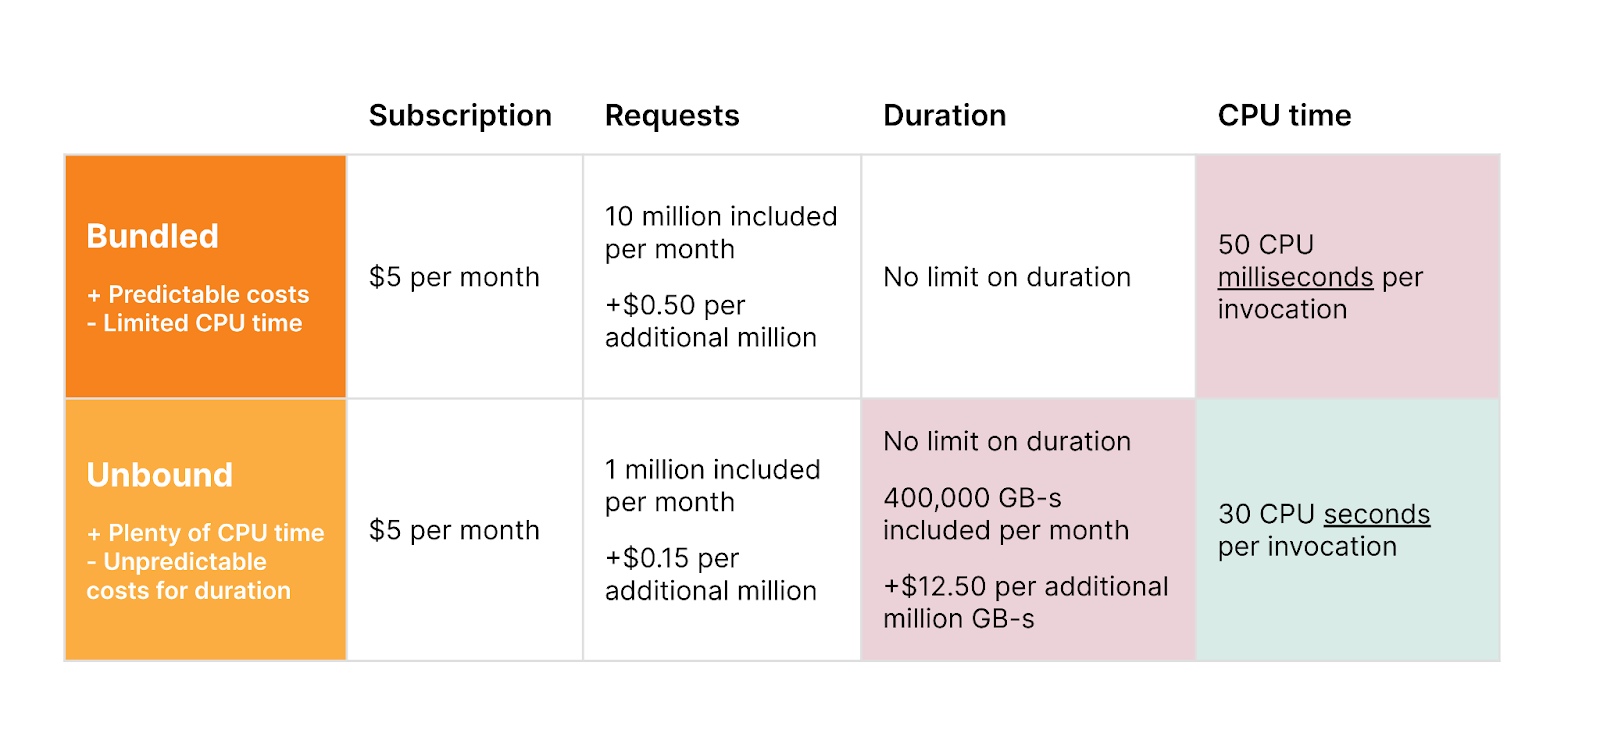

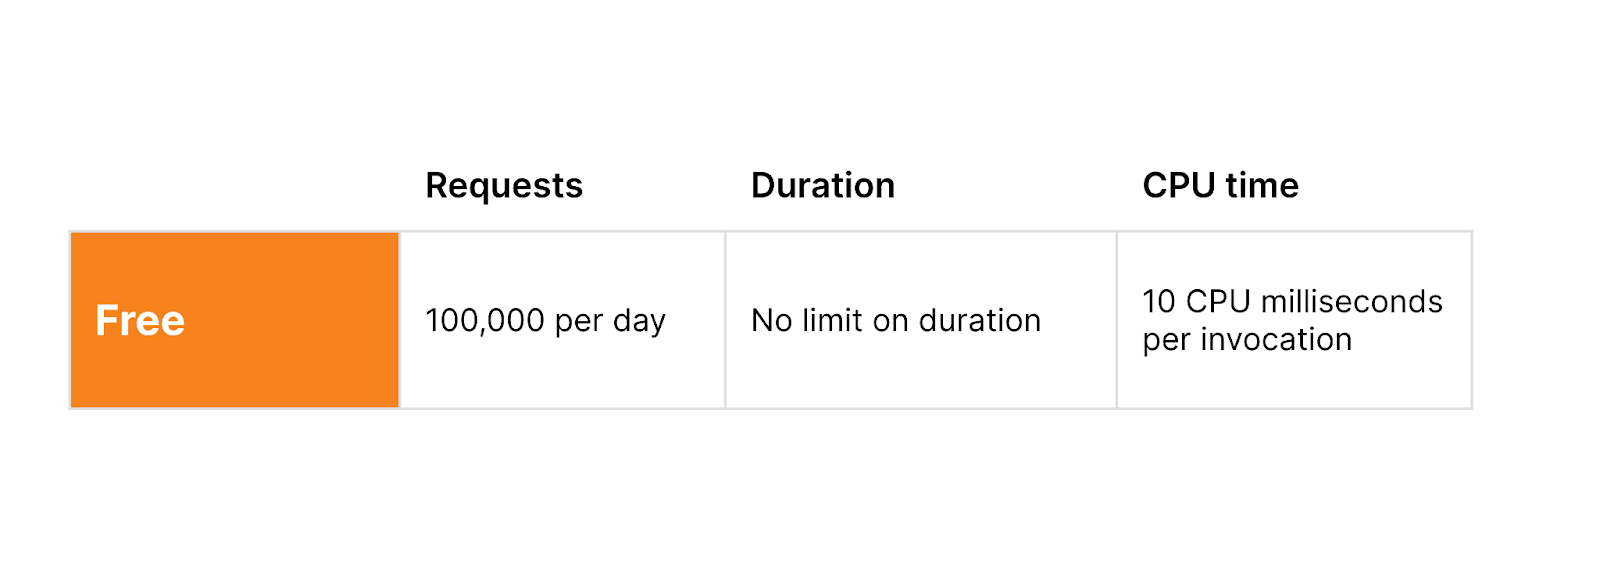
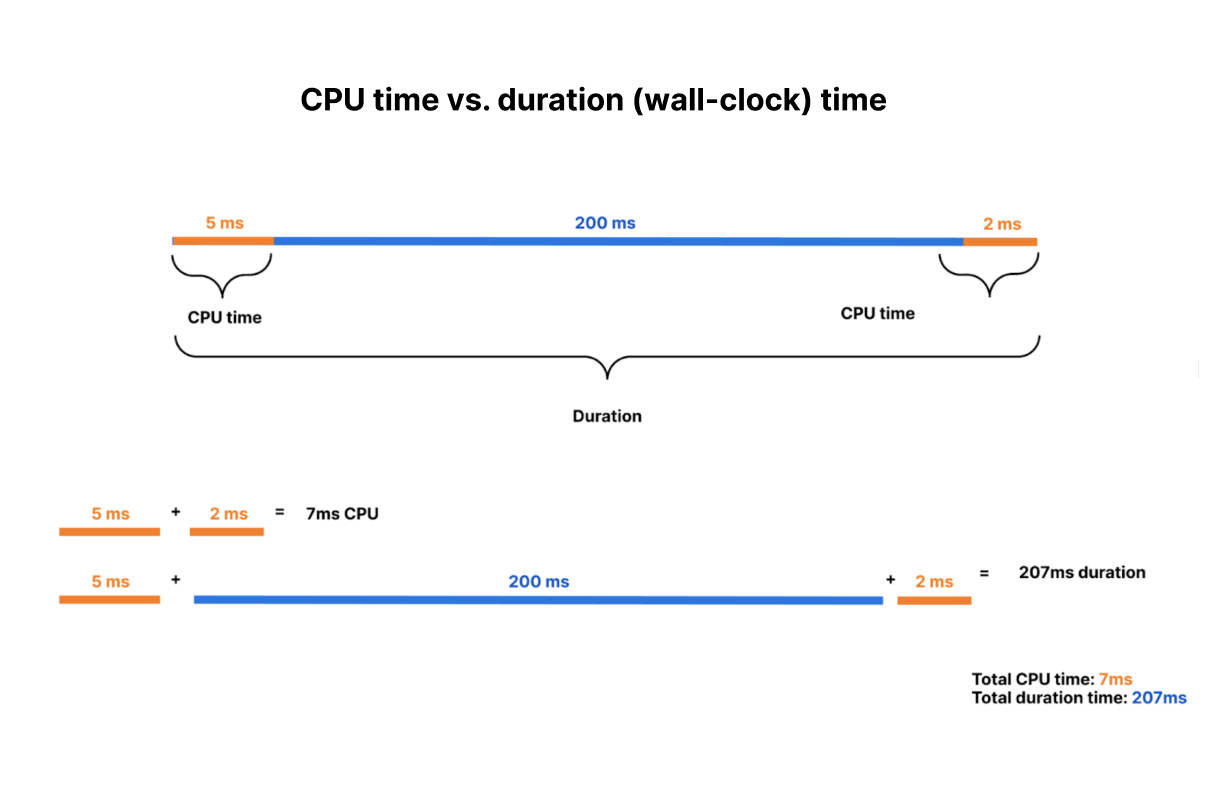

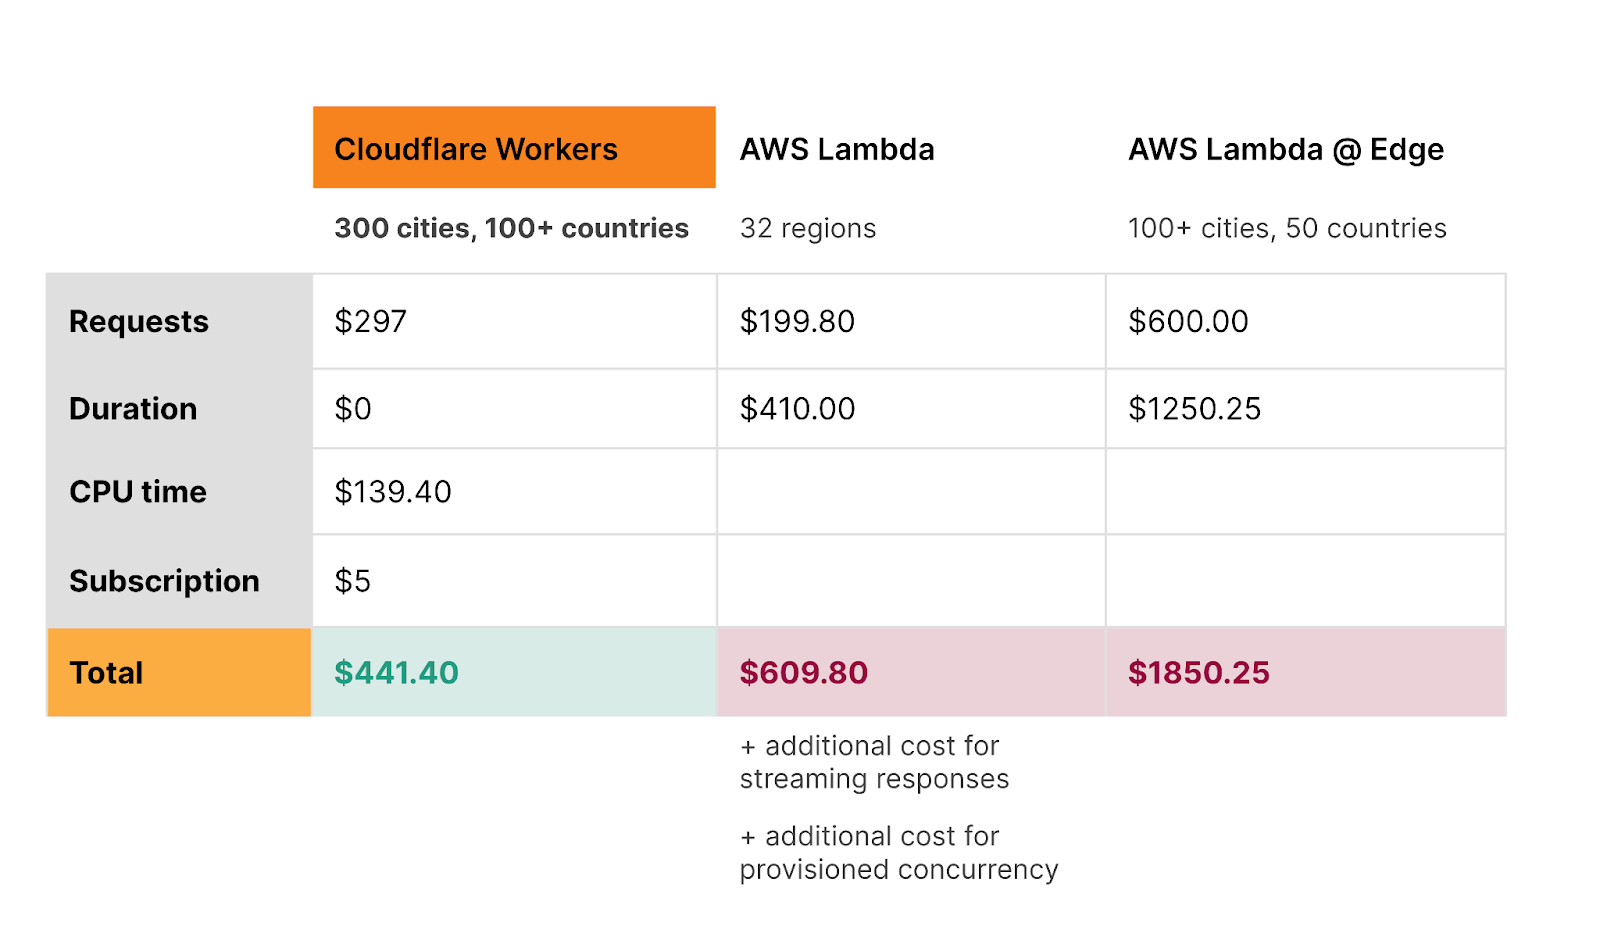
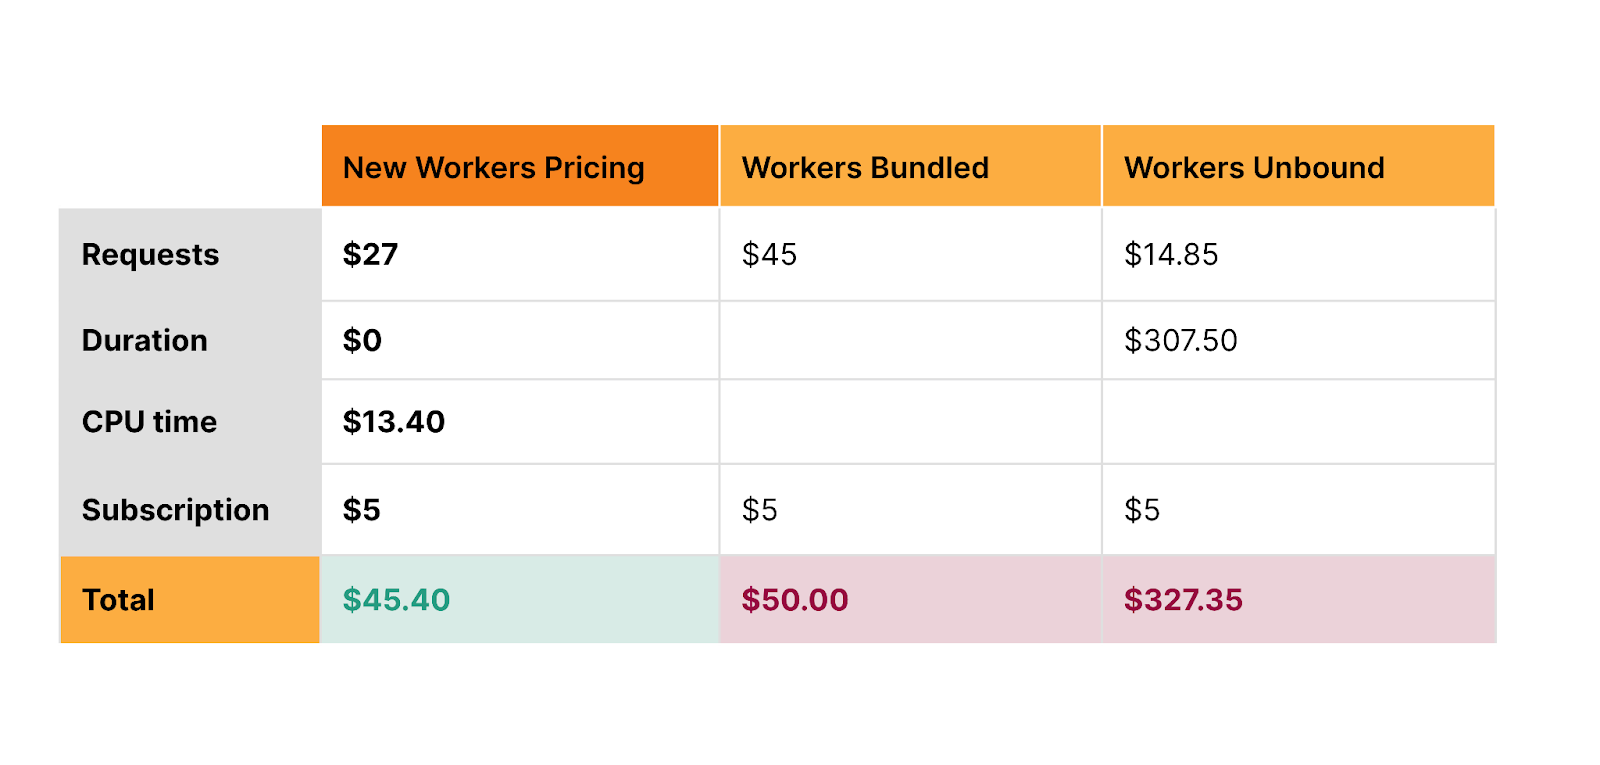
 Когато се преместих от София в с. Бойково през 2020г. реших, че ще се опитам да направя нещо за тази община. Председател съм на Фондация Възраждане на българските села и сме дарили компютърни зали на десетки селца (включително и в Украйна), та се замислих дали пък не е редно да направя нещо и за общината, в която ще живея.
 Окрилен от добрите резултати, реших да се загледам в бюджета на Община Родопи. Все пак това ми е работата – финансист съм и си мисля, че разбирам от тия работи. Понеже бях гледал заседания на общинския съвет в Пловдив си помислих, че мога да гледам и тук заседанията онлайн. „Да ама не”, както казваше Петко Бочаров. Общината нямала технологичната възможност да излъчва онлайн.

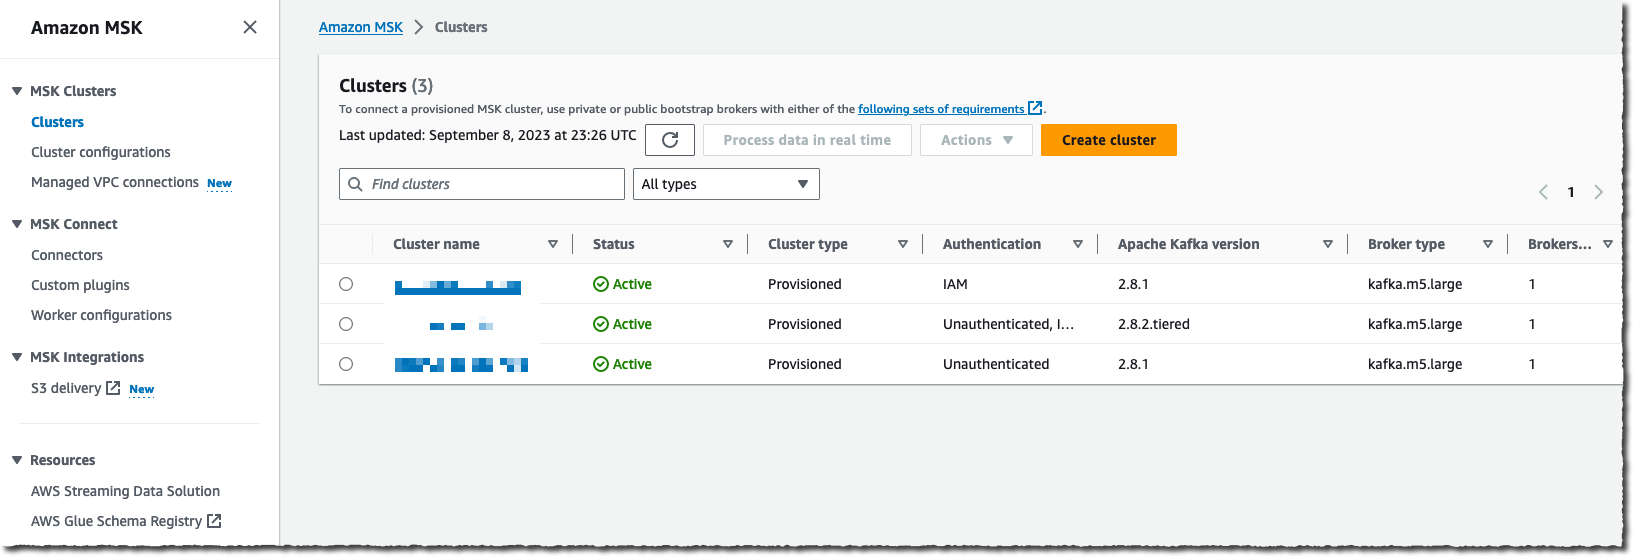
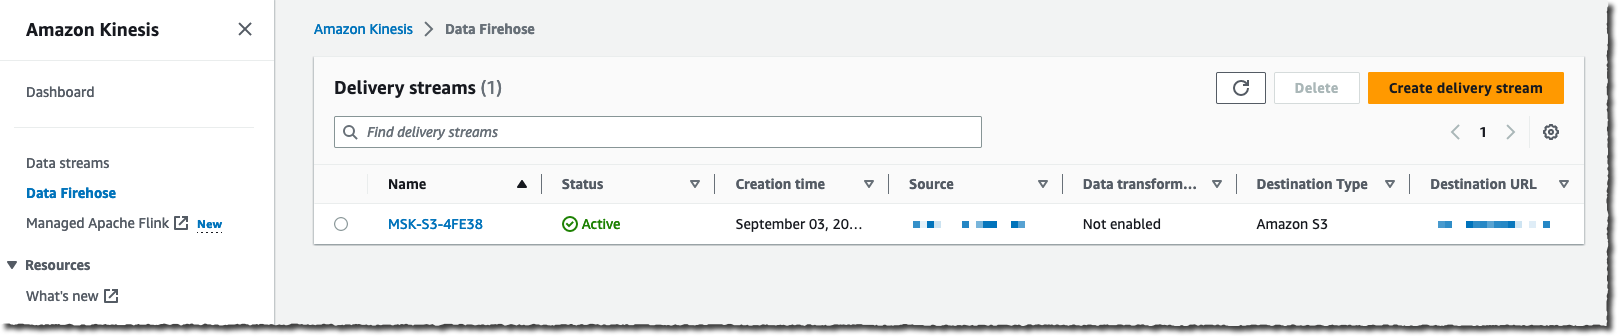


 available.