Post Syndicated from BeardedTinker original https://www.youtube.com/watch?v=-oBxEwURUhU
Security updates for Tuesday
Post Syndicated from original https://lwn.net/Articles/927548/
Security updates have been issued by Debian (dino-im and runc), Fedora (qemu), Red Hat (firefox), SUSE (chromium, containerd, docker, kernel, and systemd), and Ubuntu (graphicsmagick, linux-azure, linux-gcp, linux-oem-5.14, linux-oem-5.17, linux-oem-6.0, linux-oem-6.1, and node-url-parse).
Cloudflare’s commitment to the 2023 Summit for Democracy
Post Syndicated from Patrick Day original https://blog.cloudflare.com/cloudflare-commitment-to-the-2023-summit-for-democracy/


On Tuesday, March 28, 2023, the US Government will launch the Summit for Democracy 2023, following up on the inaugural Summit for Democracy 2021. The Summit is co-hosted by the United States, Costa Rica, Zambia, the Netherlands, and South Korea. Cloudflare is proud to participate in and contribute commitments to the Summit because we believe that everyone should have access to an Internet that is faster, more reliable, more private, and more secure. We work to ensure that the responsibility to respect human rights is embedded throughout our business functions. Cloudflare’s mission — to help build a better Internet — reflects a long-standing belief that we can help make the Internet better for everyone.
Our mission and core values dovetail with the Summit’s goals of strengthening democratic governance, respect for human rights and human rights defenders, and working in partnership to strengthen respect for these values. As we have written about before, access to the Internet allows activists and human rights defenders to expose abuses across the globe, allows collective causes to grow into global movements, and provides the foundation for large-scale organizing for political and social change in ways that have never been possible before.

What is the Summit for Democracy?
In December 2021, in an effort to respond to challenges to democracy worldwide, the United States held the first ever global Summit for Democracy. The Summit provided an opportunity to strengthen collaboration between democracies around the world and address common challenges from authoritarian threats. The United States invited over 100 countries plus the President of the European Commission and the United Nations Secretary-General. The Summit focused on three key themes: (1) defending against authoritarianism; (2) addressing and fighting corruption; and (3) promoting respect for human rights, and gave participants an opportunity to announce commitments, reforms, and initiatives to defend democracy and human rights. The Summit was followed by a Year of Action, during which governments implemented their commitments to the Summit.
The 2023 Summit will focus more directly on partnering with the private sector to promote an affirmative vision for technology by countering the misuse of technology and shaping emerging technologies so that they strengthen democracy and human rights, which Cloudflare supports in theory and in practice.
The three-day Summit will highlight the importance of the private sector’s role in responding to challenges to democracy. The first day of the Summit is the Thematic Day, where Cabinet-level officials, the private sector and civil society organizations will spotlight key Summit themes. On the second day of the Summit, the Plenary Day, the five co-hosts will each host a high-level plenary session. On the final day of the Summit, Co-Host Event Day, each of the co-hosts will lead high-level regional conversations with partners from government, civil society, and the private sector.
Cloudflare will be participating in the Thematic Day and the Co-Host Event Day in Washington, DC, in addition to other related events.
Cloudflare commitments
In advance of the 2023 Summit, the United States issued a Call to Action to the private sector to consider commitments that advance an affirmative agenda for democratic renewal. The United States encouraged the private sector to make commitments that align with the Presidential Initiative on Democratic Renewal, the Declaration on the Future of the Internet, and the Summit’s four objectives:
- Countering the misuse of technology
- Fighting corruption
- Protecting civic space
- Advancing labor rights
Cloudflare answered the United States’s call to action and made commitments to (1) help democratize post-quantum cryptography; (2) work with researchers to share data on Internet censorship and shutdowns; and (3) engage with civil society on Internet protocols and the application of privacy-enhancing technologies.
Democratizing post-quantum cryptography by including it for free, by default
At Cloudflare, we believe to enhance privacy as a human right the most advanced cryptography needs to be available to everyone, free of charge, forever. Cloudflare has committed to including post-quantum cryptography for free by default to all customers – including individual web developers, small businesses, non-profits, and governments. In particular, this will benefit at-risk groups using Cloudflare services like humanitarian organizations, human rights defenders, and journalists through Project Galileo, as well as state and local government election websites through the Athenian Project, to help secure their websites, APIs, cloud tools and remote employees against future threats.
We believe everyone should have access to the next era of cybersecurity standards–instantly and for free. To that end, Cloudflare will also publish vendor-neutral roadmaps based on NIST standards to help businesses secure any connections that are not protected by Cloudflare. We hope that others will follow us in making their implementations of post-quantum cryptography free so that we can create a secure and private Internet without a “quantum” up-charge. More details about our commitment is here and here.
Working with researchers to better document Internet censorship and shutdowns
Cloudflare commits to working with researchers to share data about Internet shutdowns and selective Internet traffic interference and to make the results of the analysis of this data public and accessible. The Cloudflare Network includes 285 locations in over 100 countries, interconnects with over 11,500 networks globally, and serves a significant portion of global Internet traffic. Cloudflare shares aggregated data on the Internet’s patterns, insights, threats and trends with the public through Cloudflare Radar, including providing alerts and data to help organizations like Access Now’s KeepItOn coalition, the Freedom Online Coalition, the Internet Society, and Open Observatory of Network Interference (OONI) monitor Internet censorship and shutdowns around the world. Cloudflare commits to working with research partners to identify signatures associated with connection tampering and failures, which are believed to be caused primarily by active censorship and blocking. Cloudflare is well-positioned to observe and report on these signatures from a global perspective, and will provide access to its findings to support additional tampering detection efforts.
Engaging with civil society on Internet protocols and the development and application of privacy-enhancing technologies
Cloudflare believes that meaningful consultation with civil society is a fundamental part of building an Internet that advances human rights. As Cloudflare works with Internet standards bodies and other Internet providers on the next-generation of privacy-enhancing technologies and protocols, like protocols to encrypt Domain Name Service records and Encrypted Client Hello (ECH) and privacy enhancing technologies like OHTTP, we commit to direct engagement with civil society and human rights experts on standards and technologies that might have implications for human rights.
Cloudflare has long worked with industry partners, stakeholders, and international standards organizations to build a more private, secure, and resilient Internet for everyone. For example, Cloudflare has built privacy technologies into its network infrastructure, helped develop and deploy TLS 1.3 alongside helping lead QUIC and other Internet protocols, improve transparency around routing and public key infrastructure (PKI), and operating a public DNS resolver that supports encryption protocols. Ensuring civil society and human rights experts are able to contribute and provide feedback as part of those efforts will make certain that future development and application of privacy-enhancing technologies and protocols are consistent with human rights principles and account for human rights impacts.
Our commitments to democratizing post-quantum cryptography, working with researchers on Internet censorship and shutdowns, and engaging with civil society on Internet protocols and the development and application of privacy-preserving technologies will help to secure access to a free, open, and interconnected Internet.
Partnering to make the Summit a success
In the lead-up to the Summit, Cloudflare has been working in partnership with the US Department of State, the National Security Council, the US Agency for International Development (USAID), and various private sector and civil society partners to prepare for the Summit. As part of our involvement, we have also contributed to roundtables and discussions with the Center for Strategic and International Studies, GNI, the Design 4 Democracy Coalition, and the Freedom Online Coalition. Cloudflare is also participating in official meetings and side events including at the Carnegie Endowment for International Peace and the Council on Foreign Relations.
In addition to the official Summit events, there are a wide range of events organized by civil society which the Accountability Lab has created a website to highlight. Separately, on Monday, March 27 the Global Democracy Coalition convened a Partners Day to organize civil society and other non-governmental events. Many of these events are being held by some of our Galileo partners like the National Democratic Institute, the International Republican Institute, Freedom House, and the Council of Europe.
Cloudflare is grateful for all of the hard work that our partners in government, civil society, and the private sector have done over the past few months to make this Summit a success. At a time where we are seeing increasing challenges to democracy and the struggle for human rights around the world, maintaining a secure, open, Internet is critical. Cloudflare is proud of our participation in the Summit and in the commitments we are making to help advance human rights. We look forward to continuing our engagement in the Summit partnership to fulfill our mission to help build a better Internet.
THG Podcast: Dog Tales
Post Syndicated from The History Guy: History Deserves to Be Remembered original https://www.youtube.com/watch?v=sH0qLK5OmlI
Security Vulnerabilities in Snipping Tools
Post Syndicated from Bruce Schneier original https://www.schneier.com/blog/archives/2023/03/security-vulnerabilities-in-snipping-tools.html
Both Google’s Pixel’s Markup Tool and the Windows Snipping Tool have vulnerabilities that allow people to partially recover content that was edited out of images.
AI education resources: What do we teach young people?
Post Syndicated from Jane Waite original https://www.raspberrypi.org/blog/ai-education-resources-what-to-teach-seame-framework/
People have many different reasons to think that children and teenagers need to learn about artificial intelligence (AI) technologies. Whether it’s that AI impacts young people’s lives today, or that understanding these technologies may open up careers in their future — there is broad agreement that school-level education about AI is important.

But how do you actually design lessons about AI, a technical area that is entirely new to young people? That was the question we needed to answer as we started Experience AI, our exciting collaboration with DeepMind, a leading AI company.
Our approach to developing AI education resources
As part of Experience AI, we are creating a free set of lesson resources to help teachers introduce AI and machine learning (ML) to KS3 students (ages 11 to 14). In England this area is not currently part of the national curriculum, but it’s starting to appear in all sorts of learning materials for young people.

While developing the six Experience AI lessons, we took a research-informed approach. We built on insights from the series of research seminars on AI and data science education we had hosted in 2021 and 2022, and on research we ourselves have been conducting at the Raspberry Pi Computing Education Research Centre.
We reviewed over 500 existing resources that are used to teach AI and ML.
As part of this research, we reviewed over 500 existing resources that are used to teach AI and ML. We found that the vast majority of them were one-off activities, and many claimed to be appropriate for learners of any age. There were very few sets of lessons, or units of work, that were tailored to a specific age group. Activities often had vague learning objectives, or none at all. We rarely found associated assessment activities. These were all shortcomings we wanted to avoid in our set of lessons.
To analyse the content of AI education resources, we use a simple framework called SEAME. This framework is based on work I did in 2018 with Professor Paul Curzon at Queen Mary University of London, running professional development for educators on teaching machine learning.
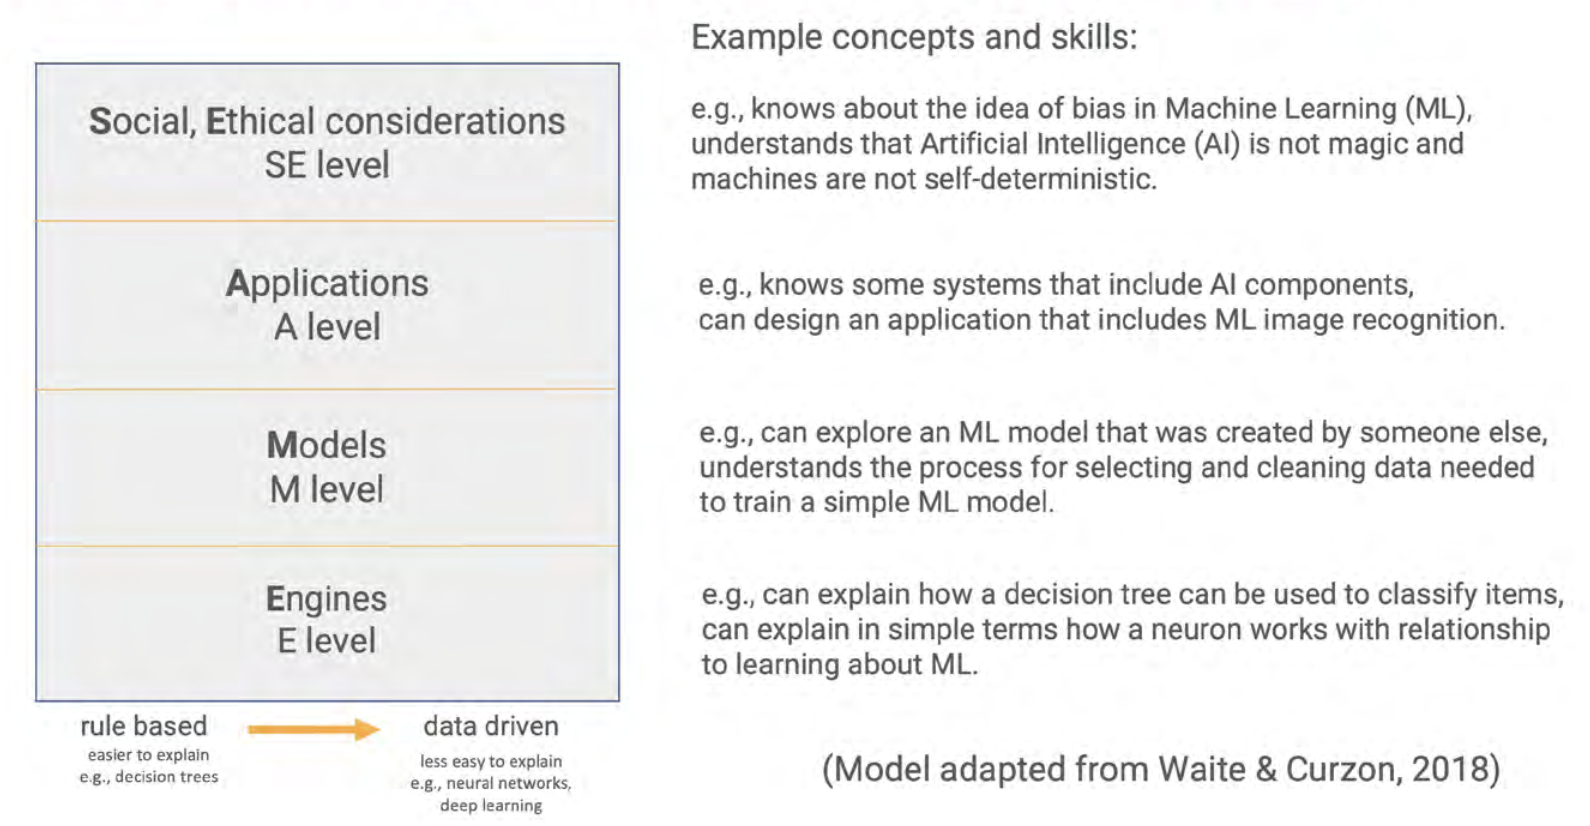
The SEAME framework gives you a simple way to group learning objectives and resources related to teaching AI and ML, based on whether they focus on social and ethical aspects (SE), applications (A), models (M), or engines (E, i.e. how AI works). We hope that it will be a useful tool for anyone who is interested in looking at resources to teach AI.
What do AI education resources focus on?
The four levels of the SEAME framework do not indicate a hierarchy or sequence. Instead, they offer a way for teachers, resource developers, and researchers to talk about the focus of AI learning activities.
Social and ethical aspects (SE)
The SE level covers activities that relate to the impact of AI on everyday life, and to its implications for society. Learning objectives and their related resources categorised at this level introduce students to issues such as privacy or bias concerns, the impact of AI on employment, misinformation, and the potential benefits of AI applications.
Applications (A)
The A level refers to activities related to applications and systems that use AI or ML models. At this level, learners do not learn how to train models themselves, or how such models work. Learning objectives at this level include knowing a range of AI applications and starting to understand the difference between rule-based and data-driven approaches to developing applications.
Models (M)
The M level concerns the models underlying AI and ML applications. Learning objectives at this level include learners understanding the processes used to train and test models. For example, through resources focused on the M level, students could learn about the different learning paradigms of ML (i.e., supervised, unsupervised, or reinforcement learning).
Engines (E)
The E level is related to the engines that make AI models work. This is the most hidden and complex level, and for school-aged learners may need to be taught using unplugged activities and visualisations. Learning objectives could include understanding the basic workings of systems such as data-driven decision trees and artificial neural networks.
Covering the four levels
Some learning activities may focus on a single level, but activities can also span more than one level. For example, an activity may start with learners trying out an existing ‘rock-paper-scissors’ application that uses an ML model to recognise hand shapes. This would cover the applications level. If learners then move on to train the model to improve its accuracy by adding more image data, they work at the models level.

Other activities cover several SEAME levels to address a specific concept. For example, an activity focussed on bias might start with an example of the societal impact of bias (SE level). Learners could then discuss the AI applications they use and reflect on how bias impacts them personally (A level). The activity could finish with learners exploring related data in a simple ML model and thinking about how representative the data is of all potential application users (M level).
The set of lessons on AI we are developing in collaboration with DeepMind covers all four levels of SEAME.
The set of Experience AI lessons we are developing in collaboration with DeepMind covers all four levels of SEAME. The lessons are based on carefully designed learning objectives and specifically targeted to KS3 students. Lesson materials include presentations, videos, student activities, and assessment questions.
We’re releasing the Experience AI lessons very soon — if you want to be the first to hear news about them, please sign up here.
The SEAME framework as a tool for research on AI education
For researchers, we think the SEAME framework will, for example, be useful to analyse school curriculum material to see whether some age groups have more learning activities available at one level than another, and whether this changes over time. We may find that primary school learners work mostly at the SE and A levels, and secondary school learners move between the levels with increasing clarity as they develop their knowledge. It may also be the case that some learners or teachers prefer activities focused on one level rather than another. However, we can’t be sure: research is needed to investigate the teaching and learning of AI and ML across all year groups.
That’s why we’re excited to welcome Salomey Afua Addo to the Raspberry Pi Computing Education Research Centre. Salomey joined the Centre as a PhD student in January, and her research will focus on approaches to the teaching and learning of AI. We’re looking forward to seeing the results of her work.
The post AI education resources: What do we teach young people? appeared first on Raspberry Pi Foundation.
Broadway’s SIX | Talks at Google
Post Syndicated from Talks at Google original https://www.youtube.com/watch?v=v9Vu9uqinLs
Comic for 2023.03.28 – Greasy Gary Again
Post Syndicated from Explosm.net original https://explosm.net/comics/greasy-gary-again
New Cyanide and Happiness Comic
Announcing General Availability of Step-by-Step Guides for Amazon Connect Agent Workspace
Post Syndicated from Veliswa Boya original https://aws.amazon.com/blogs/aws/announcing-general-availability-of-step-by-step-guides-for-amazon-connect-agent-workspace/
At AWS re:Invent 2022 we announced the availability of step-by-step guides for Amazon Connect agent workspace in preview. My colleagues who collaborated to write the announcement post wrote about some of the challenges that contact centers face with training new agents to get up to speed with their agent desktop. They also mentioned that until agents become proficient, it takes them longer to address customer needs effectively, resulting in customer dissatisfaction.
Amazon Connect agent workspace was announced in 2021 and is a single, intuitive application that provides contact center agents with the tools that are required to onboard an agent quickly, resolve issues efficiently, and improve the customer experience. With Amazon Connect agent workspace, the agent is provided with all the tools on one screen. To think of the agent workspace, imagine the agent accepting a call, a chat, or a task and being given the necessary information about the customer and the case, plus real-time recommendations, all in one place without the need to switch between applications.
Step-by-step guides enable organizations to provide customizable experiences for their agents within the workspace, enabling them to deliver exceptional service from their first day on the job by surfacing relevant information and actions that the agent requires in order to resolve customer issues faster. This is because the step-by-step experience guides agents by identifying customer issues and then recommending subsequent actions, ensuring that the agent never has to guess or rely on past experience to know what comes next. This is helpful for both new and experienced agents. New agents can learn the system and get acquainted with their job and experienced agents can keep to the organization’s standard operating procedures instead of diverging in how they handle the same type of customer request.
Because of this intuitive experience, onboarding time for agents can be reduced by up to 50 percent, time to proficiency for the agent can be reduced by up to 40 percent, and contact handle time is reduced by up to 35 percent ultimately resulting in an improved and consistent customer experience.
A High-Level Overview of Step-by-Step Guides
During the announcement of step-by-step guides in preview, I was fascinated to learn that the experience was researched and developed in the context of Amazon Customer Service. However, step-by-step guides can also be generalized to apply to other types of organizations and use cases including the following:
- Retail – You can customize guides to suit your retail organization, for example, guides for returning a purchase by a customer.
- Financial Services – An example would be adding an authorized user to a credit card. Using guides, the agent can help the customer capture new user information and handle approvals through a single workflow that is consolidated within the guides.
- Hospitality – A great example here would be creating a new reservation at a hotel by consolidating all the processes involved into a single workflow.
- Embed as a Widget – With this, you can embed guides as a widget in your existing CRM or use APIs to bring guides to a custom workspace that you are already using in your organization.
The preview announcement post provides a deep dive into how to get started with step-by-step guides. It also shows how to deploy a sample guided experience and demonstrates how to customize guides to meet business needs. In this post we look at a high-level overview of what the agent, and the manager, can expect from step-by-step guides.
Agent experience
Step-by-step guides help with onboarding and ramping up of new agents and making them proficient faster by surfacing contextually relevant information and actions needed by agents. The intuitive experience of step-by-step guides provides agents with clear instructions of what they should be doing at any point in time when handling a particular customer case and supports agents in managing complex cases more accurately by automatically identifying issues.
As an example, when a customer calls, the agent workspace automatically presents the agent with the likely issue based on the customer’s history or current context (for instance, making a flight reservation). Then, the step-by-step experience guides the agent through the actions needed to resolve the issue quickly (such as booking a hotel after the flight reservation has been completed).
The following screenshot provides a visual image of how this might look.

In the UI, the agent is provided with a sequence of simple UI pages to let them focus on one thing at a time, whether that’s an input field or a question to ask the customer. They can go step by step, getting the right information that they need to help the customer’s issue. Along the way, the agent receives scripting that they can read to the customer upon successful completion of the process.
The agent can always escape out of this workflow if it turns out that the workspace surfaced the wrong one, and they can find other workflows by searching for the correct one. This allows them to self-serve and find the right solution in case what was predicted by the step-by-step guides based on the context of the contact wasn’t perfectly aligned to what they needed.
Manager experience
Amazon Connect already has a low-code, no-code builder known as Amazon Connect Flows. Flows provide a drag-and-drop experience for building IVRs, chatbots and routing logic for customers. To enable the same low-code, no-code configuration of step-by-step guides, managers are now provided with a new block within Flows known as the Show View block. The drag-and-drop experience of configuring step-by-step guides ensures that the manager no longer needs to have developers write code to build the custom workflows for the agent. Managers also no longer need to rely on static and difficult-to-follow instructions to use later to train agents.
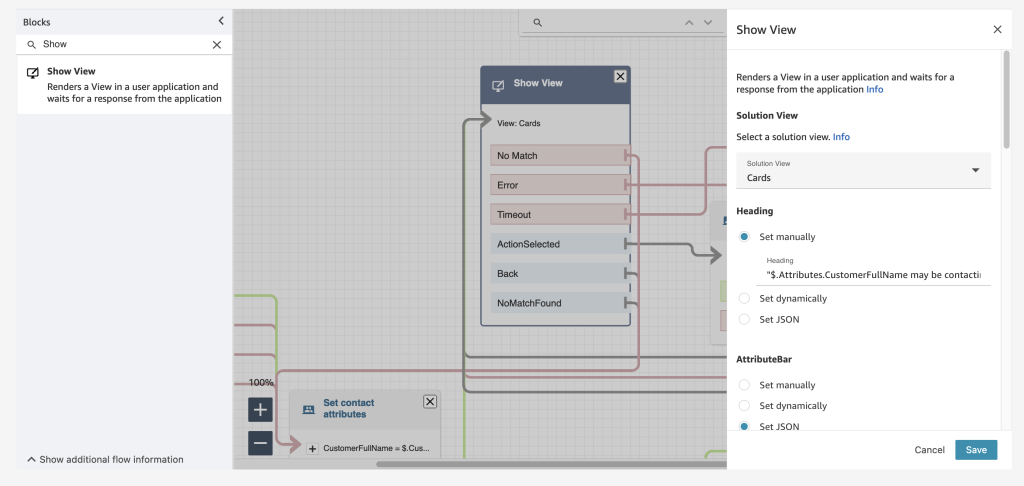
Example of the Show View block within the Contact Flow editor
Step-by-step guides are quickly created within the show view block with the help of five pre-configured views. Views are UI templates that can be used to customize the agent’s workspace, and each view is configurable. For example, you can use views to display contact attributes to an agent, provide forms for entering disposition codes, provide call notes, and present UI pages for walking agents through step-by-step guides.
The following example shows a view that we can use to create a guide for an agent that needs to book a round-trip flight for a customer. Booking this trip requires scheduling a flight to and from the destination, collecting traveler information, and asking about additional add-ons. With the form view, agents don’t have to recall all these specific steps; they can follow the wizard in their agent workspace. For each step, the agent is given form fields to fill in or options to choose from in order to quickly book the customer’s flight.

Example UI (View)
Step-by-step guides also help business operation teams figure out new ways to ensure that their agents are operating well and adjusting to new use cases. Step-by-step guides provide managers with insights into what agents do during a contact. During a workflow, data about what is shown to an agent, the decisions they made, the amount of time they spent on different steps, and what actions they took is captured and stored as a log record. Managers can use this data to improve their workflows and the agent and customer experiences.
Conclusion
In this post we discussed what step-by-step guides offer the agent and the manager of a contact center. Our customers are excited about how the guided experience consolidates actions into workflows and reduces the number of screens for their agents – at times from five screens down to one. In addition to all the benefits we’ve discussed in this post, guides provide you with opportunities to save between 15 – 20 percent on maintenance cost.
Now Available
Step-by-step guides are now generally available in all Regions where Amazon Connect is available, except AWS GovCloud (US-West) and Africa (Cape Town).
To learn more, refer to the Getting started with step-by-step guides for the Amazon Connect agent workspace post, and please send feedback to AWS re:Post for Amazon Connect or through your usual AWS support contacts.
– Veliswa x.
How French Broadcaster TF1 Used AWS Cloud Technology and Expertise to Bring the FIFA World Cup to Millions
Post Syndicated from Sébastien Stormacq original https://aws.amazon.com/blogs/aws/how-french-broadcaster-tf1-used-aws-cloud-technology-and-expertise-to-bring-the-fifa-world-cup-to-millions/
Three years before millions of viewers saw, arguably, one of the most thrilling World Cup Finals ever broadcast, TF1, the leading private TV channel in France, started a project to redefine the foundations of its broadcasting platform, including adopting a new cloud-based architecture.
They, and all other broadcasters, have been observing diminishing audiences for traditional over-the-air broadcasting and increasing popularity of digital platforms, such as smart TVs, and boxes like FireTV, ChromeCast, and AppleTV, as well as laptops, tablets, and mobile phones. According to Thierry Bonhomme, CTO of eTF1 (the group within TF1 in charge of digital platforms) whom I recently interviewed for the AWS French Podcast, digital broadcasting now accounts for 20–25 percent of TF1’s total audience.
 This online and mobile usage drives very specific traffic patterns on IT systems: a huge peak of connections and authentications in the few minutes before the start of a game and millions of video streams that must be delivered reliably over a variety of changing network qualities. In addition to these technical challenges, there is also an economic challenge: to deliver advertisements at key moments, such as before a national anthem or during a 15-minute half-time. The digital platform sells its own set of commercials, which are different from the commercials broadcast over the air, and might also be different from region to region. All these video streams have to be delivered to millions of viewers on a wide range of devices and a variety of network conditions: from 1 Gbs fiber at home down to 3 G networks in remote areas.
TF1’s approach to readiness included redesigning its digital architecture, setting up metrics showing how the new system is performing, and defining processes, roles and responsibilities for people in the team. As part of this preparation, AWS helped TF1 prepare their system to meet their scalability, performance, and security requirements.
In my conversation with Thierry, he described the two main objectives the company had when designing its new technical architecture for the future of broadcasting: first, the scalability of the platform and second, meet the demand for performance. Scalability is key to absorbing the peaks of concurrent viewers. And performance is required to ensure that the video streams start quickly (in less than 3 seconds) and there is no interruption of the video player (known as re-buffering). After all, nobody wants to know their team just scored by hearing their neighbors yelling before seeing it happen on the screen they’re watching.
The Technology
Starting in 2019, TF1 started to redesign its digital broadcasting architecture and to rewrite significant parts of the code, such as the back-end API or the front-end applications running on set-top boxes, on Android, or on iOS devices. They adopted a micro service architecture, deployed on Amazon Elastic Kubernetes Service (EKS) and written in the Go programming language for maximum performance. They designed a set of REST and GraphQL APIs to define the contracts between front and back-end applications, and an event-driven architecture with Apache Kafka for maximum scalability. They adopted multiple content delivery networks, including Amazon CloudFront, to reliably distribute the video streams to client devices. In August 2020, TF1 got a chance to test the new platform on a large-scale sporting event when Bayern Munich beat Paris Saint Germain 1-0 at the UEFA European Champion League.

Here’s a peek at what happens from the moment the action is shot on the field to the moment you see it on your mobile device: The high-quality video stream first lands in the TF1 tower, located in Paris, where hardware encoders create the necessary videos streams adapted to your device. AWS Elemental Live hardware encoders are able to generate up to eight different encodings: 4K for TVs, high-definition (1080), standard definition (720), and a variety of other formats suited to a wide range of mobile devices and network bandwidth. (This extra video encoding step is one of the reasons why you might sometimes observe a extra latency between the video you receive on your traditional TV and the feed you receive on your mobile device.) The system sends the encoded videos to AWS Elemental Media Package for packaging and, finally, to the CDNs where the player applications fetch the video segments. The player applications select the best video encoding depending on your device size and current network bandwidth available.
At the end of 2021, one year before millions watched French player Kylian Mbappé score a hat trick (three goals) for the first time in a World Cup final since 1966, TF1 started preparing for the big event by identifying risks based on previous experiences and areas needing improvement. Thierry described how they built hypotheses of the likely audience size based on different game scenarios: the longer the French national team might stay in the competition, the higher the expected traffic. They classified risks for each phase of the tournament (selection pools, quarter-final, semi-final, and final). Based on these scenarios, they figured that the platform must be able to sustain 4.5 million viewers connecting to the platform 15 minutes before the start of a game (that’s 5,000 new viewers every second).
This level of scalability requires preparation from TF1’s team but also all external systems in use, such as the AWS cloud services, the authentication and authorization service, and the CDN services.
A viewer arrival triggers multiple flows and API calls. The viewer must authenticate, and some must create a new account or reset their passwords. Once authenticated, the viewer sees the homepage that, in turn, triggers multiple API calls, one of them to the catalog service. When the viewer selects a live stream, other API calls are made to receive the video stream URL. Then the video part kicks in. The client-side player connects to the chosen CDN and starts to download video segments. Once the video is playing, the platform must ensure the stream is delivered smoothly, with high quality and no drop that would cause a re-buffering. All these elements are key to ensuring the best possible viewer experience.
The Preparation
Six months before France made it to the final and squared off against Argentina, TF1 started to work closely with their vendors, including AWS, to define requirements, reserve capacity, and start to work on test and execution plans. At this point, TF1 engaged with AWS Infrastructure Event Management, a dedicated program of the AWS enterprise support plan. Our experts offer architecture and guidance and operational support during the preparation and execution of planned events, such as shopping holidays, product launches, migrations – and in this case, the largest football (soccer) event in the world. For these events, AWS helps customers assess operational readiness, identify and mitigate risks, and execute confidently with AWS experts by their side.
Special care was given to test the scalability of the API. The TF1 team developped a load-testing engine to simulate users connecting to the platform, authenticating, selecting a program, and starting a video stream. To closely simulate real traffic, TF1 used another hyperscale cloud provider to send requests to their AWS infrastructure. The testing allowed them to define the correct metrics to observe in their dashboards and the correct values to generate alarms. Thierry said the first time the load simulator ran full speed, simulating 5,000 new connections per second, it crashed the entire back end.
But like any world class team, TF1 used this to their advantage. They took 2–3 weeks to tune the system. They eliminated redundant API calls from client applications and applied aggressive caching strategies. They learned how to scale their back-end platform in response to such traffic. They also learned to identify the value of key metrics under load. After a couple of back-end deployments and new releases for their Android and iOS apps, the system successfully passed the load test. It was a month before the start of the event. At that moment, TF1 decided to freeze all new developments or deployments until the first kickoff in Qatar, unless critical bugs were found.
Monitoring and Planning
The technological platform was only one piece of the project, Thierry told me. They also designed metric dashboards using Datadog and Grafana to monitor key performance indicators and detect anomalies during the event. Thierry noted that when observing average values, they often miss parts of the picture. For example, he said, observing a P95 percentile value instead of an average shows the experience for five percent of your users. When you have three million of them, five percent represents 150K customers, so it is important to know what their experience is. (Incidentally, this percentile technique is used routinely at Amazon and AWS across all service teams, and Amazon CloudWatch has built-in support to measure percentile values.)
TF1 also prepared for the worst, he said, including the specter of having three million people staring at a black screen during a game. TF1 involved community managers and social media owners early on, and they prepared press releases and social media messages for multiple scenarios. The team also planned to gather all key team members together in a “war room” during each game to reduce communication and reaction time if something needed immediate action. This team included the AWS technical account manager, their counterpart from the authentication service, and other CDN vendors. AWS also had on-call engineers from service teams and premium support team monitoring the health of our services and ready to react in case something went wrong.
The Attacks Weren’t Just on the Field
Three key moments at the start of the tournament provided opportunities to test the platform for real: the opening ceremony, the first game, and particularly for TF1’s audience, the first game for the French team. As the tournament played out over the following weeks — with increased intensity, suspense, and load on IT systems as the French team progressed — the TF1 team would reevaluate its traffic estimates and conduct debriefs after each game. But while the intensity of the action was unfolding on the field, TF1’s team had some behind-the-scenes excitement of its own.
Starting in the quarter final, the team noticed unusual activity from a wide range of distributed IP addresses, and they determined that the system was under a large distributed denial of service (DDOS) attack from a network of compromised machines; someone was trying to take down the service and prevent millions of people from watching. TF1 is accustomed to these types of attacks, and their dashboard helped to identify the traffic patterns in real time. Services such as AWS Shield and AWS Web Application Firewall helped to mitigate the incident without impacting the viewer experience. The TF1 security team and AWS experts conducted further analysis to proactively block some patterns of traffic and IP addresses for the next game.
Still, the intensity of the attacks increased during the semi-finals and final game, when it peaked at 40 millions of requests for a ten-minute period. “These attacks are a cat-and-mouse game,” said Thierry: attackers try new strategies and apply new patterns, but the team in the war room detects them and dynamically updates the filtering rules to block them before viewers can even detect a change in the quality of the service. The long and detailed preparation served its purpose, and everybody knew what to do. Thierry reported that the attacks were successfully mitigated with no consequences.
The Thrilling Finale
 By the time France took to the pitch on Dec. 18, 2022, TF1 knew they would break records on the platform. Thierry said the traffic was higher than estimated, but the platform absorbed it. He also described that during the first part of the game, when Argentina was leading, the TF1 team observed a slow decline of connections… that is, until the first goal scored by MBappé 10 minutes before the end of the game. At that point, all dashboards showed a sudden return of viewers for the thrilling last moments of the game. At peak, more than 3.2 million digital players were connected at the same time, delivering 3.6 terabits per second of outgoing bandwidth through all four CDNs.
Across the globe, Amazon CloudFront also helped 18 broadcasters deliver video streams. In all, over 48 million unique client IPs connected to one of 450+ edge locations globally during the tournament, peaking at just under 23 terabits per second across these customer distributions during the final game of the tournament.
The Future
While Argentina ultimately triumphed and Lionel Messi achieved his long-sought World Cup win, the 2022 FIFA World Cup proved to the team at TF1 that their processes, their architecture, and their implementation are able to deliver a high-quality viewing experience to millions. The team is now confident the platform is ready to absorb the next planned large-scale events: the World Cup of Rugby in September 2023 and the next French presidential election in 2027. Thierry concluded our conversation predicting digital broadcasting will eventually attain a larger audience than over-the-air, and having 3+ millions simultaneous viewers will become the new normal.
If your company is also looking to transform its business using the power of cloud computing, consult with one of our AWS Enterprise support advisors today.
AWS Glue crawlers support cross-account crawling to support data mesh architecture
Post Syndicated from Sandeep Adwankar original https://aws.amazon.com/blogs/big-data/aws-glue-crawlers-support-cross-account-crawling-to-support-data-mesh-architecture/
Data lakes have come a long way, and there’s been tremendous innovation in this space. Today’s modern data lakes are cloud native, work with multiple data types, and make this data easily available to diverse stakeholders across the business. As time has gone by, data lakes have grown significantly and have evolved to data meshes as a way to scale. Thoughtworks defines a data mesh as “a shift in a modern distributed architecture that applies platform thinking to create self-serve data infrastructure, treating data as the product.”
Data mesh advocates for decentralized ownership and delivery of enterprise data management systems that benefit several personas. Data producers can use the data mesh platform to create datasets and share them across business teams to ensure data availability, reliability, and interoperability across functions and data subject areas. Data consumers now have better data sharing with data mesh and federation across business units without compromising data security. The data governance team can support distributed data, where all data is accessible to those with the proper authority to access it. With data mesh, data doesn’t have to be consolidated into a single data lake or account and can remain within different databases and data lakes. An essential capability needed in such a data lake architecture is the ability to continuously understand changes in the data lakes in various other domains and make those available to data consumers. Without such a capability, manual work is needed to understand producers’ updates and make them available to consumers and governance.
AWS customers use a modern data architecture to facilitate governance and data sharing across logical or physical governance boundaries to create data domains aligned to lines of business. Each line of business creates and manages their dataset on Amazon Simple Storage Service (Amazon S3) and uses AWS Glue crawlers to discover new datasets and register them to the AWS Glue Data Catalog, add new tables and partitions, and detect schema changes. These datasets are shared with data consumers that access the data using services like Amazon Athena, Amazon Redshift, Amazon EMR, and more.
In the post Introducing AWS Glue crawlers using AWS Lake Formation permission management, we introduced a new set of capabilities in AWS Glue crawlers and AWS Lake Formation that simplifies crawler setup and supports centralized permissions for in-account and cross-account crawling of S3 data lakes. In this post, we demonstrate the same capability for a data mesh architecture in which we establish a central governance layer to catalog the data owned by the data producer and share it with the data consumer for ease of discovery. The AWS Glue crawler cross-account capability allows you to crawl data sources in different producer accounts while still having those changes cataloged in a centralized governance account. Customers prefer the central governance experience over writing bucket policies separately in each bucket owning the account of a data mesh producer. To build a data mesh architecture, now you can author permissions in a single Lake Formation governance to manage access to data locations and crawlers spanning multiple accounts in the data mesh.
According to the Allstate Corporation:
“By leveraging the power of AWS Lake Formation in our modern data architecture, we will be able to further unlock the potential of our data and empower our analytics community to drive innovation and build data-driven applications. The granular data access and collaboration provided by this architecture will enable us to build a truly unified data and analytics experience, bringing us one step closer to realizing our vision of becoming a fully data-driven enterprise.”
– Prashant Mehrotra, Director – Machine Learning and R&D, Allstate
In this post, we walk through the creation of a simplified data mesh architecture that shows how to use an AWS Glue crawler with Lake Formation to automate bringing changes from data producer domains to data consumers while maintaining centralized governance.
Solution overview
In a data mesh architecture, you have several producer accounts that own S3 buckets, several consumer accounts who wants to access shared datasets, and a central governance account to manage data shares between producers and consumers. This central governance account doesn’t own any S3 bucket or actual tables.
The following figure shows a simplified data mesh architecture with a single producer account, a centralized governance account, and a single consumer account. The data mesh producer account hosts the encrypted S3 bucket, which is shared with the central governance account. The central governance account registers the S3 bucket with Lake Formation using an AWS Identity and Access Management (IAM) role, which has permissions to the S3 bucket and AWS Key Management Service (AWS KMS). The central account creates the database for storing the dataset schema and shares it with the producer account. The producer account, as the S3 bucket owner, runs a crawler to crawl the buckets registered with the central account using Lake Formation permissions and populates the database. Now the shared database with new datasets are available to share with consumers in the data mesh. The central governance account can now share the database with a consumer admin, who can delegate access to other personas (such as data analysts) in the consumer account for data access.

In the following sections, we provide AWS CloudFormation templates to set up the resources in each account. Then we provide the steps to configure the crawler, manage permissions and sharing, and validate the solution by running queries with Athena.
Prerequisites
Complete the following steps in each account (producer, central governance, and consumer) to update the Data Catalog settings to use Lake Formation permissions to control catalog resources instead of IAM-based access control:
- Sign in to the Lake Formation console as admin.
- If this is the first time accessing the Lake Formation console, add yourself as the data lake administrator.

- In the navigation pane, under Data catalog, choose Settings.
- Uncheck Use only IAM access control for new databases.
- Uncheck Use only IAM access control for new tables in new databases.
- Keep Version 3 as the current cross-account version.
- Choose Save.

Set up resources in the central governance account
The CloudFormation template for the central account creates a CentralDataMeshOwner user assigned as Lake Formation admin. The CentralDataMeshOwner user in the central governance account performs the necessary steps to share the central catalogs with the producer and consumer accounts. The CentralDataMeshOwner user also sets up a custom Lake Formation service role to register the S3 data lake location. Complete the following steps:
- Log in to the central governance account console as IAM administrator.
- Choose Launch Stack to deploy the CloudFormation template:

- For DataMeshOwnerUserName, keep the default (
CentralDataMeshOwner). - For ProducerAWSAccount, enter the producer account ID.
- Create the stack.
- After the stack launches, on the AWS CloudFormation console, navigate to the Resources tab of the stack.
- Note down the value of
RegisterLocationServiceRole. - Choose the
LFUsersPasswordvalue to navigate to the AWS Secrets Manager console. - In the Secret value section, choose Retrieve secret value.
- Note down the secret value for the password for IAM user
CentralDataMeshOwner.
Set up resources in the producer account
The CloudFormation template for the producer account creates the following resources:
- IAM user
LOBProducerSteward - S3 bucket
retail-datalake-<producer account id >-<producer region> - KMS key used for bucket encryption
- Required S3 bucket policies to provide access to the central governance account
- AWS Glue crawler and crawler IAM role with necessary permissions
Complete the following steps:
- Log in to the producer account console as IAM administrator.
- Choose Launch Stack to deploy the CloudFormation template:
- For CentralAccountID, enter the central account ID.
- For CentralAccountLFServiceRole, enter the value of
RegisterLocationServiceRolefrom CloudFormation noted earlier. - Create the stack.
- When the stack is complete, on the AWS CloudFormation console, navigate to the Resources tab of the stack.
- Note down the
AWSGlueServiceRolevalue. - Choose the
ProducerStewardUserCredentialsvalue to navigate to the Secrets Manager console. - In the Secret value section, choose Retrieve secret value.
- Note down the secret value for the password for IAM user
LOBProducerSteward. - On the Amazon S3 console, check the bucket policies for
retail-datalake-<producer account id >-<producer region>and make sure it is shared with the central governance account IAM role.
This is required for registering the bucket with Lake Formation in the central account so that the account can manage the data sharing.
- On the AWS KMS console, check that the bucket is encrypted with the customer managed key and the key is shared with the central governance account.
Set up resources in the consumer account
The CloudFormation template for the consumer account creates the following resources:
- IAM user
ConsumerAdminUserassigned to the data lake admin - IAM user
LFBusinessAnalyst1 - S3 bucket for Athena output
- Athena workgroup
Complete the following steps:
- Log in to the consumer account console as IAM administrator.
- Choose Launch Stack to deploy the CloudFormation template:
- Create the stack.
- When the stack is complete, on the AWS CloudFormation console, navigate to the Resources tab of the stack.
- Choose the
AllConsumerUsersCredentialsvalue to navigate to the Secrets Manager console. - In the Secret value section, choose Retrieve secret value.
- Note down the secret value for the password for the IAM user
ConsumerAdminUser.
Now that all the accounts have been set up, we set up cross-account sharing on AWS with a central governance account to manage sharing of permissions across producers and consumers.
Configure the central governance account to manage sharing with the producer account
Sign in to the central governance account as CentralDataMeshOwner using the password noted earlier through the central governance account CloudFormation stack. Then complete the following steps:
- On Lake Formation console, choose Data lake locations under Register and ingest in the navigation pane.
- For Amazon S3 path, provide the path
retail-datalake-<producer account id >-<region>. - For IAM role, choose the IAM role created using the CloudFormation stack.
This role has permissions for the accessing the encrypted S3 bucket and its key. Do not choose the role AWSServiceRoleForLakeFormationDataAccess.
- Choose Register location.

- In the navigation pane, choose Databases.
- Choose Create database.
- For Database name¸ enter
datameshtestdatabase. - Choose Create database.
- In the navigation pane, choose Data locations and choose Grant.

- Select External account and provide the producer account for AWS account ID, AWS organization ID, or IAM principal ARN.
- For Storage location, provide the data lake bucket path.
- Select Grantable, then choose Grant.
- Choose Data lake permissions, then choose Grant.
- Select External accounts and provide the producer account number.
- For Databases, choose
datameshtestdatabase. - For Database permissions and Grantable permissions, select Create table, Alter, and Describe.
- Choose Grant.


Configure the crawler in the producer account to populate the schema
Sign in to producer account as LOBProducerSteward with the password noted earlier through the producer account CloudFormation stack, then complete the following steps:
- On the AWS RAM console, accept the pending resource share from the central account.
- On the Lake Formation console, choose Databases under Data catalog in the navigation pane.
- Choose
datameshtestdatabase, and on the Action menu, choose Create resource link. - For Resource link name, enter
datameshtestdatabaselink. - Choose Create.

- On the AWS Glue console, choose Crawlers in the navigation pane.
- Choose the crawler
CrossAccountCrawler-<accountid>. - Choose Edit, then choose Configure security settings.
- Select Use Lake Formation credentials for crawling S3 data source.
- Select In a different account and provide the account ID of the central governance account.
- Choose Next.

- Choose
datameshtestdatabaselinkas the database and choose Update.

- In the navigation pane, choose Data locations and choose Grant.
- Select My account, and choose the crawler IAM role for IAM users and roles.
- For Storage locations, choose the bucket
retail-datalake-<accountid>-<region>. - For Registered account location, enter the central account ID.
- Choose Grant.
 Alternatively, you can also use the AWS CLI to grant data location permission on bucket registered in central account to the crawler role using below command:
For using CLI, refer to Installing or updating the latest version of the AWS CLI.
- In the navigation pane, choose Data lake permissions.
- Choose the crawler IAM role for the principal account.
- Choose
datameshtestdatabasefor the database. - For Database permissions, select Create, Describe, and Alter.
- Choose Grant.

- Choose the crawler IAM role for the principal account.
- Choose
datameshtestdatabaselinkfor the database. - For Resource link permissions, select Describe.
- Choose Grant.
- Run the crawler.


 Alternatively, you can also use the AWS CLI to grant data location permission on bucket registered in central account to the crawler role using below command:

The following screenshot shows the details after a successful run.

When the crawler is complete, you can validate the table created under the database datameshtestdatabaselink.


This table is owned by the producer account and available in the central governance account under the shared database datameshtestdatabase. Now the data lake admin in the central governance account can share the database and populated table with the consumer account.
Configure the central governance account to manage sharing of read-only access with the consumer account
Sign in to the central governance account as CentralDataMeshOwner with the password noted earlier through the central governance account CloudFormation stack, then complete the following steps:
- Grant database permissions to the consumer account.
- For Principals, choose external account and provide <consumer accountID>
- For Databases, select
datameshtestdatabase. - For Database permissions, select Describe.
- For Grantable permissions¸ select Describe.
- Choose Grant.


- Grant table permissions to the consumer account.
- For Principals, choose external account and provide
<consumer accountID>. - For Databases, select
datameshtestdatabase. - For Tables, select
retail_datalake_<accountID>_<region>. - For Table permissions, select Select and Describe.
- For Grantable permissions¸ select Select and Describe.
- Choose Grant.


Configure the consumer account as the consumer account data lake admin
Sign to the consumer account as ConsumerAdminUser with the password noted earlier through the consumer account CloudFormation stack. (Note that in the consumer account Lake Formation configuration, both ConsumerAdminUser and LFBusinessAnalyst1 have the same password.)
- On the AWS RAM console, accept the resource share from the central account.
- On the Lake Formation console, validate that the shared database datameshtestdatabase is available and create the resource link datameshtestdatabaselink using the shared database.
The following screenshot shows the details after the resource link is created.

- On the Lake Formation console, choose Grant.
- Choose LFBusinessAnalyst1 for IAM users and roles.
- Choose
datameshtestdatabasefor the database under Named data catalog resources. - Select Describe for Database permissions.
- On the Lake Formation console, choose Grant.
- Choose
LFBusinessAnalyst1for IAM users and roles. - Choose
datameshtestdatabaselinkfor the database under Named data catalog resources. - Select Describe for Resource link permissions.
- On the Lake Formation console, choose Grant.
- Choose
LFBusinessAnalyst1for IAM users and roles. - Choose
retail_datalake_<accountid>_<region>for the table under Named data catalog resources. - Select Select and Describe for Table permissions.
Run queries in the consumer account
Sign to the consumer account console as LFBusinessAnalyst1 with the password noted earlier through the consumer account CloudFormation stack, then complete the following steps:
- On the Athena console, and choose
lfconsumer-workgroupas the Athena workgroup. - Run the following query to validate access:

We have successfully registered the dataset and created a Data Catalog in the central governance account. We crawled the data lake that was registered with the central governance account using Lake Formation permissions from the producer account and populated the schema. We granted Lake Formation permission on the database and table from the central account to the consumer user and validated consumer user access to the data using Athena.
Clean up
To avoid unwanted charges to your AWS account, delete the AWS resources:
- Sign in to the CloudFormation console as the IAM admin used for creating the CloudFormation stack in all three accounts.
- Delete the stacks you created.
Conclusion
In this post, we showed how to set up cross-account crawling using a central governance account with the new AWS Glue crawler capability of Lake Formation integration. This capability allows data producers to set up crawling capabilities in their own domain so that changes are seamlessly available to data governance and data consumers. Implementing a data mesh with AWS Glue crawlers, Lake Formation, Athena, and other analytical services provide a well-understood, performant, scalable, and cost-effective solution to integrate, prepare, and serve data.
If you have questions or suggestions, submit them in the comments section.
For more resources, refer to the following:
- Design a data mesh architecture using AWS Lake Formation and AWS Glue
- Introducing AWS Glue crawlers using AWS Lake Formation permission management
About the authors
 Sandeep Adwankar is a Senior Technical Product Manager at AWS. Based in the California Bay Area, he works with customers around the globe to translate business and technical requirements into products that enable customers to improve how they manage, secure, and access data.
 Srividya Parthasarathy is a Senior Big Data Architect on the AWS Lake Formation team. She enjoys building data mesh solutions and sharing them with the community.
 Piyali Kamra is a seasoned enterprise architect and a hands-on technologist who believes that building large scale enterprise systems is not an exact science but more like an art, in which tools and technologies must be carefully selected based on the team’s culture , strengths , weaknesses and risks , in tandem with having a futuristic vision as to how you want to shape your product a few years down the road.
Deep Pool boosts software quality control using Amazon QuickSight
Post Syndicated from Shruthi Panicker original https://aws.amazon.com/blogs/big-data/deep-pool-boosts-software-quality-control-using-amazon-quicksight/
Deep Pool Financial Solutions, an investor servicing and compliance solutions supplier, was looking to build key performance indicators to track its software tests, failures, and successful fixes to pinpoint the specific areas for improvement in its client software. Deep Pool was unable to access the large amounts of data that its project management software provided, so it used AWS to access, manage, and analyze that data more efficiently.
During a larger migration to the AWS Cloud, the company discovered Amazon QuickSight, a cloud-native, serverless business intelligence (BI) service that powers interactive dashboards that let companies make better data-driven decisions. With QuickSight, Deep Pool could democratize access to this unused data and pinpoint areas for improvement in its software development processes, thereby improving the overall quality of its software.
According to Brett Promisel, Chief Operating Officer for Deep Pool, the company wanted to manage the data that it was collecting from a BI point of view to help it make more informed decisions. Because word of mouth and high-quality software are critical in Deep Pool’s industry, the company wanted to add additional rigorous quality controls to its product development and testing so that it continues to provide top-notch, stable software that its clients can rely on.
In this post, we share how Deep Pool boosted its software quality control using QuickSight.
Enhancing software testing to with data-driven insights
Continuous improvement is a hallmark of leading organizations. Deep Pool wanted achieve greater software quality and decided to improve how it monitored and managed its software testing processes using data.
Typical development processes involve extensive testing. First, the original developer tests the code, and then the code is unit tested. Next, larger groups test the code. For all this testing to be successful and result in product improvement, it needs to be measured and tracked so that developers can learn from it and implement improvements during the development process.
Using QuickSight for data-driven insights, Deep Pool has implemented significant software testing and control. It can now count the number of bugs found or tests failed and time how long it took to create patches and repair issues. It can also better track its work backlog and the progress of functionality requests. Monitoring this information lets the company know that it has successfully implemented improvements, because a decreasing number of bugs over time is a strong indicator of quality control.
Monitoring development to increase efficiency
Better software test management benefits two groups: internal teams and external customers. Deep Pool can now log and communicate important information, such as when a request is made, how it’s being resolved or addressed, and how it’s being tested. In addition to helping internal teams streamline their processes, the company can also use this data to track communications with customers, which are also stored in its project management software. Such knowledge helps the company determine whether customer requests are being promptly addressed and identify common trends that require action on a larger scale.
Seven development teams at Deep Pool independently write the code for the components of the company’s software products, and they must integrate those components to create the final products. With the granularity of the data that is provided by QuickSight, Deep Pool can thoroughly analyze the development and testing of these products. The company now has the ability to trace software bugs down to their original coding, which makes it simple to quickly locate and address any issues that come up. Deep Pool can also measure the results of those mitigating actions and determine whether its repairs were successful.
Attention to detail helps Deep Pool improve software quality, leading to better products and customers who are more likely to give positive referrals.
“Amazon QuickSight is extremely valuable to us when performing quality control. We can now expose our whole development team to how we’re managing databases and servers and measuring performance in a more optimal way,” says Promisel.
Deep Pool has successfully proven that it can use QuickSight to measure its quality control to improve its software and, ultimately, better support its customers. Since the migration to AWS, the number of software issues discovered and logged has dropped by 57%.
The increased quality control that has come from the company’s focus on accessing all its data and optimizing its use has led to better efficiency, which results in the ability to expand its growth without increasing its costs.
“We should be able to increase our customer base without adding the equivalent costs. Making sure we are as efficient as possible lets me manage that way,” says Promisel.
Expanding into more data sources
Deep Pool is also exploring how to expand its use of QuickSight to extract and use data from even more of its databases. In the future, it hopes to analyze its internal metrics, such as sales data, and its external client-related information, such as assets and holdings, to guide how it builds its client software and provides even more custom products.
Deep Pool is also committed to helping its employees be innovative and successful by investing in their futures and skill sets. It understands that well-trained employees can optimize the use of their tools, which results in better products. As such, the company will continue to invest in the training offered by AWS. Using cutting-edge tools and promoting its intent to invest in its employees indicate to Deep Pool’s customers that the company plans to stay innovative and ahead of the technological curve.
To learn more about how QuickSight can help your business with dashboards, reports, and more, visit Amazon QuickSight.
About the Author
 Shruthi Panicker is a Senior Product Marketing Manager with Amazon QuickSight at AWS. As an engineer turned product marketer, Shruthi has spent over 15 years in the technology industry in various roles from software engineering, to solution architecting to product marketing. She is passionate about working at the intersection of technology and business to tell great product stories that help drive customer value.
Visualize Confluent data in Amazon QuickSight using Amazon Athena
Post Syndicated from Ahmed Zamzam original https://aws.amazon.com/blogs/big-data/visualize-confluent-data-in-amazon-quicksight-using-amazon-athena/
This is a guest post written by Ahmed Saef Zamzam and Geetha Anne from Confluent.
Businesses are using real-time data streams to gain insights into their company’s performance and make informed, data-driven decisions faster. As real-time data has become essential for businesses, a growing number of companies are adapting their data strategy to focus on data in motion. Event streaming is the central nervous system of a data in motion strategy and, in many organizations, Apache Kafka is the tool that powers it.
Today, Kafka is well known and widely used for streaming data. However, managing and operating Kafka at scale can still be challenging. Confluent offers a solution through its fully managed, cloud-native service that simplifies running and operating data streams at scale. Confluent extends open-source Kafka through a suite of related services and features designed to enhance the data in motion experience for operators, developers, and architects in production.
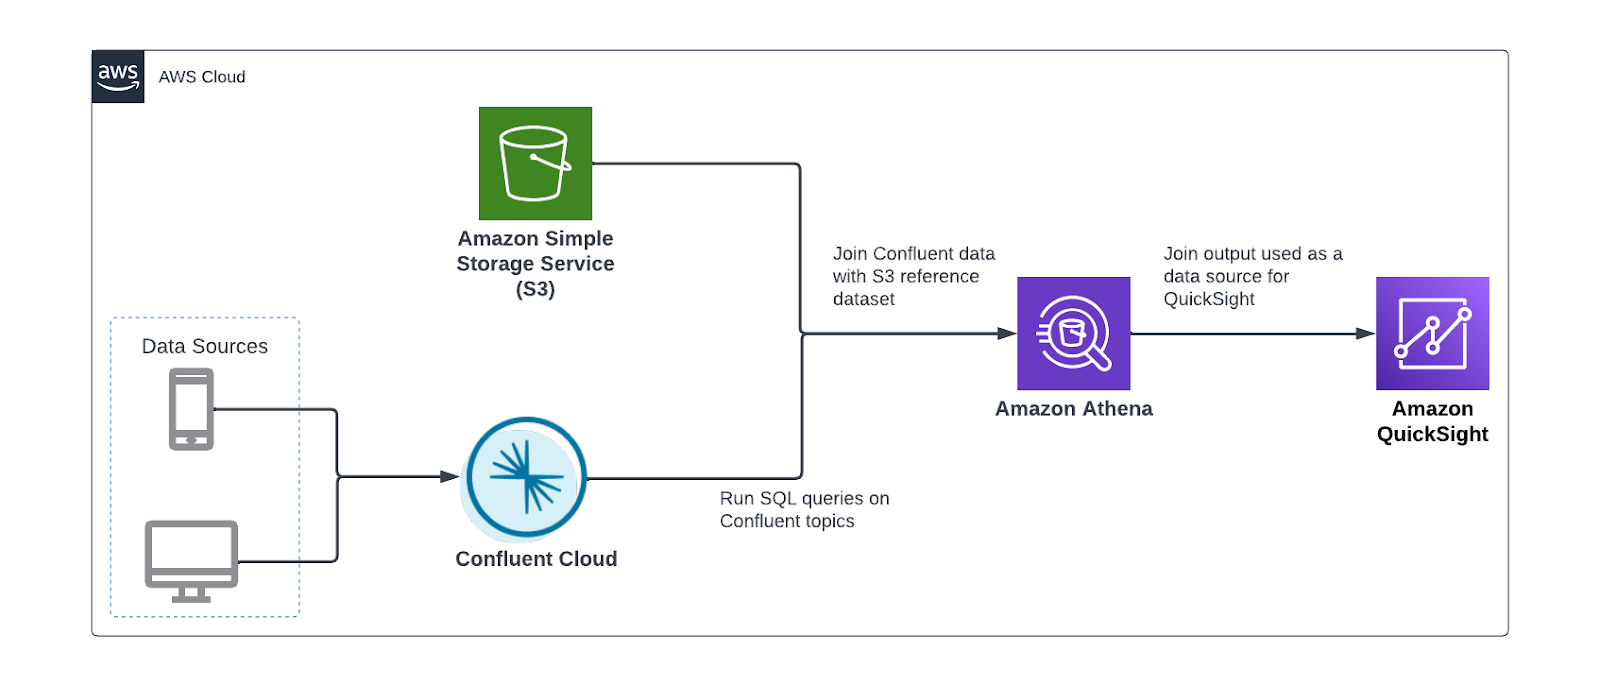
In this post, we demonstrate how Amazon Athena, Amazon QuickSight, and Confluent work together to enable visualization of data streams in near-real time. We use the Kafka connector in Athena to do the following:
- Join data inside Confluent with data stored in one of the many data sources supported by Athena, such as Amazon Simple Storage Service (Amazon S3)
- Visualize Confluent data using QuickSight
Challenges
Purpose-built stream processing engines, like Confluent ksqlDB, often provide SQL-like semantics for real-time transformations, joins, aggregations, and filters on streaming data. With ksqlDB, you can create persistent queries, which continuously process streams of events according to specific logic, and materialize streaming data in views that can be queried at a point in time (pull queries) or subscribed to by clients (push queries).
ksqlDB is one solution that made stream processing accessible to a wider range of users. However, pull queries, like those supported by ksqlDB, may not be suitable for all stream processing use cases, and there may be complexities or unique requirements that pull queries are not designed for.
Data visualization for Confluent data
A frequent use case for enterprises is data visualization. To visualize data stored in Confluent, you can use one of over 120 pre-built connectors, provided by Confluent, to write streaming data to a destination data store of your choice. Next, you connect your business intelligence (BI) tool to the data store to begin visualizing the data.
The following diagram depicts a typical architecture utilized by many Confluent customers. In this workflow, data is written to Amazon S3 through the Confluent S3 sink connector and then analyzed with Athena, a serverless interactive analytics service that enables you to analyze and query data stored in Amazon S3 and various other data sources using standard SQL. You can then use Athena as an input data source to QuickSight, a highly scalable cloud native BI service, for further analysis.

Although this approach works well for many use cases, it requires data to be moved, and therefore duplicated, before it can be visualized. This duplication not only adds time and effort for data engineers who may need to develop and test new scripts, but also creates data redundancy, making it more challenging to manage and secure the data, and increases storage cost.
Enriching data with reference data in another data store
With ksqlDB queries, the source and destination are always Kafka topics. Therefore, if you have a data stream that you need to enrich with external reference data, you have two options. One option is to import the reference data into Confluent, model it as a table, and use ksqlDB’s stream-table join to enrich the stream. The other option is to ingest the data stream into a separate data store and perform join operations there. Both require data movement and result in duplicate data storage.
Solution overview
So far, we have discussed two challenges that are not addressed by conventional stream processing tools. Is there a solution that addresses both challenges simultaneously?
When you want to analyze data without separate pipelines and jobs, a popular choice is Athena. With Athena, you can run SQL queries on a wide range of data sources—in addition to Amazon S3—without learning a new language, developing scripts to extract (and duplicate) data, or managing infrastructure.
Recently, Athena announced a connector for Kafka. Like Athena’s other connectors, queries on Kafka are processed within Kafka and return results to Athena. The connector supports predicate pushdown, which means that adding filters to your queries can reduce the amount of data scanned, improve query performance, and reduce cost.
For example, when using this connector, the amount of data scanned by the query SELECT * FROM CONFLUENT_TABLE could be significantly higher than the amount of data scanned by the query SELECT * FROM CONFLUENT_TABLE WHERE COUNTRY = 'UK'. The reason is that the AWS Lambda function which provides the runtime environment for the Athena connector, filters data at the source before returning it to Athena.
Let’s assume we have a stream of online transactions flowing into Confluent and customer reference data stored in Amazon S3. We want to use Athena to join both data sources together and produce a new dataset for QuickSight. Instead of using the S3 sink connector to load data into Amazon S3, we use Athena to query Confluent and join it with S3 data—all without moving data. The following diagram illustrates this architecture.
We perform the following steps:
- Register the schema of your Confluent data.
- Configure the Athena connector for Kafka.
- Optionally, interactively analyze Confluent data.
- Create a QuickSight dataset using Athena as the source.
Register the schema
To connect Athena to Confluent, the connector needs the schema of the topic to be registered in the AWS Glue Schema Registry, which Athena uses for query planning.
The following is a sample record in Confluent:
The following is the schema of this record:
The data producer writing the data can register this schema with the AWS Glue Schema Registry. Alternatively, you can use the AWS Management Console or AWS Command Line Interface (AWS CLI) to create a schema manually.
We create the schema manually by running the following CLI command. Replace <registry_name> with your registry name and make sure that the text in the description field includes the required string {AthenaFederationKafka}:
Next, we run the following command to create a schema inside the newly created schema registry:
Before running the command, be sure to provide the following details:
- Replace <registry_name> with our AWS Glue Schema Registry name
- Replace <schema_name> with the name of our Confluent Cloud topic, for example, transactions
- Replace <Compatibility_Mode> with one of the supported compatibility modes, for example, ‘Backward’
- Replace <Schema> with our schema
Configure and deploy the Athena Connector
With our schema created, we’re ready to deploy the Athena connector. Complete the following steps:
- On the Athena console, choose Data sources in the navigation pane.
- Choose Create data source.
- Search for and select Apache Kafka.

- For Data source name, enter the name for the data source.


This data source name will be referenced in your queries. For example:
Applying this to our use case and previously defined schema, our query would be as follows:
- In the Connection details section, choose Create Lambda function.


You’re redirected to the Applications page on the Lambda console. Some of the application settings are already filled.
The following are the important settings required for integrating with Confluent Cloud. For more information on these settings, refer to Parameters.
- For LambdaFunctionName, enter the name for the Lambda function the connector will use. For example,
athena_confluent_connector.
We use this parameter in the next step.
- For KafkaEndpoint, enter the Confluent Cloud bootstrap URL.
You can find this on the Cluster settings page in the Confluent Cloud UI.

Confluent Cloud supports two authentication mechanisms: OAuth and SASL/PLAIN (API keys). The connector doesn’t support OAuth; this leaves us with SASL/PLAIN. SASL/PLAIN uses SSL as a security protocol and PLAIN as SASL mechanism.
- For AuthType, enter
SASL_SSL_PLAIN.
The API key and secret used by the connector to access Confluent need to be stored in AWS Secrets Manager.
- Get your Confluent API key or create a new one.
- Run the following AWS CLI command to create the secret in Secrets Manager:
The secret string should have two key-value pairs, one named username and the other password.
- For SecretNamePrefix, enter the secret name prefix created in the previous step.
- If the Confluent cloud cluster is reachable over the internet, leave SecurityGroupIds and SubnetIds blank. Otherwise, your Lambda function needs to run in a VPC that has connectivity to your Confluent Cloud network. Therefore, enter a security group ID and three private subnet IDs in this VPC.
- For SpillBucket, enter the name of an S3 bucket where the connector can spill data.
Athena connectors temporarily store (spill) data to Amazon S3 for further processing by Athena.
- Select I acknowledge that this app creates custom IAM roles and resource policies.
- Choose Deploy.
- Return to the Connection details section on the Athena console and for Lambda, enter the name of the Lambda function you created.
- Choose Next.

- Choose Create data source.

Perform interactive analysis on Confluent data
With the Athena connector set up, our streaming data is now queryable from the same service we use to analyze S3 data lakes. Next, we use Athena to conduct point-in-time analysis of transactions flowing through Confluent Cloud.
Aggregation
We can use standard SQL functions to aggregate the data. For example, we can get the revenue by product category:

Enrich transaction data with customer data
The aggregation example is also available with ksqlDB pull queries. However, Athena’s connector allows us to join the data with other data sources like Amazon S3.
In our use case, the transactions streamed to Confluent Cloud lack detailed information about customers, apart from a customer_id. However, we have a reference dataset in Amazon S3 that has more information about the customers. With Athena, we can join both datasets together to gain insights about our customers. See the following code:
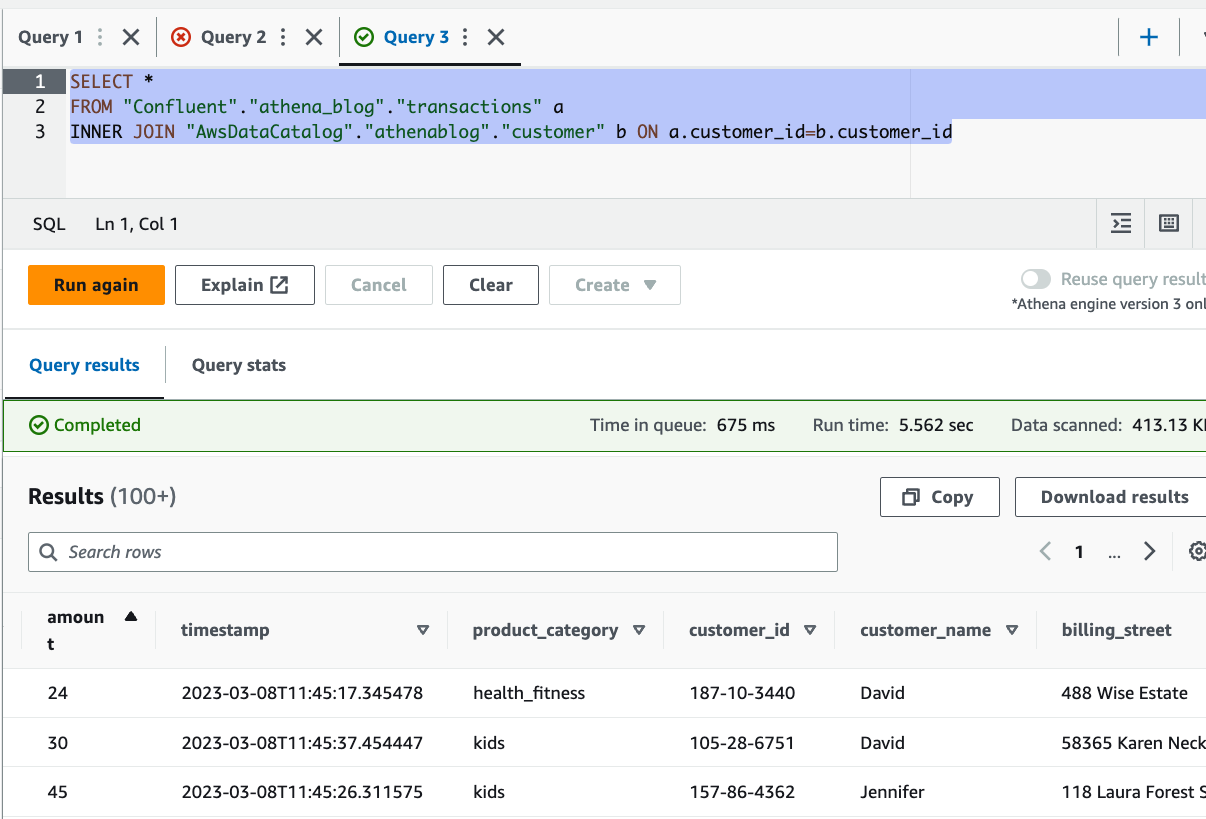
You can see from the results that we were able to enrich the streaming data with customer details, stored in Amazon S3, including name and address.
Visualize data using QuickSight
Another powerful feature this connector brings is the ability to visualize data stored in Confluent using any BI tool that supports Athena as a data source. In this post, we use QuickSight. QuickSight is a machine learning (ML)-powered BI service built for the cloud. You can use it to deliver easy-to-understand insights to the people you work with, wherever they are.
For more information about signing up for QuickSight, see Signing up for an Amazon QuickSight subscription.
Complete the following steps to visualize your streaming data with QuickSight:
- On the QuickSight console, choose Datasets in the navigation pane.
- Choose New dataset.
- Choose Athena as the data source.
- For Data source name, enter a name.
- Choose Create data source.
- In the Choose your table section, choose Use custom SQL.

- Enter the join query like the one given previously, then choose Confirm query.

- Next, choose to import the data into SPICE (Super-fast, Parallel, In-memory Calculation Engine), a fully managed in-memory cache that boosts performance, or directly query the data.


Utilizing SPICE will enhance performance, but the data may need to be periodically updated. You can choose to incrementally refresh your dataset or schedule regular refreshes with SPICE. If you want near-real-time data reflected in your dashboards, select Directly query your data. Note that with the direct query option, user actions in QuickSight, such as applying a drill-down filter, may invoke a new Athena query.
- Choose Visualize.


That’s it, we have successfully connected QuickSight to Confluent through Athena. With just a few clicks, you can create a few visuals displaying data from Confluent.
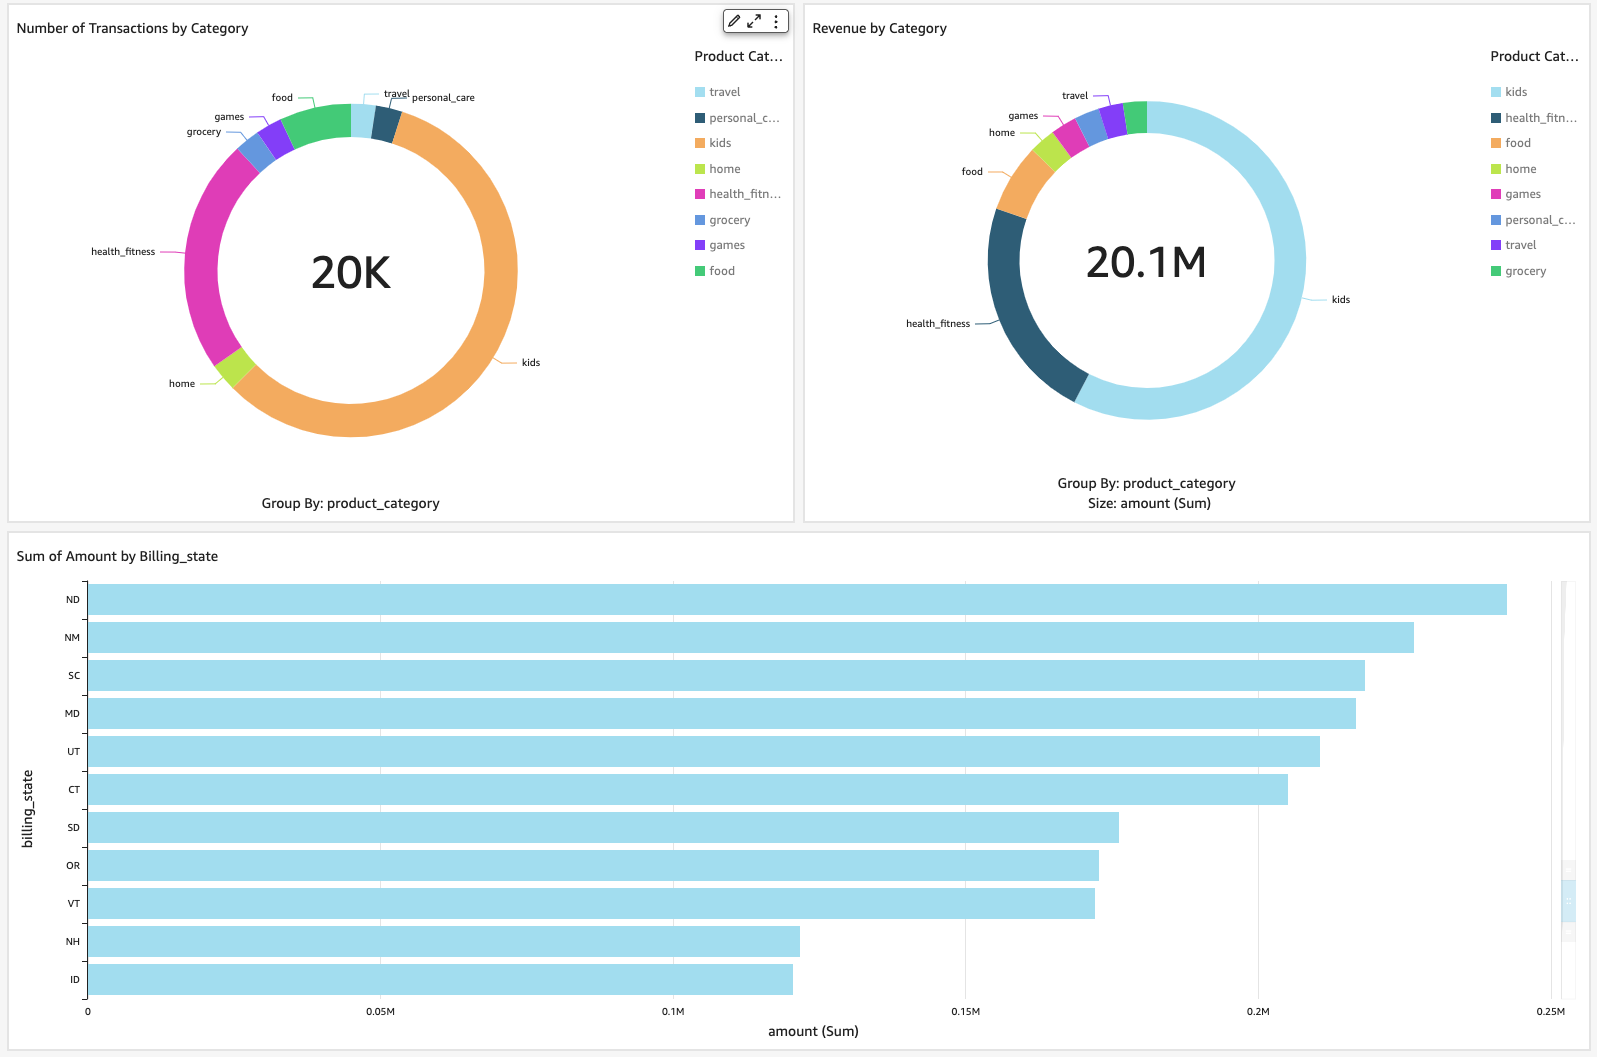
Clean up
To avoid incurring ongoing charges, delete the resources you provisioned by completing the following steps:
- Delete the AWS Glue schema and registry.
- Delete the Athena Kafka connector.
- Delete the QuickSight dataset.
Conclusion
In this post, we discussed use cases for Athena and Confluent. We provided examples of how you can use both for near-real-time data visualization with QuickSight and interactive analysis involving joins between streaming data in Confluent and data stored in Amazon S3.
The Athena connector for Kafka simplifies the process of querying and analyzing streaming data from Confluent Cloud. It removes the need to first move streaming data to persistent storage before it can be used in downstream use cases like business intelligence. This complements the existing integration between Confluent and Athena, using the S3 sink connector, which enables loading streaming data into a data lake, and is an additional option for customers who want to enable interactive analysis on Confluent data.
About the authors
 Ahmed Zamzam is a Senior Partner Solutions Architect at Confluent, with a focus on the AWS partnership. In his role, he works with customers in the EMEA region across various industries to assist them in building applications that leverage their data using Confluent and AWS. Prior to Confluent, Ahmed was a Specialist Solutions Architect for Analytics AWS specialized in data streaming and search. In his free time, Ahmed enjoys traveling, playing tennis, and cycling.
 Geetha Anne is a Partner Solutions Engineer at Confluent with previous experience in implementing solutions for data-driven business problems on the cloud, involving data warehousing and real-time streaming analytics. She fell in love with distributed computing during her undergraduate days and has followed her interest ever since. Geetha provides technical guidance, design advice, and thought leadership to key Confluent customers and partners. She also enjoys teaching complex technical concepts to both tech-savvy and general audiences.
Manage your data warehouse cost allocations with Amazon Redshift Serverless tagging
Post Syndicated from Sandeep Bajwa original https://aws.amazon.com/blogs/big-data/manage-your-data-warehouse-cost-allocations-with-amazon-redshift-serverless-tagging/
Amazon Redshift Serverless makes it simple to run and scale analytics without having to manage your data warehouse infrastructure. Developers, data scientists, and analysts can work across databases, data warehouses, and data lakes to build reporting and dashboarding applications, perform real-time analytics, share and collaborate on data, and even build and train machine learning (ML) models with Redshift Serverless.
Tags allows you to assign metadata to your AWS resources. You can define your own key and value for your resource tag, so that you can easily manage and filter your resources. Tags can also improve transparency and map costs to specific teams, products, or applications. This way, you can raise cost awareness and also make teams and users accountable for their own cost and usage.
You can now use tagging in Redshift Serverless to categorize the following resources based on your grouping needs:
- Namespace – A collection of database objects and users
- Workgroup – A collection of compute resources
- Snapshot – Point-in-time backups of a cluster
- Recovery point – Recovery points in Redshift Serverless are created every 30 minutes and saved for 24 hours
When using Redshift Serverless, you may have to manage data across many business departments, environments, and billing groups. In doing so, you’re usually faced with one of the following tasks:
- Cost allocation and financial management – You want to know what you’re spending on AWS for a given project, line of business, or environment
- Operations support and incident management – You want to send issues to the right teams and users
- Access control – You want to constrain user access to certain resources
- Security risk management – You want to group resources based on their level of security or data sensitivity and make sure proper controls are in place
In this post, we focus on tagging Redshift Serverless resources for cost allocation and reporting purposes. Knowing where you have incurred costs at the resource, workload, team, and organization level enhances your ability to budget and manage cost.
Solution overview
Let’s say that your company has two departments: marketing and finance. Each department has multiple cost centers and environments, as illustrated in the following figure. In AWS Cost Explorer, you want to create cost reports for Redshift Serverless by department, environment, and cost center.

We start with creating and applying user-defined tags to Amazon Serverless workgroups for respective departments, environments, and cost centers. You can use both the AWS Command Line Interface (AWS CLI) and Redshift Serverless console to tag serverless resources.
The high-level steps are as follows:
- Create tags.
- View and edit tags.
- Set up cost allocation tags.
- Create cost reports.
Create tags
To create tags, complete the following steps:
- On the Amazon Redshift console, choose Manage tags in the navigation pane.

- For Filter by resource type, you can filter by Workgroup, Namespace, Snapshot, and Recovery Point.
- Optionally, you can search for resources by an existing tag by entering values for Tag key or Tag value. For this post, we don’t include any tag filters, so we can view all the resources across our account.

- Select your resource from the search results and choose Manage tags to customize the tag key and value parameters.


Here, you can add new tags, remove tags, save changes, and cancel your changes if needed.
- Because we want to allocate cost across the various departments, we add a new key called
departmentand a new value calledmarketing.
- Choose Save changes.

- Confirm the changes by choosing Apply changes.


For more details on tagging, refer to Tagging resources overview.
View and edit tags
If you already have resources such as workgroups (listed on the Workgroup configuration page) or snapshots (listed on the Data backup page), you can create new tags or edit existing tags on the given resource. In the following example, we manage tags on an existing workgroup.
- On the Amazon Redshift console, choose Workgroup configuration in the navigation pane.
- Select your workgroup and on the Actions menu, choose Manage tags.


Now we can remove existing tags or add new tags. For our use case, let’s assume that the marketing department is no longer using the default workgroup, so we want to remove the current tag.
- Choose Remove next to the marketing tag.


We are given the option to choose Undo if needed.
- Choose Save changes and then Apply the changes to confirm.


After we apply the tags, we can view the full list of resources. The number of tags applied to each resource is found in the Tags column.
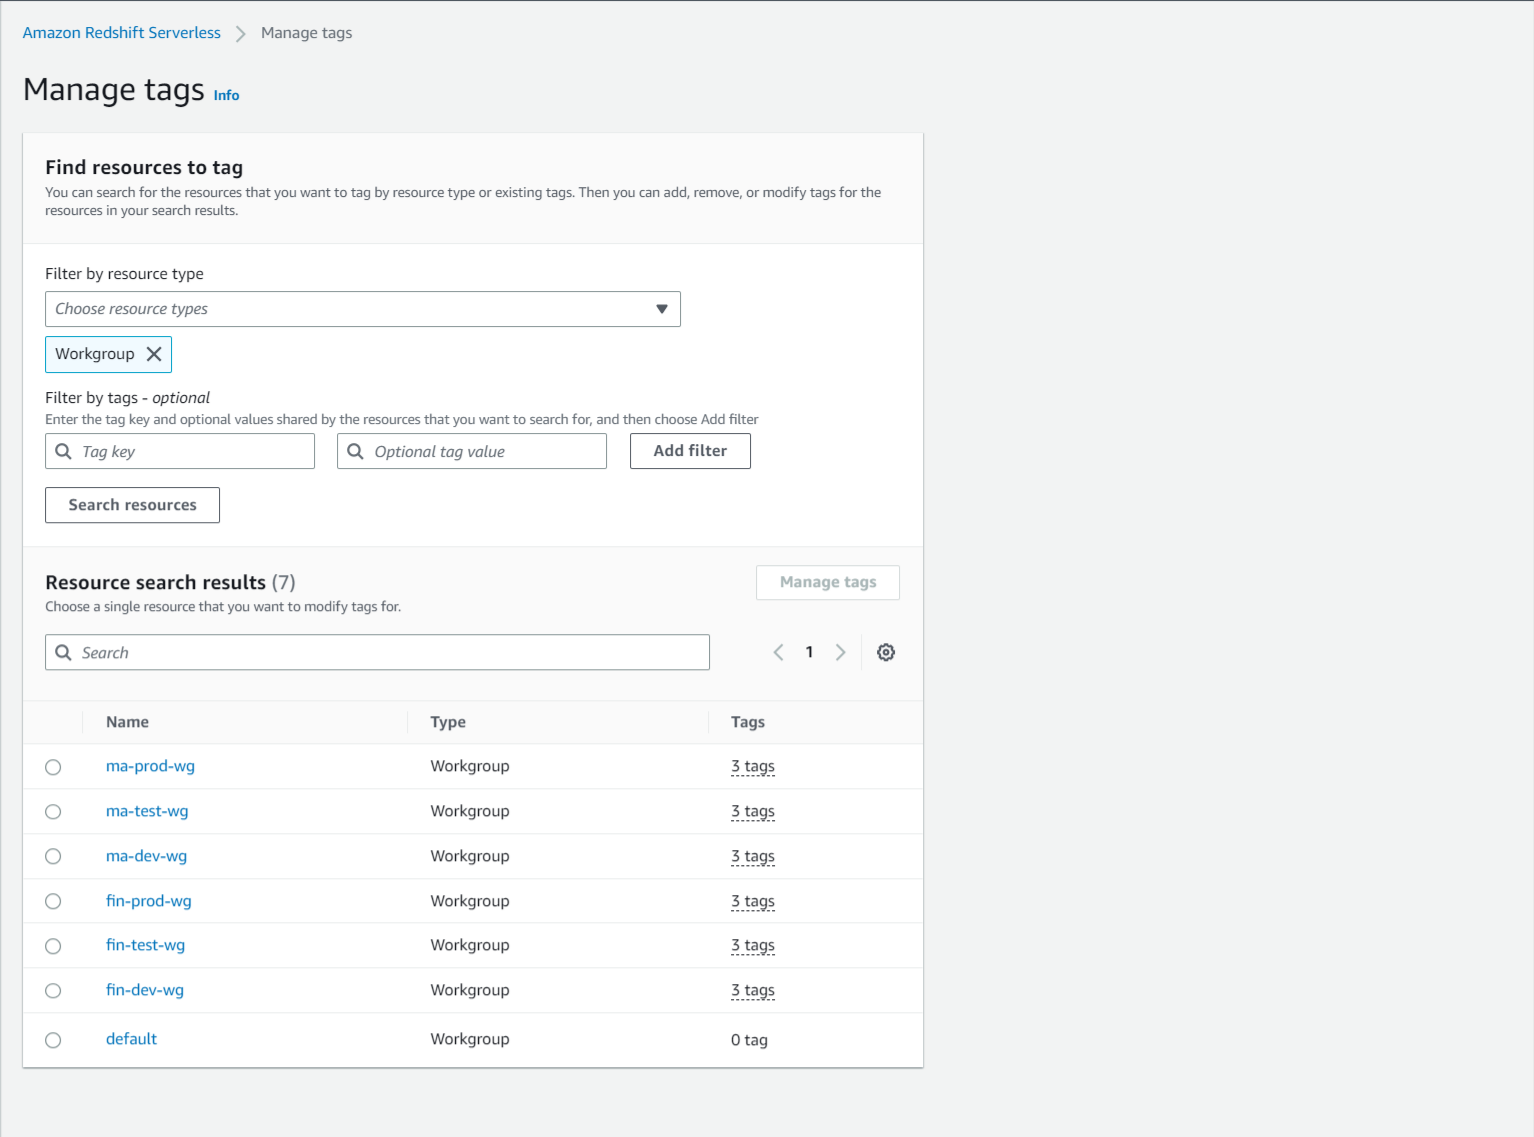
Set up cost allocation tags
After you create and apply the user-defined tags to your Redshift Serverless workgroups, it can take up to 24 hours for the tags to appear on your cost allocation tags page for activation. You can activate tags by using the AWS Billing console for cost allocation tracking with the following steps:
- On the AWS Billing console, choose Cost allocation tags in the navigation pane.
- Under User-defined cost allocation tags¸ select the tags you created and applied (for this example,
cost-center). - Choose Activate.


After we activate all the tags we created, we can view the full list by choosing Active on the drop-down menu.
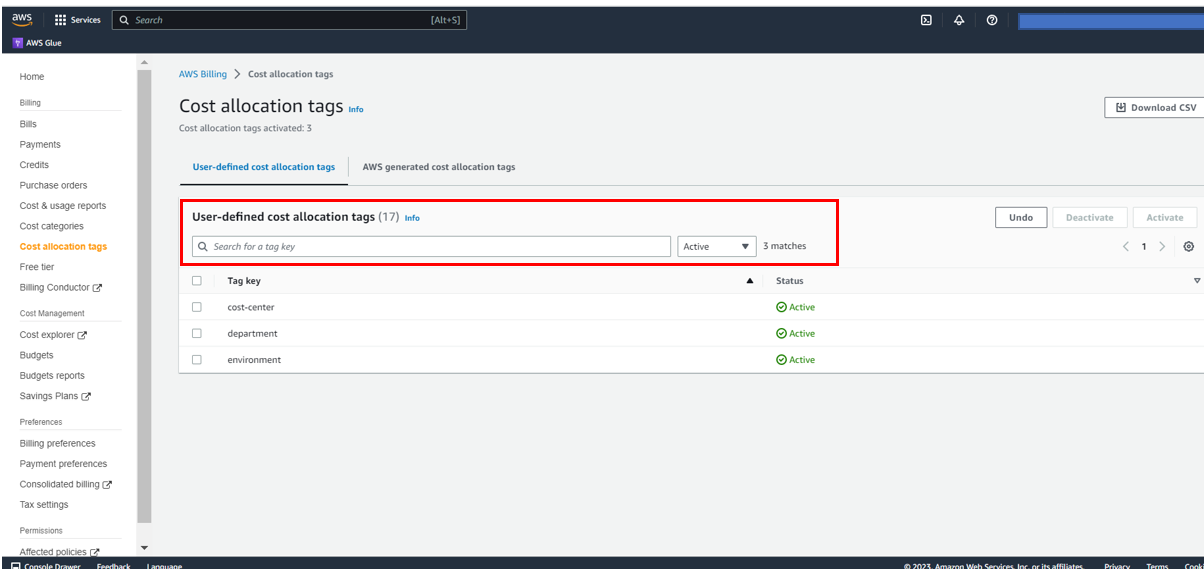
Create cost reports
After you activate the cost allocation tags, they appear on your cost allocation reports in Cost Explorer.
Cost Explorer helps you manage your AWS costs by giving you detailed insights into the line items in your bill. In Cost Explorer, you can visualize daily, monthly, and forecasted spend by combining an array of available filters. Filters allow you to narrow down costs according to AWS service type, linked accounts, and tags.
The following screenshot shows the preconfigured reports in Cost Explorer.

To create custom reports for your cost and usage data, complete the following steps:
- On the AWS Cost Management console, choose Reports in the navigation pane.
- Choose Create new report.
- Select the report type you want to create (for this example, we select Cost and usage).
- Choose Create Report.

- To view weekly Redshift Serverless cost by cost center, choose the applicable settings in the Report parameters pane. For this post, we group data by the cost-center tag and filter data by the department tag.
- Save the report for later use by choosing Save to report library.

- Enter a name for your report, then choose Save report.


The following screenshot shows a sample report for daily Redshift Serverless cost by department.
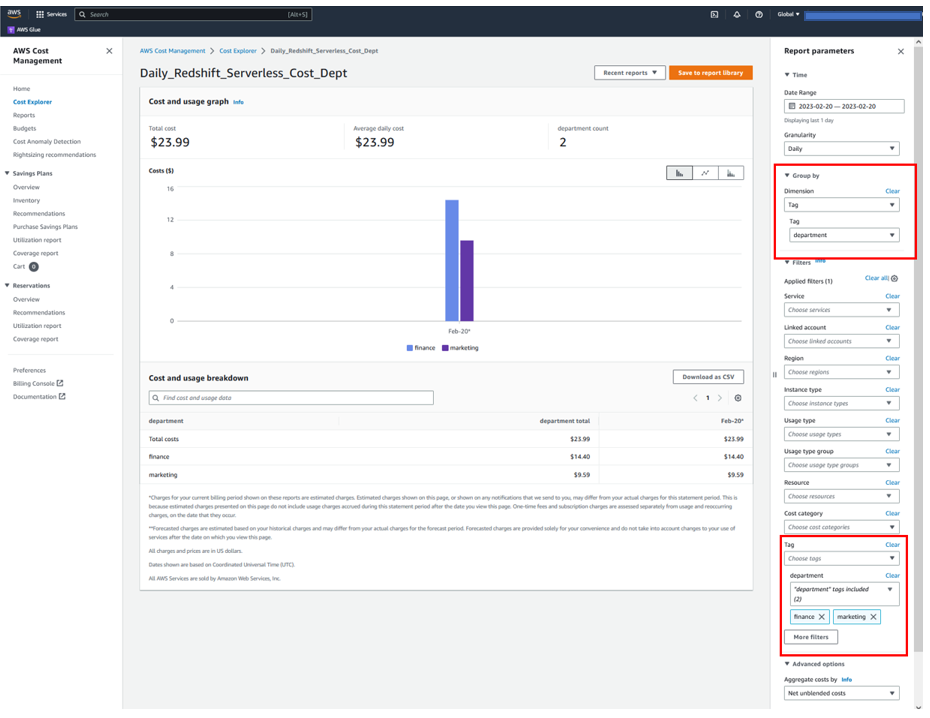
The following screenshot shows an example report of weekly Redshift Serverless cost by environment.
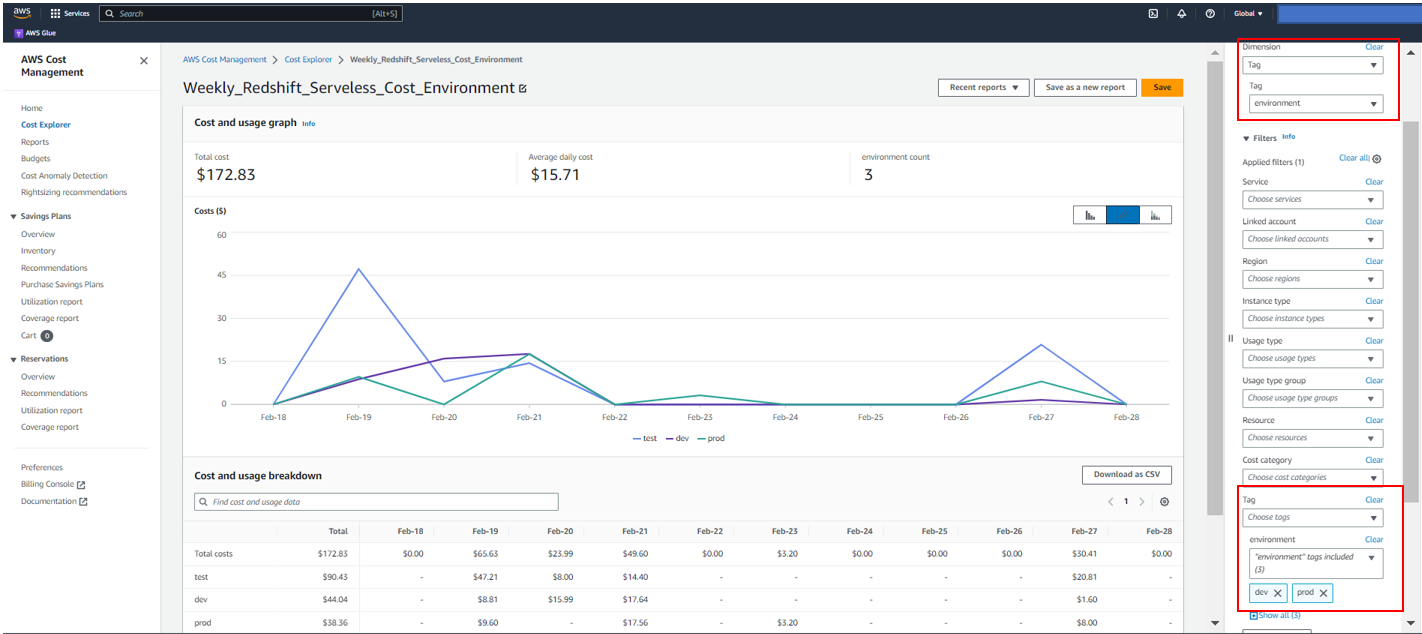
Conclusion
Tagging resources in Amazon Redshift helps you maintain a central place to organize and view resources across the service for billing management. This feature saves you hours of manual work you would spend in grouping your Amazon Redshift resources via a spreadsheet or other manual alternatives.
For more tagging best practices, refer to Tagging AWS resources.
About the Authors
 Sandeep Bajwa is a Sr. Analytics Specialist based out of Northern Virginia, specialized in the design and implementation of analytics and data lake solutions.
 Michael Yitayew is a Product Manager for Amazon Redshift based out of New York. He works with customers and engineering teams to build new features that enable data engineers and data analysts to more easily load data, manage data warehouse resources, and query their data. He has supported AWS customers for over 3 years in both product marketing and product management roles.
AWS Application Migration Service Major Updates: Import and Export Feature, Source Server Migration Metrics Dashboard, and Additional Post-Launch Actions
Post Syndicated from Donnie Prakoso original https://aws.amazon.com/blogs/aws/aws-application-migration-service-major-updates-import-and-export-feature-source-server-migration-metrics-dashboard-and-additional-post-launch-actions/
AWS Application Migration Service (AWS MGN) can simplify and expedite your migration to AWS by automatically converting your source servers from physical, virtual, or cloud infrastructure to run natively on AWS. In the post, How to Use the New AWS Application Migration Server for Lift-and-Shift Migrations, Channy introduced us to Application Migration Service and how to get started.
By using Application Migration Service for migration, you can minimize time-intensive, error-prone manual processes by automating replication and conversion of your source servers from physical, virtual, or cloud infrastructure to run natively on AWS. Last year, we introduced major improvements such as new migration servers grouping, an account-level launch template, and a post-launch actions template.
Today, I’m pleased to announce three major updates of Application Migration Service. Here’s the quick summary for each feature release:
- Import and export – You can now use Application Migration Service to import your source environment inventory list to the service from a CSV file. You can also export your source server inventory for reporting purposes, offline reviews and updates, integration with other tools and AWS services, and performing bulk configuration changes by reimporting the inventory list.
- Server migration metrics dashboard – This new dashboard can help simplify migration project management by providing an aggregated view of the migration lifecycle status of your source servers
- Additional post-launch modernization actions – In this update, Application Migration Service added eight additional predefined post-launch actions. These actions are applied to your migrated applications when you launch them on AWS.
Let me share how you can use these features for your migration.
Import and Export
Before we go further into the import and export features, let’s discuss two concepts within Application Migration Service: applications and waves, which you can define when migrating with Application Migration Service. Applications represent a group of servers. By using applications, you can define groups of servers and identify them as an application. Within your application, you can perform various activities with Application Migration Service, such as monitoring, specifying tags, and performing bulk operations, for example, launching test instances. Additionally, you can group your applications into waves, which represent a group of servers that are migrated together, as part of your migration plan.
With the import feature, you can now import your inventory list in CSV form into Application Migration Service. This makes it easy for you to manage large scale-migrations, and ingest your inventory of source servers, applications and waves, including their attributes.
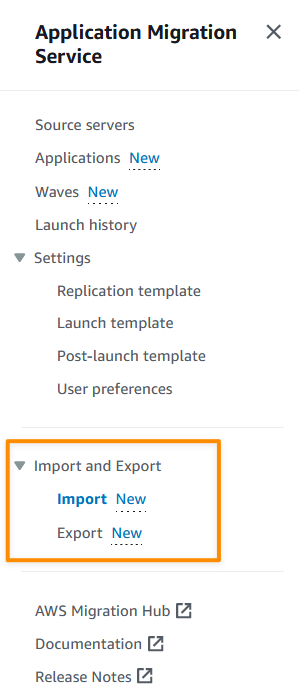
To start using the import feature, I need to identify my servers and application inventory. I can do this manually, or using discovery tools. The next thing I need to do is download the import template which I can access from the console.
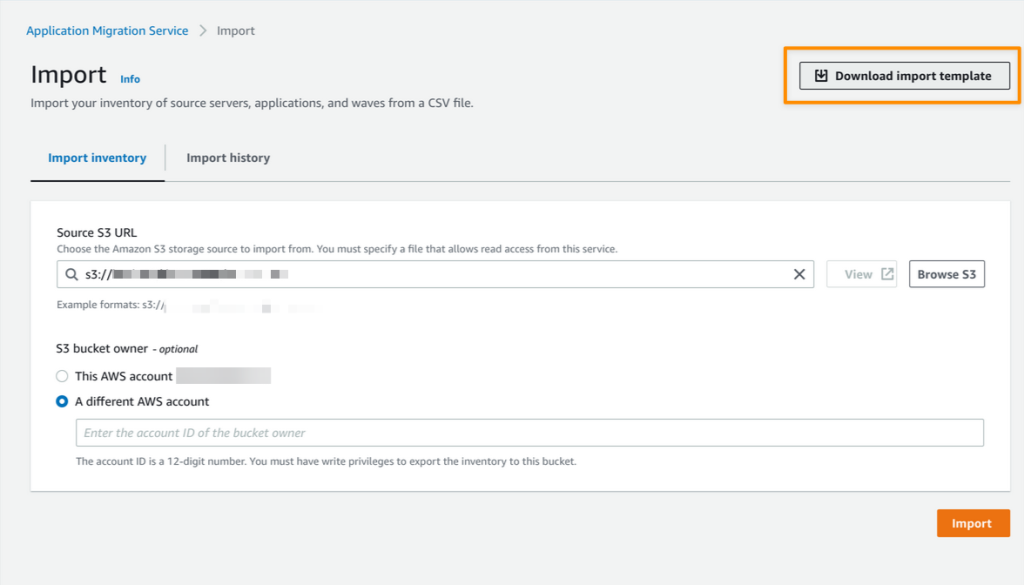
After I downloaded the import template, I can start mapping from my inventory list into this template. While mapping my inventory, I can group related servers into applications and waves. I can also perform configurations, such as defining Amazon Elastic Compute Cloud (Amazon EC2) launch template settings, and specifying tags for each wave.
The following screenshot is an example of the results of my import template:
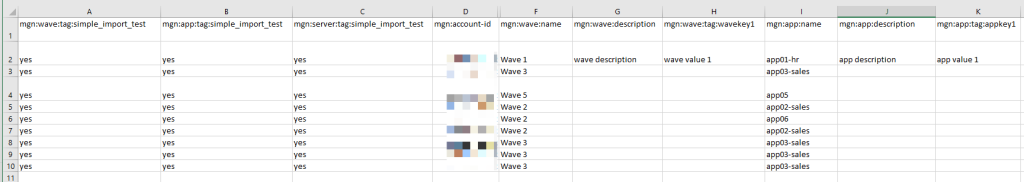
The next step is to upload my CSV file to an Amazon Simple Storage Service (Amazon S3) bucket. Then, I can start the import process from the Application Migration Service console by referencing the CSV file containing my inventory list that I’ve uploaded to the S3 bucket.
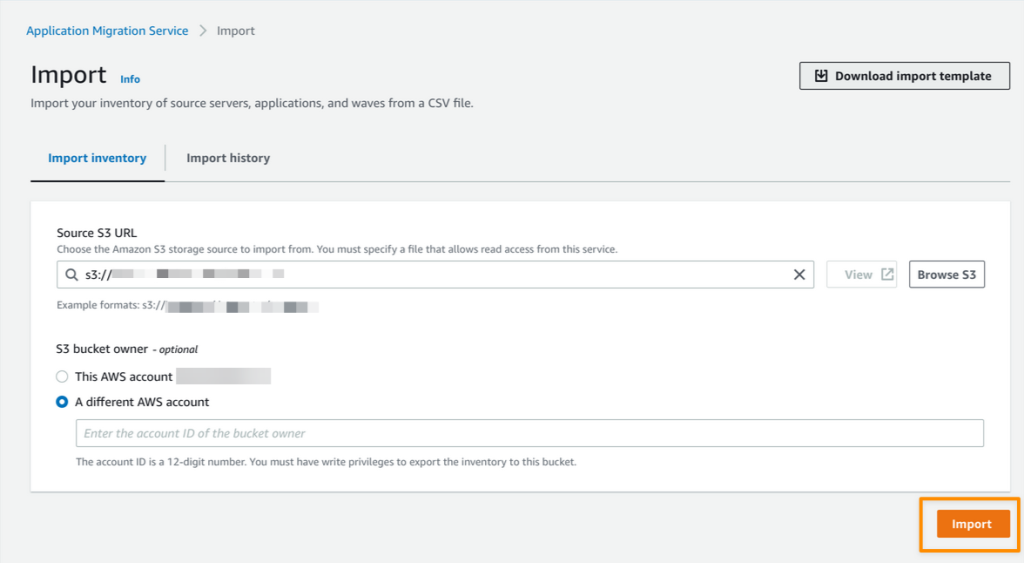
When the import process is complete, I can see the details of the import results.
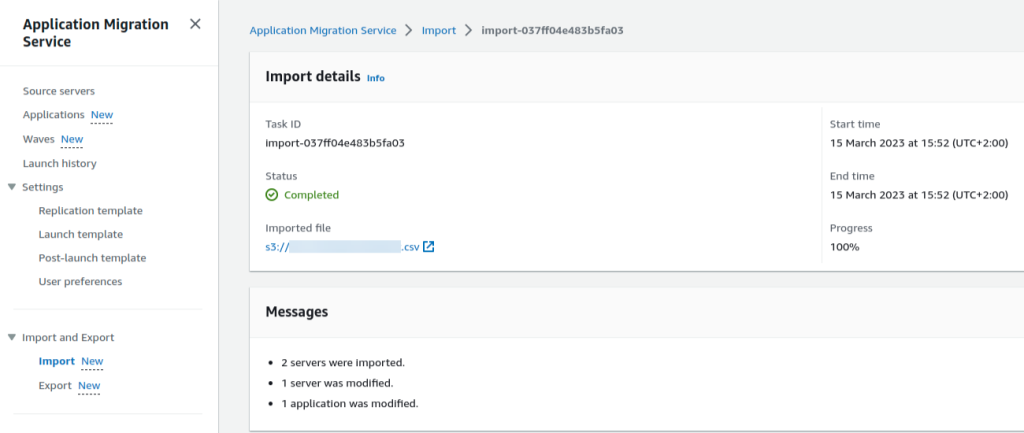
I can import inventory for servers that don’t have an agent installed, or haven’t yet been discovered by agentless replication. However, to replicate data, I need to use agentless replication, or install the AWS Replication Agent on my source servers.
Now I can view all my inventory inside the Source servers, Applications and Waves pages on the Application Migration Service console. The following is a screenshot for recently imported waves.
In addition, with the export feature, I can export my source servers, applications, and waves along with all configurations that I’ve defined into a CSV file.
This is helpful if you want to do reporting or offline reviews, or for bulk editing before reimporting the CSV file into Application Migration Service.
Server Migration Metrics Dashboard
We previously supported a migration metrics dashboard for applications and waves. In this release, we have specifically added a migration metrics dashboard for servers. Now you can view aggregated overviews of your server’s migration process on the Application Migration Service dashboard. Three topics are available in the migration metrics dashboard:
- Alerts – Shows associated alerts for respective servers.
- Data replication status – Shows the replication data overview status for source servers. Here, you get a quick overview of the lifecycle status of the replication data process.
- Migration lifecycle – Shows an overview of the migration lifecycle from source servers.
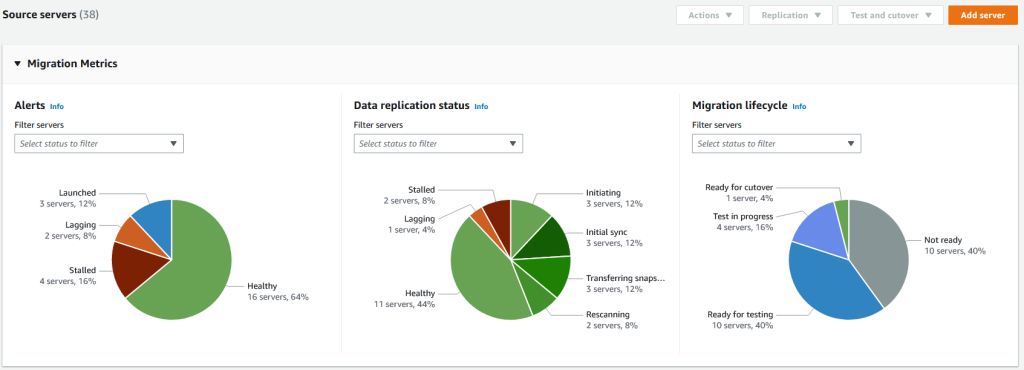
Additional Predefined Post-launch Modernization Actions
Post-launch actions allow you to control and automate actions performed after your servers have been launched in AWS. You can use predefined or use custom post-launch actions.
Application Migration Service now has eight additional predefined post-launch actions to run in your EC2 instances on top of the existing four predefined post-launch actions. These additional post-launch actions provide you with flexibility to maximize your migration experience.
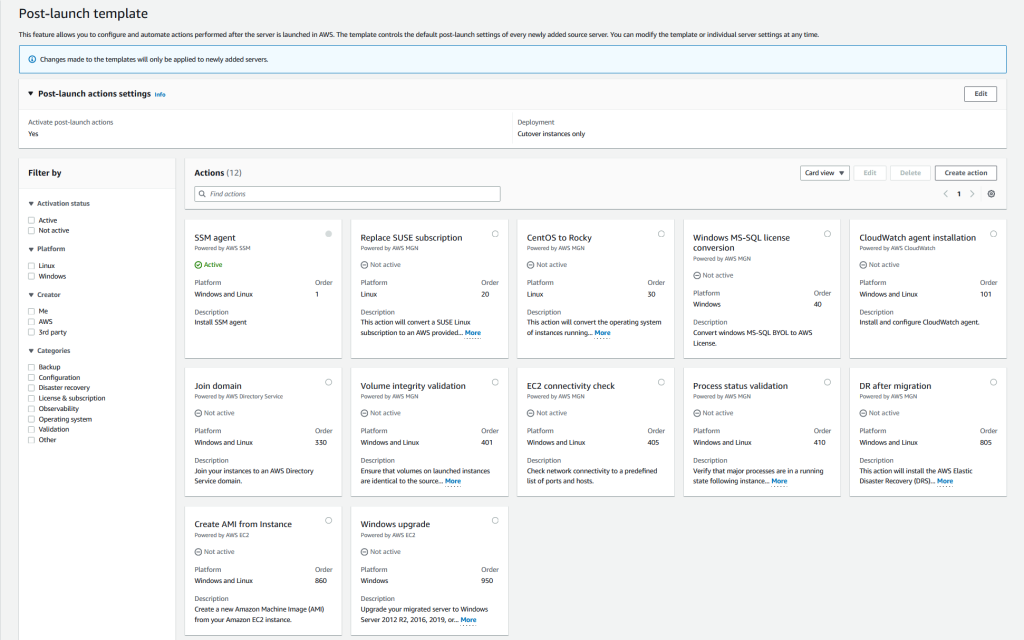
The new additional predefined post-launch actions are as follows:
- Convert MS-SQL license – You can easily convert Windows MS-SQL BYOL to an AWS license using the Windows MS-SQL license conversion action. The launch process includes checking the SQL edition (Enterprise, Standard, or Web) and using the right AMI with the right billing code.
- Create AMI from instance – You can create a new Amazon Machine Image (AMI) from your Application Migration Service launched instance.
- Upgrade Windows version – This feature allows you to easily upgrade your migrated server to Windows Server 2012 R2, 2016, 2019, or 2022. You can see the full list of available OS versions on AWSEC2-CloneInstanceAndUpgradeWindows page.
- Conduct EC2 connectivity checks – You can conduct network connectivity checks to a predefined list of ports and hosts using the EC2 connectivity check feature.
- Validate volume integrity – You can use this feature to ensure that Amazon Elastic Block Store (Amazon EBS) volumes on the launched instance are the same size as the source, properly mounted on the EC2 instance, and accessible.
- Verify process status – You can validate the process status to ensure that processes are in a running state after instance launch. You will need to provide a list of processes that you want to verify and specify how long the service should wait before testing begins. This feature lets you do the needed validations automatically and saves time by not having to do them manually.
- CloudWatch agent installation – Use the Amazon CloudWatch agent installation feature to install and set up the CloudWatch agent and Application Insights features.
- Join Directory Service domain – You can simplify the AWS join domain process by using this feature. If you choose to activate this action, your instance will be managed by the AWS Cloud Directory (instead of on premises).
Things to Know
Keep in mind the following:
- Updated UI/UX – We have updated the user interface with card layout and table layout view for the action list on the Application Migration Service console. This update helps you to determine which post-launch actions are suitable for your use case . We have also added filter options to make it easy to find relevant actions by operating system, category, and more.
- Support for additional OS versions – Application Migration Service now supports CentOS 5.5 and later and Red Hat Enterprise Linux (RHEL) 5.5 and later operating systems.
- Availability – These features are available now, and you can start using them today in all Regions where Application Migration Service is supported.
Get Started Today
Visit the Application Migration Service User Guide page to learn more about these features and understand the pricing. You can also visit Getting started with AWS Application Migration Service to learn more about how to get started to migrate your workloads.
Happy migrating!
— Donnie
Amazon Chime SDK Call Analytics: Real-Time Voice Tone Analysis and Speaker Search
Post Syndicated from Sébastien Stormacq original https://aws.amazon.com/blogs/aws/amazon-chime-sdk-call-analytics-real-time-voice-tone-analysis-and-speaker-search/
Today, I am pleased to announce the availability of Amazon Chime SDK call analytics, a new set of capabilities that helps make it easier and cost effective to record and generate insights on real-time audio calls: transcription, voice tone analysis, and speaker search. We’ve also improved the Amazon Chime SDK section of the AWS Management Console to let you integrate machine learning (ML)-based services, such as these new call analytics capabilities or Amazon Transcribe into your audio applications in just a few steps.
Voice Analytics: Voice Tone Analysis and Speaker Search
Voice analytics delivers real-time insights into audio conversations. It helps detect and classify participants expressing a positive, neutral, or negative tone. Typically, enterprises working in regulated industries have obligations to record or want to analyze conversations between employees and their business partners, customers, or suppliers.
Voice tone analysis uses ML to extract sentiment from a speech signal based on a joint analysis of lexical and linguistic information as well as acoustic and tonal information. Voice tone analysis for live calls are delivered in the data lake of your choice, on top of which you can create your own dashboards to visualize the data.
Let’s take an example from the finance industry. Trading room supervisors are sometimes required to record all the trading conversations occurring on the floor. Voice tone analysis helps them meet their regulatory requirements. They can also deliver these insights to the traders to help to improve their productivity. But finance is not the only industry that needs to record and analyze calls. We have received similar requests from customers in Business Process Outsourcing (BPO), public sector, healthcare, telecom, and insurance industries.
Alongside with voice tone analysis, your applications can now benefit from speaker search to help match speakers to an existing database. It only requires a short sample to recognize a speaker based on their voice stored in a database of known voices. Speaker search helps your applications expedite caller lookup and enrich call records and transcripts with identity attribution. Speaker search delivers a suggested unique internal identifier for the speaker and a confidence score. The decision to match current the speaker with a known speaker from your organization is up to your application. Some of our customers plan to use speaker search for real-time speaker labeling on communication happening over trading turrets, which are shared devices.
Integration with AI Services in the AWS Management Console
We want to make it easier for developers to add these capabilities into existing telephony applications without requiring expertise in telephony, cloud infrastructure, or AI.
This is why we added a easier-to-use graphical configuration in the Amazon Chime SDK section of the console. On the console, you can choose the AWS AI service you want to use to analyze real-time audio data: voice analytics, Amazon Transcribe, or Amazon Transcribe Call Analytics. Whether you choose to use voice analytics or Amazon Transcribe to generate insights, you don’t have to write any integration code. We manage the integrations with AWS AI services and your voice-based or telephony applications. The console helps you define where you want to send the analytics data: an Amazon Kinesis stream or an Amazon Simple Storage Service (Amazon S3) bucket. Voice analytics can send real-time notifications to a function deployed on AWS Lambda, or an SQS queue or Amazon Simple Notification Service (Amazon SNS) topic.
To visualize insights, call analytics also delivers analyses to a data lake of your choice. You can then use Amazon QuickSight or Tableau to build dashboards and get insights from real-time media. These dashboards can be embedded in apps, wikis, and portals. Of course, we don’t leave you alone with your data. You can download prebuilt dashboards as AWS CloudFormation templates to deploy into your own AWS account. The link to download these templates is available on the console.
Finally, call analytics can generate real-time alerts by posting events to Amazon EventBridge. You can route these events to any destination of your choice, on your AWS account or supported third-party applications.
When using call analytics, you can reduce the initial project time to generate insights from real-time audio from months to days.
How It Works
I’d like to show you how it works.
On the Amazon Chime SDK section of the console, I open Configuration under Call Analytics on the left-side menu. Then, I select Create configuration.
I give a name to my configuration. Optionally, I may also associate tags.

Under Configure analytics service, I can choose between Amazon Chime SDK voice analytics or Amazon Transcribe services to analyse calls. For this demo, I select Voice analytics.
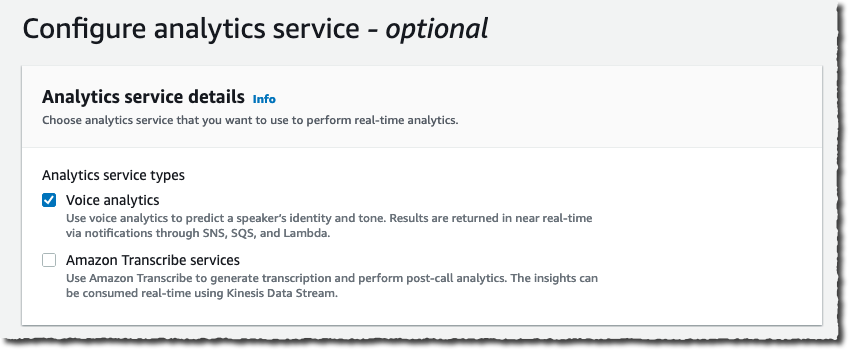
I configure where to send the analysis. Voice analytics results are always sent to Kinesis. I specify a Kinesis data stream I created previously. When I want to use a business intelligence tool such as Quicksight to create a dashboard with analytics results, I also specify an S3 bucket to receive the analysis.
The console also gives me the link to the CloudFormation templates I can use to create the voice analytics dashboards.
Finally, I choose a Lambda function, SQS queue, or SNS topic that will receive notifications of events such as when the analytics are available, a new voice enrollment occurs, or the result of a voice verification. In the later case, the payload looks as follow:
{
    ...common to all events...
    "detail-type": "SpeakerSearchStatus",
    "detail": {
        "taskId": "uuid",
        "detailStatus": "IdentificationSuccessful",
        "speakerSearchDetails" : {
            "results": [
                {
                    "voiceProfileId": "guid",
                    "confidenceScore": "0.94",
                },
                {
                    "voiceProfileId": "guid",
                    "confidenceScore": "0.92",
                },
                {
                    "voiceProfileId": "guid",
                    "confidenceScore": "0.91",
                },
                ... (up to 10)
            ]
        },
        "isCaller": false,
        "voiceConnectorId": "guid",
        "transactionId": "guid"

        ...details from Voice connector
    }
}
For this demo, I choose an existing SQS queue.
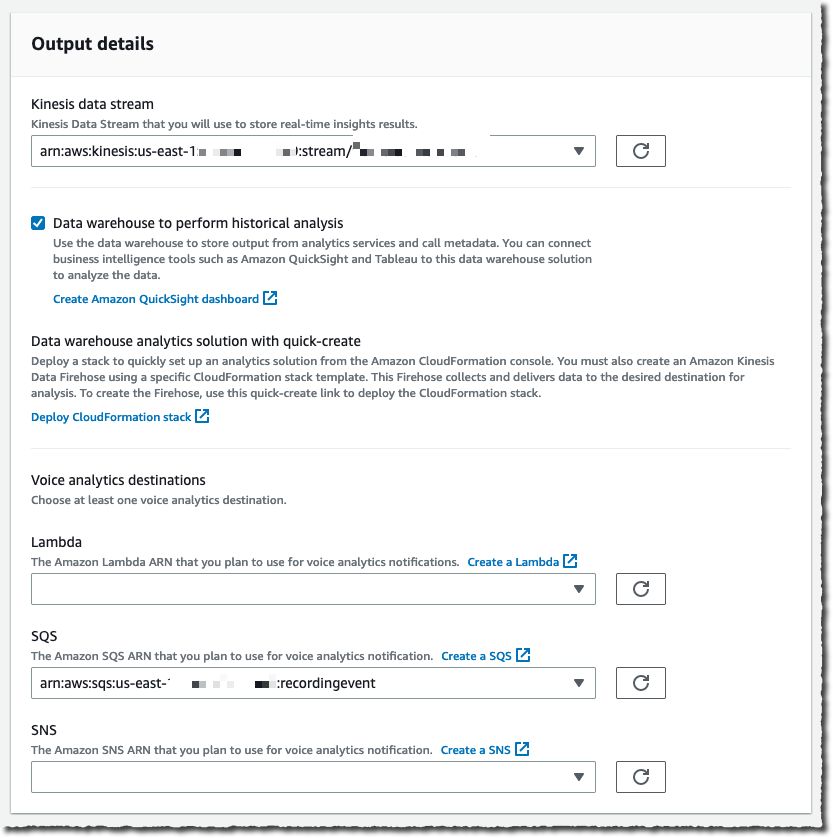
Under Consent acknowledgment, I select all the boxes and select Next.

The next step is only available when I didn’t specify any analytics service in the previous step. It allows us to configure voice recordings. Recordings are available when no analytics are selected.
Under Configure access permissions, I choose a previously created AWS Identity and Access Management (IAM) role allowing the Amazon Chime SDK to access the other AWS services I configured: the Kinesis data stream, S3 bucket, and Lambda function, SQS queue, or SNS topic. The console may create an IAM role for me if I don’t have one already.
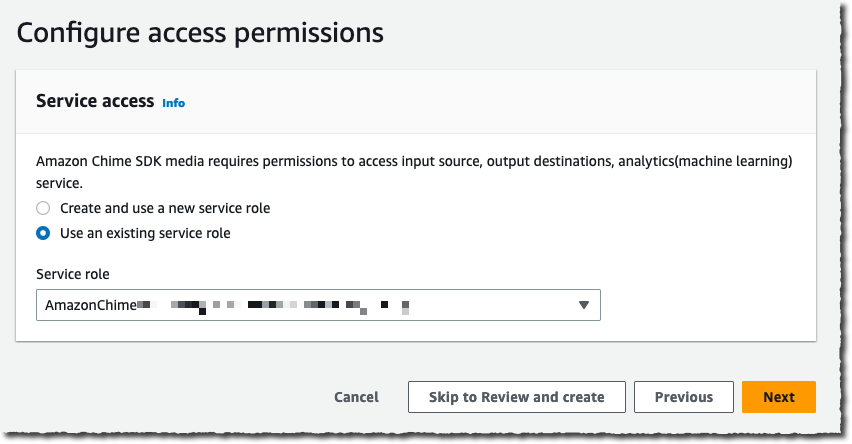
The next step is available if I selected Amazon Transcribe service under Configure analytics service. It allows me to configure real-time alerts through EventBridge. I may configure rules to send messages based on keyword match, sentiment detected, or issue detection.
The final step is Review and Create my configuration. I review the configuration details and then, I select Create configuration.
Finally, I link this configuration to a voice connector under the Voice Connector section, on the Streaming tab.
That’s it! As I mentioned earlier, no glue between AWS services or AI knowledge is required.
After the data arrives on Kinesis or your S3 bucket, you can point your preferred business reporting solution at it. When you use the QuickSight template we provide, you can get started in minutes with a high-level overview and a deep-dive view, as shown on the following screenshot.
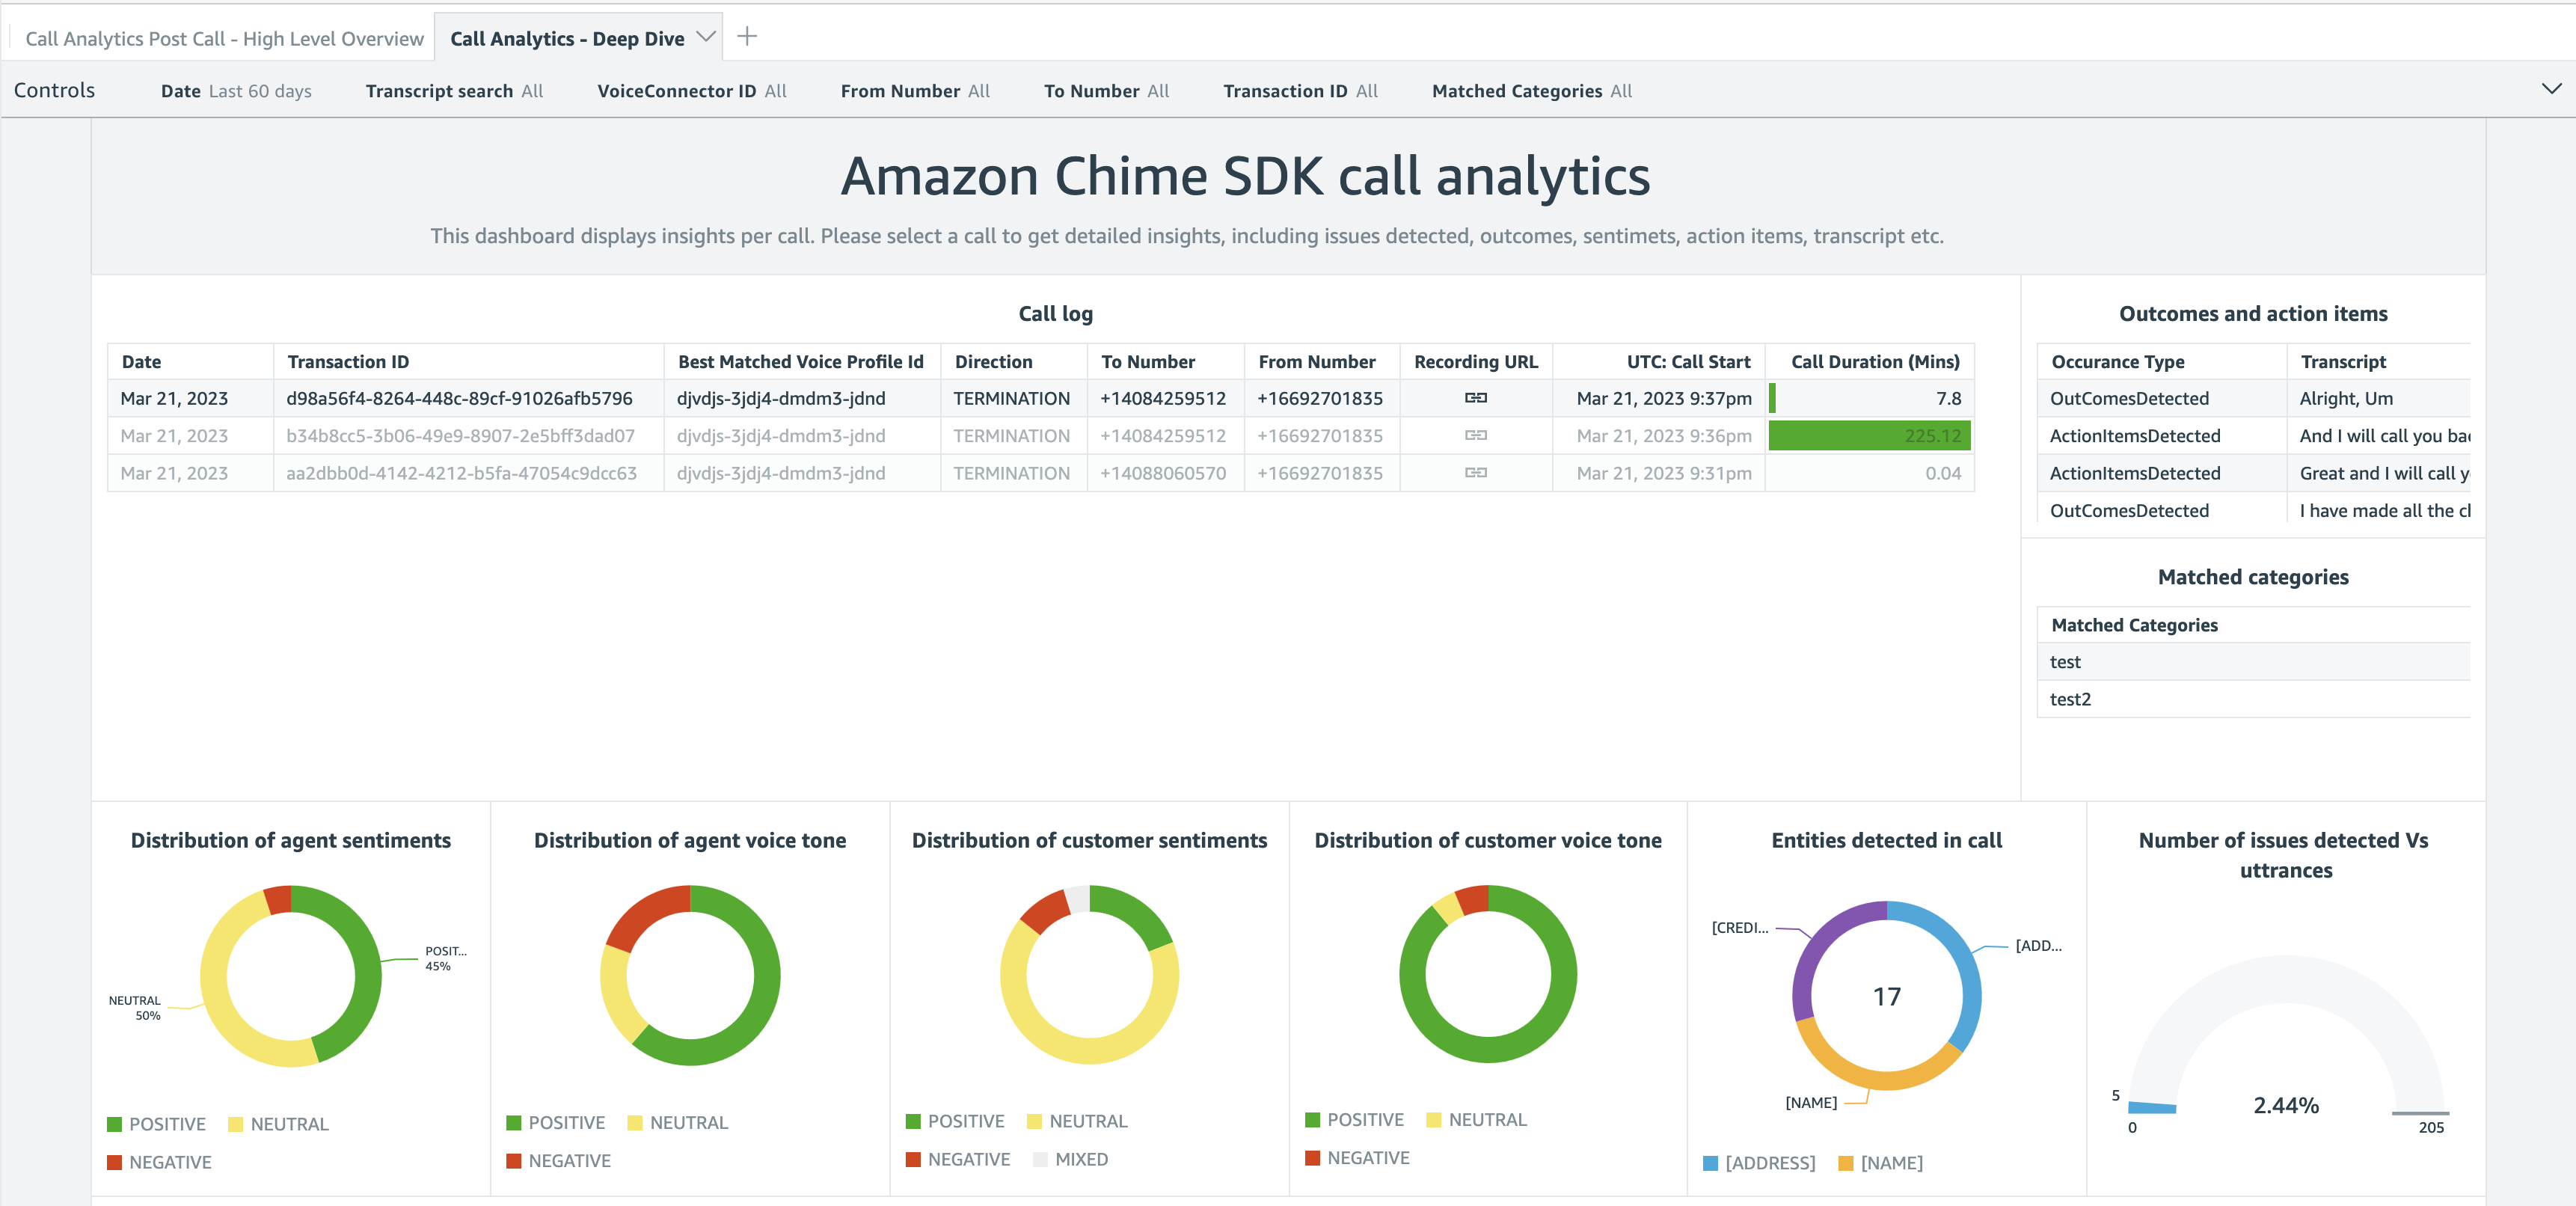

The deep-dive dashboard gives you graphical representations about the distribution of agent and customer sentiments and emotions. You also get a detailed analysis and transcript of the conversation.
Pricing and Availability
Adopting these capabilities in your audio applications requires no up-front infrastructure investment; you will be charged based only on your usage. Pricing is per minute of audio data analyzed. Visit Amazon Chime SDK pricing for details.
Call analytics is available in the following AWS Regions: US East (Ohio, N. Virginia), Asia Pacific (Singapore), and Europe (Frankfurt).
In this post, I discussed Amazon Chime SDK call analytics, a new set of capabilities that makes it easier and cost-effective to record and generate insights on real-time audio calls. With their focus on ease of use, these new capabilities are particularly well adapted to customers with minimal knowledge of cloud infrastructure, telephony, and ML.
Start today and configure your first dashboard!
Color Night Vision Cameras – Dahua Amcrest EmpireTech Annke
Post Syndicated from digiblurDIY original https://www.youtube.com/watch?v=jknu_k7DTyM
Мерки за справяне с дезинформационните кампании
Post Syndicated from Bozho original https://blog.bozho.net/blog/4041
Неутрализирането на дезинформационни кампании е деликатна тема. Защото винаги някой чете „борба с дезинформацията“ като „заглушаване на свободата на словото“. И действително ледът е тънък, затова основен принцип, от който се ръководя е „не трябва държавата да може блокира съдържание, защото го смята за грешно“.
Но възползвайки се от тази европейска ценност, и Кремъл, и местни играчи, организират дезинформационни кампании с политически и геополитически цели. Именно за това не можем да вдигнем ръце и да кажем „к’вото-такова“, оставяйки пропагандните наративи да достигат до все повече хора без насрещна реакция.
Ето няколко доста специфични мерки, които предвиждам, и които не включват цензура. Някои от тях изискват законодателна инициатива, като още в миналия парламент предложихме законови изменения:
- задължение за идентифициране на трол ферми от големите социални мрежи. Това не са хора с различно мнение или дори индивидуални анонимни акаунти. Това са много на брой профили, които действат координирано, за да промотират пропагандни наративи – чрез споделяне, харесване, публикуване в групи, коментари. И в момента те са забранени, но социалните мрежи полагат минимални усилия да прилагат собствената си забрана.
- ограничаване на алгоритмичните изкривявания при препоръчване на съдържание, за да не се препоръчва толкова много най-сензационното и скандално съдържание. По този проблем правомощия вече има Европейската комисия, като България ще участва в тази политика, давайки местната гледна точка, както направих миналата пролет при срещите си с комисарите Юрова и Бретон
- прозрачност на модерацията и възможност обжалване – това е предвидено в скоро приетия акт за цифровите услуги на ЕС, като ние предложихме и ще предложим пак местна уредба, така че блокираните профили да могат да обжалват пред трета страна. А социалните мрежи ще трябва да предоставят повече информация за модераторските си практики, които са скрили под корпоративната тайна (и отказаха отговор на всеки въпрос, поставен в документите от изслулването, което проведохме по темата)
- стратегическа комуникация – държавата трябва да има процес за реакция на пропагандни наративи, а именно – да комуникира навременно и адекватно вярната (според нея) информация. В момента се стига до това министри в личните си профили да опровергават фалшиви новини, като напр. тази, че ще изпращаме военни в Украйна (не, няма). Но този процес трябва да е структуриран – да се следи какви лъжи „бълкбукат“ в пространството и да се обяснява човешки и разбираемо гледната точка на институциите (няма да кажа „истината“ или „фактите“, защото не можем да презюмираме, че държавата ще е права, но поне да има симетрия в комуникацията
- ограничаване на финансирането на фалшиви новини чрез реклами – в момента съществуват рекламни мрежи, които разпространяват подвеждащи реклами, които не отговарят на закона (псевдо-медицински продукти за отслабване и подобни, всички сме ги виждали). Сайтовете с фалшиви новини все по-рядко могат да ползват рекламни мрежи с добра репутация и прибягват до такива отвъд закона. Държавата може са си свърши работата по закононарушенията, като глоби рекламните мрежи, като страничен ефект ще бъде спиране на притока на пари към тези сайтове. Това не значи спиране на сайтовете, разбира се.
- образование, образование, образование – всички мерки по-горе са краткосрочни. Дългосрочната мярка е възпитаването на критично мислене и гражданското образование.
Защо отделям толкова внимание на това? Защото е важно за националната сигурност. Ако външни и вътрешни фактори могат да изкривяват общественото мнение в своя полза чрез дезинформация, и това доведе до грешни политически решения, страдат всички. И затова е важно внимателно и без създаване на инструменти за цензура, да отбиваме пропагандните атаки.
Материалът Мерки за справяне с дезинформационните кампании е публикуван за пръв път на БЛОГодаря.
[$] The curious case of O_DIRECTORY|O_CREAT
Post Syndicated from original https://lwn.net/Articles/926782/
The open()
system call offers a number of flags that modify its behavior; not all
combinations of those flags make sense in a single call. It turns out,
though, that the kernel has responded in a surprising way to the
combination of O_CREAT and O_DIRECTORY for a long time.
After a 2020 change made that response even more surprising, it seems
likely that this behavior will soon be fixed, resulting in a rare user-visible
semantic change to a core system call.
GnuCash 5.0 Released
Post Syndicated from original https://lwn.net/Articles/927450/
Version 5.0 of the GnuCash accounting tool is out. Changes include a
number of investment-tracking improvements, better completion in the
register window, a reworked report-generation system, and more.