Tag Archives: Amazon CodeGuru

Amazon CodeGuru Reviewer Introduces Secrets Detector to Identify Hardcoded Secrets and Secure Them with AWS Secrets Manager

Post Syndicated from Alex Casalboni original https://aws.amazon.com/blogs/aws/codeguru-reviewer-secrets-detector-identify-hardcoded-secrets/

Amazon CodeGuru helps you improve code quality and automate code reviews by scanning and profiling your Java and Python applications. CodeGuru Reviewer can detect potential defects and bugs in your code. For example, it suggests improvements regarding security vulnerabilities, resource leaks, concurrency issues, incorrect input validation, and deviation from AWS best practices.

One of the most well-known security practices is the centralization and governance of secrets, such as passwords, API keys, and credentials in general. As many other developers facing a strict deadline, I’ve often taken shortcuts when managing and consuming secrets in my code, using plaintext environment variables or hard-coding static secrets during local development, and then inadvertently commit them. Of course, I’ve always regretted it and wished there was an automated way to detect and secure these secrets across all my repositories.

Today, I’m happy to announce the new Amazon CodeGuru Reviewer Secrets Detector, an automated tool that helps developers detect secrets in source code or configuration files, such as passwords, API keys, SSH keys, and access tokens.

These new detectors use machine learning (ML) to identify hardcoded secrets as part of your code review process, ultimately helping you to ensure that all new code doesn’t contain hardcoded secrets before being merged and deployed. In addition to Java and Python code, secrets detectors also scan configuration and documentation files. CodeGuru Reviewer suggests remediation steps to secure your secrets with AWS Secrets Manager, a managed service that lets you securely and automatically store, rotate, manage, and retrieve credentials, API keys, and all sorts of secrets.

This new functionality is included as part of the CodeGuru Reviewer service at no additional cost and supports the most common API providers, such as AWS, Atlassian, Datadog, Databricks, GitHub, Hubspot, Mailchimp, Salesforce, SendGrid, Shopify, Slack, Stripe, Tableau, Telegram, and Twilio. Check out the full list here.

Secrets Detectors in Action
First, I select CodeGuru from the AWS Secrets Manager console. This new flow lets me associate a new repository and run a full repository analysis with the goal of identifying hardcoded secrets.

Associating a new repository only takes a few seconds. I connect my GitHub account, and then select a repository named hawkcd, which contains a few Java, C#, JavaScript, and configuration files.

A few minutes later, my full repository is successfully associated and the full scan is completed. I could also have a look at a demo repository analysis called DemoFullRepositoryAnalysisSecrets. You’ll find this demo in the CodeGuru console, under Full repository analysis, in your AWS Account.

I select the repository analysis and find 42 recommendations, including one recommendation for a hardcoded secret (you can filter recommendations by Type=Secrets). CodeGuru Reviewer identified a hardcoded AWS Access Key ID in a .travis.yml file.

The recommendation highlights the importance of storing these secrets securely, provides a link to learn more about the issue, and suggests rotating the identified secret to make sure that it can’t be reused by malicious actors in the future.

CodeGuru Reviewer lets me jump to the exact file and line of code where the secret appears, so that I can dive deeper, understand the context, verify the file history, and take action quickly.

Last but not least, the recommendation includes a Protect your credential button that lets me jump quickly to the AWS Secrets Manager console and create a new secret with the proper name and value.

I’m going to remove the plaintext secret from my source code and update my application to fetch the secret value from AWS Secrets Manager. In many cases, you can keep the current configuration structure and use existing parameters to store the secret’s name instead of the secret’s value.

Once the secret is securely stored, AWS Secrets Manager also provides me with code snippets that fetch my new secret in many programming languages using the AWS SDKs. These snippets let me save time and include the necessary SDK call, as well as the error handling, decryption, and decoding logic.

I’ve showed you how to run a full repository analysis, and of course the same analysis can be performed continuously on every new pull request to help you prevent hardcoded secrets and other issues from being introduced in the future.

Available Today with CodeGuru Reviewer
CodeGuru Reviewer Secrets Detector is available in all regions where CodeGuru Reviewer is available, at no additional cost.

If you’re new to CodeGuru Reviewer, you can try it for free for 90 days with repositories up to 100,000 lines of code. Connecting your repositories and starting a full scan takes only a couple of minutes, whether your code is hosted on AWS CodeCommit, BitBucket, or GitHub. If you’re using GitHub, check out the GitHub Actions integration as well.

You can learn more about Secrets Detector in the technical documentation.

Alex

Detect Python and Java code security vulnerabilities with Amazon CodeGuru Reviewer

Post Syndicated from Haider Naqvi original https://aws.amazon.com/blogs/devops/detect-python-and-java-code-security-vulnerabilities-with-codeguru-reviewer/

with Aaron Friedman (Principal PM-T for xGuru services)

Amazon CodeGuru is a developer tool that uses machine learning and automated reasoning to catch hard to find defects and security vulnerabilities in application code. The purpose of this blog is to show how new CodeGuru Reviewer features help improve the security posture of your Python applications and highlight some of the specific categories of code vulnerabilities that CodeGuru Reviewer can detect. We will also cover newly expanded security capabilities for Java applications.

Amazon CodeGuru Reviewer can detect code vulnerabilities and provide actionable recommendations across dozens of the most common and impactful categories of code security issues (as classified by industry-recognized standards, Open Web Application Security, OWASP , “top ten” and Common Weakness Enumeration, CWE. The following are some of the most severe code vulnerabilities that CodeGuru Reviewer can now help you detect and prevent:

  • Injection weaknesses typically appears in data-rich applications. Every year, hundreds of web servers are compromised using SQL Injection. An attacker can use this method to bypass access control and read or modify application data.
  • Path Traversal security issues occur when an application does not properly handle special elements within a provided path name. An attacker can use it to overwrite or delete critical files and expose sensitive data.
  • Null Pointer Dereference issues can occur due to simple programming errors, race conditions, and others. Null Pointer Dereference can cause availability issues in rare conditions. Attackers can use it to read and modify memory.
  • Weak or broken cryptography is a risk that may compromise the confidentiality and integrity of sensitive data.

Security vulnerabilities present in source code can result in application downtime, leaked data, lost revenue, and lost customer trust. Best practices and peer code reviews aren’t sufficient to prevent these issues. You need a systematic way of detecting and preventing vulnerabilities from being deployed to production. CodeGuru Reviewer Security Detectors can provide a scalable approach to DevSecOps, a mechanism that employs automation to address security issues early in the software development lifecycle. Security detectors automate the detection of hard-to-find security vulnerabilities in Java and now Python applications, and provide actionable recommendations to developers.

By baking security mechanisms into each step of the process, DevSecOps enables the development of secure software without sacrificing speed. However, false positive issues raised by Static Application Security Testing (SAST) tools often must be manually triaged effectively and work against this value. CodeGuru uses techniques from automated reasoning, and specifically, precise data-flow analysis, to enhance the precision of code analysis. CodeGuru therefore reports fewer false positives.

Many customers are already embracing open-source code analysis tools in their DevSecOps practices. However, integrating such software into a pipeline requires a heavy up front lift, ongoing maintenance, and patience to configure. Furthering the utility of new security detectors in Amazon CodeGuru Reviewer, this update adds integrations with Bandit  and Infer, two widely-adopted open-source code analysis tools. In Java code bases, CodeGuru Reviewer now provide recommendations from Infer that detect null pointer dereferences, thread safety violations and improper use of synchronization locks. And in Python code, the service detects instances of SQL injection, path traversal attacks, weak cryptography, or the use of compromised libraries. Security issues found and recommendations generated by these tools are shown in the console, in pull requests comments, or through CI/CD integrations, alongside code recommendations generated by CodeGuru’s code quality and security detectors. Let’s dive deep and review some examples of code vulnerabilities that CodeGuru Reviewer can help detect.

Injection (Python)

Amazon CodeGuru Reviewer can help detect the most common injection vulnerabilities including SQL, XML, OS command, and LDAP types. For example, SQL injection occurs when SQL queries are constructed through string formatting. An attacker could manipulate the program inputs to modify the intent of the SQL query. The following python statement executes a SQL query constructed through string formatting and can be an attack vector:

import sqlite3
from flask import request

def removing_product():
    productId = request.args.get('productId')
    str = 'DELETE FROM products WHERE productID = ' + productId
    return str

def sql_injection():
    connection = psycopg2.connect("dbname=test user=postgres")
    cur = db.cursor()
    query = removing_product()
    cur.execute(query)

CodeGuru will flag a potential SQL injection using Bandit security detector, will make the following recommendation:

>> We detected a SQL command that might use unsanitized input. 
This can result in an SQL injection. To increase the security of your code, 
sanitize inputs before using them to form a query string.

To avoid this, the user should correct the code to use a parameter sanitization mechanism that guards against SQL injection as done below:

import sqlite3
from flask import request

def removing_product():
    productId = sanitize_input(request.args.get('productId'))
    str = 'DELETE FROM products WHERE productID = ' + productId
    return str

def sql_injection():
    connection = psycopg2.connect("dbname=test user=postgres")
    cur = db.cursor()
    query = removing_product()
    cur.execute(query)

In the above corrected code, user supplied sanitize_input method will take care of sanitizing user inputs.

Path Traversal (Python)

When applications use user input to create a path to read or write local files, an attacker can manipulate the input to overwrite or delete critical files or expose sensitive data. These critical files might include source code, sensitive, or application configuration information.

@app.route('/someurl')
def path_traversal():
    file_name = request.args["file"]
    f = open("./{}".format(file_name))
    f.close()

In above example, file name is directly passed to an open API without checking or filtering its content.

CodeGuru’s recommendation:

>> Potentially untrusted inputs are used to access a file path.
To protect your code from a path traversal attack, verify that your inputs are
sanitized.

In response, the developer should sanitize data before using it for creating/opening file.

@app.route('/someurl')
def path_traversal():
file_name = sanitize_data(request.args["file"])
f = open("./{}".format(file_name))
f.close()

In this modified code, input data file_name has been clean/filtered by sanitized_data api call.

Null Pointer Dereference (Java)

Infer detectors are a new addition that complement CodeGuru Reviewer native Java Security Detectors. Infer detectors, based on the Facebook Infer static analyzer, include rules to detect null pointer dereferences, thread safety violations, and improper use of synchronization locks. In particular, the null-pointer-dereference rule detects paths in the code that lead to null pointer exceptions in Java. Null pointer dereference is a very common pitfall in Java and is considered one of 25 most dangerous software weaknesses.

The Infer null-pointer-dereference rule guards against unexpected null pointer exceptions by detecting locations in the code where pointers that could be null are dereferenced. CodeGuru augments the Infer analyzer with knowledge about the AWS APIs, which allows the security detectors to catch potential null pointer exceptions when using AWS APIs.

For example, the AWS DynamoDBMapper class provides a convenient abstraction for mapping Amazon DynamoDB tables to Java objects. However, developers should be aware that DynamoDB Mapper load operations can return a null pointer if the object was not found in the table. The following code snippet updates a record in a catalog using a DynamoDB Mapper:

DynamoDBMapper mapper = new DynamoDBMapper(client);
// Retrieve the item.
CatalogItem itemRetrieved = mapper.load(
CatalogItem.class, 601);
// Update the item.
itemRetrieved.setISBN("622-2222222222");
itemRetrieved.setBookAuthors(
new HashSet<String>(Arrays.asList(
"Author1", "Author3")));
mapper.save(itemRetrieved);

CodeGuru will protect against a potential null dereference by making the following recommendation:

object `itemRetrieved` last assigned on line 88 could be null
and is dereferenced at line 90.

In response, the developer should add a null check to prevent the null pointer dereference from occurring.

DynamoDBMapper mapper = new DynamoDBMapper(client);
// Retrieve the item.
CatalogItem itemRetrieved = mapper.load(CatalogItem.class, 601);
// Update the item.
if (itemRetrieved != null) {
itemRetrieved.setISBN("622-2222222222");
itemRetrieved.setBookAuthors(
new HashSet<String>(Arrays.asList(
"Author1","Author3")));
mapper.save(itemRetrieved);
} else {
throw new CatalogItemNotFoundException();
}

Weak or broken cryptography  (Python)

Python security detectors support popular frameworks along with built-in APIs such as cryptography, pycryptodome etc. to identify ciphers related vulnerability. As suggested in CWE-327 , the use of a non-standard/inadequate key length algorithm is dangerous because attacker may be able to break the algorithm and compromise whatever data has been protected. In this example, `PBKDF2` is used with a weak algorithm and may lead to cryptographic vulnerabilities.
from Crypto.Protocol.KDF import PBKDF2
from Crypto.Hash import SHA1

def risky_crypto_algorithm(password):
salt = get_random_bytes(16)
keys = PBKDF2(password, salt, 64, count=1000000,
hmac_hash_module=SHA1)

SHA1 is used to create a PBKDF2, however, it is insecure hence not recommended for PBKDF2. CodeGuru’s identifies the issue and makes the following recommendation:

>> The `PBKDF2` function is using a weak algorithm which might
lead to cryptographic vulnerabilities. We recommend that you use the
`SHA224`, `SHA256`, `SHA384`,`SHA512/224`, `SHA512/256`, `BLAKE2s`,
`BLAKE2b`, `SHAKE128`, `SHAKE256` algorithms.

In response, the developer should use the correct SHA algorithm to protect against potential cipher attacks.

from Crypto.Protocol.KDF import PBKDF2
from Crypto.Hash import SHA512

def risky_crypto_algorithm(password):
salt = get_random_bytes(16)
keys = PBKDF2(password, salt, 64, count=1000000,
hmac_hash_module=SHA512)

This modified example uses high strength SHA512 algorithm.

Conclusion

This post reviewed Amazon CodeGuru Reviewer security detectors and how they automatically check your code for vulnerabilities and provide actionable recommendations in code reviews. We covered new capabilities for detecting issues in Python applications, as well as additional security features from Bandit and Infer. Together CodeGuru Reviewer’s security features provide a scalable approach for customers embracing DevSecOps, a mechanism that requires automation to address security issues earlier in the software development lifecycle. CodeGuru automates detection and helps prevent hard-to-find security vulnerabilities, accelerating DevSecOps processes for application development workflow.

You can get started from the CodeGuru console by running a full repository scan or integrating CodeGuru Reviewer with your supported CI/CD pipeline. Code analysis from Infer and Bandit is included as part of the standard CodeGuru Reviewer service.

For more information about automating code reviews and application profiling with Amazon CodeGuru, check out the AWS DevOps Blog. For more details on how to get started, visit the documentation.

Help Make BugBusting History at AWS re:Invent 2021

Post Syndicated from Sean M. Tracey original https://aws.amazon.com/blogs/aws/help-make-bugbusting-history-at-aws-reinvent-2021/

Earlier this year, we launched the AWS BugBust Challenge, the world’s first global competition to fix one million code bugs and reduce technical debt by over $100 million. As part of this endeavor, we are launching the first AWS BugBust re:Invent Challenge at this year’s AWS re:Invent conference, from 10 a.m. (PST) November 29 to 2 p.m (PST) December 2, and in doing so, hope to create a new World Record for “Largest Bug Fixing Competition” as recognized by Guinness World Records.

To date, AWS BugBust events have been run internally by organizations that want to reduce the number of code bugs and the impact they have on their external customers. At these events, an event administrator from within the organization invites internal developers to collaborate in a shared AWS account via a unique link allowing them to participate in the challenge. While this benefits the organizations, it limits the reach of the event, as it focuses only on their internal bugs. To increase the impact that the AWS BugBust events have, at this year’s re:Invent we will open up the challenge to anybody with Java or Python knowledge to help fix open-source code bases.

Historically, finding bugs has been a labor-intensive challenge. 620 million developer hours are wasted each year searching for potential bugs in a code base and patching them before they can cause any trouble in production – or worse yet, fix them on-the-fly when they’re already causing issues. The AWS BugBust re:Invent Challenge uses Amazon CodeGuru, an ML-powered developer tool that provides intelligent recommendations to improve code quality and identify an application’s most expensive lines of code. Rather than reacting to security and operational events caused by bugs, Amazon CodeGuru proactively highlights any potential issues in defined code bases as they’re being written and before they can make it into production. Using CodeGuru, developers can immediately begin picking off bugs and earning points for the challenge.

As part of this challenge, AWS will be including a myriad of open source projects that developers will be able to patch and contribute to throughout the event. Bugs can range from security issues, to duplicate code, to resource leaks and more. Once each bug has been submitted and CodeGuru determines that the issue is resolved, all of the patched software will be released back to the open source projects so that everyone can benefit from the combined efforts to squash software bugs.

The AWS BugBust re:Invent Challenge is open to all developers who have Python or Java knowledge regardless of whether or not they’re attending re:Invent. There will be an array of prizes, from hoodies and fly swatters to Amazon Echo Dots, available to all who participate and meet certain milestones in the challenge. There’s also the coveted title of “Ultimate AWS BugBuster” accompanied by a cash prize of $1500 for whomever earns the most points by squashing bugs during the event.

A screenshot of the AWS BugBust re:Invent challenge registration page

For those attending in-person, we have created the AWS BugBust Hub, a 500 square-foot space in the main exhibition hall. This space will give developers a place to join in with the challenge and track their progress on the AWS BugBust leadership board while maintaining appropriate social-distancing. In addition to the AWS BugBust Hub, there will be an AWS BugBust kiosk located within the event space where developers will be able to sign up to contribute toward the Largest Bug Fixing Challenge World Record attempt. Attendees will also be able to speak with Amazonians from the AWS BugBust SWAT team who will be able to answer questions about the event and provide product demos.

To take part in the AWS BugBust re:Invent Challenge, developers must have an AWS BugBust player account and a GitHub account. Pre-registration for the competition can be done online, or if you’re at re:Invent 2021 in-person you can register to participate at our AWS BugBust Hub or kiosk. If you’re not planning on joining us in person at re:Invent, you can still join us online, fix bugs and earn points to win prizes.

Building an InnerSource ecosystem using AWS DevOps tools

Post Syndicated from Debashish Chakrabarty original https://aws.amazon.com/blogs/devops/building-an-innersource-ecosystem-using-aws-devops-tools/

InnerSource is the term for the emerging practice of organizations adopting the open source methodology, albeit to develop proprietary software. This blog discusses the building of a model InnerSource ecosystem that leverages multiple AWS services, such as CodeBuild, CodeCommit, CodePipeline, CodeArtifact, and CodeGuru, along with other AWS services and open source tools.

What is InnerSource and why is it gaining traction?

Most software companies leverage open source software (OSS) in their products, as it is a great mechanism for standardizing software and bringing in cost effectiveness via the re-use of high quality, time-tested code. Some organizations may allow its use as-is, while others may utilize a vetting mechanism to ensure that the OSS adheres to the organization standards of security, quality, etc. This confidence in OSS stems from how these community projects are managed and sustained, as well as the culture of openness, collaboration, and creativity that they nurture.

Many organizations building closed source software are now trying to imitate these development principles and practices. This approach, which has been perhaps more discussed than adopted, is popularly called “InnerSource”. InnerSource serves as a great tool for collaborative software development within the organization perimeter, while keeping its concerns for IP & Legality in check. It provides collaboration and innovation avenues beyond the confines of organizational silos through knowledge and talent sharing. Organizations reap the benefits of better code quality and faster time-to-market, yet at only a fraction of the cost.

What constitutes an InnerSource ecosystem?

Infrastructure and processes that harbor collaboration stand at the heart of InnerSource ecology. These systems (refer Figure 1) would typically include tools supporting features such as code hosting, peer reviews, Pull Request (PR) approval flow, issue tracking, documentation, communication & collaboration, continuous integration, and automated testing, among others. Another major component of this system is an entry portal that enables the employees to discover the InnerSource projects and join the community, beginning as ordinary users of the reusable code and later graduating to contributors and committers.

A typical InnerSource ecosystem

Figure 1: A typical InnerSource ecosystem

More to InnerSource than meets the eye

This blog focuses on detailing a technical solution for establishing the required tools for an InnerSource system primarily to enable a development workflow and infrastructure. But the secret sauce of an InnerSource initiative in an enterprise necessitates many other ingredients.

InnerSource Roles & Use Cases

Figure 2: InnerSource Roles & Use Cases

InnerSource thrives on community collaboration and a low entry barrier to enable adoptability. In turn, that demands a cultural makeover. While strategically deciding on the projects that can be inner sourced as well as the appropriate licensing model, enterprises should bootstrap the initiative with a seed product that draws the community, with maintainers and the first set of contributors. Many of these users would eventually be promoted, through a meritocracy-based system, to become the trusted committers.

Over a set period, the organization should plan to move from an infra specific model to a project specific model. In a Project-specific InnerSource model, the responsibility for a particular software asset is owned by a dedicated team funded by other business units. Whereas in the Infrastructure-based InnerSource model, the organization provides the necessary infrastructure to create the ecosystem with code & document repositories, communication tools, etc. This enables anybody in the organization to create a new InnerSource project, although each project initiator maintains their own projects. They could begin by establishing a community of practice, and designating a core team that would provide continuing support to the InnerSource projects’ internal customers. Having a team of dedicated resources would clearly indicate the organization’s long-term commitment to sustaining the initiative. The organization should promote this culture through regular boot camps, trainings, and a recognition program.

Lastly, the significance of having a modular architecture in the InnerSource projects cannot be understated. This architecture helps developers understand the code better, as well as aids code reuse and parallel development, where multiple contributors could work on different code modules while avoiding conflicts during code merges.

A model InnerSource solution using AWS services

This blog discusses a solution that weaves various services together to create the necessary infrastructure for an InnerSource system. While it is not a full-blown solution, and it may lack some other components that an organization may desire in its own system, it can provide you with a good head start.

The ultimate goal of the model solution is to enable a developer workflow as depicted in Figure 3.

Typical developer workflow at InnerSource

Figure 3: Typical developer workflow at InnerSource

At the core of the InnerSource-verse is the distributed version control (AWS CodeCommit in our case). To maintain system transparency, openness, and participation, we must have a discovery mechanism where users could search for the projects and receive encouragement to contribute to the one they prefer (Step 1 in Figure 4).

Architecture diagram for the model InnerSource system

Figure 4: Architecture diagram for the model InnerSource system

For this purpose, the model solution utilizes an open source reference implantation of InnerSource Portal. The portal indexes data from AWS CodeCommit by using a crawler, and it lists available projects with associated metadata, such as the skills required, number of active branches, and average number of commits. For CodeCommit, you can use the crawler implementation that we created in the open source code repo at https://github.com/aws-samples/codecommit-crawler-innersource.

The major portal feature is providing an option to contribute to a project by using a “Contribute” link. This can present a pop-up form to “apply as a contributor” (Step 2 in Figure 4), which when submitted sends an email (or creates a ticket) to the project maintainer/committer who can create an IAM (Step 3 in Figure 4) user with access to the particular repository. Note that the pop-up form functionality is built into the open source version of the portal. However, it would be trivial to add one with an associated action (send an email, cut a ticket, etc.).

InnerSource portal indexes CodeCommit repos and provides a bird’s eye view

Figure 5: InnerSource portal indexes CodeCommit repos and provides a bird’s eye view

The contributor, upon receiving access, logs in to CodeCommit, clones the mainline branch of the InnerSource project (Step 4 in Figure 4) into a fix or feature branch, and starts altering/adding the code. Once completed, the contributor commits the code to the branch and raises a PR (Step 5 in Figure 4). A Pull Request is a mechanism to offer code to an existing repository, which is then peer-reviewed and tested before acceptance for inclusion.

The PR triggers a CodeGuru review (Step 6 in Figure 4) that adds the recommendations as comments on the PR. Furthermore, it triggers a CodeBuild process (Steps 7 to 10 in Figure 4) and logs the build result in the PR. At this point, the code can be peer reviewed by Trusted Committers or Owners of the project repository. The number of approvals would depend on the approval template rule configured in CodeCommit. The Committer(s) can approve the PR (Step 12 in Figure 4) and merge the code to the mainline branch – that is once they verify that the code serves its purpose, has passed the required tests, and doesn’t break the build. They could also rely on the approval vote from a sanity test conducted by a CodeBuild process. Optionally, a build process could deploy the latest mainline code (Step 14 in Figure 4) on the PR merge commit.

To maintain transparency in all communications related to progress, bugs, and feature requests to downstream users and contributors, a communication tool may be needed. This solution does not show integration with any Issue/Bug tracking tool out of the box. However, multiple of these tools are available at the AWS marketplace, with some offering forum and Wiki add-ons in order to elicit discussions. Standard project documentation can be kept within the repository by using the constructs of the README.md file to provide project mission details and the CONTRIBUTING.md file to guide the potential code contributors.

An overview of the AWS services used in the model solution

The model solution employs the following AWS services:

  • Amazon CodeCommit: a fully managed source control service to host secure and highly scalable private Git repositories.
  • Amazon CodeBuild: a fully managed build service that compiles source code, runs tests, and produces software packages that are ready to deploy.
  • Amazon CodeDeploy: a service that automates code deployments to any instance, including EC2 instances and instances running on-premises.
  • Amazon CodeGuru: a developer tool providing intelligent recommendations to improve code quality and identify an application’s most expensive lines of code.
  • Amazon CodePipeline: a fully managed continuous delivery service that helps automate release pipelines for fast and reliable application and infrastructure updates.
  • Amazon CodeArtifact: a fully managed artifact repository service that makes it easy to securely store, publish, and share software packages utilized in their software development process.
  • Amazon S3: an object storage service that offers industry-leading scalability, data availability, security, and performance.
  • Amazon EC2: a web service providing secure, resizable compute capacity in the cloud. It is designed to ease web-scale computing for developers.
  • Amazon EventBridge: a serverless event bus that eases the building of event-driven applications at scale by using events generated from applications and AWS services.
  • Amazon Lambda: a serverless compute service that lets you run code without provisioning or managing servers.

The journey of a thousand miles begins with a single step

InnerSource might not be the right fit for every organization, but is a great step for those wanting to encourage a culture of quality and innovation, as well as purge silos through enhanced collaboration. It requires backing from leadership to sponsor the engineering initiatives, as well as champion the establishment of an open and transparent culture granting autonomy to the developers across the org to contribute to projects outside of their teams. The organizations best-suited for InnerSource have already participated in open source initiatives, have engineering teams that are adept with CI/CD tools, and are willing to adopt OSS practices. They should start small with a pilot and build upon their successes.

Conclusion

Ever more enterprises are adopting the open source culture to develop proprietary software by establishing an InnerSource. This instills innovation, transparency, and collaboration that result in cost effective and quality software development. This blog discussed a model solution to build the developer workflow inside an InnerSource ecosystem, from project discovery to PR approval and deployment. Additional features, like an integrated Issue Tracker, Real time chat, and Wiki/Forum, can further enrich this solution.

If you need helping hands, AWS Professional Services can help adapt and implement this model InnerSource solution in your enterprise. Moreover, our Advisory services can help establish the governance model to accelerate OSS culture adoption through Experience Based Acceleration (EBA) parties.

References

About the authors

Debashish Chakrabarty

Debashish Chakrabarty

Debashish is a Senior Engagement Manager at AWS Professional Services, India managing complex projects on DevOps, Security and Modernization and help ProServe customers accelerate their adoption of AWS Services. He loves to keep connected to his technical roots. Outside of work, Debashish is a Hindi Podcaster and Blogger. He also loves binge-watching on Amazon Prime, and spending time with family.

Akash Verma

Akash Verma

Akash works as a Cloud Consultant for AWS Professional Services, India. He enjoys learning new technologies and helping customers solve complex technical problems and drive business outcomes by providing solutions using AWS products and services. Outside of work, Akash loves to travel, interact with new people and try different cuisines. He also enjoy gardening, watching Stand-up comedy, and listening to poetry.

How Amazon CodeGuru Reviewer helps Gridium maintain a high quality codebase

Post Syndicated from Aaqib Bickiya original https://aws.amazon.com/blogs/devops/codeguru-gridium-maintain-codebase/

Gridium creates software that lets people run commercial buildings at a lower cost and with less energy. Currently, half of the world lives in cities. Soon, nearly 70% will, while buildings utilize 40% of the world’s electricity. In the U.S. alone, commercial real estate value tops one trillion dollars. Furthermore, much of this asset class is still run with spreadsheets, clipboards, and outdated software. Gridium’s software platform collects large amounts of operational data from commercial buildings like offices, medical providers, and corporate campuses. Then, our analytics identifies energy savings opportunities that we work with customers to actualize.

Gridium’s Challenge

Data streams from utility companies across the U.S. are an essential input for Gridium’s analytics. This data is processed and visualized so that our customers can garner new insights and drive smarter decisions. In order to integrate a new data source into our platform, we often utilize third-party contractors to write tools that ingest data feeds and prepare them for analysis.

Our team firmly emphasizes our codebase quality. We strive for our code to be stylistically consistent, easily testable, swiftly understood, and well-documented. We write code internally by using agreed-upon standards. This makes it easy for us to review and edit internal code using standard collaboration tools.

We work to ensure that code arriving from contractors meets similar standards, but enforcing external code quality can be difficult. Contractor-developed code will be written in the style of each contractor. Furthermore, reviewing and editing code written by contractors introduces new challenges beyond those of working with internal code. We have used tools like PyLint to help stylistically align code, but we wanted a method for uncovering more complex issues without burdening the team and undermining the benefits of outside contractors.

Adopting Amazon CodeGuru Reviewer

We began evaluating Amazon CodeGuru Reviewer in order to provide an additional review layer for code developed by contractors, and to find complex corrections within code that traditional tools might not catch.

Initially, we enabled the service only on external repositories and generated reviews on pull requests. CodeGuru immediately provided us with actionable recommendations for maintaining Gridium’s codebase quality.

CodeGuru exception handling correction

The example above demonstrates a useful recurring recommendation related to exception-handling. Strictly speaking, there is nothing wrong with utilizing a general Exception class whenever needed. However, utilizing general Exception classes in production can complicate error-handling functions and generate ambiguity when trying to debug or understand code.

After a few weeks of utilizing CodeGuru Reviewer and witnessing its benefits, we determined that we wanted to use it for our entire codebase. Moreover, CodeGuru provided us with meaningful recommendations on our internal repositories.

CodeGuru highly depend functions suggestions

This example once again showcases CodeGuru’s ability to highlight subtle issues that aren’t necessarily bugs. Without diving through related libraries and functions, it would be difficult to find any optimizable areas, but CodeGuru found that this function could become problematic due to its dependency on twenty other functions. If any of the dependencies is updated, then it could break the entire function, thereby making debugging the root cause difficult.

The explanations following each code recommendation were essential in our quick adoption of CodeGuru. Simply showing what code to change would make it tough to follow through with a code correction. CodeGuru provided ample context, reasoning, and even metrics in some cases to explain and justify a correction.

Conclusion

Our development team thoroughly appreciates the extra review layer that CodeGuru provides. CodeGuru indicates areas that internal review might otherwise miss, especially in code written by external contractors.

In some cases, CodeGuru highlighted issues never before considered by the team. Examples of these issues include highly coupled functions, ambiguous exceptions, and outdated API calls. Each suggestion is accompanied with its context and reasoning so that our developers can independently judge if an edit should be made. Furthermore, CodeGuru was easily set up with our GitHub repositories. We enabled it within minutes through the console.

After familiarizing ourselves with the CodeGuru workflow, Gridium treats CodeGuru recommendations like suggestions that an internal reviewer would make. Both internal developers and third parties act on recommendations in order to improve code health and quality. Any CodeGuru suggestions not accepted by contractors are verified and implemented by an internal reviewer if necessary.

Over the twelve weeks that we have been utilizing Amazon CodeGuru, we have had 281 automated pull request reviews. These provided 104 recommendations resulting in fifty code corrections that we may not have made otherwise. Our monthly bill for CodeGuru usage is about $10.00. If we make only a single correction to our code over a whole month that we would have missed otherwise, then we can safely say that it was well worth the price!

About the Authors

Kimberly Nicholls is an Engineering Technical Lead at Gridium who loves to make data useful. She also enjoys reading books and spending time outside.

Adnan Bilwani is a Sr. Specialist-Builder Experience providing fully managed ML-based solutions to enhance your DevOps workflows.

Aaqib Bickiya is a Solutions Architect at Amazon Web Services. He helps customers in the Midwest build and grow their AWS environments.

Finding code inconsistencies using Amazon CodeGuru Reviewer

Post Syndicated from Hangqi Zhao original https://aws.amazon.com/blogs/devops/inconsistency-detection-in-amazon-codeguru-reviewer/

Here we are introducing the inconsistency detector for Java in Amazon CodeGuru Reviewer. CodeGuru Reviewer automatically analyzes pull requests (created in supported repositories such as AWS CodeCommit, GitHub, GitHub Enterprise, and Bitbucket) and generates recommendations for improving code quality. For more information, see Automating code reviews and application profiling with Amazon CodeGuru.

The Inconsistency Principle

Software is repetitive, so it’s possible mine usage specifications from the mining of large code bases. While the mined specifications are often correct, specification violations are not often bugs. This is because the code uses are contextual, therefore contextual analysis is required to detect genuine violations. Moreover, naive enforcement of learned specifications leads to many false positives. The inconsistency principle is based on the following observation: While deviations from frequent behavior (or specifications) are often permissible across repositories or packages, deviations from frequent behavior inside of a given repository are worthy of investigation by developers, and these are often bugs or code smells.

Consider the following example. Assume that within a repository or package, we observe 10 occurrences of this statement:

private static final String stage = AppConfig.getDomain().toLowerCase();

And assume that there is one occurrence of the following statement in the same package:

private static final String newStage = AppConfig.getDomain();

The inconsistency can be described as: in this package, typically there is an API call of toLowerCase() follows AppConfig.getDomain() that converts the string generated by AppConfig.getDomain() to its lower-case correspondence. However, in one occurrence, the call is missing. This should be examined.

In summary, the inconsistency detector can learn from a single package (read: your own codebase) and can identify common code usage patterns in the code, such as common patterns of logging, throwing and handling exceptions, performing null checks, etc. Next, usage patterns inconsistent with frequent usage patterns are flagged. While the flagged violations are most often bugs or code smells, it is possible that in some cases the majority usage patterns are the anti-patterns and the flagged violations are actually correct. Mining and detection are conducted on-the-fly during code analysis, and neither the code nor the patterns are persisted. This ensures that the customer code privacy requirements are preserved.

Diverse Recommendations

Perhaps the most distinguishing feature of the inconsistency detector family is how it is based on learning from the customer’s own code while conducting analysis on-the-fly without persisting the code. This is rather different than the pre-defined rules or dedicated ML algorithms targeting specific code defects like concurrency. These approaches also persist learned patterns or models. Therefore, the inconsistency principle-based detectors are much more diversified and spread out to a wide range of code problems.

Our approach aims to automatically detect inconsistent code pieces that are abnormal and deviant from common code patterns in the same package—assuming that the common behaviors are correct. This anomaly detection approach doesn’t require prior knowledge and minimizes the human effort to predefine rule sets, as it can automatically and implicitly “infer” rules, i.e., common code patterns, from the source code. While inconsistencies can be detected in the specific aspects of programs (such as synchronization, exceptions, logging, etc.), CodeGuru Reviewer can detect inconsistencies in multiple program aspects. The detections aren’t restricted to specific code defect types, but instead cover diverse code issue categories. These code defects may not necessarily be bugs, but they could also be code smells that should be avoided for better code maintenance and readability. CodeGuru Reviewer can detect 12 types of code inconsistencies in Java code. These detectors identify issues like typos, inconsistent messaging, inconsistent logging, inconsistent declarations, general missing API calls, missing null checks, missing preconditions, missing exceptions, etc. Now let’s look at several real code examples (they may not cover all types of findings).

Typo

Typos frequently appear in code messages, logs, paths, variable names, and other strings. Even simple typos can be difficult to find and can cause severe issues in your code. In a real code example below, the developer is setting a configuration file location.

context.setConfigLocation("com.amazom.daas.customerinfosearch.config");

The inconsistency detector identifies a typo in the path amazomamazon. Failure to identify and fix this typo will make the configuration location not found. Accordingly, the developer fixed the typo. In some other cases, certain typos are customized to the customer code and may be difficult to find via pre-defined rules or vocabularies. In the example below, the developer sets a bean name as a string.

public static final String COOKIE_SELECTOR_BEAN_NAME = "com.amazon.um.webapp.config.CookiesSelectorService";

The inconsistency detector learns from the entire codebase and identifies that um should instead be uam, as uam appears in multiple similar cases in the code, thereby making the use of um abnormal. The developer responded “Cool!” to this finding and accordingly made the fix.

Inconsistent Logging

In the example below, the developer is logging an exception related to a missing field, ID_FIELD.

 log.info ("Missing {} from data {}", ID_FIELD, data); 

The inconsistency detector learns the patterns in the developer’s code and identifies that, in 47 other similar cases of the same codebase, the developer’s code uses a log level of error instead of info, as shown below.

 log.error ("Missing {} from data {}", ID_FIELD, data);

Utilizing the appropriate log level can improve the application debugging process and ensure that developers are aware of all potential issues within their applications. The message from the CodeGuru Reviewer was “The detector found 47 occurrences of code with logging similar to the selected lines. However, the logging level in the selected lines is not consistent with the other occurrences. We recommend you check if this is intentional. The following are some examples in your code of the expected level of logging in similar occurrences: log.error (“Missing {} from data {}”, ID_FIELD, data); …

The developer acknowledges the recommendation to make the log level consistent, and they made the corresponding change to upgrade the level from info to error.

Apart from log levels, the inconsistency detector also identifies potentially missing log statements in your code, and it ensures that the log messages are consistent across the entire codebase.

Inconsistent Declaration

The inconsistency detector also identifies inconsistencies in variable or method declarations. For instance, a typical example is missing a final keyword for certain variables or functions. While a variable doesn’t always need to be declared final, the inconsistency determines certain variables as final by inferring from other appearances of the variables. In the example below, the developer declares a method with the variable request.

protected ExecutionContext setUpExecutionContext(ActionRequest request) {

Without prior knowledge, the inconsistency learns from 9 other similar occurrences of the same codebase, and it determines that the request should be with final keyword. The developer responded by saying “Good catch!”, and then made the change.

Missing API

Missing API calls is a typical code bug, and their identification is highly valued by customers. The inconsistency detector can find these issues via the inconsistency principle. In the example below, the developer deletes stale entities in the document object.

private void deleteEntities(Document document) {
         ...
         for (Entity returnEntity : oldReturnCollection) {
             document.deleteEntity(returnEntity);
         }
     }

The inconsistency detector learns from 4 other similar methods in the developer’s codebase, and then determines that the API document.deleteEntity() is strongly associated with another API document.acceptChanges(), which is usually called after document.deleteEntity() in order to ensure that the document can accept other changes, while it is missing in this case. Therefore, the inconsistency detector recommends adding the document.acceptChanges() call. Another human reviewer agrees with CodeGuru’s suggestion, and they also refer to the coding guidelines of their platform that echo with CodeGuru’s recommendation. The developer made the corresponding fix as shown below.

private void deleteEntities(Document document) {
         ...
         for (Entity returnEntity : oldReturnCollection) {
             document.deleteEntity(returnEntity);
         }
         document.acceptChanges();
     }

Null Check

Consider the following code snippet:

String ClientOverride = System.getProperty(MB_CLIENT_OVERRIDE_PROPERTY);
if (ClientOverride != null) {
      log.info("Found Client override {}", ClientOverride);
      config.setUnitTestOverride(ConfigKeys.Client, ClientOverride);
}
 
String ServerOverride = System.getProperty(MB_SERVER_OVERRIDE_PROPERTY);
if (ClientOverride != null) {
      log.info("Found Server override {}", ServerOverride);
      config.setUnitTestOverride(ConfigKeys.ServerMode, ServerOverride);
}

CodeGuru Reviewer indicates that the output generated by the System.getProperty(MB_SERVER_OVERRIDE_PROPERTY) misses a null-check. A null-check appears to be available in the next line. However, if we look carefully, that null check is not applied to the correct output. It is a copy-paste error, and instead of checking on ServerOverride it checks ClientOverride. The developer fixed the code as the recommendation suggested.

Exception Handling

The following example shows an inconsistency finding regarding exception handling.

Detection:

try {
        if (null != PriceString) {
            final Double Price = Double.parseDouble(PriceString);
            if (Price.isNaN() || Price <= 0 || Price.isInfinite()) {
                throw new InvalidParameterException(
                  ExceptionUtil.getExceptionMessageInvalidParam(PRICE_PARAM));
             }
         }
    } catch (NumberFormatException ex) {
        throw new InvalidParameterException(ExceptionUtil.getExceptionMessageInvalidParam(PRICE_PARAM));
}

Supporting Code Block:

try {
        final Double spotPrice = Double.parseDouble(launchTemplateOverrides.getSpotPrice());
        if (spotPrice.isNaN() || spotPrice <= 0 || spotPrice.isInfinite()) {
            throw new InvalidSpotFleetRequestConfigException(
                ExceptionUtil.getExceptionMessageInvalidParam(LAUNCH_TEMPLATE_OVERRIDE_SPOT_PRICE_PARAM));
         }
      } catch (NumberFormatException ex) {
          throw new InvalidSpotFleetRequestConfigException(
                ExceptionUtil.getExceptionMessageInvalidParam(LAUNCH_TEMPLATE_OVERRIDE_SPOT_PRICE_PARAM));
 }

There are 4 occurrences of handling an exception thrown by Double.parseDouble using catch with InvalidSpotFleetRequestConfigException(). The detected code snippet with an incredibly similar context simply uses InvalidParameterException(), which does not provide as much detail as the customized exception. The developer responded with “yup the detection sounds right”, and then made the revision.

Responses to the Inconsistency Detector Findings

Large repos are typically developed by more than one developer over a period of time. Therefore, maintaining consistency for the code snippets that serve the same or similar purpose, code style, etc., can easily be overlooked, especially for repos with months or years of development history. As a result, the inconsistency detector in CodeGuru Reviewer has flagged numerous findings and alerted developers within Amazon regarding hundreds of inconsistency issues before they hit production.

The inconsistency detections have witnessed a high developer acceptance rate, and developer feedback of the inconsistency detector has been very positive. Some feedback from the developers includes “will fix. Didn’t realize as this was just copied from somewhere else.”, “Oops!, I’ll correct it and use consistent message format.”, “Interesting. Now it’s learning from our own code. AI is trying to take our jobs haha”, and “lol yeah, this was pretty surprising”. Developers have also concurred that the findings are essential and must be fixed.

Conclusion

Inconsistency bugs are difficult to detect or replicate during testing. They can impact production services availability. As a result, it’s important to automatically detect these bugs early in the software development lifecycle, such as during pull requests or code scans. The CodeGuru Reviewer inconsistency detector combines static code analysis algorithms with ML and data mining in order to surface only the high confidence deviations. It has a high developer acceptance rate and has alerted developers within Amazon to hundreds of inconsistencies before they reach production.

Improve the performance of Lambda applications with Amazon CodeGuru Profiler

Post Syndicated from Vishaal Thanawala original https://aws.amazon.com/blogs/devops/improve-performance-of-lambda-applications-amazon-codeguru-profiler/

As businesses expand applications to reach more users and devices, they risk higher latencies that could degrade the  customer experience. Slow applications can frustrate or even turn away customers. Developers therefore increasingly face the challenge of ensuring that their code runs as efficiently as possible, since application performance can make or break businesses.

Amazon CodeGuru Profiler helps developers improve their application speed by analyzing its runtime. CodeGuru Profiler analyzes single and multi-threaded applications and then generates visualizations to help developers understand the latency sources. Afterwards, CodeGuru Profiler provides recommendations to help resolve the root cause.

CodeGuru Profiler recently began providing recommendations for applications written in Python. Additionally, the new automated onboarding process for AWS Lambda functions makes it even easier to use CodeGuru Profiler with serverless applications built on AWS Lambda.

This post highlights these new features by explaining how to set up and utilize CodeGuru Profiler on an AWS Lambda function written in Python.

Prerequisites

This post focuses on improving the performance of an application written with AWS Lambda, so it’s important to understand the Lambda functions that work best with CodeGuru Profiler. You will get the most out of CodeGuru Profiler on long-duration Lambda functions (>10 seconds) or frequently invoked shorter generation Lambda functions (~100 milliseconds). Because CodeGuru Profiler requires five minutes of runtime data before the Lambda container is recycled, very short duration Lambda functions with an execution time of 1-10 milliseconds may not provide sufficient data for CodeGuru Profiler to generate meaningful results.

The automated CodeGuru Profiler onboarding process, which automatically creates the profiling group for you, supports Lambda functions running on Java 8 (Amazon Corretto), Java 11, and Python 3.8 runtimes. Additional runtimes, without the automated onboarding process, are supported and can be found in the Java documentation and the Python documentation.

Getting Started

Let’s quickly demonstrate the new Lambda onboarding process and the new Python recommendations. This example assumes you have already created a Lambda function, so we will just walk through the process of turning on CodeGuru Profiler and viewing results. If you don’t already have a Lambda function created, you can create one by following these set up instructions. If you would like to replicate this example, the code we used can be found on GitHub here.

  1. On the AWS Lambda Console page, open your Lambda function. For this example, we’re using a function with a Python 3.8 runtime.

 This image shows the Lambda console page for the Lambda function we are referencing.

2. Navigate to the Configuration tab, go to the Monitoring and operations tools page, and click Edit on the right side of the page.

This image shows the instructions to open the page to turn on profiling

3. Scroll down to “Amazon CodeGuru Profiler” and click the button next to “Code profiling” to turn it on. After enabling Code profiling, click Save.

This image shows how to turn on CodeGuru Profiler

4. Verify that CodeGuru Profiler has been turned on within the Monitoring and operations tools page

This image shows how to validate Code profiling has been turned on

That’s it! You can now navigate to CodeGuru Profiler within the AWS console and begin viewing results.

Viewing your results

CodeGuru Profiler requires 5 minutes of Lambda runtime data to generate results. After your Lambda function provides this runtime data, which may need multiple runs if your lambda has a short runtime, it will display within the “Profiling group” page in the CodeGuru Profiler console. The profiling group will be given a default name (i.e., aws-lambda-<lambda-function-name>), and it will take approximately 15 minutes after CodeGuru Profiler receives the runtime data before it appears on this page.

This image shows where you can see the profiling group created after turning on CodeGuru Profiler on your Lambda function

After the profile appears, customers can view their profiling results by analyzing the flame graphs. Additionally, after approximately 1 hour, customers will receive their first recommendation set (if applicable). For more information on how to reading the CodeGuru Profiler results, see Investigating performance issues with Amazon CodeGuru Profiler.

The below images show the two flame graphs (CPU Utilization and Latency) generated from profiling the Lambda function. Note that the highlighted horizontal bar (also referred to as a frame) in both images corresponds with one of the three frames that generates a recommendation. We’ll dive into more details on the recommendation in the following sections.

CPU Utilization Flame Graph:

This image shows the CPU Utilization flame graph for the Lambda function

Latency Flame Graph:

This image shows the Latency flame graph for the Lambda function

Here are the three recommendations generated from the above Lambda function:

This image shows the 3 recommendations generated by CodeGuru Profiler

Addressing a recommendation

Let’s dive even further into it an example recommendation. The first recommendation above notices that the Lambda function is spending more than the normal amount of runnable time (6.8% vs <1%) creating AWS SDK service clients. It recommends ensuring that the function doesn’t unnecessarily create AWS SDK service clients, which wastes CPU time.

This image shows the detailed recommendation for 'Recreation of AWS SDK service clients'

Based on the suggested resolution step, we made a quick and easy code change, moving the client creation outside of the lambda-handler function. This ensures that we don’t create unnecessary AWS SDK clients. The code change below shows how we would resolve the issue.

...
s3_client = boto3.client('s3')
cw_client = boto3.client('cloudwatch')

def lambda_handler(event, context):
...

Reviewing your savings

After making each of the three changes recommended above by CodeGuru Profiler, look at the new flame graphs to see how the changes impacted the applications profile. You’ll notice below that we no longer see the previously wide frames for boto3 clients, put_metric_data, or the logger in the S3 API call.

CPU Utilization Flame Graph:

This image shows the CPU Utilization flame graph after making the recommended changes

Latency Flame Graph:

This image shows the Latency flame graph after making the recommended changes

Moreover, we can run the Lambda function for one day (1439 invocations) and see the results in Lambda Insights in order to understand our total savings. After every recommendation was addressed, this Lambda function, with a 128 MB memory and 10 second timeout, decreased in CPU time by 10% and dropped in maximum memory usage and network IO leading to a 30% drop in GB-s. Decreasing GB-s leads to 30% lower cost for the Lambda’s duration bill as explained in the AWS Lambda Pricing.

Latency (before and after CodeGuru Profiler):

The graph below displays the duration change while running the Lambda function for 1 day.

This image shows the duration change while running the Lambda function for 1 day.

Cost (before and after CodeGuru Profiler):

The graph below displays the function cost change while running the lambda function for 1 day.

This image shows the function cost change while running the lambda function for 1 day.

Conclusion

This post showed how developers can easily onboard onto CodeGuru Profiler in order to improve the performance of their serverless applications built on AWS Lambda. Get started with CodeGuru Profiler by visiting the CodeGuru console.

All across Amazon, numerous teams have utilized CodeGuru Profiler’s technology to generate performance optimizations for customers. It has also reduced infrastructure costs, saving millions of dollars annually.

Onboard your Python applications onto CodeGuru Profiler by following the instructions on the documentation. If you’re interested in the Python agent, note that it is open-sourced on GitHub. Also for more demo applications using the Python agent, check out the GitHub repository for additional samples.

About the authors

Headshot of Vishaal

Vishaal is a Product Manager at Amazon Web Services. He enjoys getting to know his customers’ pain points and transforming them into innovative product solutions.


Headshot of Mirela

Mirela is working as a Software Development Engineer at Amazon Web Services as part of the CodeGuru Profiler team in London. Previously, she has worked for Amazon.com’s teams and enjoys working on products that help customers improve their code and infrastructure.


Headshot of Parag

Parag is a Software Development Engineer at Amazon Web Services as part of the CodeGuru Profiler team in Seattle. Previously, he was working for Amazon.com’s catalog and selection team. He enjoys working on large scale distributed systems and products that help customers build scalable, and cost-effective applications.

Introducing new self-paced courses to improve Java and Python code quality with Amazon CodeGuru

Post Syndicated from Rafael Ramos original https://aws.amazon.com/blogs/devops/new-self-paced-courses-to-improve-java-and-python-code-quality-with-amazon-codeguru/

Amazon CodeGuru icon

During the software development lifecycle, organizations have adopted peer code reviews as a common practice to keep improving code quality and prevent bugs from reaching applications in production. Developers traditionally perform those code reviews manually, which causes bottlenecks and blocks releases while waiting for the peer review. Besides impacting the teams’ agility, it’s a challenge to maintain a high bar for code reviews during the development workflow. This is especially challenging for less experienced developers, who have more difficulties identifying defects, such as thread concurrency and resource leaks.

With Amazon CodeGuru Reviewer, developers have an automated code review tool that catches critical issues, security vulnerabilities, and hard-to-find bugs during application development. CodeGuru Reviewer is powered by pre-trained machine learning (ML) models and uses millions of code reviews on thousands of open-source and Amazon repositories. It also provides recommendations on how to fix issues to improve code quality and reduces the time it takes to fix bugs before they reach customer-facing applications. Java and Python developers can simply add Amazon CodeGuru to their existing development pipeline and save time and reduce the cost and burden of bad code.

If you’re new to writing code or an experienced developer looking to automate code reviews, we’re excited to announce two new courses on CodeGuru Reviewer. These courses, developed by the AWS Training and Certification team, consist of guided walkthroughs, gaming elements, knowledge checks, and a final course assessment.

About the course

During these courses, you learn how to use CodeGuru Reviewer to automatically scan your code base, identify hard-to-find bugs and vulnerabilities, and get recommendations for fixing the bugs and security issues. The course covers CodeGuru Reviewer’s main features, provides a peek into how CodeGuru finds code anomalies, describes how its ML models were built, and explains how to understand and apply its prescriptive guidance and recommendations. Besides helping on improving the code quality, those recommendations are useful for new developers to learn coding best practices, such as refactor duplicated code, correct implementation of concurrency constructs, and how to avoid resource leaks.

The CodeGuru courses are designed to be completed within a 2-week time frame. The courses comprise 60 minutes of videos, which include 15 main lectures. Four of the lectures are specific to Java, and four focus on Python. The courses also include exercises and assessments at the end of each week, to provide you with in-depth, hands-on practice in a lab environment.

Week 1

During the first week, you learn the basics of CodeGuru Reviewer, including how you can benefit from ML and automated reasoning to perform static code analysis and identify critical defects from coding best practices. You also learn what kind of actionable recommendations CodeGuru Reviewer provides, such as refactoring, resource leak, potential race conditions, deadlocks, and security analysis. In addition, the course covers how to integrate this tool on your development workflow, such as your CI/CD pipeline.

Topics include:

  • What is Amazon CodeGuru?
  • How CodeGuru Reviewer is trained to provide intelligent recommendations
  • CodeGuru Reviewer recommendation categories
  • How to integrate CodeGuru Reviewer into your workflow

Week 2

Throughout the second week, you have the chance to explore CodeGuru Reviewer in more depth. With Java and Python code snippets, you have a more hands-on experience and dive into each recommendation category. You use these examples to learn how CodeGuru Reviewer looks for duplicated lines of code to suggest refactoring opportunities, how it detects code maintainability issues, and how it prevents resource leaks and concurrency bugs.

Topics include (for both Java and Python):

  • Common coding best practices
  • Resource leak prevention
  • Security analysis

Get started

Developed at the source, this new digital course empowers you to learn about CodeGuru from the experts at AWS whenever, wherever you want. Advance your skills and knowledge to build your future in the AWS Cloud. Enroll today:

Rafael Ramos

Rafael Ramos

Rafael is a Solutions Architect at AWS, where he helps ISVs on their journey to the cloud. He spent over 13 years working as a software developer, and is passionate about DevOps and serverless. Outside of work, he enjoys playing tabletop RPG, cooking and running marathons.

Amazon CodeGuru Reviewer Updates: New Java Detectors and CI/CD Integration with GitHub Actions

Post Syndicated from Alex Casalboni original https://aws.amazon.com/blogs/aws/amazon_codeguru_reviewer_updates_new_java_detectors_and_cicd_integration_with_github_actions/

Amazon CodeGuru allows you to automate code reviews and improve code quality, and thanks to the new pricing model announced in April you can get started with a lower and fixed monthly rate based on the size of your repository (up to 90% less expensive). CodeGuru Reviewer helps you detect potential defects and bugs that are hard to find in your Java and Python applications, using the AWS Management Console, AWS SDKs, and AWS CLI.

Today, I’m happy to announce that CodeGuru Reviewer natively integrates with the tools that you use every day to package and deploy your code. This new CI/CD experience allows you to trigger code quality and security analysis as a step in your build process using GitHub Actions.

Although the CodeGuru Reviewer console still serves as an analysis hub for all your onboarded repositories, the new CI/CD experience allows you to integrate CodeGuru Reviewer more deeply with your favorite source code management and CI/CD tools.

And that’s not all! Today we’re also releasing 20 new security detectors for Java to help you identify even more issues related to security and AWS best practices.

A New CI/CD Experience for CodeGuru Reviewer
As a developer or development team, you push new code every day and want to identify security vulnerabilities early in the development cycle, ideally at every push. During a pull-request (PR) review, all the CodeGuru recommendations will appear as a comment, as if you had another pair of eyes on the PR. These comments include useful links to help you resolve the problem.

When you push new code or schedule a code review, recommendations will appear in the Security > Code scanning alerts tab on GitHub.

Let’s see how to integrate CodeGuru Reviewer with GitHub Actions.

First of all, create a .yml file in your repository under .github/workflows/ (or update an existing action). This file will contain all your actions’ step. Let’s go through the individual steps.

The first step is configuring your AWS credentials. You want to do this securely, without storing any credentials in your repository’s code, using the Configure AWS Credentials action. This action allows you to configure an IAM role that GitHub will use to interact with AWS services. This role will require a few permissions related to CodeGuru Reviewer and Amazon S3. You can attach the AmazonCodeGuruReviewerFullAccess managed policy to the action role, in addition to s3:GetObject, s3:PutObject and s3:ListBucket.

This first step will look as follows:

- name: Configure AWS Credentials
  uses: aws-actions/configure-aws-credentials@v1
  with:
    aws-access-key-id: ${{ secrets.AWS_ACCESS_KEY_ID }}
    aws-secret-access-key: ${{ secrets.AWS_SECRET_ACCESS_KEY }}
    aws-region: eu-west-1

These access key and secret key correspond to your IAM role and will be used to interact with CodeGuru Reviewer and Amazon S3.

Next, you add the CodeGuru Reviewer action and a final step to upload the results:

- name: Amazon CodeGuru Reviewer Scanner
  uses: aws-actions/codeguru-reviewer
  if: ${{ always() }} 
  with:
    build_path: target # build artifact(s) directory
    s3_bucket: 'codeguru-reviewer-myactions-bucket'  # S3 Bucket starting with "codeguru-reviewer-*"
- name: Upload review result
  if: ${{ always() }}
  uses: github/codeql-action/upload-sarif@v1
  with:
    sarif_file: codeguru-results.sarif.json

The CodeGuru Reviewer action requires two input parameters:

  • build_path: Where your build artifacts are in the repository.
  • s3_bucket: The name of an S3 bucket that you’ve created previously, used to upload the build artifacts and analysis results. It’s a customer-owned bucket so you have full control over access and permissions, in case you need to share its content with other systems.

Now, let’s put all the pieces together.

Your .yml file should look like this:

name: CodeGuru Reviewer GitHub Actions Integration
on: [pull_request, push, schedule]
jobs:
  CodeGuru-Reviewer-Actions:
    runs-on: ubuntu-latest
    steps:
      - name: Configure AWS Credentials
        uses: aws-actions/configure-aws-credentials@v1
        with:
          aws-access-key-id: ${{ secrets.AWS_ACCESS_KEY_ID }}
          aws-secret-access-key: ${{ secrets.AWS_SECRET_ACCESS_KEY }}
          aws-region: us-east-2
	  - name: Amazon CodeGuru Reviewer Scanner
        uses: aws-actions/codeguru-reviewer
        if: ${{ always() }} 
        with:
          build_path: target # build artifact(s) directory
          s3_bucket: 'codeguru-reviewer-myactions-bucket'  # S3 Bucket starting with "codeguru-reviewer-*"
      - name: Upload review result
        if: ${{ always() }}
        uses: github/codeql-action/upload-sarif@v1
        with:
          sarif_file: codeguru-results.sarif.json

It’s important to remember that the S3 bucket name needs to start with codeguru_reviewer- and that these actions can be configured to run with the pull_request, push, or schedule triggers (check out the GitHub Actions documentation for the full list of events that trigger workflows). Also keep in mind that there are minor differences in how you configure GitHub-hosted runners and self-hosted runners, mainly in the credentials configuration step. For example, if you run your GitHub Actions in a self-hosted runner that already has access to AWS credentials, such as an EC2 instance, then you don’t need to provide any credentials to this action (check out the full documentation for self-hosted runners).

Now when you push a change or open a PR CodeGuru Reviewer will comment on your code changes with a few recommendations.

Or you can schedule a daily or weekly repository scan and check out the recommendations in the Security > Code scanning alerts tab.

New Security Detectors for Java
In December last year, we launched the Java Security Detectors for CodeGuru Reviewer to help you find and remediate potential security issues in your Java applications. These detectors are built with machine learning and automated reasoning techniques, trained on over 100,000 Amazon and open-source code repositories, and based on the decades of expertise of the AWS Application Security (AppSec) team.

For example, some of these detectors will look at potential leaks of sensitive information or credentials through excessively verbose logging, exception handling, and storing passwords in plaintext in memory. The security detectors also help you identify several web application vulnerabilities such as command injection, weak cryptography, weak hashing, LDAP injection, path traversal, secure cookie flag, SQL injection, XPATH injection, and XSS (cross-site scripting).

The new security detectors for Java can identify security issues with the Java Servlet APIs and web frameworks such as Spring. Some of the new detectors will also help you with security best practices for AWS APIs when using services such as Amazon S3, IAM, and AWS Lambda, as well as libraries and utilities such as Apache ActiveMQ, LDAP servers, SAML parsers, and password encoders.

Available Today at No Additional Cost
The new CI/CD integration and security detectors for Java are available today at no additional cost, excluding the storage on S3 which can be estimated based on size of your build artifacts and the frequency of code reviews. Check out the CodeGuru Reviewer Action in the GitHub Marketplace and the Amazon CodeGuru pricing page to find pricing examples based on the new pricing model we launched last month.

We’re looking forward to hearing your feedback, launching more detectors to help you identify potential issues, and integrating with even more CI/CD tools in the future.

You can learn more about the CI/CD experience and configuration in the technical documentation.

Alex

New – AWS BugBust: It’s Game Over for Bugs

Post Syndicated from Martin Beeby original https://aws.amazon.com/blogs/aws/new-aws-bugbust-its-game-over-for-bugs/

Today, we are launching AWS BugBust, the world’s first global challenge to fix one million bugs and reduce technical debt by over $100 million.

You might have participated in a bug bash before. Many of the software companies where I’ve worked (including Amazon) run them in the weeks before launching a new product or service. AWS BugBust takes the concept of a bug bash to a new level.

AWS BugBust allows you to create and manage private events that will transform and gamify the process of finding and fixing bugs in your software. It includes automated code analysis, built-in leaderboards, custom challenges, and rewards. AWS BugBust fosters team building and introduces some friendly competition into improving code quality and application performance. What’s more, your developers can take part in the world’s largest code challenge, win fantastic prizes, and receive kudos from their peers.

Behind the scenes, AWS BugBust uses Amazon CodeGuru Reviewer and Amazon CodeGuru Profiler. These developer tools use machine learning and automated reasoning to find bugs in your applications. These bugs are then available for your developers to claim and fix. The more bugs a developer fixes, the more points the developer earns. A traditional bug bash requires developers to find and fix bugs manually. With AWS BugBust, developers get a list of bugs before the event begins so they can spend the entire event focused on fixing them.

Fix Your Bugs and Earn Points
As a developer, each time you fix a bug in a private event, points are allocated and added to the global leaderboard. Don’t worry: Only your handle (profile name) and points are displayed on the global leaderboard. Nobody can see your code or details about the bugs that you’ve fixed.

As developers reach significant individual milestones, they receive badges and collect exclusive prizes from AWS, for example, if they achieve 100 points they will win an AWS BugBust T-shirt and if they earn 2,000 points they will win an AWS BugBust Varsity Jacket. In addition, on the 30th of September 2021, the top 10 developers on the global leaderboard will receive a ticket to AWS re:Invent.

Create an Event
To show you how the challenge works, I’ll create a private AWS BugBust event. In the CodeGuru console, I choose Create BugBust event.

Under Step 1- Rules and scoring, I see how many points are awarded for each type of bug fix. Profiling groups are used to determine performance improvements after the players submit their improved solutions.

In Step 2, I sign in to my player account. In Step 3, I add event details like name, description, and start and end time.

I also enter details about the first-, second-, and third-place prizes. This information will be displayed to players when they join the event.

After I have reviewed the details and created the event, my event dashboard displays essential information, I can also import work items and invite players.

I select the Import work items button. This takes me to the Import work items screen where I choose to Import bugs from CodeGuru Reviewer and profiling groups from CodeGuru Profiler. I choose a repository analysis from my account and AWS BugBust imports all the identified bugs for players to claim and fix. I also choose several profiling groups that will be used by AWS BugBust.

Now that my event is ready, I can invite players. Players can now sign into a player portal using their player accounts and start claiming and fixing bugs.

Things to Know
Amazon CodeGuru currently supports Python and Java. To compete in the global challenge, your project must be written in one of these languages.

Pricing
When you create your first AWS BugBust event, all costs incurred by the underlying usage of Amazon CodeGuru Reviewer and Amazon CodeGuru Profiler are free of charge for 30 days per AWS account. This 30 day free period applies even if you have already utilized the free tiers for Amazon CodeGuru Reviewer and Amazon CodeGuru Profiler. You can create multiple AWS BugBust events within the 30-day free trial period. After the 30-day free trial expires, you will be charged for Amazon CodeGuru Reviewer and Amazon CodeGuru Profiler based on your usage in the challenge. See the Amazon CodeGuru Pricing page for details.

Available Today
Starting today, you can create AWS BugBust events in the Amazon CodeGuru console in the US East (N. Virginia) Region. Start planning your AWS BugBust today.

— Martin

How Amazon CodeGuru Profiler helps Coursera create high-quality online learning experiences

Post Syndicated from Adnan Bilwani original https://aws.amazon.com/blogs/devops/coursera-codeguru-profiler/

This guest post was authored by Rana Ahsan and Chris Liu, Software Engineers at Coursera, and edited by Dave Sanderson and Adnan Bilwani, at AWS.

Coursera was launched in 2012 by two Stanford Computer Science professors, Daphne Koller and Andrew Ng, with a vision of providing universal access to world-class learning. It’s now one of the world’s leading online learning platforms with more than 77 million registered learners. Coursera partners with over 200 leading university and industry partners to offer a broad catalog of content and credentials, including Guided Projects, courses, Specializations, certificates, and accredited bachelor’s and master’s degrees. More than 6,000 institutions have used Coursera to transform their talent by upskilling and reskilling their employees, citizens, and students in the high-demand data science, technology, and business skills required to compete in today’s economy.

Coursera’s challenge

About a year and a half ago, we were debugging some performance bottlenecks for our microservices where some requests were too slow and often resulted in server errors due to timeout. Even after digging into the logs and looking through existing performance metrics of the underlying systems, we couldn’t determine the cause or explain the behavior. To compound the matter, we saw the issues across multiple applications, leading to a concern that the issue resided in code shared across applications.

To dig deeper into the problem, we started doing manual reviews of the code for the applications associated with these failures. This process turned out to be too laborious and time-consuming.

We also started building out our debugging solution utilizing shell scripts to capture a snapshot of the system and application state so we could analyze the details of these bottlenecks. Although the scripts provided some valuable insights, we started to run into issues of scale. The process of deploying the tooling and collecting the data became tedious and cumbersome. At the same time, the more data we received back from our scripts, the more demand we saw for this level of detail.

Solution with Amazon CodeGuru

It was at this point we decided to look into CodeGuru Profiler to determine if it could provide the same insights as our tooling while reducing the administrative burden associated with deploying, aggregating, and analyzing the data.

Quickly after deploying CodeGuru Profiler, we started to get valuable and actionable data regarding the issue. The profiler highlighted a high CPU usage during the deserialization process used for application communications (see the following screenshot). This confirmed our suspicions that the issue was indeed in the shared code, but it was also an unexpected find, because JSON deserialization is widespread and it hadn’t hit our radar as a potential candidate for the issue.

Flame graph highlighted high CPU usage

The deserialization performance was causing slow processing time for each request and increasing the overall communication latency. This led to performance degradation by causing the calls to slowly stack up over time until the request would time out. With CodeGuru Profiler, we were also able to establish a relationship between the size of the JSON document and the high CPU usage. As the document size increased, so did CPU usage. In some cases, this resulted in a resource starvation situation on the system, which in turn could cause other processes on the instance to crash, resulting in a sudden failure.

In addition to the performance and application instances failures, the high CPU usage during deserialization was quietly driving up costs. Because the issue was in shared code, the wasteful resource consumption was contributing to the need for additional instances to be added into the application cluster in order to meet throughput requirements.

Results

The details from CodeGuru Profiler enabled us to see and understand the underlying cause and move forward with a solution. Because the code is in the critical communication path for our microservices and shared across many applications, we decided to replace the JSON serialization with an alternative object serialization approach that was much more performant.

To get a deeper understanding of the performance impact of this change, we deployed the original code to a test environment. We used CodeGuru Profiler to evaluate the performance of the JSON and native object serialization. After we ran the same battery of tests against the new code, the deserialization CPU usage dropped between 30–40%.

Flame graph displayed lower CPU usage after changes

This resulted in a corresponding decrease in serialization-deserialization latency of 5–50% depending on response payload size and workload.

As we roll out this optimization across our fleet, we anticipate seeing significant improvements in the performance and stability of our microservices platform as well as a reduction in CPU utilization cost.

Conclusion

CodeGuru Profiler provides additional application insights and helps us troubleshoot other issues in our applications, including resolving a case of flaky I/O errors and improving tail latency by recommending a different thread-pooling strategy.

CodeGuru Profiler was easy to maintain and scale across our fleet. It quickly identified these performance issues in our production environment and helped us verify and understand the impact of possible resolutions prior to releasing the code back into production.


About the authors

Rana Ahsan is a Staff Software Engineer at Coursera
Chris Liu is a Staff Software Engineer at Coursera
Adnan Bilwani is a Sr. Specialist Builders Experience at AWS
Dave Sanderson is a Sr. Technical Account Manager at AWS


Improving the CPU and latency performance of Amazon applications using AWS CodeGuru Profiler

Post Syndicated from Neha Gupta original https://aws.amazon.com/blogs/devops/improving-the-cpu-and-latency-performance-of-amazon-applications-using-aws-codeguru-profiler/

Amazon CodeGuru Profiler is a developer tool powered by machine learning (ML) that helps identify an application’s most expensive lines of code and provides intelligent recommendations to optimize it. You can identify application performance issues and troubleshoot latency and CPU utilization issues in your application.

You can use CodeGuru Profiler to optimize performance for any application running on AWS Lambda, Amazon Elastic Compute Cloud (Amazon EC2), Amazon Elastic Container Service (Amazon ECS), AWS Fargate, or AWS Elastic Beanstalk, and on premises.

This post gives a high-level overview of how CodeGuru Profiler has reduced CPU usage and latency by approximately 50% and saved around $100,000 a year for a particular Amazon retail service.

Technical and business value of CodeGuru Profiler

CodeGuru Profiler is easy and simple to use, just turn it on and start using it. You can keep it running in the background and you can just look into the CodeGuru Profiler findings and implement the relevant changes.

It’s fairly low cost and unlike traditional tools that take up lot of CPU and RAM, running CodeGuru Profiler has less than 1% impact on total CPU usage overhead to applications and typically uses no more than 100 MB of memory.

You can run it in a pre-production environment to test changes to ensure no impact occurs on your application’s key metrics.

It automatically detects performance anomalies in the application stack traces that start consuming more CPU or show increased latency. It also provides visualizations and recommendations on how to fix performance issues and the estimated cost of running inefficient code. Detecting the anomalies early prevents escalating the issue in production. This helps you prioritize remediation by giving you enough time to fix the issue before it impacts your service’s availability and your customers’ experience.

How we used CodeGuru Profiler at Amazon

Amazon has on-boarded many of its applications to CodeGuru Profiler, which has resulted in an annual savings of millions of dollars and latency improvements. In this post, we discuss how we used CodeGuru Profiler on an Amazon Prime service. A simple code change resulted in saving around $100,000 for the year.

Opportunity to improve

After a change to one of our data sources that caused its payload size to increase, we expected a slight increase to our service latency, but what we saw was higher than expected. Because CodeGuru Profiler is easy to integrate, we were able to quickly make and deploy the changes needed to get it running on our production environment.

After loading up the profile in Amazon CodeGuru Profiler, it was immediately apparent from the visualization that a very large portion of the service’s CPU time was being taken up by Jackson deserialization (37%, across the two call sites). It was also interesting that most of the blocking calls in the program (in blue) was happening in the jackson.databind method _createAndCacheValueDeserializer.

Flame graphs represent the relative amount of time that the CPU spends at each point in the call graph. The wider it is, the more CPU usage it corresponds to.

The following flame graph is from before the performance improvements were implemented.

The Flame Graph before the deployment

Looking at the source for _createAndCacheValueDeserializer confirmed that there was a synchronized block. From within it, _createAndCache2 was called, which actually did the adding to the cache. Adding to the cache was guarded by a boolean condition which had a comment that indicated that caching would only be enabled for custom serializers if @JsonCachable was set.

Solution

Checking the documentation for @JsonCachable confirmed that this annotation looked like the correct solution for this performance issue. After we deployed a quick change to add @JsonCachable to our four custom deserializers, we observed that no visible time was spent in _createAndCacheValueDeserializer.

Results

Adding a one-line annotation in four different places made the code run twice as fast. Because it was holding a lock while it recreated the same deserializers for every call, this was allowing only one of the four CPU cores to be used and therefore causing latency and inefficiency. Reusing the deserializers avoided repeated work and saved us lot of resources.

After the CodeGuru Profiler recommendations were implemented, the amount of CPU spent in Jackson reduced from 37% to 5% across the two call paths, and there was no visible blocking. With the removal of the blocking, we could run higher load on our hosts and reduce the fleet size, saving approximately $100,000 a year in Amazon EC2 costs, thereby resulting in overall savings.

The following flame graph shows performance after the deployment.

The Flame Graph after the deployment

Metrics

The following graph shows that CPU usage reduced by almost 50%. The blue line shows the CPU usage the week before we implemented CodeGuru Profiler recommendations, and green shows the dropped usage after deploying. We could later safely scale down the fleet to reduce costs, while still having better performance than prior to the change.

Average Fleet CPU Utilization


The following graph shows the server latency, which also dropped by almost 50%. The latency dropped from 100 milliseconds to 50 milliseconds as depicted in the initial portion of the graph. The orange line depicts p99, green p99.9, and blue p50 (mean latency).

Server Latency


Conclusion

With a few lines of changed code and a half-hour investigation, we removed the bottleneck which led to lower utilization of resources and  thus we were able to decrease the fleet size. We have seen many similar cases, and in one instance, a change of literally six characters of inefficient code, reduced CPU usage from 99% to 5%.

Across Amazon, CodeGuru Profiler has been used internally among various teams and resulted in millions of dollars of savings and performance optimization. You can use CodeGuru Profiler for quick insights into performance issues of your application. The more efficient the code and application is, the less costly it is to run. You can find potential savings for any application running in production and significantly reduce infrastructure costs using CodeGuru Profiler. Reducing fleet size, latency, and CPU usage is a major win.


About the Authors

Neha Gupta

Neha Gupta is a Solutions Architect at AWS and have 16 years of experience as a Database architect/ DBA. Apart from work, she’s outdoorsy and loves to dance.

Ian Clark

Ian is a Senior Software engineer with the Last Mile organization at Amazon. In his spare time, he enjoys exploring the Vancouver area with his family.

Improving AWS Java applications with Amazon CodeGuru Reviewer

Post Syndicated from Rajdeep Mukherjee original https://aws.amazon.com/blogs/devops/improving-aws-java-applications-with-amazon-codeguru-reviewer/

Amazon CodeGuru Reviewer is a machine learning (ML)-based AWS service for providing automated code reviews comments on your Java and Python applications. Powered by program analysis and ML, CodeGuru Reviewer detects hard-to-find bugs and inefficiencies in your code and leverages best practices learned from across millions of lines of open-source and Amazon code. You can start analyzing your code through pull requests and full repository analysis (for more information, see Automating code reviews and application profiling with Amazon CodeGuru).

The recommendations generated by CodeGuru Reviewer for Java fall into the following categories:

  • AWS best practices
  • Concurrency
  • Security
  • Resource leaks
  • Other specialized categories such as sensitive information leaks, input validation, and code clones
  • General best practices on data structures, control flow, exception handling, and more

We expect the recommendations to benefit beginners as well as expert Java programmers.

In this post, we showcase CodeGuru Reviewer recommendations related to using the AWS SDK for Java. For in-depth discussion of other specialized topics, see our posts on concurrency, security, and resource leaks. For Python applications, see Raising Python code quality using Amazon CodeGuru.

The AWS SDK for Java simplifies the use of AWS services by providing a set of features that are consistent and familiar for Java developers. The SDK has more than 250 AWS service clients, which are available on GitHub. Service clients include services like Amazon Simple Storage Service (Amazon S3), Amazon DynamoDB, Amazon Kinesis, Amazon Elastic Compute Cloud (Amazon EC2), AWS IoT, and Amazon SageMaker. These services constitute more than 6,000 operations, which you can use to access AWS services. With such rich and diverse services and APIs, developers may not always be aware of the nuances of AWS API usage. These nuances may not be important at the beginning, but become critical as the scale increases and the application evolves or becomes diverse. This is why CodeGuru Reviewer has a category of recommendations: AWS best practices. This category of recommendations enables you to become aware of certain features of AWS APIs so your code can be more correct and performant.

The first part of this post focuses on the key features of the AWS SDK for Java as well as API patterns in AWS services. The second part of this post demonstrates using CodeGuru Reviewer to improve code quality for Java applications that use the AWS SDK for Java.

AWS SDK for Java

The AWS SDK for Java supports higher-level abstractions for simplified development and provides support for cross-cutting concerns such as credential management, retries, data marshaling, and serialization. In this section, we describe a few key features that are supported in the AWS SDK for Java. Additionally, we discuss some key API patterns such as batching, and pagination, in AWS services.

The AWS SDK for Java has the following features:

  • Waiters Waiters are utility methods that make it easy to wait for a resource to transition into a desired state. Waiters makes it easier to abstract out the polling logic into a simple API call. The waiters interface provides a custom delay strategy to control the sleep time between retries, as well as a custom condition on whether polling of a resource should be retried. The AWS SDK for Java also offer an async variant of waiters.
  • Exceptions The AWS SDK for Java uses runtime (or unchecked) exceptions instead of checked exceptions in order to give you fine-grained control over the errors you want to handle and to prevent scalability issues inherent with checked exceptions in large applications. Broadly, the AWS SDK for Java has two types of exceptions:
    • AmazonClientException – Indicates that a problem occurred inside the Java client code, either while trying to send a request to AWS or while trying to parse a response from AWS. For example, the AWS SDK for Java throws an AmazonClientException if no network connection is available when you try to call an operation on one of the clients.
    • AmazonServiceException – Represents an error response from an AWS service. For example, if you try to end an EC2 instance that doesn’t exist, Amazon EC2 returns an error response, and all the details of that response are included in the AmazonServiceException that’s thrown. For some cases, a subclass of AmazonServiceException is thrown to allow you fine-grained control over handling error cases through catch blocks.

The API has the following patterns:

  • Batching – A batch operation provides you with the ability to perform a single CRUD operation (create, read, update, delete) on multiple resources. Some typical use cases include the following:
  • Pagination – Many AWS operations return paginated results when the response object is too large to return in a single response. To enable you to perform pagination, the request and response objects for many service clients in the SDK provide a continuation token (typically named NextToken) to indicate additional results.

AWS best practices

Now that we have summarized the SDK-specific features and API patterns, let’s look at the CodeGuru Reviewer recommendations on AWS API use.

The CodeGuru Reviewer recommendations for the AWS SDK for Java range from detecting outdated or deprecated APIs to warning about API misuse, missing pagination, authentication and exception scenarios, and using efficient API alternatives. In this section, we discuss a few examples patterned after real code.

Handling pagination

Over 1,000 APIs from more than 150 AWS services have pagination operations. The pagination best practice rule in CodeGuru covers all the pagination operations. In particular, the pagination rule checks if the Java application correctly fetches all the results of the pagination operation.

The response of a pagination operation in AWS SDK for Java 1.0 contains a token that has to be used to retrieve the next page of results. In the following code snippet, you make a call to listTables(), a DynamoDB ListTables operation, which can only return up to 100 table names per page. This code might not produce complete results because the operation returns paginated results instead of all results.

public void getDynamoDbTable() {
        AmazonDynamoDBClient client = new AmazonDynamoDBClient();
        List<String> tables = dynamoDbClient.listTables().getTableNames();
        System.out.println(tables)
}

CodeGuru Reviewer detects the missing pagination in the code snippet and makes the following recommendation to add another call to check for additional results.

Screenshot of recommendations for introducing pagination checks

You can accept the recommendation and add the logic to get the next page of table names by checking if a token (LastEvaluatedTableName in ListTablesResponse) is included in each response page. If such a token is present, it’s used in a subsequent request to fetch the next page of results. See the following code:

public void getDynamoDbTable() {
        AmazonDynamoDBClient client = new AmazonDynamoDBClient();
        ListTablesRequest listTablesRequest = ListTablesRequest.builder().build();
        boolean done = false;
        while (!done) {
            ListTablesResponse listTablesResponse = client.listTables(listTablesRequest);
	    System.out.println(listTablesResponse.tableNames());
            if (listTablesResponse.lastEvaluatedTableName() == null) {
                done = true;
            }
            listTablesRequest = listTablesRequest.toBuilder()
                    .exclusiveStartTableName(listTablesResponse.lastEvaluatedTableName())
                    .build();
        }
}

Handling failures in batch operation calls

Batch operations are common with many AWS services that process bulk requests. Batch operations can succeed without throwing exceptions even if some items in the request fail. Therefore, a recommended practice is to explicitly check for any failures in the result of the batch APIs. Over 40 APIs from more than 20 AWS services have batch operations. The best practice rule in CodeGuru Reviewer covers all the batch operations. In the following code snippet, you make a call to sendMessageBatch, a batch operation from Amazon SQS, but it doesn’t handle any errors returned by that batch operation:

public void flush(final String sqsEndPoint,
                     final List<SendMessageBatchRequestEntry> batch) {
    AwsSqsClientBuilder awsSqsClientBuilder;
    AmazonSQS sqsClient = awsSqsClientBuilder.build();
    if (batch.isEmpty()) {
        return;
    }
    sqsClient.sendMessageBatch(sqsEndPoint, batch);
}

CodeGuru Reviewer detects this issue and makes the following recommendation to check the return value for failures.

Screenshot of recommendations for batch operations

You can accept this recommendation and add logging for the complete list of messages that failed to send, in addition to throwing an SQSUpdateException. See the following code:

public void flush(final String sqsEndPoint,
                     final List<SendMessageBatchRequestEntry> batch) {
    AwsSqsClientBuilder awsSqsClientBuilder;
    AmazonSQS sqsClient = awsSqsClientBuilder.build();
    if (batch.isEmpty()) {
        return;
    }
    SendMessageBatchResult result = sqsClient.sendMessageBatch(sqsEndPoint, batch);
    final List<BatchResultErrorEntry> failed = result.getFailed();
    if (!failed.isEmpty()) {
           final String failedMessage = failed.stream()
                         .map(batchResultErrorEntry -> 
                            String.format("…", batchResultErrorEntry.getId(), 
                            batchResultErrorEntry.getMessage()))
                         .collect(Collectors.joining(","));
           throw new SQSUpdateException("Error occurred while sending 
                                        messages to SQS::" + failedMessage);
    }
}

Exception handling best practices

Amazon S3 is one of the most popular AWS services with our customers. A frequent operation with this service is to upload a stream-based object through an Amazon S3 client. Stream-based uploads might encounter occasional network connectivity or timeout issues, and the best practice to address such a scenario is to properly handle the corresponding ResetException error. ResetException extends SdkClientException, which subsequently extends AmazonClientException. Consider the following code snippet, which lacks such exception handling:

private void uploadInputStreamToS3(String bucketName, 
                                   InputStream input, 
                                   String key, ObjectMetadata metadata) 
                         throws SdkClientException {
    final AmazonS3Client amazonS3Client;
    PutObjectRequest putObjectRequest =
          new PutObjectRequest(bucketName, key, input, metadata);
    amazonS3Client.putObject(putObjectRequest);
}

In this case, CodeGuru Reviewer correctly detects the missing handling of the ResetException error and suggests possible solutions.

Screenshot of recommendations for handling exceptions

This recommendation is rich in that it provides alternatives to suit different use cases. The most common handling uses File or FileInputStream objects, but in other cases explicit handling of mark and reset operations are necessary to reliably avoid a ResetException.

You can fix the code by explicitly setting a predefined read limit using the setReadLimit method of RequestClientOptions. Its default value is 128 KB. Setting the read limit value to one byte greater than the size of stream reliably avoids a ResetException.

For example, if the maximum expected size of a stream is 100,000 bytes, set the read limit to 100,001 (100,000 + 1) bytes. The mark and reset always work for 100,000 bytes or less. However, this might cause some streams to buffer that number of bytes into memory.

The fix reliably avoids ResetException when uploading an object of type InputStream to Amazon S3:

private void uploadInputStreamToS3(String bucketName, InputStream input, 
                                   String key, ObjectMetadata metadata) 
                             throws SdkClientException {
        final AmazonS3Client amazonS3Client;
        final Integer READ_LIMIT = 10000;
        PutObjectRequest putObjectRequest =
   			new PutObjectRequest(bucketName, key, input, metadata);  
        putObjectRequest.getRequestClientOptions().setReadLimit(READ_LIMIT);
        amazonS3Client.putObject(putObjectRequest);
}

Replacing custom polling with waiters

A common activity when you’re working with services that are eventually consistent (such as DynamoDB) or have a lead time for creating resources (such as Amazon EC2) is to wait for a resource to transition into a desired state. The AWS SDK provides the Waiters API, a convenient and efficient feature for waiting that abstracts out the polling logic into a simple API call. If you’re not aware of this feature, you might come up with a custom, and potentially inefficient polling logic to determine whether a particular resource had transitioned into a desired state.

The following code appears to be waiting for the status of EC2 instances to change to shutting-down or terminated inside a while (true) loop:

private boolean terminateInstance(final String instanceId, final AmazonEC2 ec2Client)
    throws InterruptedException {
    long start = System.currentTimeMillis();
    while (true) {
        try {
            DescribeInstanceStatusResult describeInstanceStatusResult = 
                            ec2Client.describeInstanceStatus(new DescribeInstanceStatusRequest()
                            .withInstanceIds(instanceId).withIncludeAllInstances(true));
            List<InstanceStatus> instanceStatusList = 
                       describeInstanceStatusResult.getInstanceStatuses();
            long finish = System.currentTimeMillis();
            long timeElapsed = finish - start;
            if (timeElapsed > INSTANCE_TERMINATION_TIMEOUT) {
                break;
            }
            if (instanceStatusList.size() < 1) {
                Thread.sleep(WAIT_FOR_TRANSITION_INTERVAL);
                continue;
            }
            currentState = instanceStatusList.get(0).getInstanceState().getName();
            if ("shutting-down".equals(currentState) || "terminated".equals(currentState)) {
                return true;
             } else {
                 Thread.sleep(WAIT_FOR_TRANSITION_INTERVAL);
             }
        } catch (AmazonServiceException ex) {
            throw ex;
        }
        …
 }

CodeGuru Reviewer detects the polling scenario and recommends you use the waiters feature to help improve efficiency of such programs.

Screenshot of recommendations for introducing waiters feature

Based on the recommendation, the following code uses the waiters function that is available in the AWS SDK for Java. The polling logic is replaced with the waiters() function, which is then run with the call to waiters.run(…), which accepts custom provided parameters, including the request and optional custom polling strategy. The run function polls synchronously until it’s determined that the resource transitioned into the desired state or not. The SDK throws a WaiterTimedOutException if the resource doesn’t transition into the desired state even after a certain number of retries. The fixed code is more efficient, simple, and abstracts the polling logic to determine whether a particular resource had transitioned into a desired state into a simple API call:

public void terminateInstance(final String instanceId, final AmazonEC2 ec2Client)
    throws InterruptedException {
    Waiter<DescribeInstancesRequest> waiter = ec2Client.waiters().instanceTerminated();
    ec2Client.terminateInstances(new TerminateInstancesRequest().withInstanceIds(instanceId));
    try {
        waiter.run(new WaiterParameters()
              .withRequest(new DescribeInstancesRequest()
              .withInstanceIds(instanceId))
              .withPollingStrategy(new PollingStrategy(new MaxAttemptsRetryStrategy(60), 
                    new FixedDelayStrategy(5))));
    } catch (WaiterTimedOutException e) {
        List<InstanceStatus> instanceStatusList = ec2Client.describeInstanceStatus(
               new DescribeInstanceStatusRequest()
                        .withInstanceIds(instanceId)
                        .withIncludeAllInstances(true))
                        .getInstanceStatuses();
        String state;
        if (instanceStatusList != null && instanceStatusList.size() > 0) {
            state = instanceStatusList.get(0).getInstanceState().getName();
        }
    }
}

Service-specific best practice recommendations

In addition to the SDK operation-specific recommendations in the AWS SDK for Java we discussed, there are various AWS service-specific best practice recommendations pertaining to service APIs for services such as Amazon S3, Amazon EC2, DynamoDB, and more, where CodeGuru Reviewer can help to improve Java applications that use AWS service clients. For example, CodeGuru can detect the following:

  • Resource leaks in Java applications that use high-level libraries, such as the Amazon S3 TransferManager
  • Deprecated methods in various AWS services
  • Missing null checks on the response of the GetItem API call in DynamoDB
  • Missing error handling in the output of the PutRecords API call in Kinesis
  • Anti-patterns such as binding the SNS subscribe or createTopic operation with Publish operation

Conclusion

This post introduced how to use CodeGuru Reviewer to improve the use of the AWS SDK in Java applications. CodeGuru is now available for you to try. For pricing information, see Amazon CodeGuru pricing.

Understanding memory usage in your Java application with Amazon CodeGuru Profiler

Post Syndicated from Fernando Ciciliati original https://aws.amazon.com/blogs/devops/understanding-memory-usage-in-your-java-application-with-amazon-codeguru-profiler/

“Where has all that free memory gone?” This is the question we ask ourselves every time our application emits that dreaded OutOfMemoyError just before it crashes. Amazon CodeGuru Profiler can help you find the answer.

Thanks to its brand-new memory profiling capabilities, troubleshooting and resolving memory issues in Java applications (or almost anything that runs on the JVM) is much easier. AWS launched the CodeGuru Profiler Heap Summary feature at re:Invent 2020. This is the first step in helping us, developers, understand what our software is doing with all that memory it uses.

The Heap Summary view shows a list of Java classes and data types present in the Java Virtual Machine heap, alongside the amount of memory they’re retaining and the number of instances they represent. The following screenshot shows an example of this view.

Amazon CodeGuru Profiler heap summary view example

Figure: Amazon CodeGuru Profiler Heap Summary feature

Because CodeGuru Profiler is a low-overhead, production profiling service designed to be always on, it can capture and represent how memory utilization varies over time, providing helpful visual hints about the object types and the data types that exhibit a growing trend in memory consumption.

In the preceding screenshot, we can see that several lines on the graph are trending upwards:

  • The red top line, horizontal and flat, shows how much memory has been reserved as heap space in the JVM. In this case, we see a heap size of 512 MB, which can usually be configured in the JVM with command line parameters like -Xmx.
  • The second line from the top, blue, represents the total memory in use in the heap, independent of their type.
  • The third, fourth, and fifth lines show how much memory space each specific type has been using historically in the heap. We can easily spot that java.util.LinkedHashMap$Entry and java.lang.UUID display growing trends, whereas byte[] has a flat line and seems stable in memory usage.

Types that exhibit constantly growing trend of memory utilization with time deserve a closer look. Profiler helps you focus your attention on these cases. Associating the information presented by the Profiler with your own knowledge of your application and code base, you can evaluate whether the amount of memory being used for a specific data type can be considered normal, or if it might be a memory leak – the unintentional holding of memory by an application due to the failure in freeing-up unused objects. In our example above, java.util.LinkedHashMap$Entry and java.lang.UUIDare good candidates for investigation.

To make this functionality available to customers, CodeGuru Profiler uses the power of Java Flight Recorder (JFR), which is now openly available with Java 8 (since OpenJDK release 262) and above. The Amazon CodeGuru Profiler agent for Java, which already does an awesome job capturing data about CPU utilization, has been extended to periodically collect memory retention metrics from JFR and submit them for processing and visualization via Amazon CodeGuru Profiler. Thanks to its high stability and low overhead, the Profiler agent can be safely deployed to services in production, because it is exactly there, under real workloads, that really interesting memory issues are most likely to show up.

Summary

For more information about CodeGuru Profiler and other AI-powered services in the Amazon CodeGuru family, see Amazon CodeGuru. If you haven’t tried the CodeGuru Profiler yet, start your 90-day free trial right now and understand why continuous profiling is becoming a must-have in every production environment. For Amazon CodeGuru customers who are already enjoying the benefits of always-on profiling, this new feature is available at no extra cost. Just update your Profiler agent to version 1.1.0 or newer, and enable Heap Summary in your agent configuration.


Happy profiling!

Resource leak detection in Amazon CodeGuru Reviewer

Post Syndicated from Pranav Garg original https://aws.amazon.com/blogs/devops/resource-leak-detection-in-amazon-codeguru/

This post discusses the resource leak detector for Java in Amazon CodeGuru Reviewer. CodeGuru Reviewer automatically analyzes pull requests (created in supported repositories such as AWS CodeCommit, GitHub, GitHub Enterprise, and Bitbucket) and generates recommendations for improving code quality. For more information, see Automating code reviews and application profiling with Amazon CodeGuru. This blog does not describe the resource leak detector for Python programs that is now available in preview.

What are resource leaks?

Resources are objects with a limited availability within a computing system. These typically include objects managed by the operating system, such as file handles, database connections, and network sockets. Because the number of such resources in a system is limited, they must be released by an application as soon as they are used. Otherwise, you will run out of resources and you won’t be able to allocate new ones. The paradigm of acquiring a resource and releasing it is also followed by other categories of objects such as metric wrappers and timers.

Resource leaks are bugs that arise when a program doesn’t release the resources it has acquired. Resource leaks can lead to resource exhaustion. In the worst case, they can cause the system to slow down or even crash.

Starting with Java 7, most classes holding resources implement the java.lang.AutoCloseable interface and provide a close() method to release them. However, a close() call in source code doesn’t guarantee that the resource is released along all program execution paths. For example, in the following sample code, resource r is acquired by calling its constructor and is closed along the path corresponding to the if branch, shown using green arrows. To ensure that the acquired resource doesn’t leak, you must also close r along the path corresponding to the else branch (the path shown using red arrows).

A resource must be closed along all execution paths to prevent resource leaks

Often, resource leaks manifest themselves along code paths that aren’t frequently run, or under a heavy system load, or after the system has been running for a long time. As a result, such leaks are latent and can remain dormant in source code for long periods of time before manifesting themselves in production environments. This is the primary reason why resource leak bugs are difficult to detect or replicate during testing, and why automatically detecting these bugs during pull requests and code scans is important.

Detecting resource leaks in CodeGuru Reviewer

For this post, we consider the following Java code snippet. In this code, method getConnection() attempts to create a connection in the connection pool associated with a data source. Typically, a connection pool limits the maximum number of connections that can remain open at any given time. As a result, you must close connections after their use so as to not exhaust this limit.

 1     private Connection getConnection(final BasicDataSource dataSource, ...)
               throws ValidateConnectionException, SQLException {
 2         boolean connectionAcquired = false;
 3         // Retrying three times to get the connection.
 4         for (int attempt = 0; attempt < CONNECTION_RETRIES; ++attempt) {
 5             Connection connection = dataSource.getConnection();
 6             // validateConnection may throw ValidateConnectionException
 7             if (! validateConnection(connection, ...)) {
 8                 // connection is invalid
 9                 DbUtils.closeQuietly(connection);
10             } else {
11                 // connection is established
12                 connectionAcquired = true;
13                 return connection;
14             }
15         }
16         return null;
17     }

At first glance, it seems that the method getConnection() doesn’t leak connection resources. If a valid connection is established in the connection pool (else branch on line 10 is taken), the method getConnection() returns it to the client for use (line 13). If the connection established is invalid (if branch on line 7 is taken), it’s closed in line 9 before another attempt is made to establish a connection.

However, method validateConnection() at line 7 can throw a ValidateConnectionException. If this exception is thrown after a connection is established at line 5, the connection is neither closed in this method nor is it returned upstream to the client to be closed later. Furthermore, if this exceptional code path runs frequently, for instance, if the validation logic throws on a specific recurring service request, each new request causes a connection to leak in the connection pool. Eventually, the client can’t acquire new connections to the data source, impacting the availability of the service.

A typical recommendation to prevent resource leak bugs is to declare the resource objects in a try-with-resources statement block. However, we can’t use try-with-resources to fix the preceding method because this method is required to return an open connection for use in the upstream client. The CodeGuru Reviewer recommendation for the preceding code snippet is as follows:

“Consider closing the following resource: connection. The resource is referenced at line 7. The resource is closed at line 9. The resource is returned at line 13. There are other execution paths that don’t close the resource or return it, for example, when validateConnection throws an exception. To prevent this resource leak, close connection along these other paths before you exit this method.”

As mentioned in the Reviewer recommendation, to prevent this resource leak, you must close the established connection when method validateConnection() throws an exception. This can be achieved by inserting the validation logic (lines 7–14) in a try block. In the finally block associated with this try, the connection must be closed by calling DbUtils.closeQuietly(connection) if connectionAcquired == false. The method getConnection() after this fix has been applied is as follows:

private Connection getConnection(final BasicDataSource dataSource, ...) 
        throws ValidateConnectionException, SQLException {
    boolean connectionAcquired = false;
    // Retrying three times to get the connection.
    for (int attempt = 0; attempt < CONNECTION_RETRIES; ++attempt) {
        Connection connection = dataSource.getConnection();
        try {
            // validateConnection may throw ValidateConnectionException
            if (! validateConnection(connection, ...)) {
                // connection is invalid
                DbUtils.closeQuietly(connection);
            } else {
                // connection is established
                connectionAcquired = true;
                return connection;
            }
        } finally {
            if (!connectionAcquired) {
                DBUtils.closeQuietly(connection);
            }
        }
    }
    return null;
}

As shown in this example, resource leaks in production services can be very disruptive. Furthermore, leaks that manifest along exceptional or less frequently run code paths can be hard to detect or replicate during testing and can remain dormant in the code for long periods of time before manifesting themselves in production environments. With the resource leak detector, you can detect such leaks on objects belonging to a large number of popular Java types such as file streams, database connections, network sockets, timers and metrics, etc.

Combining static code analysis with machine learning for accurate resource leak detection

In this section, we dive deep into the inner workings of the resource leak detector. The resource leak detector in CodeGuru Reviewer uses static analysis algorithms and techniques. Static analysis algorithms perform code analysis without running the code. These algorithms are generally prone to high false positives (the tool might report correct code as having a bug). If the number of these false positives is high, it can lead to alarm fatigue and low adoption of the tool. As a result, the resource leak detector in CodeGuru Reviewer prioritizes precision over recall— the findings we surface are resource leaks with a high accuracy, though CodeGuru Reviewer could potentially miss some resource leak findings.

The main reason for false positives in static code analysis is incomplete information available to the analysis. CodeGuru Reviewer requires only the Java source files and doesn’t require all dependencies or the build artifacts. Not requiring the external dependencies or the build artifacts reduces the friction to perform automated code reviews. As a result, static analysis only has access to the code in the source repository and doesn’t have access to its external dependencies. The resource leak detector in CodeGuru Reviewer combines static code analysis with a machine learning (ML) model. This ML model is used to reason about external dependencies to provide accurate recommendations.

To understand the use of the ML model, consider again the code above for method getConnection() that had a resource leak. In the code snippet, a connection to the data source is established by calling BasicDataSource.getConnection() method, declared in the Apache Commons library. As mentioned earlier, we don’t require the source code of external dependencies like the Apache library for code analysis during pull requests. Without access to the code of external dependencies, a pure static analysis-driven technique doesn’t know whether the Connection object obtained at line 5 will leak, if not closed. Similarly, it doesn’t know that DbUtils.closeQuietly() is a library function that closes the connection argument passed to it at line 9. Our detector combines static code analysis with ML that learns patterns over such external function calls from a large number of available code repositories. As a result, our resource leak detector knows that the connection doesn’t leak along the following code path:

  • A connection is established on line 5
  • Method validateConnection() returns false at line 7
  • DbUtils.closeQuietly() is called on line 9

This suppresses the possible false warning. At the same time, the detector knows that there is a resource leak when the connection is established at line 5, and validateConnection() throws an exception at line 7 that isn’t caught.

When we run CodeGuru Reviewer on this code snippet, it surfaces only the second leak scenario and makes an appropriate recommendation to fix this bug.

The ML model used in the resource leak detector has been trained on a large number of internal Amazon and GitHub code repositories.

Responses to the resource leak findings

Although closing an open resource in code isn’t difficult, doing so properly along all program paths is important to prevent resource leaks. This can easily be overlooked, especially along exceptional or less frequently run paths. As a result, the resource leak detector in CodeGuru Reviewer has observed a relatively high frequency, and has alerted developers within Amazon to thousands of resource leaks before they hit production.

The resource leak detections have witnessed a high developer acceptance rate, and developer feedback towards the resource leak detector has been very positive. Some of the feedback from developers includes “Very cool, automated finding,” “Good bot :),” and “Oh man, this is cool.” Developers have also concurred that the findings are important and need to be fixed.

Conclusion

Resource leak bugs are difficult to detect or replicate during testing. They can impact the availability of production services. As a result, it’s important to automatically detect these bugs early on in the software development workflow, such as during pull requests or code scans. The resource leak detector in CodeGuru Reviewer combines static code analysis algorithms with ML to surface only the high confidence leaks. It has a high developer acceptance rate and has alerted developers within Amazon to thousands of leaks before those leaks hit production.

New for Amazon CodeGuru – Python Support, Security Detectors, and Memory Profiling

Post Syndicated from Danilo Poccia original https://aws.amazon.com/blogs/aws/new-for-amazon-codeguru-python-support-security-detectors-and-memory-profiling/

Amazon CodeGuru is a developer tool that helps you improve your code quality and has two main components:

  • CodeGuru Reviewer uses program analysis and machine learning to detect potential defects that are difficult to find in your code and offers suggestions for improvement.
  • CodeGuru Profiler collects runtime performance data from your live applications, and provides visualizations and recommendations to help you fine-tune your application performance.

Today, I am happy to announce three new features:

  • Python Support for CodeGuru Reviewer and Profiler (Preview) – You can now use CodeGuru to improve applications written in Python. Before this release, CodeGuru Reviewer could analyze Java code, and CodeGuru Profiler supported applications running on a Java virtual machine (JVM).
  • Security Detectors for CodeGuru Reviewer – A new set of detectors for CodeGuru Reviewer to identify security vulnerabilities and check for security best practices in your Java code.
  • Memory Profiling for CodeGuru Profiler – A new visualization of memory retention per object type over time. This makes it easier to find memory leaks and optimize how your application is using memory.

Let’s see these functionalities in more detail.

Python Support for CodeGuru Reviewer and Profiler (Preview)
Python Support for CodeGuru Reviewer is available in Preview and offers recommendations on how to improve the Python code of your applications in multiple categories such as concurrency, data structures and control flow, scientific/math operations, error handling, using the standard library, and of course AWS best practices.

You can now also use CodeGuru Profiler to collect runtime performance data from your Python applications and get visualizations to help you identify how code is running on the CPU and where time is consumed. In this way, you can detect the most expensive lines of code of your application. Focusing your tuning activities on those parts helps you reduce infrastructure cost and improve application performance.

Let’s see the CodeGuru Reviewer in action with some Python code. When I joined AWS eight years ago, one of the first projects I created was a Filesystem in Userspace (FUSE) interface to Amazon Simple Storage Service (S3) called yas3fs (Yet Another S3-backed File System). It was inspired by the more popular s3fs-fuse project but rewritten from scratch to implement a distributed cache synchronized by Amazon Simple Notification Service (SNS) notifications (now, thanks to the many contributors, it’s using S3 event notifications). It was also a good excuse for me to learn more about Python programming and S3. It’s a personal project that at the time made available as open source. Today, if you need a shared file system, you can use Amazon Elastic File System (EFS).

In the CodeGuru console, I associate the yas3fs repository. You can associate repositories from GitHub, including GitHub Enterprise Cloud and GitHub Enterprise Server, Bitbucket, or AWS CodeCommit.

After that, I can get a code review from CodeGuru in two ways:

  • Automatically, when I create a pull request. This is a great way to use it as you and your team are working on a code base.
  • Manually, creating a repository analysis to get a code review for all the code in one branch. This is useful to start using GodeGuru with an existing code base.

Since I just associated the whole repository, I go for a full analysis and write down the branch name to review (apologies, I was still using master at the time, now I use main for new projects).

After a few minutes, the code review is completed, and there are 14 recommendations. Not bad, but I can definitely improve the code. Here’s a few of the recommendations I get. I was using exceptions and global variables too much at the time.

Security Detectors for CodeGuru Reviewer
The new CodeGuru Reviewer Security Detector uses automated reasoning to analyze all code paths and find potential security issues deep in your Java code, even ones that span multiple methods and files and that may involve multiple sequences of operations. To build this detector, we used learning and best practices from Amazon’s 20+ years of experience.

The Security Detector is also identifying security vulnerabilities in the top 10 Open Web Application Security Project (OWASP) categories, such as weak hash encryption.

If the security detector discovers an issue, it offers a suggested remediation along with an explanation. In this way, it’s much easier to follow security best practices for AWS APIs, such as those for AWS Key Management Service (KMS) and Amazon Elastic Compute Cloud (EC2), and for common Java cryptography and TLS/SSL libraries.

With help from the security detector, security engineers can focus on architectural and application-specific security best-practices, and code reviewers can focus their attention on other improvements.

Memory Profiling for CodeGuru Profiler
For applications running on a JVM, CodeGuru Profiler can now show the Heap Summary, a consolidated view of memory retention during a time frame, tracking both overall sizes and number of objects per object type (such as String, int, char[], and custom types). These metrics are presented in a timeline graph, so that you can easily spot trends and peaks of memory utilization per object type.

Here are a couple of scenarios where this can help:

Memory Leaks – A constantly growing memory utilization curve for one or more object types may indicate a leak (intended here as unnecessary retention of memory objects by the application), possibly leading to out-of-memory errors and application crashes.

Memory Optimizations – Having a breakdown of memory utilization per object type is a step beyond traditional memory utilization monitoring, based solely on JVM-level metrics like total heap usage. By knowing that an unexpectedly high amount of memory has been associated with a specific object type, you can focus your analysis and optimization efforts on the parts of your application that are responsible for allocating and referencing objects of that type.

For example, here is a graph showing how memory is used by a Java application over an interval of time. Apart from the total capacity available and the used space, I can see how memory is being used by some specific object types, such as byte[], java.lang.UUID, and the entries of a java.util.LinkedHashMap. The continuous growth over time of the memory retained by these object types is suspicious. There is probably a memory leak I have to investigate.

In the table just below, I have a longer list of object types allocating memory on the heap. The first three are selected and for that reason are shown in the graph above. Here, I can inspect other object types and select them to see their memory usage over time. It looks like the three I already selected are the ones with more risk of being affected by a memory leak.

Available Now
These new features are available today in all regions where Amazon CodeGuru is offered. For more information, please see the AWS Regional Services table.

There are no pricing changes for Python support, security detectors, and memory profiling. You pay for what you use without upfront fees or commitments.

Learn more about Amazon CodeGuru and start using these new features today to improve the code quality of your applications.  

Danilo

Raising code quality for Python applications using Amazon CodeGuru

Post Syndicated from Ran Fu original https://aws.amazon.com/blogs/devops/raising-code-quality-for-python-applications-using-amazon-codeguru/

We are pleased to announce the launch of Python support for Amazon CodeGuru, a service for automated code reviews and application performance recommendations. CodeGuru is powered by program analysis and machine learning, and trained on best practices and hard-learned lessons across millions of code reviews and thousands of applications profiled on open-source projects and internally at Amazon.

Amazon CodeGuru has two services:

  • Amazon CodeGuru Reviewer – Helps you improve source code quality by detecting hard-to-find defects during application development and recommending how to remediate them.
  • Amazon CodeGuru Profiler – Helps you find the most expensive lines of code, helps reduce your infrastructure cost, and fine-tunes your application performance.

The launch of Python support extends CodeGuru beyond its original Java support. Python is a widely used language for various use cases, including web app development and DevOps. Python’s growth in data analysis and machine learning areas is driven by its rich frameworks and libraries. In this post, we discuss how to use CodeGuru Reviewer and Profiler to improve your code quality for Python applications.

CodeGuru Reviewer for Python

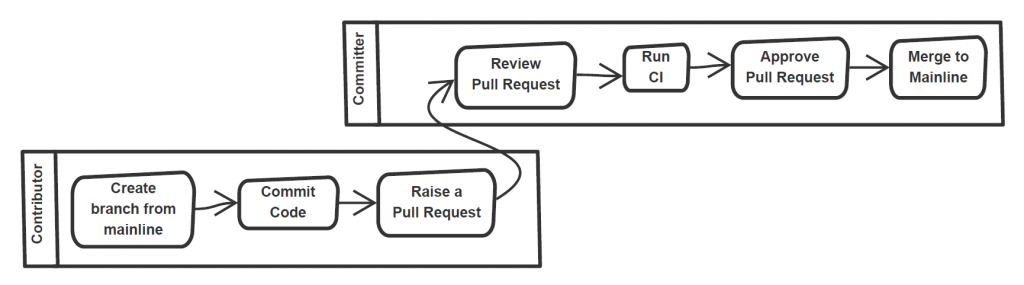
CodeGuru Reviewer now allows you to analyze your Python code through pull requests and full repository analysis. For more information, see Automating code reviews and application profiling with Amazon CodeGuru. We analyzed large code corpuses and Python documentation to source hard-to-find coding issues and trained our detectors to provide best practice recommendations. We expect such recommendations to benefit beginners as well as expert Python programmers.

CodeGuru Reviewer generates recommendations in the following categories:

  • AWS SDK APIs best practices
  • Data structures and control flow, including exception handling
  • Resource leaks
  • Secure coding practices to protect from potential shell injections

In the following sections, we provide real-world examples of bugs that can be detected in each of the categories:

AWS SDK API best practices

AWS has hundreds of services and thousands of APIs. Developers can now benefit from CodeGuru Reviewer recommendations related to AWS APIs. AWS recommendations in CodeGuru Reviewer cover a wide range of scenarios such as detecting outdated or deprecated APIs, warning about API misuse, authentication and exception scenarios, and efficient API alternatives.

Consider the pagination trait, implemented by over 1,000 APIs from more than 150 AWS services. The trait is commonly used when the response object is too large to return in a single response. To get the complete set of results, iterated calls to the API are required, until the last page is reached. If developers were not aware of this, they would write the code as the following (this example is patterned after actual code):

def sync_ddb_table(source_ddb, destination_ddb):
    response = source_ddb.scan(TableName=“table1”)
    for item in response['Items']:
        ...
        destination_ddb.put_item(TableName=“table2”, Item=item)
    …   

Here the scan API is used to read items from one Amazon DynamoDB table and the put_item API to save them to another DynamoDB table. The scan API implements the Pagination trait. However, the developer missed iterating on the results beyond the first scan, leading to only partial copying of data.

The following screenshot shows what CodeGuru Reviewer recommends:

The following screenshot shows CodeGuru Reviewer recommends on the need for pagination

The developer fixed the code based on this recommendation and added complete handling of paginated results by checking the LastEvaluatedKey value in the response object of the paginated API scan as follows:

def sync_ddb_table(source_ddb, destination_ddb):
    response = source_ddb.scan(TableName==“table1”)
    for item in response['Items']:
        ...
        destination_ddb.put_item(TableName=“table2”, Item=item)
    # Keeps scanning util LastEvaluatedKey is null
    while "LastEvaluatedKey" in response:
        response = source_ddb.scan(
            TableName="table1",
            ExclusiveStartKey=response["LastEvaluatedKey"]
        )
        for item in response['Items']:
            destination_ddb.put_item(TableName=“table2”, Item=item)
    …   

CodeGuru Reviewer recommendation is rich and offers multiple options for implementing Paginated scan. We can also initialize the ExclusiveStartKey value to None and iteratively update it based on the LastEvaluatedKey value obtained from the scan response object in a loop. This fix below conforms to the usage mentioned in the official documentation.

def sync_ddb_table(source_ddb, destination_ddb):
    table = source_ddb.Table(“table1”)
    scan_kwargs = {
                  …
    }
    done = False
    start_key = None
    while not done:
        if start_key:
            scan_kwargs['ExclusiveStartKey'] = start_key
        response = table.scan(**scan_kwargs)
        for item in response['Items']:
            destination_ddb.put_item(TableName=“table2”, Item=item)
        start_key = response.get('LastEvaluatedKey', None)
        done = start_key is None

Data structures and control flow

Python’s coding style is different from other languages. For code that does not conform to Python idioms, CodeGuru Reviewer provides a variety of suggestions for efficient and correct handling of data structures and control flow in the Python 3 standard library:

  • Using DefaultDict for compact handling of missing dictionary keys over using the setDefault() API or dealing with KeyError exception
  • Using a subprocess module over outdated APIs for subprocess handling
  • Detecting improper exception handling such as catching and passing generic exceptions that can hide latent issues.
  • Detecting simultaneous iteration and modification to loops that might lead to unexpected bugs because the iterator expression is only evaluated one time and does not account for subsequent index changes.

The following code is a specific example that can confuse novice developers.

def list_sns(region, creds, sns_topics=[]):
    sns = boto_session('sns', creds, region)
    response = sns.list_topics()
    for topic_arn in response["Topics"]:
        sns_topics.append(topic_arn["TopicArn"])
    return sns_topics
  
def process():
    ...
    for region, creds in jobs["auth_config"]:
        arns = list_sns(region, creds)
        ... 

The process() method iterates over different AWS Regions and collects Regional ARNs by calling the list_sns() method. The developer might expect that each call to list_sns() with a Region parameter returns only the corresponding Regional ARNs. However, the preceding code actually leaks the ARNs from prior calls to subsequent Regions. This happens due to an idiosyncrasy of Python relating to the use of mutable objects as default argument values. Python default value are created exactly one time, and if that object is mutated, subsequent references to the object refer to the mutated value instead of re-initialization.

The following screenshot shows what CodeGuru Reviewer recommends:

The following screenshot shows CodeGuru Reviewer recommends about initializing a value for mutable objects

The developer accepted the recommendation and issued the below fix.

def list_sns(region, creds, sns_topics=None):
    sns = boto_session('sns', creds, region)
    response = sns.list_topics()
    if sns_topics is None: 
        sns_topics = [] 
    for topic_arn in response["Topics"]:
        sns_topics.append(topic_arn["TopicArn"])
    return sns_topics

Resource leaks

A Pythonic practice for resource handling is using Context Managers. Our analysis shows that resource leaks are rampant in Python code where a developer may open external files or windows and forget to close them eventually. A resource leak can slow down or crash your system. Even if a resource is closed, using Context Managers is Pythonic. For example, CodeGuru Reviewer detects resource leaks in the following code:

def read_lines(file):
    lines = []
    f = open(file, ‘r’)
    for line in f:
        lines.append(line.strip(‘\n’).strip(‘\r\n’))
    return lines

The following screenshot shows that CodeGuru Reviewer recommends that the developer either use the ContextLib with statement or use a try-finally block to explicitly close a resource.

The following screenshot shows CodeGuru Reviewer recommend about fixing the potential resource leak

The developer accepted the recommendation and fixed the code as shown below.

def read_lines(file):
    lines = []
    with open(file, ‘r’) as f: 
        for line in f:
            lines.append(line.strip(‘\n’).strip(‘\r\n’))
    return lines

Secure coding practices

Python is often used for scripting. An integral part of such scripts is the use of subprocesses. As of this writing, CodeGuru Reviewer makes a limited, but important set of recommendations to make sure that your use of eval functions or subprocesses is secure from potential shell injections. It issues a warning if it detects that the command used in eval or subprocess scenarios might be influenced by external factors. For example, see the following code:

def execute(cmd):
    try:
        retcode = subprocess.call(cmd, shell=True)
        ...
    except OSError as e:
        ...

The following screenshot shows the CodeGuru Reviewer recommendation:

The following screenshot shows CodeGuru Reviewer recommends about potential shell injection vulnerability

The developer accepted this recommendation and made the following fix.

def execute(cmd):
    try:
        retcode = subprocess.call(shlex.quote(cmd), shell=True)
        ...
    except OSError as e:
        ...

As shown in the preceding recommendations, not only are the code issues detected, but a detailed recommendation is also provided on how to fix the issues, along with a link to the Python official documentation. You can provide feedback on recommendations in the CodeGuru Reviewer console or by commenting on the code in a pull request. This feedback helps improve the performance of Reviewer so that the recommendations you see get better over time.

Now let’s take a look at CodeGuru Profiler.

CodeGuru Profiler for Python

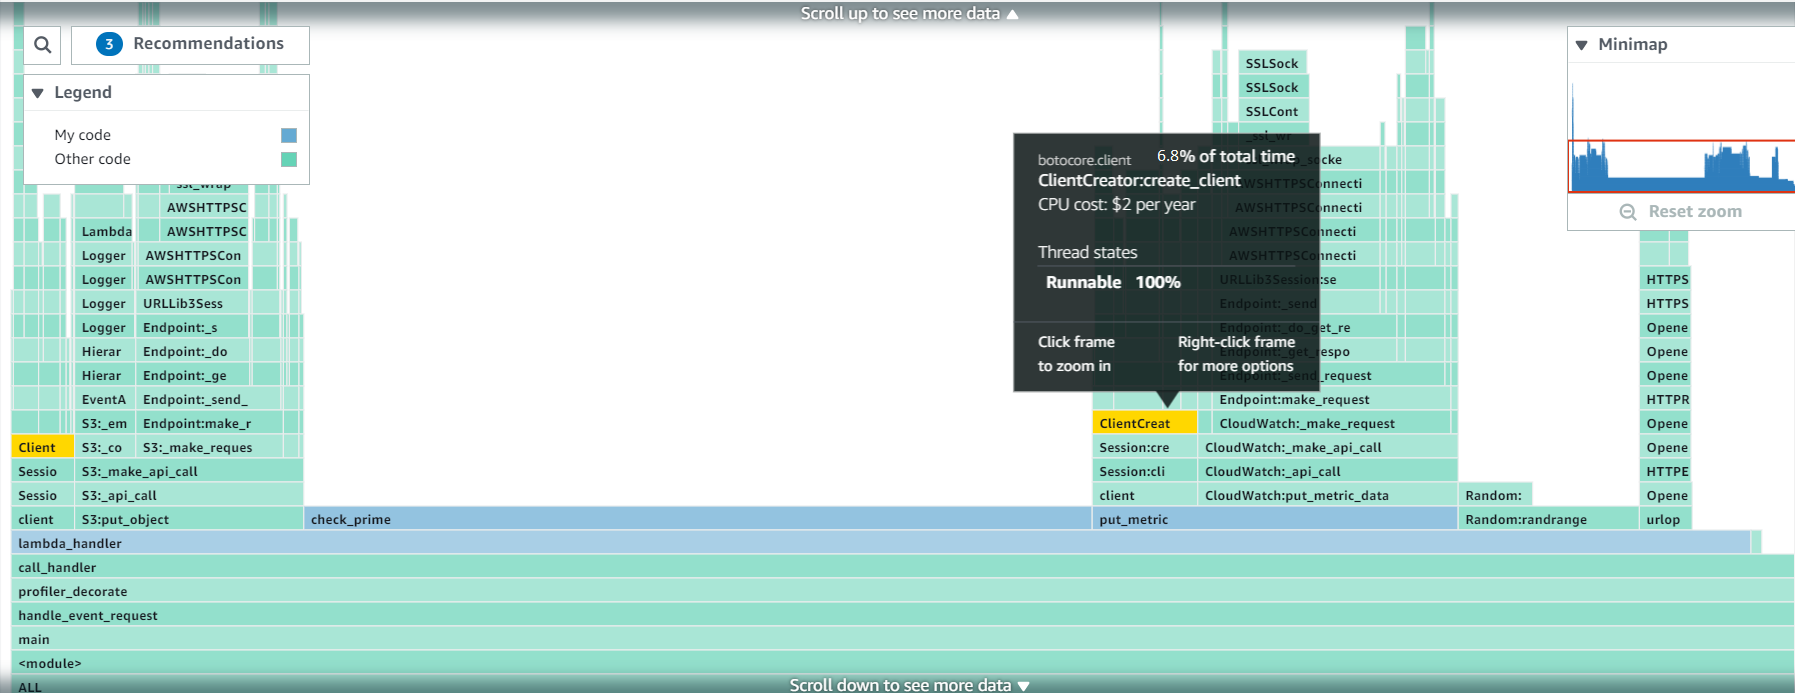
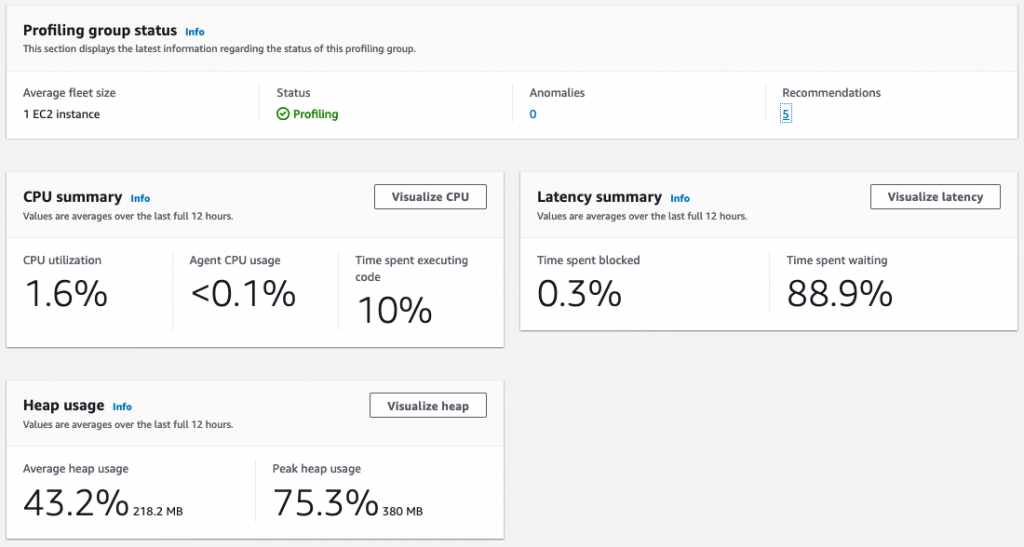
Amazon CodeGuru Profiler analyzes your application’s performance characteristics and provides interactive visualizations to show you where your application spends its time. These visualizations a. k. a. flame graphs are a powerful tool to help you troubleshoot which code methods have high latency or are over utilizing your CPU.

Thanks to the new Python agent, you can now use CodeGuru Profiler on your Python applications to investigate performance issues.

The following list summarizes the supported versions as of this writing.

  • AWS Lambda functions: Python3.8, Python3.7, Python3.6
  • Other environments: Python3.9, Python3.8, Python3.7, Python3.6

Onboarding your Python application

For this post, let’s assume you have a Python application running on Amazon Elastic Compute Cloud (Amazon EC2) hosts that you want to profile. To onboard your Python application, complete the following steps:

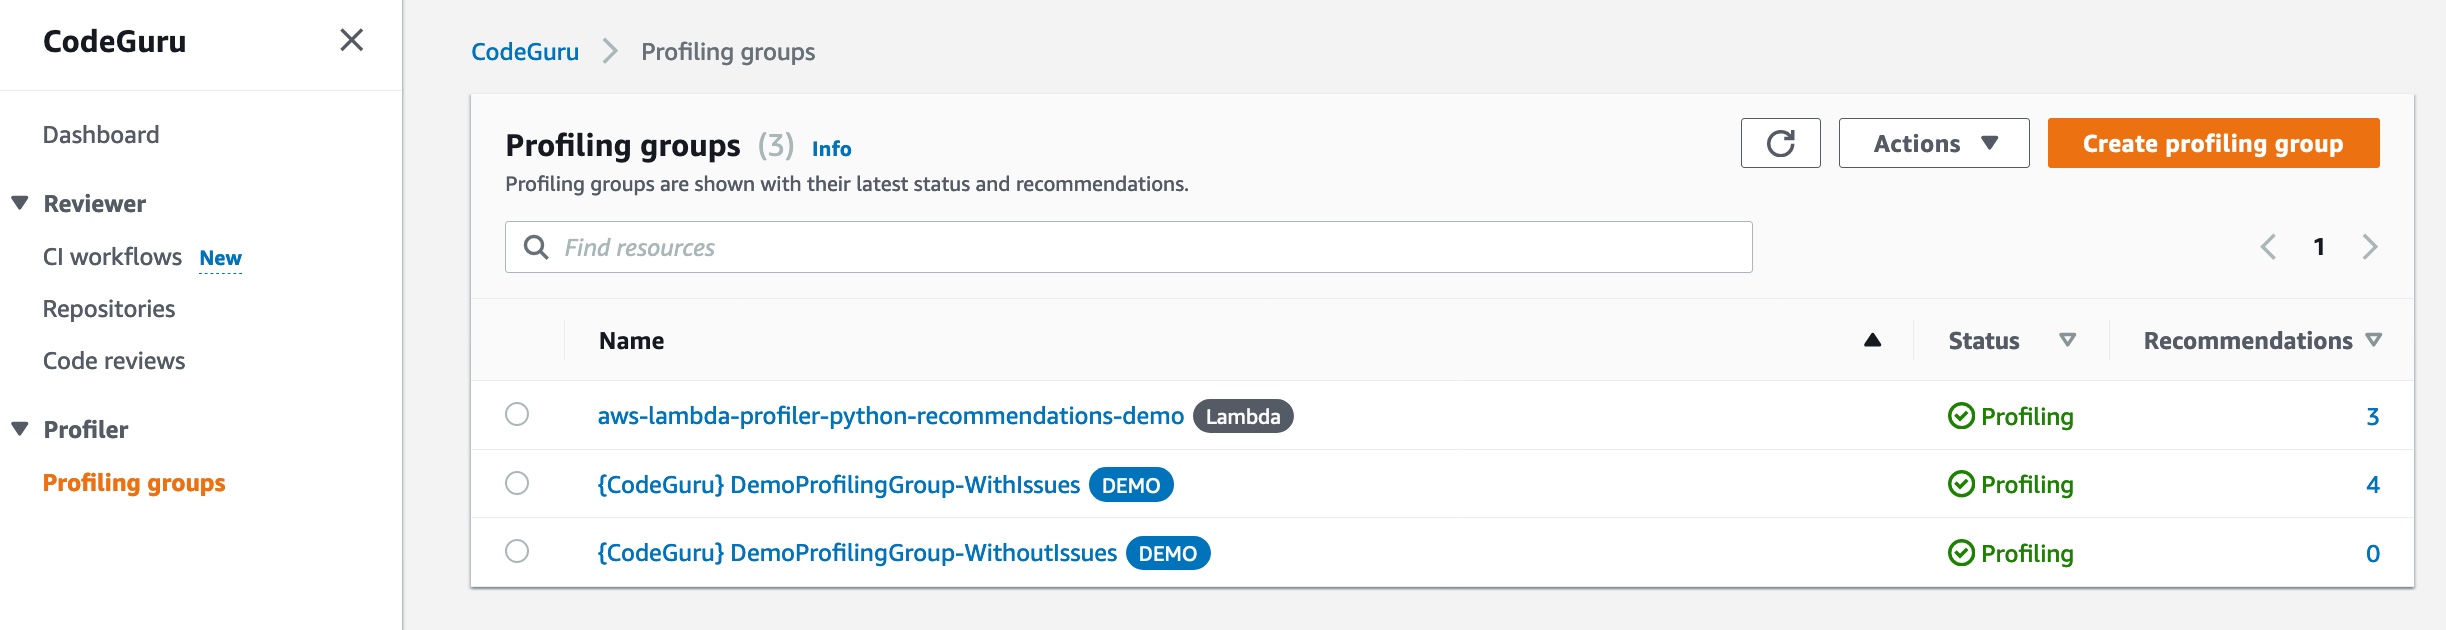
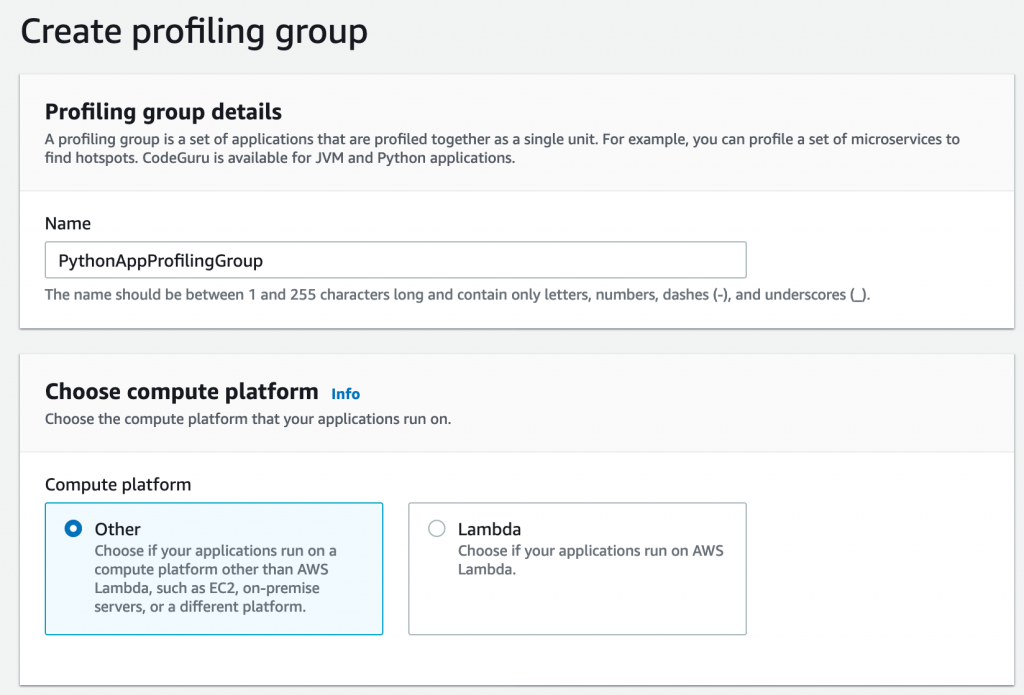
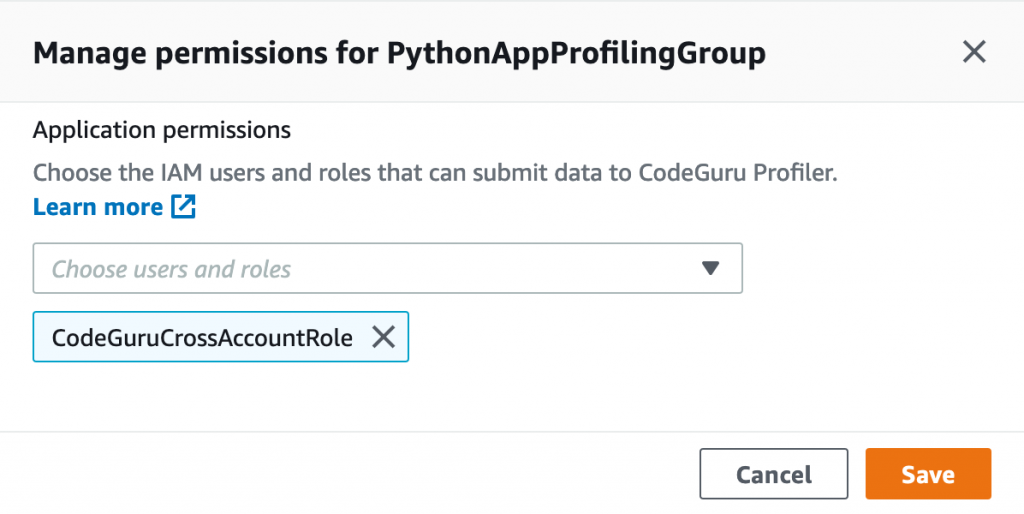
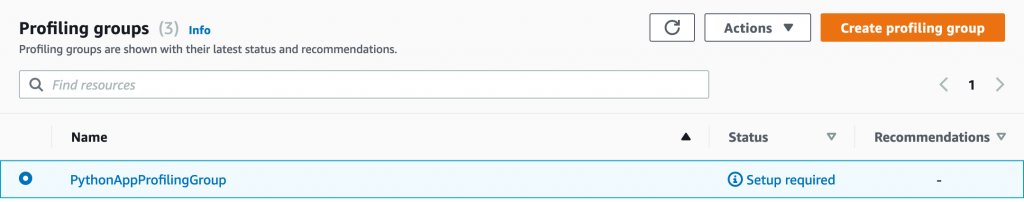
1. Create a new profiling group in CodeGuru Profiler console called ProfilingGroupForMyApplication. Give access to your Amazon EC2 execution role to submit to this profiling group. See the documentation for details about how to create a Profiling Group.

2. Install the codeguru_profiler_agent module:

pip3 install codeguru_profiler_agent

3. Start the profiler in your application.

An easy way to profile your application is to start your script through the codeguru_profiler_agent module. If you have an app.py script, use the following code:

python -m codeguru_profiler_agent -p ProfilingGroupForMyApplication app.py

Alternatively, you can start the agent manually inside the code. This must be done only one time, preferably in your startup code:

from codeguru_profiler_agent import Profiler

if __name__ == "__main__":
     Profiler(profiling_group_name='ProfilingGroupForMyApplication')
     start_application()    # your code in there....

Onboarding your Python Lambda function

Onboarding for an AWS Lambda function is quite similar.

  1. Create a profiling group called ProfilingGroupForMyLambdaFunction, this time we select “Lambda” for the compute platform. Give access to your Lambda function role to submit to this profiling group. See the documentation for details about how to create a Profiling Group.
  2. Include the codeguru_profiler_agent module in your Lambda function code.
  3. Add the with_lambda_profiler decorator to your handler function:
from codeguru_profiler_agent import with_lambda_profiler

@with_lambda_profiler(profiling_group_name='ProfilingGroupForMyLambdaFunction')
def handler_function(event, context):
      # Your code here

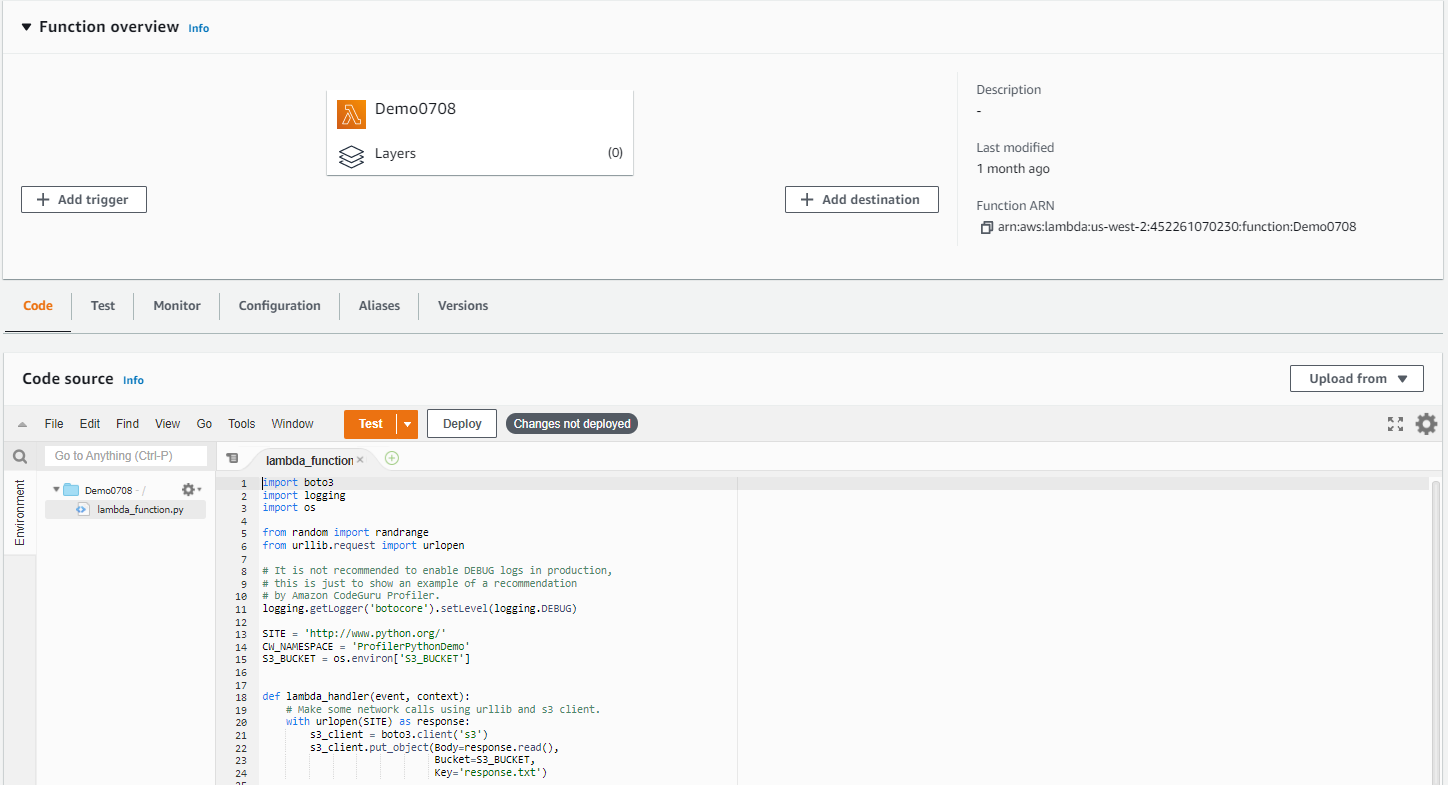
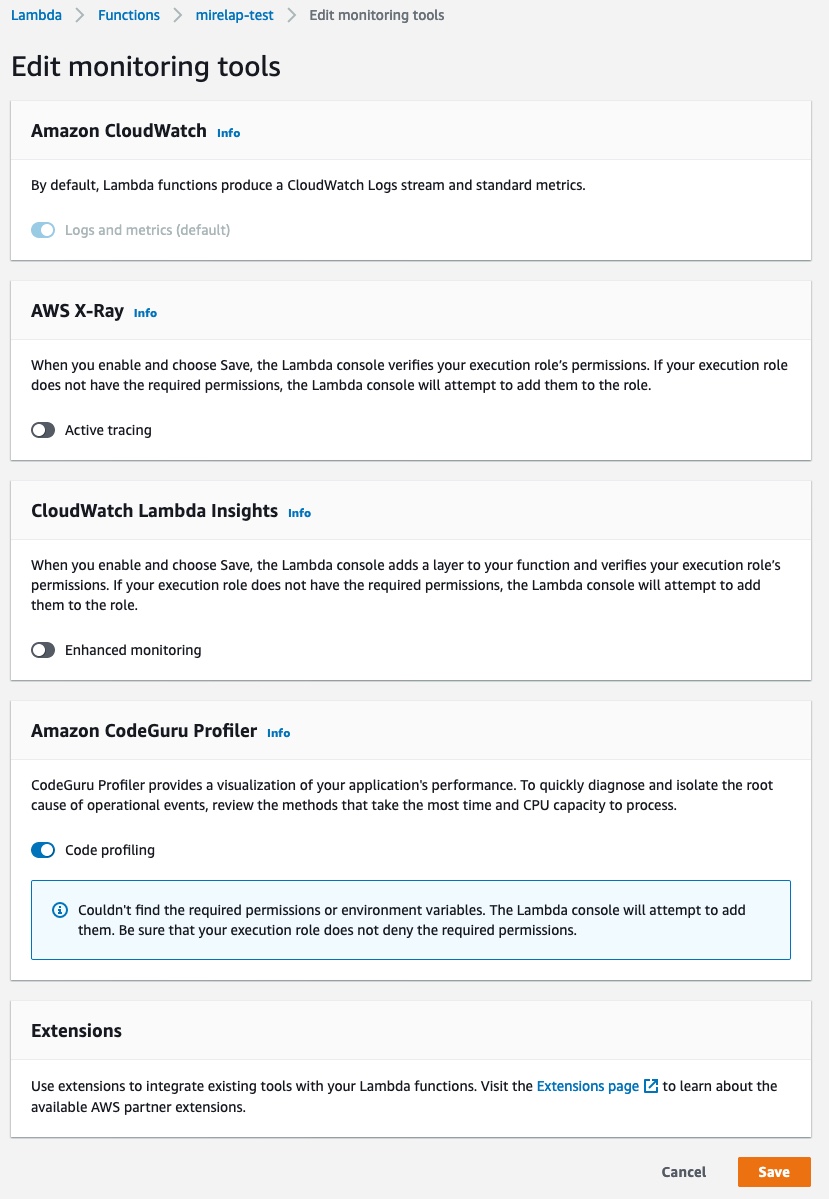
Alternatively, you can profile an existing Lambda function without updating the source code by adding a layer and changing the configuration. For more information, see Profiling your applications that run on AWS Lambda.

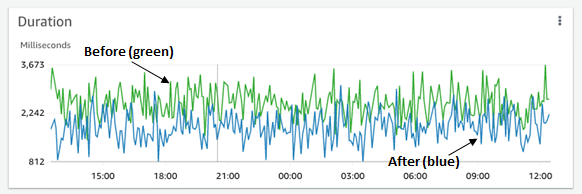
Profiling a Lambda function helps you see what is slowing down your code so you can reduce the duration, which reduces the cost and improves latency. You need to have continuous traffic on your function in order to produce a usable profile.

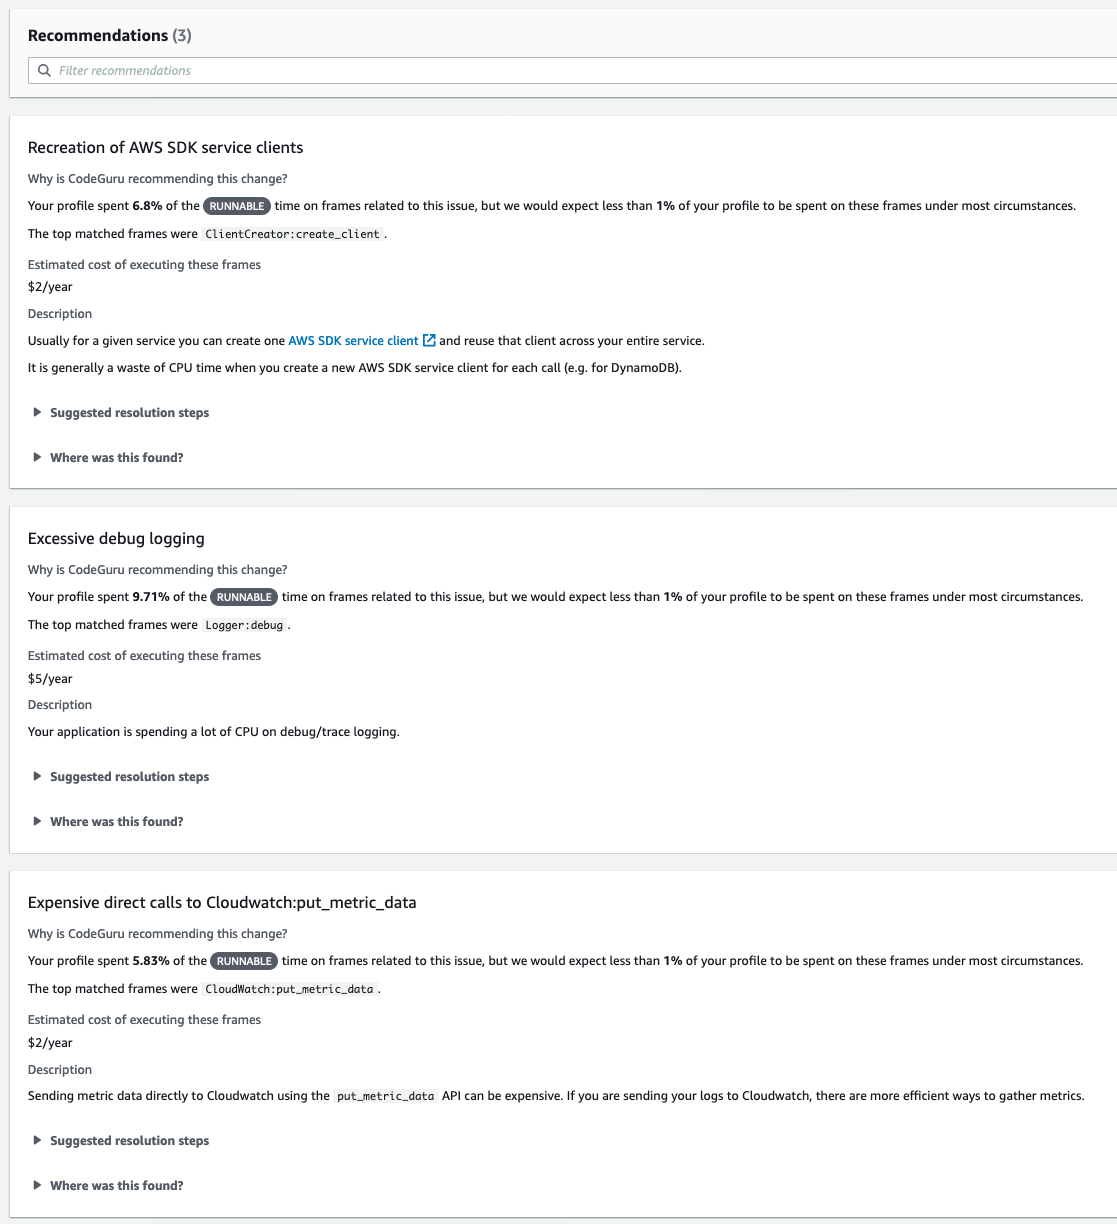
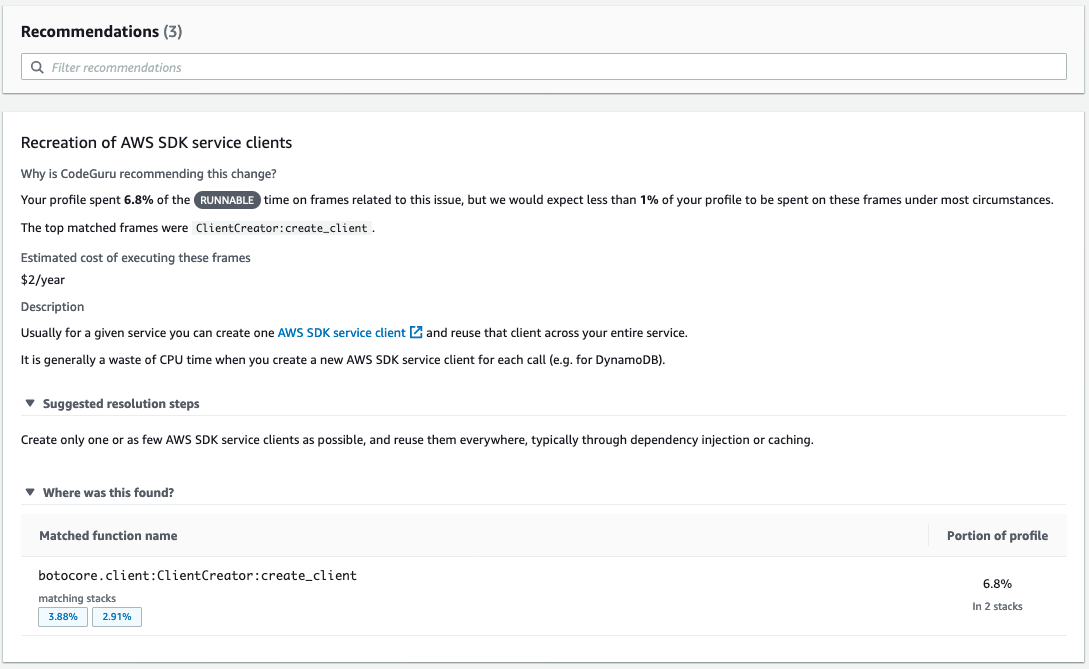
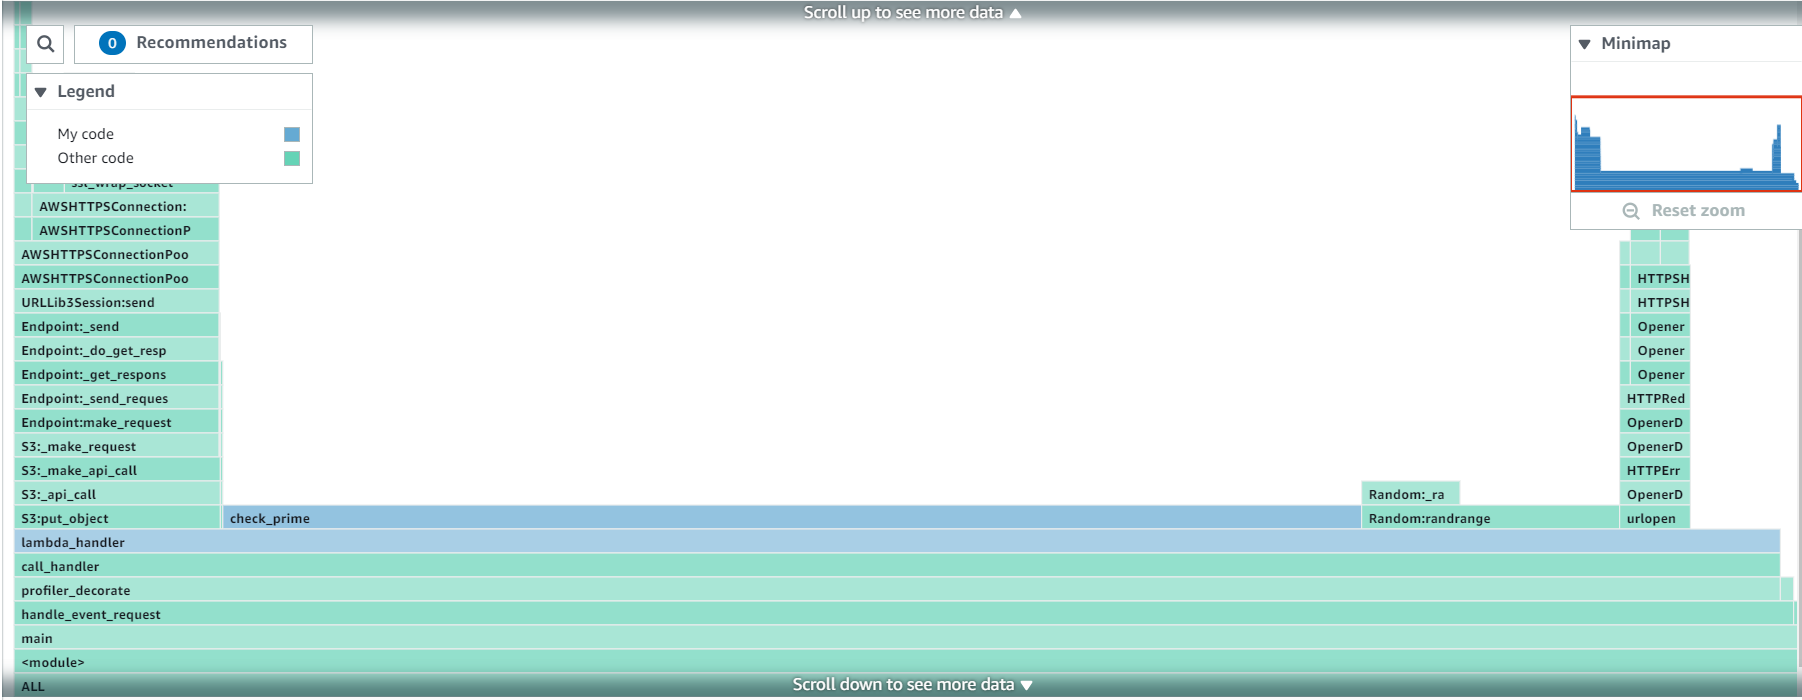
Viewing your profile

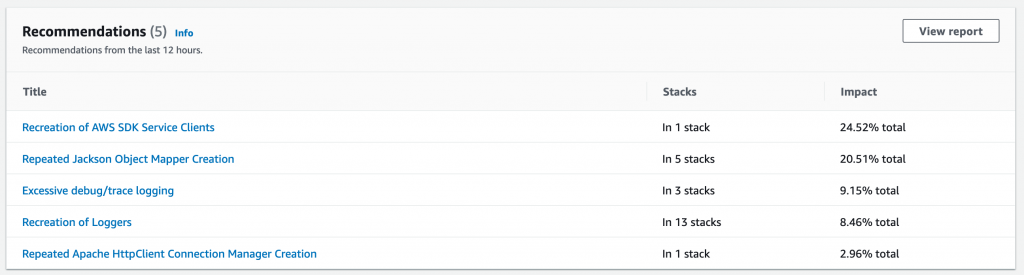
After running your profile for some time, you can view it on the CodeGuru console.

Screenshot of Flame graph visualization by CodeGuru Profiler

Each frame in the flame graph shows how much that function contributes to latency. In this example, an outbound call that crosses the network is taking most of the duration in the Lambda function, caching its result would improve the latency.

For more information, see Investigating performance issues with Amazon CodeGuru Profiler.

Supportability for CodeGuru Profiler is documented here.

If you don’t have an application to try CodeGuru Profiler on, you can use the demo application in the following GitHub repo.

Conclusion

This post introduced how to leverage CodeGuru Reviewer to identify hard-to-find code defects in various issue categories and how to onboard your Python applications or Lambda function in CodeGuru Profiler for CPU profiling. Combining both services can help you improve code quality for Python applications. CodeGuru is now available for you to try. For more pricing information, please see Amazon CodeGuru pricing.


About the Authors

Neela Sawant is a Senior Applied Scientist in the Amazon CodeGuru team. Her background is building AI-powered solutions to customer problems in a variety of domains such as software, multimedia, and retail. When she isn’t working, you’ll find her exploring the world anew with her toddler and hacking away at AI for social good.


Pierre Marieu is a Software Development Engineer in the Amazon CodeGuru Profiler team in London. He loves building tools that help the day-to-day life of other software engineers. Previously, he worked at Amadeus IT, building software for the travel industry.


Ran Fu is a Senior Product Manager in the Amazon CodeGuru team. He has a deep customer empathy, and love exploring who are the customers, what are their needs, and why those needs matter. Besides work, you may find him snowboarding in Keystone or Vail, Colorado.


Incorporating security in code-reviews using Amazon CodeGuru Reviewer

Post Syndicated from Nikunj Vaidya original https://aws.amazon.com/blogs/devops/incorporating-security-in-code-reviews-using-amazon-codeguru-reviewer/

Today, software development practices are constantly evolving to empower developers with tools to maintain a high bar of code quality. Amazon CodeGuru Reviewer offers this capability by carrying out automated code-reviews for developers, based on the trained machine learning models that can detect complex defects and providing intelligent actionable recommendations to mitigate those defects. A quick overview of CodeGuru is covered in this blog post.

Security analysis is a critical part of a code review and CodeGuru Reviewer offers this capability with a new set of security detectors. These security detectors introduced in CodeGuru Reviewer are geared towards identifying security risks from the top 10 OWASP categories and ensures that your code follows best practices for AWS Key Management Service (AWS KMS), Amazon Elastic Compute Cloud (Amazon EC2) API, and common Java crypto and TLS/SSL libraries. As of today, CodeGuru security analysis supports Java language, thus we will take an example of a Java application.

In this post, we will walk through the on-boarding workflow to carry out the security analysis of the code repository and generate recommendations for a Java application.


Security workflow overview:

The new security workflow, introduced for CodeGuru reviewer, utilizes the source code and build artifacts to generate recommendations. The security detector evaluates build artifacts to generate security-related recommendations whereas other detectors continue to scan the source code to generate recommendations. With the use of build artifacts for evaluation, the detector can carry out a whole-program inter-procedural analysis to discover issues that are caused across your code (e.g., hardcoded credentials in one file that are passed to an API in another) and can reduce false-positives by checking if an execution path is valid or not. You must provide the source code .zip file as well as the build artifact .zip file for a complete analysis.

Customers can run a security scan when they create a repository analysis. CodeGuru Reviewer provides an additional option to get both code and security recommendations. As explained in the following sections, CodeGuru Reviewer will create an Amazon Simple Storage Service (Amazon S3) bucket in your AWS account for that region to upload or copy your source code and build artifacts for the analysis. This repository analysis option can be run on Java code from any repository.


Prerequisites

Prepare the source code and artifact zip files: If you do not have your Java code locally, download the source code that you want to evaluate for security and zip it. Similarly, if needed, download the build artifact .jar file for your source code and zip it. It will be required to upload the source code and build artifact as separate .zip files as per the instructions in subsequent sections. Thus even if it is a single file (eg. single .jar file), you will still need to zip it. Even if the .zip file includes multiple files, the right files will be discovered and analyzed by CodeGuru. For our sample test, we will use src.zip and jar.zip file, saved locally.

Creating an S3 bucket repository association:

This section summarizes the high-level steps to create the association of your S3 bucket repository.

1. On the CodeGuru console, choose Code reviews.

2. On the Repository analysis tab, choose Create repository analysis.

Screenshot of initiating the repository analysis

Figure: Screenshot of initiating the repository analysis


3. For the source code analysis, select Code and security recommendations.

4. For Repository name, enter a name for your repository.

5. Under Additional settings, for Code review name, enter a name for trackability purposes.

6. Choose Create S3 bucket and associate.

Screenshot to show selection of Security Code Analysis

Figure: Screenshot to show selection of Security Code Analysis

It takes a few seconds to create a new S3 bucket in the current Region. When it completes, you will see the below screen.

Screenshot for Create repository analysis showing S3 bucket created

Figure: Screenshot for Create repository analysis showing S3 bucket created


7. Choose Upload to the S3 bucket option and under that choose Upload source code zip file and select the zip file (src.zip) from your local machine to upload.

Screenshot of popup to upload code and artifacts from S3 bucket

Figure: Screenshot of popup to upload code and artifacts from S3 bucket


8. Similarly, choose Upload build artifacts zip file and select the zip file (jar.zip) from your local machine and upload.


Screenshot for Create repository analysis showing S3 paths populated

Figure: Screenshot for Create repository analysis showing S3 paths populated


Alternatively, you can always upload the source code and build artifacts as zip file from any of your existing S3 bucket as below.

9. Choose Browse S3 buckets for existing artifacts and upload from there as shown below:


Screenshot to upload code and artifacts from S3 bucket

Figure: Screenshot to upload code and artifacts from an existing S3 bucket


10. Now click Create repository analysis and trigger the code review.

A new pending entry is created as shown below.


Screenshot of code review in Pending state

Figure: Screenshot of code review in Pending state

After a few minutes, you would see the recommendations generate that would include security analysis too. In the below case, there are 10 recommendations generated.

Screenshot of repository analysis being completed

Figure: Screenshot of repository analysis being completed


For the subsequent code reviews, you can use the same repository and upload new files or create a new repository as shown below:


Screenshot of subsequent code review making repository selection

Figure: Screenshot of subsequent code review making repository selection


Recommendations

Apart from detecting the security risks from the top 10 OWASP categories, the security detector, detects the deep security issues by analyzing data flow across multiple methods, procedures, and files.

The recommendations generated in the area of security are labelled as Security. In the below example we see a recommendation to remove hard-coded credentials and a non-security-related recommendation about refactoring of code for better maintainability.

Screenshot of Recommendations generated

Figure: Screenshot of Recommendations generated


Below is another example of recommendations pointing out the potential resource-leak as well as a security issue pointing to a potential risk of path traversal attack.

Screenshot of deep security recommendations

Figure: More examples of deep security recommendations


As this blog is focused on on-boarding aspects, we will cover the explanation of recommendations in more detail in a separate blog.

Disassociation of Repository (optional):

The association of CodeGuru to the S3 bucket repository can be removed by following below steps. Navigate to the Repositories page, select the repository and choose Disassociate repository.

Screenshot of disassociating the S3 bucket repo with CodeGuru

Figure: Screenshot of disassociating the S3 bucket repo with CodeGuru


Conclusion

This post reviewed the support for on-boarding workflow to carry out the security analysis in CodeGuru Reviewer. We initiated a full repository analysis for the Java code using a separate UI workflow and generated recommendations.

We hope this post was useful and would enable you to conduct code analysis using Amazon CodeGuru Reviewer.


About the Author

Author's profile photo


Nikunj Vaidya is a Sr. Solutions Architect with Amazon Web Services, focusing in the area of DevOps services. He builds technical content for the field enablement and offers technical guidance to the customers on AWS DevOps solutions and services that would streamline the application development process, accelerate application delivery, and enable maintaining a high bar of software quality.

Tightening application security with Amazon CodeGuru

Post Syndicated from Brian Farnhill original https://aws.amazon.com/blogs/devops/tightening-application-security-with-amazon-codeguru/

Amazon CodeGuru is a developer tool powered by machine learning (ML) that provides intelligent recommendations for improving code quality and identifies an application’s most expensive lines of code. To help you find and remediate potential security issues in your code, Amazon CodeGuru Reviewer now includes an expanded set of security detectors. In this post, we discuss the new types of security issues CodeGuru Reviewer can detect.

Time to read 9 minutes
Services used Amazon CodeGuru

The new security detectors are now a feature in CodeGuru Reviewer for Java applications. These detectors focus on finding security issues in your code before you deploy it. They extend CodeGuru Reviewer by providing additional security-specific recommendations to the existing set of application improvements it already recommends. When an issue is detected, a remediation recommendation and explanation is generated. This allows you to find and remediate issues before the code is deployed. These findings can help in addressing the OWASP top 10 web application security risks, with many of the recommendations being based on specific issues customers have had in this space.

You can run a security scan by creating a repository analysis. CodeGuru Reviewer now provides an additional option to get both code and security recommendations for Java codebases. Selecting this option enables you to find potential security vulnerabilities before they are promoted to production, and support users remaining secure when using your service.

Types of security issues CodeGuru Reviewer detects

Previously, CodeGuru Reviewer helped address security by detecting potential sensitive information leaks (such as personally identifiable information or credit card numbers). The additional CodeGuru Reviewer security detectors expand on this by addressing:

  • AWS API security best practices – Helps you follow security best practices when using AWS APIs, such as avoiding hard-coded credentials in API calls
  • Java crypto library best practices – Identifies when you’re not using best practices for common Java cryptography libraries, such as avoiding outdated cryptographic ciphers
  • Secure web applications – Inspects code for insecure handling of untrusted data, such as not sanitizing user-supplied input to protect against cross-site scripting, SQL injection, LDAP injection, path traversal injection, and more
  • AWS Security best practices – Developed in collaboration with AWS Security, these best practices help bring our internal expertise to customers

Examples of new security findings

The following are examples of findings that CodeGuru Reviewer security detectors can now help you identify and resolve.

AWS API security best practices

AWS API security best practice detectors inspect your code to identify issues that can be caused by not following best practices related to AWS SDKs and APIs. An example of a detected issue in this category is using hard-coded AWS credentials. Consider the following code:

import com.amazonaws.auth.AWSCredentials;
import com.amazonaws.auth.BasicAWSCredentials;

static String myKeyId ="AKIAX742FUDUQXXXXXXX";
static String mySecretKey = "MySecretKey";

public static void main(String[] args) {
    AWSCredentials creds = getCreds(myKeyId, mySecretKey);
}

static AWSCredentials getCreds(String id, String key) {
    return new BasicAWSCredentials(id, key);}
}

In this code, the variables myKeyId and mySecretKey are hard-coded in the application. This may have been done to move quickly, but it can also lead to these values being discovered and misused.

In this case, CodeGuru Reviewer recommends using environment variables or an AWS profile to store these values, because these can be retrieved at runtime and aren’t stored inside the application (or its source code). Here you can see an example of what this finding looks like in the console:

An example of the CodeGuru reviewer finding for IAM credentials in the AWS console

The recommendation suggests using environment variables or an AWS profile instead, and that after you delete or rotate the affected key you monitor it with CloudWatch for any attempted use. Following the learn more link, you’ll see additional detail and recommended approaches for remediation, such as using the DefaultAWSCredentialsProviderChain. An example of how to remediate this in the preceding code is to update the getCreds() function:

import com.amazonaws.auth.DefaultAWSCredentialsProviderChain;

static AWSCredentials getCreds() {
    DefaultAWSCredentialsProviderChain creds =
        new DefaultAWSCredentialsProviderChain();
    return creds.getCredentials();
}

Java crypto library best practices

When working with data that must be protected, cryptography provides mechanisms to encrypt and decrypt the information. However, to ensure the security of this data, the application must use a strong and modern cipher. Consider the following code:

import javax.crypto.Cipher;

static final String CIPHER = "DES";

public void run() {
    cipher = Cipher.getInstance(CIPHER);
}

A cipher object is created with the DES algorithm. CodeGuru Reviewer recommends a stronger cipher to help protect your data. This is what the recommendation looks like in the console:

An example of the CodeGuru reviewer finding for encryption ciphers in the AWS console

Based on this, one example of how to address this is to substitute a different cipher:

static final String CIPHER ="RSA/ECB/OAEPPadding";

This is just one option for how it could be addressed. The CodeGuru Reviewer recommendation text suggests several options, and a link to documentation to help you choose the best cipher.

Secure web applications

When working with sensitive information in cookies, such as temporary session credentials, those values must be protected from interception. This is done by flagging the cookies as secure, which prevents them from being sent over an unsecured HTTP connection. Consider the following code:

import javax.servlet.http.Cookie;

public static void createCookie() {
    Cookie cookie = new Cookie("name", "value");
}

In this code, a new cookie is created that is not marked as secure. CodeGuru Reviewer notifies you that you could make a correction by adding:

cookie.setSecure(true);

This screenshot shows you an example of what the finding looks like.

An example CodeGuru finding that shows how to ensure cookies are secured.

AWS Security best practices

This category of detectors has been built in collaboration with AWS Security and assists in detecting many other issue types. Consider the following code, which illustrates how a string can be re-encrypted with a new key from AWS Key Management Service (AWS KMS):

import java.nio.ByteBuffer;
import com.amazonaws.services.kms.AWSKMS;
import com.amazonaws.services.kms.AWSKMSClientBuilder;
import com.amazonaws.services.kms.model.DecryptRequest;
import com.amazonaws.services.kms.model.EncryptRequest;

AWSKMS client = AWSKMSClientBuilder.standard().build();
ByteBuffer sourceCipherTextBlob = ByteBuffer.wrap(new byte[]{1, 2, 3, 4, 5, 6, 7, 8, 9, 0});

DecryptRequest req = new DecryptRequest()
                         .withCiphertextBlob(sourceCipherTextBlob);
ByteBuffer plainText = client.decrypt(req).getPlaintext();

EncryptRequest res = new EncryptRequest()
                         .withKeyId("NewKeyId")
                         .withPlaintext(plainText);
ByteBuffer ciphertext = client.encrypt(res).getCiphertextBlob();

This approach puts the decrypted value at risk by decrypting and re-encrypting it locally. CodeGuru Reviewer recommends using the ReEncrypt method—performed on the server side within AWS KMS—to avoid exposing your plaintext outside AWS KMS. A solution that uses the ReEncrypt object looks like the following code:

import com.amazonaws.services.kms.model.ReEncryptRequest;

ReEncryptRequest req = new ReEncryptRequest()
                           .withCiphertextBlob(sourceCipherTextBlob)
                           .withDestinationKeyId("NewKeyId");

client.reEncrypt(req).getCiphertextBlob();

This screenshot shows you an example of what the finding looks like.

An example CodeGuru finding to show how to avoid decrypting and encrypting locally when it's not needed

Detecting issues deep in application code

Detecting security issues can be made more complex by the contributing code being spread across multiple methods, procedures and files. This separation of code helps ensure humans work in more manageable ways, but for a person to look at the code, it obscures the end to end view of what is happening. This obscurity makes it harder, or even impossible to find complex security issues. CodeGuru Reviewer can see issues regardless of these boundaries, deeply assessing code and the flow of the application to find security issues throughout the application. An example of this depth exists in the code below:

import java.io.UnsupportedEncodingException;
import javax.servlet.http.Cookie;
import javax.servlet.http.HttpServletRequest;
import javax.servlet.http.HttpServletResponse;

private String decode(final String val, final String enc) {
    try {
        return java.net.URLDecoder.decode(val, enc);
    } catch (UnsupportedEncodingException e) {
        e.printStackTrace();
    }
    return "";
}

public void pathTraversal(HttpServletRequest request) throws IOException {
    javax.servlet.http.Cookie[] theCookies = request.getCookies();
    String path = "";
    if (theCookies != null) {
        for (javax.servlet.http.Cookie theCookie : theCookies) {
            if (theCookie.getName().equals("thePath")) {
                path = decode(theCookie.getValue(), "UTF-8");
                break;
            }
        }
    }
    if (!path.equals("")) {
        String fileName = path + ".txt";
        String decStr = new String(org.apache.commons.codec.binary.Base64.decodeBase64(
            org.apache.commons.codec.binary.Base64.encodeBase64(fileName.getBytes())));
        java.io.FileOutputStream fileOutputStream = new java.io.FileOutputStream(decStr);
        java.io.FileDescriptor fd = fileOutputStream.getFD();
        System.out.println(fd.toString());
    }
}

This code presents an issue around path traversal, specifically relating to the Broken Access Control rule in the OWASP top 10 (specifically CWE 22). The issue is that a FileOutputStream is being created using an external input (in this case, a cookie) and the input is not being checked for invalid values that could traverse the file system. To add to the complexity of this sample, the input is encoded and decoded from Base64 so that the cookie value isn’t passed directly to the FileOutputStream constructor, and the parsing of the cookie happens in a different function. This is not something you would do in the real world as it is needlessly complex, but it shows the need for tools that can deeply analyze the flow of data in an application. Here the value passed to the FileOutputStream isn’t an external value, it is the result of the encode/decode line and as such, is a new object. However CodeGuru Reviewer follows the flow of the application to understand that the input still came from a cookie, and as such it should be treated as an external value that needs to be validated. An example of a fix for the issue here would be to replace the pathTraversal function with the sample shown below:

static final String VALID_PATH1 = "./test/file1.txt";
static final String VALID_PATH2 = "./test/file2.txt";
static final String DEFAULT_VALID_PATH = "./test/file3.txt";

public void pathTraversal(HttpServletRequest request) throws IOException {
    javax.servlet.http.Cookie[] theCookies = request.getCookies();
    String path = "";
    if (theCookies != null) {
        for (javax.servlet.http.Cookie theCookie : theCookies) {
            if (theCookie.getName().equals("thePath")) {
                path = decode(theCookie.getValue(), "UTF-8");
                break;
            }
        }
    }
    String fileName = "";
    if (!path.equals("")) {
        if (path.equals(VALID_PATH1)) {
            fileName = VALID_PATH1;
        } else if (path.equals(VALID_PATH2)) {
            fileName = VALID_PATH2;
        } else {
            fileName = DEFAULT_VALID_PATH;
        }
        String decStr = new String(org.apache.commons.codec.binary.Base64.decodeBase64(
            org.apache.commons.codec.binary.Base64.encodeBase64(fileName.getBytes())));
        java.io.FileOutputStream fileOutputStream = new java.io.FileOutputStream(decStr);
        java.io.FileDescriptor fd = fileOutputStream.getFD();
        System.out.println(fd.toString());
    }
}

The main difference in this sample is that the path variable is tested against known good values that would prevent path traversal, and if one of the two valid path options isn’t provided, the third default option is used. In all cases the externally provided path is validated to ensure that there isn’t a path through the code that allows for path traversal to occur in the subsequent call. As with the first sample, the path is still encoded/decoded to make it more complicated to follow the flow through, but the deep analysis performed by CodeGuru Reviewer can follow this and provide meaningful insights to help ensure the security of your applications.

Extending the value of CodeGuru Reviewer

CodeGuru Reviewer already recommends different types of fixes for your Java code, such as concurrency and resource leaks. With these new categories, CodeGuru Reviewer can let you know about security issues as well, bringing further improvements to your applications’ code. The new security detectors operate in the same way that the existing detectors do, using static code analysis and ML to provide high confidence results. This can help avoid signaling non-issue findings to developers, which can waste time and erode trust in the tool.

You can provide feedback on recommendations in the CodeGuru Reviewer console or by commenting on the code in a pull request. This feedback helps improve the performance of the reviewer, so the recommendations you see get better over time.

Conclusion

Security issues can be difficult to identify and can impact your applications significantly. CodeGuru Reviewer security detectors help make sure you’re following security best practices while you build applications.

CodeGuru Reviewer is available for you to try. For full repository analysis, the first 30,000 lines of code analyzed each month per payer account are free. For pull request analysis, we offer a 90 day free trial for new customers. Please check the pricing page for more details. For more information, see Getting started with CodeGuru Reviewer.

About the author

Brian Farnhill

Brian Farnhill is a Developer Specialist Solutions Architect in the Australian Public Sector team. His background is building solutions and helping customers improve DevOps tools and processes. When he isn’t working, you’ll find him either coding for fun or playing online games.