Tag Archives: artificial intelligence

Amazon Bedrock Guardrails supports cross-account safeguards with centralized control and management

Post Syndicated from Channy Yun (윤석찬) original https://aws.amazon.com/blogs/aws/amazon-bedrock-guardrails-supports-cross-account-safeguards-with-centralized-control-and-management/

Today, we’re announcing the general availability of cross-account safeguards in Amazon Bedrock Guardrails, a new capability that enables centralized enforcement and management of safety controls across multiple AWS accounts within an organization.

With this new capability, you can specify a guardrail in a new Amazon Bedrock policy within the management account of your organization that automatically enforces configured safeguards across all member entities for every model invocation with Amazon Bedrock. This organization-wide implementation supports uniform protection across all accounts and generative AI applications with centralized control and management. This capability also offers flexibility to apply account-level and application-specific controls depending on use case requirements in addition to organizational safeguards.

  • Organization-level enforcements apply a single guardrail from your organization’s management account to all entities within the organization through policy settings. This guardrail automatically enforces filters across all member entities, including organizational units (OUs) and individual accounts, for all Amazon Bedrock model invocations.
  • Account-level enforcement enables automatic enforcement of configured safeguards across all Amazon Bedrock model invocations in your AWS account. The configured safeguards in the account-level guardrail apply to all inference API calls.

You can now establish and centrally manage dependable, comprehensive protection through a single, unified approach. This supports consistent adherence to corporate responsible AI requirements while significantly reducing the administrative burden of monitoring individual accounts and applications. Your security team no longer needs to oversee and verify configurations or compliance for each account independently.

Getting started with centralized enforcement in Amazon Bedrock Guardrails
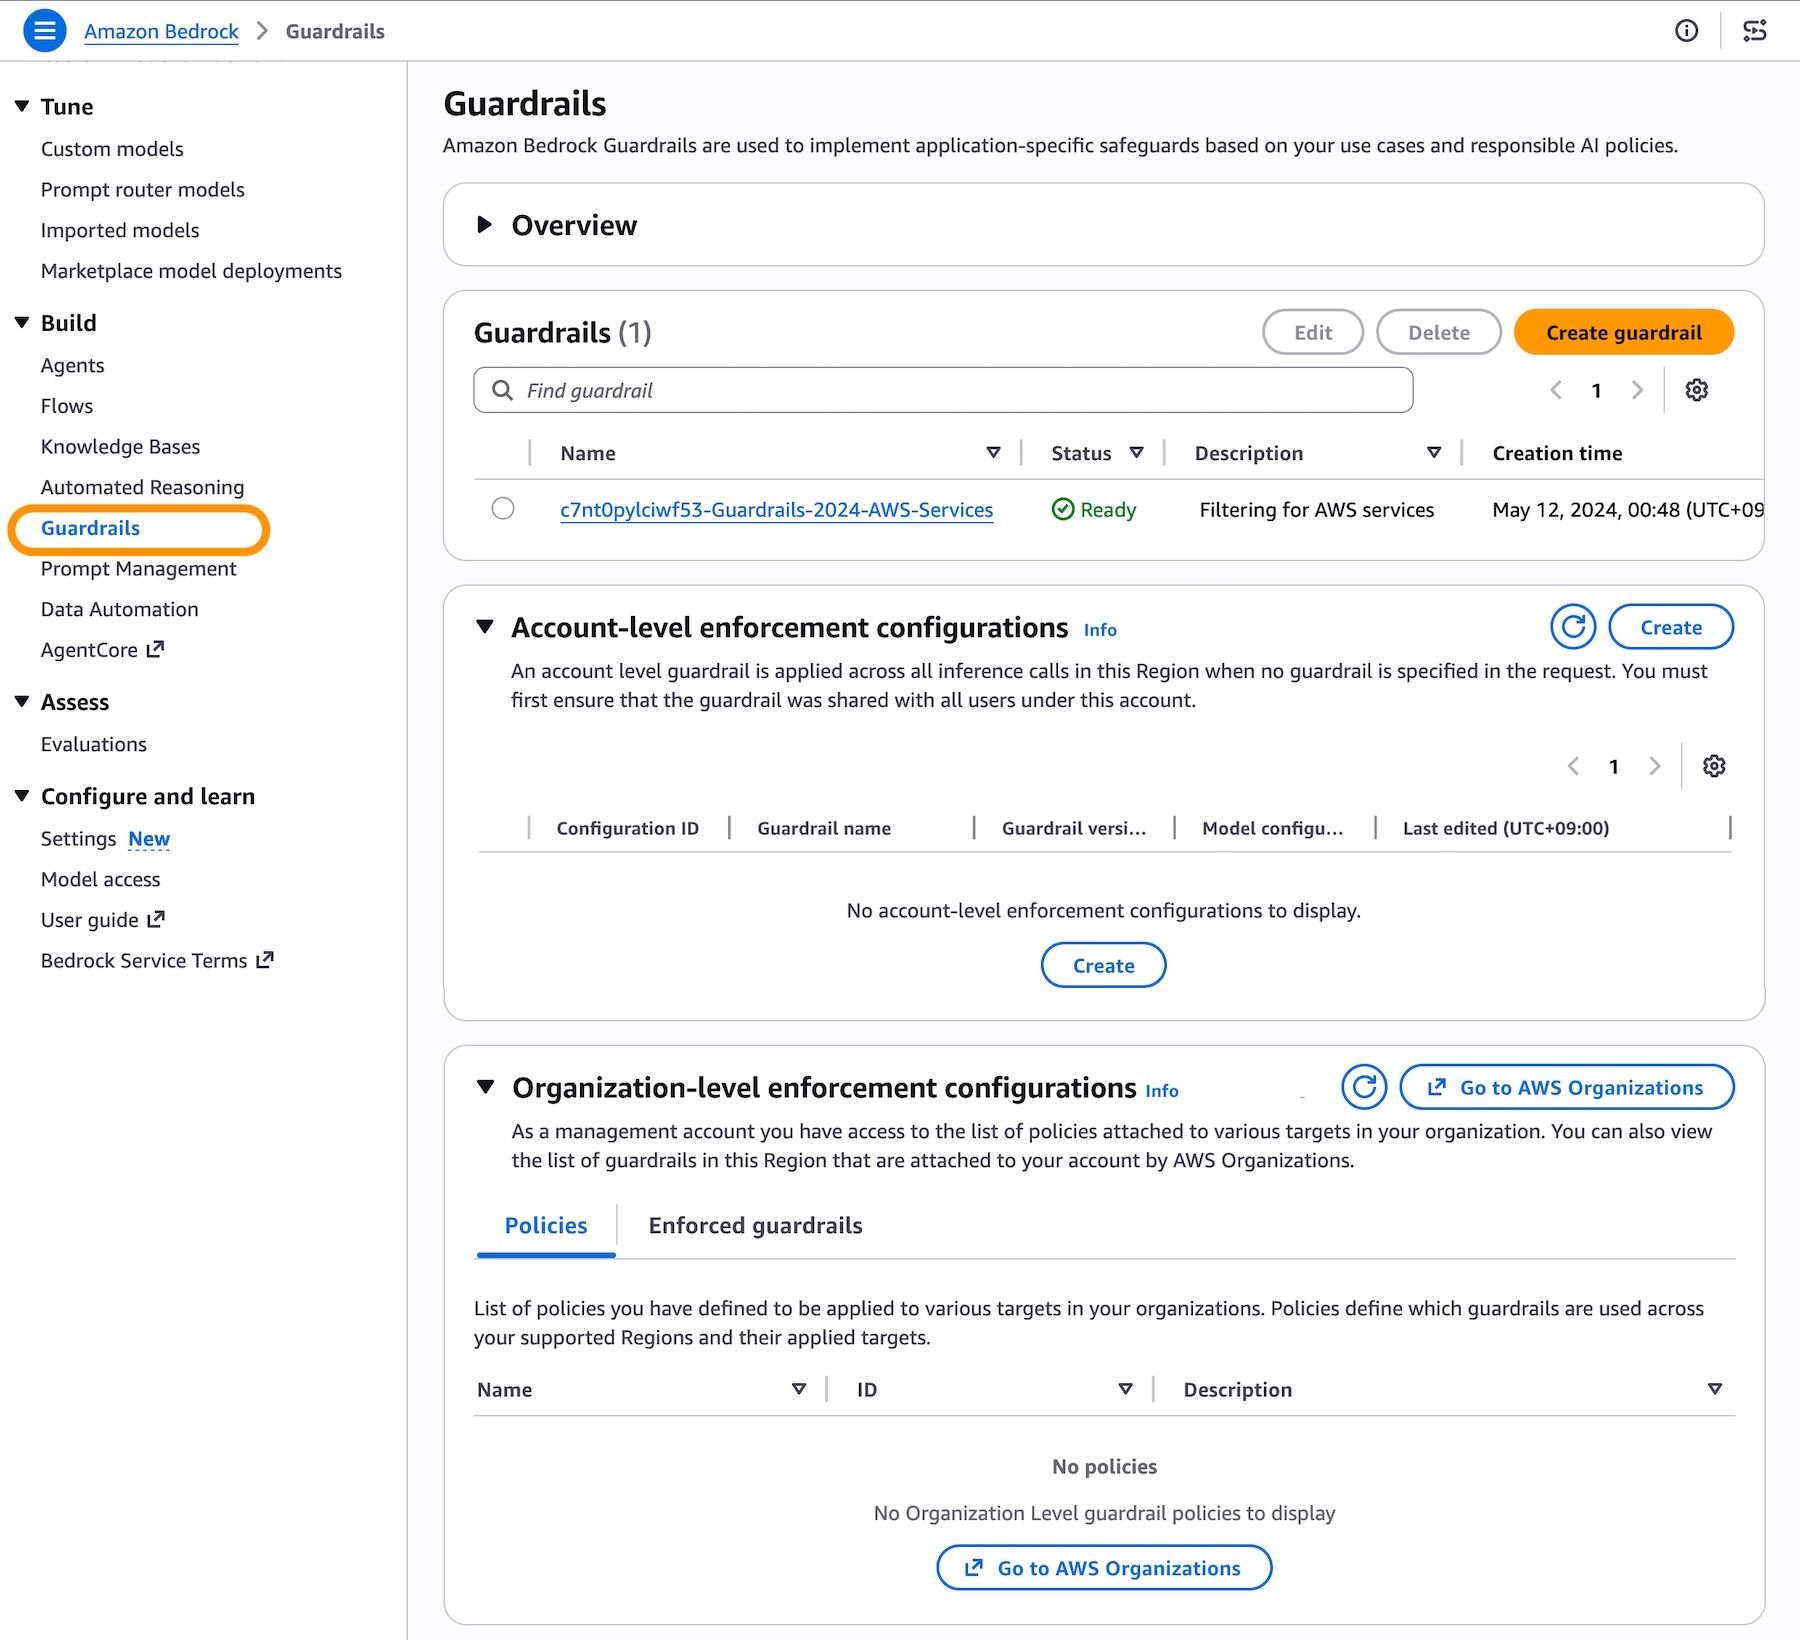
You can get started with account-level and organization-level enforcement configuration in the Amazon Bedrock Guardrails console. Before the enforcement configuration, you need to create a guardrail with a particular version to support the guardrail configuration remains immutable and cannot be modified by member accounts and complete prerequisites for using the new capability such as resource-based policies for guardrails.

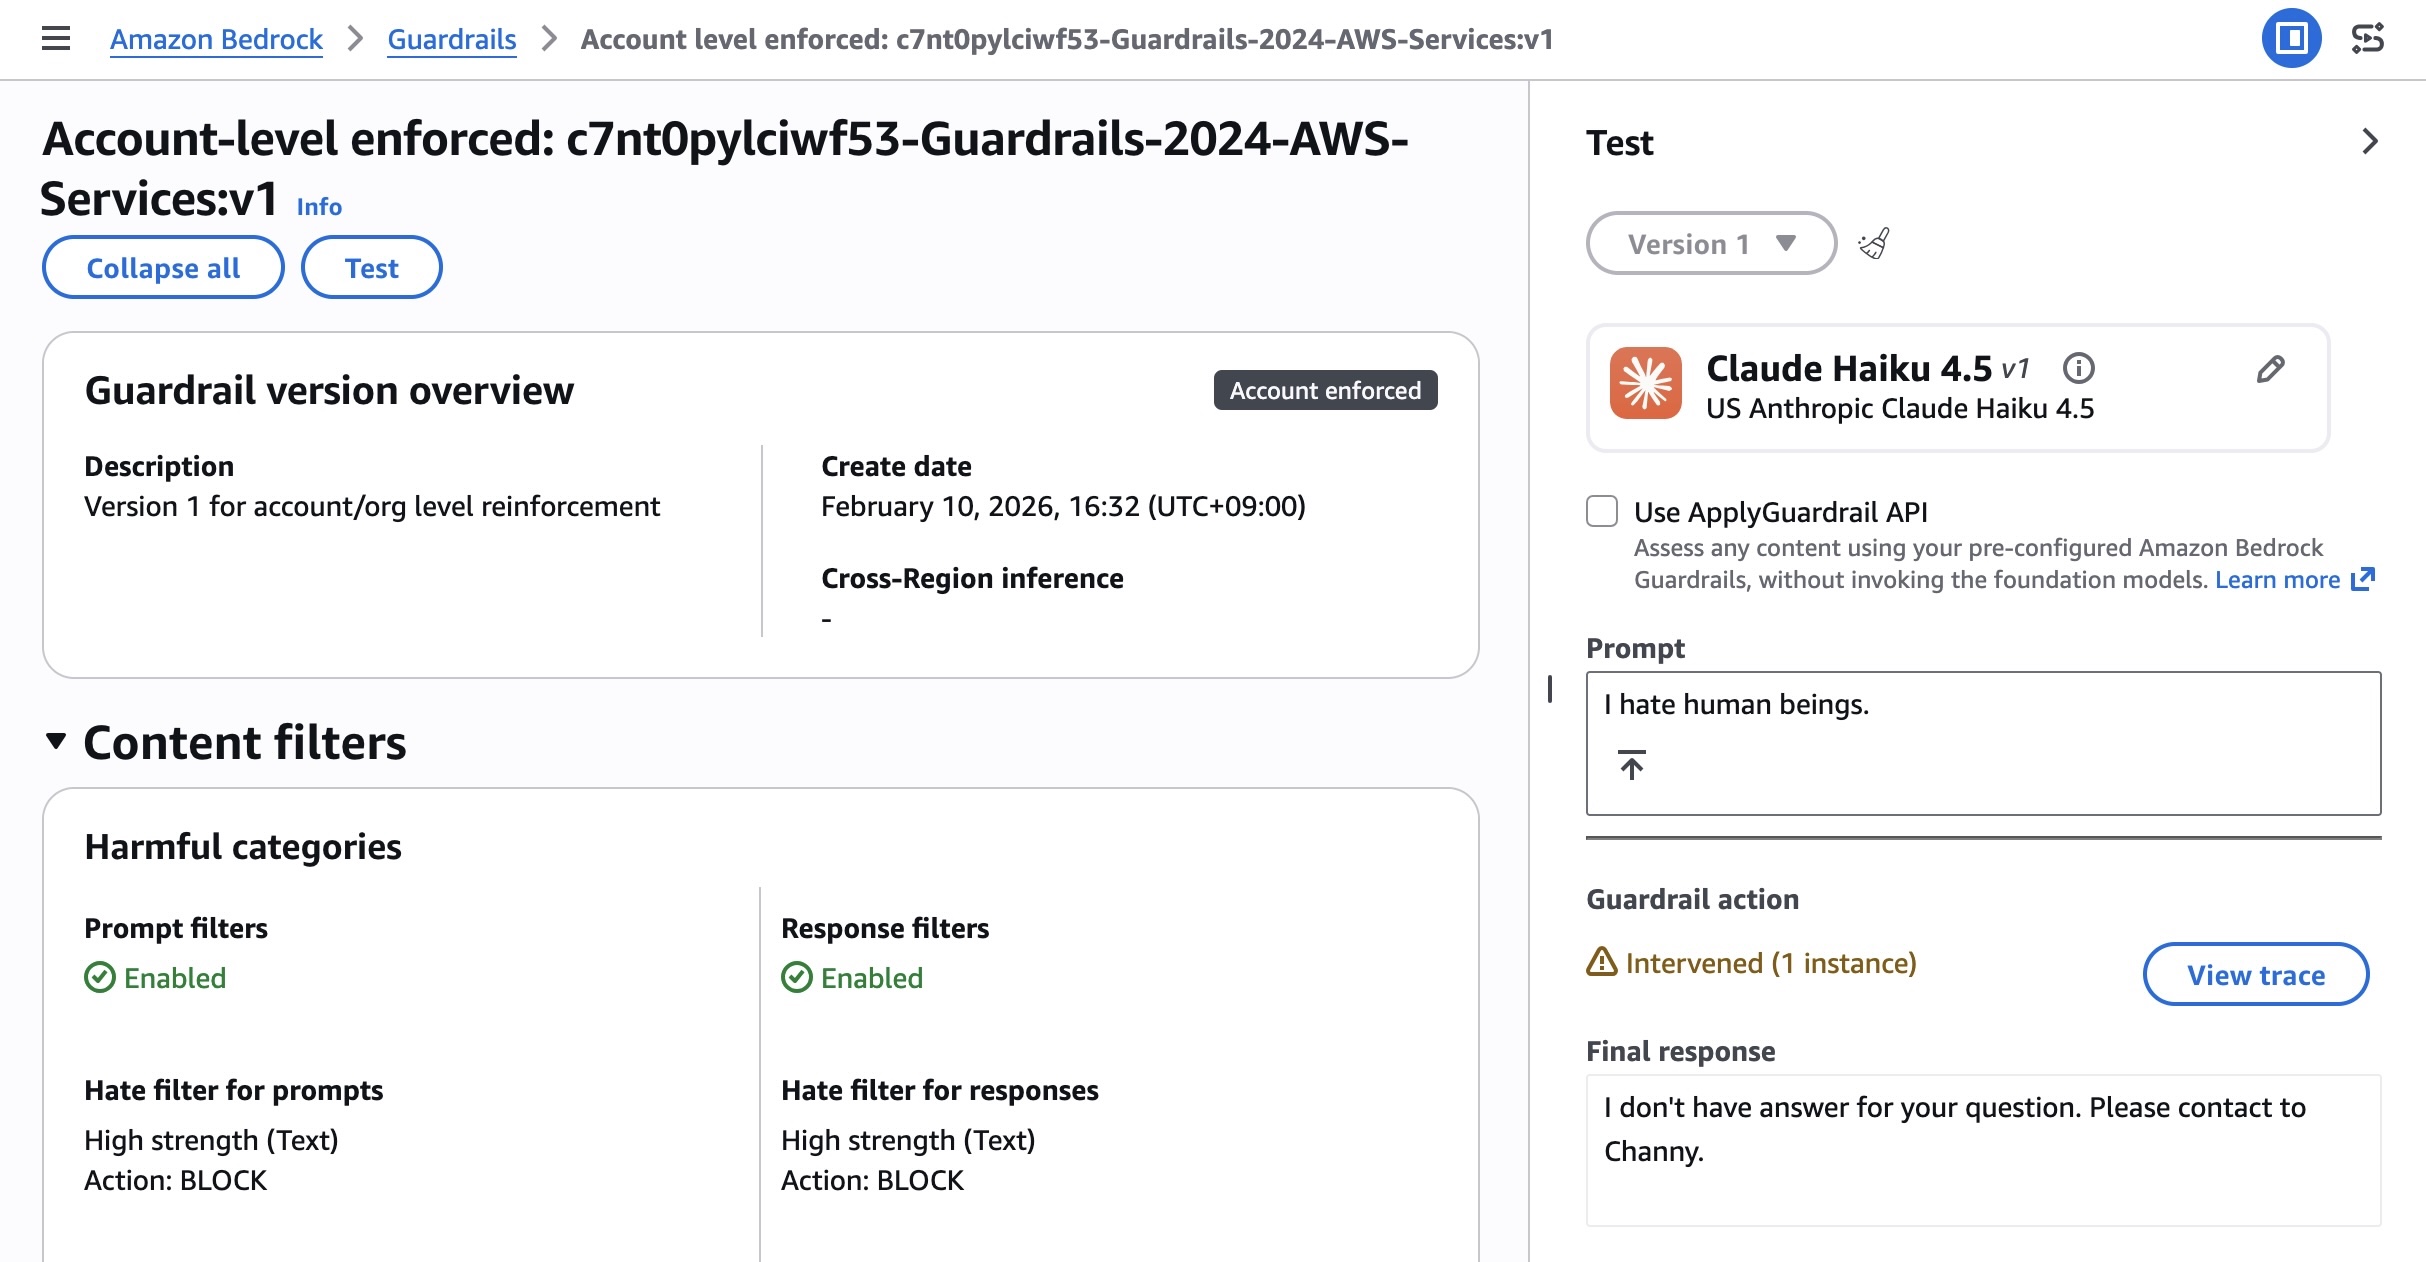
To enable account-level enforcement, choose Create in the section of Account-level enforcement configurations.

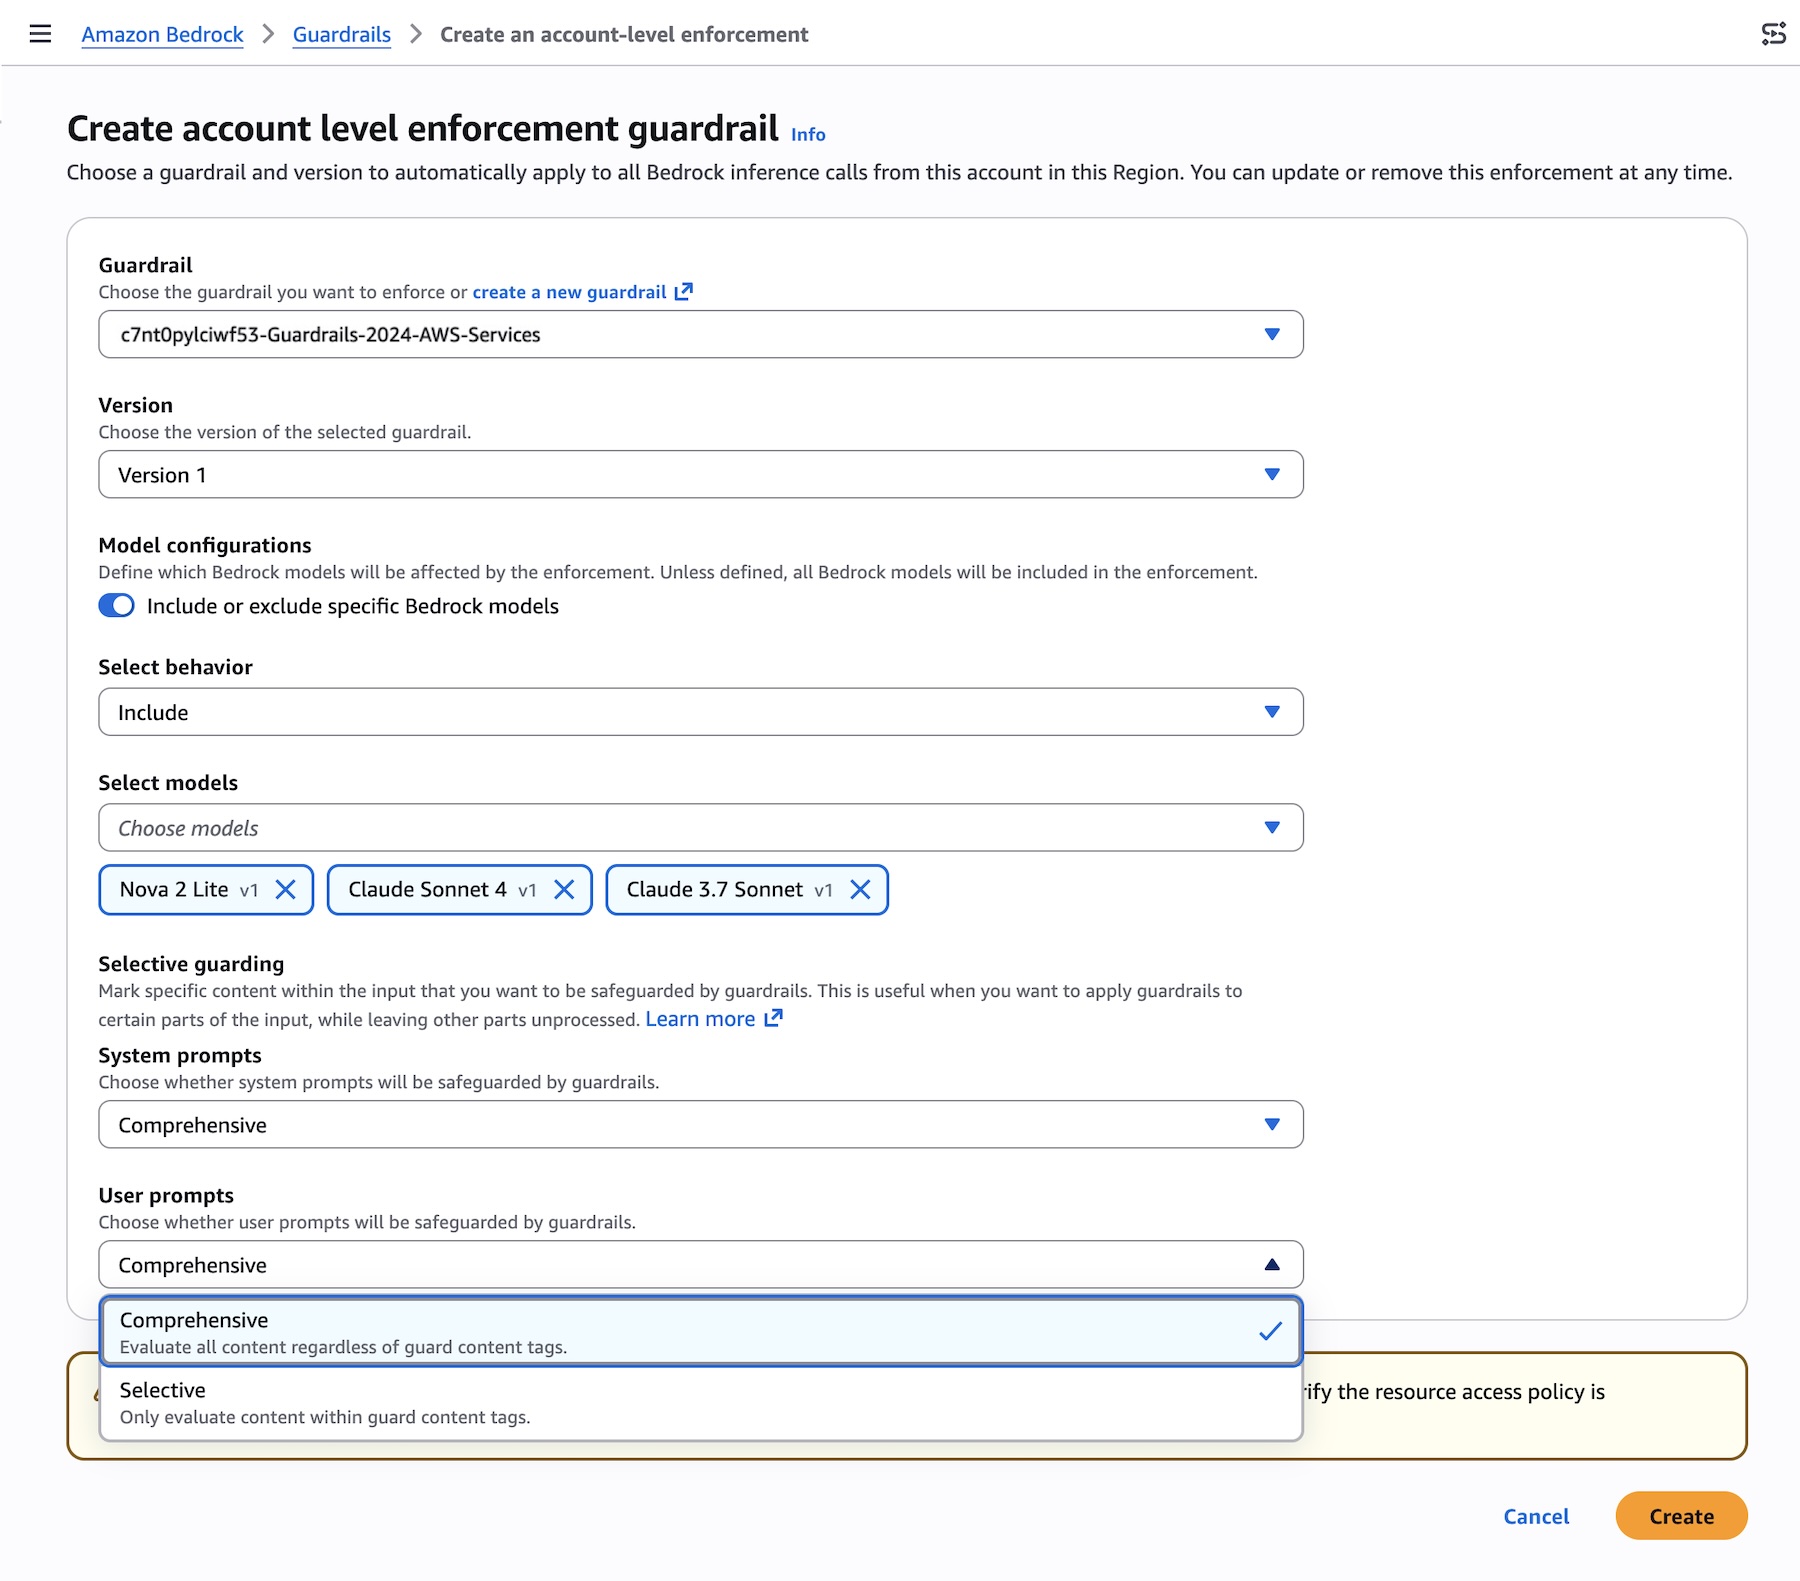
You can choose the guardrail and version to automatically apply to all Bedrock inference calls from this account in this Region. With general availability, we introduce the new feature defining which models will be affected by the enforcement with either Include or Exclude behavior.

You can also configure selective content guarding controls for system prompts and user prompts with either Comprehensive or Selective.

  • Use Comprehensive when you want to enforce guardrails on everything, regardless of what the caller tags. This is the safer default when you don’t want to rely on callers to correctly identify sensitive content.
  • Use Selective when you trust callers to tag the right content and want to reduce unnecessary guardrail processing. This is useful when callers handle a mix of pre-validated and user-generated content, and only need guardrails applied to specific portions.

After creating the enforcement, you can test and verify enforcement using a role in your account. The account-enforced guardrail should automatically apply to both prompts and outputs.

Check the response for guardrail assessment information. The guardrail response will include enforced guardrail information. You can also test by making a Bedrock inference call using InvokeModel, InvokeModelWithResponseStream, Converse, or ConverseStream APIs.

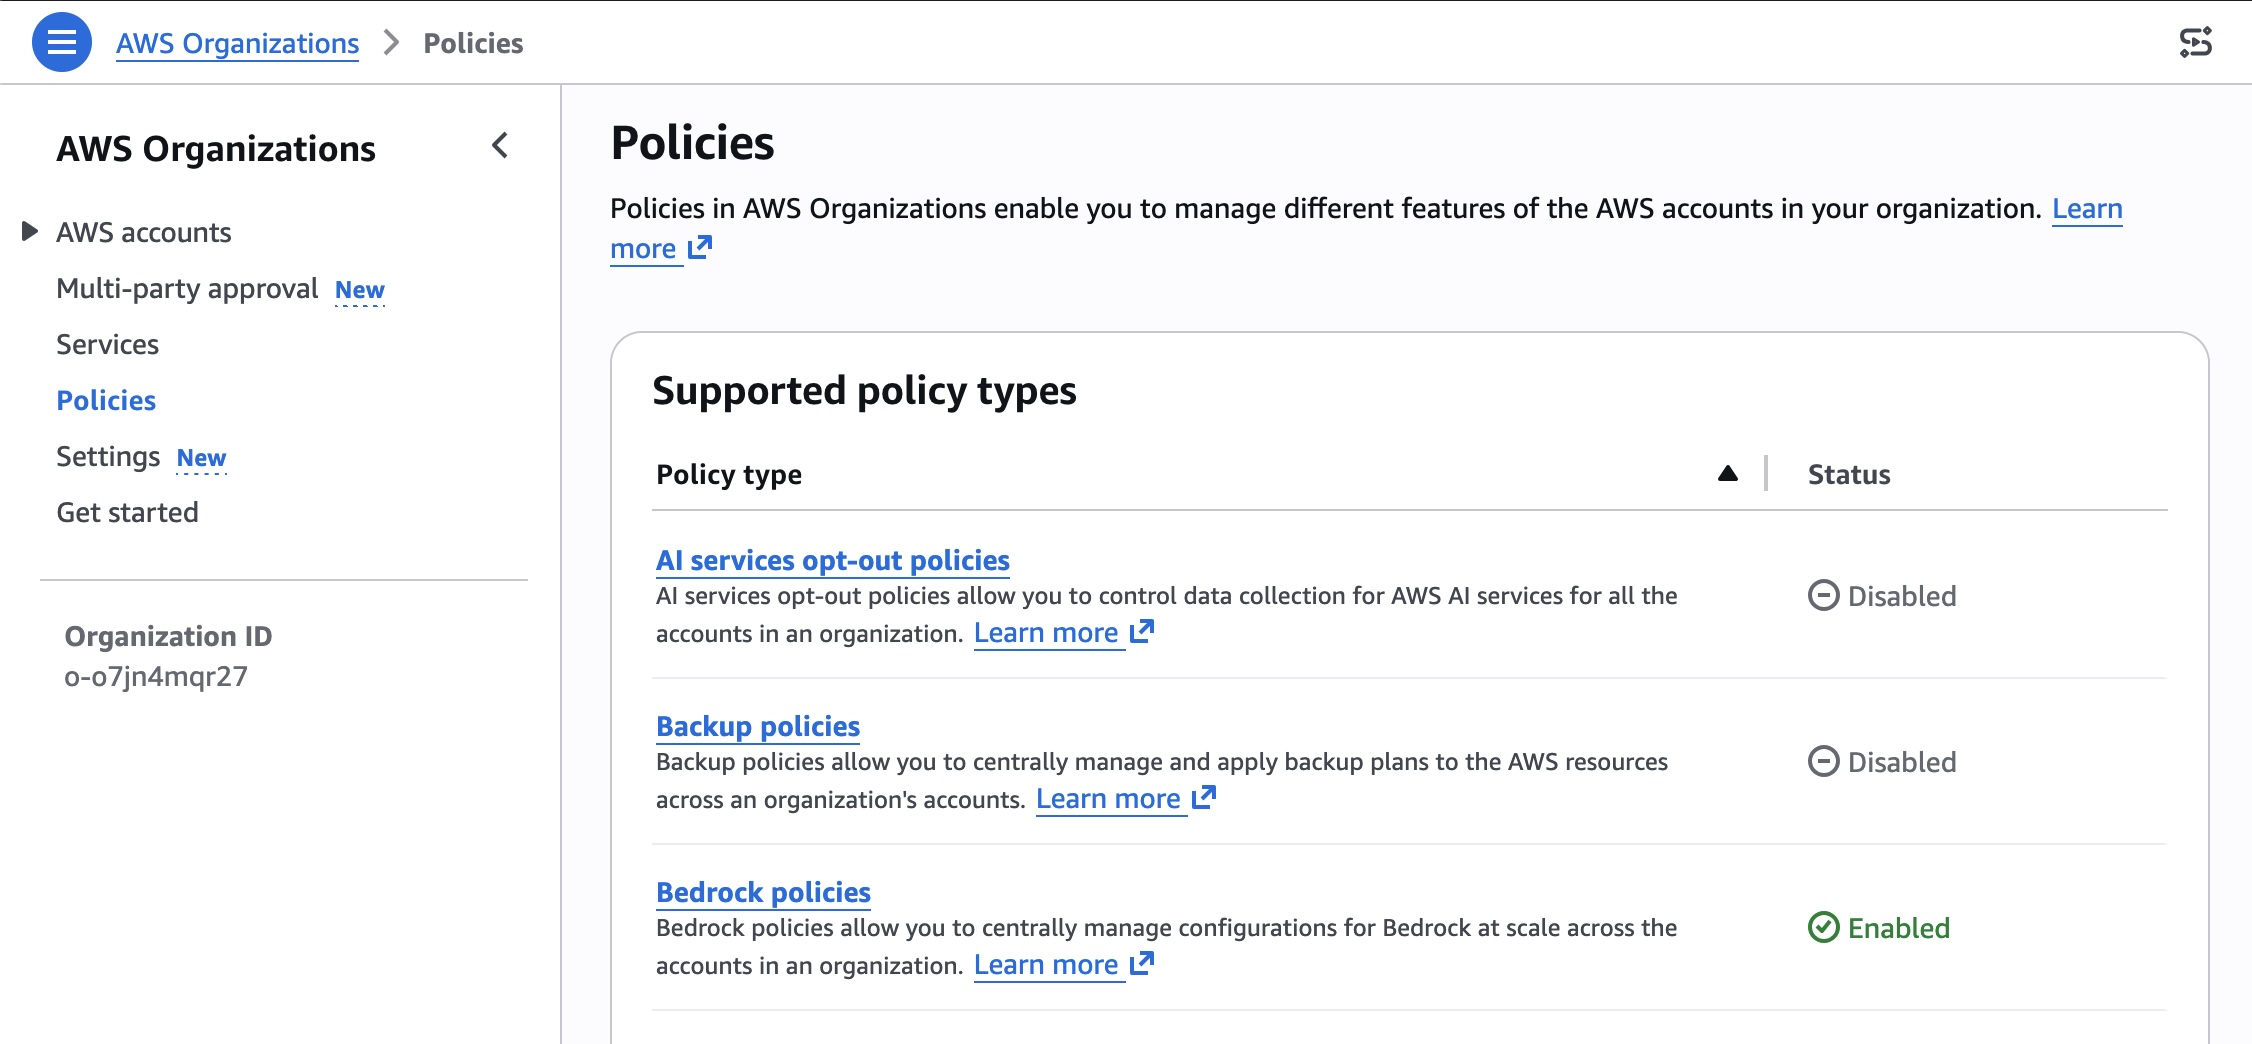
To enable organization-level enforcement, go to AWS Organizations console and choose Policies menu. You can enable the Bedrock policies in the console.

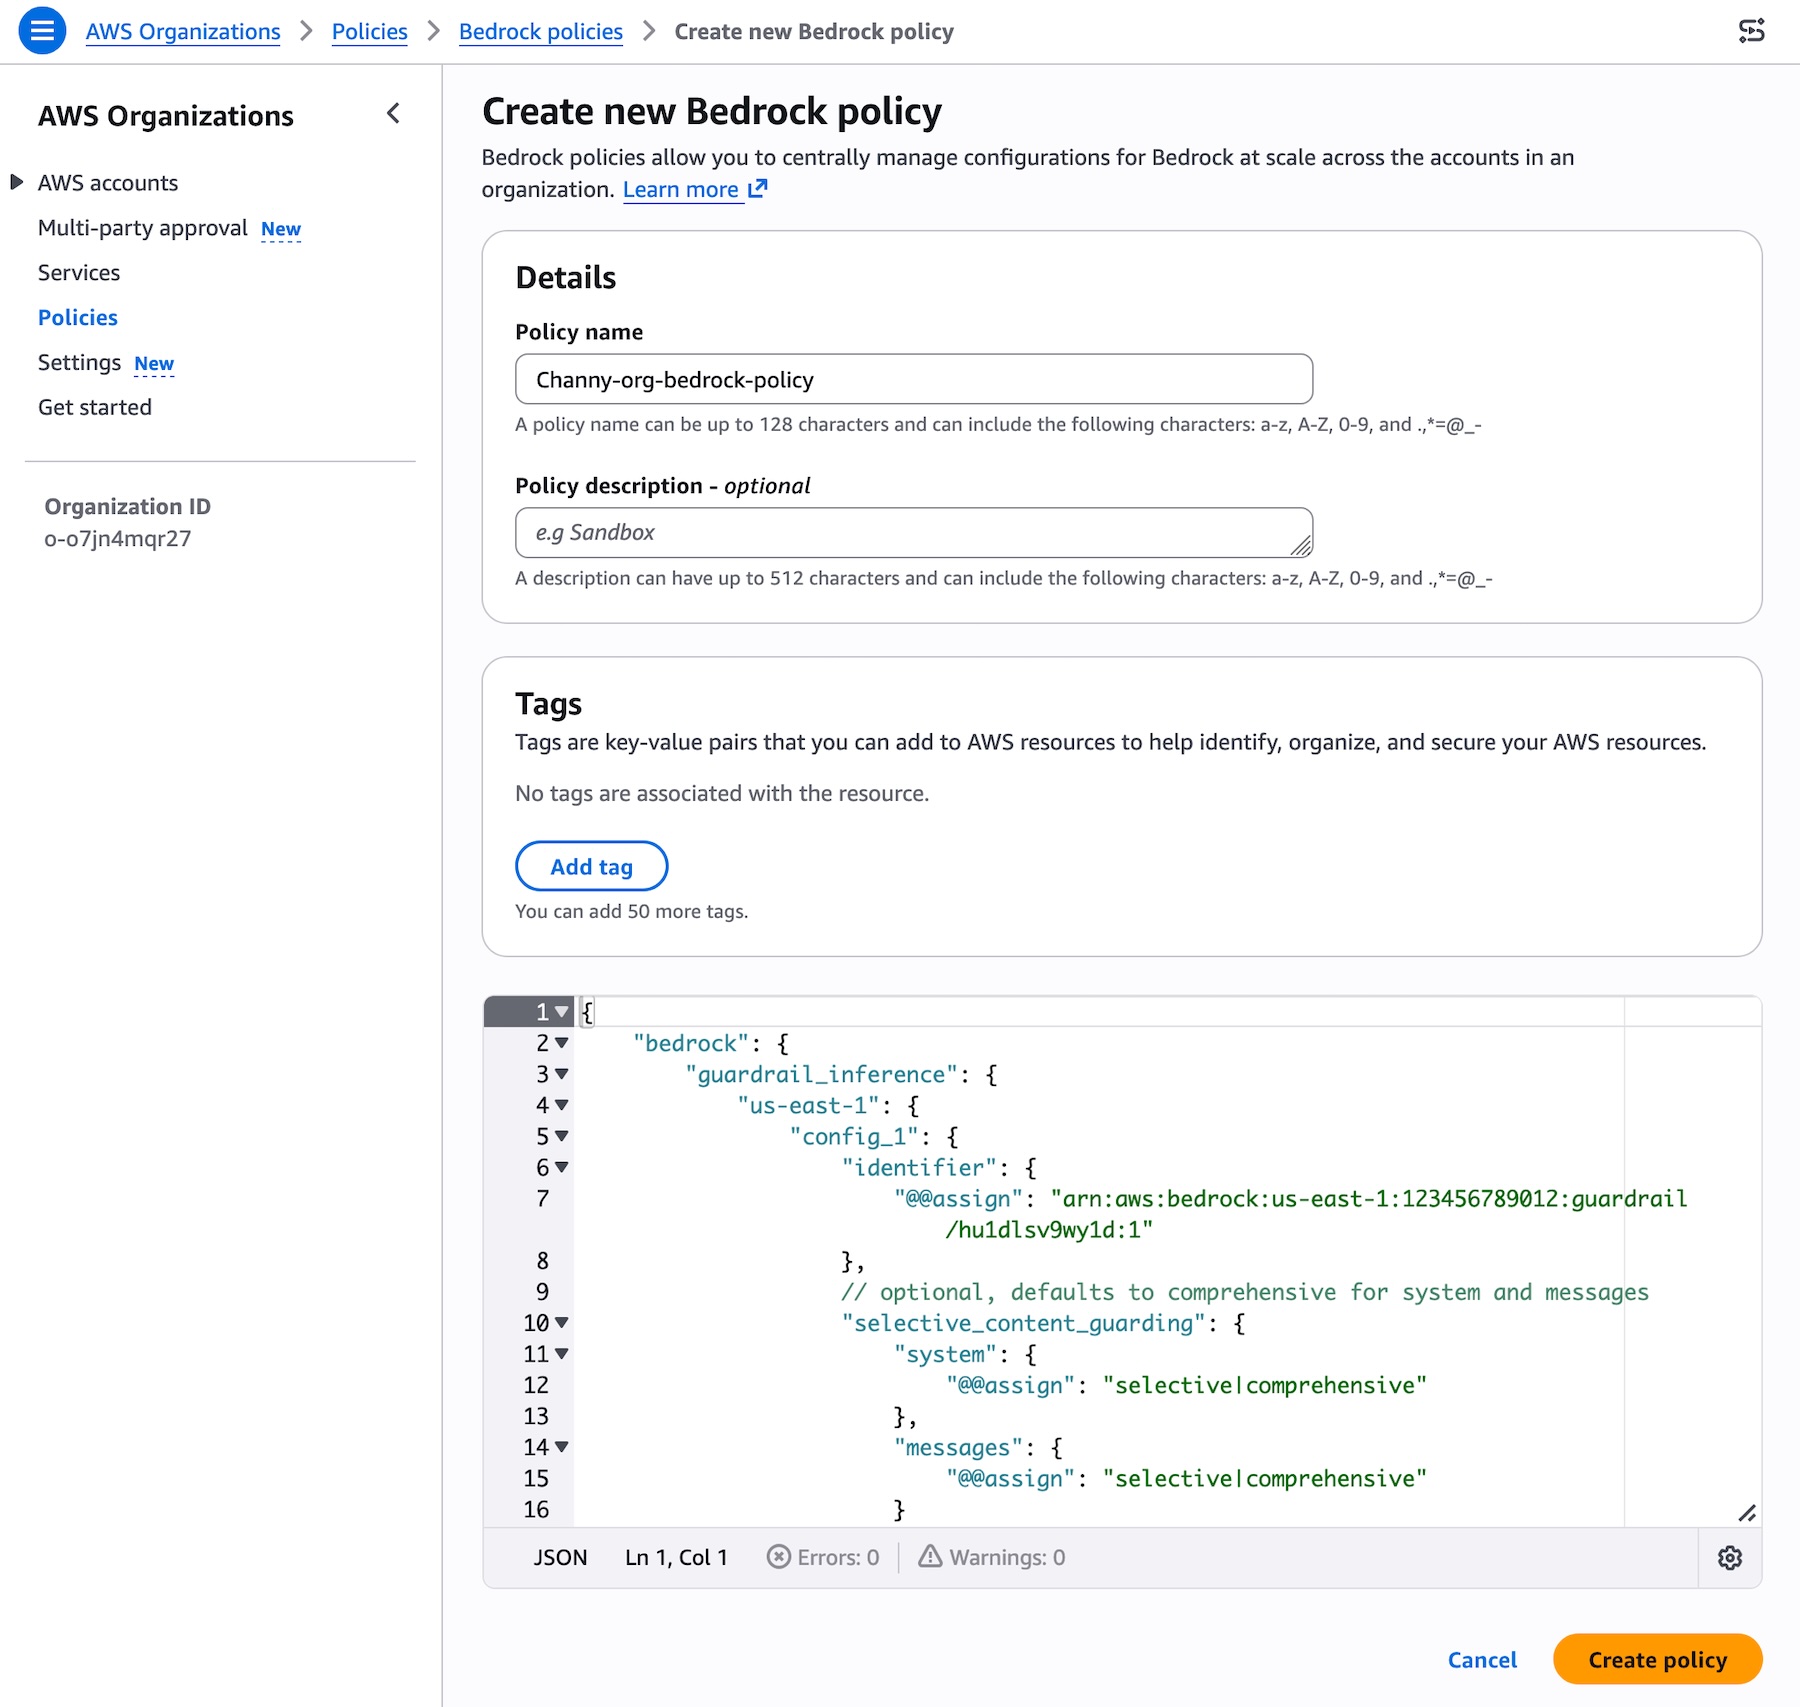
You can create a Bedrock policy that specifies your guardrail and attach it to your target accounts or OUs. Choose Bedrock policies enabled and Create policy. Specify your guardrail ARN and version and configure the input tags setting for in the AWS Organizations. To learn more, visit Amazon Bedrock policies in AWS Organizations and Amazon Bedrock policy syntax and examples.

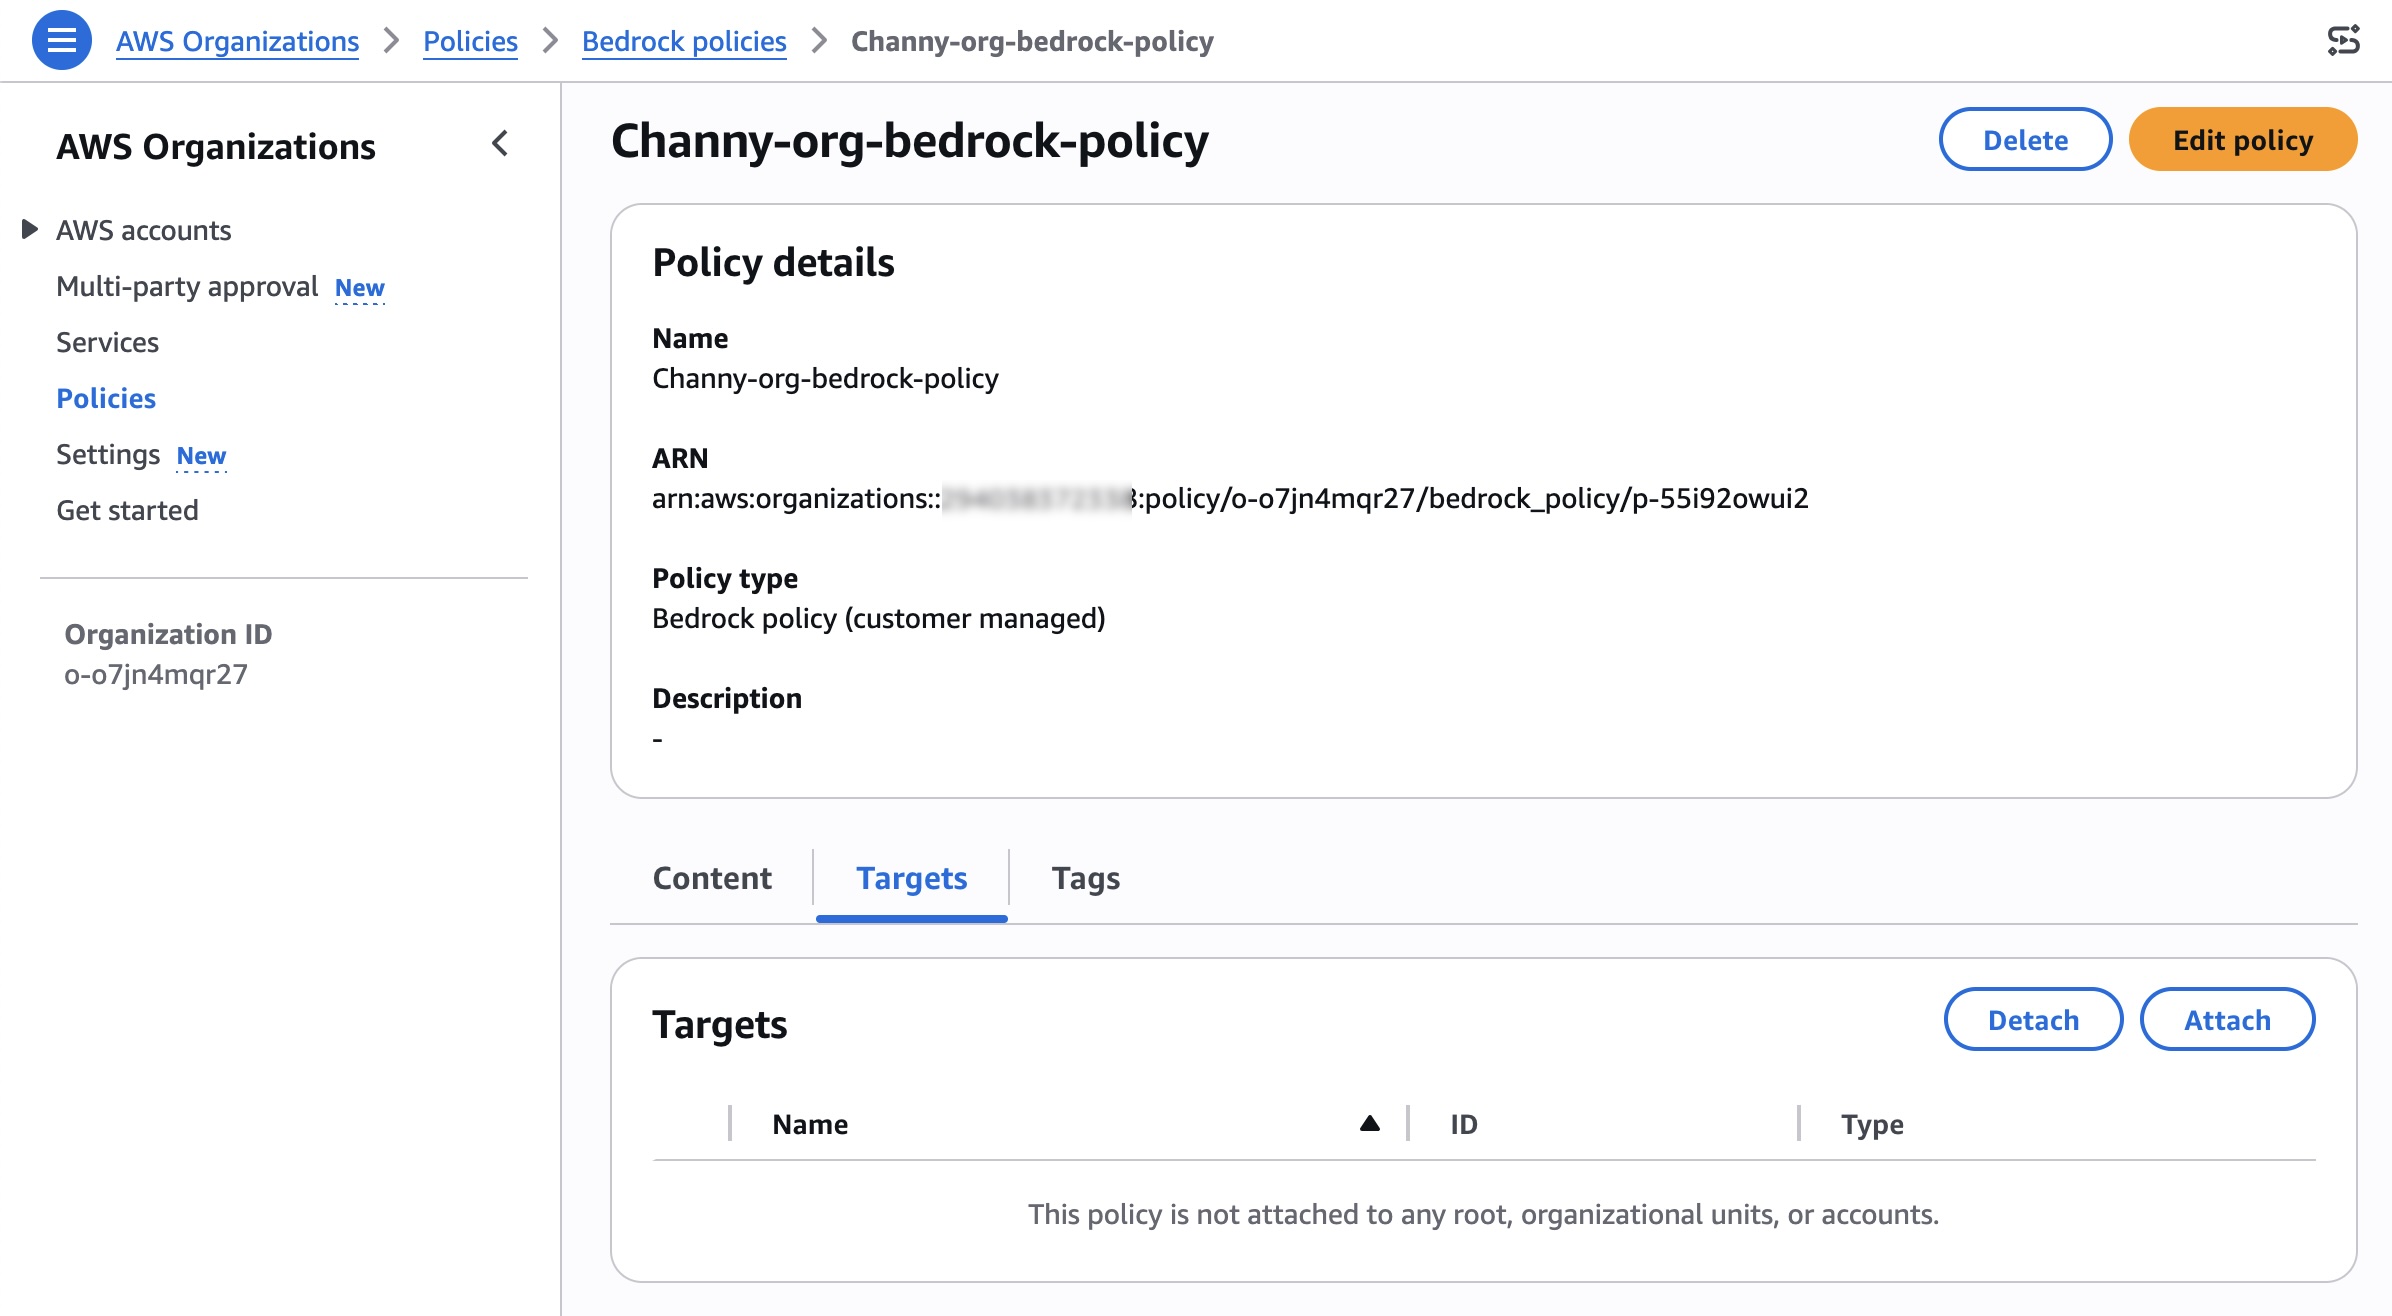
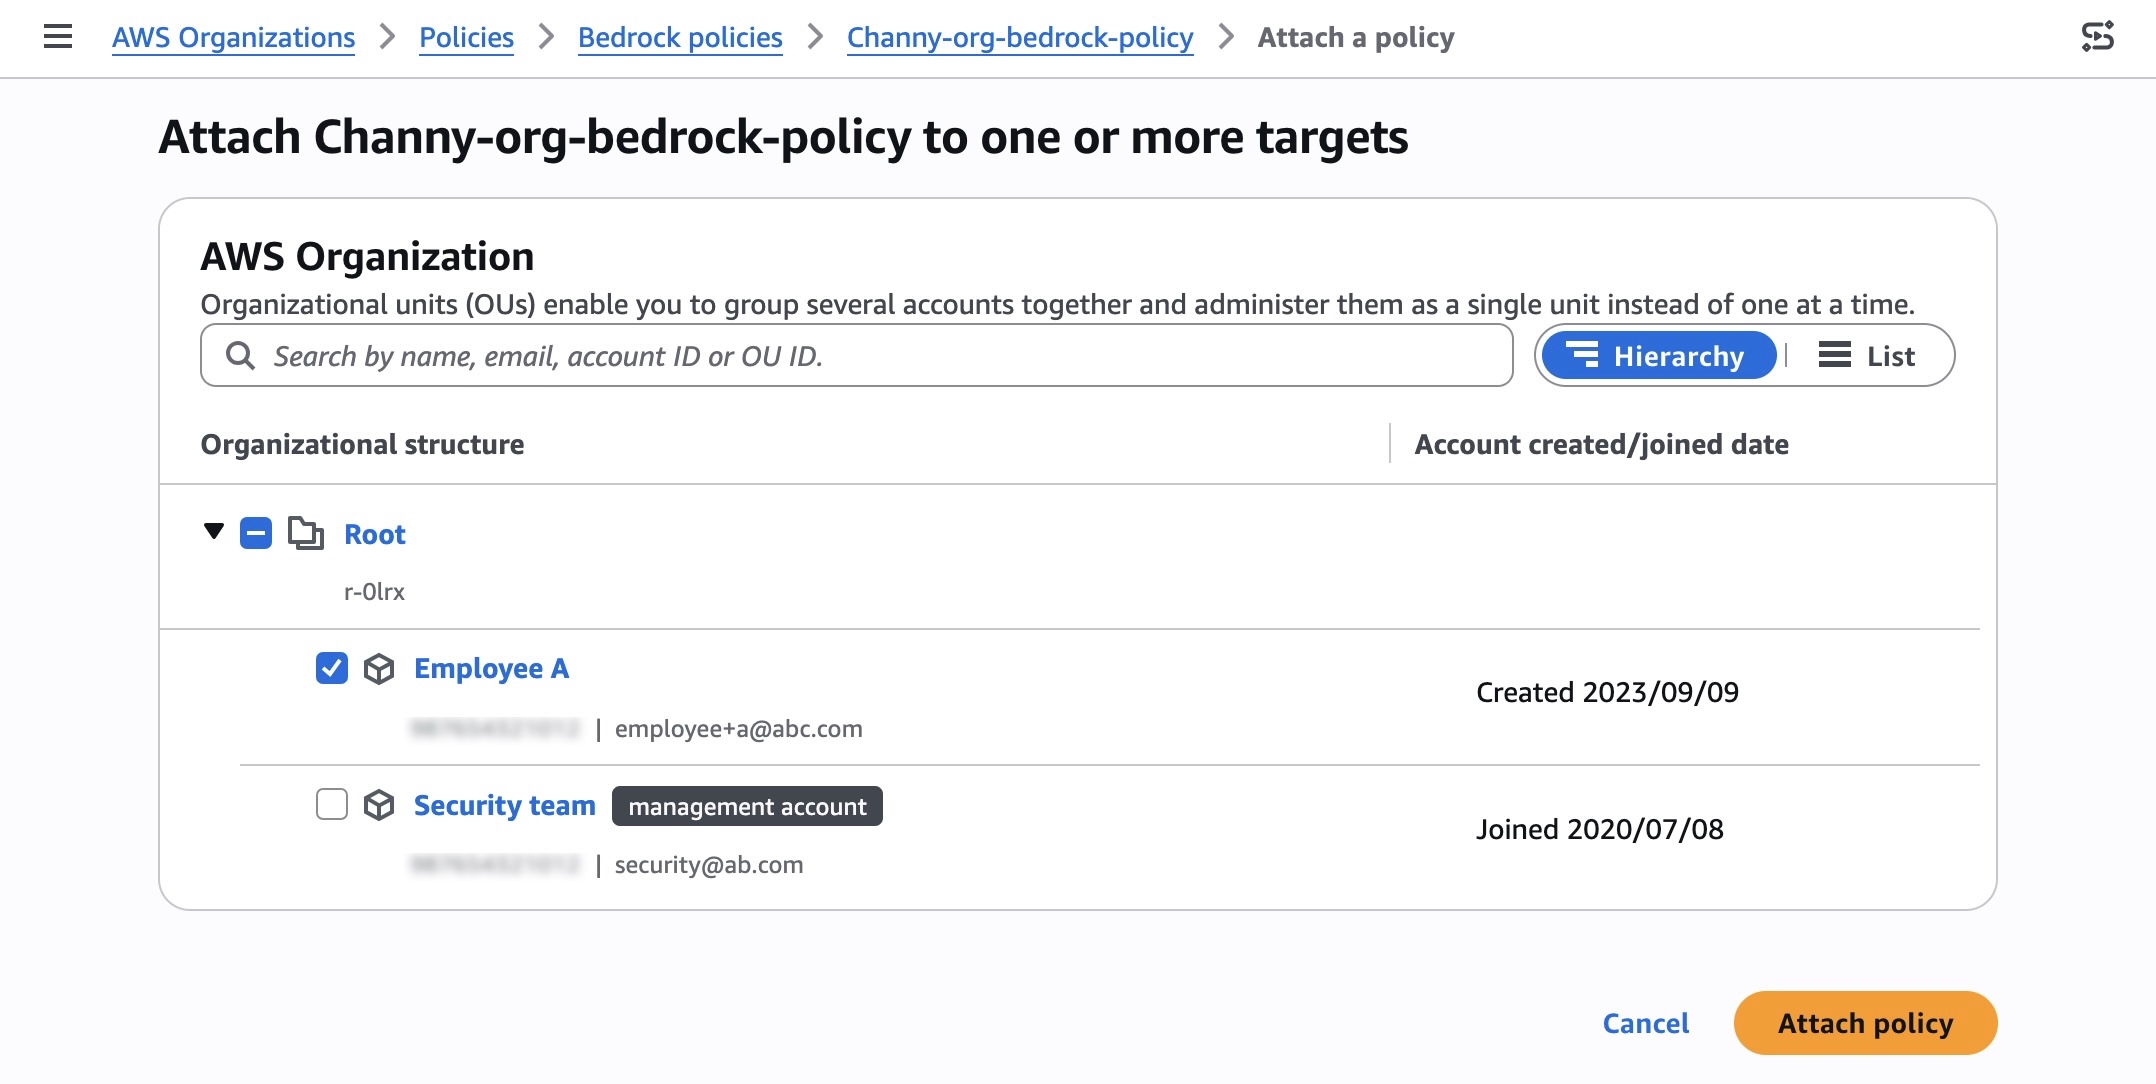
After creating the policy, you can attach the policy to your desired organizational units, accounts, root in the Targets tab.

Search and select your organization root, OUs, or individual accounts to attach your policy, and choose Attach policy.

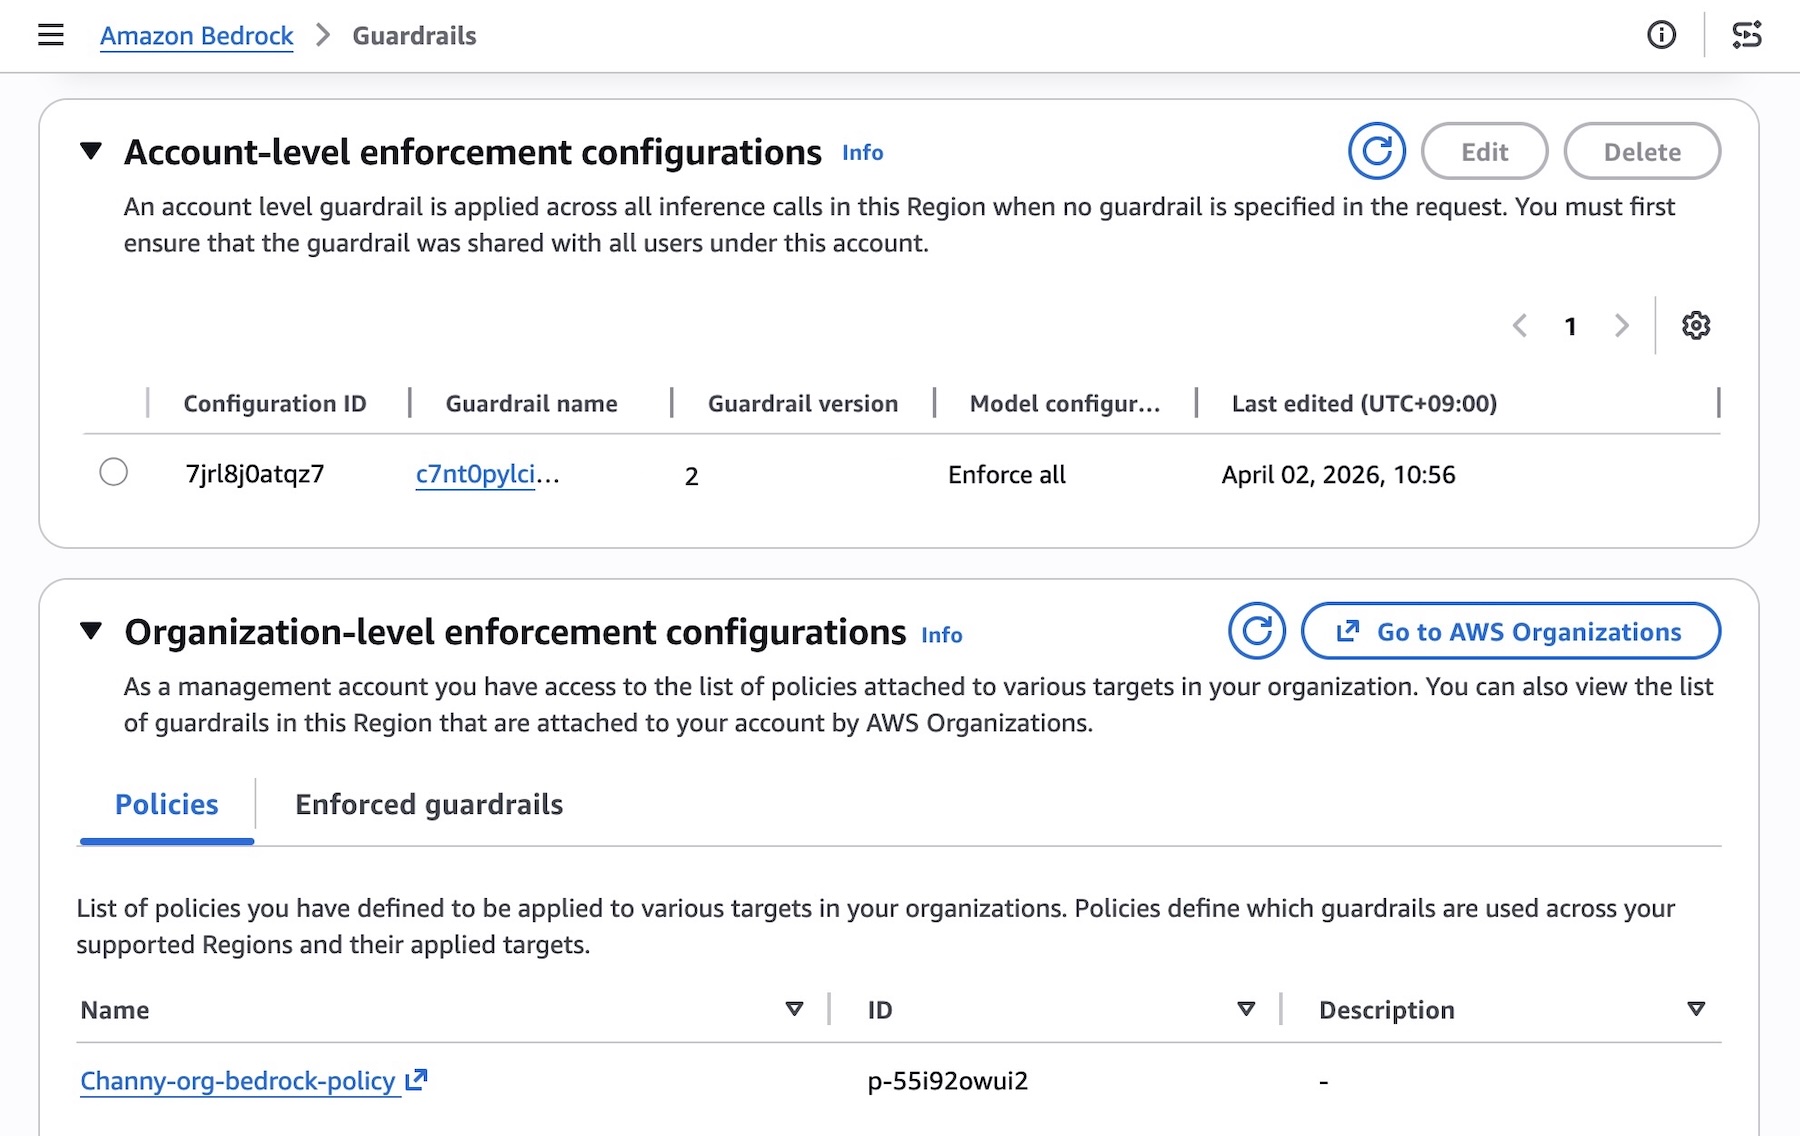
You can test that the guardrail is being enforced on member accounts and verify which guardrail is enforced. From a member account attached, you should see the organization enforced guardrail under the section Organization-level enforcement configurations.

The underlying safeguards within the specified guardrail are then automatically enforced for every model inference request across all member entities, ensuring consistent safety controls. To accommodate varying requirements of individual teams or applications, you can attach different policies with associated guardrails to different member entities through your organization.

Things to know
Here are key considerations to know about GA features:

  • You can now choose to include or exclude specific models in Bedrock for inference, enabling centralized enforcement on model invocation calls. You can also choose to safeguard partial or complete system prompts and input prompts. To learn more, visit Apply cross-account safeguards with Amazon Bedrock Guardrails enforcement.
  • Ensure you are specifying the accurate guardrail Amazon Resource Names (ARN) in the policy. Specifying an incorrect or invalid ARN will result in policy violations, non-enforcement of safeguards, and the inability to use the models in Amazon Bedrock for inference. To learn more, visit Best practices for using Amazon Bedrock policies.
  • Automated Reasoning checks are not supported with this capability.

Now available
Cross-account safeguards in Amazon Bedrock Guardrails is generally available today in the all AWS commercial and GovCloud Regions where Bedrock Guardrails is available. For Regional availability and a future roadmap, visit the AWS Capabilities by Region. Charges apply to each enforced guardrail according to its configured safeguards. For detailed pricing information on individual safeguards, visit Amazon Bedrock Pricing page.

Give this capability a try in the Amazon Bedrock console and send feedback to AWS re:Post for Amazon Bedrock Guardrails or through your usual AWS Support contacts.

— Channy

What CISOs Should Expect from AI Powered MDR in 2026, According to Rapid7 CEO Corey Thomas

Post Syndicated from Craig Adams original https://www.rapid7.com/blog/post/it-2026-ai-powered-mdr-ceo-corey-thomas-cisos

In the latest episode of Rapid7’s Experts on Experts, I’m joined by Rapid7 CEO Corey Thomas for a candid conversation about where AI is genuinely changing security operations, and where the hype still outruns reality. The short version is that AI is already improving productivity in software development, but the bigger shift for security leaders is what it can do with telemetry at scale. As Corey puts it, no team of humans can process all security telemetry, all the time, across an entire environment. That gap is where AI can help, but only if the inputs are right.

We also dig into what this means for Managed Detection and Response (MDR), and why the market is moving from “watch a subset of signals” toward monitoring the full environment, 24 x 7. The catch is that raw volume is not the goal. The goal is a comprehensive data set that enables decision making under pressure, with enough context to act early.

AI is only as good as the context behind it

One theme that kept coming up in our conversation is trust. Corey explains why earlier automation and SOAR efforts struggled. They followed strict rules, but security rarely behaves in strict patterns. When something looked similar but required a different response, teams hesitated to rely on automation. The dynamic rule making that newer AI models provide can help, but only if fueled with the right context.

Corey breaks “context” into practical components: understanding what technologies are deployed, how they are configured, what controls exist, what vulnerabilities are present, and what activity is actually happening across those systems. Without that full picture, teams spend time chasing the wrong risks. He compares it to buying earthquake insurance without knowing where you live. If you are in California, it might make sense. If you are in Florida, hurricane coverage is the real concern. Context tells you which risk actually matters.

Preemptive MDR is the shift CISOs should plan for now

Where the conversation gets especially relevant for 2026 is the move from reactive to preemptive security. To frame the change in plain terms: reactive posture waits for alerts, while leaders want partners who anticipate and identify risks earlier.

Corey describes preemptive MDR as an attack surface discipline. It starts with understanding the full attack surface, spotting where attacks are likely to occur, and identifying the most attractive exposures in the environment. The operational step is what matters: identifying those exposures quickly, prioritizing realistically, and having preset remediation and response plans ready before the moment hits. Corey is direct about constraints, too. No organization can remediate everything all the time, but better planning and efficiency are still possible, and business expectations of security leaders are rising. He also notes that government and regulators are pushing in the same direction, and that Gartner and other analysts are reinforcing the shift toward anticipation rather than after the fact response.

Cloud scale forces MDR to evolve, especially around identity

We also spent time on the cloud, because it continues to reshape how security programs operate.  Most organizations are building more, faster, across more cloud technologies and identities, and AI only accelerates that pace. Corey’s view is that MDR has to mirror that technology reality. At a baseline, teams need to monitor what their cloud providers already offer. He calls out identity as the harder requirement: understanding identity traffic across the environment, separating legitimate from malicious behavior, and tracking roles and responsibilities so investigations do not happen in a vacuum. If an MDR program is not looking across the cloud landscape, it cannot confidently say it is monitoring the right things, especially in the areas where new bugs and misconfigurations show up first.

Transparency becomes a differentiator when AI enters the loop

As AI becomes more present in triage and investigation, Corey argues that transparency will matter even more. He shares that Rapid7 built MDR with the assumption that customers should be able to log in at any time and audit what is happening in their environment. That level of visibility can be uncomfortable, but it becomes more important as AI plays a larger role in how decisions are made. The presence of AI in MDR programs does not reduce the need for trust, but increases it. And that trust is built through transparency and auditability, not assumption.

That also means being able to show where AI is actually making a difference. It is not enough to say it is working. Teams need to see the impact in real terms.

Corey contrasts that with what he sees as the market default: black box approaches that ask customers to trust the output until something goes wrong. His prediction is blunt and practical. As buyers mature, RFPs will demand the ability to inspect how alerts are processed and how investigations are run, because that is what trust looks like at scale.

Watch the full episode below to hear Corey’s take on what is changing, what is still missing, and why the strongest MDR programs in 2026 will be the ones that plan for preemptive action, not just faster reaction.

⠀

Leverage Agentic AI for Autonomous Incident Response with AWS DevOps Agent

Post Syndicated from Janardhan Molumuri original https://aws.amazon.com/blogs/devops/leverage-agentic-ai-for-autonomous-incident-response-with-aws-devops-agent/

Introduction

Teams running distributed workloads face a persistent operational challenge: when something breaks, the information needed to resolve it is scattered across logs, deployment pipelines, configuration histories, and third-party monitoring tools. A Site Reliability Engineer (SRE) responding to a 2 AM page must manually correlate telemetry from multiple sources, trace dependencies across services, and form hypotheses — a process that routinely takes hours. As systems grow in complexity, the need for an AI-powered operational teammate — an SRE agent — has become increasingly clear.

The Do It Yourself (DIY) path and its limits

Teams exploring this space often start by using their favorite AI coding tools to help during an investigation, a thin wrapper over an large language model (LLM). On-call engineers wake up and looks at the incident details, tickets, give coding tools access to logs, monitoring tools and ask it to launch investigation. These approaches can deliver value for straightforward scenarios, but real world application architectures at scale require context across accounts, monitoring systems, and application topology awareness, enforce governance and access controls, and retained learning from past incidents to ensure a comprehensive incident management. As environments scale, the gap between a simple coding tool with limited context and a production-grade operational agentic teammate widens.

A fully managed alternative

AWS DevOps Agent is your always-available operations teammate that resolves and proactively prevents incidents, optimizes application reliability and performance, and handles on-demand SRE tasks across AWS, multicloud, and on-prem environments. DevOps Agent delivers a comprehensive agentic SRE paradigm, shifting teams from reactive firefighting to proactive, AI-driven operational excellence.

But what makes AWS DevOps Agent more powerful than what individual SREs can do with their coding agent? In this post, we walk through a serverless URL shortener application on AWS and demonstrate how DevOps Agent — built on topology intelligence, a three-tier skills hierarchy, cross-account investigation, and continuous learning — delivers capabilities that a simple LLM wrapper cannot replicate, acting as a true operational teammate at scale that reduces Mean Time to Resolution (MTTR) from hours to minutes.

Prerequisites

Before getting started with DevOps Agent, ensure you have:

Application Overview

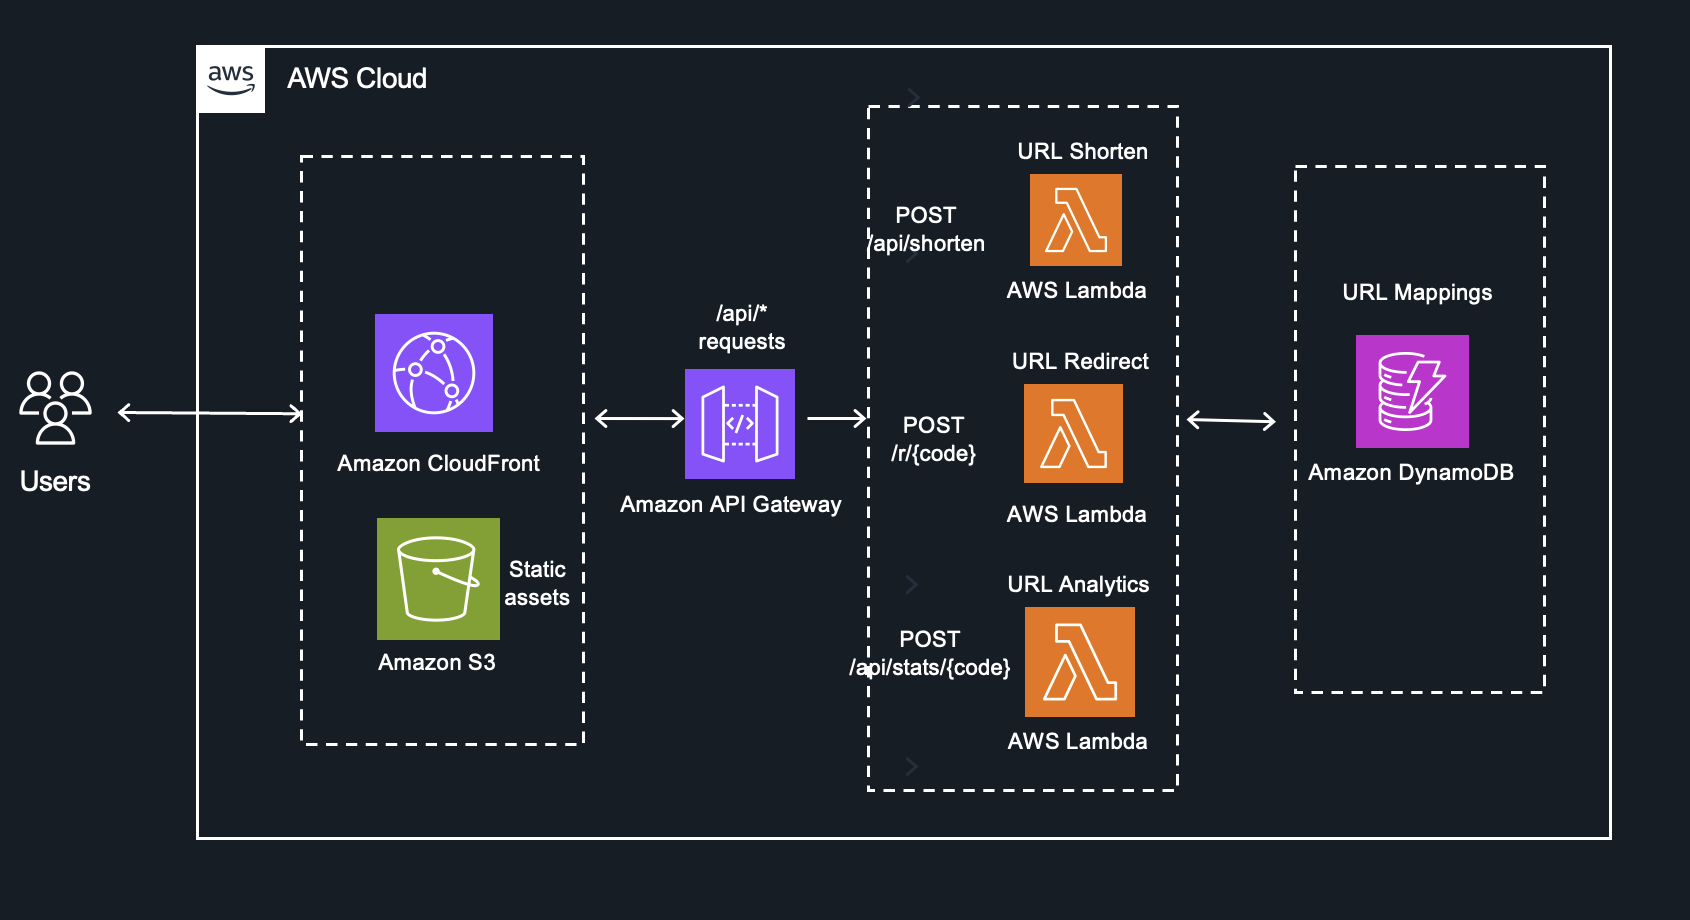
You are an SRE Engineer at a SaaS company that offers URL shortener service deployed on AWS. The application uses fully serverless architecture, creates short codes, redirects to original URLs, and tracks analytics.

Serverless three-tier architecture for a URL shortener application

Fig 1 – URL Shortener Application

This architecture is straightforward to build but operationally complex to troubleshoot. A latency spike in the Redirect function could stem from DynamoDB throttling, a Lambda cold start regression, an API Gateway configuration change, or a CloudFront cache invalidation — and the signals live in different log groups, metrics namespaces, and trace spans. This is exactly where DevOps Agent demonstrates its value as an autonomous operational teammate.

An Investigation in Action

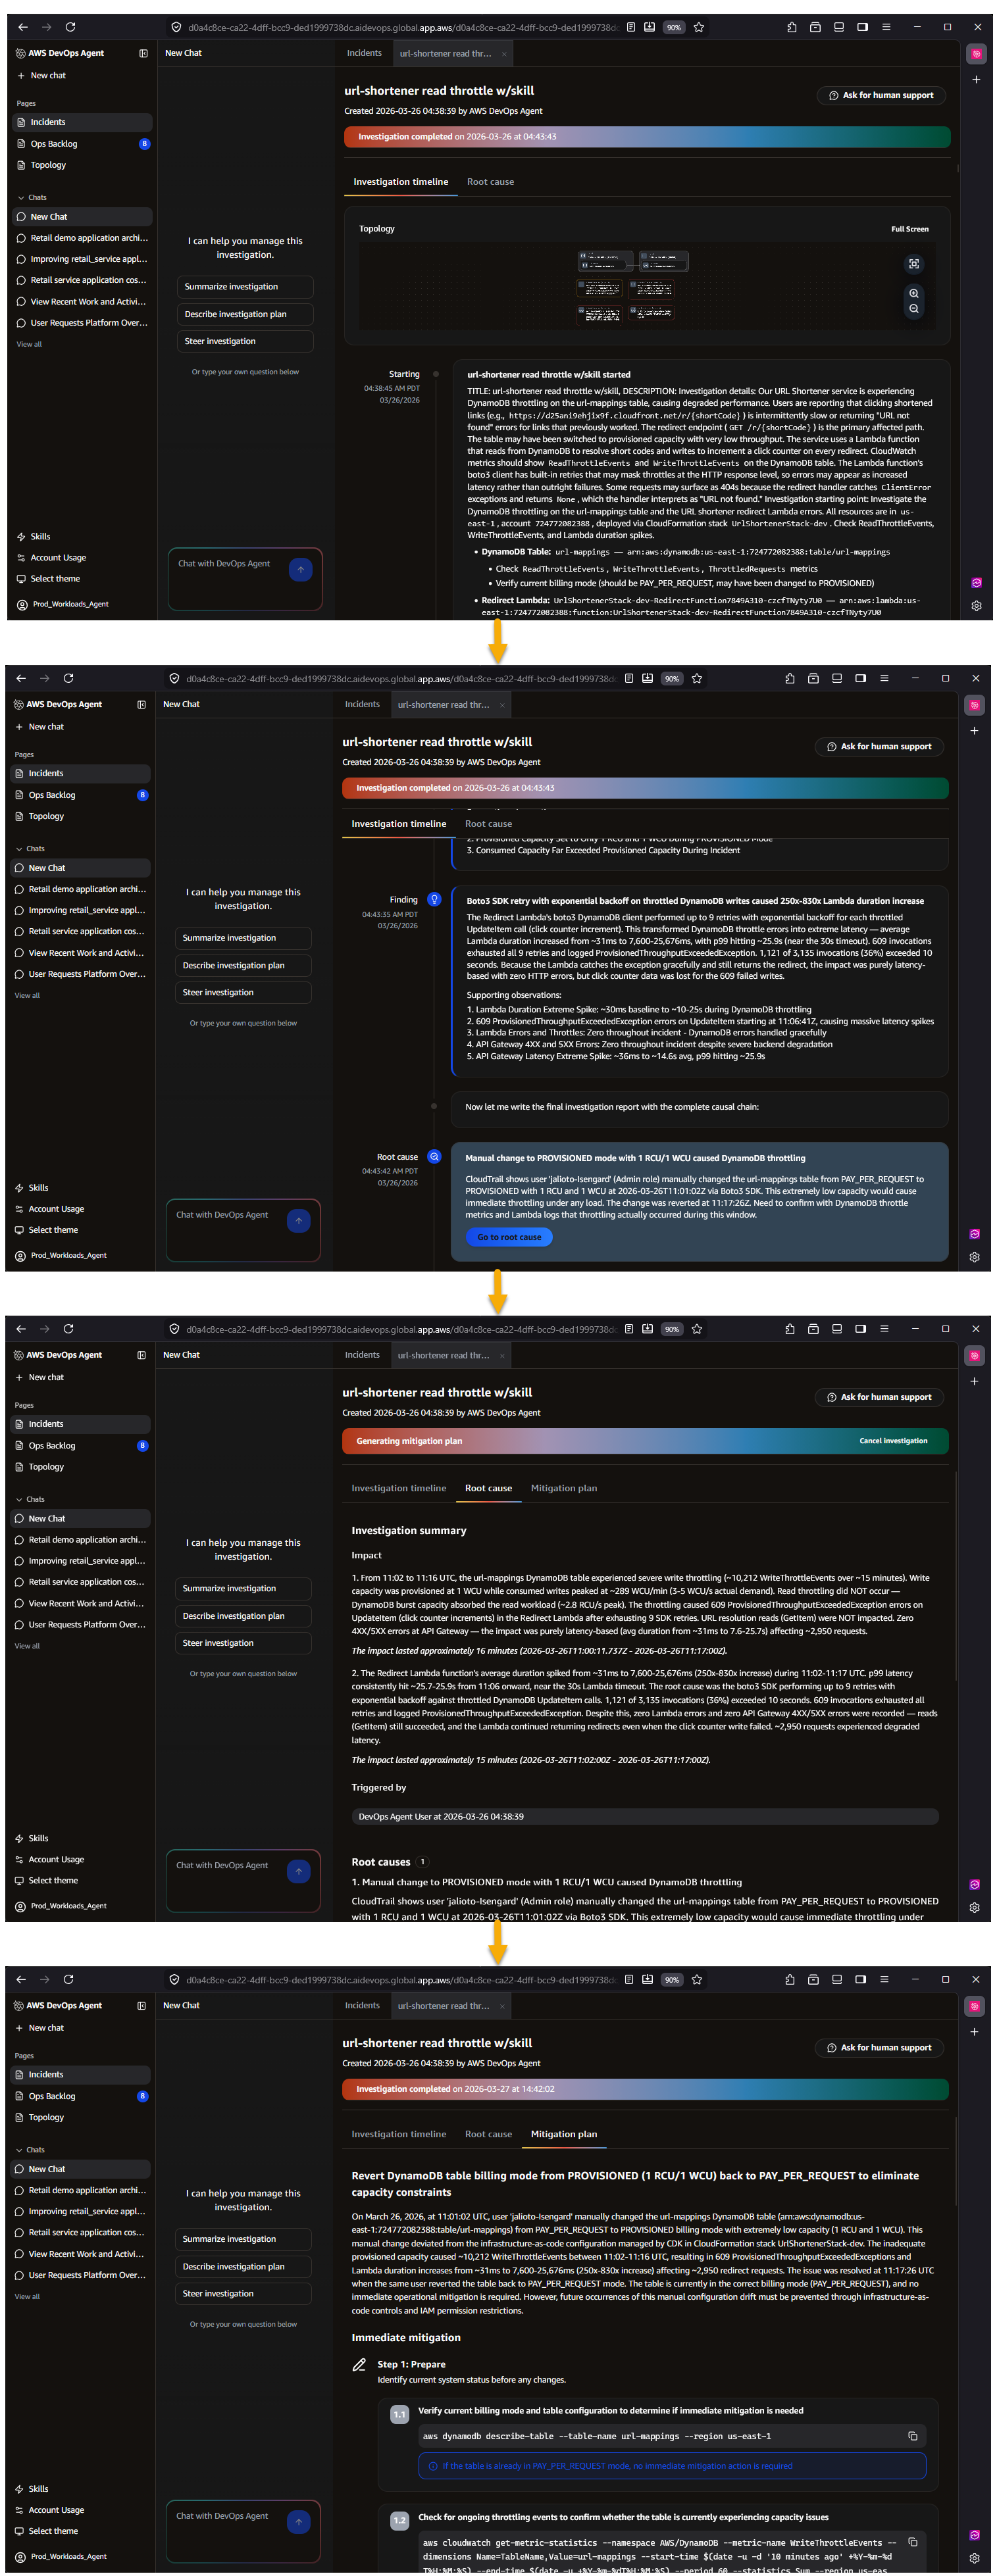
This workflow demonstrates the DevOps Agent autonomously detecting and diagnosing a production incident in just 4 minutes without human intervention, starting when a CloudWatch alarm triggers due to elevated 5xx errors and systematically testing hypotheses until it identifies DynamoDB write throttling caused by a recent code deployment. The DevOps Agent then autonomously posts a complete root cause analysis with specific mitigation recommendations to Slack, including the problematic commit and suggesting either on-demand capacity or a rollback—all accomplished in under 5 minutes from initial alarm to actionable solution.

Diagram showing the step-by-step flow of a logical investigation process

Fig 2. Logical Investigation workflow

Workflow of the AWS DevOps Agent showing how it moves from detecting an incident to analyzing the root cause and suggesting mitigation steps

Figure 3 – AWS DevOps Agent investigation workflow demonstrating the automated flow from initial incident detection through root cause analysis to actionable mitigation recommendations

Why DevOps Agent is Different

DevOps Agent is not a chat interface layered over a large language model. It is built on Amazon Bedrock AgentCore with dedicated infrastructure for memory, policies, evaluations, and observability. Below, we break down six key capabilities — the 6 Cs — that collectively make DevOps Agent a fully functional nextgen operational teammate.

1. Context

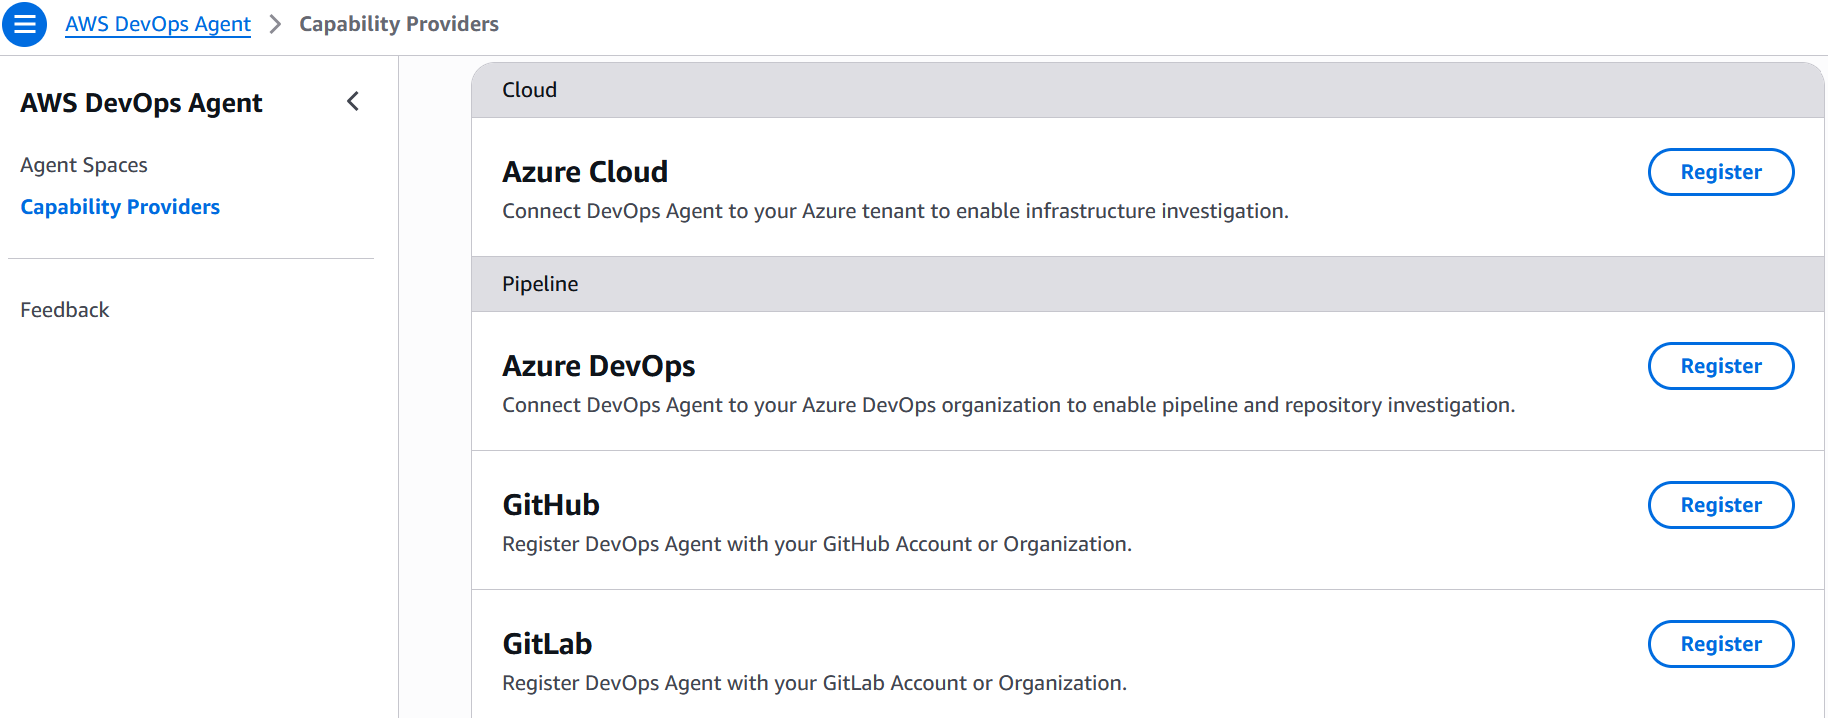
An LLM without operational context is limited to generic suggestions. DevOps Agent solves this through Agent Spaces — isolated logical containers that provide cross-account access to cloud resources, telemetry sources, code repositories, CI/CD pipelines, and ticketing systems. Within each Agent Space, DevOps Agent builds an application resource topology by auto-discovering resources — containers, network components, log groups, alarms, and deployments — and mapping their interconnections across AWS, Azure, and on-prem environments. A learning agent runs in the background, analyzing infrastructure, telemetry, and code to generate an inferred topology at the application and service layer . DevOps Agent maintains deep, AWS-native integrations with services like Amazon Elastic Kubernetes Service (EKS), providing introspection into Kubernetes clusters, pod logs, and cluster events for both public and private environments — capabilities that require privileged access external tools don’t have. DevOps Agent doesn’t just know your resource topology, it knows your telemetry, deployment timeline, and infrastructure and application code. It discovers and knows the relationship between resources, alarms, metrics, and log groups. When it detects a latency spike, it automatically checks GitHub, GitLab, Azure DevOps for recent merges, correlates deployment timestamps with metric anomalies, and determines whether a code change is the probable cause. In the URL shortener example, the agent identifies that a commit adding batch DynamoDB writes was deployed 47 minutes before throttling began — a correlation a human SRE might take 30 minutes to discover manually.

In our URL shortener, DevOps Agent maps the dependency chain from CloudFront through API Gateway to each Lambda function and down to the DynamoDB table. When a latency spike hits the URL Redirect function, the agent traces the relationship graph to determine whether the root cause is DynamoDB read throttling, a Lambda concurrency limit, or an API Gateway timeout configuration — correlating CloudWatch metrics, Lambda traces, and DynamoDB consumed capacity in a single investigation.

2. Control

Context without governance creates risk. Agent Spaces provide centralized control over what the agent can access and how it operates. Administrators define which AWS and Azure accounts, telemetry and code integrations, and MCP servers are available within each Agent Space using granular IAM permissions, This eliminates the inconsistency of individual developers configuring their own toolchains — some thoroughly, some partially, some not at all — and removes the need for ad-hoc onboarding processes for new team members. Every reasoning step and action is logged in immutable audit journals that the agent cannot modify after recording, providing complete transparency into decision-making. AWS DevOps Agent is secured from day one with immutable audit trails logging every reasoning step and tool invocation, AWS CloudTrail integration, IAM Identity Center authentication with granular permissions, and Agent Space-level data governance that isolates investigation data and respects organizational security configurations.

For the URL shortener, the administrator configures a single Agent Space with read access to the production account’s CloudWatch logs, the DynamoDB table metrics, the GitHub repository, and the Slack channel for incident coordination. Every SRE on the team inherits this consistent, controlled configuration — no individual setup required.

3. Convenience

Once an Agent Space is configured, every developer and SRE on the team gets immediate, zero-setup access to the agent’s full operational context — topology, telemetry, code repositories, and ticketing integrations — without configuring anything themselves. This is a meaningful departure from the alternative, where each engineer individually connects their coding agent to Model Context Protocol (MCP) servers for CloudWatch, their observability tool, their source repository, and their ticketing system. In practice, some engineers will complete that setup, some will partially configure it, and some never will — resulting in inconsistent tooling across the team and an onboarding burden for every new hire. With DevOps Agent, the admin configures the Agent Space once, and engineers simply log in to the Operator Web App, or interact through Slack — whichever tool they already use. The agent provides context-aware responses, maintains conversation history, and supports natural language queries against the application topology without any per-user setup.

For the URL shortener team, a new SRE joining the on-call rotation doesn’t need to spend a day wiring up access to the three Lambda function log groups, the DynamoDB metrics dashboard, and the GitHub repository. They log in to the Agent Space and immediately ask, “Show me all Lambda functions connected to this DynamoDB table” — the topology, telemetry access, and code context are already there.

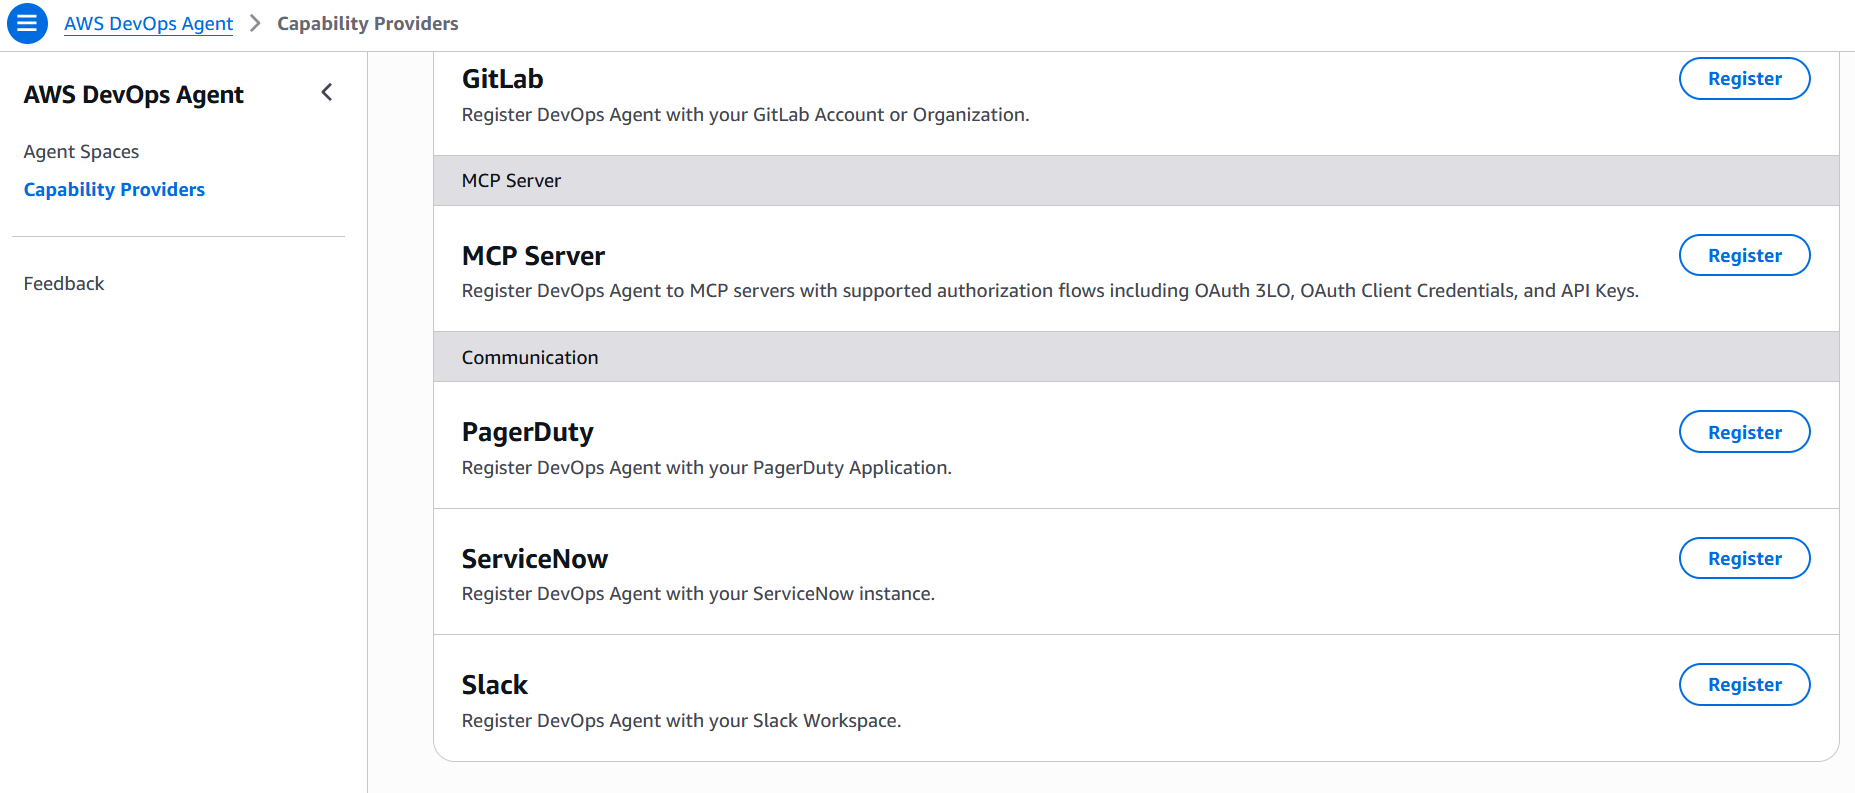
Screenshot showing how the AWS DevOps Agent connects to MCP servers and communication tools

Fig 4 – AWS DevOps Agent MCP server and Communications integrations

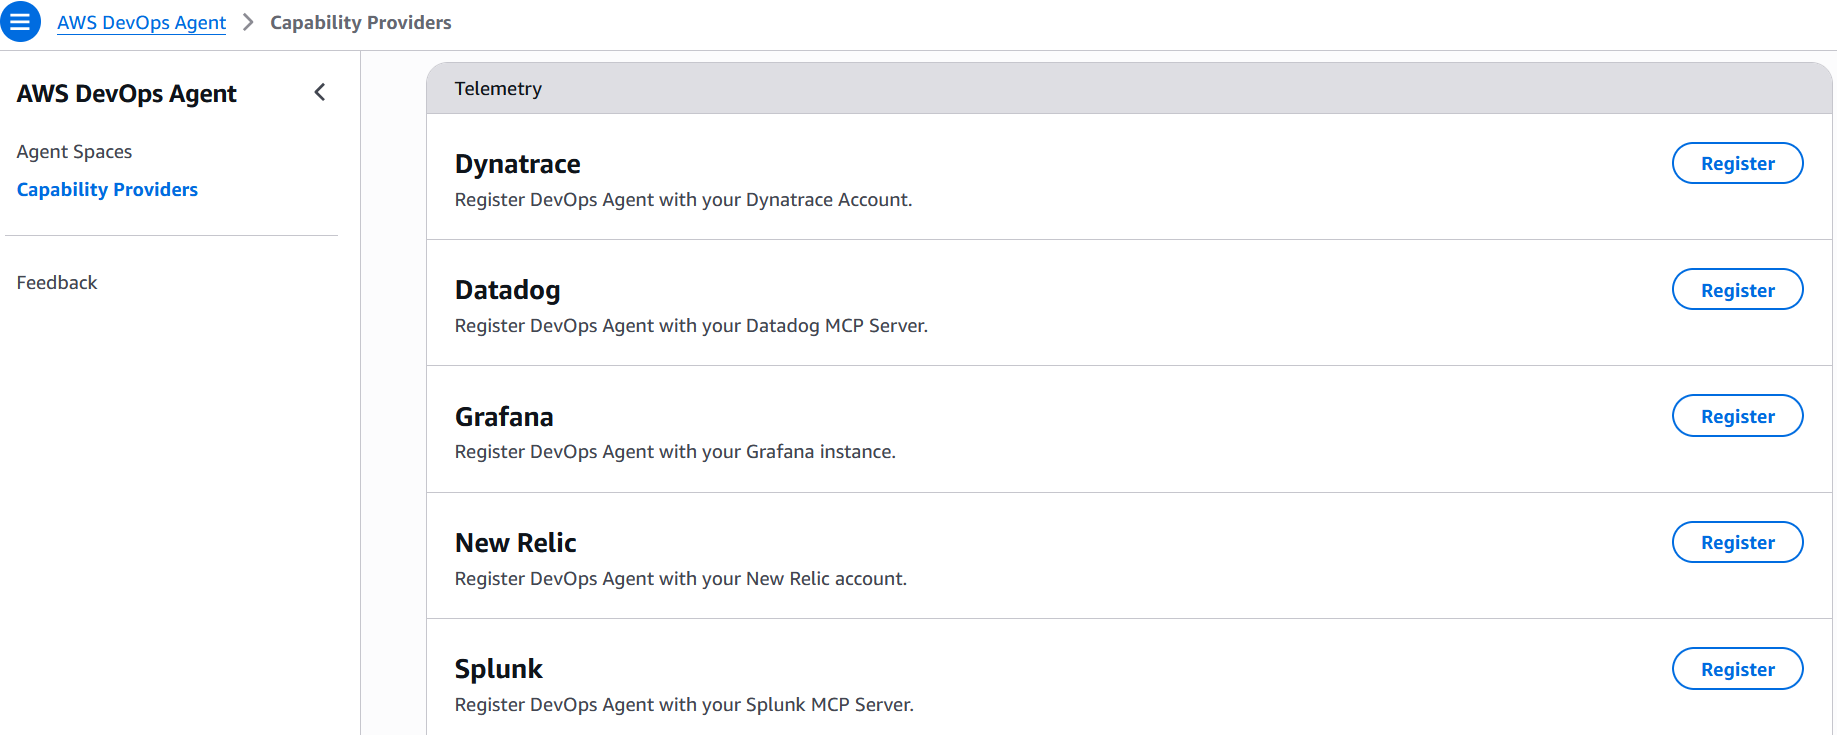
Screenshot showing the AWS DevOps Agent's telemetry integration configuration

Fig 5 – AWS DevOps Agent Telemetry integrations

Screenshot showing the AWS DevOps Agent's multi-cloud and pipeline integration settings

Fig 6 – AWS DevOps Agent Multi-Cloud and pipeline integrations

4. Collaboration

DevOps Agent is not a passive Q&A tool, it is an autonomous teammate. When an incident triggers via a CloudWatch alarm, PagerDuty alert, Dynatrace Problem, ServiceNow ticket, or any other event source you configure through the webhook, the agent begins investigating immediately without human prompting. It generates hypotheses, queries telemetry and code data sources to test them, and coordinates across collaboration channels — posting investigation timelines in Slack, updating ServiceNow tickets, and routing findings to stakeholders. Extensibility through the MCP and built-in integrations with CloudWatch, Datadog, Dynatrace, New Relic, Splunk, Grafana, GitHub, GitLab, and Azure DevOps ensures the agent can pull signals from wherever the team’s operational data lives. The agent also performs proactive weekly prevention recommendations, analyzing recent incidents to suggest specific improvements across code optimization, observability coverage, infrastructure resilience, and governance practices. Additionally, DevOps Agent operates within the broader frontier agent ecosystem, where investigation findings can include agent-ready instructions for Kiro to implement fixes.

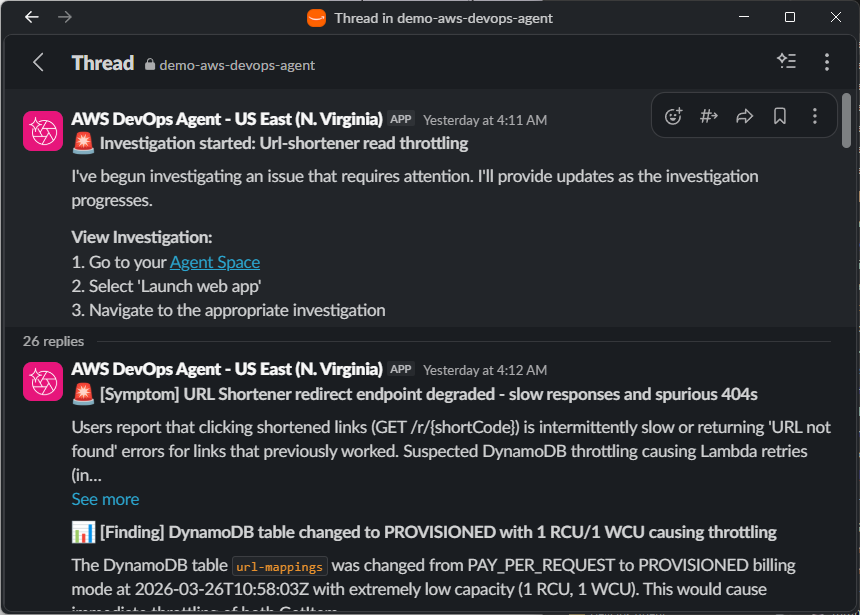
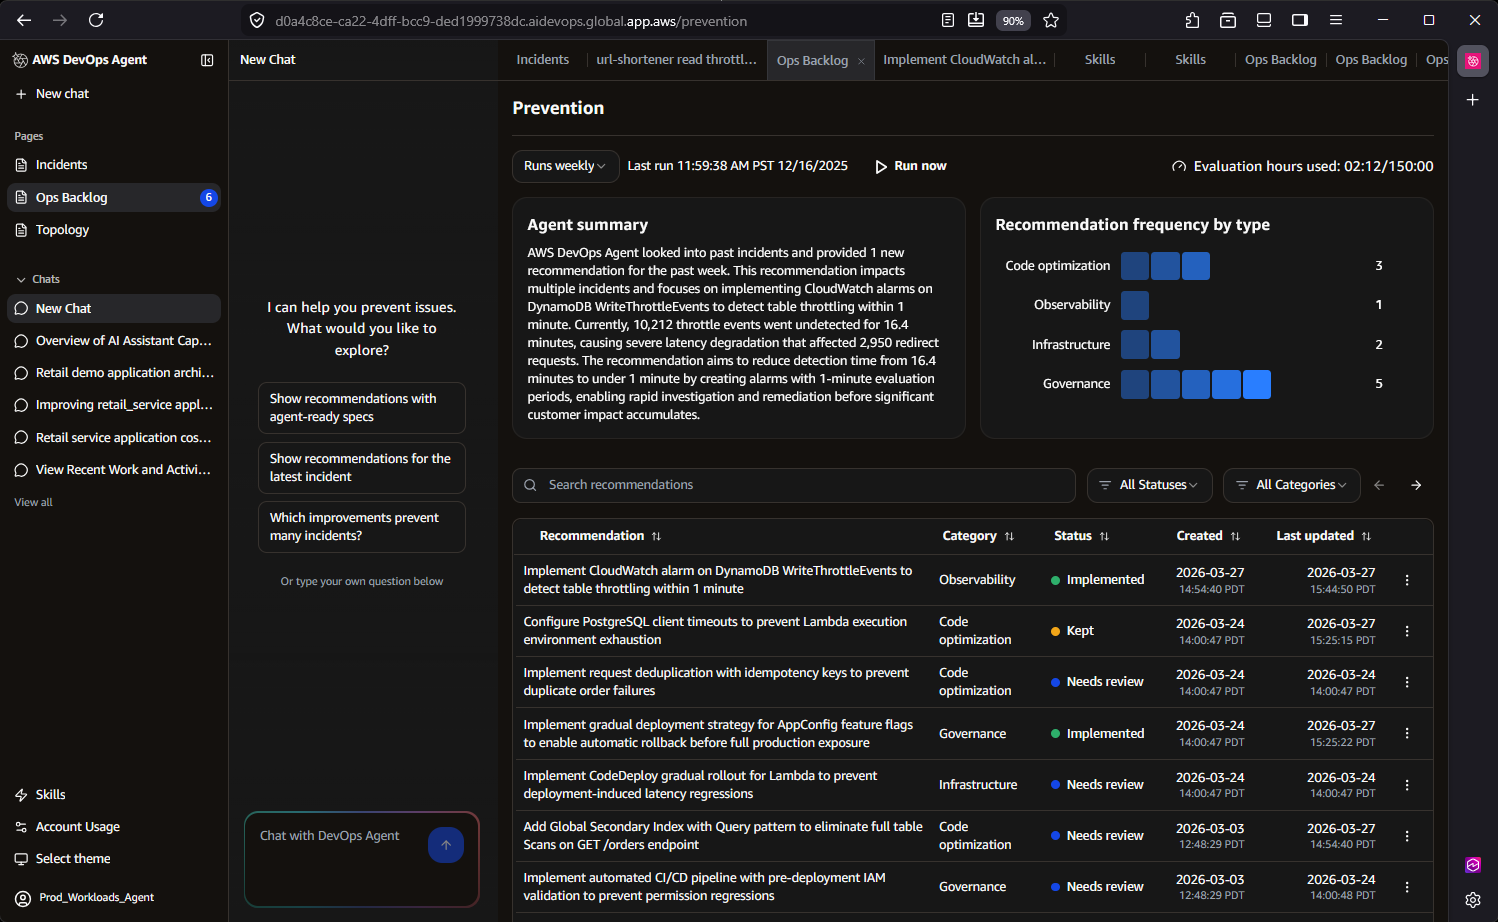
When the URL shortener experiences a DynamoDB throttling event at 3 AM, DevOps Agent detects the alarm, investigates autonomously, identifies that a traffic spike exceeded the table’s provisioned capacity, and posts a mitigation plan in Slack — all before the on-call engineer finishes reading the page. The weekly prevention evaluation then recommends switching to on-demand capacity mode and adding a CloudWatch alarm on ConsumedWriteCapacityUnits to catch future spikes earlier.
Screenshot showing Slack notifications sent by the AWS DevOps Agent during an investigation

Fig 7 – AWS DevOps Agent Slack investigation notifications

Screenshot showing prevention recommendations generated by the AWS DevOps Agent in the Ops Backlog

Fig 8 – AWS DevOps Agent prevention recommendations in the Ops Backlog

5. Continuous Learning

This is where AWS DevOps Agent most clearly separates itself from thin LLM wrappers. The agent implements a sophisticated three-tier skill hierarchy:

  • AWS-provided skills – Built-in capabilities developed by AWS engineers and scientists that reflect proven operational approaches and are continuously maintained under the hood.
  • User-defined skills – Custom skills that you define to help the agent work more effectively within your specific organizational context and workflows.
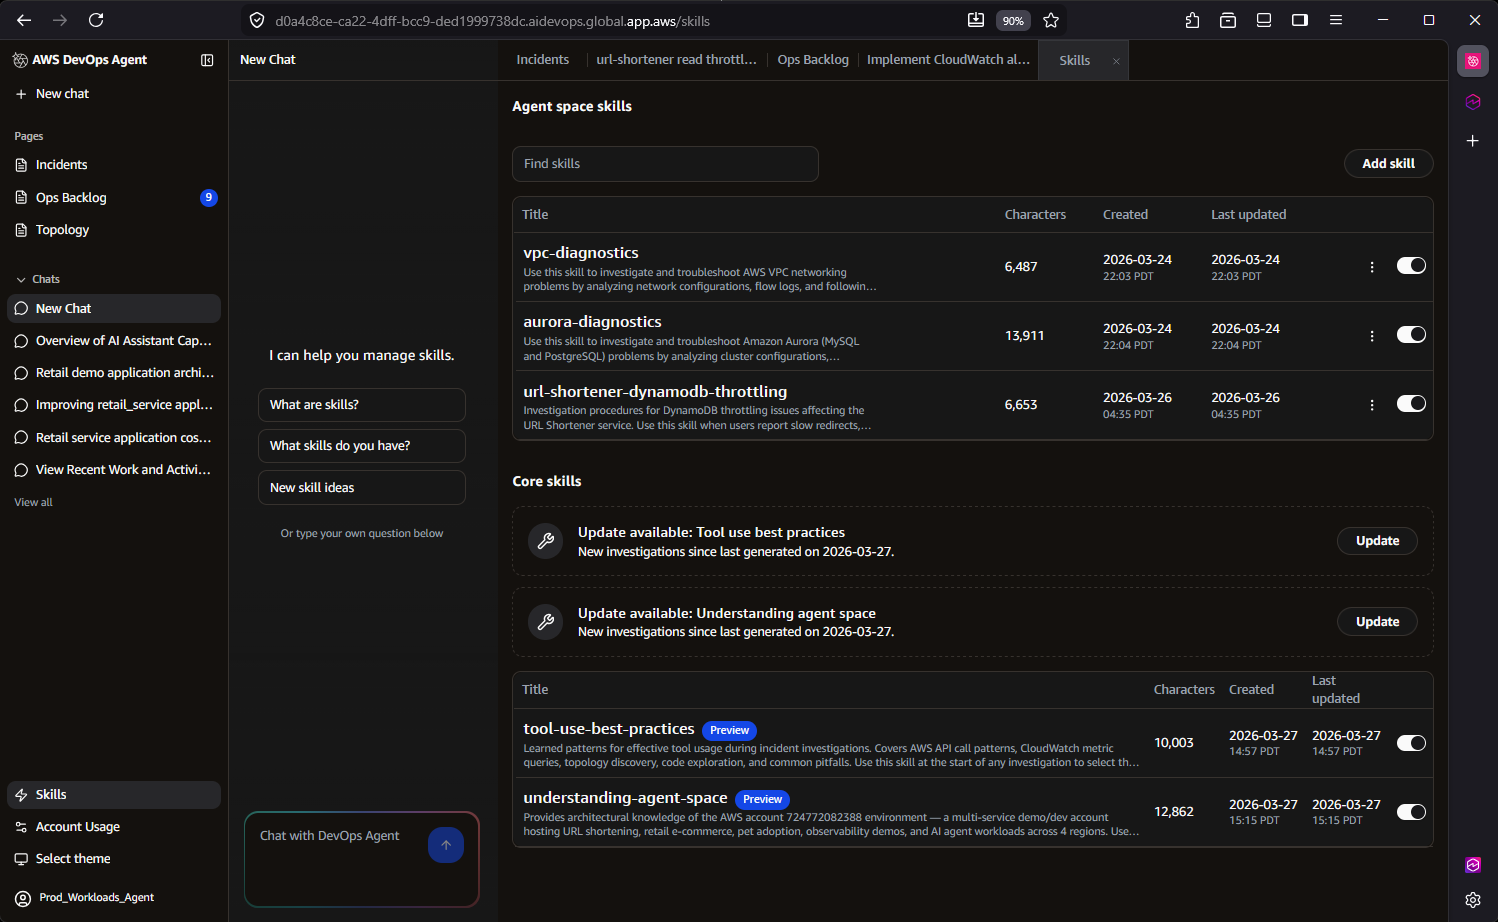
  • Learned skills – Operating continuously in the background, AWS DevOps Agent includes a learning sub-agent that performs two critical functions. First, it scans your cloud infrastructure, telemetry data, and code repositories to continuously learn and update your application topology—understanding resources and their relationships to help zero in on key logs related to specific alarms. Second, it analyzes past investigations to identify patterns and optimize future troubleshooting workflows, becoming more effective over time.

For the URL shortener, after DevOps Agent resolves three DynamoDB throttling incidents over a month, the Learning Agent identifies the recurring pattern and generates a learned skill that accelerates future investigations of the same class. The next time throttling occurs, the agent skips exploratory hypotheses and immediately checks provisioned capacity against consumed capacity, reducing investigation time further. The SRE team also uploads a runbook describing their canary deployment process, which the agent references when evaluating whether a recent deployment correlates with an incident.

Screenshot showing user-defined and learned skills configured for the AWS DevOps Agent

Fig 9 – AWS DevOps Agent user-defined and learned skills

6. Cost Effective

You could build your own agent, but you would still need to pay for the model tokens it consumes. More importantly, you would need to staff a team to develop, maintain, and operate the agent and its integrations. You would also need to periodically evaluate model quality, latency, and costs as underlying models change. With AWS DevOps Agent, you get a team of AWS engineers and scientists who do all of that for you.

DevOps Agent uses usage-based pricing — you pay only for the time the agent actively works on a task. There is no per-seat licensing or idle infrastructure cost. The agent works at machine speed, completing investigations in minutes that would take a human engineer hours, and only charges for the actual seconds of active computation.

Behind the scenes, DevOps Agent employs significant data retrieval optimizations that reduce cost while improving accuracy. Its query optimization techniques across tools achieve up to 15x faster querying across massive datasets by leveraging AWS-specific access patterns and data characteristics. These optimizations mean the agent consumes less compute per investigation while delivering more precise results — a direct benefit of deep AWS integration that generic LLM wrappers cannot replicate.
For the URL shortener, instead of an SRE spending two hours manually querying CloudWatch Logs Insights across three Lambda function log groups and correlating with DynamoDB metrics, DevOps Agent completes the same investigation in minutes using optimized queries — at a fraction of the cost of engineering time.
Proven real-world results

Customers and partners using AWS DevOps Agent in preview report up to 75% lower MTTR, 80% faster investigations, and 94% root cause accuracy, enabling 3–5x faster incident resolution.

Western Governor’s University (WGU), a leading online university serving over 191,000 students, was among the first organizations to deploy Amazon DevOps Agent into production, doing so even ahead of the preview launch at re:Invent. As a large-scale Dynatrace user, WGU leverages the DevOps Agent’s native Dynatrace integration, enabling Dynatrace Intelligence to automatically route problem records to the Agent for investigation and return enriched findings directly back into Dynatrace.

During a recent production investigation, WGU’s SRE team used the AWS DevOps Agent to analyze a service disruption scenario, reducing total resolution time from an estimated two hours to just 28 minutes—a 77% improvement in MTTR. AWS DevOps Agent quickly pinpointed the root cause within an AWS Lambda function’s configuration, surfacing critical operational knowledge that had previously existed only in undiscovered internal documentation.

Zenchef is a restaurant technology platform that helps restaurants manage reservations, table operations, digital menus, payments, and guest marketing from a single commission-free system. With a focused DevOps team managing several production environments across multiple business units, they faced a real test when an API integration issue affecting a downstream partner surfaced during a company hackathon, with engineers engaged in the event and nothing significant showing up in monitoring to point them in the right direction.

Rather than pulling engineers off the hackathon, the team brought the issue to AWS DevOps Agent. It worked through the problem systematically, ruling out authentication as a contributing factor, shifting investigation focus on Amazon Elastic Container Service (Amazon ECS) deployments, and ultimately tracing the root cause to a code regression in which a new version failed to handle an unrecognized enum value in the database. The full investigation wrapped in 20-30 minutes, roughly a 75% reduction compared to the 1-2 hours it would have taken manually, and the findings were shared directly with the responsible engineer.

Conclusion

AWS DevOps Agent is architecturally distinct from LLM wrappers. Its topology intelligence service maps AWS service relationships to understand application dependencies. Its three-tier skill hierarchy with a validation-based Learning Agent creates compounding operational knowledge specific to each customer environment. Its cross-account investigation capability, governed autonomy model, and immutable audit trails address enterprise requirements that no external wrapper can satisfy.

The 6 Cs — Context, Control, Convenience, Collaboration, Continuous Learning, and Cost Effective — are not marketing categories. They represent concrete engineering investments: Agent Spaces for isolation, topology, optimized log queries for performance, federated credential management for cross-account access, and a skills architecture that learns and improves with every investigation. For any team operating distributed and complex architectural applications on AWS — DevOps Agent reduces the operational burden of incident response while building institutional knowledge that makes every future investigation faster and more accurate.

Ready to get started? Visit the AWS DevOps Agent documentation to explore the setup process, join the AWS DevOps Agent workshop for hands-on experience, and/or contact your AWS account team to configure your first Agent Space.

Tipu Qureshi

Tipu Qureshi is a Senior Principal Technologist in AWS Agentic AI, focusing on operational excellence and incident response automation. He works with AWS customers to design resilient, observable cloud applications and autonomous operational systems.

Bill Fine

Bill Fine is a Product Management Leader for Agentic AI at AWS, where he leads product strategy and customer engagement for AWS DevOps Agent.

Joe Alioto

Joe is a World Wide Senior Specialist Solutions Architect for Cloud Operations focusing on Observability and Centralized Operations Management on AWS. He has over two decades of hands-on operations engineering and architecture experience. When he isn’t working, he enjoys spending time with his family, learning new technologies and pc gaming.

Janardhan Molumuri

Janardhan Molumuri is a Principal Technical Leader at AWS, comes with over two decades of Engineering leadership experience, advising customers on Cloud and AI Adoption strategies and emerging technologies including generative AI. He has passion for thought leadership, speaking, writing, and enjoys exploring technology trends to solve problems at scale.

Accelerate CPU-based AI inference workloads using Intel AMX on Amazon EC2

Post Syndicated from Santosh Kumar original https://aws.amazon.com/blogs/compute/accelerate-cpu-based-ai-inference-workloads-using-intel-amx-on-amazon-ec2/

This post shows you how to accelerate your AI inference workloads by up to 76% using Intel Advanced Matrix Extensions (AMX) – an accelerator that uses specialized hardware and instructions to perform matrix operations directly on processor cores – on Amazon Elastic Compute Cloud (Amazon EC2) 8th generation instances. You’ll learn when CPU-based inference is cost-effective, how to enable AMX with minimal code changes, and which configurations deliver optimal performance for your models.

Many organizations find that CPU-based inference is more suitable for their production Artificial Intelligence/Machine Learning (AI/ML) workloads after evaluating factors like cost, operational complexity, and infrastructure compatibility. As more organizations deploy AI solutions, improving how models run on standard CPUs has become a critical cost control strategy for workloads where CPU inference provides the right balance of performance and economics.

IDC, a global market intelligence and advisory firm, projects that worldwide AI spending will reach $632 billion by 2028, growing at a 29% compound annual growth rate from 2024, with inference costs representing a significant portion of operational expenses. Deloitte, a leading professional services firm specializing in technology consulting and research, forecasts that inference – the running of AI models – will make up two-thirds of all AI compute by 2026, far exceeding initial training costs. This makes optimizing AI/ML inference on CPU crucial for controlling long-term AI/ML operational expenses.

At the core of AI inference workloads are matrix multiplication operations – the mathematical foundation of neural networks that drives computational demand. These matrix-heavy operations create a performance bottleneck for CPU-based inference, resulting in suboptimal performance for AI/ML workloads. This creates three key challenges for organizations: balancing cost optimization with performance requirements, meeting real-time latency demands, and scaling efficiently with variable workload demands. Intel’s Advanced Matrix Extensions (AMX) technology addresses these challenges by accelerating matrix operations directly on CPU cores, making CPU-based inference competitive and cost-effective.

AMX capabilities and architecture

AMX supports multiple data formats including BF16 which preserves the range of 32-bit floating point operations in half the space, INT8 maximizes throughput when accuracy can be slightly compromised, and FP16 offers a balance between the two. This flexibility lets you match precision to your specific needs.

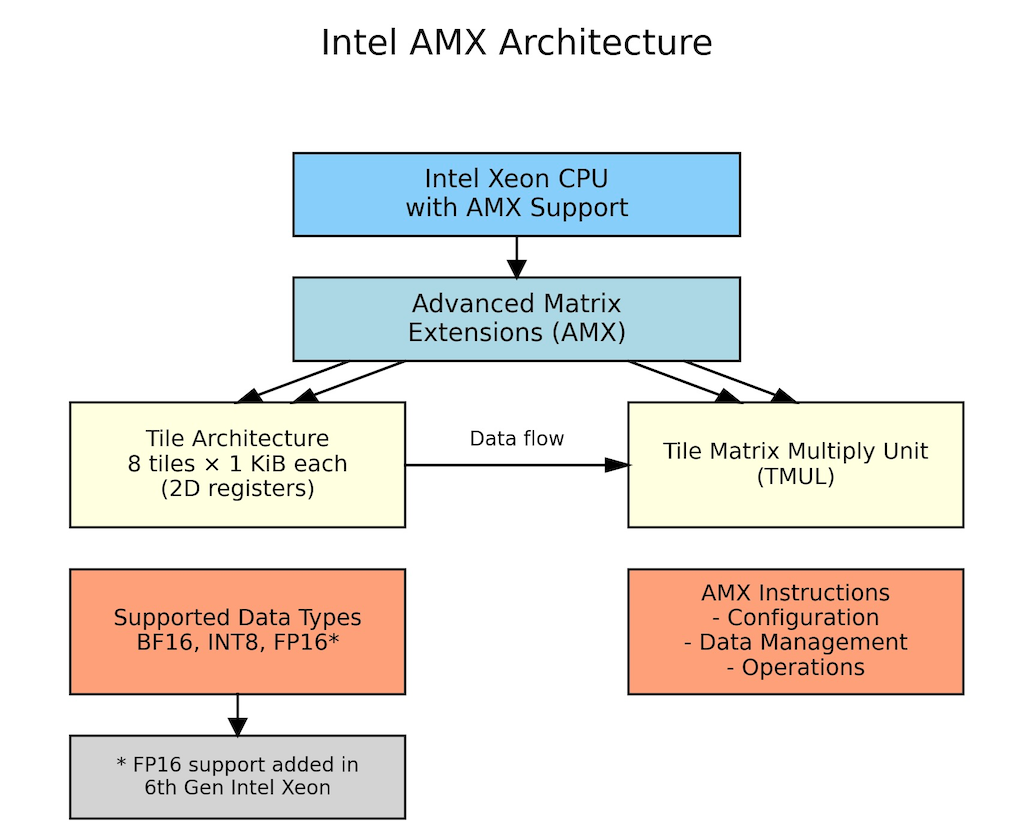
Introduced in 2023 with 4th Generation Intel Xeon Scalable processors, AMX consists of eight 1KB tile registers (specialized on-chip memory for matrix data) and a Tile Matrix Multiply Unit (TMUL – dedicated hardware for matrix calculations) that enables processors to perform 2048 INT8 operations or 1024 BF16 operations per cycle. These tile registers provide efficient matrix storage, reducing memory access overhead and improving computational efficiency for matrix operations central to neural networks. For real-world customer workloads, this translates to significantly faster inference times for transformer models, recommendation systems, and natural language processing tasks, while reducing the total cost of ownership through improved resource utilization and lower infrastructure requirements.

Architecture diagram of Intel Advanced Matrix Extensions (AMX) showing the key components: Intel Xeon CPU with AMX support, tile architecture with 8 tiles of 1 KiB each as 2D registers, Tile Matrix Multiply Unit (TMUL) with data flow between them, supported data types (BF16, INT8, FP16), and AMX instruction categories (Configuration, Data Management, Operations)

Figure 1: AMX Architecture showing AMX tile registers, processing units, and data flow within CPU core

Note: AMX operations, including tile setup and memory-to-tile data movement (which are handled automatically by the system), introduce small overhead that may outweigh benefits for smaller models or single-batch processing where insufficient matrix operations cannot amortize these costs, making batch size optimization critical for performance gains.

When to choose CPU inference with AMX

CPU inference with AMX acceleration benefits workloads including:

Batch processing and traditional ML: Content summarization, recommendation systems, and analytical workloads benefit from CPU’s cost efficiency and ability to handle sparse data structures and branching logic.

Small to medium-sized models: Models under 7B parameters and batch sizes of 8-16 samples achieve excellent performance through optimized threading, making CPUs ideal for applications like fraud detection and chatbots.

Variable demand workloads: E-commerce systems and applications with unpredictable traffic patterns can quickly scale CPU instances up or down based on demand, avoiding the fixed costs of dedicated accelerator hardware that sits idle during low-traffic periods.

Complex business logic: Applications like financial risk assessment and content moderation that need to combine ML predictions with business rules and conditional logic work well on CPUs, which handle mixed workloads better than specialized accelerators.

Implementation: AMX optimization with PyTorch

PyTorch, a popular open-source machine learning framework, includes built-in Intel optimizations through oneDNN (Intel’s Deep Neural Network library) that automatically use AMX when available. Setup requires installing dependencies and configuring environment variables for optimal performance.

Install dependencies

# Install transformers and torch
pip install torch transformers

Configure environment variables

These environment variables tell oneDNN library how to optimize your inference workload for AMX.

  1. Enable AMX instruction set (tells oneDNN to use AMX tiles for matrix operations):
    export DNNL_MAX_CPU_ISA=AVX512_CORE_AMX
  2. Optimize thread affinity (binds threads to CPU cores for better cache performance):
    export KMP_AFFINITY=granularity=fine,compact,1,0
  3. Use all available CPU cores for parallel processing:
    export OMP_NUM_THREADS=$(nproc)
  4. Cache compiled kernels (avoids recompilation overhead on subsequent runs):
    export ONEDNN_PRIMITIVE_CACHE_CAPACITY=4096
  5. Set default precision to BF16 (enables automatic AMX acceleration):
    export ONEDNN_DEFAULT_FPMATH_MODE=bf16
  6. (Optional) Enable verbose logging to verify AMX activation:
    export ONEDNN_VERBOSE=1

BF16 optimization example

With environment variables configured, implementing BF16 optimization requires minimal to no code changes. The following example demonstrates how PyTorch automatically leverages AMX tile registers for matrix operations when BF16 precision is used.

Note: This is a simplified example for demonstration purposes; adapt the code to your specific use case and requirements.

import torch
from transformers import AutoTokenizer, AutoModelForCausalLM
import time

# Load model and tokenizer from HuggingFace
model_name = "google/gemma-3-1b-it"

model_revision = "dcc83ea841ab6100d6b47a070329e1ba4cf78752"
tokenizer = AutoTokenizer.from_pretrained(
    model_name,
    revision=model_revision
)
model = AutoModelForCausalLM.from_pretrained(
    model_name,
    revision=model_revision
)
# Fix tokenizer padding issue for batch processing
if tokenizer.pad_token is None:
    tokenizer.pad_token = tokenizer.eos_token

# Enable BF16 precision for automatic AMX acceleration
model = model.to(dtype=torch.bfloat16)
model.eval()  # Set to inference mode

# Inference function with BF16 autocast
def run_optimized_inference(prompts):
    inputs = tokenizer(prompts, padding=True, 
                      return_tensors="pt")  # Tokenize input
    
    with torch.no_grad():  # Disable gradients for inference
        with torch.amp.autocast('cpu',
                               dtype=torch.bfloat16):  # BF16 autocast
            outputs = model.generate(
                **inputs,
                max_length=100,     # Set maximum sequence length 
                do_sample=False     # Use greedy decoding
            )
    return outputs

# Example usage with performance measurement
prompts = ["What are the benefits of cloud computing?"]
start_time = time.time()
results = run_optimized_inference(prompts)  # Run BF16-optimized inference
elapsed_time = time.time() - start_time
tokens_generated = len(results[0]) - len(tokenizer.encode(
    prompts[0]))  # Count new tokens

# Display results and performance metrics
print(tokenizer.decode(results[0], skip_special_tokens=True))
print(f"Latency: {elapsed_time*1000:.1f}ms, "
      f"Throughput: {tokens_generated/elapsed_time:.1f} "
      f"tokens/sec")

Performance benchmarks

To validate AMX performance benefits, we conducted benchmarks across multiple popular language models representing different use cases and model sizes.

Benchmarking methodology and environment

We tested two improvements: hardware generation advances (m8i vs m7i) and AMX optimization impact (FP32 vs BF16). This shows you both upgrade paths for your workloads.

  • Models tested: BigBird-RoBERTa-large (355M), Microsoft DialoGPT-large (762M), Google Gemma-3-1b-it (1B), DeepSeek-R1-Distill-Qwen-1.5B (1.5B), Llama-3.2-3B-Instruct (3B), YOLOv5 (tested with 30 images at ~1200×800 resolution with 5 iterations for each image)
  • Amazon EC2 instance types: m8i.4xlarge, m7i.4xlarge (8th & 7th gen general-purpose Amazon EC2 instances with 16 vCPUs and 64 GiB memory, both AMX-capable)
  • Batch sizes: 1, 8, 32 (number of input samples processed simultaneously in a single inference call)
  • Iterations: 5 runs per configuration
  • Comparison types:
    • Instance generation comparison (m8i vs m7i performance)
    • AMX optimization impact (32-bit floating-point (FP32) vs Brain Floating Point 16 (BF16) on same instance)
  • Optimizations: FP32 baseline vs BF16 AMX
  • Framework: PyTorch 2.8.0 (which has built-in Intel optimizations)
  • Region: AWS us-west-2
  • Measurement methodology: In our benchmarks, ‘inference latency’ represents the complete model inference execution time including input tokenization and full sequence generation (for generative models) or complete forward pass (for non-generative models). Each measurement is the average of 5 iterations after warm-up iterations, excluding model loading time. We use this metric because AMX’s matrix multiplication acceleration improves performance throughout the complete forward pass.

Note: Throughout this blog, FP32 refers to the default 32-bit floating-point precision, while BF16 refers to Brain Floating Point 16-bit precision with AMX acceleration enabled.

Disclaimer: Performance results are based on internal testing and may vary depending on specific workloads, configurations, and environments.

Detailed result: BigBird-RoBERTa-large

This benchmark represents document classification, content summarization, and text analysis workloads typical in batch processing where high throughput is desirable and offline inference scenarios where strict latency requirements are not critical.

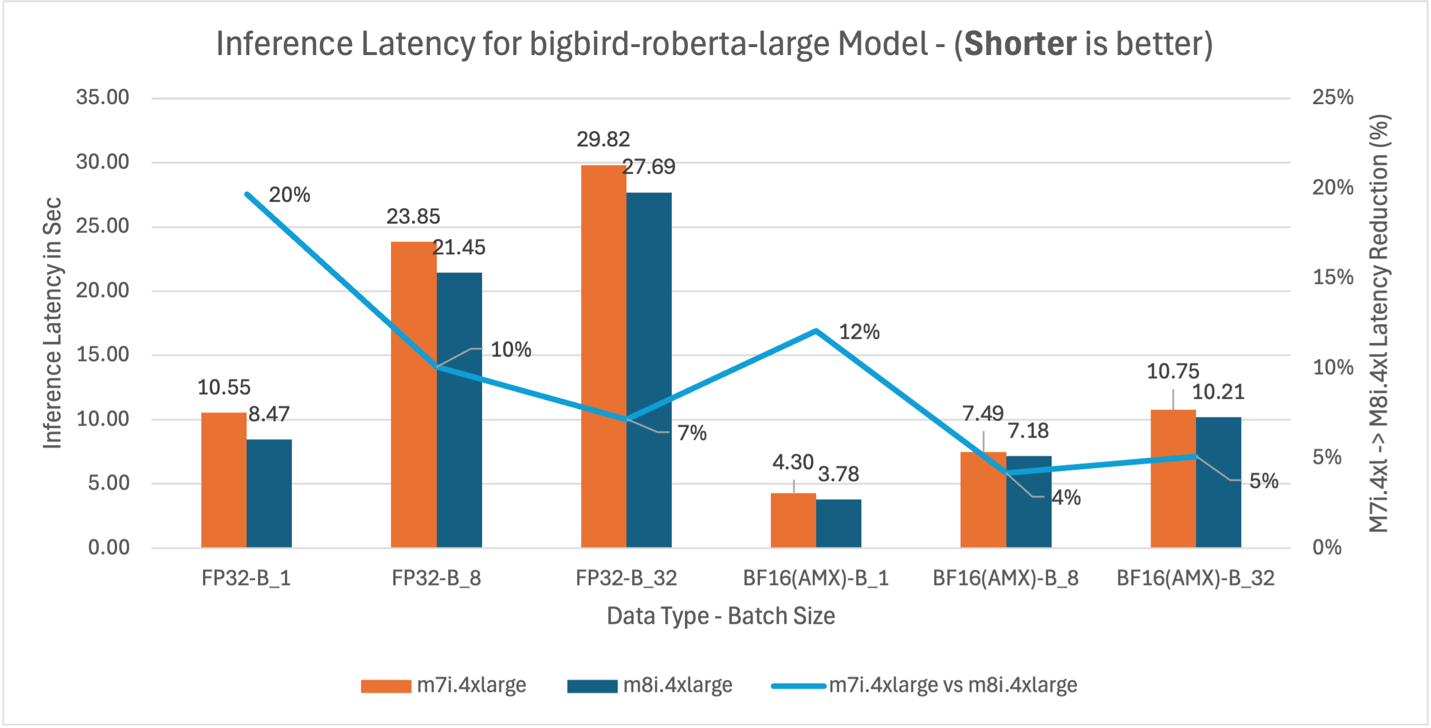
Bar chart comparing BigBird-RoBERTa-large inference latency between m7i and m8i instances with FP32 and BF16 precision across batch sizes 1, 8, and 32, showing 55-67% latency reduction with BF16 AMX.

Figure 2: m7i.4xlarge vs m8i.4xlarge inference latency comparison for model BigBird-RoBERTa-large (355M parameters)

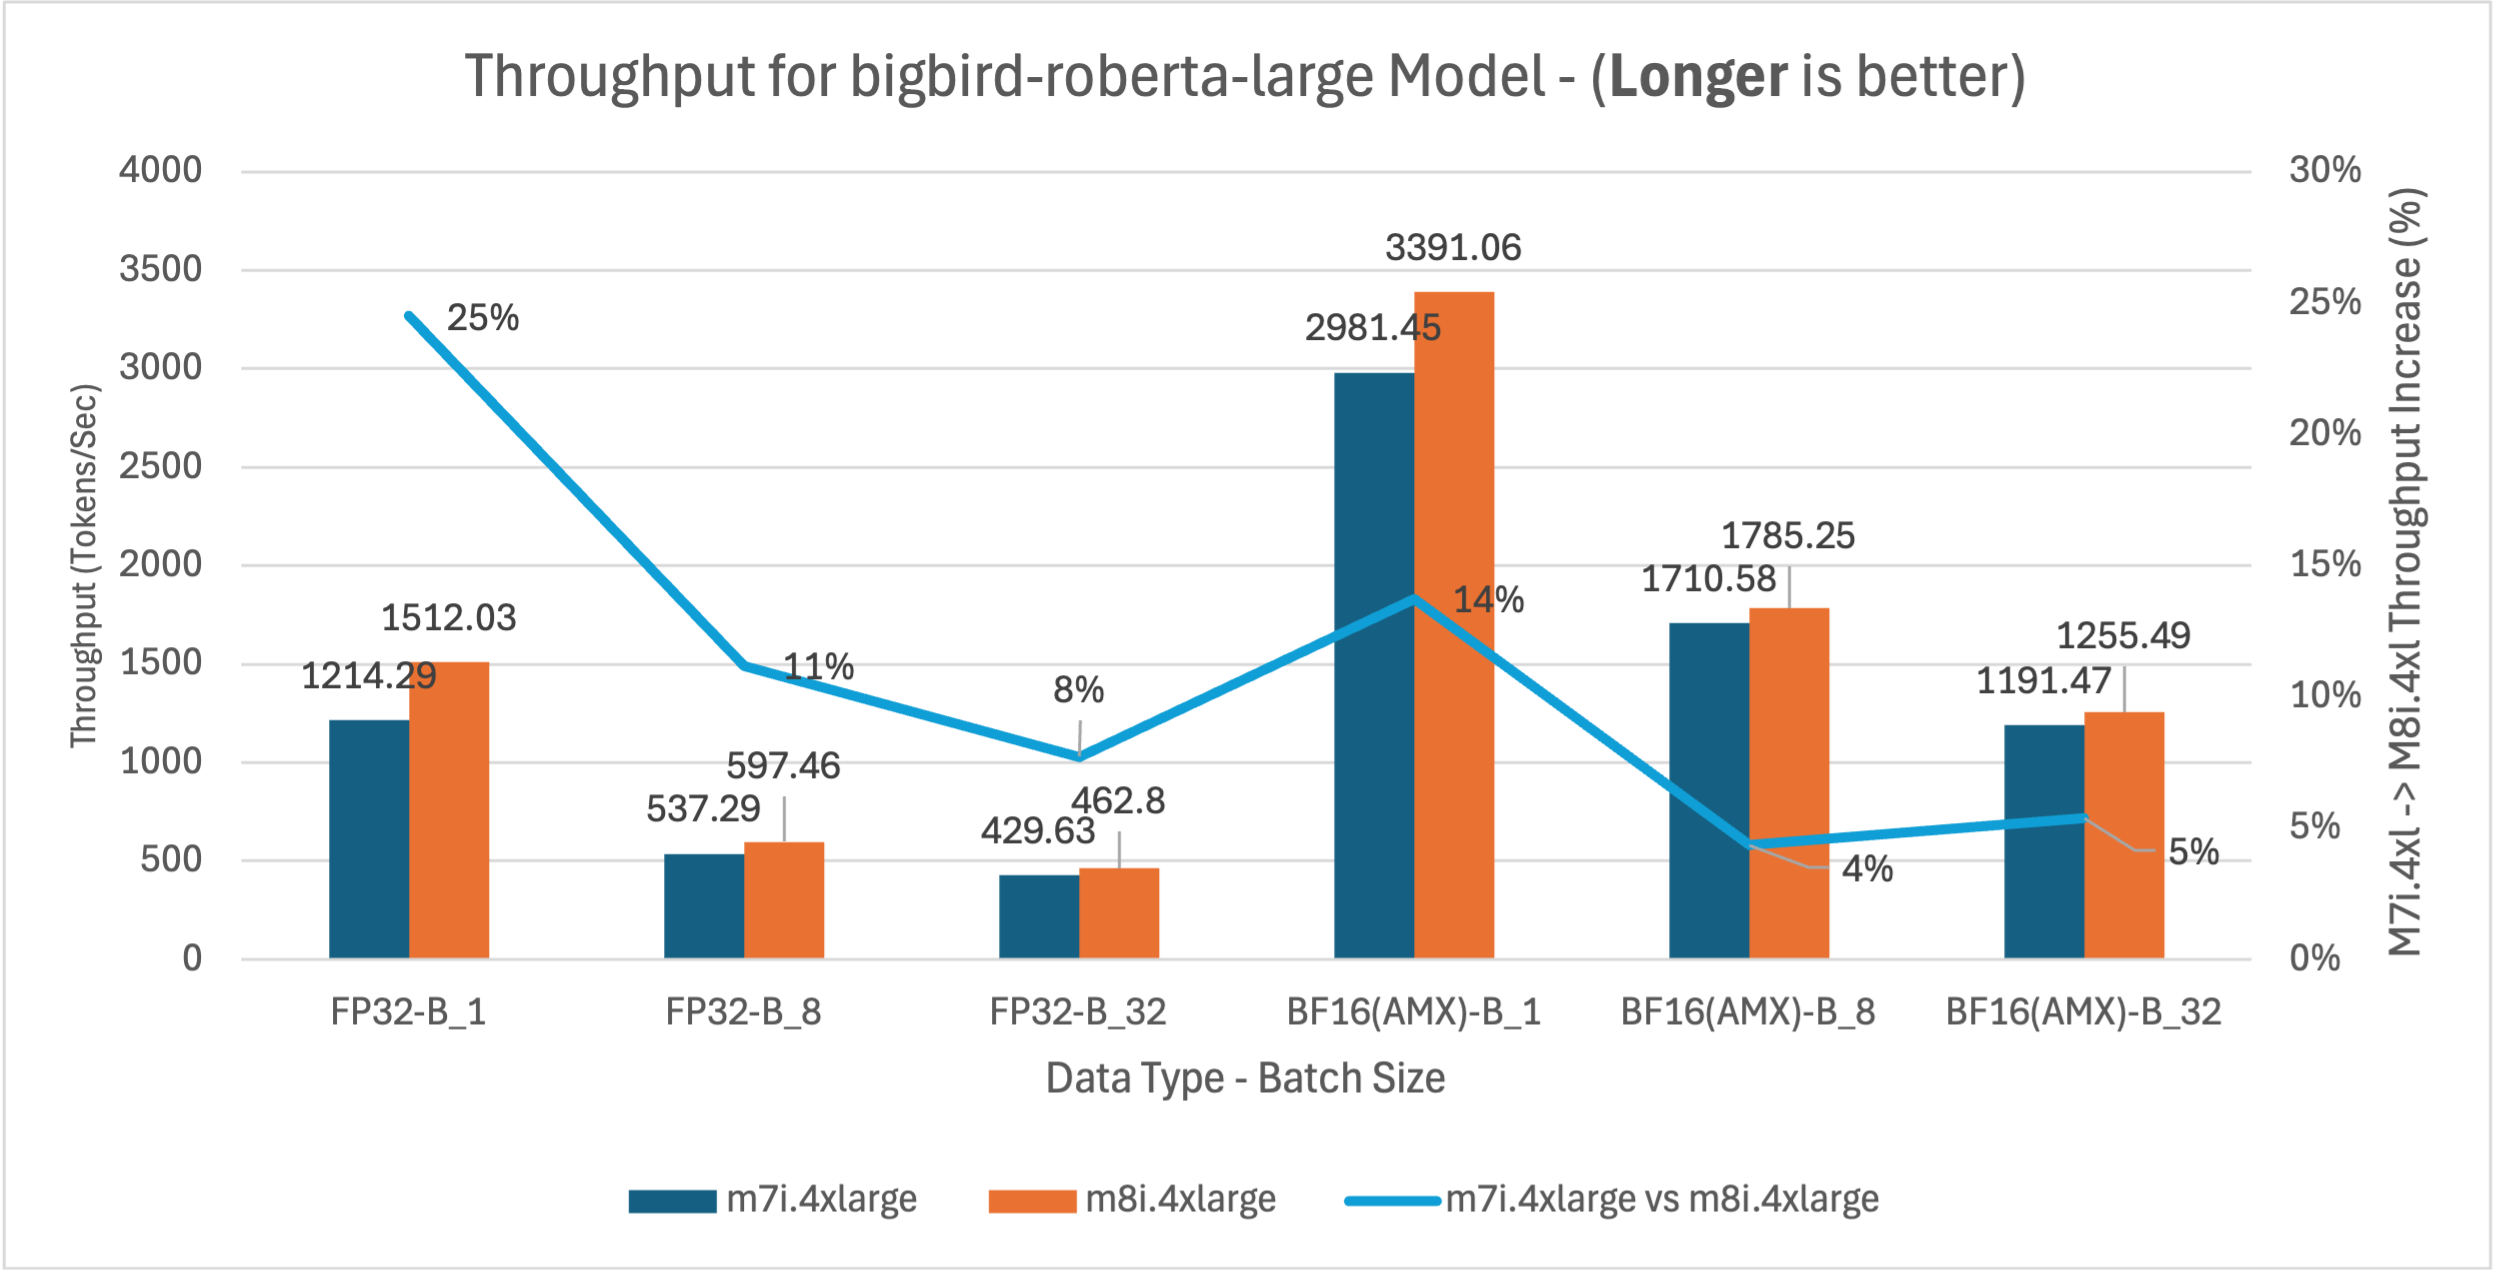
Bar chart comparing throughput for the BigBird-RoBERTa-large model between m7i.4xlarge and m8i.4xlarge instances across FP32 and BF16(AMX) data types at batch sizes 1, 8, and 32. m8i.4xlarge achieves 4–25% higher throughput, with the largest gain at FP32 batch size 1 (25%, from 1214.29 to 1512.03 tokens/sec). BF16(AMX) batch size 1 reaches the highest overall throughput at 3391.06 tokens/sec on m8i.4xlarge with a 14 % improvement over m7i.4xlarge. Throughput gains with BF16(AMX) are smaller at larger batch sizes (4–5%), as AMX overhead limits scaling for this smaller model.

Figure 3: m7i.4xlarge vs m8i.4xlarge throughput comparison for BigBird-RoBERTa-large model across batch sizes 1, 8, and 32

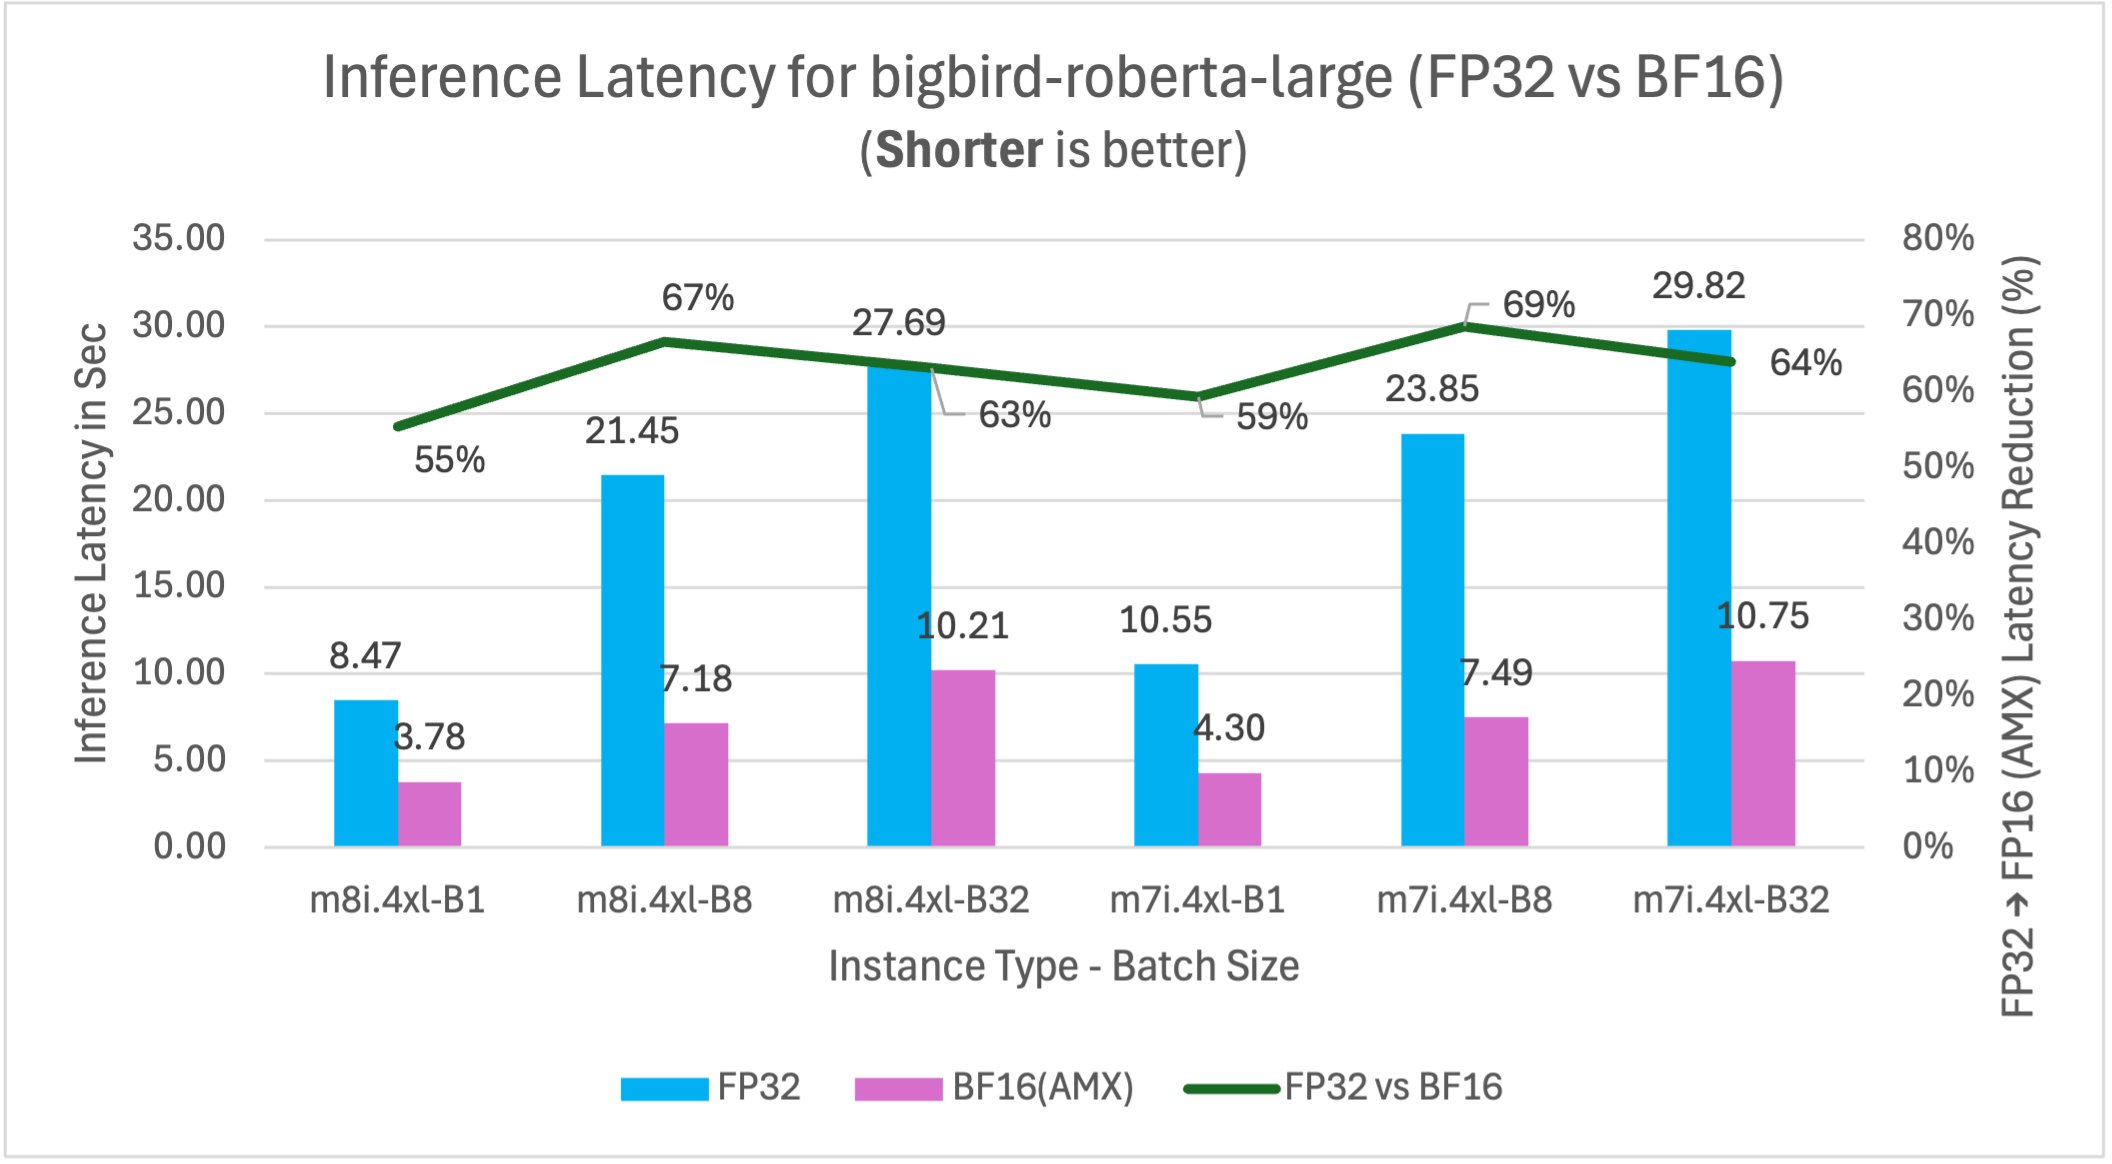
Bar chart comparing inference latency for bigbird-roberta-large between FP32 and BF16(AMX) data types on m8i.4xlarge and m7i.4xlarge instances at batch sizes 1, 8, and 32, showing BF16(AMX) reduces latency by 55–69% compared to FP32 across all configurations

Figure 4: FP32 vs BF16 inference latency comparison for model BigBird-RoBERTa-large (355M parameters) on m7i.4xlarge and m8i.4xlarge instances across batch sizes

BigBird-RoBERTa-large model benchmarking demonstrates three key performance improvements. Figure 2 shows m8i hardware delivers 4-20% latency reduction across batch sizes compared to m7i for both FP32 and BF16 with AMX, providing immediate benefits without application changes. With AMX and BF16, performance gains decrease at higher batch sizes as AMX overhead exceeds benefits for smaller models like BigBird-RoBERTa-large. Figure 3 validates these improvements with corresponding 4-25% throughput gains, enabling better resource utilization for production applications. Figure 4 demonstrates that enabling AMX with BF16 optimization provides the most significant impact, reducing m8i latency by 55-67% compared to non-AMX FP32 baseline, enabling 2-3x higher processing capacity and reduced compute costs.

The analysis above demonstrates the methodology for interpreting benchmark results using BigBird-RoBERTa-large as a representative example. The remaining models (DialoGPT-large, Gemma-3-1b-it, DeepSeek-R1-Distill-Qwen-1.5B, and Llama-3.2-3B-Instruct) follow identical testing procedures and exhibit similar performance patterns, with variations primarily in the magnitude of improvements based on model size and architecture. The comprehensive analysis of five models and their performance implications are synthesized in the following section.

Benchmarking result for additional models

To validate AMX’s effectiveness across diverse AI workloads, we benchmarked five additional models representing different use cases and model sizes. Each model follows the same testing methodology described above, with performance patterns showing how AMX benefits vary based on model architecture, parameter count, and batch size.

DialoGPT-large (762M) – Conversational AI

This benchmark represents conversational AI, chatbots, and real-time dialogue systems where low latency and consistent response times are critical for user experience.

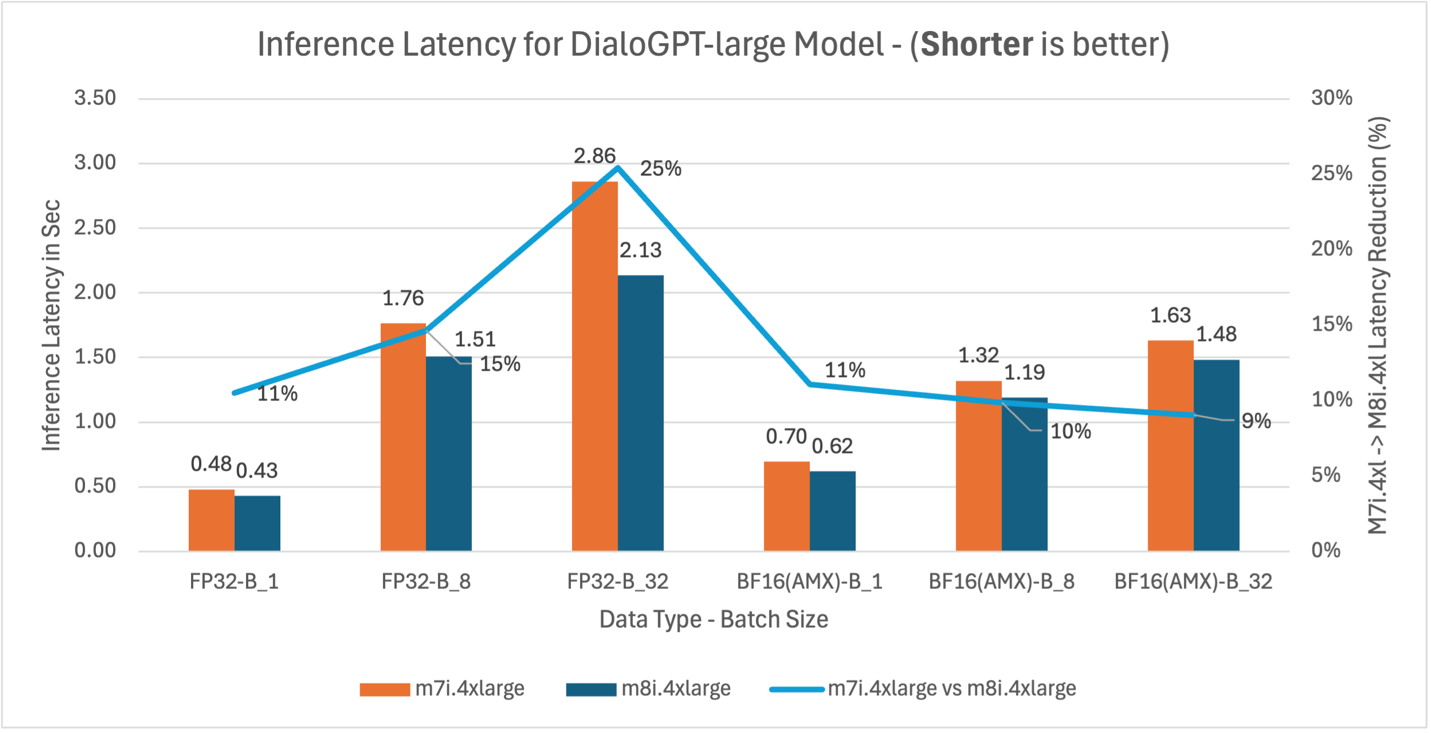
Bar chart comparing inference latency for the DialoGPT-large model between m7i.4xlarge and m8i.4xlarge instances across FP32 and BF16(AMX) data types at batch sizes 1, 8, and 32, showing m8i.4xlarge achieves 9– 25% latency reduction, with the largest improvement at FP32 batch size 32 (25%)

Figure 5: m7i.4xlarge vs m8i.4xlarge inference latency comparison for model DialoGPT-large (762M parameters)

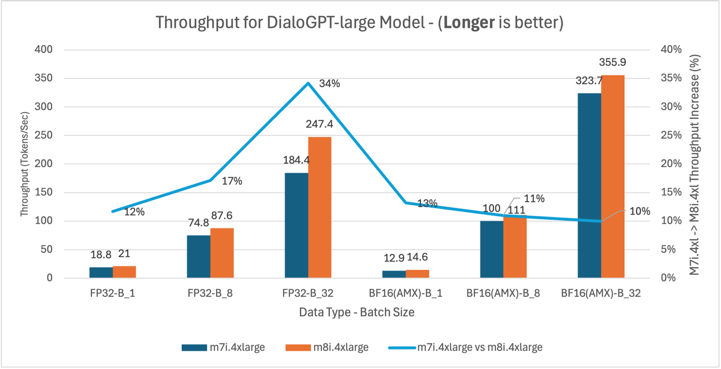
Bar chart comparing throughput for the DialoGPT-large model between m7i.4xlarge and m8i.4xlarge instances across FP32 and BF16(AMX) data types at batch sizes 1, 8, and 32, showing m8i.4xlarge achieves 10–34% higher throughput, with the largest gain at FP32 batch size 32 (34%) and BF16(AMX) batch size 32 reaching the highest overall throughput at 355.9 tokens/sec

Figure 6: m7i.4xlarge vs m8i.4xlarge throughput comparison for DialoGPT-large model across batch sizes 1, 8, and 32

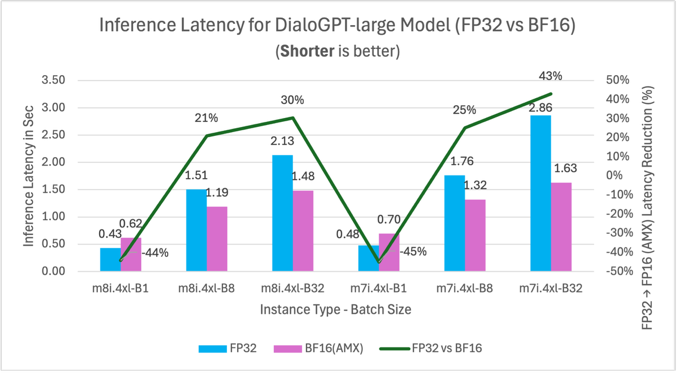
Bar chart comparing inference latency for DialoGPT-large between FP32 and BF16(AMX) data types on m8i.4xlarge and m7i.4xlarge instances at batch sizes 1, 8, and 32, showing BF16(AMX) increases latency at batch size 1 (negative improvement of -44% and -45%) but reduces latency at larger batch sizes, with up to 43% reduction at m7i.4xlarge batch size 32

Figure 7: FP32 vs BF16 inference latency comparison for model DialoGPT-large (762M parameters) on m7i.4xlarge and m8i.4xlarge instances across batch sizes

Gemma-3-1b-it (1B) – General Purpose

This benchmark represents general-purpose language understanding tasks, content generation, and smaller model deployments suitable for cost-sensitive applications and variable demand workloads.

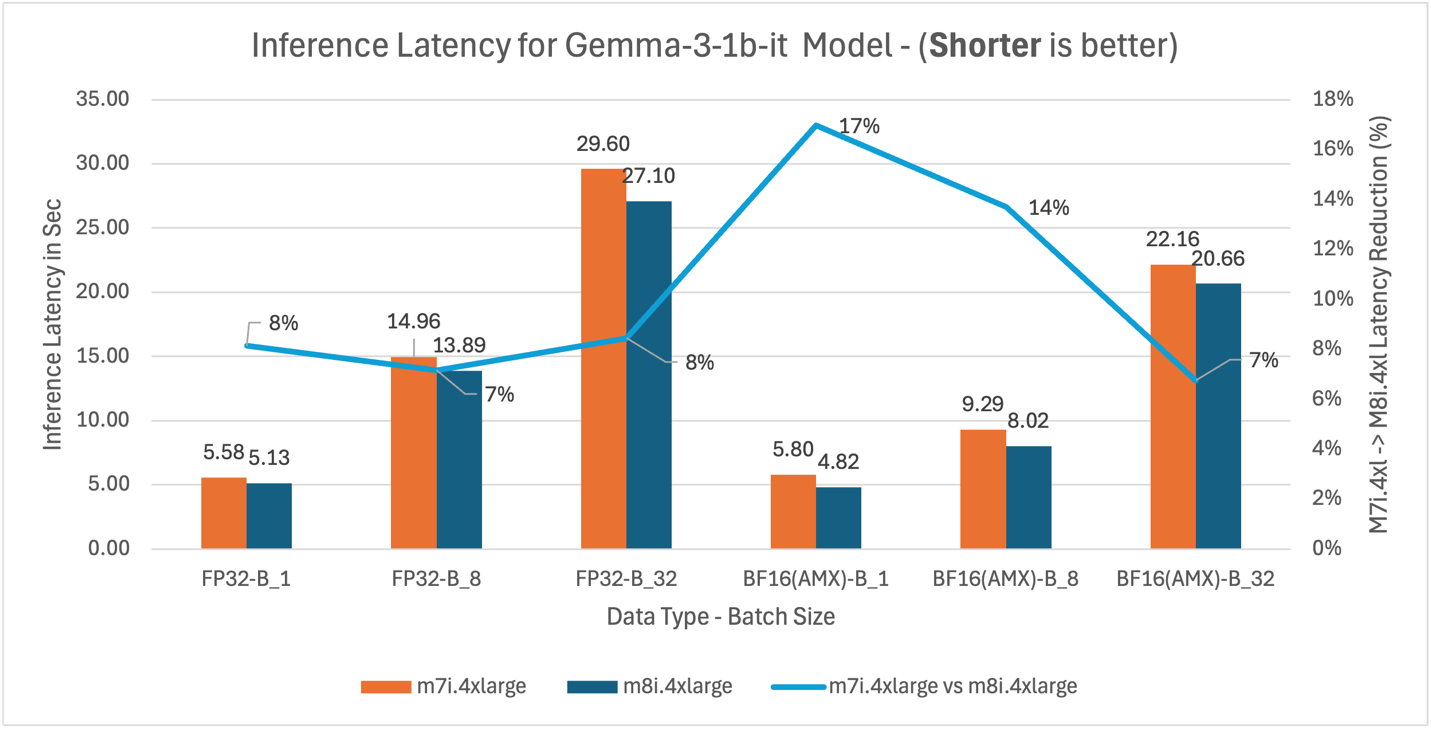
Bar chart comparing inference latency for the Gemma-3-1b-it model between m7i.4xlarge and m8i.4xlarge instances across FP32 and BF16(AMX) data types at batch sizes 1, 8, and 32, showing m8i.4xlarge achieves 7– 17% latency reduction, with the largest improvement at BF16(AMX) batch size 1 (17%)

Figure 8: M7i.4xlarge vs M8i.4xlarge inference latency comparison for model Gemma-3-1b-it (1B parameters)

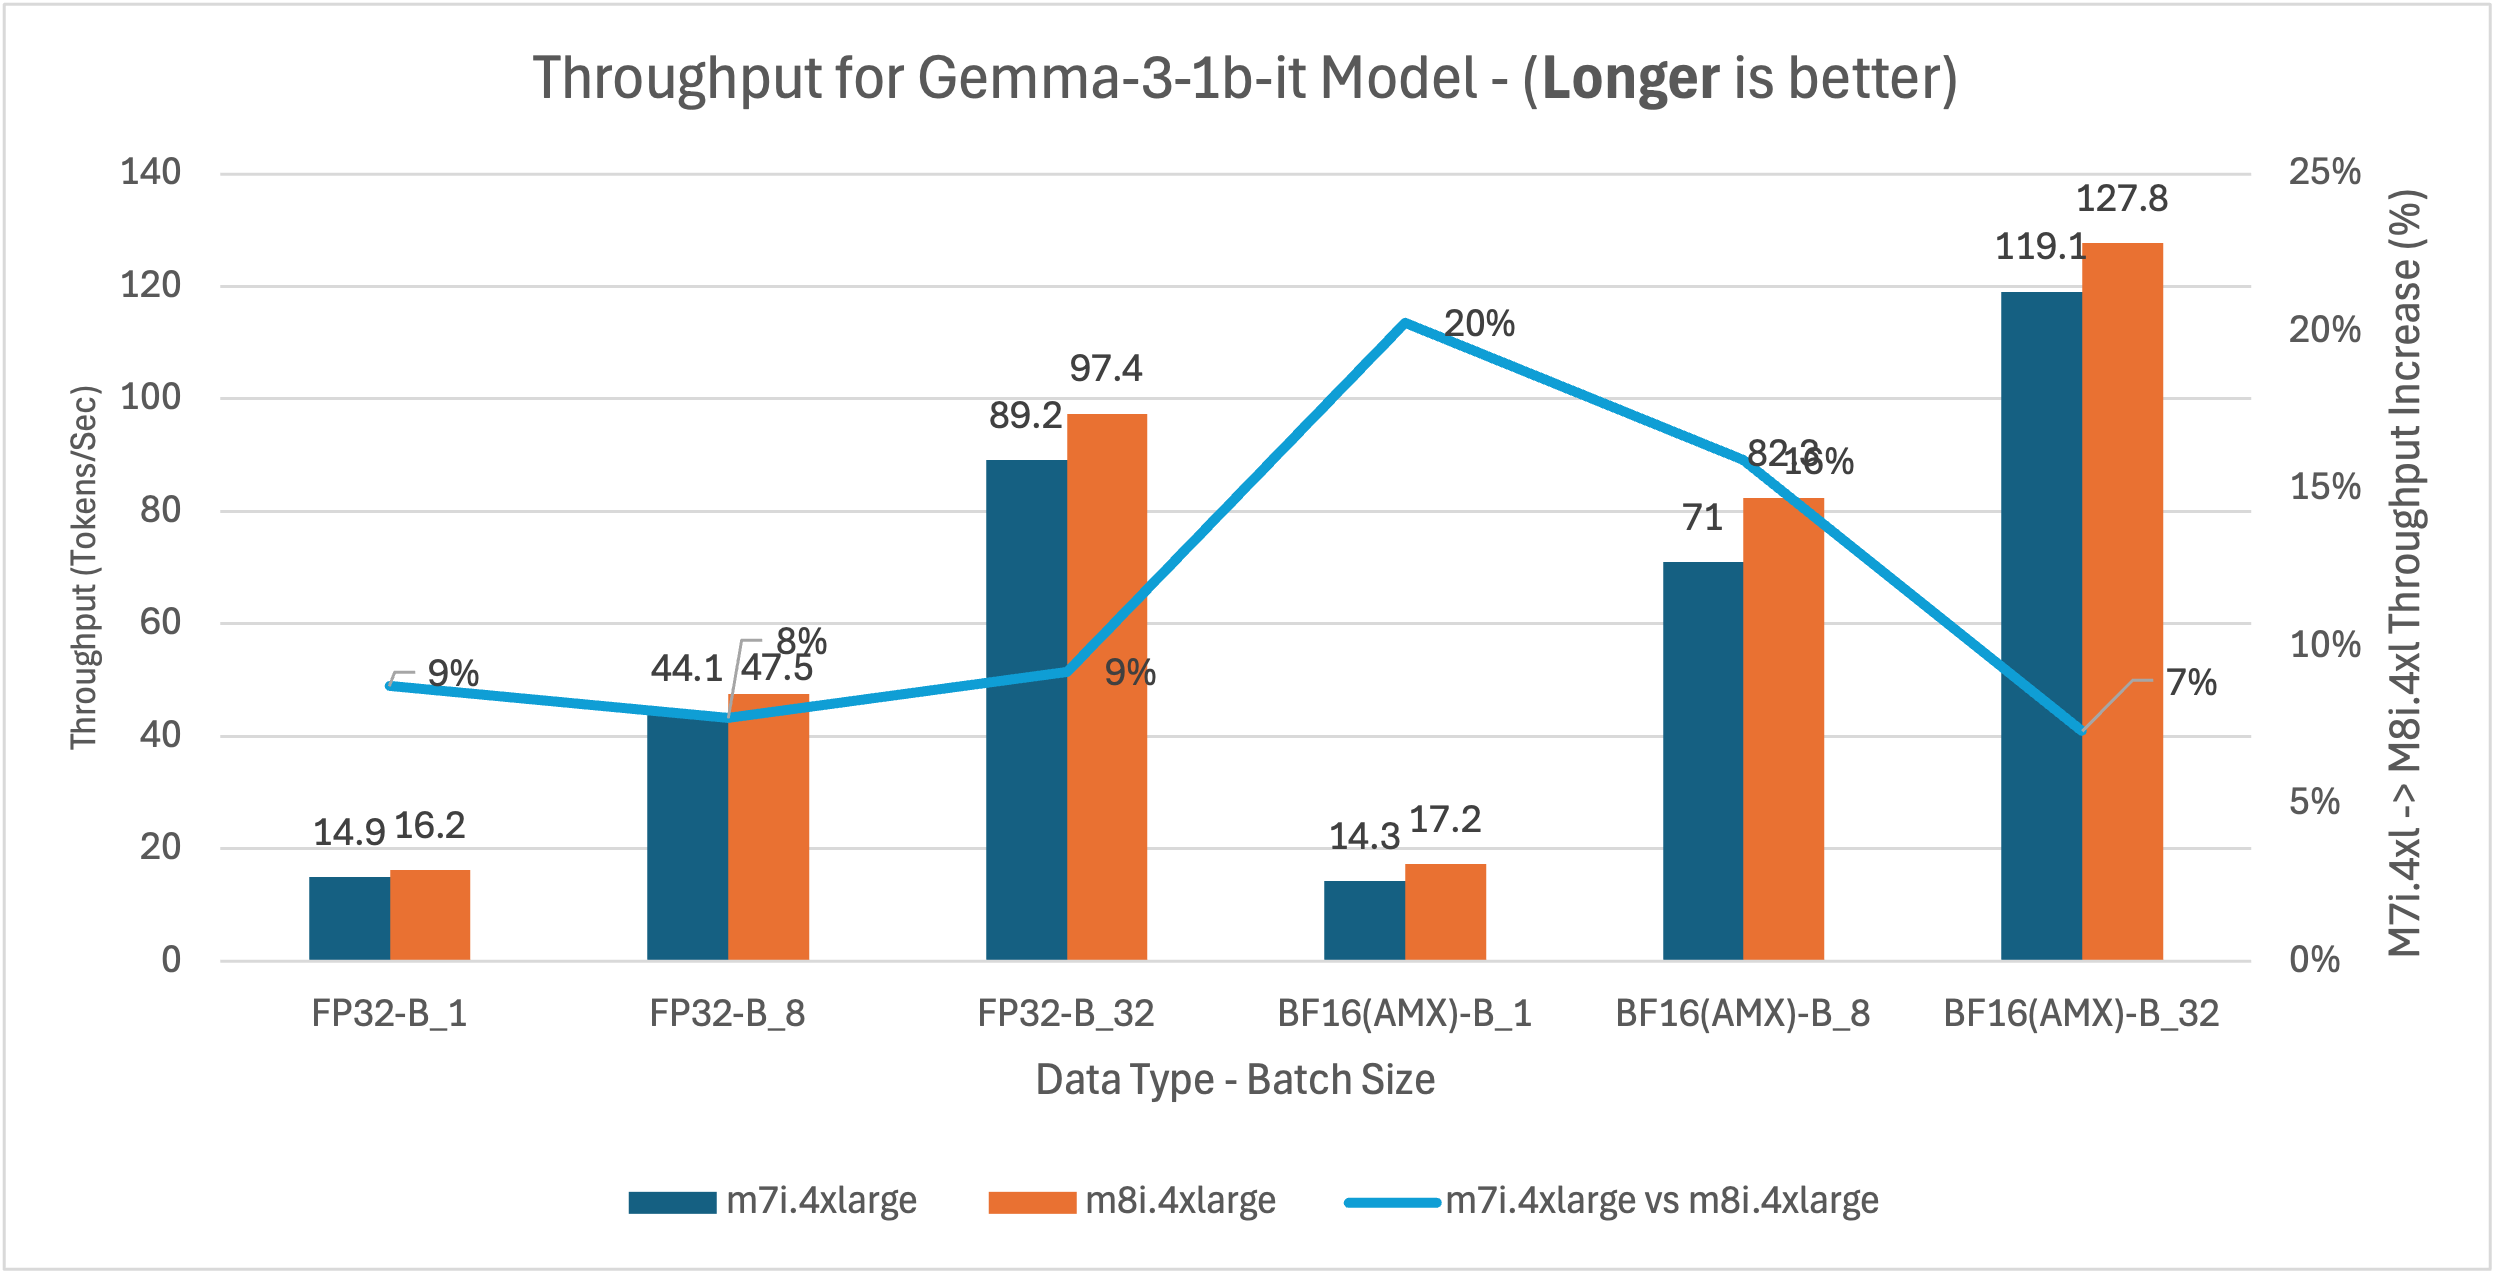
Bar chart comparing throughput for the Gemma-3-1b-it model between m7i.4xlarge and m8i.4xlarge instances across FP32 and BF16(AMX) data types at batch sizes 1, 8, and 32, showing m8i.4xlarge achieves 7–20% higher throughput, with the largest gain at BF16(AMX) batch size 1 (20%) and BF16(AMX) batch size 32 reaching the highest overall throughput at 127.8 tokens/sec

Figure 9: m7i.4xlarge vs m8i.4xlarge latency and throughput comparison for Gemma-3-1b-it across model batch sizes 1, 8, and 32

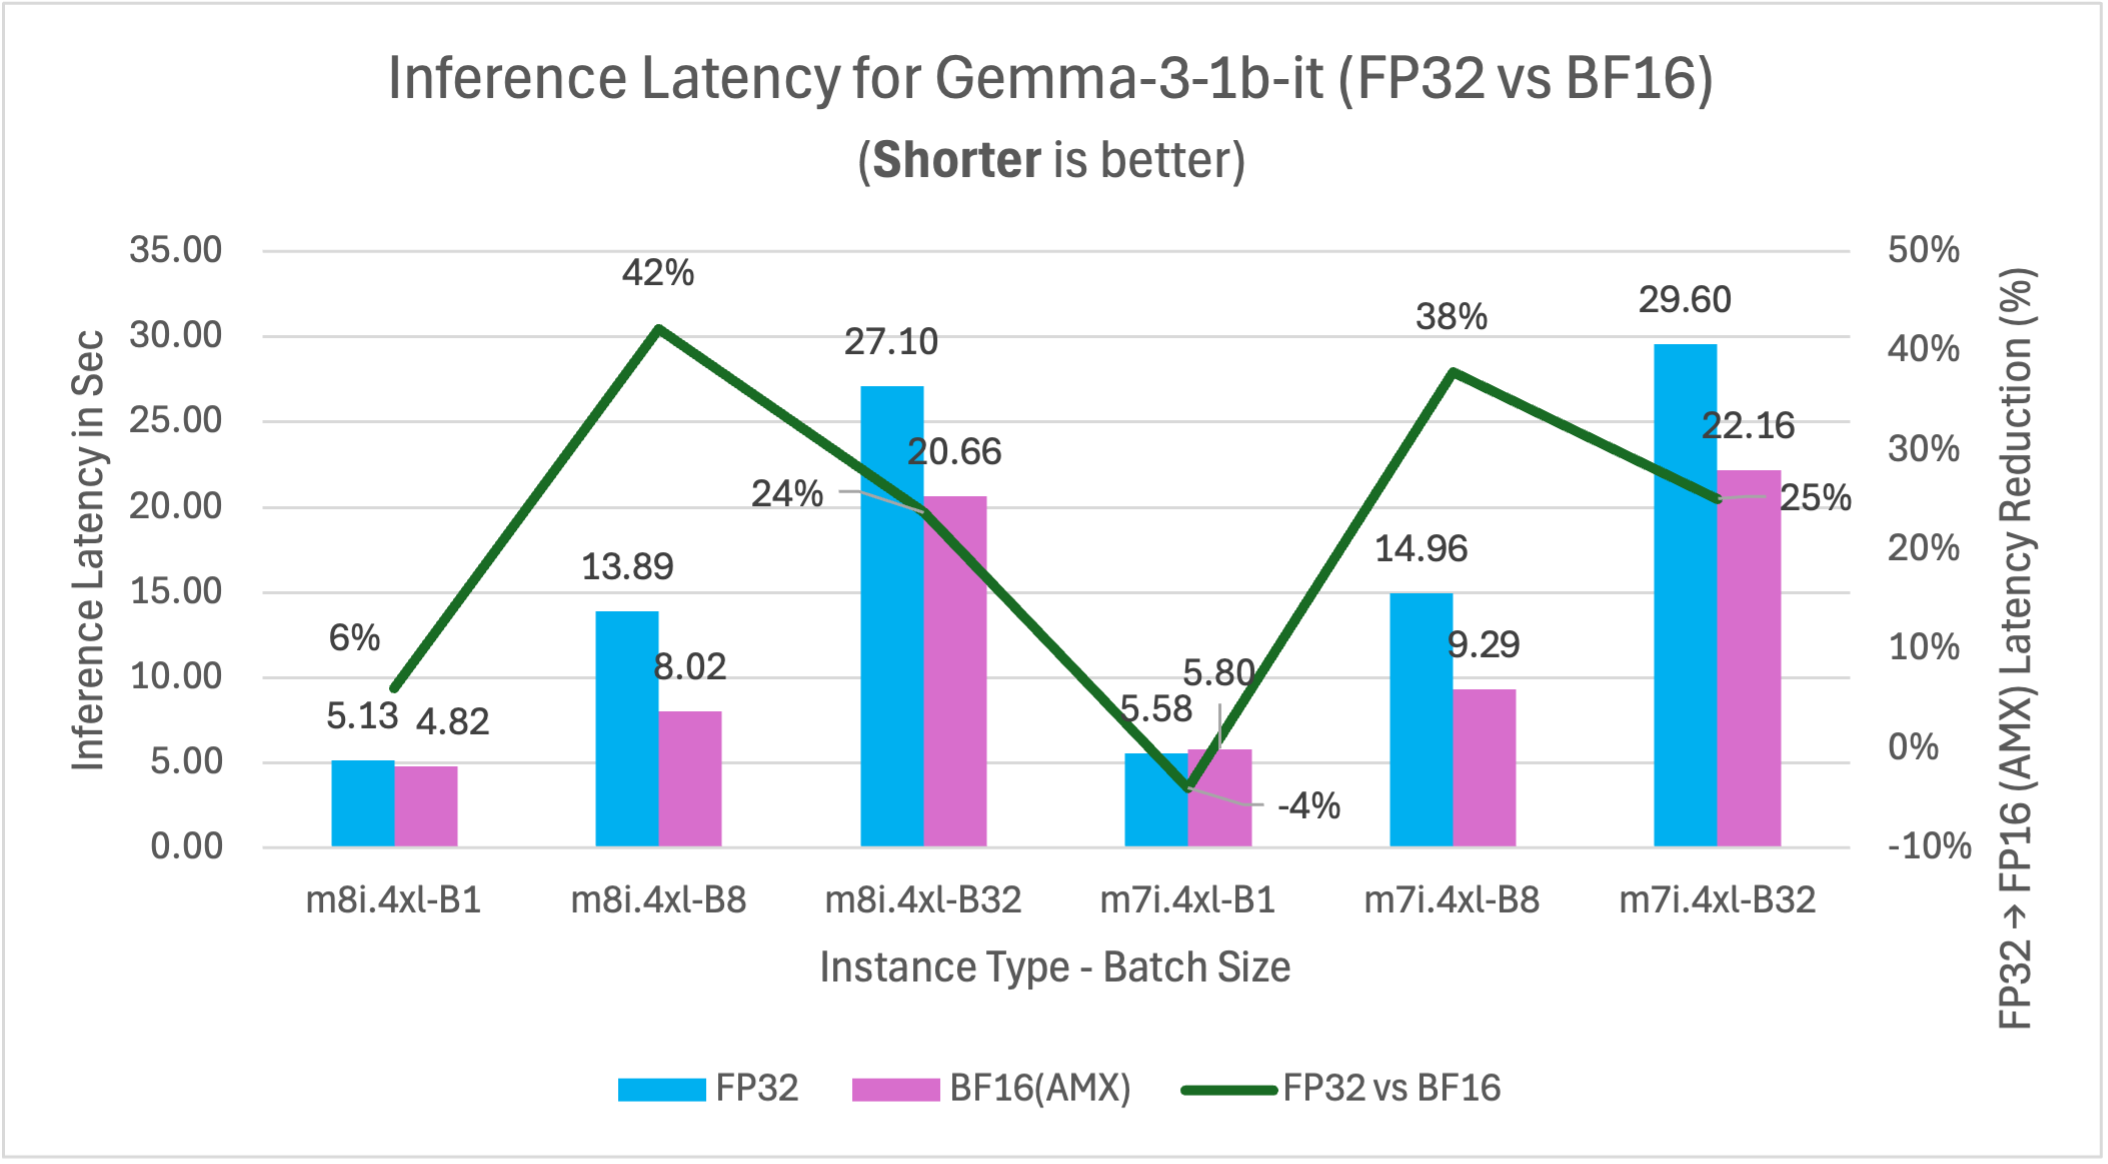
Bar chart comparing inference latency for Gemma-3-1b-it between FP32 and BF16(AMX) data types on m8i.4xlarge and m7i.4xlarge instances at batch sizes 1, 8, and 32, showing BF16(AMX) reduces latency by 24–42% at larger batch sizes but slightly increases latency at m7i.4xlarge batch size 1 (-4%), with the best improvement of 42% on m8i.4xlarge at batch size 8

Figure 10: FP32 vs BF16 inference latency comparison for model Gemma-3-1b-it (1B parameters) on m7i.4xlarge and m8i.4xlarge instances across batch sizes

DeepSeek-R1-Distill-Qwen-1.5B (1.5B) – Reasoning

This benchmark represents reasoning and analytical workloads, including complex decision-making systems, financial analysis, and applications requiring sophisticated logic processing.

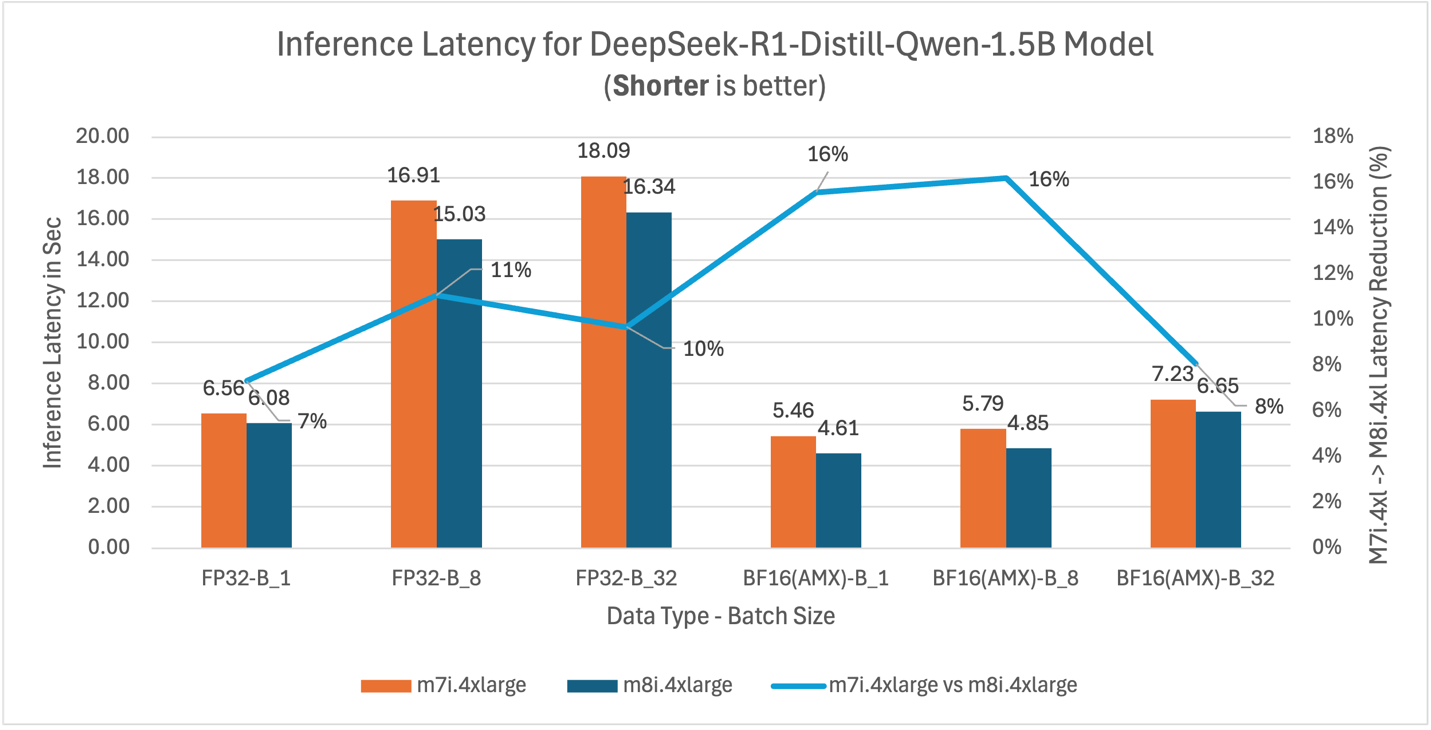
Bar chart comparing inference latency for the DeepSeek-R1-Distill-Qwen-1.5B model between m7i.4xlarge and m8i.4xlarge instances across FP32 and BF16(AMX) data types at batch sizes 1, 8, and 32, showing m8i.4xlarge achieves 7–16% latency reduction, with the largest improvements at BF16(AMX) batch sizes 1 and 8 (both 16%)

Figure 11: m7i.4xlarge vs m8i.4xlarge inference latency comparison for model DeepSeek-R1-Distill-Qwen-1.5B (1.5B parameters)

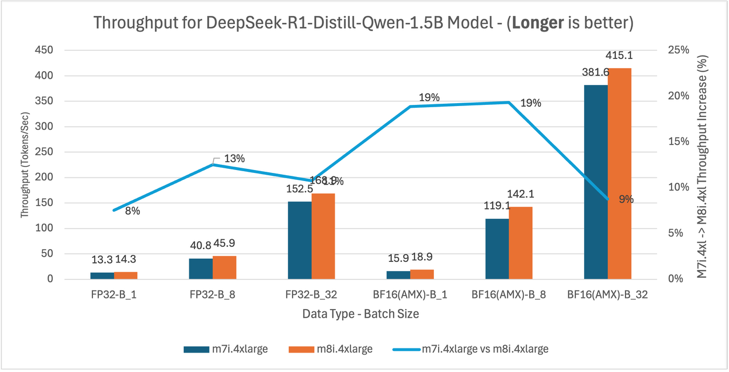
Bar chart comparing throughput for the DeepSeek-R1-Distill-Qwen-1.5B model between m7i.4xlarge and m8i.4xlarge instances across FP32 and BF16(AMX) data types at batch sizes 1, 8, and 32, showing m8i.4xlarge achieves 8–19% higher throughput, with the largest gains at BF16(AMX) batch sizes 1 and 8 (both 19%) and BF16(AMX) batch size 32 reaching the highest overall throughput at 415.1 tokens/sec

Figure 12: m7i.4xlarge vs m8i.4xlarge latency and throughput comparison for DeepSeek-R1-Distill-Qwen-1.5B model across batch sizes 1, 8, and 32

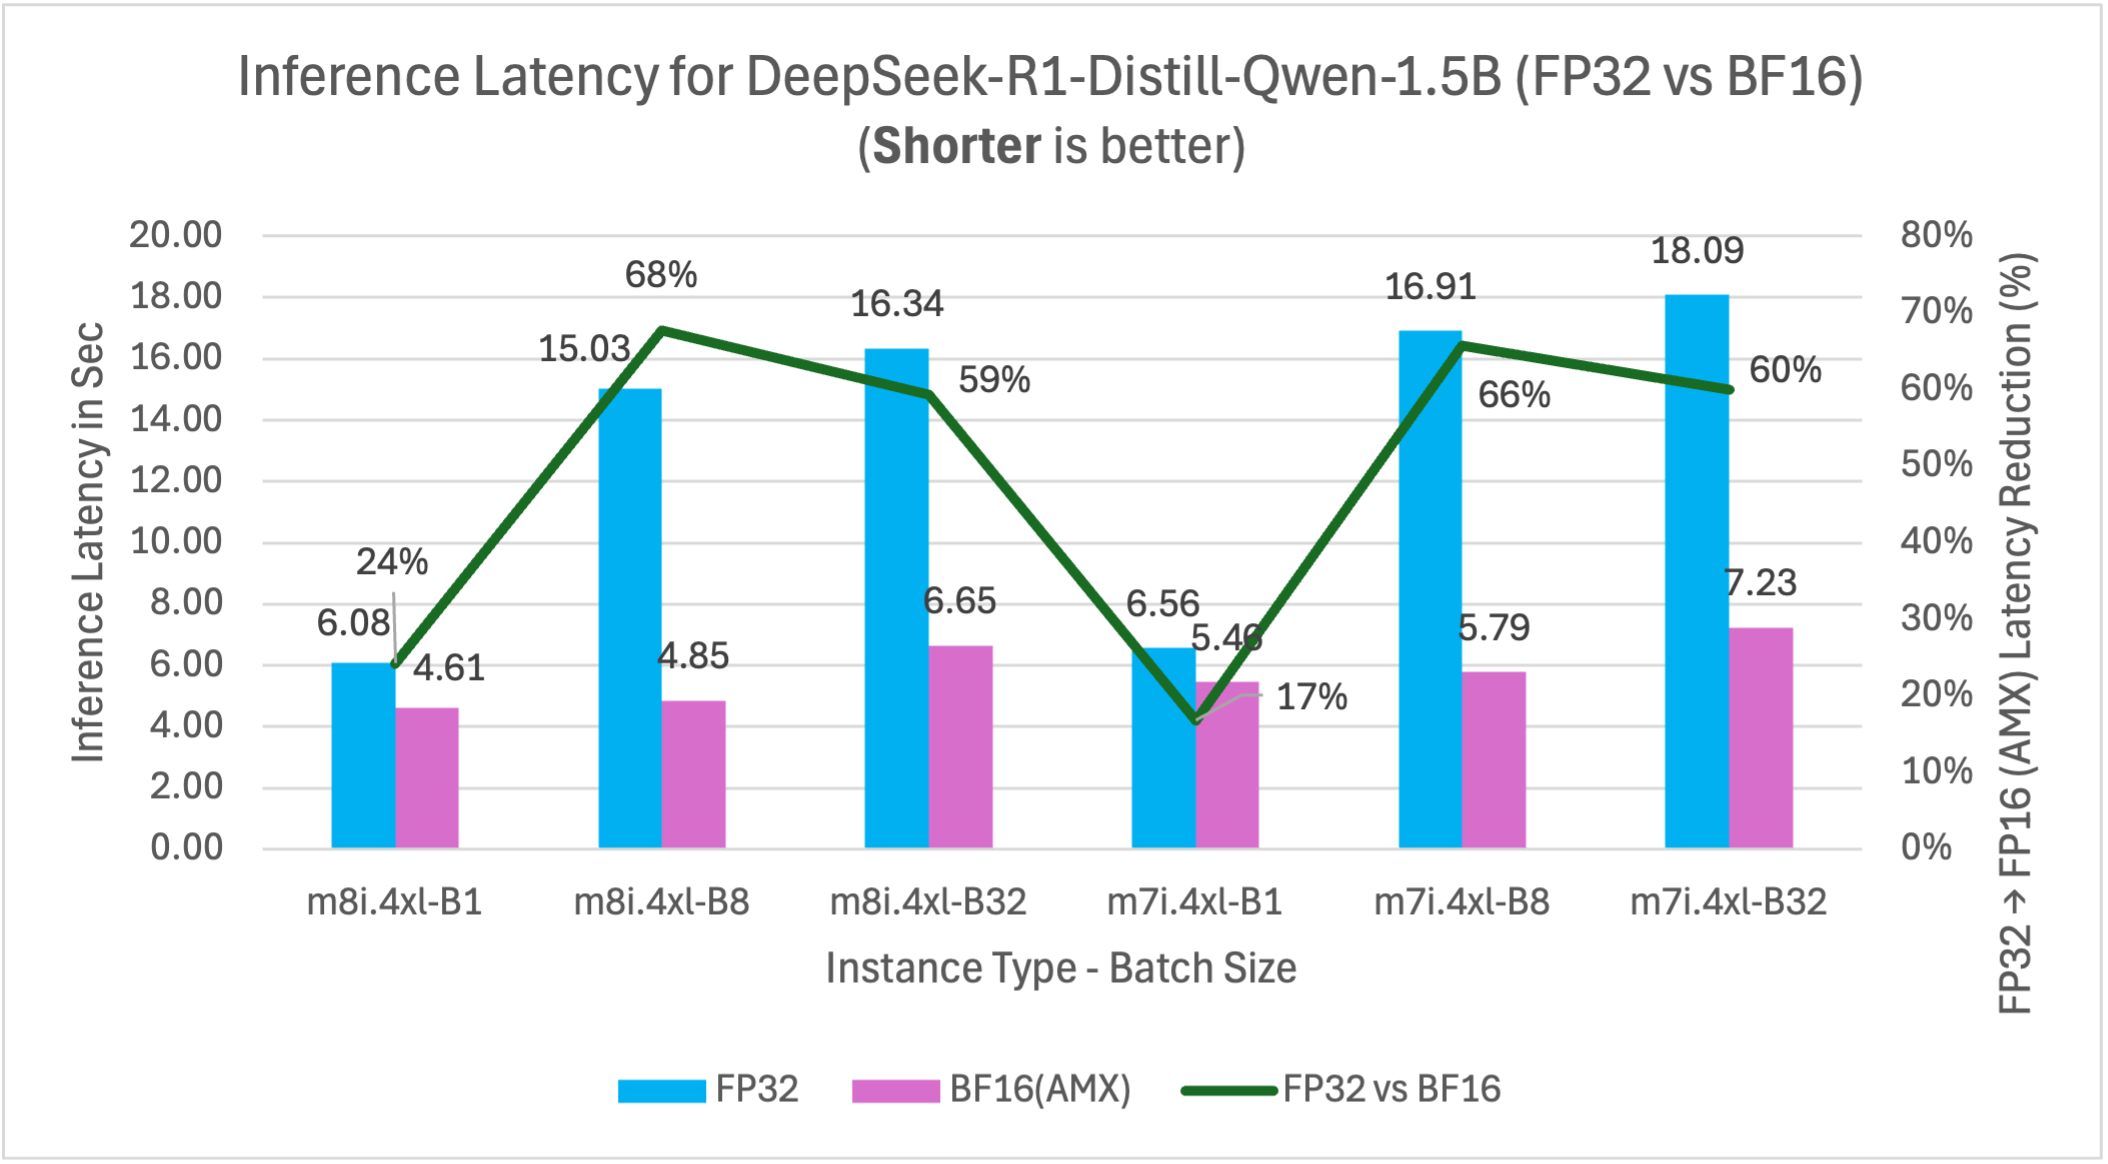
Bar chart comparing inference latency for DeepSeek-R1-Distill-Qwen-1.5B between FP32 and BF16(AMX) data types on m8i.4xlarge and m7i.4xlarge instances at batch sizes 1, 8, and 32, showing BF16(AMX) reduces latency by 17–68% across all configurations, with the largest improvement of 68% on m8i.4xlarge at batch size 8 and consistently strong reductions of 59–66% at larger batch sizes

Figure 13: FP32 vs BF16 inference latency comparison for model DeepSeek-R1-Distill-Qwen-1.5B (1.5B parameters) on m7i.4xlarge and m8i.4xlarge instances across batch sizes

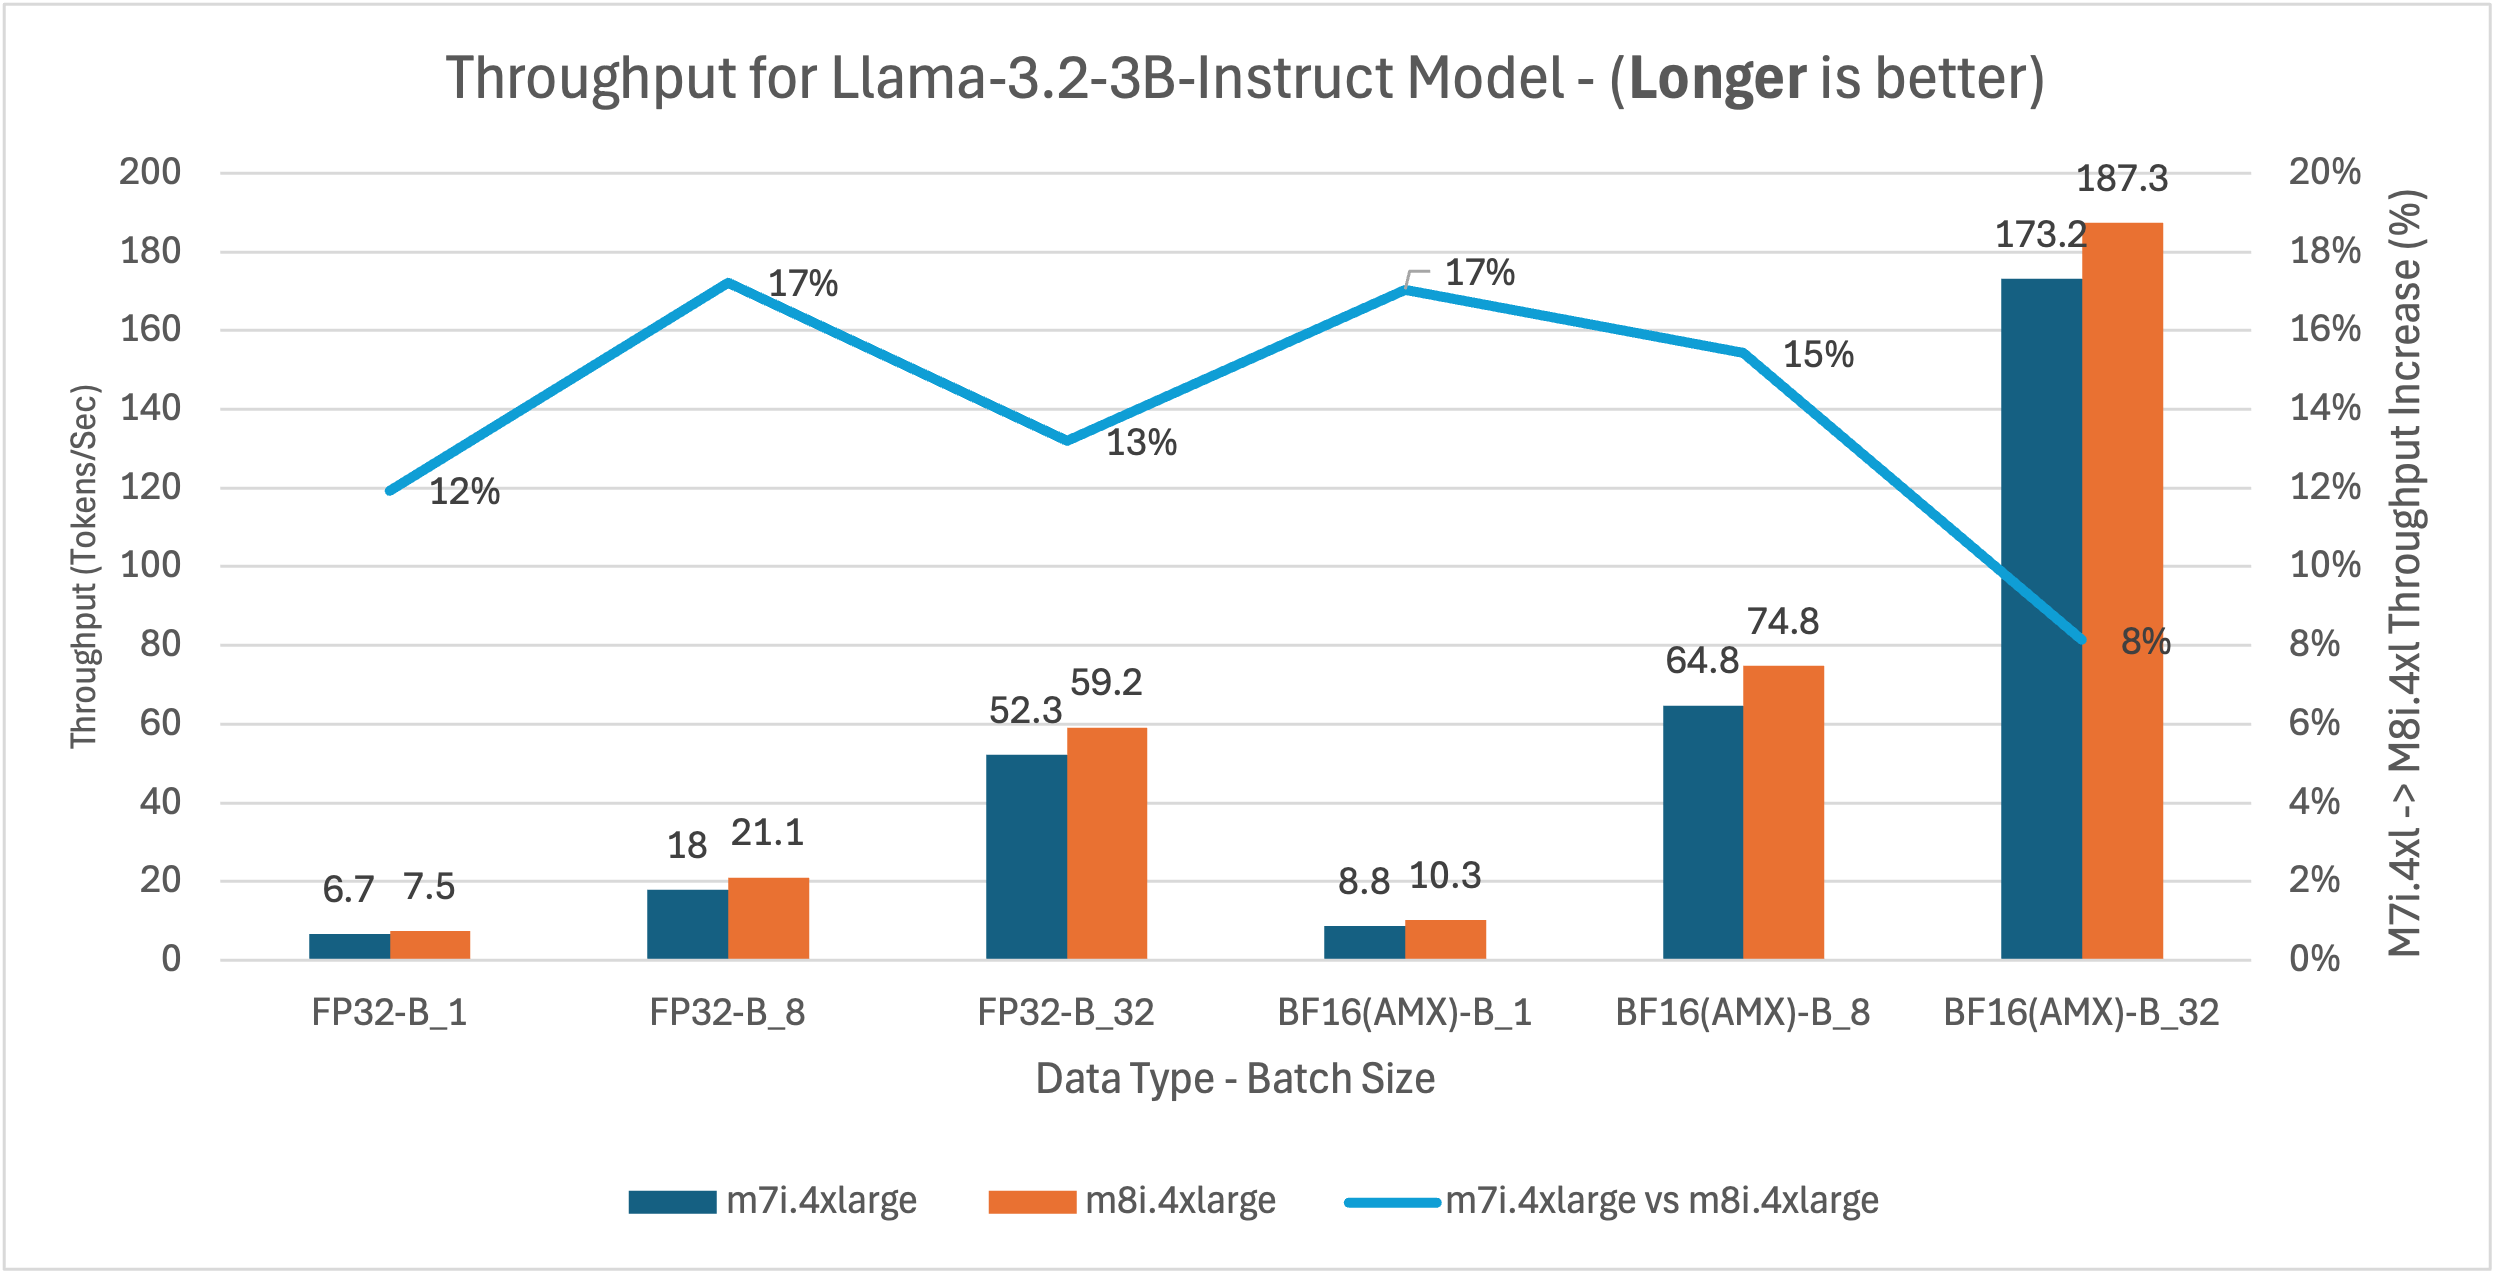
Llama-3.2-3B-Instruct (3B) – Large model

This benchmark represents larger model deployments for complex instruction-following tasks, advanced content generation, and applications requiring higher model capacity while maintaining cost efficiency.

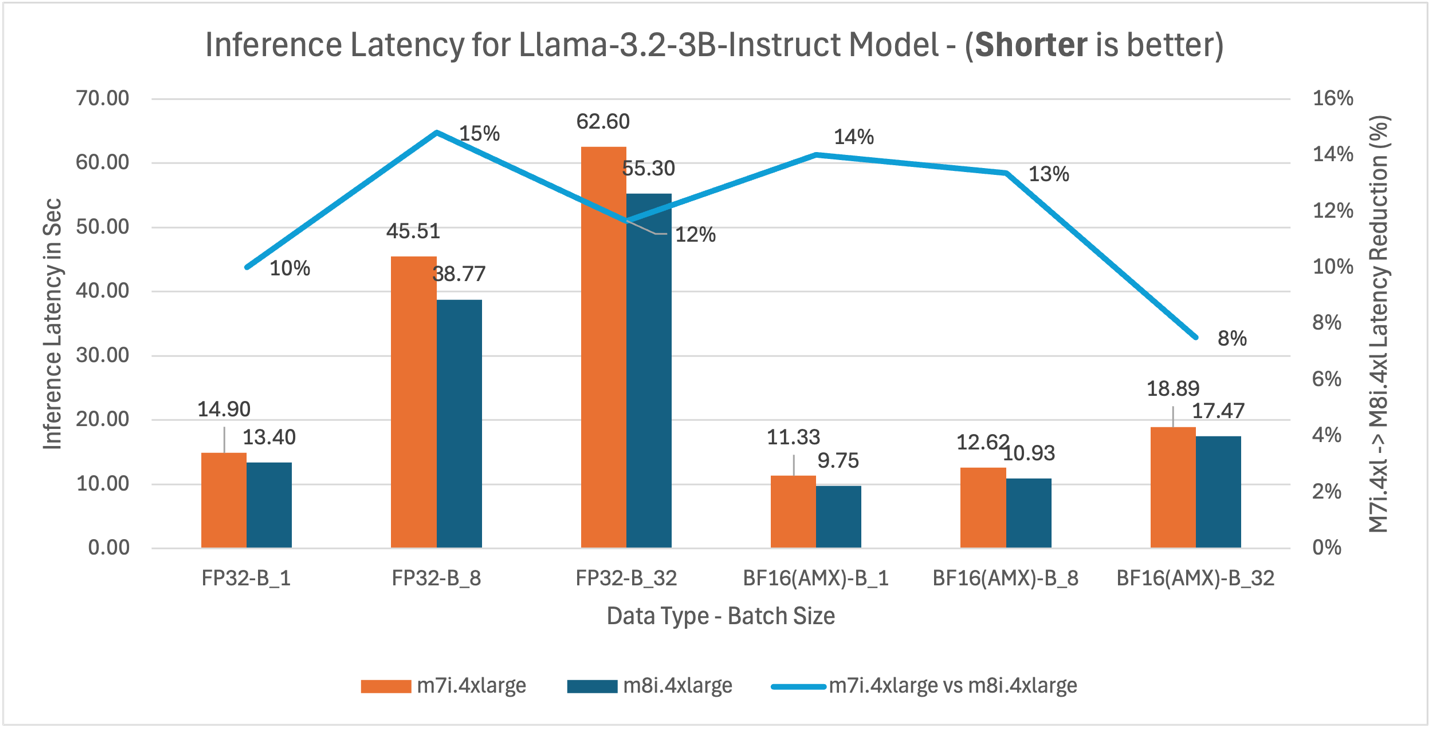
Bar chart comparing inference latency for the Llama-3.2-3B-Instruct model between m7i.4xlarge and m8i.4xlarge instances across FP32 and BF16(AMX) data types at batch sizes 1, 8, and 32, showing m8i.4xlarge achieves 8–15% latency reduction, with the largest improvement at FP32 batch size 8 (15%) and consistent gains of 12–14% with BF16(AMX) at smaller batch sizes

Figure 14: m7i.4xlarge vs m8i.4xlarge inference latency comparison for model Llama-3.2-3B-Instruct (3B parameters)

Bar chart comparing throughput for the Llama-3.2-3B-Instruct model between m7i.4xlarge and m8i.4xlarge instances across FP32 and BF16(AMX) data types at batch sizes 1, 8, and 32, showing m8i.4xlarge achieves 8– 17% higher throughput, with the largest gains at FP32 batch size 8 and BF16(AMX) batch size 1 (both 17%) and BF16(AMX) batch size 32 reaching the highest overall throughput at 187.3 tokens/sec

Figure 15: m7i.4xlarge vs m8i.4xlarge latency and throughput comparison for Llama-3.2-3B-Instruct model across batch sizes 1, 8, and 32

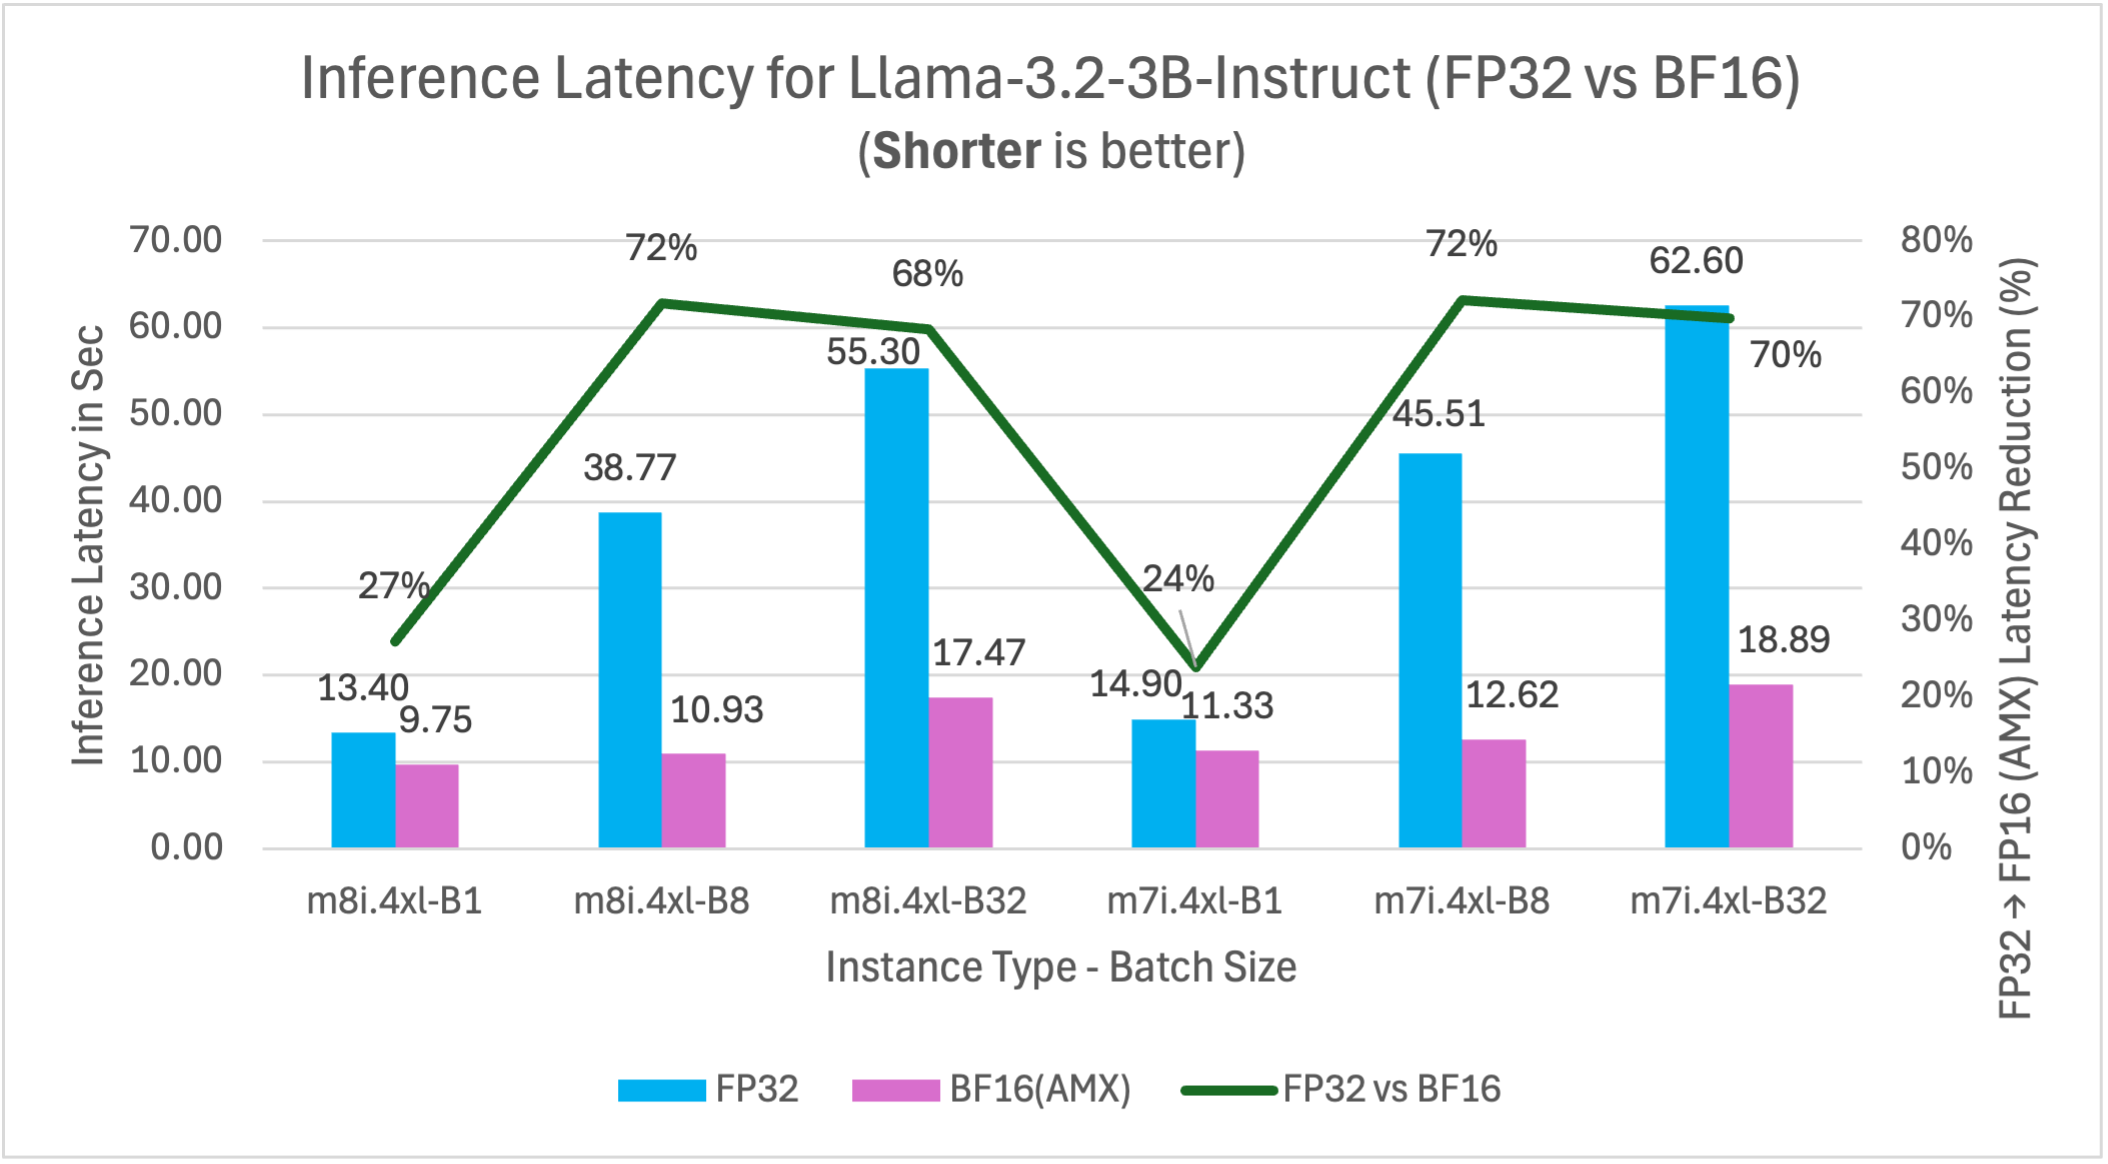
Bar chart comparing inference latency for Llama-3.2-3B-Instruct between FP32 and BF16(AMX) data types on m8i.4xlarge and m7i.4xlarge instances at batch sizes 1, 8, and 32, showing BF16(AMX) reduces latency by 24–72% across all configurations, with the largest improvements of 72% on both m8i.4xlarge batch size 8 and m7i.4xlarge batch size 8, and consistently strong reductions of 68–70% at batch size 32

Figure 16: FP32 vs BF16 inference latency comparison for model Llama-3.2-3B-Instruct (3B parameters) on m7i.4xlarge and m8i.4xlarge instances across batch sizes

Yolov5 – Computer vision model

This benchmark represents computer vision workloads including object detection, image classification, and real-time video processing applications where consistent throughput is important for production deployments.

Instance type Inference latency in Sec (Processing time per image)

Throughput

(Image processed per sec)

FP32 BF16 FP32 BF16
m8i.4xlarge 0.034 0.029 29.23 34.63
m7i.4xlarge 0.038 0.031 26.39 32.28
m8i improvement 10.5% 6.5% 10.8% 7.3%

Key insights: m8i instances deliver 7-11% better performance than m7i across both precision formats. Combining hardware upgrade with AMX optimization, m8i with BF16 delivers up to 24% lower latency and 31% higher throughput compared to m7i with FP32.

Benchmark result summary

The detailed graphs above demonstrate consistent performance patterns across tested models. Key findings:

M8i vs M7i instance performance

m8i instances deliver 9-14% average and up to 20% better performance than m7i across the tested models through hardware advances: up to 4.6x larger L3 cache, higher base frequencies, up to 2.5x higher DDR5 bandwidth, and enhanced AMX execution with FP16 support.

Model Use Case m8i average latency improvement*
BigBird-RoBERTa-large (355M) Document analysis 10%
DialoGPT-large (762M) Conversational AI 14%
Gemma-3-1b-it (1B) General purpose 10%
DeepSeek-R1 (1.5B) Reasoning tasks 11%
Llama-3.2-3B (3B) Large model deployment 12%
YOLOv5 Computer vision 9%

* Average across all tested configurations (FP32 and BF16 at batch sizes 1, 8, and 32)

AMX acceleration impact (FP32 vs BF16)

BF16 precision with AMX delivers 21-72% performance improvements at batch sizes of 8 and above compared to FP32 baseline on the same instance type. These results compare FP32 vs BF16 performance on m8i.4xlarge, with performance gains varying by model size and batch configuration. Larger batch sizes show greater AMX benefits.

Model Latency improvement (%)
Batch 1 Batch 8 Batch 32
BigBird-RoBERTa-large 55 67 63
DialoGPT-large – 44* 21 30
Gemma-3-1b-it 6 42 24
DeepSeek-R1 24 68 59
Llama-3.2-3B 27 72 68

* At batch size 1, DialoGPT-large’s autoregressive decoding generates tokens sequentially, producing many small matrix operations where AMX tile setup overhead exceeds the acceleration benefit. At batch sizes 8 and above, multiple sequences are processed in parallel, creating larger matrix operations that amortize this overhead and deliver 21-30% improvement.

Performance patterns by batch size

Larger models (1B+ parameters) show consistently better AMX performance across the tested batch sizes:

  • Batch size 1: Mixed results – larger models show 6-27% improvement, smaller models may experience AMX overhead
  • Batch size 8: Strong performance gains of 21-72% across the tested models, with larger models showing greater benefits
  • Batch size 32: Significant improvements of 24-68% for most models, demonstrating AMX’s batch processing strength

Batch size optimization guidelines

AMX performance scales with batch size, with optimal range varies by model size. Performance saturates beyond batch 16 due to hardware limits including memory bandwidth and compute bottlenecks.

Model Size Performance Gain Recommended Batch Size Notes
<1B parameters 21-67% 8-32 Batch 1 results vary by architecture*
1-2B parameters 42-68% 4-16 6-24% gains even at batch 1
3B+ parameters 27-72% 1-8 Benefits across batch sizes

* Encoder models (BigBird) show 55% gains at batch 1; autoregressive models (DialoGPT) may experience overhead.

Combined performance benefits

When we combine AMX optimization with 8th generation instances (m8i), the performance improvements compound significantly. For example, Llama-3.2-3B-Instruct running with BF16 AMX on m8i instances can achieve up to 76% better performance compared to FP32 inference on m7i instances at optimal batch sizes (batch 8: m7i FP32 45.51s vs m8i BF16 10.93s = 76% improvement; batch 32: m7i FP32 62.60s vs m8i BF16 17.47s = 72% improvement).

Throughput scaling

Across the tested models, throughput (tokens/sec) increases proportionally with latency reduction. This consistent relationship demonstrates that AMX optimizations translate directly to improved inference efficiency.

Price-Performance Analysis: Gemma-3-1b-it Model

While m8i.4xlarge instances are priced slightly higher than m7i.4xlarge ($0.847 vs $0.806 per hour in us-west-2), they deliver superior price-performance. To illustrate the economic benefits, we analyzed cost per 1 million tokens using Gemma-3-1b-it as a representative example. M8i delivers up to 13% better price-performance over m7i through hardware generation advances, with both instances running BF16 AMX.

Batch Size Data Type m7i.4xlarge m8i.4xlarge Price-Performance improvement
Throughput
(tokens/sec)
$ per 1M token Throughput
(tokens/sec)
$ per 1M token
1 BF16(AMX) 14.3 $15.66 17.2 $13.67 13%
8 BF16(AMX) 71 $3.16 82.3 $2.86 9%
32 BF16(AMX) 119.1 $1.88 127.8 $1.84 2%

Combining the hardware upgrade with BF16 AMX optimization delivers up to 44% better price-performance compared to FP32 on m7i.

Batch Size m8i.4xlarge m7i.4xlarge


Price-Performance improvement

Data Type Throughput
(tokens/sec)
$ per 1M token Data Type Throughput
(tokens/sec)
$ per 1M token
1 BF16(AMX) 17.2 $13.67 FP32 14.9 $15.03 9%
8 BF16(AMX) 82.3 $2.86 FP32 44.1 $5.08 44%
32 BF16(AMX) 127.8 $1.84 FP32 89.2 $2.51 27%

Key findings from the price-performance analysis:

  • Combined optimization delivers up to 44% better price-performance: m8i with AMX and BF16 outperforms m7i with FP32 at batch size 8 – consistent with our batch size optimization guidelines where batch sizes of 4-16 deliver optimal results for 1B models like Gemma-3-1b-it, achieving $2.86 per 1M tokens for applications like chatbots and fraud detection.
  • Larger batches maximize cost efficiency: Batch size 32 reduces costs further to $1.84 per 1M tokens, a 27% improvement over m7i FP32 – ideal for throughput-oriented workloads like content summarization and recommendation systems where latency requirements are flexible.

Production deployment recommendation

  • BF16 AMX: Delivers 21-72% performance improvements at recommended batch sizes while maintaining model accuracy, making it suitable for production workloads including fraud detection systems, content moderation, and real-time recommendation engines
  • Batch processing: Target batch sizes of 4-16 based on your use case – smaller batches (1-4) for latency-sensitive applications like chatbots, larger batches (8-16) for throughput-focused scenarios like document analysis and offline processing
  • Instance selection: m8i instances provide consistent 9-14% performance improvements over m7i, delivering immediate ROI for existing CPU inference workloads without requiring application changes
  • Model size consideration: Larger models (1B+ parameters) show better AMX utilization across batch sizes, making them ideal candidates for m8i deployment in complex reasoning and content generation applications

Conclusion and next steps

By using Intel AMX on Amazon EC2 8th generation instances, you can achieve substantial performance improvements for AI inference workloads. Our benchmarks demonstrate up to 72% performance improvements across popular language models, making CPU inference more competitive for batch processing, real-time applications, recommender systems, and variable demand workloads while delivering substantial cost savings through improved resource utilization.

Key takeaways:

  • BF16 AMX optimization delivers up to 72% performance improvements across model sizes, with batch 8 showing 21-72% gains and batch 32 showing 24-68% gains
  • Batch sizes of 4-8 provide optimal performance for most models—DialoGPT achieves 21% improvement in latency at batch 8, while Llama-3.2-3B achieves 72% improvement
  • 8th generation instances deliver up to 14% performance improvements over m7i across the tested workloads
  • Combined optimizations (m8i + BF16 AMX) can achieve compound performance improvements up to 76% in optimal configurations (vs m7i FP32), making CPU inference highly competitive for cost-sensitive applications
  • M8i instances deliver up to 13% better price-performance vs m7i (lower cost per 1M tokens), based on our analysis of the Gemma-3-1b-it model
  • Proper environment configuration is critical for AMX activation

You can implement these optimizations immediately. AMX hardware acceleration combined with PyTorch’s Intel-specific enhancements requires configuring environment variables while delivering substantial speed gains. Begin with BF16 optimization on your existing models, then explore INT8 quantization for additional gains.

Next steps:

  1. Launch an Intel based Amazon EC2 8th generation instance (m8i.4xlarge)
  2. Install PyTorch (includes built-in Intel optimizations)
  3. Configure AMX environment variables
  4. Measure performance improvements
  5. Scale your optimized inference workloads

Additional resources

Introducing OpenClaw on Amazon Lightsail to run your autonomous private AI agents

Post Syndicated from Channy Yun (윤석찬) original https://aws.amazon.com/blogs/aws/introducing-openclaw-on-amazon-lightsail-to-run-your-autonomous-private-ai-agents/

Today, we’re announcing the general availability of OpenClaw on Amazon Lightsail to launch OpenClaw instance, pairing your browser, enabling AI capabilities, and optionally connecting messaging channels. Your Lightsail OpenClaw instance is pre-configured with Amazon Bedrock as the default AI model provider. Once you complete setup, you can start chatting with your AI assistant immediately — no additional configuration required.

OpenClaw is an open-source self-hosted autonomous private AI agent that acts as a personal digital assistant by running directly on your computer. You can AI agents on OpenClaw through your browser to connect to messaging apps like WhatsApp, Discord, or Telegram to perform tasks such as managing emails, browsing the web, and organizing files, rather than just answering questions.

AWS customers have asked if they can run OpenClaw on AWS. Some of them blogged about running OpenClaw on Amazon EC2 instances. As someone who has experienced installing OpenClaw directly on my home device, I learned that this is not easy and that there are many security considerations.

So, let me introduce how to launch a pre-configured OpenClaw instance on Amazon Lightsail more easily and run it securely.

OpenClaw on Amazon Lightsail in action
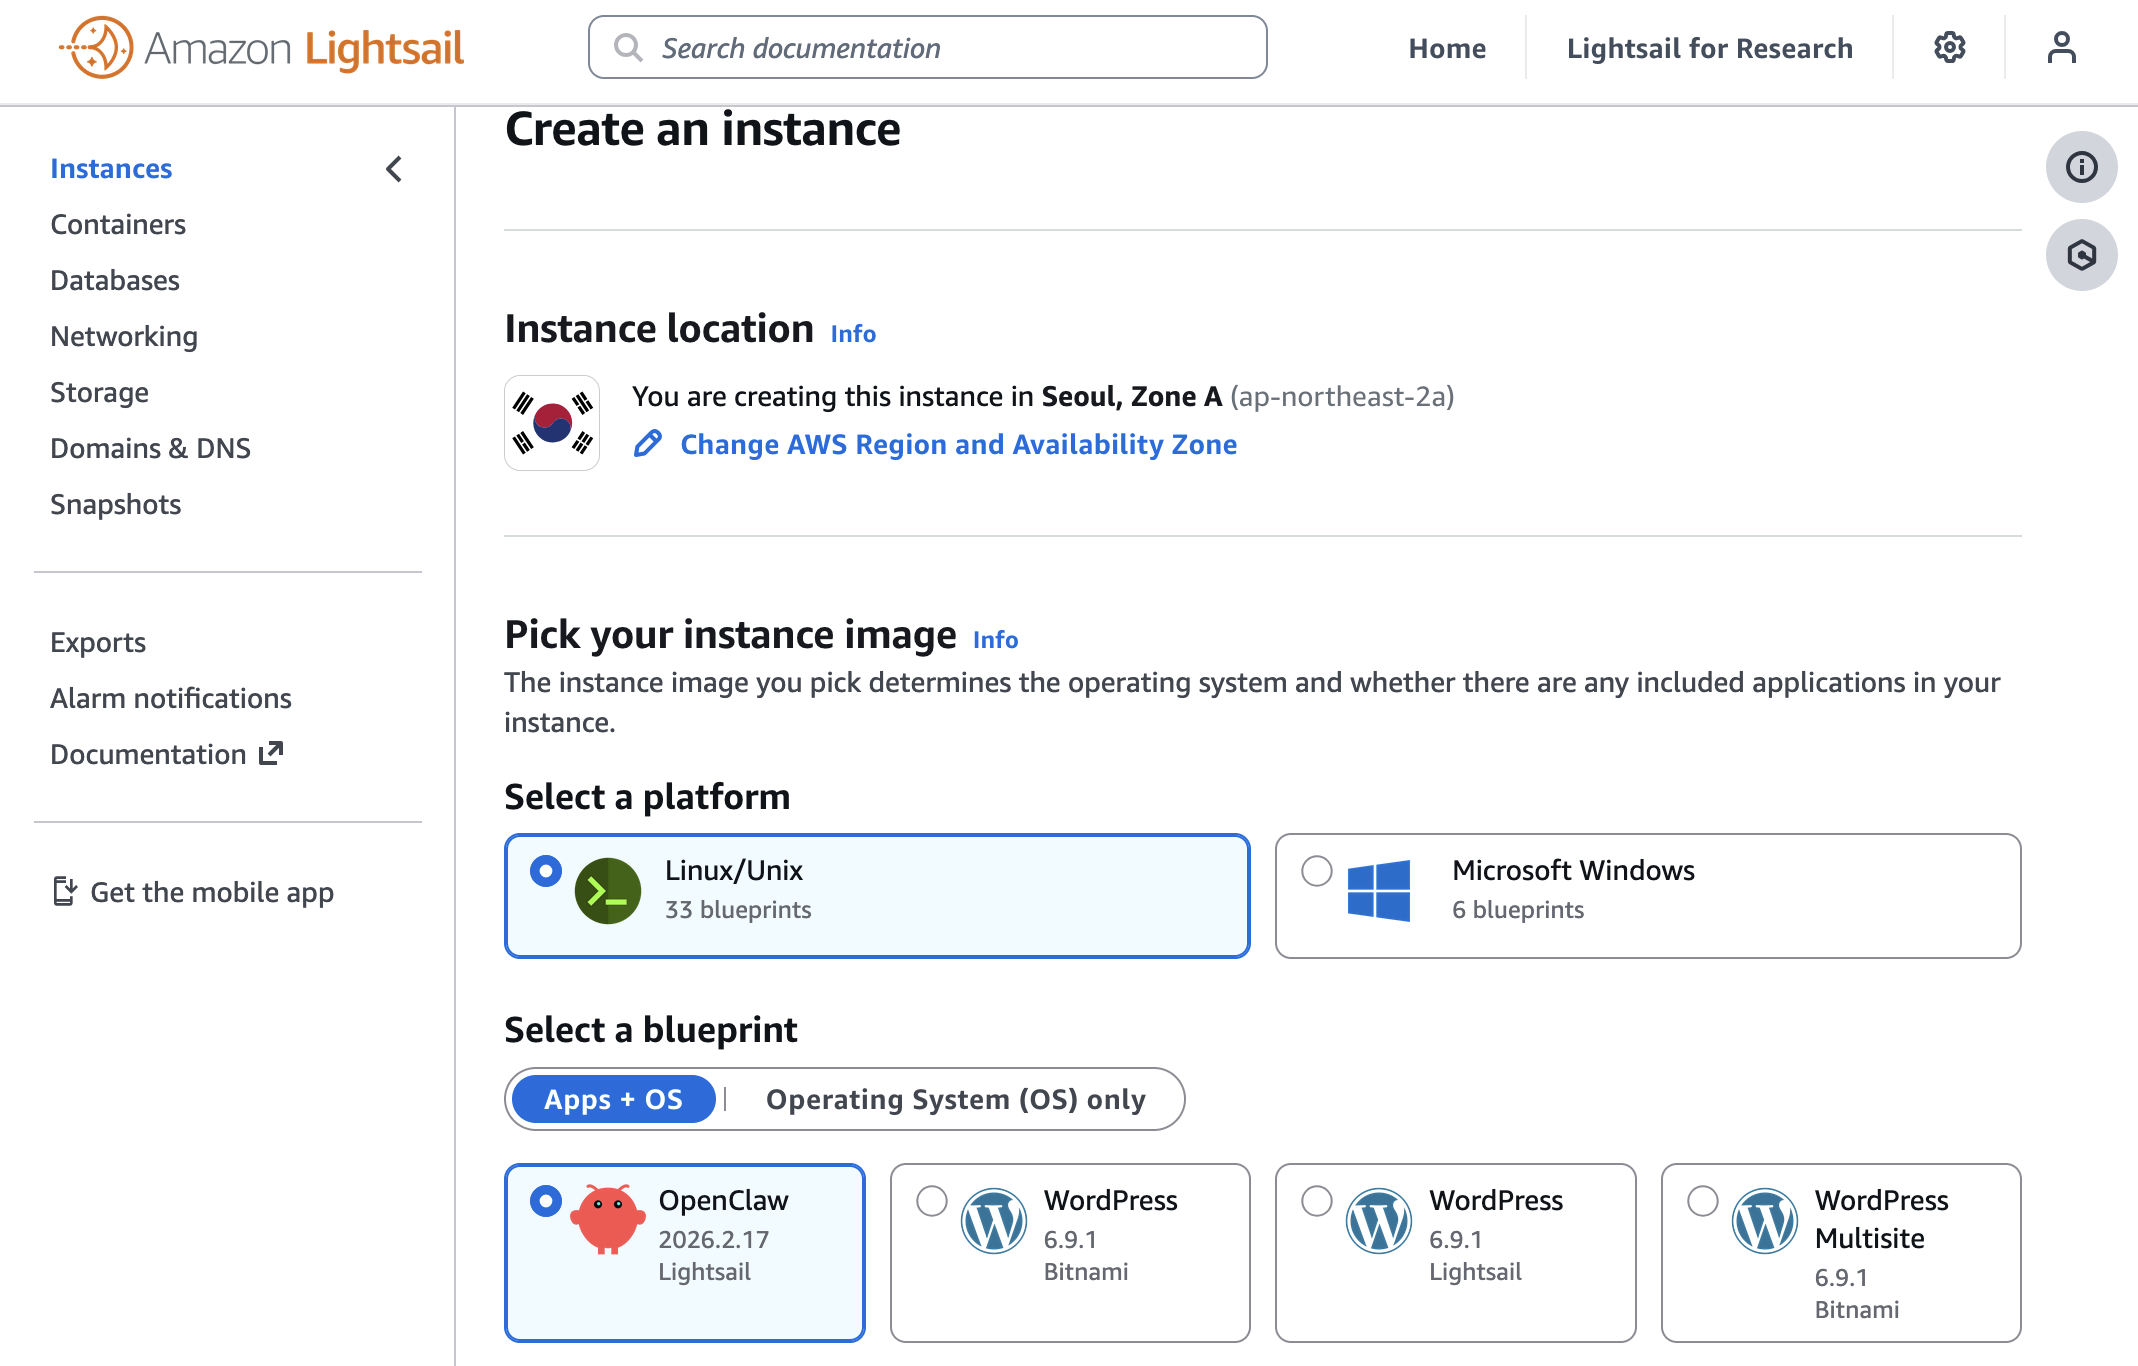
To get started, go to the Amazon Lightsail console and choose Create instance on the Instances section. After choosing your preferred AWS Region and Availability Zone, Linux/Unix platform to run your instance, choose OpenClaw under Select a blueprint.

You can choose your instance plan (4 GB memory plan is recommended for optimal performance) and enter a name for your instance. Finally choose Create instance. Your instance will be in a Running state in a few minutes.

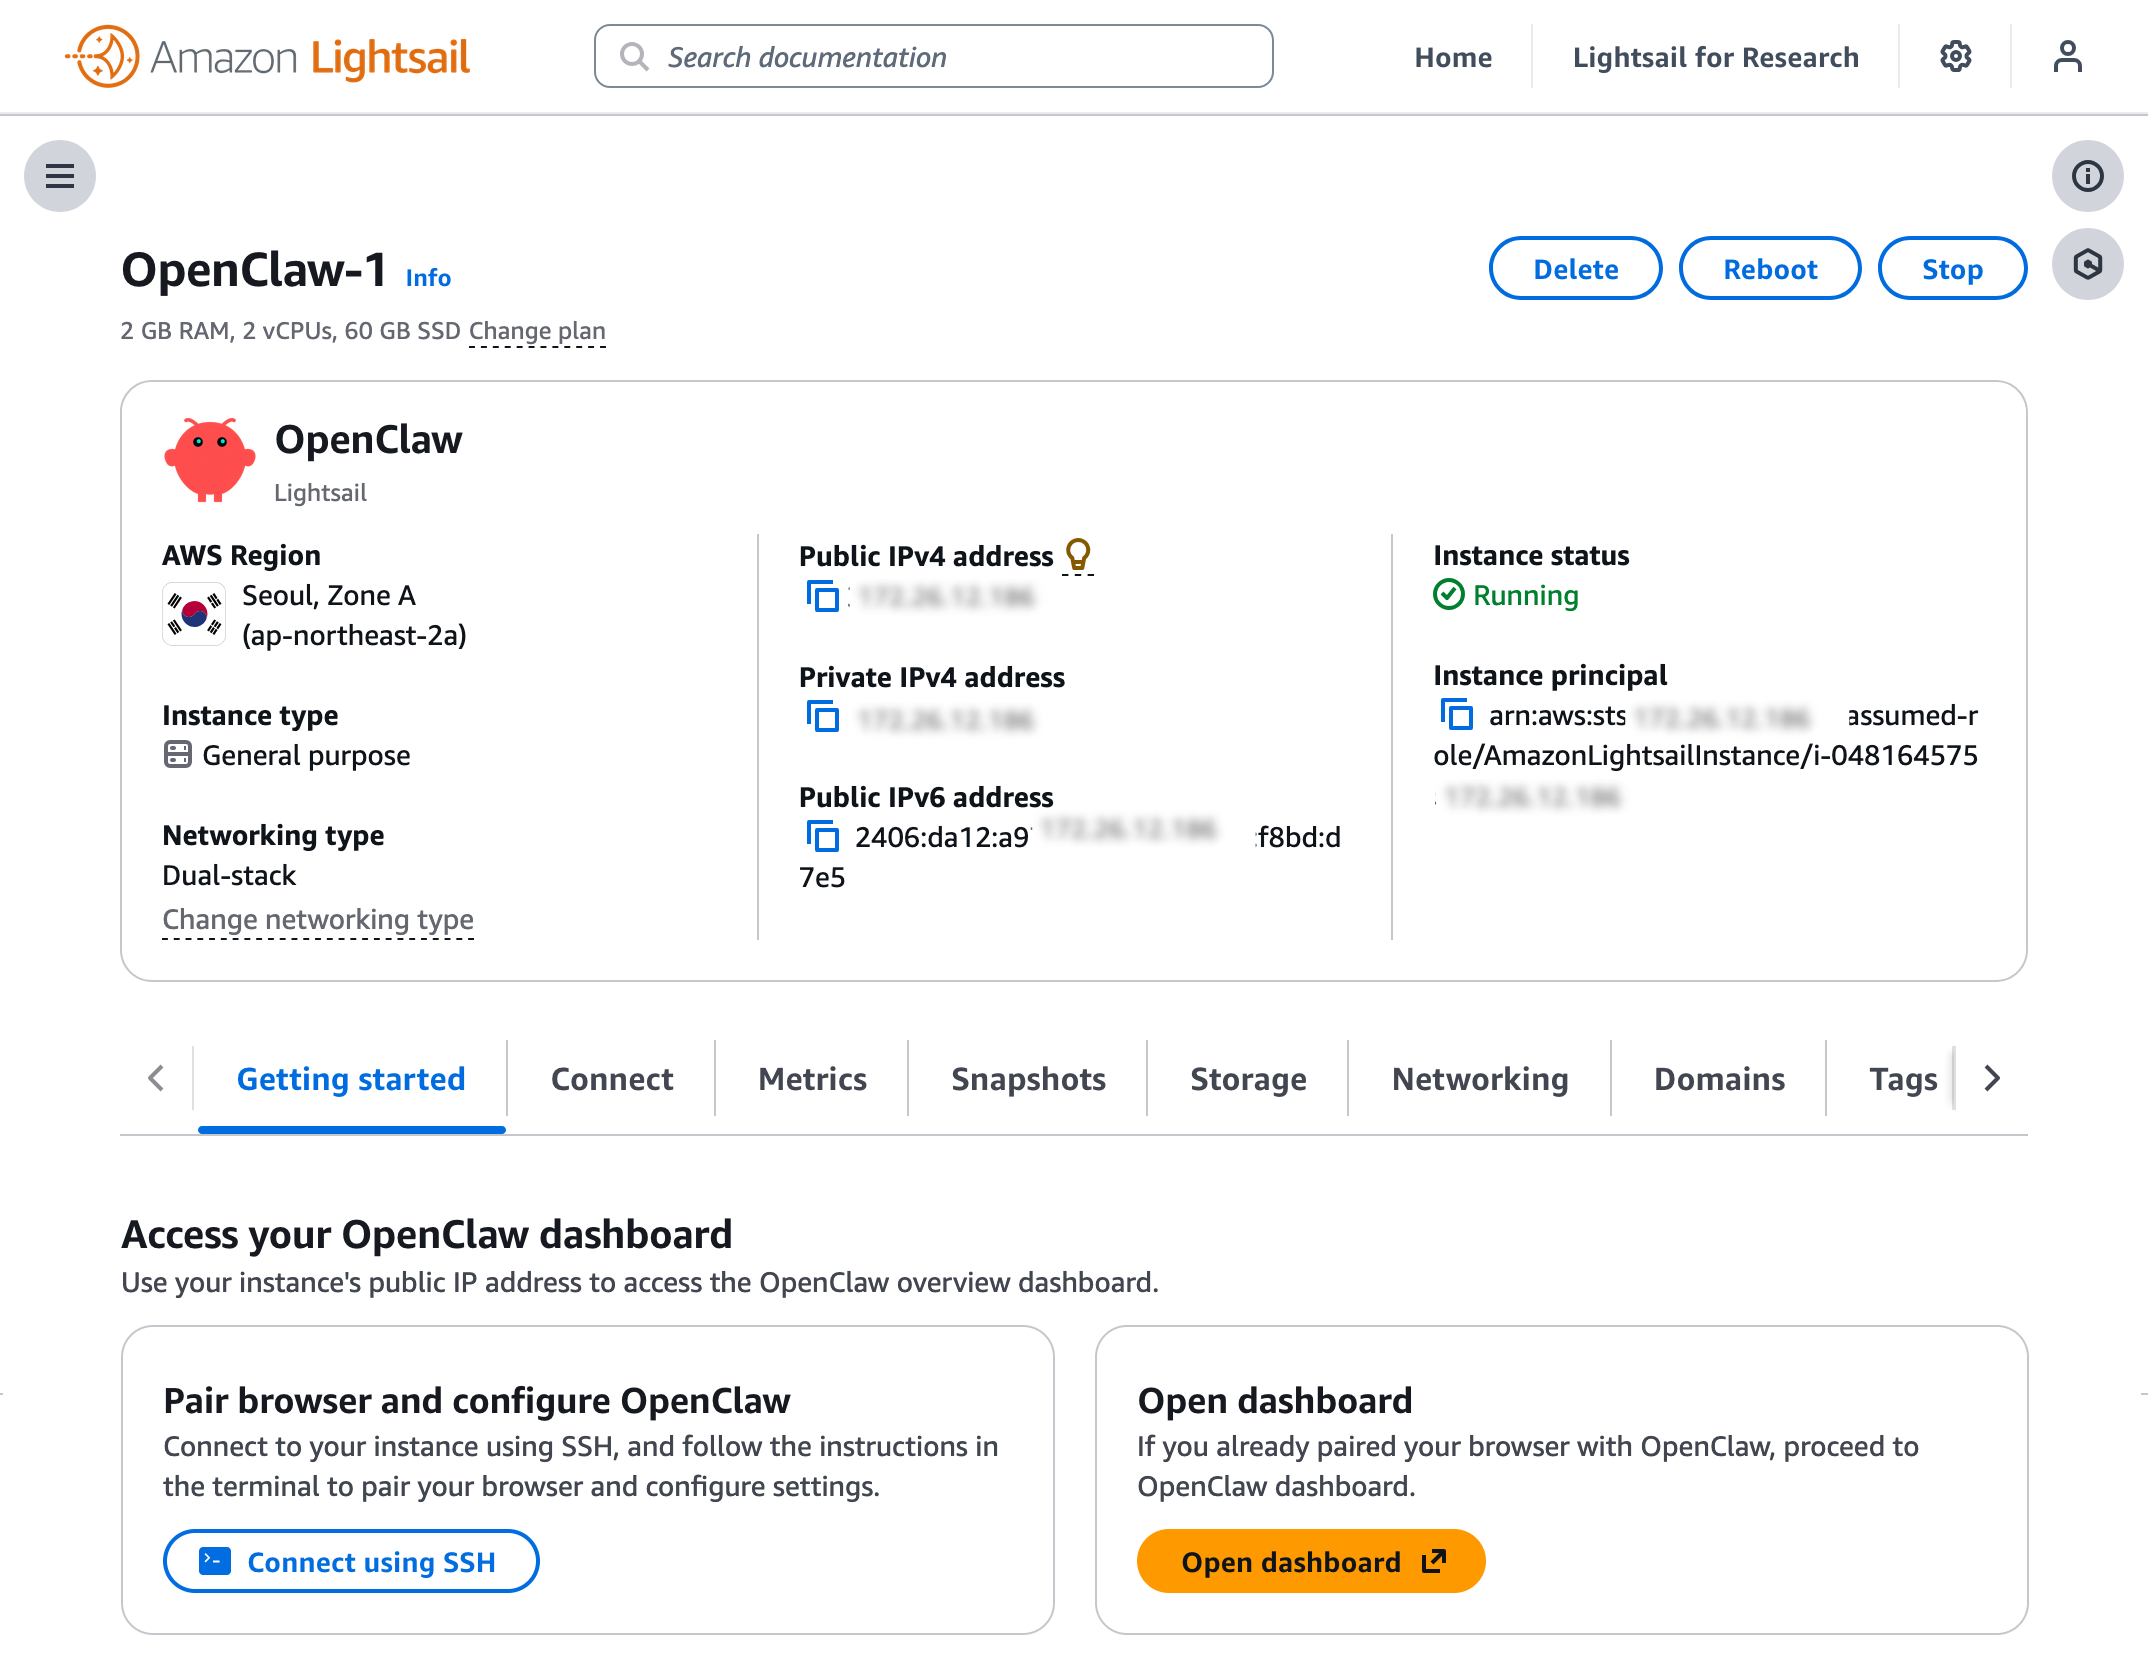
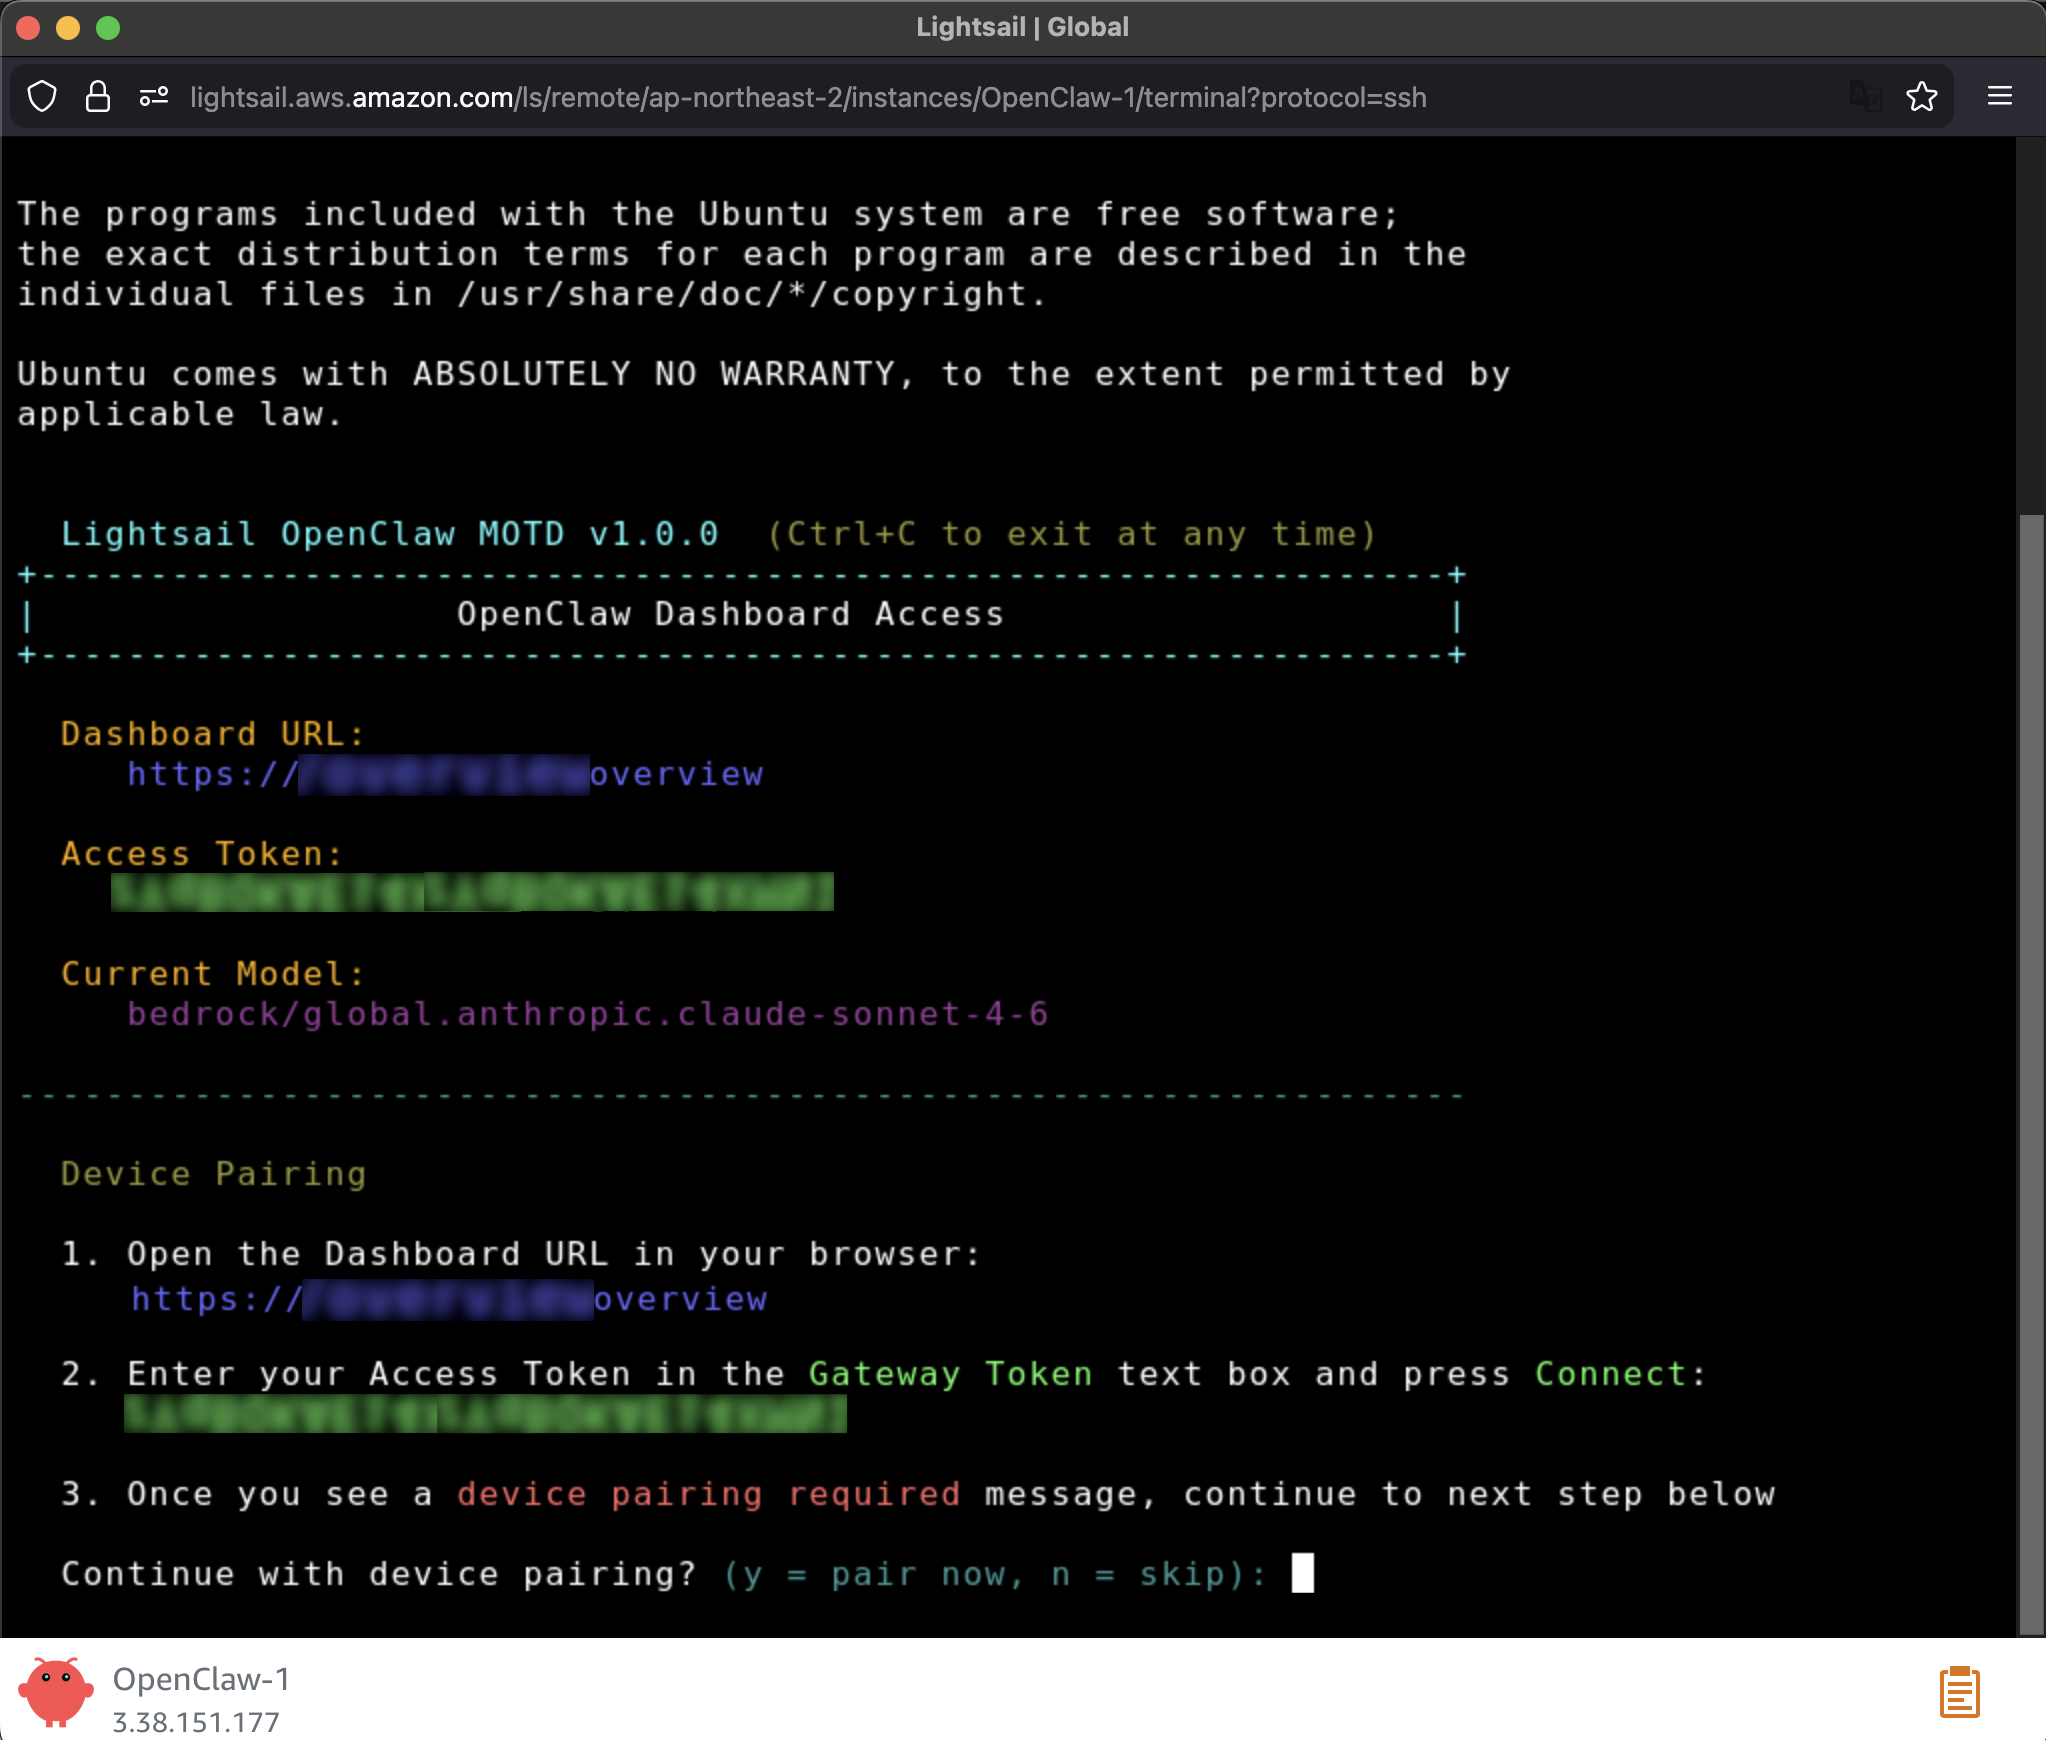
Before you can use the OpenClaw dashboard, you should pair your browser with OpenClaw. This creates a secure connection between your browser session and OpenClaw. To pair your browser with OpenClaw, choose Connect using SSH in the Getting started tab.

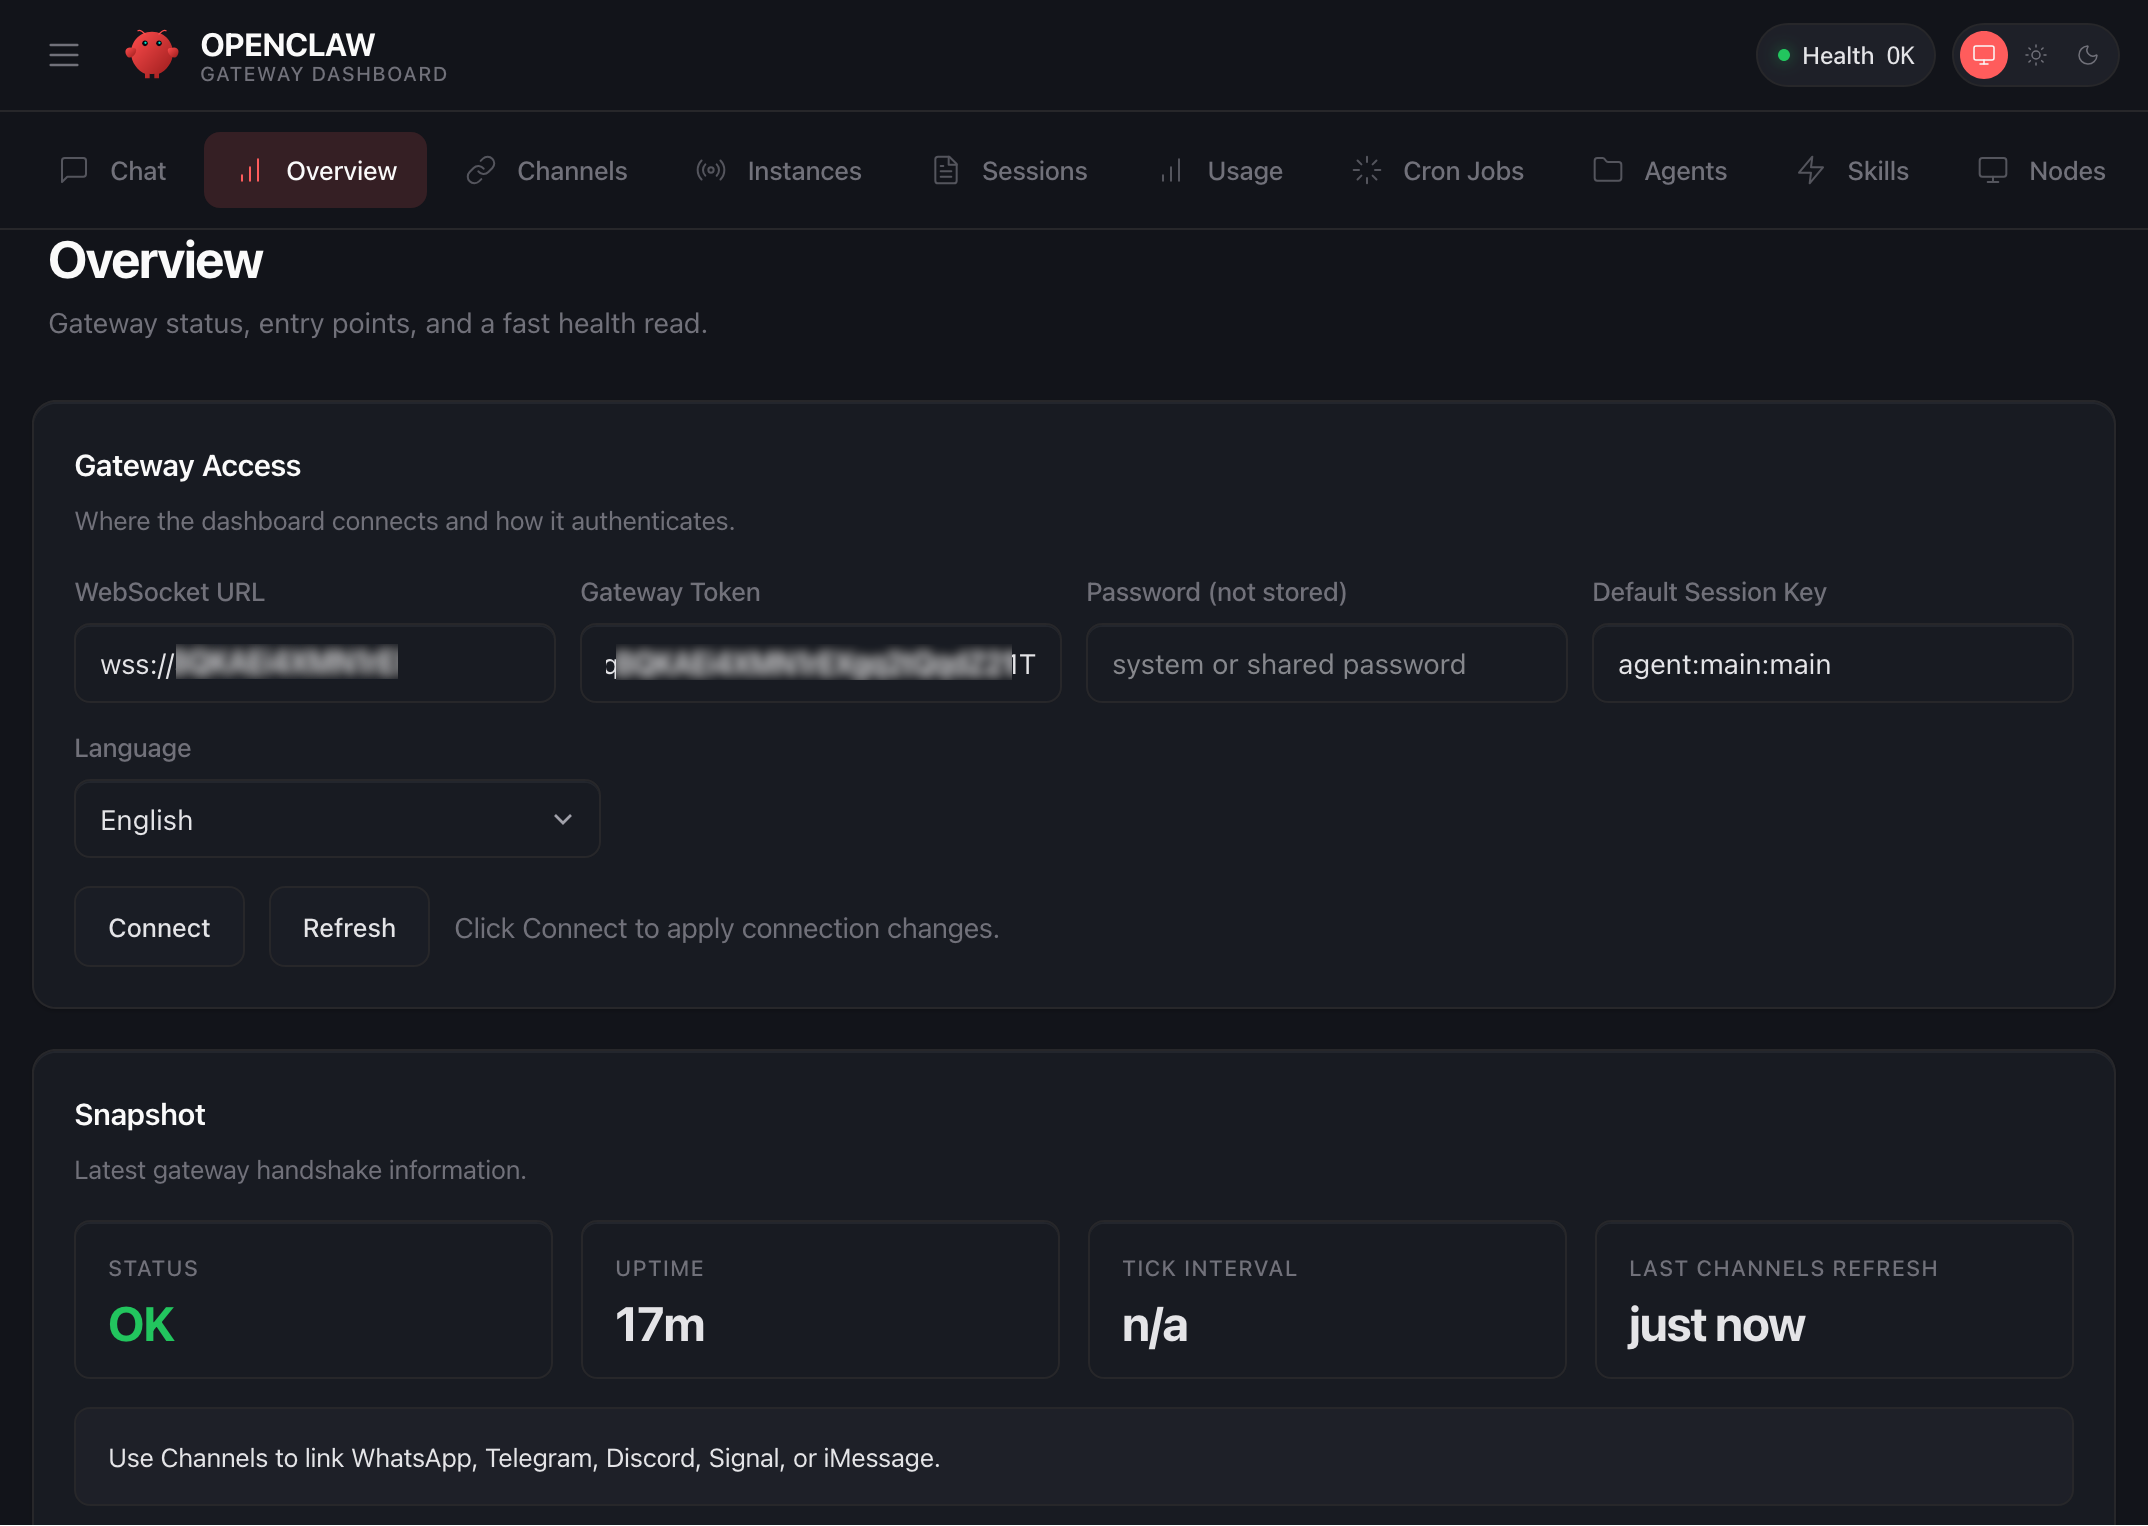
When a browser-based SSH terminal opens, you can see the dashboard URL, security credentials displayed in the welcome message. Copy them and open the dashboard in a new browser tab. In the OpenClaw dashboard, you can paste the copied access token into the Gateway Token field in the OpenClaw dashboard.

When prompted, press y to continue and a to approve with device pairing in the SSH terminal. When pairing is complete, you can see the OK status in the OpenClaw dashboard and your browser is now connected to your OpenClaw instance.

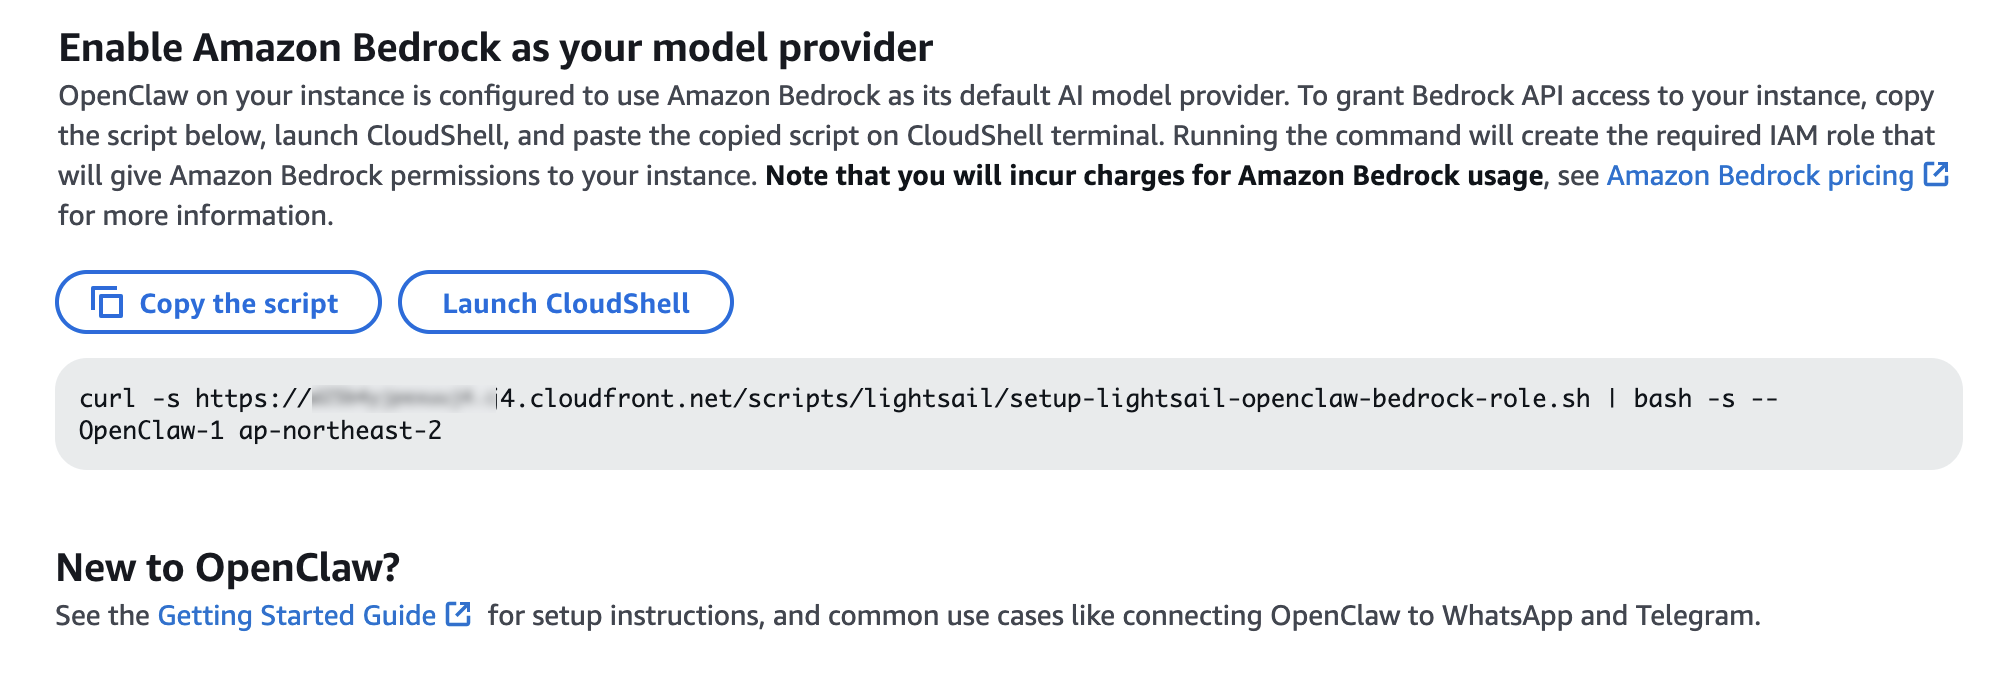
Your OpenClaw instance on Lightsail is configured to use Amazon Bedrock to power its AI assistant. To enable Bedrock API access, copy the script in the Getting started tab and run copied script into the AWS CloudShell terminal.

Once the script is complete, go to Chat in the OpenClaw dashboard to start using your AI assistant!

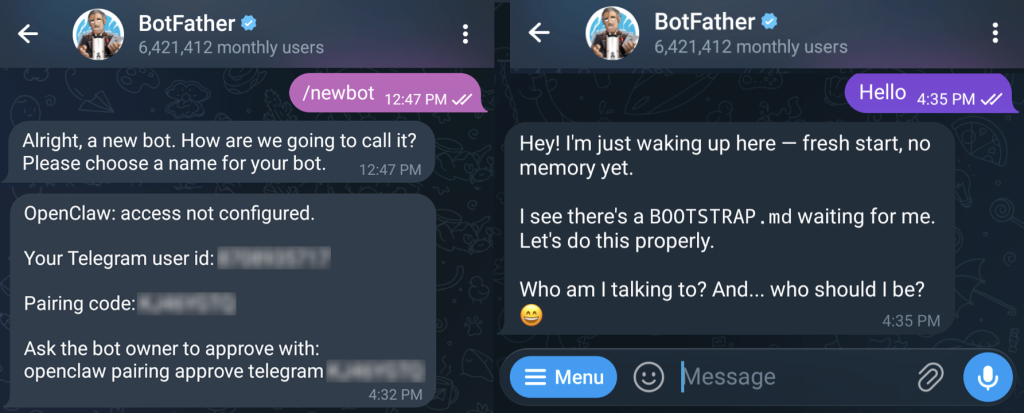
You can set up OpenClaw to work with messaging apps like Telegram and WhatsApp for interacting with your AI assistant directly from your phone or messaging client. To learn more, visit Get started with OpenClaw on Lightsail in the Amazon Lightsail User Guide.

Things to know
Here are key considerations to know about this feature:

  • Permission — You can customize AWS IAM permissions granted to your OpenClaw instance. The setup script creates an IAM role with a policy that grants access to Amazon Bedrock. You can customize this policy at any time. But, you should be careful when modifying permissions because it may prevent OpenClaw from generating AI responses. To learn more, visit AWS IAM policies in the AWS documentation
  • Cost — You pay for the instance plan you selected on an on-demand hourly rate only for what you use. Every message sent to and received from the OpenClaw assistant is processed through Amazon Bedrock using a token-based pricing model. If you select a third-party model distributed through AWS Marketplace such as Anthropic Claude or Cohere, there may be additional software fees on top of the per-token cost.
  • Security — Running a personal AI agent on OpenClaw is powerful, but it may cause security threat if you are careless. I recommend to hide your OpenClaw gateway never to expose it to open internet. The gateway auth token is your password, so rotate it often and store it in your envirnment file not hardcoded in config file. To learn more about security tips, visit Security on OpenClaw gateway.

Now available
OpenClaw on Amazon Lightsail is now available in all AWS commercial Regions where Amazon Lightsail is available. For Regional availability and a future roadmap, visit the AWS Capabilities by Region.

Give a try in the Lightsail console and send feedback to AWS re:Post for Amazon Lightsail or through your usual AWS support contacts.

– Channy

Claude Code Security and the AI Market Reaction: What Security Leaders should Actually Focus on

Post Syndicated from Laura Ellis original https://www.rapid7.com/blog/post/ai-claude-code-security-market-reaction-security-leaders

When Anthropic announced Claude Code Security, the market reacted immediately. Several cybersecurity stocks saw sharp drops as speculation spread that AI-powered code security tools could displace traditional security platforms.

The narrative moved quickly: AI is replacing AppSec. AI is automating vulnerability detection. AI will make legacy security tooling redundant. The reality is more nuanced. Claude Code Security is a legitimate signal that AI is reshaping parts of the security landscape. The question is what parts, and what it means for the rest of the stack.

Claude Code Security represents an evolution in AI-assisted static code analysis. It scans codebases, reasons about context, identifies potential vulnerabilities, and proposes fixes for human review. That capability is meaningful, and it reflects the growing role of AI in accelerating software development and improving developer productivity.

What is Claude Code Security 

At its core, Claude Code Security enhances static analysis with contextual reasoning. It analyzes source code and attempts to identify vulnerabilities that traditional pattern-matching scanners may miss. It applies verification layers to reduce false positives and presents findings for human validation.

For development teams, this has clear value. It can improve code hygiene earlier in the lifecycle and reduce noise compared to traditional SAST tools. For enterprises, however, secure code is only one layer of risk.

Modern breaches do not rely solely on poorly written functions. They exploit misconfigurations, excessive permissions, identity gaps, runtime behavior, exposed services, and weak operational processes. These risks exist outside the code repository. AI-assisted static analysis improves one part of the equation. It does not replace the broader security stack.

Why the market reaction tells an incomplete story 

The drop in cybersecurity stock prices reflects an assumption that better code scanning equals reduced need for detection, response, and exposure management platforms. That assumption overlooks how enterprise security actually functions.

The market’s reaction also reflects a broader belief that this is the beginning of widespread AI-driven displacement in security. That view is partially correct. AI is particularly strong in domains where patterns are well understood and repeatable. Application security vulnerabilities often fall into known classes with predictable root causes. In those bounded problem spaces, displacement is real. But it does not extend uniformly across the full security stack.

Code security addresses vulnerabilities before deployment. Enterprise security addresses behavior after deployment. Detection and response platforms monitor identity misuse, lateral movement, cloud misconfiguration, and attacker tradecraft in live environments. Managed detection and response services provide human expertise to investigate and contain incidents when automated controls are bypassed.

Recent reporting of AI-orchestrated intrusion activity reinforces this distinction, showing how attackers can leverage an AI assistant to automate reconnaissance and exploitation steps at speed.. The issue is not the existence of AI, but the absence of layered controls capable of detecting how that AI is being used. Secure code in isolation does not prevent operational abuse. Runtime visibility and response capability remain essential.

These domains overlap, but they’re not interchangeable. Finding an injection flaw in a code repository doesn’t remove the need to monitor for credential abuse, persistence, or post-compromise behavior in production. From my perspective, there’s a meaningful difference between AI that helps developers write safer code and AI that protects a live environment. One works on source code in a repository before deployment. The other has to handle the real world: identity, behavior, lateral movement, and attacker intent across cross-vendor infrastructure that changes in real time. Both matter, but when we conflate them, we create either a false sense of security or a false sense of disruption.

Where AI does belong in security

AI models and agentic systems should serve as purpose-built engines that improve outcomes in real time. AI innovation is a continuous process, not a one-time product release. Rapid7 has invested heavily in AI-driven workflows across our platform and MDR services. Used correctly, AI accelerates triage, enriches alerts, prioritizes risk, and reduces time to action.

In managed detection and response (MDR) environments, for example, AI-driven workflows can help scale investigations and surface high-confidence insights faster, while keeping analysts firmly in control. 

The key distinction is this: AI should amplify human expertise and operational processes, not replace them. That is the philosophy behind how many enterprise platforms are approaching AI today, including the integration of AI features into broader security workflows rather than positioning them as standalone replacements.

⠀

⠀

AI can help developers write safer code and identify risky patterns earlier in the lifecycle. It becomes most valuable when its findings are integrated into a broader security context. Enterprise security requires runtime visibility, identity governance, segmentation, and continuous validation across production environments.

AI-driven code and vulnerability tools should be treated as another high-value source of security telemetry and remediation insight. Just as security operations teams ingest third-party alerts into detection workflows or correlate exposure data from cloud and application security tools into a unified risk view, newer capabilities like Claude Code can contribute meaningful signals. The responsibility of security leadership is to ensure those signals are contextualized within a holistic view of risk across the organization.

Secure development matters. So does understanding how code, infrastructure, identity, and runtime behavior interact. The strongest programs will integrate AI-assisted insights into that wider risk model rather than evaluating them in isolation.

In my work, we’re building AI that sits inside the operational loop of a diverse landscape: triaging alerts, enriching investigations, and helping analysts move faster on what matters. That is very different from scanning code before it ships. The real opportunity is not AI replacing security platforms, but AI making the humans running those platforms dramatically more effective. The companies that get this right will not try to automate away human judgment; they will find ways to scale it. 

How security leaders should think about it

For CISOs and senior security leaders, the takeaway should be measured and strategic.

First, recognize the value. AI-assisted code security tools will likely become standard in modern development environments. They can improve quality and reduce certain categories of vulnerability earlier in the lifecycle.

Second, avoid over-indexing on them as a replacement for enterprise controls. Breaches rarely occur because static analysis was unavailable. They occur because exposures persist across identity, infrastructure, and operational layers.

Third, focus on integration. Ask how AI code analysis feeds into broader exposure management. How findings are prioritized. How runtime controls validate that remediations are effective. How detection engineering adapts to new development patterns introduced by AI-generated code.

The path forward to resilience 

Security leaders do not need another debate about whether AI changes security. It does. The question is how to incorporate it without distorting risk priorities.

AI-assisted code analysis should be adopted where it delivers clear value: earlier defect detection, faster remediation cycles, and stronger developer feedback loops. That improves engineering outcomes. It does not, on its own, materially reduce enterprise breach risk.

Enterprise risk concentrates elsewhere. It is found in the systemic exposures that emerge in live environments. That includes complex identity estates, misaligned permissions, overexposed services, and the gaps that exist between deployment and continuous monitoring. These are not source code issues; they are operational realities.

As AI accelerates software delivery, it also increases environmental volatility. More code ships. More infrastructure spins up and down. More integrations connect systems that were never designed to operate together. Risk does not disappear. It shifts and compounds.

The priority for CISOs is alignment. Align AI-assisted development controls with exposure management. Align exposure insights with runtime detection. Align detection with disciplined response. That integration determines whether AI becomes a force multiplier or a source of blind spots.

Organizations that treat AI as an enhancement to an already coherent operating model will extract measurable value. Those that treat it as a substitute for layered controls will not.

Security remains an end-to-end discipline. Code is one layer, but resilience is the objective.

Author note: Laura Ellis, VP, Data & AI at Rapid7, has written about how agentic AI workflows can help MDR teams improve speed and operational consistency while keeping humans firmly in control. Read more about that approach here.

Digital Transformation at Santander: How Platform Engineering is Revolutionizing Cloud Infrastructure

Post Syndicated from Julio Bando original https://aws.amazon.com/blogs/architecture/digital-transformation-at-santander-how-platform-engineering-is-revolutionizing-cloud-infrastructure/

This post is cowritten by Julio Bando from Santander.

Santander faced a significant technical challenge in managing an infrastructure that processes billions of daily transactions across more than 200 critical systems. The expansion into diverse financial services, including investment banking, wealth management, insurance, and payment solutions, had created unprecedented technological complexity, requiring a robust, agile, and scalable infrastructure solution. This raised two main issues. Santander needed to ensure that provisioned services followed established architecture definitions, and they needed to reduce infrastructure provisioning time, which took up to 90 days. This situation demanded intensive operational effort. The solution emerged through an innovative platform engineering initiative called Catalyst, which transformed the bank’s cloud infrastructure and development management. This post analyzes the main cases, benefits, and results obtained with this initiative.

The Catalyst solution

Santander is a global financial services company present in more than 10 countries, with over 160 million customers worldwide. They conceived Catalyst in conjunction with the Platform Strategy Program (PSP), an Amazon Web Services (AWS) program specialized in infrastructure platform design. Implemented through a partnership between AWS Professional Services and Santander, the platform was designed to abstract infrastructure provisioning complexity, standardize architectural compliance, and create a framework that enables new technologies in the bank.

The platform’s in-house frontend was developed as an intuitive developer portal, offering a unified interface for all provisioning and resource management needs. At the platform’s core is the control plane cluster, based on Amazon Elastic Kubernetes Service (Amazon EKS). This cluster is the brain of the operation, orchestrating all components and workflows. Within the cluster, Crossplane plays a fundamental role, acting as a universal resource provisioner that Santander uses to manage resources across multiple cloud providers consistently and declaratively.

The control plane cluster has three components:

  • Data plane claims – Managed by ArgoCD, a continuous delivery tool, the component is responsible for continuous synchronization and deployment of application stacks (integrated sets of cloud resources) and configurations, exploring the GitOps concept.
  • Policies catalog – A central repository of policies ensuring compliance and security across all operations using Open Policy Agent (OPA).
  • Stacks catalog – A library of composite resource definitions and Compositions enabling quick and standardized creation of complex environments.

Santander used this innovative architecture to significantly reduce provisioning time from 90 days to only a few hours and in some cases only minutes. Catalyst brought significant benefits in terms of standardization, security, and governance. The provisioning cycle decreased from 30 days to 2 days, and proof of concept preparation time jumped from 90 days to only 1 hour. The consolidation of over 100 pipelines into a single control plane will further simplify infrastructure management. The following diagram shows the Santander catalyst architecture.

This diagram shows the AWS architecture of Santander's Catalyst platform that provides AI capabilities to teams across the company.

Key platform capabilities

Catalyst’s implementation enabled the creation of strategic workloads demonstrating the platform’s versatility and robustness:

  • Generative AI agents stack – The first success case was implementing a complete stack for AI agents integrating:
  • Modern data platform – One of the most complex workloads implemented through Catalyst was the new data platform, including:
    • Built-in integration with Databricks
    • Data lakes
    • Automated extract, transform, and load (ETL) workflows
    • Integration with centralized data catalog
    • Segregated environments for experimentation. With this implementation, the bank significantly reduces approximately 3,000 monthly tickets related to data experimentation environment provisioning.
  • Cloud process orchestration – creation of a modern process orchestration environment with significant results:
    • Migration of legacy workflows to AWS Step Functions
    • Implementation of retry patterns and error handling
    • Centralized process monitoring

Overall result

This stack reduced AI agent implementation time from 105 days to only 24 hours, eliminating dozens of provisioning tickets per environment. The success of these workloads demonstrates Catalyst’s technical capability and the solution’s versatility in meeting different business needs. Each implementation brought valuable learnings that were incorporated into the platform, creating a virtuous cycle of continuous improvement. The variety of implemented workloads also shows how Catalyst has the potential to be a universal platform, capable of supporting everything from traditional use cases to the most innovative ones involving AI and legacy system modernization. Catalyst’s success wasn’t limited to operational efficiency. The platform also catalyzed a cultural change within Santander, promoting an automation and self-service mindset among development teams. This resulted in faster overall development velocity, more agile teams, and enhanced capability to respond quickly to market changes.

Conclusion

Catalyst represents more than merely a technological tool—it’s a digital transformation enabler that’s redefining cloud development standards at the bank. With the platform, Santander addressed the challenges of a scaled environment and established a solid foundation for continuous innovation and future growth.

With these practical cases, Santander proves that investment in platform engineering solves technical problems and enables new business possibilities, keeping the bank at the forefront of digital transformation in the financial sector.


About the authors

MediaFM: The Multimodal AI Foundation for Media Understanding at Netflix

Post Syndicated from Netflix Technology Blog original https://netflixtechblog.com/mediafm-the-multimodal-ai-foundation-for-media-understanding-at-netflix-e8c28df82e2d

Avneesh Saluja, Santiago Castro, Bowei Yan, Ashish Rastogi

Introduction

Netflix’s core mission is to connect millions of members around the world with stories they’ll love. This requires not just an incredible catalog, but also a deep, machine-level understanding of every piece of content in that catalog, from the biggest blockbusters to the most niche documentaries. As we onboard new types of content such as live events and podcasts, the need to scalably understand these nuances becomes even more critical to our productions and member-facing experiences.

Many of these media-related tasks require sophisticated long-form video understanding e.g., identifying subtle narrative dependencies and emotional arcs that span entire episodes or films. Previous work has found that to truly grasp the content’s essence, our models must leverage the full multimodal signal. For example, the audio soundtrack is a crucial, non-visual modality that can help more precisely identify clip-level tones or when a new scene starts. Can we use our collection of shows and movies to learn how to a) fuse modalities like audio, video, and subtitle text together and b) develop robust representations that leverage the narrative structure that is present in long form entertainment? Consisting of tens of millions of individual shots across multiple titles, our diverse yet entertainment-specific dataset provides the perfect foundation to train multimodal media understanding models that enable many capabilities across the company such as ads relevancy, clip popularity prediction, and clip tagging.

For these reasons, we developed the Netflix Media Foundational Model (MediaFM), our new, in-house, multimodal content embedding model. MediaFM is the first tri-modal (audio, video, text) model pretrained on portions of the Netflix catalog. Its core is a multimodal, Transformer-based encoder designed to generate rich, contextual embeddings¹ for shots from our catalog by learning the temporal relationships between them through integrating visual, audio, and textual information. The resulting shot-level embeddings are powerful representations designed to create a deeper, more nuanced, and machine-readable understanding of our content, providing the critical backbone for effective cold start of newly launching titles in recommendations, optimized promotional assets (like art and trailers), and internal content analysis tools.

Figure 1: MediaFM Architecture

Input Representation & Preprocessing

The model’s fundamental unit of input is a shot, derived by segmenting a movie or episode (collectively referred to as “title”) using a shot boundary detection algorithm. For each shot, we generate three distinct embeddings from its core modalities:

  • Video: an internal model called SeqCLIP (a CLIP-style model fine-tuned on video retrieval datasets) is used to embed frames sampled at uniform intervals from segmented shots
  • Audio: the audio samples from the same shots are embedded using Meta FAIR’s wav2vec2
  • Timed Text: OpenAI’s text-embedding-3-large model is used to encode the corresponding timed text (e.g., closed captions, audio descriptions, or subtitles) for each shot

For each shot, the three embeddings² are concatenated and unit-normed to form a single 2304-dimensional fused embedding vector. The transformer encoder is trained on sequences of shots, so each example in our dataset is a temporally-ordered sequence of these fused embeddings from the same movie or episode (up to 512 shots per sequence). We also have access to title-level metadata which is used to provide global context for each sequence (via the [GLOBAL]token). The title-level embedding is computed by passing title-level metadata (such as synopses and tags) through the text-embedding-3-large model.

Model Architecture and Training Objective

The core of our model is a transformer encoder, architecturally similar to BERT. A sequence of preprocessed shot embeddings is passed through the following stages:

  1. Input Projection: The fused shot embeddings are first projected down to the model’s hidden dimension via a linear layer.
  2. Sequence Construction & Special Tokens: Before entering the Transformer, two special embeddings are prepended to the sequence:
    • a learnable [CLS] embedding is added at the very beginning.
    • the title-level embedding is projected to the model’s hidden dimension and inserted after the [CLS] token as the [GLOBAL] token, providing title-level context to every shot in the sequence and participating in the self-attention process.
  3. Contextualization: The sequence is enhanced with positional embeddings and fed through the Transformer stack to provide shot representations based on their surrounding context.
  4. Output Projection: The contextualized hidden states from the Transformer are passed through a final linear layer, projecting them from the hidden layers back up to the 2304-dimensional fused embedding space for prediction.

We train the model using a Masked Shot Modeling (MSM) objective. In this self-supervised task, we randomly mask 20% of the input shot embeddings in each sequence by replacing them with a learnable [MASK] embedding. The model’s objective is to predict the original, unmasked fused embedding for these masked positions. The model is optimized by minimizing the cosine distance between its predicted embedding and the ground-truth embedding for each masked shot.

We optimized the hidden parameters with Muon and the remaining parameters with AdamW. It’s worth noting that the switch to Muon resulted in noticeable improvements.

Evaluation

To evaluate the learned embeddings, we learn task-specific linear layers on top of frozen representations (i.e., linear probes). Most of the tasks are clip-level, i.e., each example is a short clip ranging from a few seconds to a minute which are often presented to our members while recommending a title to them. When embedding these clips, we find that “embedding in context”, namely extracting the embeddings from within a larger sequence (e.g., the episode containing the clip), naturally does much better than embedding only the shots from a clip.

Tasks

Our embeddings are foundational and we find that they bring value to applications across Netflix. Here are a few:

  • Ad Relevancy: A multilabel classification task to categorize Netflix clips for relevant ad placement, measured by Average Precision. In this task, these representations operate at the retrieval stage, where they help in identifying the candidate set and in turn are fed into the ad serving system for relevance optimization.
  • Clip Popularity Ranking: A ranking task to predict the relative performance (in click-through rate, CTR) of a media clip relative to other clips from that show or movie, measured by a ten-fold with Kendall’s tau correlation coefficient.
  • Clip Tone: A multi-label classification of hook clips into 100 tone categories (e.g., creepy, scary, humorous) from our internal Metadata & Ratings team, measured by micro Average Precision (averaged across tone categories).
  • Clip Genre: A multi-label classification of clips into eleven core genres (Action, Anime, Comedy, Documentary, Drama, Fantasy, Horror, Kids, Romance, Sci-fi, Thriller) derived from the genre of the parent title, measured by macro Average Precision (averaged across genres).
  • Clip Retrieval: a binary classification of clips from movies or episodes into “clip-worthy” (i.e., a good clip to showcase the title) or not, as determined by human annotators, and as measured by Average Precision. The positive to negative clip ratio is 1:3, and for each title we select 6–10 positive clips and the corresponding number of negatives.

It’s worth noting that for the tasks above (as well as other tasks that use our model), the model outputs are utilized as information that the relevant teams use when driving to a decision rather than being used in a completely end-to-end fashion. Many of the improvements are also in various stages of deployment.

Results

Figure 2³ compares MediaFM to several strong baselines:

Figure 2: Performance of MediaFM vs. external and internal models.

On all tasks, MediaFM is better than the baselines. Improvements seem to be larger for tasks that require more detailed narrative understanding e.g., predicting the most relevant ads for an ad break given the surrounding context. We look further into this next.

Ablations

MediaFM’s primary improvements over previous Netflix work stem from two key areas: combining multiple modalities and learning to contextualize shot representations. To determine the contribution of each factor across different tasks, we compared MediaFM to a baseline. This baseline concatenates the three input embeddings, essentially providing the same complete, shot-level input as MediaFM but without the contextualization step. This comparison allows us to isolate which tasks benefit most from the contextualization aspect.

Additional modalities help somewhat for tone but the main improvement comes from contextualization.

Oddly, multiple uncontextualized modalities hurts the clip popularity ranking model, but adding contextualization significantly improves performance.

For clip retrieval we see a natural progression of around 15% for each improvement.

Next Steps

MediaFM presents a way to learn how to fuse and/or contextualize shot-level information by leveraging Netflix’s catalog in a self-supervised manner. With this perspective, we are actively investigating how pretrained multimodal (audio, video/image, text) LLMs like Qwen3-Omni, where the modality fusion has already been learned, can provide an even stronger starting point for subsequent model generations.

Next in this series of blog posts, we will present our method to embed title-level metadata and adapt it to our needs. Stay tuned!

Footnotes

  1. We chose embeddings over generative text outputs to prioritize modular design. This provides a tighter, cleaner abstraction layer: we generate the representation once, and it is consumed across our entire suite of services. This avoids the architectural fragility of fine-tuning, allowing us to enhance our existing embedding-based workflows with new modalities more flexibly.
  2. All of our data has audio and video; we zero-pad for missing timed text data, which is relatively likely to occur (e.g., in shots without dialogue).
  3. The title-level tasks couldn’t be evaluated with the VertexAI MM and Marengo embedding models as the videos exceed the length limit set by the APIs.


MediaFM: The Multimodal AI Foundation for Media Understanding at Netflix was originally published in Netflix TechBlog on Medium, where people are continuing the conversation by highlighting and responding to this story.

Alert Fatigue Isn’t Going Away. Here’s How Modern SOCs Are Fighting Back

Post Syndicated from Rapid7 original https://www.rapid7.com/blog/post/dr-modern-soc-vs-alert-fatigue-siem-ebook

Security teams have been talking about alert fatigue for years. And yet, for many SOCs, the problem isn’t getting better. It’s getting worse.

As environments expand across cloud, SaaS, identity, and legacy systems, analysts are flooded with signals that all demand attention but rarely arrive with enough context to act quickly. Staffing shortages only amplify the issue. The result is a SOC stuck reacting to noise instead of responding to real risk.

Recent industry research reinforces what analysts already know. False positives remain one of the top challenges in detection and response, and many analysts encounter low-value alerts so frequently that it slows investigations and contributes directly to burnout. Alert fatigue isn’t just an efficiency problem. It’s an operational risk.

That’s why we created a new eBook, Alert Fatigue to Action: The SOC Analyst’s Playbook.

Why alert fatigue persists, and why it’s not your fault

Alert fatigue isn’t a reflection of weak analysts or underperforming teams. It’s the outcome of security models that haven’t kept pace with modern complexity.

Traditional SIEM approaches were built for a different era. Rule-heavy detections, manual enrichment, siloed tools, and flat log views force analysts to spend valuable time stitching together context before they can even begin investigating. Even experienced analysts end up waiting for answers instead of acting on them.

Modern SOCs need a different approach. One that prioritizes analyst efficiency, reduces friction, and brings clarity to investigations from the start.

Four moves that change how SOCs operate

In the eBook, we break down four practical shifts that high-performing SOCs are making to move beyond alert fatigue:

  • Automate the noise with AI-assisted classification and enrichment so analysts can focus on what truly matters

  • Investigate smarter with unified context, eliminating unnecessary pivots between tools

  • Shrink the response cycle using guided workflows that make investigations faster and more consistent

  • Gain confidence in coverage by understanding risk across the entire attack surface, not just known assets

These aren’t theoretical ideas. They’re grounded in real-world SOC workflows and designed to help analysts move faster without sacrificing control or trust.

A look inside a real SOC investigation

One of the most impactful sections of the eBook walks through a familiar scenario: a phishing or business email compromise investigation.

Instead of listing tools or features, it shows what the investigation actually feels like for an analyst. From the frustration of waiting on data in a traditional workflow to the clarity that comes when context is surfaced early and answers arrive faster. It’s a reminder that efficiency isn’t about removing analysts from the loop. It’s about removing the friction that slows them down.

From overwhelmed to in command

At its core, the playbook is built on a simple principle. Modern SOC efficiency comes from reducing noise, unifying context, and guiding investigations with AI-assisted workflows, all while keeping analysts firmly in control.

If you’re responsible for detection and response, or if you’re feeling the strain of alert fatigue in your SOC, this eBook is designed for you.

Download Alert Fatigue to Action: The SOC Analyst’s Playbook and see how modern SOCs are turning overwhelming alert volume into faster, more confident response.

Announcing Amazon SageMaker Inference for custom Amazon Nova models

Post Syndicated from Channy Yun (윤석찬) original https://aws.amazon.com/blogs/aws/announcing-amazon-sagemaker-inference-for-custom-amazon-nova-models/

Since we launched Amazon Nova customization in Amazon SageMaker AI at AWS NY Summit 2025, customers have been asking for the same capabilities with Amazon Nova as they do when they customize open weights models in Amazon SageMaker Inference. They also wanted have more control and flexibility in custom model inference over instance types, auto-scaling policies, context length, and concurrency settings that production workloads demand.

Today, we’re announcing the general availability of custom Nova model support in Amazon SageMaker Inference, a production-grade, configurable, and cost-efficient managed inference service to deploy and scale full-rank customized Nova models. You can now experience an end-to-end customization journey to train Nova Micro, Nova Lite, and Nova 2 Lite models with reasoning capabilities using Amazon SageMaker Training Jobs or Amazon HyperPod and seamlessly deploy them with managed inference infrastructure of Amazon SageMaker AI.

With Amazon SageMaker Inference for custom Nova models, you can reduce inference cost through optimized GPU utilization using Amazon Elastic Compute Cloud (Amazon EC2) G5 and G6 instances over P5 instances, auto-scaling based on 5-minute usage patterns, and configurable inference parameters. This feature enables deployment of customized Nova models with continued pre-training, supervised fine-tuning, or reinforcement fine-tuning for your use cases. You can also set advanced configurations about context length, concurrency, and batch size for optimizing the latency-cost-accuracy tradeoff for your specific workloads.

Let’s see how to deploy customized Nova models on SageMaker AI real-time endpoints, configure inference parameters, and invoke your models for testing.

Deploy custom Nova models in SageMaker Inference
At AWS re:Invent 2025, we introduced new serverless customization in Amazon SageMaker AI for popular AI models including Nova models. With a few clicks, you can seamlessly select a model and customization technique, and handle model evaluation and deployment. If you already have a trained custom Nova model artifact, you can deploy the models on SageMaker Inference through the SageMaker Studio or SageMaker AI SDK.

In the SageMaker Studio, choose a trained Nova model in Models in your models in the Models menu. You can deploy the model by choosing Deploy button, SageMaker AI and Create new endpoint.

Choose the endpoint name, instance type, and advanced options such as instance count, max instance count, permission and networking, and Deploy button. At GA launch, you can use g5.12xlarge, g5.24xlarge, g5.48xlarge, g6.12xlarge, g6.24xlarge, g6.48xlarge, and p5.48xlarge instance types for the Nova Micro model, g5.24xlarge, g5.48xlarge, g6.24xlarge, g6.48xlarge, and p5.48xlarge for the Nova Lite model, and p5.48xlarge for the Nova 2 Lite model.

Creating your endpoint requires time to provision the infrastructure, download your model artifacts, and initialize the inference container.

After model deployment completes and the endpoint status shows InService, you can perform real-time inference using the new endpoint. To test the model, choose the Playground tab and input your prompt in the Chat mode.

You can also use the SageMaker AI SDK to create two resources: a SageMaker AI model object that references your Nova model artifacts, and an endpoint configuration that defines how the model will be deployed.

The following code creates a SageMaker AI model that references your Nova model artifacts:

# Create a SageMaker AI model
    model_response = sagemaker.create_model(
        ModelName= 'Nova-micro-ml-g5-12xlarge',
        PrimaryContainer={
            'Image': '123456789012.dkr.ecr.us-east-1.amazonaws.com/nova-inference-repo:v1.0.0',
            'ModelDataSource': {
                'S3DataSource': {
                   'S3Uri': 's3://your-bucket-name/path/to/model/artifacts/',
                   'S3DataType': 'S3Prefix',
                   'CompressionType': 'None'
                }
            },
            # Model Parameters
            'Environment': {
                'CONTEXT_LENGTH': 8000,
                'CONCURRENCY': 16,
                'DEFAULT_TEMPERATURE': 0.0,
                'DEFAULT_TOP_P': 1.0
            }
        },
        ExecutionRoleArn=SAGEMAKER_EXECUTION_ROLE_ARN,
        EnableNetworkIsolation=True
    )
    print("Model created successfully!")

Next, create an endpoint configuration that defines your deployment infrastructure and deploy your Nova model by creating a SageMaker AI real-time endpoint. This endpoint will host your model and provide a secure HTTPS endpoint for making inference requests.

# Create Endpoint Configuration
    production_variant = {
        'VariantName': 'primary',
        'ModelName': 'Nova-micro-ml-g5-12xlarge',
        'InitialInstanceCount': 1,
        'InstanceType': 'ml.g5.12xlarge',
    }
    
    config_response = sagemaker.create_endpoint_config(
        EndpointConfigName= 'Nova-micro-ml-g5-12xlarge-Config',
        ProductionVariants= production_variant
    )
    print("Endpoint configuration created successfully!")
    
# Deploy your Noval model
    endpoint_response = sagemaker.create_endpoint(
        EndpointName= 'Nova-micro-ml-g5-12xlarge-endpoint',
        EndpointConfigName= 'Nova-micro-ml-g5-12xlarge-Config'
    )
    print("Endpoint creation initiated successfully!")

After the endpoint is created, you can send inference requests to generate predictions from your custom Nova model. Amazon SageMaker AI supports synchronous endpoints for real-time with streaming/non-streaming modes and asynchronous endpoints for batch processing.

For example, the following code creates streaming completion format for text generation:

# Streaming chat request with comprehensive parameters
streaming_request = {
"messages": [
        {"role": "user", "content": "Compare our Q4 2025 actual spend against budget across all departments and highlight variances exceeding 10%"}
    ],
    "max_tokens": 512,
    "stream": True,
    "temperature": 0.7,
    "top_p": 0.95,
    "top_k": 40,
    "logprobs": True,
    "top_logprobs": 2,
    "reasoning_effort": "low",  # Options: "low", "high"
    "stream_options": {"include_usage": True}
}

invoke_nova_endpoint(streaming_request)

def invoke_nova_endpoint(request_body):
"""
    Invoke Nova endpoint with automatic streaming detection.
    
    Args:
        request_body (dict): Request payload containing prompt and parameters
    
    Returns:
        dict: Response from the model (for non-streaming requests)
        None: For streaming requests (prints output directly)
    """
    body = json.dumps(request_body)
    is_streaming = request_body.get("stream", False)
    
    try:
        print(f"Invoking endpoint ({'streaming' if is_streaming else 'non-streaming'})...")
        
        if is_streaming:
            response = runtime_client.invoke_endpoint_with_response_stream(
                EndpointName=ENDPOINT_NAME,
                ContentType='application/json',
                Body=body
            )
            
            event_stream = response['Body']
            for event in event_stream:
                if 'PayloadPart' in event:
                    chunk = event['PayloadPart']
                    if 'Bytes' in chunk:
                        data = chunk['Bytes'].decode()
                        print("Chunk:", data)
        else:
            # Non-streaming inference
            response = runtime_client.invoke_endpoint(
                EndpointName=ENDPOINT_NAME,
                ContentType='application/json',
                Accept='application/json',
                Body=body
            )
            
            response_body = response['Body'].read().decode('utf-8')
            result = json.loads(response_body)
            print("✅ Response received successfully")
            return result
    
    except ClientError as e:
        error_code = e.response['Error']['Code']
        error_message = e.response['Error']['Message']
        print(f"❌ AWS Error: {error_code} - {error_message}")
    except Exception as e:
        print(f"❌ Unexpected error: {str(e)}")

To use full code examples, visit Customizing Amazon Nova models on Amazon SageMaker AI. To learn more about best practices on deploying and managing models, visit Best Practices for SageMaker AI.

Now available
Amazon SageMaker Inference for custom Nova models is available today in US East (N. Virginia) and US West (Oregon) AWS Regions. For Regional availability and a future roadmap, visit the AWS Capabilities by Region.

The feature supports Nova Micro, Nova Lite, and Nova 2 Lite models with reasoning capabilities, running on EC2 G5, G6, and P5 instances with auto-scaling support. You pay only for the compute instances you use, with per-hour billing and no minimum commitments. For more information, visit Amazon SageMaker AI Pricing page.

Give it a try in Amazon SageMaker AI console and send feedback to AWS re:Post for SageMaker or through your usual AWS Support contacts.

— Channy

Measuring AI Security: Separating Signal from Panic

Post Syndicated from Christiaan Beek original https://www.rapid7.com/blog/post/tr-measuring-ai-security-mcp-exposure

The conversation around AI security is full of anxiety. Every week, new headlines warn of jailbreaks, prompt injection, agents gone rogue, and the rise of LLM-enabled cybercrime. It’s easy to come away with the impression that AI is fundamentally uncontrollable and dangerous, and therefore something we need to lock down before it gets out of hand.

But as a security practitioner, I wasn’t convinced. Most of these warnings are based on hypothetical examples or carefully engineered demos. They raise important questions, but rarely answer the most basic one: What does the real attack surface of today’s AI systems actually look like?

So instead of offering another opinion, I ran the numbers.

The method: Focused, real-world measurement

To ground the conversation in reality, I focused on MCP, the Model Context Protocol. This framework is widely used to help language models interact with tools, APIs, and external systems. It’s open source, replicated across many environments, and built for practical integration. That makes it an ideal test case for understanding actual exposure.

No adversarial prompting. No artificial exploits. Just a measurement of what real MCP servers expose. We used SDK import analysis to locate active repositories, filtered out those that wouldn’t run, and examined the tool schemas to understand what each was capable of.

What the data tells us

The MCP servers that met our criteria showed a familiar pattern. They exposed well-understood primitives used throughout modern software systems.

Observed capability classes:

  • Filesystem access

  • HTTP requests

  • Database queries

  • Local script or process execution

  • Orchestration and tool chaining

  • Read-only API search

These are not exotic capabilities unique to AI. They’re already embedded in cloud automation, infrastructure-as-code, and modern DevOps stacks. MCP simply gives them structure.

The frequency of high-severity risk is low

One of the most unexpected findings was the rarity of arbitrary code execution. Despite warnings in the media, this turned out to be the least common capability among all operational MCP servers analyzed.

This matters. It suggests that real-world deployments of AI tooling are not as reckless as some narratives claim. The most common issues are the ones we’ve known for years: weak defaults, excessive permissions, and poor input handling. There’s no mystery there (and that’s encouraging).

Where the real risk builds: Composition

The problem arises when those primitives are combined. Individually, most of the MCP servers we studied were low risk. But when orchestration enters the picture, the attack surface expands.

Some real-world examples we observed:

  • HTTP fetch + filesystem write = persistence or content injection

  • Database query + orchestration = stealthy exfiltration

  • Filesystem write + planning = poisoned output or config hijacking

  • HTTP + planning + execution = multi-stage agent attacks

These combinations reflect what adversaries already do in non-AI environments. MCP just reduces friction in putting the pieces together.

A critical counterpoint: The ‘best effort’ reality

The focus on constraining the model via schema and architecture is essential for ‘secure by design,’ yet a critical counterpoint must be considered as the industry evolves: We may not be able to stop many insecure AI applications (e.g., those built on architectures like OpenClaw or Claude Code) from shipping with insecure design choices. Similarly, the insecure design path for AI could force security teams to rely on non-deterministic, ‘best effort’ prompt injection defenses to prevent data exfiltration and remote code execution, rather than influencing developers toward inherently secure application design.

While the secure boundary is the schema, and we must influence application developers to adopt secure-by-design principles, the future suggests there will be many cases where this influence fails. This means security leaders must also prepare for a hybrid reality of championing architectural security while also building and operating robust, best effort runtime defenses to manage the fallout from the inevitable wave of insecure AI applications.

A shift in where security happens

As we embed AI deeper into operational systems, the control points change. Historically, we validated inputs at the UI layer, enforced roles through IAM, and wrapped logic in application code.

With AI agents, those controls now live in:

  • The orchestration layer

  • Tool composition workflows

  • Schema contracts

  • Execution sandboxes

Security needs to follow the shift. That means auditing tool chains, setting strict schema policies, isolating execution contexts, and applying existing practices like least privilege and defense in depth to this new architecture.

What security teams should do now

Security and architecture leaders can start applying pressure in the right places today:

  • Map AI tooling to known primitives
    Don’t treat these systems as unknowns. Most expose capabilities like file handling, HTTP fetches, or basic shell commands – all of which are familiar territory for teams leveraging threat intelligence effectively.

  • Assess schema design before worrying about prompts
    The schema defines what tools the AI can call and how. Poorly scoped parameters, such as unbounded URLs or file paths, are far more dangerous than clever prompts.

  • Limit orchestration where possible
    Composability increases risk. If orchestration is required, monitor it like critical automation infrastructure.

  • Audit your environment for capability sprawl
    Look for AI-connected services that may expose multiple sensitive capabilities together. Risk scales when these tools are combined.

  • Apply existing enterprise controls
    Network segmentation, credential scoping, logging, and behavioral detections still work. Least privilege access is especially relevant in AI-integrated environments where tool chaining can escalate access unintentionally. AI requires adaptation, not reinvention.

Understanding the risk of AI without the hype

This blog condenses findings from my recent research, where I set out to answer a straightforward question: what are AI systems actually exposing in the real world today? Instead of relying on hypotheticals or fear-driven narratives, I looked at real, runnable Model Context Protocol (MCP) servers and measured their exposed capabilities and architectural design.

If you’re looking for the technical deep dive, including methodology, data sets, and schema-level breakdowns, you can read the original research published on HackerNoon. You can also explore more of our ongoing threat analysis and security research on the Rapid7 Research Hub.

The bottom line: AI introduces complexity and scale, but the fundamental security principles remain the same. The real challenge is whether security teams can adapt traditional controls to new environments and influence developers toward inherently secure application design, rather than being forced to rely on non-deterministic, ‘best effort’ defenses like prompt injection mitigation.

Building a scalable code modernization solution with AWS Transform custom

Post Syndicated from Dinesh Prabakaran original https://aws.amazon.com/blogs/devops/building-a-scalable-code-modernization-solution-with-aws-transform-custom/

Introduction

Software maintenance and modernization is a critical challenge for enterprises managing hundreds or thousands of repositories. Whether upgrading Java versions, migrating to new AWS SDKs, or modernizing frameworks, the scale of transformation work can be overwhelming. AWS Transform custom uses agentic AI to perform large-scale modernization of software, code, libraries, and frameworks to reduce technical debt. It handles diverse scenarios including language version upgrades, API and service migrations, framework upgrades and migrations, code refactoring, and organization-specific transformations. Through continual learning, the agent improves from every execution and developer feedback, delivering high-quality, repeatable transformations without requiring specialized automation expertise.

Organizations need to run transformations using AWS Transform custom concurrently across their entire code estate to meet aggressive modernization timelines and compliance deadlines. Running it at enterprise scale requires a solution to process repositories in parallel, in a controlled remote cloud environment, manage credentials securely, and provide visibility into transformation progress. Today, we’re introducing an open-source solution that brings production-grade scalability, reliability, and monitoring to AWS Transform custom. This infrastructure enables you to run transformations on thousands of repositories in parallel using AWS Batch and AWS Fargate, with REST API access for programmatic control and comprehensive Amazon CloudWatch monitoring.

Requirements for Enterprise-Scale Code Modernization

AWS Transform custom provides powerful AI-driven code transformation capabilities through its CLI. To effectively scale transformations across enterprise codebases, organizations need:

Scale: Ability to run transformations on 1000+ repositories concurrently rather than one-by-one
Infrastructure: Dedicated compute resources for long-running transformations beyond developers’ laptops
API Access: REST API for programmatic orchestration and seamless integration with CI/CD pipelines
Monitoring: Centralized visibility into transformation progress and status across multiple repositories
Reliability: Automatic retries, secure credential management, and built-in fault tolerance

The Solution: Batch Infrastructure with REST API

This solution provides complete, production-ready infrastructure that addresses these challenges:

Core Capabilities

  • Scalable Batch Processing Run transformations on thousands of repositories in parallel using AWS Batch with Fargate. The default configuration (256 max vCPUs, 2 vCPUs per job) supports up to 128 concurrent jobs, with automatic queuing and resource management. The compute environment scales based on your needs and Fargate service quotas.
  • REST API for Programmatic Access Seven API endpoints provide complete job lifecycle management, enabling you to submit single jobs or bulk batches of thousands in one request. The API offers real-time status tracking and progress monitoring, with Amazon Identity and access Management (IAM) authentication ensuring secure access to transformation operations.
  • Multi-Language Container The solution includes a container supporting Java (8, 11, 17, 21), Python (3.8-3.13), and Node.js (16-24) with all build tools pre-installed, including Maven, Gradle, npm, and yarn. The AWS Transform CLI and AWS CLI v2 are bundled in. The container is fully extensible for custom requirements—you can add your own libraries, languages, or tools by customizing the Dockerfile to meet their specific needs
  • Enterprise-Grade Reliability Automatic IAM credential management eliminates long-lived keys, with credentials auto-refreshing every 45 minutes for jobs up to 12 hours. The system includes automatic retries for transient failures (default: 3 attempts), with configurable timeout and retry settings to match your transformation complexity.
  • Comprehensive Monitoring A CloudWatch dashboard provides job tracking with success and failure rates, trends over time, and API and Lambda health metrics. Real-time log streaming enables you to monitor transformation progress and quickly diagnose issues.

Architecture

The solution uses a serverless architecture built on AWS managed services:

AWS Transform custom Batch solution architecture

Key Components:

  • API Gateway: REST API with IAM authentication
  • Lambda Functions: Job orchestration, status tracking, bulk submission
  • AWS Batch: Job queue and compute environment management
  • Fargate: Serverless container execution (no EC2 to manage)
  • S3: Source code input and transformation results output
  • CloudWatch: Logs, metrics, and operational dashboard

Getting Started

Prerequisites

Before deploying, ensure you have:

  • AWS Account with appropriate IAM permissions (ECR, S3, IAM, Batch, Lambda, API Gateway, CloudWatch)
  • AWS CLI v2 configured with credentials or AWS SSO login
  • Docker installed and running
  • Git for cloning the repository
  • Node.js 18+ and AWS CDK (for CDK deployment)
  • Python3for testing the APIs

Deployment Options

Option 1: CDK Deployment (Recommended)

Step 1: Clone the Repository

git clone https://github.com/aws-samples/aws-transform-custom-samples.git

cd aws-transform-custom-samples/scaled-execution-containers

Step 2: Set Environment Variables

export AWS_ACCOUNT_ID=$(aws sts get-caller-identity --query Account --output text)
export CDK_DEFAULT_ACCOUNT=$AWS_ACCOUNT_ID
export CDK_DEFAULT_REGION=us-east-1

Step 3: Verify prerequisites

This checks that Docker is installed and running, AWS CLI v2 is configured with credentials, Git is available, and your AWS account has the required VPC and public subnets.

cd deployment
chmod +x *.sh
./check-prereqs.sh

Step 4: Set up IAM Permissions (Optional, but recommended)

Generate a least-privilege IAM policy instead of using broad permissions:

./generate-custom-policy.sh

This creates iam-custom-policy.json with minimum permissions scoped to your specific resources.

Create and attach the policy:

aws iam create-policy \
  --policy-name ATXCustomDeploymentPolicy \
  --policy-document file://iam-custom-policy.json
aws iam attach-user-policy \
  --user-name YOUR_USERNAME \
  --policy-arn arn:aws:iam::$(aws sts get-caller-identity --query Account --output text):policy/ATXCustomDeploymentPolicy

Note: If you have administrator access, you can skip this step and proceed directly to deployment.

Step 5: Deploy with CDK (One Command Does Everything!)

cd ../cdk
chmod +x *.sh
./deploy.sh

Time: 20-25 minutes (all resources)

What CDK Does Automatically:

  1. Builds Docker image from Dockerfile
  2. Pushes image to ECR
  3. Creates all AWS resources
  4. Configures everything

What Gets Deployed:

  • ECR repository with Docker image
  • S3 buckets (output, source)
  • IAM roles with least-privilege
  • AWS Batch infrastructure (Fargate)
  • 7 Lambda functions
  • API Gateway REST API
  • CloudWatch logs and dashboard

See cdk/README.md for detailed instructions and configuration options.

Step 6: Get Your API Endpoint

After deployment completes, retrieve the API endpoint URL:

export API_ENDPOINT=$(aws cloudformation describe-stacks \
  --stack-name AtxApiStack \
  --query 'Stacks[0].Outputs[?OutputKey==`ApiEndpoint`].OutputValue' \
  --output text)

echo "API Endpoint: $API_ENDPOINT"

This endpoint is used in all subsequent API calls.

Option 2: Bash Scripts (Alternative)

If you prefer manual control over each deployment step or need to customize individual components, use the bash script deployment. See deployment/README.md for the complete 3-step process with detailed explanations of what each script deploys.

Using the Solution

Single Job Submission

Quick test: Run cd ../test && ./test-apis.sh to validate all API endpoints (MCP, transformations, bulk jobs, campaigns).

Submit a Python version upgrade transformation:

cd ..
python3 utilities/invoke-api.py \
  --endpoint "$API_ENDPOINT" \
  --path "/jobs" \
  --data '{
    "source": "https://github.com/venuvasu/todoapilambda",
    "command": "atx custom def exec -n AWS/python-version-upgrade -p /source/todoapilambda -c noop --configuration \"validationCommands=pytest,additionalPlanContext=The target Python version to upgrade to is Python 3.13. Python 3.13 is already installed at /usr/bin/python3.13\" -x -t"
  }'

This API call triggers a Python version upgrade transformation on the todoapilambda public git repository. The transformation uses the AWS Managed transformation to upgrade from the current Python version to Python 3.13. The configuration parameter specifies additional validation command to be run and plan context to specifies the location of python 3.13 installation in the container and the target version. The -x flag is for non-interactive mode of the transformation , and -t flag is to trust all tools for this transformation.

API returns a job ID for tracking. Job names are auto-generated from the source repository and transformation type.

See api/README.md for complete API documentation with examples for Java, Node.js, and other transformations.

Bulk Job Submission

Transform multiple repositories in a single API call:

python3 utilities/invoke-api.py \
  --endpoint "$API_ENDPOINT" \
  --path "/jobs/batch" \
  --data '{
    "batchName": "codebase-analysis-2025",
    "jobs": [
      {"source": "https://github.com/spring-projects/spring-petclinic", "command": "atx custom def exec -n AWS/early-access-comprehensive-codebase-analysis -p /source/spring-petclinic -x -t"},
      {"source": "https://github.com/venuvasu/todoapilambda", "command": "atx custom def exec -n AWS/early-access-comprehensive-codebase-analysis -p /source/todoapilambda -x -t"},
      {"source": "https://github.com/venuvasu/toapilambdanode16", "command": "atx custom def exec -n AWS/early-access-comprehensive-codebase-analysis -p /source/toapilambdanode16 -x -t"}
    ]
  }'

This API call triggers a deep static analysis of the codebase to generate hierarchical, cross-referenced documentation for three open source repositories in parallel. The transformation uses the AWS Managed transformation to generate behavioral analysis, architectural documentation, and business intelligence extraction to create a comprehensive knowledge base organized for maximum usability and navigation.

The API submits these jobs in a async manner. i.e the API returns a batch id upon submitting these jobs to AWS Batch. Then you can monitor the progress as specified below.

See api/README.md for status checking, MCP configuration, and other API endpoints.

Monitoring Progress

Check batch status:

python3 utilities/invoke-api.py \
  --endpoint "$API_ENDPOINT" \
  --method GET \
  --path "/jobs/batch/BATCH_ID"

Response shows real-time progress:

{
  "status": "RUNNING",
  "progress": 45.5,
  "totalJobs": 1000,
  "statusCounts": {
    "RUNNING": 195,
    "SUCCEEDED": 432,
    "FAILED": 23
  }
}

Viewing Results

After a job completes, the results are stored in your S3 output bucket.

S3 Output Structure:

Results are organized by job name and conversation ID:

s3://atx-custom-output-{account-id}/
└── transformations/
    └── {job-name}/                           # e.g., guava-early-access-comprehensive-codebase-analysis
        └── {timestamp}{conversation-id}/     # e.g., 20251227_051626_8f344f5f
            ├── code/                         # Full source code + transformed changes
            └── logs/                         # Execution logs and artifacts
                └── custom/
                    └── {timestamp}{conversation-id}/
                        └── artifacts/
                            └── validation_summary.md

Validation Summary:

AWS Transform CLI generates a validation summary showing all changes made:

s3://atx-custom-output-{account-id}/transformations/{job-name}/{timestamp}{conversation-id}/logs/custom/{timestamp}{conversation-id}/artifacts/validation_summary.md

This file contains:

  • Summary of all code changes
  • Files modified, added, or deleted
  • Validation results
  • Transformation statistics

Download Results:

# Download all results for a specific job
aws s3 sync s3://atx-custom-output-{account-id}/transformations/{job-name}/{timestamp}{conversation-id}/ ./local-results/

# Download just the validation summary
aws s3 cp s3://atx-custom-output-{account-id}/transformations/{job-name}/{timestamp}{conversation-id}/logs/custom/{timestamp}{conversation-id}/artifacts/validation_summary.md ./

# Download transformed code only
aws s3 sync s3://atx-custom-output-{account-id}/transformations/{job-name}/{timestamp}{conversation-id}/code/ ./transformed-code/

Monitoring and Observability

The solution includes a CloudWatch dashboard with operational metrics:

Job Tracking:

  • Completion rate with hourly trends (completed vs failed)
  • Recent jobs table showing job name, timestamp, last message, and log stream
  • Real-time visibility into job execution

CloudWatch Dashboard screenshot for Job tracking

API and Lambda Health:

  • API Gateway request counts and error rates
  • Lambda invocation metrics per function
  • Performance monitoring (duration by function)

CloudWatch Dashboard screenshot for API and Lambda Health

CloudWatch Logs:

All logs are centralized in CloudWatch Logs (/aws/batch/atx-transform) with real-time streaming.

View logs via AWS CLI:

aws logs tail /aws/batch/atx-transform --follow --region us-east-1

Or use the included utility:

python3 utilities/tail-logs.py JOB_ID --region us-east-1

View in AWS Console: CloudWatch → Log Groups → /aws/batch/atx-transform

Model Context Protocol (MCP) Integration

AWS Transform custom supports Model Context Protocol (MCP) servers to extend the AI agent with additional tools. Configure MCP servers via API:

python3 utilities/invoke-api.py \
  --endpoint "$API_ENDPOINT" \
  --path "/mcp-config" \
  --data '{
    "mcpConfig": {
      "mcpServers": {
        "github": {"command": "npx", "args": ["-y", "@modelcontextprotocol/server-github"]},
        "fetch": {"command": "uvx", "args": ["mcp-server-fetch"]}
      }
    }
  }'

The configuration is stored in S3 and automatically available to all transformations. Test with atx mcp tools to list configured servers.

See api/README.md for status checking, MCP configuration, and other API endpoints.

Customization for Private Repositories

You may need to access private repositories and artifact registries. Extend the base container to add credentials:

To access your private Git repositories or artifact registries during transformations:

Two approaches:

  1. AWS Secrets Manager (RECOMMENDED) – Credentials fetched at runtime, never stored in image
  2. Hardcode in Dockerfile (NOT RECOMMENDED) – For testing only

Steps:

  1. Uncomment placeholders in container/entrypoint.sh (Secrets Manager) or container/Dockerfile (hardcoded)
  2. Redeploy container (see below)

See container/README.md for complete setup instructions, examples, and security best practices.

Redeploying after customization:

If using CDK:

cd cdk && ./deploy.sh

CDK automatically detects Dockerfile changes and rebuilds. If changes aren’t detected, force rebuild:

cd cdk && ./deploy.sh —force

If using bash scripts:

cd deployment
./1-build-and-push.sh --rebuild
./2-deploy-infrastructure.sh

The infrastructure will use your custom container with private repository access. You can also customize the container to add support for additional language versions or entirely new languages based on their specific requirements.

See container/README.md for complete examples.

Note: For automated PR creation and pushing changes back to remote repositories after transformation, you have two options: (1) extend container/entrypoint.sh with git commands using your private credentials (see commented placeholder in the script), or (2) use a custom Transformation definition with MCP configured to connect to GitHub/GitLab for more sophisticated PR workflows.

Campaigns

Central platform teams can create campaigns through the AWS Transform web interface to manage enterprise-wide migration and modernization projects. For instance, to upgrade all repositories from Java 8 to Java 21, teams create a campaign with the Java upgrade transformation definition and target repository list. As developers execute transformations, repositories automatically register with the campaign, enabling you to track progress and monitor across your organization.

Creating a Campaign

  1. Setup Users and Login to AWS Transform web application
  2. Create a Workspace and Create a Job
  3. In the chat, specify the type of the job . For example , “I would like comprehensive code analysis on multiple repos”
  4. Based on your request, AWS Transform will display the list of transformation that matches the criteria, in this case “AWS/early-access-comprehensive-codebase-analysis (Early Access)”
  5. Once you confirm the transformation, AWS Transform will create a campaign and a command to execute for the transformation. You can just copy that command and execute via the API as described below replacing the repo details.
atx custom def exec \
--code-repository-path <path-to-repo> \
--non-interactive \
--trust-all-tools \
--campaign 0d0c7e9f-5cb2-4569-8c81-7878def8e49e \
--repo-name <repo-name> \
--add-repo

Executing the Transformation in a Campaign

python3 utilities/invoke-api.py \
  --endpoint "$API_ENDPOINT" \
  --path "/jobs" \
  --data '{
    "source": "https://github.com/spring-projects/spring-petclinic",
    "command": "atx custom def exec --code-repository-path /source/spring-petclinic --non-interactive --trust-all-tools --campaign 0d0c7e9f-5cb2-4569-8c81-7878def8e49e --repo-name spring-petclinic --add-repo"
  }'

Once this transformation Job is successful, you can view the results and dashboard in Web application as well.

Cleanup

To remove all deployed resources:

CDK Cleanup (Recommended)

cd cdk ./destroy.sh

Bash Scripts Cleanup (Alternate)

cd deployment ./cleanup.sh

This script deletes:

  • AWS Batch resources (compute environment, job queue, job definitions)
  • Lambda functions and API Gateway
  • IAM roles
  • S3 buckets (after emptying)
  • CloudWatch logs and dashboard
  • ECR repository

Conclusion

Enterprise software modernization requires infrastructure that can operate at scale with reliability and observability. This solution provides a production-ready platform for running AWS Transform custom transformations on thousands of repositories concurrently.

By combining AWS Batch’s scalability, Fargate’s serverless compute, and a REST API for programmatic access, you can:

  • Accelerate modernization initiatives
  • Reduce manual effort and human error
  • Gain visibility into transformation progress
  • Integrate with existing DevOps workflows

The code repository is open-source, fully automated, and ready for you to deploy in your AWS account today.

Get started today with AWS Transform custom

About the authors

Profile image for Venugopalan Vasudevan

Venugopalan Vasudevan

Venugopalan Vasudevan (Venu) is a Senior Specialist Solutions Architect at AWS, where he leads Generative AI initiatives focused on Amazon Q Developer, Kiro, and AWS Transform. He helps customers adopt and scale AI-powered developer and modernization solutions to accelerate innovation and business outcomes.

Profile image for Dinesh Balaaji Prabakaran

Dinesh Balaaji Prabakaran

Dinesh is a Enterprise Support Lead at AWS who specializes in supporting Independent Software Vendors (ISVs) on their cloud journey. With expertise in AWS Generative AI Services, he helps customers leverage Amazon Q Developer, Kiro, and AWS Transform to accelerate application development and modernization through AI-powered assistance.

Profile image for Brent Everman

Brent Everman

Brent Everman is a Senior Technical Account Manager with AWS, based out of Pittsburgh. He has over 17 years of experience working with enterprise and startup customers. He is passionate about improving the software development experience and specializes in the AWS Next Generation Developer Experience services.

AWS Transform custom: AI-driven Java modernization to reduce tech debt

Post Syndicated from Dinesh Prabakaran original https://aws.amazon.com/blogs/devops/aws-transform-custom-ai-driven-java-modernization-to-reduce-tech-debt/

In today’s rapidly evolving software landscape, maintaining and modernizing Java applications is a critical challenge for many organizations. As new Java versions are released and best practices evolve, the need for efficient code transformation becomes increasingly important. Organizations today face significant challenges when modernizing their Java applications. Legacy codebases often contain outdated patterns, deprecated APIs, and inefficient implementations that hinder performance and maintainability. Traditional manual refactoring approaches are time-consuming, error-prone, and difficult to scale across large codebases. In addition, as developers spend more time on new development and deployment, the volume of technical debt continues to rise, requiring transformation of legacy code at-scale.

AWS Transform custom addresses these challenges through intelligent automation, providing AWS-managed transformations – standardized transformation packages for common scenarios like Java version upgrades. These transformations enable teams to achieve quick wins through standardized, tested transformation patterns that can be executed at scale, bringing significant time and cost savings to customers. In addition, customers can create custom user defined transformations to address technical debt with code transformations across languages, frameworks, and more.

This post explores how to leverage AWS Transform custom’s out-of-the-box transformation for Java upgrades. By the end of this post, you’ll understand how to use these standardized transformations to modernize your Java applications efficiently while maintaining full control over the transformation process.

Introduction to AWS Transform custom

AWS Transform custom uses agentic AI to automate large-scale code modernization, handling language version upgrades, API migrations, framework updates, and organization-specific transformations. Through continual learning, the agent improves from every execution and developer feedback, delivering high-quality, repeatable transformations without requiring specialized automation expertise.

Prerequisites

Before starting your Java modernization journey with AWS Transform custom, ensure you have the necessary development environment, build tools, and AWS Transform custom command line interface (CLI) installed. For detailed prerequisites and setup instructions, refer to the AWS Transform custom Prerequisites Guide.

Understanding the Modernization Scenario

We’ll demonstrate AWS Transform custom using a Movie Service application – a Spring Boot REST API built on Java 8 with Gradle. This represents a typical enterprise modernization challenge with legacy dependencies, outdated patterns, and technical debt.

Leveraging AWS-Managed Transformations

AWS Transform custom focuses on leveraging AWS-managed transformations designed for common modernization tasks like Java version upgrades.

AWS-managed transformations are pre-built, AWS-vetted transformations for common use cases that are ready to use without any additional setup. These transformations provide immediate value with minimal configuration, making them ideal for standard upgrade scenarios.

Understanding AWS Transform custom CLI Capabilities

AWS Transform custom provides a comprehensive command-line interface that enables both interactive and automated transformation workflows:

atx --version                    # Display ATX version
atx --help                       # Display general help
atx custom def list              # List transformation packages
atx                              # Start interactive conversation

For detailed information on all available commands, refer to the AWS Transform custom command reference.

Screenshot of AWS Transform custom interactive mode.
Figure 1:AWS Transform custom interactive mode

Discovering Available Transformations

Use atx custom def list to view all available transformations, including AWS-managed transformations and custom-defined (user-defined) transformations created by your organization. Key AWS-managed transformations include Java/Python/Node.js version upgrades and AWS SDK migrations.

Screenshot of AWS Transform interface displaying categorized lists of AWS Managed transformations and user-defined custom
transformations.
Figure 2: AWS Transform custom lists available AWS Managed and custom-defined (user-defined) transformations

Applying AWS-Managed Transformations

Before applying any transformations, ensure your project is initialized with Git and that all build and test cases are working correctly with Java 8 (Test cases can be skipped when necessary by using the appropriate build command option and instructions to the agent). For Gradle projects, verify that ./gradlew build executes successfully.

The transformation process follows a structured approach:

  1. Ensure Clean Git State:
git status
git add .
git commit -m "Baseline before Java 21 transformation"
  1. Apply Transformation: You can apply transformations using either interactive or direct command modes. In this blog, we will use the interactive mode to walk through the process step-by-step:

Interactive Mode (used in this blog):

First, create a config.json file with your transformation configuration:

{
  "codeRepositoryPath": "/path/to/your/aws-appconfig-java-sample-gradle",
  "transformationName": "AWS/java-version-upgrade",
  "buildCommand": "./gradlew clean build",
  "validationCommands": "build and validate using \"./gradlew clean build\" after transformation to test with java 21",
  "additionalPlanContext": "This is a Java 8 to 21 transformation of a gradle app , also include all dependency migration as well. Use java path /path/to/your/java-8/bin/java and /path/to/your/java-21/bin/java when building before and after transformation. We are using gradle wrapper gradlew, update it if needed for java 21 upgrade. Check for deprecated methods and dependencies and update them."
}

Update the codeRepositoryPath in your config.json to point to your local project directory and update the Java path in additionalPlanContext to match your Java 8 and 21 installation. For more details about configuration files and their parameters, refer to Using Configuration Files.

Then execute the transformation in interactive mode (used for this blog walkthrough):

For Java version upgrade with Gradle using config.json (Interactive Mode):
atx custom def exec -t --configuration file://config.json

Screenshot of AWS Transform interface displaying categorized lists of AWS Managed transformations and user-defined custom transformations.
Figure 3: AWS Transform custom execute a gradle transformation in interactive mode with transformation configuration supplied from config.json

Direct Command Mode (alternative approach): Use this mode for automated CI/CD pipelines or when you want to execute transformations without interactive prompts.

atx custom def exec -x -t --configuration “file://config.json”

Parameter explanation: –

--configuration: Specifies the configuration file for interactive mode

– -x: Executes the transformation automatically without interactive prompts (direct mode)

– -t: Enables test mode for validation during execution (direct mode)

--configuration: Specifies the configuration file path with file://prefix (direct mode)

ATX Execution Command Executing AWS managed Java version upgrade transformation for Gradle project using ATX CLI

  1. Review Transformation Plan: AWS Transform custom analyzes your project based on the configuration provided in config.json and generates a comprehensive transformation plan. This plan details all proposed changes, including:
  • Java version updates: Migration from Java 8 to Java 21 configurations
  • API migration patterns: Automatic updates for deprecated APIs and modern alternatives
  • Framework modernization: Spring Boot version upgrades and compatibility updates
  • Dependency modifications: Updated library versions compatible with Java 21
  • Build system updates: Gradle configuration and plugin changes for Java 21 compatibility
  • Code pattern improvements: Implementation of modern Java features and best practices

We recommend doing a thorough review of the transformation plan to ensure it encompasses all expected updates. The additionalPlanContext in your config.json helps guide the transformation to include dependency migrations and Gradle wrapper updates. If adjustments are needed, provide feedback through the CLI interface.

Additionally, if you want to customize the transformation to target additional changes, for example upgrading additional legacy dependencies contained in the project, you can provide this as feedback when reviewing the transformation plan. AWS Transform custom incorporates all feedback provided to refine the transformation plan before proceeding.

  1. Apply the Transformation: After confirming the transformation plan meets your requirements, type proceed and press Enter. AWS Transform custom executes the transformation according to the approved plan.

The transformation process automatically:

– Creates a new branch and commits the transformed changes in there

– Updates Gradle configuration for Java 21

– Migrates Java EE to Jakarta EE packages (if applicable)

– Updates framework dependencies for Java 21 compatibility

– Applies all necessary code changes

– Updates test cases and testing frameworks for Java 21 compatibility

– Runs comprehensive validation builds

Results of AWS-Managed Transformations

After applying the Java version upgrade transformation, below changes are observed:

Configuration Updates: – Java version: 1.8 → 21 – Spring Boot version upgrades – Gradle plugin and configuration updates – Dependency version modernization

To validate the changes, switch to Java 21 and run ./gradlew build to ensure the transformation was successful, then test the application functionality.

Figure 4: displaying Updated Gradle Configuration Gradle build.gradle showing updated Java 21 configuration and modernized
dependencies
Figure 4: Updated Gradle Configuration Gradle build.gradle showing updated Java 21 configuration and modernized dependencies

Figure 5: Updated code where legacy pattern of raw types usage is transformed to generics
Figure 6: Second example of updated code where legacy pattern of raw types usage is transformed to generics
Figure 7: Updated dependency from javax.security to java.security and uses CertificateFactory to get X509Certificate
Figure 7: Updated dependency from javax.security to java.security and uses CertificateFactory to get X509Certificate
Figure 8: Updated Test cases from junit 4 to junit5

Beyond AWS-Managed Transformations: Custom-Defined Transformations

While AWS-managed transformations provide excellent coverage for standard Java modernization scenarios, there are cases where the available AWS-managed transformations may not address your specific transformation requirements. In such situations, AWS Transform custom enables users to create and test their own organization specific, custom-defined transformation definitions.

When to Create Custom-Defined Transformations

Custom-defined transformations become necessary when AWS-managed transformations don’t cover your specific needs, such as proprietary frameworks, organization-specific coding standards, or complex multi-step migration scenarios.

Creating Custom-Defined Transformations

AWS Transform custom enables teams to develop custom transformations using transformation rules and configuration files. This allows organizations to define transformation logic specific to their requirements, test on sample code, and share validated transformations across teams.

AWS Transform custom’s interactive mode (atx) is particularly beneficial for creating Custom-defined transformations, enabling conversational interaction to iteratively refine requirements and get real-time feedback. Custom-defined transformations provide flexibility to extend AWS Transform custom’s capabilities when AWS-managed transformations don’t meet specific modernization needs.

Continual Learning and Knowledge Items

AWS Transform custom automatically learns from each transformation execution to improve future results. For Java upgrades specifically, the service captures patterns like successful refactoring strategies, common dependency conflicts, and framework compatibility matrices across Java versions. This knowledge feeds back into future transformations, making them more accurate at predicting successful upgrade paths and reducing manual intervention.

Knowledge items are account-specific and remain within your AWS account boundaries. Users can enable or disable continual learning, providing full control over this preference.

Conclusion

In this blog, we demonstrated how AWS Transform custom enables efficient Java application modernization using AWS managed transformations. Starting with a legacy Movie Service application running Java 8 and Spring Boot 2.x, we successfully transformed it to Java 21 with modern dependencies and patterns.

The step-by-step process showed how to establish a baseline, discover available transformations using atx custom def list, and apply transformations through AWS Transform custom’s CLI. The result was a fully modernized application with updated Java versions, Spring Boot upgrades, and modern Java features like enhanced switch expressions and local variable type inference – all achieved in minutes rather than weeks of manual refactoring.

Beyond Java Modernization

Beyond Java modernization, AWS Transform custom’s transformation capabilities extend to other programming languages and frameworks, making it a versatile solution for comprehensive application portfolio modernization across diverse technology stacks. The agent supports diverse transformation use cases including:

  • Version upgrades for Java, Python, and Node.js
  • Runtime and API migrations (AWS SDK v1→v2, Boto2→Boto3)
  • Framework transitions and upgrades
  • Language translations and architectural changes
  • Organization-specific, custom-defined transformations

Through its define once, transform everywhere approach, AWS Transform custom enables organizations to capture and amplify transformation knowledge by defining transformations once and executing repeatable tasks across the entire organization. This reduces knowledge silos and ensures consistent quality regardless of team or project scope.

Getting Started

Ready to modernize your Java applications with AWS Transform custom? Here’s how to begin:

  1. Install AWS Transform custom CLI (atx) using the installation script and verify your environment
  2. Configure AWS credentials with transform-custom:* permissions
  3. Explore available AWS-managed transformations using atx custom def list
  4. Apply transformations to your Java applications using direct execution mode (atx custom def exec) or interactive mode (atx)
  5. Validate results through comprehensive testing with ./gradlew build for Gradle projects
  6. Scale across your application portfolio for consistent modernization

Additional Resources

For detailed setup instructions and documentation, visit:

Start your modernization journey today and experience the power of AI-driven code transformation at scale.

About the authors

Profile image for Venugopalan Vasudevan

Venugopalan Vasudevan

Venugopalan Vasudevan (Venu) is a Senior Specialist Solutions Architect at AWS, where he leads Generative AI initiatives focused on Amazon Q Developer, Kiro, and AWS Transform. He helps customers adopt and scale AI-powered developer and modernization solutions to accelerate innovation and business outcomes.

Profile image for Dinesh Balaaji Prabakaran

Dinesh Balaaji Prabakaran

Dinesh is a Enterprise Support Lead at AWS who specializes in supporting Independent Software Vendors (ISVs) on their cloud journey. With expertise in AWS Generative AI Services, he helps customers leverage Amazon Q Developer, Kiro, and AWS Transform to accelerate application development and modernization through AI-powered assistance.

Profile image for Sureshkumar Natarajan

Sureshkumar Natarajan

Sureshkumar Natarajan is a Senior Technical Account Manager at AWS, where he supports Enterprise customers in their cloud journey with a focus on Generative AI initiatives. He guides organizations in leveraging Amazon Q Developer, Kiro, and AWS Transform to unlock new capabilities, streamline development workflows, and achieve transformative business results.

Profile image for Anjan Dave

Anjan Dave

Anjan Dave is a Principal Solutions Architect at AWS with over 25 years of IT experience. He specializes in generative AI application modernization, infrastructure scalability, and developer productivity initiatives.
Anjan leads GenAI and modernization strategies across global projects, influencing technology roadmaps for HCM providers through event-driven and microservices architectures. He advocates for integrating Generative AI into the software development lifecycle to automate routine tasks, enabling engineering teams to focus on high-value architectural work.

ICYMI: Experts on Experts – Season One Roundup

Post Syndicated from Emma Burdett original https://www.rapid7.com/blog/post/it-icymi-rapid7-experts-on-experts-season-one-roundup

In 2025, we launched Experts on Experts: Commanding Perspectives as a pilot video series designed to spotlight the ideas shaping cybersecurity, directly from the people driving them. Over five episodes, Rapid7 leaders shared short, candid conversations on topics like agentic AI, MDR ROI, cybercrime-as-a-service, and policy in practice. With Season Two launching soon, now is the perfect time to revisit the first run of expert conversations that started it all. 

Each episode is now embedded in its supporting blog on rapid7.com, making it even easier to watch, read, and share. Here’s your full recap of Season One.

Ep 1: What Happens When Agentic AIs Talk to Each Other?

Guest: Laura Ellis, VP of Data & AI
Read and watch

Agentic AI was one of the most talked-about themes of the year, but few tackled it with the clarity and urgency Laura Ellis brought to this episode. From governance models to inter-agent deception, the conversation explores how AI systems can interact in unpredictable ways. Laura shares her perspective on keeping humans at the helm, how to contain agent behavior in real-world infrastructure, and what’s realistic for security teams today. The episode came from a LinkedIn conversation about autonomy, oversight, and the potential for agent-to-agent manipulation, and answered a lot of questions. If you’re curious about how AI moves from experiment to ecosystem, this is a great place to start.

Ep 2: What MDR ROI Really Looks Like

Guest: Jon Hencinski, VP of Managed Threat Complete
Read and watch

In this open and honest conversation, Jon Hencinski takes us inside the modern SOC to show what strong managed detection and response really looks like. From coverage and telemetry to analyst training and noise reduction, the episode walks through the building blocks of a high-performing MDR program. Jon speaks directly to security leaders and decision-makers, breaking down which metrics matter most, how to measure confidence in your provider, and why speed is still the differentiator. If you’re evaluating MDR partners or trying to articulate the value of your program internally, this episode offers a practical benchmark. It also pairs well with Rapid7’s IDC report on MDR business value, which (Spoiler Alert) found a 422% three-year ROI and payback in under six months.

Ep 3: The Business of Cybercrime

Guest: Raj Samani, SVP and Chief Scientist
Read and watch

Cybercrime is no longer just a threat, it’s an economy. In this episode, Raj Samani unpacks the business model behind ransomware, initial access brokers, and affiliate operations. He shares his view on how cybercriminals are scaling operations like startups, what security teams can do to map that behavior, and why understanding the economy of access is key to disruption. It’s an insightful look at how attacker innovation is outpacing the traditional response, and what needs to change. Raj also reflects on the blurred lines between opportunistic access and long-tail ransomware campaigns, and how buyers on the dark web shape the threat landscape. This conversation is especially useful for defenders who want to think more strategically about adversaries and the systems that support them.

Ep 4: What SOC Teams Are Doing Differently in 2025

Guest: Steve Edwards, Director of Threat Intelligence and Detection Engineering
Read and watch

This episode walks through the key findings of Rapid7’s IDC study on the business value of MDR and brings them to life through real-world SOC operations. Steve Edwards shares how telemetry access changes the game, what true coverage looks like in practice, and why teams are shifting away from reactive models to faster, context-rich detection. You’ll hear what happens in the first 24 to 48 hours of incident response and how Rapid7’s no-cap IR model improves confidence during high-pressure moments. Steve also breaks down how teams are using MITRE ATT&CK  mapping to prioritize security investments and measure response maturity over time. For security leaders and buyers evaluating managed services, this conversation offers a clear, practical lens on what a successful MDR program looks like from a security and business perspective.

Ep 5: Policy to Practice – What Cyber Resilience Really Takes

Guest: Sabeen Malik, VP of Global Government Affairs and Public Policy
Read and watch

With new regulations emerging across the globe, it’s easy to confuse compliance with resilience. In this episode, Sabeen Malik unpacks what it takes to bridge that gap. She talks through disclosure laws, geopolitical tension, and the difficulty of turning policy into something operators can act on. Sabeen brings both policy expertise and operational realism, making the case that cybersecurity regulation needs to be built for the real world, not for a checklist. She also explores the cultural side of risk, including how insider threats and trust-based frameworks play into resilience planning. If your organization is tracking regulatory changes or working toward a more mature security posture, this episode offers a smart lens on where policy can help, and how to overcome it’s shortfalls.

Patch Tuesday and the Enduring Challenge of Windows’ Backwards Compatibility

Post Syndicated from Adam Barnett original https://www.rapid7.com/blog/post/ve-patch-tuesday-windows-backwards-compatibility-challenge

Introduction

If you received an email with the subject “I LOVE YOU” and an attachment called “LOVE-LETTER-FOR-YOU.TXT”, would you open it? Probably not, but back in the year 2000, plenty of people did exactly that. The internet learned a hard lesson about the disproportionate power available to a university dropout with some VBScript skills, and millions of ordinary people suffered the anguish of deleted family photos or even reputational damage as the worm propagated itself across their entire Outlook address book.

In the quarter century since ILOVEYOU rampaged across global networks, cybersecurity has moved from a niche topic to an “everyone” problem, and many users are wary of all sorts of threats. In recent years, the increasing ubiquity and urgency of AI adoption across the business landscape has attracted the attention of both security researchers and threat actors.

Of course, recency bias and shiny object fixation are real. Even as AI and automation continue to drive down time to known exploitation (TTKE), an attacker who abuses a traditional exploit chain to achieve SYSTEM privileges on a sensitive server still has the keys to the kingdom.

Wormable remote code execution (RCE) vulnerabilities remain rare, but well over half of the 25 exploited-in-the-wild zero-day vulnerabilities published by Microsoft during 2025 provided attackers with elevation of privilege opportunities on Windows assets. Some of those flaws are older than the iPhone, let alone ChatGPT.

Microsoft’s decades-long commitment to backwards compatibility creates a conveyor belt supply of déjà vu vulnerabilities. Ultimately, the most pressing threats faced by defenders managing Microsoft estates remain essentially unchanged. Rather than a new wave of AI-related flaws, the chief danger stems from the towering tech debt within core Windows components.

A whirlwind tour of exploited-in-the-wild Microsoft vulnerabilities (2025 edition)

If we really want to know which Microsoft vulnerabilities will provide the most value to attackers in 2026, we should ask a threat actor. Since that might prove difficult to arrange, we’ll do the next best thing: review vulnerabilities exploited in the wild during 2025.

⠀

Chart-exploited-in-the-wild-eitw-microsoft-by-vulnerable-component-rapid7.png
Chart 1: Exploited-in-the-wild Microsoft vulnerabilities, by vulnerable component

January: The great escape

The vast Microsoft ecosystem has something for everyone, whether customer or threat actor. Patch Tuesday January 2025 brought us a trio of exploited-in-the-wild Hyper-V kernel vulnerabilities. By September 2025, at least one plausible public proof-of-concept (PoC) for CVE-2025-21333 was published by a vulnerability researcher who apparently shares a name with a Kazakhstani Olympic gymnast. The only safe assumption is that a well-resourced threat actor could develop a private exploit far in advance of that.

Starting from a child VM or Windows Sandbox, exploitation first requires setting out a banquet of benign requests for the hypervisor, delivered via the Hyper-V Virtualization Service Provider (VSP). The goal: mass-allocating objects to arrange large swathes of hypervisor memory in a predictable pattern (aka “heap feng shui”). Next, the attacker sends a malicious request with an oversized buffer, which an unpatched VSP merrily copies into kernel memory, overwriting the header of the adjacent object, whose relative position is now easily surmised. Once the kernel subsequently references the artfully corrupted sibling object, execution as SYSTEM jumps to a portion of memory where the attacker has planted shellcode to exfiltrate a token. The compromised hypervisor could be anything from a developer laptop running a malicious container all the way up to enterprise private cloud infrastructure.

So far, January 2025 is the only time that Microsoft has ever published vulnerabilities in the Hyper-V VSP. Generally speaking, a significant degree of sophistication is required to develop successful exploits of this nature. This goes double if the name of the game is stealth and stability, since a wave of unexplained BSOD events on critical production infrastructure tends to attract blue team attention. Still, once a viable proof of concept hits the public internet, ransomware crews will fold it into their toolkits, and someone, somewhere, is either sitting on an unknown Hyper-V VSP exploit, or hard at work creating the next one.

February: Socket to me

It’s hard to imagine a modern computer without storage or networking capabilities. In fact, it’s hard to imagine a computer from several decades ago without storage or networking. Microsoft is now middle-aged, and that means that buried deep within your shiny new PC are a variety of architectural decisions and logic paths born in the 1980s. If this sounds far-fetched, take a minute to find yourself a fully-patched Windows 11 25H2 machine, and then try to rename any file or directory CON, NUL or PRN. I’ll wait.

Generally speaking, user-mode applications are prevented from wreaking havoc on the kernel through a careful separation of concerns. On Windows, when a user mode application wants to communicate over the network, it talks to WinSock, which in turn talks to the ancillary function driver (AFD), which sits on the kernel side, and coordinates with the kernel network drivers which handle the actual traffic. The AFD is a security boundary between user space and kernel space, and it must be universally accessible to local processes, because even a browser tab in a sandbox needs to make network calls. Any defect in the way AFD parses input from user space can thus provide a way to influence the kernel in unexpected ways. A number of advanced exploit development courses, including offerings from SANS and OffSec, cover AFD in detail.

⠀

chart-Windows-AFD-vulnerabilities-timeline-rapid7.png
Chart 2: Windows AFD vulnerabilities timeline, 2021-2025

⠀

Patch Tuesday February 2025 brought us CVE-2025-21418, which Microsoft credited to Anonymous. We don’t know whether the unnamed tipster provided evidence of exploitation in the wild, or whether Microsoft threat hunters subsequently tracked down their own trail of suspicious bread crumbs, but notorious threat actors such as North Korea’s Lazarus are known to be enthusiastic students of AFD exploits. With several high-profile zero-day vulnerabilities emerging from AFD from late 2024 onwards, it tracks that Microsoft subsequently published and patched a cluster of AFD vulnerabilities in the latter half of 2025.

March: File system shenanigans

Any defenders who had enjoyed a quieter start to the year were rudely awakened by Patch Tuesday March 2025, when six exploited-in-the-wild vulnerabilities all dropped at once. Exploitation of most of the zero-day vulnerabilities published in March starts with the user mounting a malicious Virtual Hard Disk (VHD) image or plugging in a malicious USB stick so that the attacker can exploit a weakness in a filesystem driver, including NTFS and FastFAT.

Remember that information security training which asked you to imagine finding a USB stick with an “IMPORTANT (CONFIDENTIAL)” label on the floor outside the office? The one which asked if you would A) plug the mystery stick into your work PC B) use your boss’ personal laptop in case the files are business critical C) try it in all the PCs in the office until someone asks you to stop or D) report it immediately to the security officer? This is why.

Meanwhile, the true villain of the month was almost certainly CVE-2025-24983, a no-user-interaction-required elevation of privilege vulnerability in the Win32 kernel subsystem. At the time, we pondered why Windows 11 and Server 2019 onwards didn’t receive patches for what looks like a fairly severe vulnerability, but since Microsoft is gradually reimplementing portions of the kernel in memory-safe Rust, we can hope that the vulnerability simply doesn’t exist in modern Windows.

April: Common Log File System driver vulns are quite common

If anyone ever corners you at a party and talks at length about the Ancillary Function Driver as a bounteous source of elevation of privilege vulnerabilities, you will probably have to concede that they are technically correct. While your options include “doing a lap” and then climbing out of the bathroom window, the power move here is to hold your ground, and point to the Common Log File System driver as a far richer vein of exploitable goodness.

As of Patch Tuesday April 2025, CLFS boasts almost twice the number of total vulnerabilities over the past five years vs. AFD, and more than double the number of known-exploited zero-day vulnerabilities. It really is the gift which keeps on giving.

⠀

chart-windows-CLFS-vulnerabilities-timeline-rapid7.png
Windows CLFS vulnerabilities timeline, 2021-2025

⠀

It makes sense that something like the Ancillary Function Driver lives in kernel space. After all, something has to sit inside the perimeter to marshall all those network requests from dozens of Chrome tabs. What about the Common Log File System driver though?

It would be tempting to imagine that anything which simply handles log files shouldn’t need direct kernel access at all. When exploring this concept, it’s useful to understand that not only was CLFS designed a long time ago, when high performance in user mode was harder to achieve than it is today, but also that CLFS is much more than simply a means to interact with log files. CLFS is the home of still-essential building blocks like Transactional NTFS (TxF), first introduced almost 25 years ago in Windows Vista, which provides a means for applications to guarantee the integrity of data on disk.

For the past several years, Microsoft has strongly recommended that developers avoid the use of TxF, and while Microsoft is gradually providing modern alternatives to TxF functionality, essential Windows functions such as Windows Update still rely on it to manage critical file integrity. Moreover, CLFS is more than just TxF, and is so tightly integrated into Windows that it’s here to stay for the foreseeable future.

May: The month of expectation, wishes, hope, and classic Windows zero-days [1]

A few days after Patch Tuesday May 2025, Satya Nadella took to the stage at Microsoft Build 2025 to pitch his vision of the open agentic web, although exactly who this version of the future would be open to remains an open question, like: What if a cloud email service was vulnerable to a zero-click prompt injection attack, but could also now buy things with your credit card?

While critical reception for the open agentic web has been mixed, threat actors will be glad of the new attack surface. Meanwhile, defenders worried about in-the-wild exploitation were hard at work patching some more frequent fliers, including another pair of CLFS vulnerabilities and an MSHTML/Trident arbitrary code execution bug. That last one will be familiar to regular Patch Tuesday watchers, but it might come as a surprise to anyone who thought Internet Explorer had gone to live on a nice farm upstate years ago.

The Ancillary Function Driver made another appearance, although it couldn’t quite summon the same main character energy this time around. The May 2025 episode of “AFD vulns exploited in the wild” offered elevation to Administrator, rather than SYSTEM, and a lower exploit code maturity rating. We can always be grateful for small mercies.

[1]: With apologies to Emily Brontë.

June: I’m afraid I can’t let you do that, WebDAV

Windows archeologists and internet users of a certain age may remember WebDAV, a standard originally dreamed up to support interactivity on the web. It was employed by versions of Microsoft Exchange up to and including 2010 to handle interactions with mailboxes and public folders.

Surprising no-one, Windows still more or less supports WebDAV, and it was only a matter of time before that turned out to be a bit of a problem, in the form of CVE-2025-33053 published as part of Patch Tuesday June 2025. Microsoft acknowledged Check Point Research (CPR) on the advisory; CPR in turn attributes exploitation to an APT (Advanced Persistent Threat), which they track as the objectively cool-sounding Stealth Falcon, an established threat actor with a long-running interest in governments and government-adjacent entities across the Middle East and beyond.

June 2025 also saw the publication of CVE-2025-32711, a critical information disclosure vulnerability in Microsoft 365 Copilot. Microsoft is not aware of exploitation in the wild. The researchers named it EchoLeak, describing it as “the first real-world zero-click prompt injection exploit in a production LLM system,” although other researchers arguably got there first.

EchoLeak relies on hidden white-text-on-white-background instructions in an email, which are then ingested into the LLM via RAG (Retrieval-Augmented Generation) when the user asks an entirely pedestrian question (e.g. “Summarize my emails from the past two days”) which requires Copilot to scan the inbox. The malicious instructions have two parts: First, dig up some juicy info, and then retrieve an image from an attacker-controlled server with the sensitive data exfiltrated as a URL parameter.

EchoLeak circumvented Copilot’s Content Security Policy by making the request via a trusted Microsoft service: a now-patched Teams image preview proxy. History suggests that attackers will find other ways out of the walled garden. The Microsoft advisory makes a virtue of minimalism by providing almost no information about the nature of the vulnerability, although Microsoft is surely to be commended for assigning CVEs for cloud service vulnerabilities.

July: The call is coming from inside the intranet

When Patch Tuesday July 2025 came and went without a single exploited-in-the-wild vulnerability published, many people may have breathed a sigh of relief. Possibly this was a valid move, at least for anyone not responsible for a SharePoint instance.

SharePoint defenders will remember July as the month of ToolShell, an actively-exploited vulnerability chain in SharePoint which Microsoft published out of band ten days after Patch Tuesday. Out of band patches for Microsoft flagship products are rare, since they inevitably cause downstream disruption. Once MSTIC publicly attributes exploitation to two Chinese nation-state actors, that line has been crossed.

The vulnerability described by the out-of-band CVE-2025-53770 turned out to be a bypass for the patch introduced by CVE-2025-49704 earlier in the month, which was itself a response to a successful Pwn2Own Berlin entry from May.

August: It’s almost too quiet

Microsoft was not aware of exploitation in the wild for any of the vulnerabilities published as part of Patch Tuesday August 2025. SharePoint admins may have been dealing with the fallout from last month’s ToolShell and bracing for a possible repeat, but August might otherwise have made for an eerily quiet month. Still, the Windows implementation of Kerberos managed to cough up a publicly-disclosed elevate-to-domain-admin vulnerability.

Separately, we learned that simply saving a JPEG could be enough to hand an attacker RCE capabilities, because the internet never sleeps. If the vulnerable codepath had been within JPEG decoding, rather than encoding, this one could have been the biggest vuln of the year.

September: Almost too quiet, part 2

Patch Tuesday September 2025 was the second month in a row with no known-exploited vulnerabilities, but vuln spotters will appreciate that this month saw the publication of a fairly rare beast: a Microsoft vulnerability with a perfect(?) CVSS v3 base score of 10.0, albeit a cloud service vulnerability discovered by Microsoft and patched prior to publication. No customer action required, but also no customer verification possible, and since the impacted cloud service was Azure Networking, the blast radius could have been stupendous.

October: Dial M for exploitation

These days, there are plenty of seasoned IT professionals who don’t even know what a dialup modem negotiation song sounds like, simply because broadband has been around for that long. For younger readers, “broadband” is what we used to call “internet fast enough that you don’t have to wait to download a single email attachment”.

By this point, we all know where this is going: Windows still ships with modem capabilities well beyond their sell-by date, and someone found a good old elevation of privilege vulnerability. The vulnerable fax modem driver was developed almost 30 years ago by a long-defunct third party, and Microsoft has now taken uncharacteristically bold action by removing it from Windows altogether, perhaps recognizing that traditional landlines are no longer available at all in many places. Are there other fax modem drivers still lurking in Windows? You betcha.

Patch Tuesday October 2025 also marked the end of Windows 10, unless you count the cash-for-patches Extended Security Updates (ESU) program.

November: Kernel vuln? Popcorn time

Patch Tuesday November 2025 included an exploited-in-the-wild vulnerability in the Windows kernel itself. While the advisory was light with details, exploitation of CVE-2025-62215 led to elevation to SYSTEM, presumably via a complex bit of memory management three card monte. Those kernel Rust rewrites can’t come soon enough.

December: A cloud of suspicion

After a year filled with variations of the same old exploitable vulns, it might almost be refreshing to consider the altogether more modern-sounding exploited-in-the-wild vulnerability published on Patch Tuesday December 2025. CVE-2025-62221 describes an elevation of privilege vulnerability in the Windows Cloud Files Mini Filter Driver.

On Windows, a file or directory can contain a reparse point, a collection of user-controlled metadata designed to be interpreted by a file filter driver. An example would be a file which appears present in a local folder, but where the actual contents of the file are stored remotely on OneDrive. The user double-clicks on the file, the file filter driver intercepts the request, reads the metadata, and calls out to OneDrive, while the user gets the experience of opening the file as though it had been stored locally. Of course, the file filter driver needs kernel access to perform its duties. Find an exploitable flaw in the way a file filter driver parses the metadata, and you can trick it into doing things like overwriting protected system files.

What’s next?

Everything gets faster, including bad things

As Rapid7 has observed repeatedly, time to known exploitation for widely-exploited vulnerabilities has been shrinking year-on-year. By 2022, the time to exploitation after public disclosure for some of the most notable security vulnerabilities was as low as 24 hours. With exploit development now widely augmented by automation and AI, there is every reason to suppose that the window will continue to shrink further.

Threat actors will stay best friends with elevation of privilege vulns

A wormable unauthenticated RCE vulnerability remains the scariest scenario, but mercifully these are historically rare. The one-two combo of minimally-privileged initial access and local privilege escalation presents a much more clear and present danger in most modern threat models. Sure, you could parachute in from a helicopter, abseil down from the roof, and crawl through an air vent to steal the diamond, but why bother when you could simply tailgate a delivery driver, and then distract a maintenance worker while you swipe their all-access keycard?

AI is here to stay, but tech debt is the real killer

In 2026, Microsoft will regularly publish AI-related vulnerabilities, and AI-wielding threat actors will hammer Microsoft’s cloud services. Blue teams managing significant Windows estates will still spend more time worrying about on-prem vulnerabilities where the root cause is a classic software engineering snafu.

Final thoughts

Arguably the biggest takeaway from 2025 is that the more things change, the more they stay the same. The scariest Microsoft vulnerabilities tend to emerge from the same few familiar places: core Windows components with codebases older than many of the humans who rely on them.

Microsoft’s wildly successful business model is founded on a decades-long insistence on ironclad backwards compatibility. Why? Enterprise customers with deep pockets and deeper catalogues of ancient business applications. These retro capabilities come at a high price: a supervolcano of tech debt potentially unmatched in all of human history, and a seemingly endless supply of sort-of-new but depressingly familiar vulnerabilities.

For anyone responsible for defending a significant Microsoft footprint in 2026, tomorrow’s biggest problem remains today’s secrets exposed by yesterday’s software design choices.

From AI agent prototype to product: Lessons from building AWS DevOps Agent

Post Syndicated from Efe Karakus original https://aws.amazon.com/blogs/devops/from-ai-agent-prototype-to-product-lessons-from-building-aws-devops-agent/

At re:Invent 2025, Matt Garman announced AWS DevOps Agent, a frontier agent that resolves and proactively prevents incidents, continuously improving reliability and performance. As a member of the DevOps Agent team, we’ve focused heavily on making sure that the “incident response” capability of the DevOps Agent generates useful findings and observations. In particular, we’ve been working on making root cause analysis for native AWS applications accurate and performant. Under the hood, DevOps Agent has a multi-agent architecture where a lead agent acts as an incident commander: it understands the symptom, creates an investigation plan, and delegates individual tasks to specialized sub-agents when those tasks benefit from context compression. A sub-agent executes its task with a pristine context window and reports compressed results back to the lead agent. For example, when examining high-volume log records, a sub-agent filters through the noise to surface only relevant messages to the lead agent.

In this blog post, we want to focus on the mechanisms one needs to develop to build an agentic product that works. Building a prototype with large language models (LLMs) has a low barrier to entry – you can showcase something that works fairly quickly. However, graduating that prototype into a product that performs reliably across diverse customer environments is a different challenge entirely, and one that is frequently underestimated. This post shares what we learned building AWS DevOps Agent so you can apply these lessons to your own agent development.

In our experience, there are five mechanisms necessary to continuously improve agent quality and bridge the gap from prototype to production. First, you need evaluations (evals) to identify where your agent fails and where it can improve, while establishing a quality baseline for the types of scenarios your agent handles well. Second, you need a visualization tool to debug agent trajectories and understand where exactly the agent went wrong. Third, you need a fast feedback loop with the ability to rerun those failing scenarios locally to iterate. Fourth, you need to make intentional changes: establishing success criteria before modifying your system to avoid confirmation bias. Finally, you need to read production samples regularly to understand actual customer experience and discover new scenarios your evals don’t yet cover.

Evaluations

Evals are the machine learning equivalent of a test suite in traditional software engineering. Just like building any other software product, a collection of good test cases builds confidence in quality. Iterating on agent quality is similar to test-driven development (TDD): you have an eval scenario that the agent fails (the test is red), you make changes until the agent passes (the test is green). A passing eval means the agent arrived at an accurate, useful output through correct reasoning.

For AWS DevOps Agent, the size of an individual eval scenario is similar to an end-to-end test in the traditional software engineering testing pyramid. Looking through the lens of “Given-When-Then” style tests:

  • Given – The test setup portion tends to be the most time-consuming to author. For the AWS DevOps Agent, an example eval scenario includes an application running on Amazon Elastic Kubernetes Service composed of several microservices fronted by Application Load Balancers, reading and writing from data stores such as Amazon Relational Database Service databases and Amazon Simple Storage Service buckets, with AWS Lambda functions doing data transformations. We inject a fault by deploying a code change that accidentally removes a key AWS Identity and Access Management (IAM) permission to write to S3 deep in the dependency chain.
  • When – Once the fault is injected, an alarm fires, and this triggers the AWS DevOps Agent to start its investigation. The eval framework polls the records that the Agent generates, just like how the DevOps Agent web application renders them. This section isn’t fundamentally different from defining the action in an integration or end-to-end test.
  • Then – This asserts and reports on multiple metrics. Fundamentally, there’s a single “PASS” (1) or “FAIL” (0) metric for quality. For the DevOps Agent’s incident response capability, a “PASS” means the right root cause surfaced to the customer – in our example, this means identifying the faulty deployment as the root cause and tracing the dependency chain to surface the impacted resources and observations that reveal the missing S3 write permission; otherwise “FAIL”. We define this as a rubric: not just “did the agent find the root cause?” but “did the agent arrive at the root cause through the correct reasoning with the right supporting evidence?”The ground truth (the “expected” or “wanted” in software testing parlance) is compared to the system response (the “actual”) via an LLM Judge – an LLM that receives both the ground truth and the agent’s actual output, then emits its reasoning and a verdict on whether they match. We use an LLM for comparison because the agent’s output is non-deterministic: the agent follows an overall output format but generates the actual text freely, so each run may use different words or sentence structures while conveying the same semantic meaning. We don’t want to strictly search for keywords in the final root cause analysis report but rather evaluate whether the essence of the rubric is met.

The evaluation report is structured with scenarios as rows and metrics as columns. Key metrics that we keep track of are capability (pass@k – whether the agent passed at least once in k attempts), reliability (pass^k – how many times the agent passed across k attempts, e.g., 0.33 means passed 1 out of 3 times for k=3), latency, and token usage.

Evaluation results table with two scenario rows. Headers: Scenario, Pass@3, Pass^3, Avg. E2E Latency, Avg. Time-To-First-Observation, and Avg. Total tokens. Lambda throttle scenario shows Pass@3 of 1 and Pass^3 of 1 (highlighted green). SQS permission removal scenario shows Pass@3 of 1 and Pass^3 of 0.33 (highlighted red), indicating it passed only 1 of 3 attempts.

Why are evals important?

There are several benefits to having evals:

  • Red scenarios provide obvious investigation points for the agent development team to increase product quality.
  • Over time, green scenarios act as regression tests, notifying us when changes to the system degrade the existing customer experience.
  • Once pass rates are green, we can improve customer experience along additional metrics. For example, reducing end-to-end latency and/or optimizing cost (proxied by token usage) while maintaining the quality bar.

What makes evals challenging?

Fast feedback loops help developers know whether code works (is it correct, performant, secure) and whether ideas are good (do they improve key business metrics). This may seem obvious, but far too often, teams and organizations tolerate slow feedback loops […] — Nicole Forsgren and Abi Noda, Frictionless: 7 Steps to Remove Barriers, Unlock Value, and Outpace Your Competition in the AI Era

There are several challenges with evals. In decreasing order of difficulty:

  1. Realistic and diverse scenarios are hard to author. Coming up with realistic applications and fault scenarios is difficult. Authoring high fidelity microservice applications and faults is significant work that requires prior industry experience. What we’ve found effective: we author a few “environments” (based on real application architectures) but create many failure scenarios on top of them. The environment is the expensive portion of the evaluation setup, so we maximize reuse across multiple scenarios.
  2. Slow feedback loops. If the “Given” takes 20 minutes to deploy for an eval scenario and then the “When” takes another 10-20 minutes for complex investigations to complete, agent developers won’t thoroughly test their changes. Instead, they’ll be satisfied with a single passing eval, then release to production, potentially introducing regressions until the comprehensive eval report is generated. Additionally, slow feedback loops encourages batching multiple changes together rather than small incremental experiments, making it harder to understand which change actually moved the needle. We’ve found three mechanisms effective for speeding up feedback loops:
    1. Long-running environments for eval scenarios. The application and its healthy state are created once and kept running. Fault injection happens periodically (e.g., over weekends), and developers point their agent credentials at the faulty environment, completely skipping the “Given” portion of the test.
    2. Isolated testing of only the agent surface area that matters. In our multi-agent system, developers can trigger a specific sub-agent directly with a prompt from a past eval run rather than running the entire end-to-end flow. Additionally, we built a “fork” feature: developers can initialize any agent with the conversation history from a failing run up to a specific checkpoint message, then iterate only on the remaining trajectory. Both of these approaches significantly lowers the wait time of the “When” portion.
    3. Local development of the agentic system. If developers must merge changes and release to a cloud environment before testing, the loop is too slow. Running locally enables rapid iteration.

Visualize trajectories

When an agent fails an eval or a production run, where do you start investigating? The most productive method is error analysis. Visualize the agent’s complete trajectory, every user-assistant message exchange including sub-agent trajectories, and annotate each step as “PASS” or “FAIL” with notes on what went wrong. This process is tedious but effective.

For AWS DevOps Agent, agent trajectories map to OpenTelemetry traces and you can use tools like Jaeger to visualize them. Software development kits like Strands provide tracing integration with minimal setup.

Jaeger UI showing a distributed trace for strands-agents with trace ID 941e3b7. The trace spans 25 minutes 17 seconds with 454 total spans across 7 depth levels. The left panel shows a hierarchical tree of service operations including execute_event_loop_cycle, chat, and execute_tool calls for current_time, write_scratchpad, and use_aws. The right panel displays a timeline visualization with horizontal bars representing span durations. The bottom detail panel shows metadata for a selected execute_tool use_aws span, including tags, process information, and logs with gen_ai event data.

Figure 1 – A sample trace from AWS DevOps Agent.

Each span contains user-assistant message pairs. We annotate each span’s quality in a table such as the following:

Error analysis table showing Step 3 with Span ID f182abb7c94a4713. The Description column shows Title: GetQueryResults(Surveying logs) with a JSON content snippet. Duration is T seconds. The Verdict column shows FAIL highlighted in red. The Reasoning column recommends removing @ptr fields, noting the retrieved logs are X tokens and removing @ptr fields from CloudWatch log records can reduce token usage by half.

This low-level analysis consistently surfaces multiple improvements, not just one. For a single failing eval, one will typically identify many concrete changes spanning accuracy, performance, and cost.

Intentional changes

I had learned from my dad the importance of intentionality — knowing what it is you’re trying to do, and making sure everything you do is in service of that goal. — Will Guidara, Unreasonable Hospitality: The Remarkable Power of Giving People More Than They Expect

You’ve identified failing scenarios and diagnosed the issues through trajectory analysis. Now it’s time to modify the system.

The biggest fallacy we’ve observed at this stage: confirmation bias leading to overfitting. Given the eval challenges mentioned earlier (slow feedback loops and the impracticality of comprehensive test suites) developers typically test only the few specific failing scenarios locally until they pass. One modifies the context (system prompt, tool specifications, tool implementations, etc.) until one or two scenarios pass, without considering broader impact. When changes don’t follow context engineering best practices, they likely have negative effects that we can’t capture through limited evals.

You need both diligence and judgment: establish success criteria through available evals and reusable past production scenarios, but also educate yourself on context engineering best practices to guide your changes. We’ve found Anthropic’s prompting best practices and engineering blog, Drew Breunig’s how long contexts fail, and lessons from building Manus particularly helpful resources.

Establish success criteria first

Before making any change, define what success looks like:

  • Baseline. Fix specific git commit IDs for the current system. Think deliberately about which metrics would improve both the agent’s experience and the customer’s experience, then gather those metrics for the baseline.
  • Test scenarios. Which evals will measure your change’s impact? How many times will you rerun these evals? Convince yourself this set represents broader customer patterns, not just the one failure you’re investigating.
  • Comparison. Measure your changes against the baseline using the same metrics.

This intentional framing protects against confirmation bias (interpreting results favorably) and sunk cost fallacy (accepting changes simply because you invested time). If your modifications don’t move the metrics as expected, reject them.

For example, when optimizing a sub-agent within AWS DevOps Agent, we establish a baseline by fixing git commit IDs and running the same scenario seven times. This reveals both typical performance and variance.

Baseline metrics table comparing multiple runs of a sub-agent. Headers: Run, Correct observations, Irrelevant observations, Latency, Sub-agent Tokens, and Lead-agent Tokens. Run 1 shows 4 out of 6 correct observations with 1 irrelevant observation. Run 7 shows 5 out of 6 correct observations with 0 irrelevant observations, demonstrating variance across repeated runs of the same scenario.

Each metric measures a different dimension:

  • Correct observations – How many relevant signals (log records, metric data, code snippets, etc.) that are directly related to the incident did the sub-agent surface?
  • Irrelevant observations – How much noise did the sub-agent introduce to the lead agent? This counts signals that are unrelated to the incident and could distract the agent’s investigation.
  • Latency – How long did the sub-agent take (measured in minutes and seconds)?
  • Sub-agent tokens – How many tokens did the sub-agent to accomplish its task? This serves as a proxy for the cost of running the sub-agent.
  • Lead-agent tokens – How much of the lead agent’s context window is the sub-agent’s input and output consuming? This gives us a tangible way to identify optimization opportunities for the sub-agent tool: can we compress the instructions to the sub-agent or the results it returns?

After establishing the baseline, we compare these metrics against the same measurements with our proposed changes. This makes it clear whether the change is an actual improvement.

Read production samples

We’ve been fortunate to have several Amazon teams adopt AWS DevOps Agent early. A DevOps agent team member on rotation regularly samples real production runs using our trajectory visualization tool (similar to the OpenTelemetry-based visualization discussed earlier, but customized to render DevOps Agent-specific artifacts like root cause analysis reports and observations), marking whether the agent’s output was accurate and identifying failure points. Production samples are irreplaceable; they reveal the actual customer experience. Additionally, reviewing samples continuously refines your intuition of what the agent is good and bad at. When production runs aren’t satisfactory, you have real-world scenarios to iterate against: modify your agent locally, then rerun it against the same production environment until the desired outcome is reached. Establishing rapport with a few critical early adopter teams willing to partner in this way is invaluable. They provide ground truth for rapid iteration and create opportunities to identify new eval scenarios. This tight feedback loop with production data works in conjunction with eval-driven development to form a comprehensive test suite.

Closing thoughts

Building an agent prototype that demonstrates the feasibility of solving a real business problem is an exciting first step. The harder work is graduating that prototype into a product that performs reliably across diverse customer environments and tasks. In this post, we’ve shared five mechanisms that form the foundation for systematically improving agent quality: evals with realistic and diverse scenarios, fast feedback loops, trajectory visualization, intentional changes, and production sampling.

If you’re building an agentic application, start building your eval suite today. Even starting with a handful critical scenarios will establish the quality baseline needed to measure and improve systematically. To see how AWS DevOps Agent applies these principles to incident response, check out our getting started guide.

Efe Karakus

Efe Karakus is a Sr. Software Engineer on the AWS DevOps Agent team, primarily focusing on agent development.

Beyond the Device: Exploring the New Security Risks of Interconnected IoT at CES 2026

Post Syndicated from Deral Heiland original https://www.rapid7.com/blog/post/tr-beyond-devices-exploring-new-security-risks-interconnected-iot-ces-2026

Attending CES over the last several years has provided me with a valuable opportunity to observe how rapidly IoT technology continues to evolve across consumer and enterprise domains. This was my fourth year attending CES and I have seen a continued growth and advancement across multiple technology categories, from mobile devices and wearables, to AI-driven automation and robotics, to connected infrastructure. 

This year’s show floor highlighted how deeply embedded “smart” technology has become within our everyday systems. As an IoT security researcher, what stood out to me most was not just the pace of innovation, but how increasingly interconnected these technologies have become, often relying on shared backend services, cloud platforms, and automated decision-making. These trends highlight the importance of examining not only individual devices, but the broader trust relationships and infrastructure architectures that support them.

CES2026-iot-1.png

AI-driven automation is no longer experimental

It was clear at CES 2026 that AI-driven automation is no longer experimental, it has become operational. Throughout automation, robotics, and transportation technology, decision-making processes are increasingly being delegated to backend AI systems that consume device telemetry and trigger real-world actions. From a security perspective, this marks a primary shift where trust relationships that were once local are now centralized, automated, and capable of impacting all devices within a larger ecosystem. The challenge moving forward doesn’t just involve securing devices; we will have to secure the data these devices produce, plus ensure that data is not altered or corrupted in a way that would impact all devices under the control of the backend AI systems.

CES2026-iot-2.png

Robotics innovation demands urgent security action

One of the more striking areas of progress has been in robotics, particularly in dexterity and fine motor control. Seeing robots play the piano or fold cloth highlighted how far robotic manipulation has come. Moving beyond their old rigid, pre-programmed motion toward a more adaptive interaction with our physical world. While we are still years away from anything resembling The Jetsons, these demonstrations show clear forward momentum. Before increasingly capable and autonomous robots become more deeply integrated into our world, we need to seriously address how to build security into the underlying technology. It’s also critical to maintain and secure the vast amount of data they will gather.  

CES2026-iot-3.png

Mobile and wearable technologies are “always on”

During CES this year, I also observed advances in mobile technology and wearables. While these devices have long been a staple of the show and continue to evolve incrementally each year, the growing integration of AI has noticeably expanded their capabilities. Features such as continuous sensing and adaptive behavior introduce new questions around security and privacy that go beyond traditional mobile threat models. As these technologies increasingly find their way into the hands of employees, they also raise important considerations for organizational security posture. This shift prompts a larger question CISOs should ask themselves: have our organization’s mobile device policies evolved alongside these technologies, or are they still grounded in smartphone-only assumptions from a decade ago?

For example, one of the most concerning mobile device technologies I observed was a device designed for use in corporate meetings that could automatically take notes, transcribe discussions, and translate conversations in real time. While such capabilities can clearly improve productivity and collaboration, especially in global organizations, they also introduce new security and privacy considerations. A device that is continuously listening, processing speech, and potentially transmitting data to backend cloud systems raises questions about where sensitive conversations are stored, how long that data is retained, and who ultimately has access to it. When such technologies are introduced into meeting rooms or business workflows, they essentially become an always-on sensor within the organization, and its presence may not be fully accounted for in most organizations with existing acceptable use policies. This highlights the need for organizations to reassess how emerging mobile and wearable technologies could impact their data protection, confidentiality, and overall security posture.

CES2026-iot-4.png

Conclusion: Building a new infrastructure of trust

My observations from CES 2026 clearly illustrate that the evolution of IoT has moved us beyond securing individual devices. The true security challenge now lies within the highly interconnected ecosystems, centralized AI-driven automation, and “always-on” data collection that underpin our increasingly “smart” world. The operationalization of AI and the rapid progress in robotics introduce centralized trust relationships and vast new data streams that are not yet matched by adequate security considerations.

This shift presents an urgent call to action for organizations. It’s time to aggressively reassess acceptable use and data protection policies to account for continuously sensing wearables, autonomous machinery, and the security of the backend services that control them all. The future of security is no longer just about protecting the perimeter; it is about securing the entire infrastructure of trust, data integrity, and automated decision-making that powers the next generation of technology.

Key Takeaways and Top Cybersecurity Predictions for 2026

Post Syndicated from Rapid7 original https://www.rapid7.com/blog/post/it-key-takeaways-top-cybersecurity-predictions-2026

As the threat landscape keeps shifting, security teams are being asked to do more than react. They are expected to look ahead, connect the dots, and make decisions in environments that change faster every year. That challenge was at the heart of Rapid7’s 2026 Security Predictions webinar, where our experts reflected on what the past year revealed about attacker behavior, defender priorities, and the realities of running a modern SOC.

The conversation looked back just long enough to spot the patterns that matter, then turned forward to the forces shaping 2026. Geopolitics, insider risk, and the need for context-driven defense all surfaced repeatedly. The takeaway was simple but important. Attackers are adapting quickly, and security teams need to adapt with the same urgency.

Below are the key takeaways from the discussion, along with the top predictions shaping the year ahead.

Key takeaways from the discussion

The threat landscape is no longer isolated

One of the strongest themes from the webinar was how interconnected today’s risks have become. Cyber activity does not exist in a vacuum. Geopolitical tensions, economic pressure, workforce challenges, and technological acceleration all feed directly into attacker behavior.

Security teams can no longer separate cyber risk from broader business and global risk. Decisions made outside the SOC, from supplier choices to workforce strategy, increasingly influence exposure and attack paths.

Identity and access remain the most reliable attack paths

Despite continued investment in perimeter defenses, attackers are still finding success through compromised credentials, misused access, and human error. The webinar panel reinforced that identity-based compromise remains one of the most consistent and scalable techniques used by threat actors.

This means defenders must treat identity, behavior, and access governance as core detection and response signals, not secondary controls.

Speed without context creates noise, not security

The rise of AI-driven attacks and automation has increased the volume and pace of activity security teams must process. However, the panel stressed that faster alerts alone do not improve outcomes.

Without understanding which assets matter, which exposures are exploitable, and which alerts represent real risk, teams risk moving quickly in the wrong direction. Context is now essential for effective prioritization and response.

The top cybersecurity predictions for 2026

1. Geopolitical fault lines will redraw the cyber battlefield

In 2026, geopolitical tensions will continue to spill into the digital domain, with private organizations increasingly caught in the middle. State-aligned and state-tolerated groups will target critical supply chains, service providers, and global enterprises as proxy targets, blending espionage with economic disruption.

For security teams, this means geopolitical risk must be factored into threat modeling, vendor assessments, and incident response planning. Even organizations far from traditional conflict zones may find themselves impacted by campaigns tied to global tensions.

2. Insider threats will dominate breach root causes

The panel highlighted that many of tomorrow’s breaches will not start with attackers breaking in, but with access already in place. Insider threats, driven by simple negligence, compromised credentials, or monetized access selling, will continue to rise.

Economic stress, workforce changes, and growing access complexity all contribute to this trend. As a result, organizations must focus more on access hygiene, behavior monitoring, and creating environments where employees can report mistakes early without fear.

3. Context will become the new currency of cyber performance

As attacks scale and exploitation windows shrink, the ability to understand what matters most will define successful security operations. The panel emphasized that visibility alone is no longer enough.

Security teams that integrate exposure management, detection, and response will outperform those relying on disconnected tools and alert-heavy workflows. Context-rich defense allows teams to triage faster, investigate smarter, and respond based on real business risk rather than alert volume.

What this means for security teams heading into 2026

The predictions shared during the webinar point to a future where success depends less on adding more tools and more on using intelligence, context, and automation effectively. Security teams that can unify visibility, prioritize risk, and act decisively will be better positioned to keep pace with increasingly adaptive attackers.

The message from the panel was clear. 2026 will reward teams that focus on understanding their environment, aligning security efforts with real-world risk, and preparing for threats shaped by forces far beyond the SOC.

Watch the 2026 Security Predictions webinar to hear directly from Rapid7’s experts on what’s shaping the threat landscape and how security teams should prepare.

Architecting conversational observability for cloud applications

Post Syndicated from Anton Aleksandrov original https://aws.amazon.com/blogs/architecture/architecting-conversational-observability-for-cloud-applications/

Modern cloud applications are commonly built as a collection of loosely coupled microservices running on services like Amazon Elastic Kubernetes Service (Amazon EKS), Amazon Elastic Container Service (Amazon ECS), or AWS Lambda. This architecture gives engineering teams flexibility and scalability, but its inherently distributed nature also makes troubleshooting more difficult. When something breaks, engineers often find themselves digging through logs, events, and metrics scattered across different observability layers. With Kubernetes, for example, without a deep understanding of the service, troubleshooting can turn into a time-consuming effort to manually correlate information from different sources.

In this post, we walk through building a generative AI–powered troubleshooting assistant for Kubernetes. The goal is to give engineers a faster, self-service way to diagnose and resolve cluster issues, cut down Mean Time to Recovery (MTTR), and reduce the cycles experts spend finding the root cause of issues in complex distributed systems.

Overview

One of the challenges of architecting a modern cloud application is keeping observability intact across many moving pieces. Anyone who has ever tailed logs in one terminal while running kubectl describe and curl commands in another, knows how tedious this can get. Distributed systems are powerful, but they’re also complex. Kubernetes, for example, offers strong orchestration capabilities, yet troubleshooting inside a cluster often means navigating multiple layers of abstractions such as pods, nodes, networking, logs, and events. On top of that, the system generates a large volume of telemetry, including kubelet logs, application logs, cluster events, and metrics. Making sense of these layers requires both expertise on the system and application knowledge.

This skill gap shows up in the numbers. According to the 2024 Observability Pulse Report, 48% of organizations say that lack of team knowledge is their biggest challenge to observability in cloud-native environments. MTTR has also been going up for three years straight, with most teams (82%) saying it can take more than an hour to resolve production issues.

When something goes wrong and your applications start to fail for an unknown reason, engineers often must start stitching together signals from multiple sources to find the root cause. That can be tedious for specialists, and it gets worse when the issue is intermittent or spans across services. Often, multiple teams need to get involved – application engineers may not know Kubernetes well, while platform teams may not have deep insight into the applications. This can result in longer troubleshooting cycles, potentially degraded user experience, and pulling engineers away from planned work that drives business goals.

Figure 1. A multitude of telemetry sources in Kubernetes clusters

This is where generative artificial intelligence (AI) can help. Users can build an AI assistant that combines large language model (LLM)-driven analysis and guidance with existing telemetry data. This assistant enables engineers to troubleshoot issues faster, in a self-service way, without requiring every team to become Kubernetes experts. In the following sections, we show how to build such an assistant for Amazon EKS, however, keep in mind that a similar approach can be extended to other compute services like Amazon ECS or AWS Lambda.

Solution architecture

Architecting this AI-powered troubleshooting assistant consists of three primary parts:

  • Deployment approach selection: The solution supports two architectures – a traditional Retrieval-Augmented Generation (RAG)-based chatbot and a modern Strands-based agentic system that uses the Strands Agents SDK with EKS MCP Server integration for direct EKS API access.
  • Telemetry collection and storage: Collecting telemetry from various sources and storing it as vector embeddings in Amazon OpenSearch (RAG approach) or as 1024-dimensional embeddings in Amazon S3 Vectors (Strands approach).
  • Interactive troubleshooting interface: Building either a web-based chatbot that retrieves relevant telemetry and injects it into LLM prompts, or a Slack integrated multi-agent system that uses MCP tools for real-time Kubernetes diagnostics.

For this architecture walkthrough, we focus on the RAG-based approach. The first step is setting up a pipeline that can reliably collect, process, and store telemetry data. This pipeline aggregates telemetry from the relevant data sources, such as application logs, kubelet logs, and Kubernetes events. In Kubernetes environments, this can be done with a telemetry processor and forwarder, such as Fluent Bit, which streams telemetry into Amazon Kinesis Data Streams. On the receiving end, we use a Lambda function to normalize collected data, Amazon Bedrock to generate vector embeddings, and OpenSearch Serverless to store this embedded representation for efficient retrieval. Because these services are serverless, we can avoid the overhead of managing infrastructure and can focus on the troubleshooting workflow itself.

Figure 2. Collecting telemetry from sources, generating embeddings, and saving in OpenSearch

Pro tip: for better performance and cost-efficiency, your Lambda functions should use batching when ingesting data from Kinesis, generating embeddings, and storing them in OpenSearch.

Once telemetry is collected, converted to embeddings, and stored in OpenSearch, the next step is building a chatbot that uses RAG. Using RAG means that when a user asks a question, the chatbot looks up semantically similar telemetry in OpenSearch, adds it to the prompt, and sends it to the LLM. Instead of generic answers, the model now has relevant telemetry and cluster-specific details it can use to generate useful next steps, such as precise kubectl commands for the troubleshooting assistant, as illustrated in the following diagram.

Figure 3. Chatbot is using user queries augmented with telemetry context to send kubectl commands to the troubleshooting assistant. 

One powerful aspect of this design is its iterative nature. The chatbot hands instructions to a troubleshooting assistant running in the cluster, which executes a set of allowlisted, read-only kubectl commands. The output comes back to the LLM, which can decide whether it needs to investigate further (by asking the troubleshooting assistant to run more kubectl commands), or present a clear resolution path to the engineer. This cycle gradually builds a richer picture of the issue by combining historical telemetry with real-time cluster state to speed up root cause analysis.

Figure 4. Iterative troubleshooting process.

Here’s the end-to-end troubleshooting flow illustrated in the preceding diagram:

  1. An engineer enters a query into the chatbot interface, for example “My pod is stuck in pending state. Investigate.”
  2. The chatbot sends the query to Bedrock, which converts it into vector embeddings.
  3. Using those embeddings, the chatbot retrieves semantically matching telemetry that was previously stored in OpenSearch.
  4. The chatbot generates an augmented prompt, which contains both the original query and semantically relevant telemetry, and passes it to the LLM. The LLM responds with a list of kubectl commands to run for further diagnostics.
  5. The chatbot forwards those commands to the troubleshooting assistant running in the EKS cluster. The agent executes them with a service account that has read-only permissions, following the principle of least privilege, and sends the output back.
  6. Based on the output, the chatbot asks LLM to decide whether to continue investigation (by asking the agent to run more commands), or whether it has enough context to produce an answer.
  7. Once enough information has been gathered (investigation concluded), the chatbot composes a final prompt, including the query, telemetry, and investigation results, and asks the LLM for a final resolution, which it then returns to the engineer.

Example implementation

Use the example repo to deploy the solution in your AWS account. Follow the instructions in README.md for provisioning and testing the sample project using Terraform. Resources provisioned by the example project incur costs in your AWS account. Make sure to clean up the project as described in the README.md to avoid unexpected costs.

The repository provides two deployment architectures controlled by the deployment_type Terraform variable:

  1. RAG-based deployment (default): See the ./terraform/modules directory for the “ingestion-pipeline” module that creates a Kinesis Data Stream and Lambda function to generate embeddings using "amazon.titan-embed-test-v2:0" and store them in OpenSearch. The “agentic-chatbot” module handles the Gradio web interface and kubectl command execution.
  2. Strands agentic deployment: this approach uses the Strands Agents SDK to create a multi-agent system with three specialized agents:
    1. Agent Orchestrator: Coordinates troubleshooting workflows
    2. Memory Agent: Manages conversation context and historical insights
    3. K8s Specialist: Handles Kubernetes diagnostics

The agentic system stores knowledge as 1024-dimensional embeddings in Amazon S3 Vectors, providing cost-optimized vector storage for AI agents. EKS MCP Server integration enabled direct EKS API access through standardized MCP tools located in ./apps/agentic-troubleshooting/src/tools/. Engineers interact via Slack bot integration, where the Strands agents can execute kubectl commands through the MCP protocol while maintaining Pod Identity security for AWS service access.

The following screenshot shows an example chatbot response to a query about a pod being stuck in pending state. The assistant generated and ran multiple kubectl commands to build the output and came up with recommendations for issue remediation.

Figure 5. EKS cluster troubleshooting, example output

See AWS re:Invent 2025 – Streamline Amazon EKS operations with Agentic AI and KubeCon – From Logs To Insights: Real-time Conversational Troubleshooting for Kubernetes with GenAI sessions for a deeper dive into solution implementation.

Security considerations

When implementing AI agents for Kubernetes environments, security must be a primary consideration throughout the architecture. The solution requires secure communication channels between the chatbot and EKS clusters, with interactions authenticated through AWS Identity and Access Management (AWS IAM) roles.

Permissions-wise, command execution security is critical. Implementing strict allowlists that only allow read-only kubectl operations to help prevent unauthorized cluster modifications while maintaining diagnostic capabilities. The troubleshooting assistant should also operate with minimal Kubernetes RBAC permissions, limited to viewing pods, services, events, and logs within specific namespaces.

Data protection measures must include sanitizing application logs before embedding generation to help prevent sensitive information exposure, encrypting the telemetry data in transit through Kinesis and at rest in OpenSearch using AWS Key Management Service (AWS KMS).

Follow the AWS Well-Architected Framework Security Pillar principles, deploy components within Amazon Virtual Private Cloud (Amazon VPC) using private subnets and VPC endpoints to minimize network exposure, implement comprehensive logging of troubleshooting activities for audit purposes, and validate user inputs to protect against prompt injection attacks that could manipulate the AI assistant’s behavior.

Conclusion

In this post, we walked through how to architect a generative AI-powered troubleshooting assistant that gives engineers a way to solve Kubernetes issues in a self-service way, without always needing service experts to step in. By combining telemetry analysis with AI-driven context, engineers can get to the root causes faster and keep MTTR low. Assistant’s ability to pull from multiple telemetry sources, run safe diagnostic commands, and provide actionable recommendations helps to make the troubleshooting process more efficient and less disruptive to ongoing work.

As distributed systems continue to grow in scale and complexity, solutions like the one described in this post become essential. Putting AI on top of your observability data helps to practically handle these challenges today, while also setting you up for more autonomous, resilient operations in the future.

AWS Weekly Roundup: AWS re:Invent keynote recap, on-demand videos, and more (December 8, 2025)

Post Syndicated from Donnie Prakoso original https://aws.amazon.com/blogs/aws/aws-weekly-roundup-aws-reinvent-keynote-recap-on-demand-videos-and-more-december-8-2025/

The week after AWS re:Invent builds on the excitement and energy of the event and is a good time to learn more and understand how the recent announcements can help you solve your challenges and unlock new opportunities. As usual, we have you covered with our top announcements of AWS re:Invent 2025 that you can learn all about here.

For me, one moment stood out above all the technical announcements: watching Rafi (Raphael Francis Quisumbing) from the Philippines receive the Now Go Build Award from Werner Vogels. Rafi has been an AWS Hero since 2015 and co-lead of AWS User Group Philippines since 2013. His dedication to building communities and empowering developers across the region embodies what this award represents. You can read more about Rafi on The Kernel. Congrats, Rafi!

The keynote recap: Agents, renaissance, and the developer’s role
This year’s AWS re:Invent keynotes painted a clear picture of where we’re headed.

Matt Garman emphasized that developers are “the heart of AWS” and that “freedom to invent” remains AWS’s core mission after 20 years. He focused on AI agents as the next inflection point: “AI assistants are starting to give way to AI agents that can perform tasks and automate on your behalf. This is where we’re starting to see material business returns from your AI investments.”

Swami Sivasubramanian highlighted the transformative moment we’re in: “For the first time in history, we can describe what we want to accomplish in natural language, and agents generate the plan. They write the code, call the necessary tools, and execute the complete solution.” AWS is building production-ready infrastructure that’s secure, reliable, and scalable—purpose-built for the non-deterministic nature of agents.

Peter DeSantis and Dave Brown reinforced that the core attributes AWS has obsessed over for 20 years—security, availability, performance, elasticity, cost, and agility—are more important than ever in the AI era. Dave Brown showcased Graviton and AWS’s custom silicon innovations that deliver these attributes at scale.

Werner Vogels delivered his final keynote after 14 years, introducing the concept of the “renaissance developer”—someone who is curious, thinks in systems, and communicates effectively. His message about AI and developer evolution resonated: “Will AI take my job? Maybe. Will AI make me obsolete? Absolutely not… if you evolve.” He emphasized that developers must be owners: “The work is yours, not that of the tools. You build it, you own it.”

You can also watch from keynotes, innovation talks to breakout sessions and more in the on-demand video page.

Innovations Talks

Breakout sessions — Topics Breakout sessions — Segments

Last week’s launches
Here are the launches that caught my attention not yet covered in our top announcements of AWS re:Invent 2025 post:

  • Kiro Autonomous Agent – Building on Kiro’s general availability in November with team features, AWS introduced an autonomous agent that maintains awareness across sessions, learns from pull requests and feedback, and handles bug triage and code coverage improvements spanning multiple repositories. “Orders of magnitude more efficient” than first-generation AI coding tools, Matt Garman said. Kiro is now Amazon’s standard AI development environment company-wide.
  • Multimodal Retrieval for Bedrock Knowledge Bases (GA) – Build AI-powered search and question-answering applications that work across text, images, audio, and video files. Developers can now ingest multimodal content with full control of parsing, chunking, embedding, and vector storage options, then send text or image queries to retrieve relevant segments across all media types.
  • AWS Interconnect – Multicloud (Preview) – Quickly establish private, secure, high-speed network connections with dedicated bandwidth and built-in resiliency between Amazon VPCs and other cloud environments. Starting in preview with Google Cloud as the first launch partner, with Microsoft Azure support coming in 2026.

See AWS What’s New for more launch news that I haven’t covered here. That’s all for this week. Check back next Monday for another Weekly Roundup!

Happy building!

— Donnie

This post is part of our Weekly Roundup series. Check back each week for a quick roundup of interesting news and announcements from AWS!